Dropping out: the benefits and costs of trying university · Australian public policy makes it...
65
Transcript of Dropping out: the benefits and costs of trying university · Australian public policy makes it...

Dropping out: the benefits and costs of trying university
Grattan Institute Support
Founding members Endowment SupportersThe Myer Foundation
National Australia Bank
Susan McKinnon Foundation
Affiliate PartnersMedibank Private
Susan McKinnon Foundation
Senior AffiliatesGoogle
Maddocks
PwC
McKinsey & Company
The Scanlon Foundation
Wesfarmers
AffiliatesAshurst
Corrs
Deloitte
GE ANZ
Jemena
Urbis
Westpac
Woodside
Grattan Institute Report No. 2018-07, May 2018
This report was written by Andrew Norton, Grattan Institute HigherEducation Program Director and Ittima Cherastidtham, HigherEducation Program Fellow. Will Mackey provided extensive researchassistance and made a substantial contribution to the report. James Haalso provided research assistance. Paul Austin provided substantialediting assistance.
We would like to thank members of Grattan Institute’s Higher EducationReference Group, Buly Cardak, Marcia Devlin, Toni Downes, RichardJames, Kevin Jameson, Ian Li, Mike Evans and several others for theiradvice on this report and its background paper.
The opinions in this report are those of the authors and do notnecessarily represent the views of Grattan Institute’s foundingmembers, affiliates, individual board members, reference groupmembers or reviewers. Any remaining errors or omissions are theresponsibility of the authors.
Grattan Institute is an independent think-tank focused on Australianpublic policy. Our work is independent, practical and rigorous. We aimto improve policy outcomes by engaging with both decision-makers andthe community.
For further information on the Institute’s programs, or to join our mailinglist, please go to: http://www.grattan.edu.au/.
This report may be cited as: Norton, A., Cherastidtham, I., and Mackey, W. (2018).Dropping out: the benefits and costs of trying university. Grattan Institute.
ISBN: 978-0-6482307-7-9
All material published or otherwise created by Grattan Institute is licensed under aCreative Commons Attribution-NonCommercial-ShareAlike 3.0 Unported License
Grattan Institute 2018 2
Dropping out: the benefits and costs of trying university
Overview
Nearly a quarter of a million students will start a bachelor degree inAustralia in 2018, but more than 50,000 of them will leave universitywithout getting a degree.
Dropping out is not always a bad outcome. Surveys of school andfirst-year university students show that many are uncertain about theirdirection. Enrolling can help students decide what they want to do. Ifstudents discover that university is not for them, and leave quickly, itcosts them little in time and money.
Partially complete degrees can have other advantages. Many peoplewho did not finish their course found it interesting, learned useful skills,and made lasting friendships and connections. Often they say thatif they had their time over again, they would still begin their course,suggesting they believe that their enrolment brought more benefits thancosts.
Yet for a significant minority, an incomplete degree leaves them withdebt and regret. Nearly two-thirds believe they would have been betteroff if they had finished. Nearly 40 per cent of students who droppedout would not begin their degree again knowing what they know now,and about a third of them believe they received no benefits from theircourse. These students do not get value for their time and money.
Much of the risk of dropping out is foreseeable. Part-time studentsare the most likely to drop out. Many try to combine study with paidwork and family, but discover they can’t manage their competingcommitments. Students who enrol in three or four subjects a year – half
as many as a full-time student – have only about a 50 per cent chanceof completing their course in eight years. Students who enrol full-timehave about an 80 per cent chance.
School results are important. Students with ATARs below 60 are twiceas likely to drop out of university than otherwise similar students withATARs above 90.
With better advice, some prospective part-time students may opt tostudy full-time. And some low-ATAR students would take a vocationaleducation course instead. Some may not study at all, but look for a jobinstead.
Governments and universities should do more to alert prospectivestudents to their risk factors. The Commonwealth Government’s QualityIndicators for Learning and Teaching information website shouldinclude a guide to students’ completion prospects. Universities shouldcheck that part-time students have realistic course completion plans.
Some students who drop out never seriously engage with their course,and needlessly accrue HELP debt before they leave. This reportrecommends new ways to protect students from unnecessary financialburdens.
Australia’s higher education system lets people try out university. Itrecognises that not enrolling, as well as dropping out, has costs andrisks. But Australia should do more to reduce the number of drop-outs.With some changes, Australia’s higher education system could makedropping out less common and less costly.
Grattan Institute 2018 3

Dropping out: the benefits and costs of trying university
Recommendations
For people thinking about applying for university
The Government’s student website, QILT, should include personalisedinformation about the risk of not completing a degree. It should alsoadvise on how to reduce this risk.
University web pages for future students should clearly state whatpart-time students need to do to finish the course in the maximum timeallowed.
When universities are enrolling or re-enrolling students
Universities should check that students take enough subjects tocomplete their degree in the maximum time, or that the student has acredible plan for catching up.
Before the census date when students become liable to pay for theirsubjects
All students should receive more effective communication about theimportance and timing of their census date, so they don’t pay forsubjects that they are unlikely to complete.
If students are disengaged before the census date, and don’t commit tore-engaging, universities should cancel their enrolment.
If disengaged commencing students remain an issue after othermethods of protecting them are tried, the Government could requirestudents to confirm their enrolment, or opt-in, a few weeks into term.Students who did not confirm would no longer be enrolled and wouldnot incur a HELP debt.
For the Tertiary Education Quality and Standards Agency
The regulator, TEQSA, should pay more attention to what universitiestell prospective part-time students about how many subjects they needto take, and whether universities are enrolling part-time students whodo not have credible plans for completing their degree.
TEQSA’s annual monitoring of higher education providers shouldinclude examining outcomes for students at high risk of not completingtheir degree, such as part-time students and students failing manysubjects.
Grattan Institute 2018 4
Dropping out: the benefits and costs of trying university
Table of contents
Overview . . . . . . . . . . . . . . . . . . . . . . . . . . . . . . . . 3
Recommendations . . . . . . . . . . . . . . . . . . . . . . . . . . . 4
1 Starting and ending university enrolment . . . . . . . . . . . . . 8
2 Benefits and costs of an incomplete degree . . . . . . . . . . . . 16
3 Risk factors for not completing a degree . . . . . . . . . . . . . . 23
4 University admission practices . . . . . . . . . . . . . . . . . . . 33
5 Informing student choice . . . . . . . . . . . . . . . . . . . . . . 37
6 Improved university policies and practices . . . . . . . . . . . . . 41
7 Increased monitoring by TEQSA . . . . . . . . . . . . . . . . . . 46
8 New census date policies to increase student protection . . . . . 48
A Mutual selection analysis methodology . . . . . . . . . . . . . . 54
B Grattan survey of students who dropped out . . . . . . . . . . . 55
C Glossary . . . . . . . . . . . . . . . . . . . . . . . . . . . . . . . 61
Grattan Institute 2018 5

Dropping out: the benefits and costs of trying university
List of Figures
1.1 School-leaver application rates decline as ATAR declines . . . . . . . . . . . . . . . . . . . . . . . . . . . . . . . . . . . . . . . . . . . . . . . . . 81.2 A mutual selection process decides who will continue with their course . . . . . . . . . . . . . . . . . . . . . . . . . . . . . . . . . . . . . . . . . . 111.3 Three in every ten students do not complete a degree within eight years . . . . . . . . . . . . . . . . . . . . . . . . . . . . . . . . . . . . . . . . . 131.4 Completion rates are deteriorating slightly . . . . . . . . . . . . . . . . . . . . . . . . . . . . . . . . . . . . . . . . . . . . . . . . . . . . . . . . . . 141.5 Early student departures have trended up . . . . . . . . . . . . . . . . . . . . . . . . . . . . . . . . . . . . . . . . . . . . . . . . . . . . . . . . . . 14
2.1 Many people who drop out would still begin the degree, knowing what they know now . . . . . . . . . . . . . . . . . . . . . . . . . . . . . . . . . . 162.2 Older students leave more quickly . . . . . . . . . . . . . . . . . . . . . . . . . . . . . . . . . . . . . . . . . . . . . . . . . . . . . . . . . . . . . . 172.3 Most students who drop out will pay or borrow less than $10,000 . . . . . . . . . . . . . . . . . . . . . . . . . . . . . . . . . . . . . . . . . . . . . 182.4 Students who don’t complete report benefits from their time at university . . . . . . . . . . . . . . . . . . . . . . . . . . . . . . . . . . . . . . . . . 192.5 People who begin a bachelor degree generally earn more, even if they don’t complete . . . . . . . . . . . . . . . . . . . . . . . . . . . . . . . . . . 202.6 Women gain little financial benefit from upper-level vocational qualifications . . . . . . . . . . . . . . . . . . . . . . . . . . . . . . . . . . . . . . . 212.7 Most people who don’t complete their degree believe they would have been better off if they had completed . . . . . . . . . . . . . . . . . . . . . . 22
3.1 The student and course characteristics used to analyse completion prospects . . . . . . . . . . . . . . . . . . . . . . . . . . . . . . . . . . . . . . 243.2 High-ATAR students are much more likely to complete a degree . . . . . . . . . . . . . . . . . . . . . . . . . . . . . . . . . . . . . . . . . . . . . . 253.3 People who have previously succeeded in higher education are more likely to complete . . . . . . . . . . . . . . . . . . . . . . . . . . . . . . . . 253.4 Studying part-time increases the risk of not completing, and the fewer subjects the higher the risk . . . . . . . . . . . . . . . . . . . . . . . . . . . 273.5 Part-time students are more likely than full-time students to work full-time . . . . . . . . . . . . . . . . . . . . . . . . . . . . . . . . . . . . . . . . 283.6 Part-time students are much more likely to cite work and family responsibilities as reasons for considering leaving . . . . . . . . . . . . . . . . . . 283.7 The risk of not completing a course varies significantly by discipline . . . . . . . . . . . . . . . . . . . . . . . . . . . . . . . . . . . . . . . . . . . . 303.8 The risk of not completing increases from age 19 to age 30 . . . . . . . . . . . . . . . . . . . . . . . . . . . . . . . . . . . . . . . . . . . . . . . . 32
4.1 The higher-risk student group share of commencing enrolments has increased . . . . . . . . . . . . . . . . . . . . . . . . . . . . . . . . . . . . . 344.2 One in five students is more likely to drop out of university than complete their course . . . . . . . . . . . . . . . . . . . . . . . . . . . . . . . . . . 36
Grattan Institute 2018 6

Dropping out: the benefits and costs of trying university
4.3 Of students who are more likely to drop out than complete, more than 80 per cent study part-time . . . . . . . . . . . . . . . . . . . . . . . . . . . 36
5.1 Studying full-time minimises the risk of not-completing university . . . . . . . . . . . . . . . . . . . . . . . . . . . . . . . . . . . . . . . . . . . . . 40
6.1 Potentially disengaged students are a growing share of all commencing bachelor degree students . . . . . . . . . . . . . . . . . . . . . . . . . . . 436.2 Students who are not satisfied with their university are more likely to consider leaving . . . . . . . . . . . . . . . . . . . . . . . . . . . . . . . . . . 45
B.1 Distribution of Grattan survey respondents and university enrolments . . . . . . . . . . . . . . . . . . . . . . . . . . . . . . . . . . . . . . . . . . . 55B.2 Comparing LSAY and the Grattan online survey results . . . . . . . . . . . . . . . . . . . . . . . . . . . . . . . . . . . . . . . . . . . . . . . . . . 57
Grattan Institute 2018 7

Dropping out: the benefits and costs of trying university
1 Starting and ending university enrolment
As higher education enrolments have increased in recent decades,dropping out of university has become a common experience forAustralians. In 2015, the ABS estimated that 800,000 Australian hadstarted but not finished a degree at some time. That number is growingby more than 50,000 a year.
Australian public policy makes it cheap and easy to give university a try,and for many young people that is now the default option after leavingschool. Some of them only find out after they commence their studieswhether university is for them. For universities, it can be hard to tell theapplicants who are committed to getting a degree from the applicantswho are just exploring their options.
This chapter explains the implications of that uncertainty faced by bothstudents and universities. It shows that the selection of students byuniversities, and the first semester or two of enrolment, are not twoentirely distinct phases. Instead, they overlap.
1.1 Starting university and mutual selection
People’s decision-making about university often starts during childhood,when they begin forming views about their post-school education andcareers.1 At least since the 1990s, most upper-years school students inAustralia have indicated an interest in going to university.2 By the end ofYear 12, this interest is moderated by academic results. As Figure 1.1shows, a school leaver’s propensity to apply for university declines withtheir ATAR, reflecting their preference for academic work, how likelythey are to receive an offer, and their chances of success at university.
1. Gore et al. (2017a); Gore et al. (2017b); and Roy Morgan Research (2009,p. 51).
2. James (2002, p. 15); Mission Australia (2016, pp. 15–16); Roy Morgan Research(2009, pp. 48–50); and ANOP/DEET (1994, pp. 7–9).
Figure 1.1: School-leaver application rates decline as ATAR declinesProportion of school students applying for university through a tertiaryadmission centre, per cent, by ATAR, 2014
0
10
20
30
40
50
60
70
80
90
100
0 10 20 30 40 50 60 70 80 90ATAR
Does not apply Applies for a bachelor
course during Year 12
2014 apps (year 12 2013)
100
Notes: Excluding direct applications to universities and Queensland students, sinceQueensland primarily uses Overall Position rather than ATAR. The population is basedon Year 7 students in 2008. Only applicants who studied Year 12 in 2013 who havean ATAR. ATAR is a rank of all people in the age cohort. Actual ATARs awarded areskewed to the higher end, because students who would have received the lower ATARsleft school before Year 12 or did not receive an ATAR.
Source: ABS (various years); Department of Education and Training (various years).
Grattan Institute 2018 8

Dropping out: the benefits and costs of trying university
Despite ATAR’s moderating effect on interest in higher education, mostYear 12 students apply for university. But not all Year 12 applicantsare strongly committed to university in general or a particular course.Surveys clearly show student indecision about their course anduniversity choice. South Australian research into Year 12 studentdecision-making found that one-in-five were uncertain about theiruniversity preferences, but were going to apply anyway, and only 60per cent were certain or very certain about their first preference.3
Similarly, a 2015 survey of first-year students at two universitiesfound that less than two-thirds believed they had a good or very goodunderstanding of which course would be best for them.4 A 2014survey of first-year university students found 4 per cent were unclearabout why they were at university, and 20 per cent agreed with theproposition that they were ‘marking time’.5 A small percentage ofstudents who drop out say that they never really intended to complete.6
The decisions of young people are often driven by strong parental andsocial expectations around university attendance, not clear or definitegoals.7 For them, university is now a default option.
Ultimately many students drop out, although saying exactly whatproportion do so is not straightforward. Calculating a drop-out raterequires identifying a start and a finish date for each student. Astudent’s first day of enrolment is an obvious starting point, but it is notused to calculate Australian attrition or completion rates. Students areonly counted if they remain enrolled at a ‘census date’, which is at least20 per cent of the way through the semester.8 Students often enrol well
3. Parks et al. (2017, p. 8).4. Harvey et al. (2016, p. 58).5. Baik et al. (2015, p. 31).6. See Figure B.2 on page 57.7. Of first year students in 2004, 41 per cent cited parental expectations as a
factor, and 65 per cent cited school pressure as a factor in their decision to goto university: Baik et al. (2015, p. 22).
8. DIICCSRTE (2013a, section 6.30).
before the teaching period begins, so the census date could be twomonths or longer after enrolment.
While it could seem that this late start date under-states attrition rates,it recognises that the time immediately after enrolment is not entirelydistinct from the prior period, when prospective students look forcourses and universities decide whether to admit them. In practice,the selection and enrolment phases overlap in a long process of mutualselection, during which prospective students and universities decidewhether the student will proceed in a course.
Australia’s student selection system does little to discourage specu-lative applications from people without clear aims. For a modest fee,usually well below $100, prospective students can apply simultaneouslyfor multiple courses through tertiary admissions centres in each state.Applicants receive offers, if any, in order of their stated preferences.The process lets applicants keep their options open at low cost. It givesthem more time to decide, and more time perhaps to find somethingthey would like more, such as a job.
For the potential students who do apply, universities must decidewhether to offer them a place. The applicant’s prospect of successis almost always an explicit selection principle.9 What prospect ofsuccess each university regards as acceptable is not clear, but thecriteria for assessing it are primarily academic (discussed further inSection 4.2). Many universities set minimum ATARs, varying from 50to 80, depending on the university. When the applicant has been touniversity before, previous academic results are often used. Specialadmissions tests, auditions, professional experience and vocationaleducation are also used as admission criteria.
Some applicants receive no offers. Figure 1.2 on page 11 usesapplicants for the 2014 academic year as a guide to what proportion
9. Based on desktop research in January 2018.
Grattan Institute 2018 9

Dropping out: the benefits and costs of trying university
of the original applicants leave at each stage in the mutual selectionprocess. Seventeen per cent of the original pool were screened out bythe offers process. The share varies slightly depending on applicanttype. Applicants who finished Year 12 in 2013 were slightly more likelyto receive an offer than older applicants.
Inevitably, applications data lacks important information relevant to auniversity decision about applicants’ prospects of success. Althoughapplicants with unrealistic plans often have warning signs (Chapter 3),these are not conclusive. The committed applicant who is determinedto succeed, and the uncommitted applicant who is just keeping optionsopen, can look very similar. Universities cannot fully identify whichcategory an applicant is in before making offers.
The offers process itself identifies some uncertain applicants. Overall,8 per cent of the original applicant pool selected itself out by notaccepting their offer. Disappointment may be a factor for applicantswho did not receive an offer for their first-preference course.10 Butfirst-preference offers were also rejected, indicating some applicantshad second thoughts, and some were never very serious aboutuniversity. People who had just completed school were more likely toproceed than older applicants, perhaps because they are under moresocial pressure to study and have fewer other demands on their time.
Uncertain applicants can extend their decision time into first semester.Accepting and enrolling does not of itself trigger financial costs.Students are not charged unless they are still enrolled on the censusdate (discussed in more detail in Chapter 6). For people who areunsure about university, this free try-before-you-buy period gives them
10. Applicants were 8 percentage points more likely to accept if offered their first-rather than their second-preference course, and 15 percentage points more likelyto accept if offered their first- rather than their third-preference course: Departmentof Education and Training (2017a).
added information supplied by their initial university experiences.11
Overall, another 7 per cent of the original applicant pool selected itselfout by the first semester 2014 census date. Again, younger and olderapplicants behaved differently, with those who had just completedschool more likely to persist at university.
About one-third of the original applicant pool departed by the firstsemester census date. Exit decisions were distributed fairly betweenuniversities and applicants; universities made no offer to 17 per cent ofapplicants, and 16 per cent of applicants did not accept their offer or leftbefore the census date.12
Having reached the census date, students become liable to pay studentcontributions. For some, letting the census date pass without action isa mistake; they have disengaged but not disenrolled, and needlesslypay for their subjects. How to minimise this is discussed in Chapters 6and 8. But others continue experimenting with university, decidingwhether it is for them. Surveys asking departed students why they leftshow substantial proportions giving reasons such as the course beingdifferent from what they wanted, not gaining or keeping their interest,and being too hard.13 Of the original applicant pool, another 8 per centleft after first semester. Again, school leavers are more likely to staythan older students. This pattern is repeated at the end of first year. Inthe second academic year, just over half of the original applicant poolremain.
During the academic year, universities again play a critical role in themutual selection process. Students use initial academic results as
11. Universities vary in their enrolment practices. Some combine accepting offersand enrolment, while at others accepting an offer and enrolling are separateprocesses. At these universities, some applicants may never have enrolled despiteaccepting their offer.
12. The proportion of applicants who did not accept their offer (8.3 per cent) or leftbefore the census date (7.4 per cent) was 15.7 per cent.
13. See the survey results reported in Appendix B.
Grattan Institute 2018 10

Dropping out: the benefits and costs of trying university
Figure 1.2: A mutual selection process decides who will continue with their courseApplicants for the 2014 academic year
64
66
72
78
83 17
5
6
6
5
0.0 25.0 50.0 75.0 100.0 125.0 150.0
Not participating
Of 100 applicants
No offer
Did not accept
Not enrolled at census date semester 1
Not enrolled at census date semester 2
Not enrolled in either semestersecond year
Participating
Accepted an offer
Enrolled
Enrolled
Enrolled
Received an offer
51
54
63
72
82 18
11
9
9
6
0.0 25.0 50.0 75.0 100.0 125.0 150.0
Of 100 applicants
57
59
67
75
83 17
8
7
8
5
0.0 25.0 50.0 75.0 100.0 125.0 150.0
School leavers Non-school leavers All applicants
Not participating Participating Not participating Participating
Notes: 2014 domestic bachelor applicant cohort only. Those who completed high school in 2013 are considered school leavers. Applications to tertiary admission centres and directapplications are considered. Only those who accept or defer an offer are considered in the enrolment stages. Second year is equivalent to the third and fourth semesters after commencingstudies. Applications to UAC (NSW) and UTAS (Tasmania) have a high proportion of ‘offer response unknown’ observations and been omitted from the analysis. The analysis only includesapplicants, enrolments and completions in bachelor courses. See Appendix A for detailed methodology.
Source: Department of Education and Training (various years).
Grattan Institute 2018 11

Dropping out: the benefits and costs of trying university
feedback in their decision-making. In 2014, 8 per cent of commencingbachelor degree students failed all their first semester subjects, andanother 18 per cent failed some subjects.14 Bad results can triggervoluntary departures, perhaps among students who were originallyclear about their direction, as well as those who were uncertainall along.15 Universities prompt disengaged students to considerwithdrawing from their studies. But not all the later departures reportedin Figure 1.2 are voluntary. Universities can exclude students whopersistently fail subjects; this process usually begins at the end of firstyear. Chapters 6 and 8 consider these parts of the selection process inmore detail.
Which start date is used has substantial implications for calculatingdrop-out rates. If the start date was accepting an offer for a bachelordegree place in 2014, 24 per cent of students were not enrolled atany public university in second year. If the start date was the firstsemester census date, the date used in official statistics, 15 per centwere not enrolled in second year. If the start date was the secondsemester census date, after many students enrolling on a speculativeor experimental basis have either gone or committed to continuing, only9 per cent were not enrolled in second year.
Each measure has potential uses, but needs to be evaluated in thecontext of policy incentives and goals. If prospective students werecharged a substantial fee for applying, fewer would do so; if studentcontributions were charged on accepting or enrolling, fewer applicantswould accept their offer. The system encourages potential students to
14. Including those taking only one subject: Department of Education and Training(various years).
15. The annual Student Experience Survey is conducted in August, when many ofthe original pool of people who accepted their offer have already left. However,unsurprisingly it shows that students reporting low average marks are much morelikely to be considering early departure than those getting high average marks:Social Research Centre/Department of Education and Training (2017, p. 11).
keep their options open and give university a try. Whether this processcould be more efficient, while preserving an open system, is discussedin later chapters.
1.2 Ending university
Just as there are several potential university start dates, there areseveral potential end dates. Students can change courses or taketime off but still end up completing a degree, so early end dates canmisclassify individuals. Some students classified as departed inFigure 1.2 will return in a later year, while others classified as retainedwill subsequently leave without a degree.
In the shortest-run currently-published statistics, the Department ofEducation and Training counts as attrition a commencing student whoreached their first census date but is not enrolled the next calendar yearand has not completed their course. The higher education regulator,the Tertiary Education Quality and Standards Agency (TEQSA),monitors each university’s year-to-year commencing student attritionstatistics.16 While attrition statistics do not measure final completions,they are a useful trend indicator that can quickly reveal potentialproblems. An institution’s commencing student attrition rate is highlycorrelated with its long-term completion rate.17
Students can still complete a degree long after starting.18 In addition toattrition rates, the Department produces completion statistics over four,six and nine-year periods.19 In practice, few students complete after
16. TEQSA (2017a).17. In separate analysis of commencing students between 2006 and 2008, the
correlation between first-year attrition and completion within nine years is about90 per cent.
18. Universities typically have maximum completion times between seven and tenyears for a bachelor degree course. However, students can move to anotheruniversity.
19. Department of Education and Training (2017b).
Grattan Institute 2018 12

Dropping out: the benefits and costs of trying university
eight years.20 This report’s main statistical analysis uses an eight-yearcompletion timeframe, covering domestic students who commenced abachelor degree in a public university between 2006 and 2008. On thismeasure, 70 per cent of students who commenced in 2008 completedwithin eight years (Figure 1.3). Another 7 per cent had been enrolled inat least one of the last two years, while just under a quarter had neithercompleted a bachelor degree nor been enrolled in either of the last twoyears.
Another measure again is to take the degree length and then addsome time. Anyone who finishes within this period is counted as acompletion; everyone else is a non-completion. The OECD uses thismethod. On this measure, Australia’s non-completion rate is aboutaverage in the OECD.21
1.3 Trends in completion rates
While Australia’s completion rates are not unusual compared toother countries, they are decreasing slightly using the census datecommencement method. Figure 1.4 on the following page suggeststhat compared to students commencing in 2008, subsequent studentsare slightly more likely to drop out. Whether we check progress at four,five or six years after commencement, the 2008 cohort has the highestcompletion rate of recent cohorts. The four-year analysis suggeststhat the deteriorating trend will continue until at least the 2013 cohort.The four-year completion rate of students commencing in 2013 was 4percentage points below the result for the 2008 cohort.
20. An eight-year timeframe lets us look at more student cohorts than longertimeframes. Data was only available for the years 2005 to 2015, limiting thescope for 9- or 10-year cohorts. About an additional 2 per cent of students areexpected to complete in years 9 and 10. Our data does not extend further, butsome students may eventually return after longer periods.
21. Based on the theoretical length of the degree plus three years for full-timestudents: OECD (2016, pp. 166–170).
Figure 1.3: Three in every ten students do not complete a degree withineight yearsProportion of bachelor degree students who commenced in 2008
Completed70%
Still enrolled(last 2 yrs.)
7%
Left(not enrolled,
last 2 yrs.)23%
Notes: Commencing domestic students with a Commonwealth Higher EducationStudent Number (CHESSN) who first enrolled in 2008. CHESSN is used to trackstudents over time. ‘Completed’ includes any bachelor degree completion, includingstudents completing a degree in a different field or at a different institution from the onethey started. ‘Still enrolled’ includes students who were enrolled in the 7th or 8th yearafter they commenced, or both. ‘Left’ is classified as students who have not completedand were not enrolled in the 7th or 8th year after they enrolled. Bachelor graduate entrystudents, permanent humanitarian visa-holders, students studying entirely offshore,and students who completed in the same year they commenced are excluded (lessthan 3 per cent).
Source: Grattan analysis of Department of Education and Training (various years).
Grattan Institute 2018 13

Dropping out: the benefits and costs of trying university
Figure 1.4: Completion rates are deteriorating slightlyProportion of students completing a bachelor degree by year ofcommencement, per cent
4 5 6
Completion within years from commencement
0
10
20
30
40
50
60
70
Commencing
2013
20122005
2005
2005year:
Four years Five years Six years
2011Completion rates peaked for the 2008 cohort
Notes: Commencing domestic students with a CHESSN. Based on the first enrolmentbetween 2006 and 2013 of each student. See Figure 1.3.
Source: Grattan analysis of Department of Education and Training (various years).
Figure 1.5: Early student departures have trended upProportion of students who did not return in second year to a bachelor degree,per cent
0
2
4
6
8
10
12
14
16
18
20
2006 2007 2008 2009 2010 2011 2012 2013 2014 2015Commencing year
Notes: Students not retained in a bachelor degree at any university. The Department ofEducation and Training also publishes attrition time series: one showing the proportionof commencing students leaving each university, and another showing the proportionof students leaving the higher education system, Department of Education and Training(2017c, appendix 4). Due to transfers between universities, attrition from the system islower than attrition from individual universities. The Department’s system-level attritionnumber is lower than the numbers in this chart because it counts students who havedownshifted to a diploma or associate degree and completions in those courses asenrolments. These are not counted in this chart.
Source: Grattan analysis of Department of Education and Training (various years).
Grattan Institute 2018 14

Dropping out: the benefits and costs of trying university
Figure 1.5 on the previous page, which reports on attrition after firstyear, suggests that long-term completions may decline further. Stu-dents were more likely to leave after their first year in 2015 comparedto 2008, although with only a small upward trend since 2013, and anoverall rate only slightly higher than it was in 2006.
While the share of students leaving university without a qualificationis not growing drastically, the number of such students is growingsubstantially – because about 40 per cent more people go to universitynow than in 2008.22 Given that the additional students tend to havelower ATARs than typical students in the past (see Figure 4.1 onpage 34), it is surprising that the growth in student numbers has notreduced completion rates even further.
In 2018, about 240,000 commencing domestic students are expectedto enrol at Australia’s public universities.23 Even using the best recentcommencing year for completions, 2008, as a guide, 23 per cent,or nearly 55,000 of these students, are likely to drop out. Givensubsequent trends, the actual proportion is likely to be higher still. Theywill add to the large pool of people who have started but not finished adegree. In 2015, the Australian Bureau of Statistics (ABS) estimatedthat nearly 800,000 people had an incomplete bachelor degree (otherthan one they were currently enrolled in).24
22. The growth in unique CHESSNs for commencing enrolments between 2008 and2014 at public universities was 40 per cent, Department of Education and Training(various years).
23. There were about 240,000 enrolments with a unique CHESSN public universitiesin 2016. Growth in commencing domestic bachelor degree student numbersslowed to close to zero in 2015 and 2016. Applications and offers statisticssuggest another year of stable numbers in 2017. As a result, zero growth isassumed between 2016 and 2018 throughout this report, Department of Educationand Training (2017d).
24. Calculated from ABS (2016a). There are differences between the methodologyused in this report and the ABS methodology. See Cherastidtham et al. (2018,section 1.2).
1.4 Policy interest in course non-completion
The Federal Government is concerned about increasing non-completion rates. The Education Minister, Senator Simon Birmingham,has asked the Higher Education Standards Panel, a statutory advisorycommittee, to look into the factors driving attrition, and how highereducation providers can support student success and course comple-tion.25 He is making university funding partly contingent on universityperformance, including on retaining students (there is more on perfor-mance funding in Section 8.4 on page 50).26 TEQSA, responsible forensuring higher education providers meet legal minimum standards onadmission and student progress, has also investigated attrition levels(there is more on TEQSA in Chapter 7).27
Government interest in attrition and completion is not misplaced – insome cases dropping out leads to costs that are unnecessarily high,and benefits that are unnecessarily low. But there is a careful balanceto maintain. As the next chapter will show, students who drop outreceive benefits as well as incur costs.
25. Higher Education Standards Panel (2017, p. 5).26. Australian Government (2017a).27. Attrition levels: TEQSA (2017b). Minimum standards: Department of Education
and Training (2015a).
Grattan Institute 2018 15

Dropping out: the benefits and costs of trying university
2 Benefits and costs of an incomplete degree
Policy concern about dropping out is driven by concern about its cost.Students spend time and money on study that does not deliver thebenefits of a completed degree. Most people who drop out of universityreport some benefits, including improved skills and employment,interest in what they studied, and making friends. Nearly half of themwould still begin their degree, knowing what they know now. For peoplewho are unsure of their direction, there is a benefit in exploring highereducation as one of their options.
But there are also costs. Most people who leave without a degree haveHELP debts below $10,000. But some drop out with substantial debtsafter years of study. Almost one-in-five people who drop out say theyreceived no benefits at all from their time at university.
Most people who dropped out believe that they would be better off ifthey had a degree.
2.1 Student perceptions
Trying university can have benefits even for students who do notcomplete a degree. A Grattan Institute online survey of people with anincomplete degree suggests that for many the benefits outweigh thecosts.28 More than 40 per cent of respondents said that, knowing whatthey know now, they would still have begun their degree (Figure 2.1).Remarkably, of this group, nearly half would still leave. Even thoughthey did not finish their course, enrolling brought benefits.
But the survey also shows that almost 40 per cent of people who didnot complete would not have started their degree, knowing what theyknow now. Although their time at university might have brought some
28. The survey was conducted between late 2017 and early 2018, see Appendix B formore detail.
Figure 2.1: Many people who drop out would still begin the degree,knowing what they know nowPer cent
0
10
20
30
40
50
No Unsure Yes0
10
20
30
40
50
No Unsure Yes
if yes “… still leave the degree”“…would you still begin the degree?”
“Knowing what you know now…
Notes: Only includes students who have never completed a degree, 376 respondents.
Source: Grattan survey of people with an incomplete university degree, 2017-18. SeeAppendix B for details.
benefits, the costs were greater and, with the benefit of hindsight, theywould not have attended.
2.1.1 Time and student contribution costs
The time and money costs of incomplete degrees vary significantly.Many students leave quickly during the mutual selection process(Section 1.1). They haven’t necessarily spent much time studying.
Grattan Institute 2018 16
Dropping out: the benefits and costs of trying university
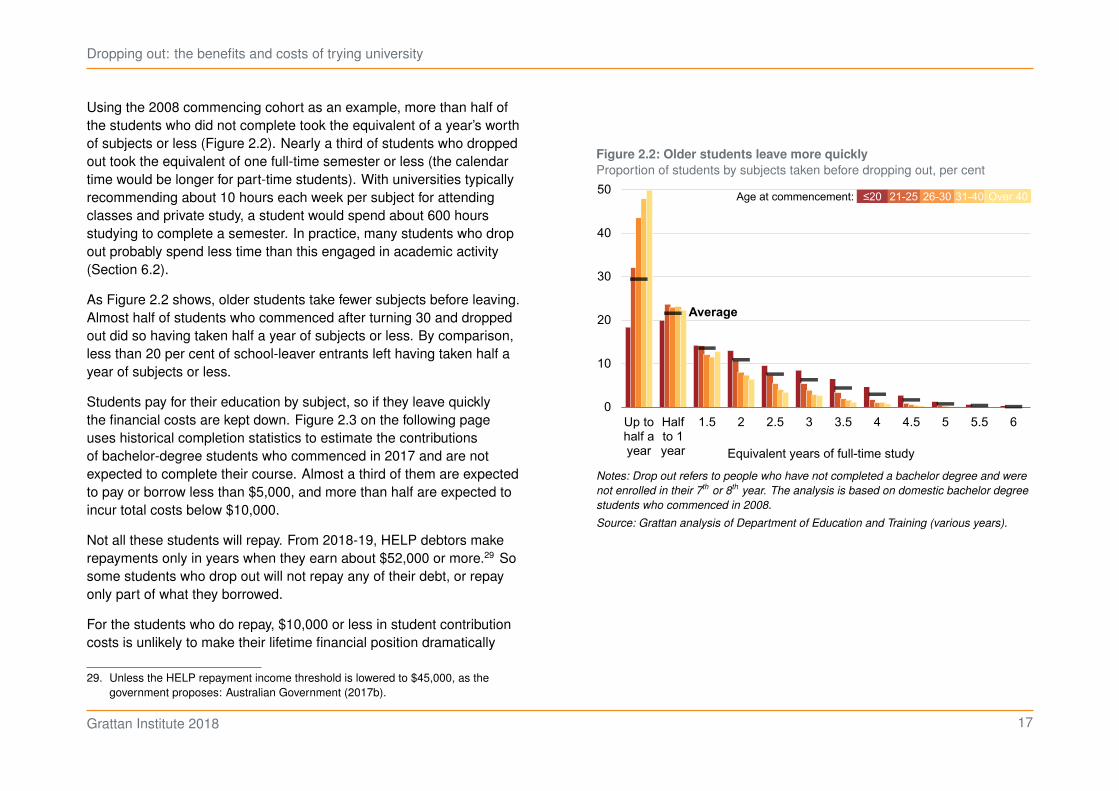
Using the 2008 commencing cohort as an example, more than half ofthe students who did not complete took the equivalent of a year’s worthof subjects or less (Figure 2.2). Nearly a third of students who droppedout took the equivalent of one full-time semester or less (the calendartime would be longer for part-time students). With universities typicallyrecommending about 10 hours each week per subject for attendingclasses and private study, a student would spend about 600 hoursstudying to complete a semester. In practice, many students who dropout probably spend less time than this engaged in academic activity(Section 6.2).
As Figure 2.2 shows, older students take fewer subjects before leaving.Almost half of students who commenced after turning 30 and droppedout did so having taken half a year of subjects or less. By comparison,less than 20 per cent of school-leaver entrants left having taken half ayear of subjects or less.
Students pay for their education by subject, so if they leave quicklythe financial costs are kept down. Figure 2.3 on the following pageuses historical completion statistics to estimate the contributionsof bachelor-degree students who commenced in 2017 and are notexpected to complete their course. Almost a third of them are expectedto pay or borrow less than $5,000, and more than half are expected toincur total costs below $10,000.
Not all these students will repay. From 2018-19, HELP debtors makerepayments only in years when they earn about $52,000 or more.29 Sosome students who drop out will not repay any of their debt, or repayonly part of what they borrowed.
For the students who do repay, $10,000 or less in student contributioncosts is unlikely to make their lifetime financial position dramatically
29. Unless the HELP repayment income threshold is lowered to $45,000, as thegovernment proposes: Australian Government (2017b).
Figure 2.2: Older students leave more quicklyProportion of students by subjects taken before dropping out, per cent
0
10
20
30
40
50
Up tohalf ayear
Halfto 1year
1.5 2 2.5 3 3.5 4 4.5 5 5.5 6
Equivalent years of full-time study
≤20 21-25 26-30 31-40Age at commencement: Over 40
Average
Notes: Drop out refers to people who have not completed a bachelor degree and werenot enrolled in their 7th or 8th year. The analysis is based on domestic bachelor degreestudents who commenced in 2008.
Source: Grattan analysis of Department of Education and Training (various years).
Grattan Institute 2018 17

Dropping out: the benefits and costs of trying university
worse. Nevertheless, if they received few or no benefits from their studythis is money they could have better spent on something else.
Although most students who drop out spend less than $10,000 andmodest amounts of time, some invest much more than this withoutgetting a degree. Ten per cent spend the equivalent of three or moreyears of full-time study before departing. Eight per cent end up owing$30,000 or more. On average, students who drop out borrow $12,000.
2.1.2 Career costs and benefits
The main long-term cost of not finishing a course is lost labour marketopportunities. Most students have job and career reasons in mind whenthey enrol in university.30 Without their degree, students may miss outon a career they wanted, and the additional lifetime earnings that, onaverage, graduates receive.31
In theory, people who start but do not finish university should havehigher average incomes than people who never went to university,but lower than graduates. Admission to higher education suggestsabove-average cognitive ability, and university students may acquireknowledge and skills with labour market value without completing theircourse. These factors should boost pay, on average. But people wholeave university without a degree lack skills or credentials requiredor preferred in many high-paying occupations, limiting their careeropportunities.32
The Grattan online survey of people who had started but not finished adegree allows us to explore the idea that students acquire employmentbenefits from incomplete degrees. Of the people who said they wouldstill begin their degree, despite knowing that they will not complete,
30. Baik et al. (2015, p. 24); and Long et al. (2006, chapter 5).31. Norton (2012); Borland et al. (2000); Wei (2010); and Daly et al. (2012).32. Schnepf (2017), using European data, provides empirical support for the theory.
Figure 2.3: Most students who drop out will pay or borrow less than$10,000Per cent of students by debt level ($2017)
0
5
10
15
20
25
30
5k or less 5 - 10k 10 - 15k 15 - 20k 20 - 30k More than30k
Notes: Student contributions are calculated using the six-digit field of education codeand 2017 funding rates. Twelve per cent of student contributions were paid upfront.See also Figure 2.2.
Source: Grattan analysis of Department of Education and Training (2017e) andDepartment of Education and Training (various years).
Grattan Institute 2018 18

Dropping out: the benefits and costs of trying university
many reported significant employment-related benefits from theirincomplete degree, as Figure 2.4 shows. Of this group, more than60 per cent said that their course ‘taught them useful skills’, one-thirdsaid it ‘helped clarify career goals’, and one-quarter reported that theirincomplete degree ‘helped them get employed’. The people who wouldnot begin their degree again also reported some employment-relatedbenefits, but at lower levels than those who would begin their degreeagain. These results are consistent with a recent single-universitysurvey, which found that nearly half of students who left withoutcompleting see their study as helpful for their career goals.33
The career benefits of incomplete qualifications are reflected inearnings. Figure 2.5 shows that people who start a degree earnconsiderably more than people who never enrolled, but also less thanpeople who complete their degree. The median annual income ofpeople with an incomplete bachelor degree and no other post-schoolqualification is close to $12,000 more than someone with Year 12 butno further study. But it is about $15,000 below that of someone whocompleted their bachelor degree.
At the median, a diploma-holder who attempted a bachelor degreeearns nearly $14,000 a year more than one who did not. This isconsistent with diploma-holders who were admitted to a bachelordegree being more able and skilled than other diploma-holders, withsome of their skills potentially learned while enrolled in their bachelordegree.
Figure 2.5 also shows that, at the median, someone with an incompletebachelor degree but with a Certificate III/IV or a diploma or advanceddiploma earns only moderately less than someone with a bachelordegree. Almost half of people with an incomplete bachelor degree haveone of these qualifications.34
33. Harvey et al. (2017, p. 37).34. Excluding people who completed another bachelor degree or above, ABS (2016a).
Figure 2.4: Students who don’t complete report benefits from their timeat university“Were there any benefits from the time you spent doing the incompletedegree?”, per cent
0 10 20 30 40 50 60 70
No benefits
I made friends/connections
It was interesting
It taught me useful skills
It helped clarify career goals
It helped me get employed
Would still enrol in the
degree: NoYes
Non-employment related
Employment related
None
Average
Notes: Only includes 311 respondents who dropped out and do not hold a bachelordegree.
Source: Grattan survey of people with an incomplete university degree, 2017-18.
Grattan Institute 2018 19

Dropping out: the benefits and costs of trying university
This positive earnings information on diplomas needs a caveat. ABSsurveys and other data sources suggest that upper-level vocationalqualifications benefit men more than women, at least financially. AsFigure 2.6 on the next page shows, early-career women with thesequalifications earn much the same as women who finished theireducation at Year 12.35 This suggests that women who drop out ofuniversity forgo more earnings than men.
2.1.3 Non-financial costs and benefits
Although most commencing students have career goals, studentsoverwhelmingly choose courses that interest them. Ninety-five percent of first-year students agree that ‘studying in a field that reallyinterests me’ is an important reason for enrolling.36 On this goal, highereducation often delivers, even for those who do not complete. Amongthe people who would still enrol in a degree, 70 per cent found theirincomplete course interesting, and even among people who would nothave enrolled in hindsight, 40 per cent found their course interesting.(Figure 2.4 on the preceding page).
University is also a place to meet people and make friends. More than40 per cent of the people who did not complete, but would still enrol intheir degree anyway, made lasting friendships or connections while atuniversity. But less than 20 per cent of the people who would not dotheir degree again made lasting friendships or connections at university.
Friendships contribute to well-being, but the broader psychological con-sequences of trying university are unclear. In recent surveys, youngeruniversity students report higher rates of psychological distress thannon-students of the same age.37 Among students considering leavingwithout finishing, the single most commonly cited reason is ‘health or
35. Wilkins (2016, pp. 49–51); and Norton and Cherastidtham (2017, section 3.2.2).36. Baik et al. (2015, p. 24).37. Cvetkovski et al. (2012).
Figure 2.5: People who begin a bachelor degree generally earn more,even if they don’t completeMedian annual earnings from all sources all ages, $2015
0
10,000
20,000
30,000
40,000
50,000
60,000
Year 12 Cert III/IV Diploma
Did notstart uni
Dropped out of a bachelor course
Highest completed qualificationBachelor
Notes: ‘Diploma’ also includes advanced diploma. Excludes people who were studyingat any level. ‘Did not start uni’ represents those with no incomplete bachelor-or-abovecourses. ‘Dropped out’ group is composed of those whose highest incompletequalification is a bachelor degree. ‘Bachelor’ includes those with an incompletequalification, provided they have completed at least one bachelor degree. Includespeople who are not working.
Source: ABS (2016a).
Grattan Institute 2018 20

Dropping out: the benefits and costs of trying university
stress’.38 For some students, concluding that enrolment was a mistake,or struggling with academic work, may cause or exacerbate mentalhealth problems.39 If so, that may be a cost of attending university.
Dropping out may remove some triggers for mental health problems.But it may not resolve all psychological issues. In the Grattan survey ofpeople with incomplete degrees, more than two-thirds of respondentsfelt that by dropping out they had let themselves or someone else down(they may also have felt this if they had not attended in the first place).40
In an ABS survey, people with an incomplete bachelor degree weretwice as likely to report a long-term mental health condition as peoplewith bachelor degrees who had never dropped out.41 However, we donot know whether or to what extent these mental health issues arelinked to their university experience.
2.1.4 Selection costs and benefits
The long mutual selection process described in Section 1.1 hasbenefits. A selection system with low application fees and a lengthytry-before-you-buy period lowers the risk of going to university. Peopleare more prepared to apply and enrol if the costs of enrolment are low.Even if the motive for attending university is to comply with parental
38. The survey starts collecting data in second semester, so the data excludesstudents who left earlier, Social Research Centre/Department of Education andTraining (2017, p. 12). In the Grattan survey of people with incomplete degrees,18 per cent of those who do not currently have a bachelor degree gave a mentalhealth reason for leaving university.
39. One recent Australian study found an association between mental health issues,alcohol consumption and missing classes and not completing assignments:Tembo et al. (2017). However, another Australian study found, counter-intuitively,that people with anxiety or depression were not less likely to complete theirdegree: Cvetkovski et al. (2018).
40. More than half of respondents who did not have a degree felt they had let theirfamily down.
41. ABS (2016a). This was true whether or not they subsequently went on to completea degree.
Figure 2.6: Women gain little financial benefit from upper-levelvocational qualificationsMedian annual income from all jobs, 25-to-34 years old in 2016, $
0
10,000
20,000
30,000
40,000
50,000
60,000
70,000
80,000
90,000
Male Female
Diploma
Year 12
BachelorCert III/IV
Notes: Sample includes people born in Australia or born overseas and arrived inAustralia at least ten years ago, employed and not studying. Weighted by weeklyearnings in all jobs. The income differences are larger than they appear in Figure 2.5because it includes people who are not working.
Source: ABS (2017).
Grattan Institute 2018 21

Dropping out: the benefits and costs of trying university
desires or to join friends, some may discover that it is interesting andthey want to continue. Their careers and lifetime earnings could besubstantially better as a result.
Subsequent chapters will suggest improvements to the mutualselection process. But even with these changes there will still be manythings that applicants don’t know about themselves and about univer-sity, and many things that universities don’t know about applicants.This uncertainty means that, to some extent, incomplete degreesare an inevitable cost of seeking to match people with courses andcareers. Although it is difficult to quantify the benefits to the peoplewho might never have started under a different system, these shouldbe considered along with the costs to students who start courses butdo not finish.
For the students whose enrolment does not work out, the time andmoney spent experimenting with university are not necessarily wasted.Clarifying their course and career goals can be beneficial. So canmaking friends and learning things that are interesting or useful.
2.2 Reducing costs and increasing benefits
Most students who go to university report some benefits, whether theycomplete or not. But in some cases, the benefits could have beengreater than they were. More than 60 per cent of the people whodropped out and have no other degree think that their position wouldbe better if they had finished (Figure 2.7). For some, this might be ageneral recognition that graduates usually earn more, not a belief thatthey should have tried harder to complete. But Figure 2.4 on page 19shows that around a quarter of those who would begin their degreeagain would not drop out if they had their time again. This points tosome potential to improve completion rates, through better decisionsby students and changes to university practices.
Figure 2.7: Most people who don’t complete their degree believe theywould have been better off if they had completed“Do you think you would be in a better position now if you had finished yourincomplete degree?”, per cent
Much worse
About the same
Much better
0
10
20
30
40
1 2 3 4 5
Source: See Figure 2.1.
A third of the people who would not begin the degree again if theyhad their time again report no benefits at all; this is one in five of allrespondents to the Grattan survey of people who do not currently havea degree. In their view, the time and money they spent at universitydid not deliver commensurate benefits. The following chapters discusshow we can identify these students more quickly, and how the selectionsystem can better protect them from costly mistakes.
Grattan Institute 2018 22

Dropping out: the benefits and costs of trying university
3 Risk factors for not completing a degree
The path from enrolment to graduation is never entirely predictable.Some promising students end up failing or deciding to do somethingelse. Some students succeed despite disadvantage and the obstaclesin their way.
Despite this uncertainty, going to university is not a lottery in whichanything might happen. Statistical analysis of university students showsthat some factors and characteristics are signs of high risk of nevergetting a degree, and other factors and characteristics are signs of lowrisk.
Past academic achievement is a useful guide to future academicachievement. Students with a high ATAR have good prospects ofcompleting university, while students with ATARs below 60 have a 40per cent risk of not completing university within eight years, after takingaccount of a wide range of other characteristics. Similarly, studentswho have failed subjects in the past are less likely to complete thanstudents who never fail any subjects.
While academic ability is essential, so too is the time needed tocomplete course requirements. Part-time study is the single biggestrisk for non-completion, largely because most part-time students haveother major responsibilities at home and at work.
3.1 Learning from the experience of others
The mutual selection process involves some uncertainty that can onlybe resolved by enrolling and seeing how it turns out. But students anduniversities can also learn from the experiences of others. Statisticalanalysis of student outcomes can identify personal or study factors thataffect completion prospects. These can inform student and universitydecision-making.
This report draws on an analysis of students who started a bachelordegree at a public university between 2006 and 2008, and tracks themover eight years. It uses enrolment data collected by the Departmentof Education and Training. Figure 3.1 on the next page summarisesthe variables included in the analysis. The starting hypothesis was notthat these attributes necessarily cause a student to complete or notcomplete a degree, but that they might be associated with factors thatmore directly affect outcomes. These factors include academic ability,motivation, persistence, time put into study, study practices, financialsupport, social support, academic support and teaching quality.
This risk analysis aims to identify how each factor in isolation affectsthe risk of not completing. For example, many part-time students arealso mature age, and many lower-ATAR students also have a lowersocio-economic status. For student and university decision-making, itis important to work out the relative importance of each factor. In somecases, attributes that look high-risk in isolation are low-risk when otherfactors are taken into account.
The most significant predictive factors are prior academic performanceand part-time study, because of their substantial influence on comple-tion prospects, and because they affect many students. Subsequentsections of this chapter examine them in more detail. Most othervariables listed in Figure 3.1 have, in isolation, a modest, small, or noeffect on completion rates, or affect only small numbers of students.But when combined with other risk factors they can be important tostudent and university decision-making. They are outlined only brieflyin this chapter. A background paper, University attrition: what helps andwhat hinders university completion?, discusses them in more detail.42
42. Cherastidtham et al. (2018).
Grattan Institute 2018 23

Dropping out: the benefits and costs of trying university
3.1.1 Academic performance
Every university includes academic performance as part of its ad-mission criteria. Most media attention focuses on ATAR, which ranksschool leavers by their academic results. In recent years, about 40 percent of commencing bachelor-degree students have been admittedbased on their secondary education, although not always using theirATAR. Nearly as many students again are admitted based on priorvocational or higher education, so their academic preparation alsoneeds to be closely examined.
ATAR incorporates the effects of ability and effort in school. Theseattributes are important at university as well, so it is unsurprising thatATAR levels are linked to completion rates.43 Figure 3.2 on the followingpage shows the risk of not completing by ATAR band, after controllingfor other factors in the analysis.
Commencing students with ATARs of 90 or above have a low risk –below 20 per cent. This means 2-in-10 students with an ATAR of 90or above, who otherwise have an average background representative ofall commencing students, will not complete with eight years. The risk ismarginally higher for men than women, but both are low risk. The riskof not completing rises as ATAR falls among students with otherwisesimilar backgrounds. For students with an ATAR of between 70 and 79,the risk is above 30 per cent. And for students with an ATAR of below60, the risk rises to twice the level for students with an ATAR of 90 orabove, to about 40 per cent.
Nearly 20 per cent of commencing bachelor degree students haveincomplete higher education. Changing courses is a significant aspect
43. Cardak et al. (2017) also found a strong positive impact of ATAR using the 2006Longitudinal Survey of Australian Youth (LSAY) data. With LSAY data, Lim (2011)found a positive effect of Programme for International Student Assessment (PISA)scores on completion. PISA is an international test of the skills and knowledge of15-year-olds.
Figure 3.1: The student and course characteristics used to analysecompletion prospects
Personal and family
Academic performance
Institution and course
Engagement with study
1. Gender
2. Age
3. Aboriginal and Torres Strait Islander
4. Disability
5. Citizenship
6. Socio-economic
7. Language spoken at home
8. Country of birth
9. Remoteness of home
10.Year 12 state or territory
1. ATAR
2. Highest qualification
3. Basis of admission
1. Institution
2. Field of education
3. Course length
4. Credit used
1. Type of attendance
2. Mode of attendance
3. Remoteness of campus
4. Move away from home
5. Travel time
6. Commencing in semester 2 rather than semester 1
Notes: A subject is assumed to equal 0.125 EFTSL. For further detail of each variable,see the background paper, Cherastidtham et al. (2018).
Grattan Institute 2018 24

Dropping out: the benefits and costs of trying university
Figure 3.2: High-ATAR students are much more likely to complete adegreeRisk of not completing within eight years, controlling for other factors, per cent
0
10
20
30
40
50
30-49 50-59 60-69 70-79 80-89 90or above
ATARNotes: Predictive margins are shown. This means, for example, that controlling for allthe other characteristics in the analysis, a student with an ATAR between 70 and 79has a non-completion risk 15 percentage points higher than a student with an ATAR of90 or above. See the background paper, Cherastidtham et al. (2018) for further detail.
Source: Grattan analysis of Department of Education and Training (various years).
Figure 3.3: People who have previously succeeded in higher educationare more likely to completeRisk of not completing within eight years, controlling for other factors, per cent
0
10
20
30
40
50
Failed atleast 50%
Failed between25% and 50%
Failed less than25%
Failed none
Subject fail rate during the previous two semestersNotes: Based on a sub-sample of students commencing in 2008. Only includesstudents admitted based on incomplete higher education and who were enrolled in2007. Predictive margins are shown. See also the background paper, Cherastidtham etal. (2018).
Source: Grattan analysis of Department of Education and Training (various years).
Grattan Institute 2018 25

Dropping out: the benefits and costs of trying university
of the mutual selection process into university.44 At least for studentswho complete a full year of study before switching, changing coursesdoes not of itself have a major negative effect on completion prospects.But previous university performance does predict their risk of notcompleting. Students who passed all their subjects in the year priorto changing courses have a relatively low non-completion risk of about20 per cent. Those who have previously failed subjects are less likely tocomplete their new course. Students who have failed half their subjectshave a non-completion risk of more than 40 per cent (Figure 3.3).45
People who have previously completed vocational or sub-bachelorqualifications are more likely to complete a higher education degreethan otherwise. About 10 per cent of students admitted have acompleted vocational qualification and another 4 per cent have acompleted higher education diploma or associate degree.46 Studentsadmitted with a vocational qualification have a non-completion riskof 28 per cent, and students with a higher education diploma orassociate degree have a risk of 27 per cent.47 These are slightly lowerrisks than for all students whose highest educational attainment isYear 12. Higher education diploma and associate degree studentsusually had relatively low ATARs.48 They are more likely to completehigher education degrees than would be expected given their ATAR.
44. In recent years, 17.5 per cent of commencing bachelor degree students have anincomplete higher education course as their highest previous education. This isnot necessarily their basis of admission: Department of Education and Training(various years).
45. In recent years, 1.5-to-1.8 per cent of commencing bachelor degree studentsfailed half or more of the subjects they took in the previous year: ibid.
46. Ibid.47. Diplomas include pathway courses that usually have a remedial element, as
well as specialised courses such as diplomas of languages. However, languagediplomas are typically taken concurrently with a bachelor degree, and so areunlikely to be reported as a highest prior qualification.
48. For example, in 2015 median ATARs for commencing students were: 80 forbachelor pass degree students who finished school in 2014, 65 for associate
It is probable that they improve academically during their diploma orassociate degree; and these courses also screen out students who areunlikely to succeed in higher education.
3.1.2 Part-time study
About 18 per cent of commencing domestic bachelor degree studentsbegin their studies part-time.49 For them, four subjects over a year isthe most common study load, half the standard full-time level. About 20per cent of commencing part-time students switch to full-time in secondyear, about 40 per cent remain part-time, and the rest do not continuewith their studies.50
As this high departure rate shows, part-time students often do notpersist. No other factor in the statistical analysis is more negative forcompletion prospects than part-time study. Figure 3.4 shows the riskof not completing is higher if students enrol in fewer subjects in theirfirst year. Students who enrol in two subjects or fewer in their first yearare least likely to complete, with more than a 60 per cent risk of notcompleting within eight years. The part-time students who do completetypically increase the number of subjects they take after first year.
The results for students with very few subjects require some caveats.As discussed in Section 1.1 some newly-enrolled students are tryingout university, without a firm intention to complete on the day they enrol.Taking one or two subjects can be an experiment with study: students
degree students, and 52 for diploma or advanced diploma students: Department ofEducation and Training (2017a).
49. The official definition of part-time study is taking less than 75 per cent of thenormal annual subject load of a full-time student.
50. Based on students commencing between 2006 and 2008.
Grattan Institute 2018 26

Dropping out: the benefits and costs of trying university
who like it and pass continue; the others leave.51 Departing studentsfound out that university was not for them, at low cost.
Other students taking very few subjects may be seeking specific skillsor knowledge without planning on taking a full degree. Universitiesoffer not-for-award subjects for such students, but these attract nogovernment subsidies and students must pay upfront fees. It is cheaperfor the student to enrol in a course, and then drop out. Students whoalready have a degree and enrol in only one subject in a subsequentbachelor degree could be in this category.52
Students taking three, four or five subjects a year are more likely to beaiming for a degree. Figure 3.4 shows that their risk of not completingwithin eight years is much lower than students taking one or twosubjects a year. Students who take more than six subjects – 75 percent of a full year load – in their first year are least likely to drop out,with a 22 per cent risk of not completing in eight years. They arelikely to stay full-time; of the full-time commencing students in ouranalysis, less than 8 per cent enrolled part-time in any subsequentyear. Full-time study maximises a student’s chance of completing theircourse.
51. In a separate analysis, nearly 2 per cent of commencing bachelor pass degreeenrolments enrolled in one subject between 2006 and 2015. Of those, 60 per centwere categorised as potentially trialling university – with prior education of lessthan a bachelor degree and either increasing their study load or leaving universityafter first semester. Another possible category of students, although not one easilyidentifiable in the data, is students who always intended to be full-time but droppedmost of their subjects prior to the census date, perhaps after realising that theyhad chosen the wrong course.
52. In the separate analysis of one-subject bachelor pass degree enrolments (footnote64), 6 per cent were classed as potentially in this group because they already hada bachelor degree or above and did not re-enrol in semester two after taking onesubject: Department of Education and Training (various years).
Figure 3.4: Studying part-time increases the risk of not completing, andthe fewer subjects the higher the riskRisk of not completing within eight years, controlling for other factors, per cent
0
20
40
60
80
More than6 subjects
5 to 6 3 to 4 2 or fewer
Number of subjects in the first yearNotes: Predictive margins are shown. Based on subjects taken in the first twosemesters. Six or more subjects in a year is regarded as full-time. See also thebackground report, Cherastidtham et al. (2018).
Source: Grattan analysis of Department of Education and Training (various years).
Even for students who start part-time, converting to full-time study is avaluable strategy for completion. Of the students who never enrol full-time, only 19 per cent complete a bachelor degree within eight years,with another 9 per cent still enrolled.53 At best, less than 30 per cent ofcontinuously part-time students will complete a course.
53. This figure does not control for other risk factors, meaning that factors andcharacteristics other than part-time study may contribute to this outcome.
Grattan Institute 2018 27

Dropping out: the benefits and costs of trying university
Figure 3.5: Part-time students are more likely than full-time students towork full-timePer cent of students by type of attendance, 2016
0 20 40 60 80 100
Full-time
Part-time Not employed
1-9 hours a week
10-19 working hours per week
20-29hours
40 hoursor more
30-39hours
Per cent of studentsNotes: Including bachelor degree students at universities and other providers and allages.
Source: ABS (2016b).
Figure 3.6: Part-time students are much more likely to cite work andfamily responsibilities as reasons for considering leaving
0 10 20 30 40
Academic support
Paid workresponsibilities
Familyresponsibilities
Workload difficulties
Study/life balance
Full-timePart-time
Reasons for considering leaving institution
Per cent of students who chose reason
x2.5
x2
Notes: Health and stress is also a top reason, at about 30 per cent. Domesticbachelor-degree students. Data from 2012-2015.
Source: Social Research Centre/Department of Education and Training (various years).
Grattan Institute 2018 28

Dropping out: the benefits and costs of trying university
Many students study part-time because they are time poor. Accord-ing to Australian Bureau of Statistics data, part-time students aremore likely to work and to work longer hours than full-time students(Figure 3.5 on the preceding page). Median weekly working time isless than 10 hours for full-time students; for part-time students it is30-to-39 hours. With work commitments, part-time students haveless time available for study and engagement with other aspects ofuniversity life.54 The Government’s Student Experience Survey showsthat part-time students disproportionately nominate paid-work as areason they consider discontinuing (Figure 3.6 on the previous page).
Adding to their time commitments, part-time students are also muchmore likely than full-time students to have young children. Amongstudents aged 25-44, nearly 40 per cent of part-time students havea youngest child aged under 15, compared to about 25 per cent offull-time students.55 Among students considering leaving university,part-time students are twice as likely as full-time students to nominatefamily responsibilities as their reason (Figure 3.6).
3.1.3 Other study factors
Overall, off-campus students have low rates of completion.56 But aftercontrolling for age, part-time study and other attributes, off-campusstudy adds only a small amount of risk. On-campus students have adrop-out risk of 31 per cent; for off-campus students it is 33 per cent.
Completion rates vary by the discipline studied, as can be seen inthe left side of Figure 3.7 on the following page. Students in healthcourses typically have better-than-average completion rates, while
54. The lack of engagement is with other students rather than with academic staff, seeFigure 3.6 and Cherastidtham et al. (2018, section 2.1).
55. Including bachelor degree students at universities and other providers; ABS(2016b).
56. Department of Education and Training (2017b, table 1).
IT, humanities and agricultural students do worse than average.These results are influenced by student characteristics – for example,some courses attract high-ATAR students, with others mostly enrollower-ATAR students. The right side of Figure 3.7 shows the risk of notcompleting by discipline, after controlling for the ATAR and the otherfactors in Figure 3.1 on page 24. The patterns remain similar, but all theSTEM fields (Science, Technology, Engineering and Mathematics) endup with above-average risk, along with humanities and the creative arts.The lowest-risk fields are all health-related. The background papersuggests some possible explanations for this.57
3.1.4 Equity groups
Universities and government have a particular interest in ‘equitygroups’, categories of people with a history of lower-than-averagehigher education attainment. Generally, analysis based on the factors inFigure 3.1 shows that equity group membership is, of itself, associatedwith only a slightly higher risk of not completing.
On the standard low socio-economic status measure, which is basedon the education and occupation levels of people living near thestudent’s home address, completion rates differ little after takinginto account other factors.58 Students from the top 10 per cent ofsocio-economic status areas have a 30 per cent risk of not completing;students from the bottom 10 per cent have a 33 per cent risk of notcompleting.
For students from regional and remote areas, the findings are similar.Compared to students from major cities, students from inner or outerregional areas have the same completion risks, after controlling forother characteristics. Students from remote or very remote areas face
57. Cherastidtham et al. (2018, chapter 4).58. Year 12 address for school leavers, permanent home address for others. See
Cherastidtham et al. (Ibid., section 5.5).
Grattan Institute 2018 29

Dropping out: the benefits and costs of trying university
Figure 3.7: The risk of not completing a course varies significantly by discipline
-15 -10 -5 0 5 10 15
Medical
Nursing
Other health
Commerce
Education
Architecture
Agriculture
Science
Creative arts
Humanities
Engineering
IT
-15 -10 -5 0 5 10 15
Medical
Nursing
Other health
Commerce
Education
Architecture
Agriculture
Science
Creative arts
Humanities
Engineering
IT
Low risk
High risk
Non-completion riskwithin eight years,
deviation from the average
Non-completion ratewithin eight years,
deviation from the average
-22
Commencing course discipline
Notes: Discipline of commencing enrolment course. The risk shows deviation from the average rate across fields and universities based on an average person. Law is excluded because ithas a much higher share of double-degree students than other disciplines. See also the background paper, Cherastidtham et al. (2018).
Source: Grattan analysis of Department of Education and Training (various years).
Grattan Institute 2018 30

Dropping out: the benefits and costs of trying university
an increased risk, of 3 and 6 percentage points respectively. Only smallnumbers of students come from remote areas.59
Students who report a disability have a non-completion risk 5 per-centage points higher than other students. Most students reporting adisability classify it as ‘medical’, although it can be physical, learning or‘other’.60
The one equity group with a substantially elevated non-completion riskis Indigenous students. Their risk of not completing is 45 per cent, 15percentage points above non-Indigenous students. A relatively largeproportion of Indigenous students are admitted on an ‘other’ basis,which means that their school results or previous tertiary educationwere not the main basis for their admission. It’s likely that theseIndigenous students begin their higher education studies with relativelyweak academic preparation.61
Risk results for equity students require careful interpretation. Whileequity group membership does not of itself usually substantially addto risk, these students are more likely to have other significant riskfactors, such as weaker academic preparation or part-time study.62
Socio-economic factors may explain why the student had a relativelylow ATAR, or why they need to work full-time and study part-time.
3.1.5 Other personal characteristics
Where a student was born generally has a modest, 5 percentage pointsor less, effect on completion prospects. The risk of people born in NewZealand or Asia not completing is slightly higher than for people born inAustralia. Similarly, language spoken at home generally has little effect
59. For more detail, see Cherastidtham et al. (2018, section 5.6).60. For more detail, see Cherastidtham et al. (Ibid., section 5.2).61. For more detail, see Cherastidtham et al. (Ibid., section 5.3).62. For the links between ATAR and socio-economic status, see the references at
Norton (2016, pp. 186–188).
on completion rates. The exception is students speaking an East Asianlanguage such as Chinese at home; their completion prospects arebetter than those of students who speak English at home.63
Women are more likely to a complete their course than men. Aftercontrolling for other factors, men have a 5 percentage points higher riskof not completing than women.64
Students who begin their course at age 18 or younger have the lowestnon-completion risk, at 28 per cent (Figure 3.8 on the following page).Risk increases slowly in the early post-school years, and peaks forpeople beginning their studies between the ages of 21 and 30. Thestatistical model takes account of the fact that older students are morelikely to study part-time, which is the largest non-completion risk.However, even among part-time students, the 20-somethings are lesslikely to complete than younger or older students.65
63. For more detail, see Cherastidtham et al. (2018, section 5.7).64. For more detail see Cherastidtham et al. (Ibid., section 5.1).65. For more detail see Cherastidtham et al. (Ibid., section 5.4).
Grattan Institute 2018 31

Dropping out: the benefits and costs of trying university
Figure 3.8: The risk of not completing increases from age 19 to age 30Risk of not completing within eight years controlling for other factors, per cent
2 48 8
4 36
0
10
20
30
40
18 oryounger
19 20 21-25
26-30
31-40
41-50
Over50
Age at commencement
Increased risk compared to 18 or younger
Notes: Predictive margins are shown. See also the background paper, Cherastidthamet al. (2018).
Source: Grattan analysis of Department of Education and Training (various years).
Grattan Institute 2018 32

Dropping out: the benefits and costs of trying university
4 University admission practices
University admissions are lightly regulated, and in practice primarilyfocus on academic ability, rather than other factors that also affectcompletion prospects.
Universities are required by law to only admit students with the aca-demic preparation needed for the course. All universities have policieson the minimum academic achievement required for admission. Mostuniversities say that prospects for success are a selection principle.But a substantial minority of admitted students, one-in-five, havecharacteristics that put them at high risk of not completing their course.Most of them enrol part-time. Universities rarely scrutinise whetherpart-time students can put in the work necessary to complete theircourse.
4.1 Legal requirements on admissions
Universities have substantial autonomy over their admission re-quirements, although within legal minimum standards. In 2012 thegovernment introduced ‘threshold standards’ that all higher educationproviders must meet. These include admission standards. The TertiaryEducation Quality and Standards Agency (TEQSA) is responsible forensuring that the standards are met.
The first version of the threshold standards applied between 2012 and2016. These required universities and other higher education providersto check that prospective students had ‘adequate prior knowledgeand skills to undertake the course of study successfully’.66 The lateststandards, which took effect on 1 January 2017, contain a similarprovision. Providers need to ‘ensure that admitted students have the
66. DIICCSRTE (2013b, p. 15).
academic preparation and proficiency in English needed to participatein their intended study’.
The new threshold standards also contain a potentially important addi-tion: ‘. . . and no known limitations that would be expected to impede[the student’s] progression and completion’.67 This requires a moreholistic view of possible impediments to success in higher educationthan just academic preparation. It can include orientation-type issuescovered in the standards; for example that students know about andhave access to support services they may need.
The evidence in this report shows that studying part-time, and espe-cially studying a low number of subjects, should also be regarded as aknown limitation that impedes progression and completion. Continuouspart-time study, especially combined with other risk factors, makescompletion unlikely. However, this is not the way either TEQSA or theuniversities interpret the standards (the role of TEQSA is discussedfurther in Chapter 7).
4.2 Admissions in practice
Almost every university policy on admission has the applicant’sprospect of success as a selection principle.68 An acceptable levelof risk is not stated, but the main tools for managing it are variousmeasures of academic preparation.
For school leavers, most universities use secondary education, andusually ATAR, as the main admission criteria.69 Some courses also
67. Department of Education and Training (2015b, p. 3).68. Based on desktop research in January 2018.69. The statistics on this subject have some issues: Cherastidtham and Norton
(2018). However between 2010 and 2016, 90 per cent of school-leaver entrants
Grattan Institute 2018 33

Dropping out: the benefits and costs of trying university
require prerequisite subjects in addition to English, which is necessaryfor an ATAR and which also is used to meet the standard on languageproficiency.
For the most part, the standards and prospects for success areirrelevant to the ATARs required for admission. Instead, ATAR levelsare typically set by the admissions market, with high-demand coursestypically requiring ATARs that are well above the levels that would raiseany concerns about risk of non-completion (Section 3.1.1). ATAR isused as a fair and efficient way of allocating scarce student places,not to protect prospective students from a poor choice.70 Half of schoolleavers commencing university have ATARs above 80.
Although most ATAR course admission requirements are not related toany inherent minimum academic ability needed to do the course, manyuniversities nominate a minimum ATAR, either overall or for particularcourses. The minimum ATAR at several universities is between 50 and60, indicating a willingness to take relatively high-risk students.
The proportion of commencing domestic bachelor-degree studentsbeing admitted with lower ATARs has trended up, as Figure 4.1 shows.The share of below-60 ATAR students grew from about 5 per cent in2008 to more than 8 per cent in 2016.
For applicants seeking entry based on their previous higher educationexperience – a growing share of new entrants – universities typicallyuse past academic performance, such as a grade point average (GPA).
have an ATAR recorded in the enrolment data. Three-quarters of school-leaverentrants had a valid ATAR recorded and used secondary education as their basisof admission: Department of Education and Training (various years).
70. Universities require lower ATARs, or allocate bonus ATAR ranks for selectionpurposes, for students from disadvantaged backgrounds. A number of studieshave shown that ATAR under-predicts their academic performance comparedto other students with the same ATAR, for example: Li and Dockery (2014) andMessinis and Sheehan (2015).
Figure 4.1: The higher-risk student group share of commencingenrolments has increasedCommencing bachelor-degree students, per cent
0
5
10
15
20
25
20082016
2008
2016
Part-time Low-ATAR
Notes: ‘Low ATAR’ is defined as students with an ATAR below 60, measured againstthe total number of domestic bachelor enrolments with an ATAR.
Source: Grattan analysis of Department of Education and Training (various years).
Grattan Institute 2018 34

Dropping out: the benefits and costs of trying university
ATAR can often also be used if it is recent. Some universities letapplicants use whichever of their GPA and ATAR is better.
The data used in the analysis for Chapter 3 does not include GPA, butfailed subjects would lower a student’s GPA. Section 3.1.1 showedthat students with previous failed subjects are less likely to complete.About 5 per cent of commencing students failed at least one subjectthe previous year.71 Some universities have specific policies for thesestudents. For example, the University of Tasmania requires applicantswho have failed some subjects to undergo an extra review before anoffer can be made.72
Students who repeatedly fail half or more of their subjects are likelyto face exclusion from their university for unsatisfactory progress.Universities often impose a delay of 12 months before acceptinganother application from an excluded student. Once the waiting periodends, some universities require students to demonstrate how andwhy their chance of success in the course has improved.73 Of all theadmission criteria, this is the one that most carefully examines whetherprospective students have a reasonable prospect of completing theirdegree.
Although ATAR gets most attention in public discussion about universityadmissions, part-time study is a more significant issue. The non-completion risk of studying few subjects a year is higher than havinga low ATAR, and the proportion of students affected is larger. Part-timestudents grew from 15 per cent of commencing enrolments in 2011 to18 per cent in 2015, before declining slightly in 2016 (Figure 4.1). Butpart-time enrolment seems to get little attention during the admissionsprocess.
71. Department of Education and Training (2017a).72. University of Tasmania (2018a).73. For example UTS (2016, p. 9), University of Melbourne (2017, p. 8) and Monash
University (2018).
A small number of courses offer full-time enrolment only, but generallystudents can freely choose to study part-time. A few universities recom-mend guidance from a program administrator. The main restriction onpart-time study is the maximum time allowed to complete a degree.Typically, students have seven to ten years to complete a bachelordegree, depending on course and university. Some universities haveformulas, such as twice the standard degree length for a full-timestudent, plus one or two years. Only some universities clearly signalmaximum times in materials aimed at prospective students.
4.3 High-risk students
Mainly due to part-time study, a substantial minority of commencingstudents are at high risk of not completing a degree. Based on the riskanalysis described in Chapter 3, of the students commencing bachelordegrees in public universities in 2015, one in five – more than 50,000students – are more likely to drop out than to complete their coursewithin eight years. And nearly one in ten – about 25,000 students –have a non-completion risk of more than 70 per cent (Figure 4.2).
Most high-risk students study part-time, as Figure 4.3 shows. Amongstudents who are more likely to drop out than to complete, more than80 per cent take four subjects or fewer in their first year. Less than 5per cent of students who study more than six subjects are high risk.
Low ATAR is another major risk factor. As discussed in Section 3.1.1,students with an ATAR below 60 face about double the non-completionrisk as those with an ATAR of 90 or more.
Increased numbers of part-time and low-ATAR students help explainwhy overall non-completion rates are increasing (Section 1.3 onpage 13).
Grattan Institute 2018 35

Dropping out: the benefits and costs of trying university
Figure 4.2: One in five students is more likely to drop out of universitythan complete their courseCommencing bachelor-degree domestic students, 2015, per cent
0
5
10
15
20
25
30
10 orless
10 -20
20 -30
30 -40
40 -50
50 -60
60 -70
70 -80
80 -90
Over90
More likely to drop outthan complete (22 per cent)
Risk of not completing within eight years (per cent)Note: For details on the modelling techniques, see the background paper,Cherastidtham et al. (2018).
Source: Grattan analysis of Department of Education and Training (various years).
Figure 4.3: Of students who are more likely to drop out than complete,more than 80 per cent study part-timeCommencing bachelor-degree domestic students, 2015, per cent
More than 6 subjects4% 5 to 6
subjects14%
3 to 4 subjects in the first year
51%
2 or fewersubjects30%
Notes: Rounding means the percentages do not add up to 100. See Figure 4.2.
Source: See Figure 4.2.
Grattan Institute 2018 36

Dropping out: the benefits and costs of trying university
5 Informing student choice
More and better information about university study will not help allprospective students decide on their tertiary education options. Onlydirect experience will persuade some that university is the right orthe wrong place for them. But with so many prospective studentsuncertain about their direction, better advice should be available tothem. One-in-five people who dropped out say they would not haveenrolled if they had more information before they started.
Students should be alerted to the factors that increase the risk ofcompleting. Prospective students planning to study part-time shouldbe particularly warned. These factors should be included on websitesthat provide information to students, such as the Good UniversitiesGuide and the Department of Education and Training’s QILT (QualityIndicators for Learning and Teaching) website. The QILT site shouldbe upgraded to enable students to enter their personal characteristics,so they can understand how risk factors interact. The site should alsoexplain how students can mitigate the risks of non-completion.
5.1 Clear and simple advice to prospective university students
Many factors can affect whether students complete their degrees. Butsome factors are so significant that school advisers, university staff,and parents should alert prospective students to the risks in simple andgeneral terms.
Young people should be encouraged to think first about whetheruniversity or vocational education would best suit them. As Section 1.1reported, university is now the default post-school activity for manyyoung people. In their late-teenage years, two-thirds of young peopleplan to go to university.74 These high aspirations are out of kilter with
74. Mission Australia (2016, p. 16).
what is required to successfully complete a degree and the labourmarket’s need for people with university qualifications.75 Highereducation demand has moderated in recent years, which is likely tobe a sensible reaction to these trends. The fact that graduates do betterin the labour market than non-graduates on average is not particularlyuseful information for prospective students at high risk of not obtainingprofessional or managerial employment.
For high-ATAR students, university clearly remains a good option. Butthose with lower ATARs are less likely to complete (Section 3.1.1).Gender matters to the choices of lower-ATAR school leavers. Evenwith identical ATARs, men are less likely to complete university thanwomen.76 On the other hand, men are much more likely than women togain a financial benefit from vocational education (Section 2.1.3).
These factors both suggest we should encourage young men withlower ATARs to think seriously about a vocational diploma or a Cer-tificate III/IV qualification. Although mature-age study creates additionalrisks, vocational qualifications do not preclude university later in life.As Section 3.1.1 reported, students entering university with a priorvocational diploma qualification have reasonably good completionprospects, typically better than those without such qualifications butwith otherwise similar backgrounds.
Young people choosing university should be encouraged to go assoon as possible after leaving school, to study full-time and to enrolon-campus. Delaying university only adds slightly to the risk of notcompleting, if it is just one year to age 19 (Section 3.1.5). But delays
75. See Norton (2017) on graduate labour market outcomes.76. For more detail on the interaction between gender and ATAR, see the background
paper, Cherastidtham et al. (2018, sections 3.1 and 5.1).
Grattan Institute 2018 37

Dropping out: the benefits and costs of trying university
increase the chance of distractions such as work once studies com-mence. Those who are older when they start studying are more likelyto work full-time.77 People who work full-time before beginning theirdegree can get used to earning more, making them reluctant to forgothat income as a student. But no potentially avoidable factor is moreharmful to completion prospects than studying part-time while jugglingmultiple commitments (Section 3.1.2).
After controlling for all other factors, off-campus study adds only slightlyto the risk of non-completion (Section 3.1.3). For full-time studentswho genuinely can’t get to a campus, off-campus study is better thannot attending. But for students who can commute or move, studyingon-campus should slightly increase their completion prospects, and addto the non-academic benefits of studying. As Section 2.1.3 reported,lasting friendships and connections are often a positive outcome ofattending university.78
Prospective mature-age students are the most complex case forgeneral advice. Compared to starting university straight after school,commencing at an older age in itself adds up to 8 percentage pointsto the risk of non-completion (Section 3.1.5). Mature-age students aremuch more likely than school leavers to study part-time, and to haveother risk attributes such as studying online or being from an equitygroup. Because high-ATAR students usually begin their studies straightafter school, mature-age students tend to have lower ATARs (Figure 1.1on page 8). Such students are more likely to complete university if theyhave completed other post-school qualifications, which prepare themfor academic study.
For mature-age students, advice to study full-time and on-campusmay simply be impractical. It may be too difficult for them to change
77. See Cherastidtham et al. (2018, section 5.4).78. Some other private benefits of higher education, including health, and some public
benefits, including volunteering and civic attitudes, are plausibly linked to socialnetworks at university: see Savage and Norton (2012).
their other commitments. But some mature-age students do make thetransition from part-time to full-time study. By their second year, abouta third of the remaining mature-age students who began part-time haveconverted to full-time study.79 Their completion rate is much higherthan those who continuously study part-time (Section 3.1.2). If at leastperiods of full-time study are possible, mature-age students shouldseriously consider it. For students who cannot study full-time at all, anyadvice is partly a warning: the vast majority of people who study onlypart-time won’t get a degree in the next eight years.
5.2 Integrate information about completion rates into QILT
Some people could improve their higher education choices if informa-tion was more easily available. In the Grattan survey of people who haddropped out of a course, about one-in-five said they would not haveenrolled had they had more information before they started. A slightlylarger group were unsure (the other half would have started anyway,reflecting the benefits of an incomplete degree described in Chapter 2).
Some prospective university students already use information aboutcompletion prospects. Applications, acceptances and enrolmentdata all show that lower-ATAR students exercise greater caution thanhigh-ATAR students, and progressively larger numbers decide againstuniversity.80
ATAR’s connection with completion is unsurprising. But the linksbetween other factors and completion are less intuitive. Prospectivestudents are therefore taking risks they may have avoided if they hadbeen better informed. The most significant of these risks is part-timestudy. For mature-age students, part-time study might seem like a
79. Department of Education and Training (various years). ‘Mature age’ defined asaged 25 or more on commencement.
80. Section 1.1 and Department of Education and Training (2017d, tables A8.1 andA8.2).
Grattan Institute 2018 38

Dropping out: the benefits and costs of trying university
sensible and convenient way to deal with the competing demands ofwork and family. But for many of them it doesn’t work out, and theyleave university without completing their course (Section 3.1.2).
Some students who drop out of university have found from their ownexperience what they could have learned from the experience of others:that they aren’t academically ready for university, or that there are toofew hours in the day to combine study, work and family. If they hadknown that they were in the group of people with a less-than-50 percent chance of completing university in eight years, they may not haveenrolled in the first place, or enrolled only after they found a better wayto manage the competing demands on their time.
As in many other fields, in higher education a website is the easiestway to get information to a wide audience. Higher education has acommercial website, the Good Universities Guide, and the Departmentof Education and Training’s QILT (Quality Indicators for Learning andTeaching) website. The Good Universities Guide includes informationon school-leaver student retention into second year, giving universitiesratings of up to five stars on this and other indicators. But it does notcover other types of student, does not give information on fields ofeducation (which, as Section 3.1.3 shows, can vary significantly intheir completion rates), and does not distinguish between enrolmenttypes. For example, retention rates largely driven by full-time studentsare misleading for a prospective part-time student.
Prospective students using QILT choose fields and universities of inter-est, and the website then provides them with comparative informationon student satisfaction and graduate outcomes. QILT has no dataon student retention or completion, and this is not otherwise easilyavailable from government sources, either to prospective studentsor the people advising them.81 Adding that data to QILT, both to alert
81. The best existing source of information on completion by personal characteristicsand study method is a now-regular report from the Department of Education
students to potential risks and to help them choose between courses,would be helpful.
QILT’s presentation of information by university and field should stay,to ensure consistent presentation. But as Chapter 3 shows, thereare many individual characteristics and study choices that can makeaverage results unreliable. For the QILT data to be more useful forprospective students, it needs to be more personalised.
Personalising data would require prospective students to provideinformation relevant to calculating their completion prospects. Thiswould include basic personal characteristics, such as age and gender,and then academic history and proposed study approach – full-time orpart-time, on-campus or off-campus, now or delayed. If prospectivestudents provided this information, when they looked at courses ofinterest they could see their completion prospects, based on theoutcomes of similar students in the past.
and Training (2017b). The best existing source of information on retention intosecond year is in the Department’s annual student statistics release: Departmentof Education and Training (2017c, appendix 4). However, each is located in adifficult-to-find part of the Department’s website.
Grattan Institute 2018 39

Dropping out: the benefits and costs of trying university
For example, a hypothetical 25-year-old male student from a remotearea planning to study full-time at his nearby regional universitycampus faces a non-completion risk of 36 per cent. This means nearly4-in-10 students in his situation are not expected to complete. He isconsidering moving to the city to study, which would reduce his risk to32 per cent. But moving to the city means he has to move out of hisparents’ home, pay rent, and get a job. So he is considering studyingpart-time and online to accommodate his work schedule. Dropping 4subjects to part-time would increase his risk to 64 per cent and onlinewould increase it marginally further to 66 per cent. This means nearly7-in-10 students in his situation would not complete. So while movingto the city to study would reduce his risk moderately, if this meant hehad to study part-time he is better off studying near home to avoidincreasing his risk substantially. The website could show, as Figure 5.1does, that part-time study alone would make him nearly twice as likelyto not complete within eight years.
QILT should also advise prospective students on how to improvetheir completion prospects. For example, if a prospective student isconsidering part-time study, the website would explain the difficulties ofmanaging multiple competing demands on a student’s time. This wouldenable prospective students to make a better-informed decision asthey weigh up their options. As discussed in Section 3.1.2, substantialproportions of the part-time students who persist past first year willswitch to full-time study. They may have discovered at cost that theQILT website could and should have told them for free before theyenrolled: that studying part-time substantially increases their risk ofdropping out of university.
Figure 5.1: Studying full-time minimises the risk of not-completinguniversityRisk of not completing university within eight years, per cent
From a remote area studying full-time at a
regional campus
Moves to study at a metro campus
Drops 4subjects
Studiesoff-campus
Total risk
36 -7
+35
+2
66
Notes: This hypothetical prospective student is assumed to be a non-Indigenous maleAustralian citizen who speaks English at home, reports no disability, lives in a medianSES area of NSW, lives 20- to-40 minutes from campus, and starts university in thefirst semester. He uses a previous diploma as his basis of admission.
Source: Grattan analysis of Department of Education and Training (various years).
Grattan Institute 2018 40

Dropping out: the benefits and costs of trying university
6 Improved university policies and practices
Universities could do more to help prospective students make gooddecisions. Their websites should more explicitly alert prospectivestudents to the issues with part-time enrolment. They should explainhow many subjects a student needs to pass each year to completetheir degree within its maximum time. On enrolment and re-enrolment,universities should check that students are on-track to complete theirdegree.
Universities already monitor student engagement, but some have moresophisticated programs than others to protect disengaged students. Ifthese students cannot or will not engage with their studies, they need tobe encouraged to take leave of absence or discontinue, so they avoidpaying for subjects they are not taking.
6.1 Part-time enrolment
Because combining work and family responsibilities with part-timestudy increases the risk of non-completion so much, and is potentiallyavoidable, universities should do a lot more to help students makefully-informed decisions about studying part-time.
University websites do little to warn prospective students that part-timestudy is high risk. The websites instead tend to emphasise that coursesare flexible, with students able to choose between full-time and part-time study. The main warning around part-time study is that studentincome support is only available for full-time students.
At least for enrolled students, some universities do offer practical advicefor part-time students on how to manage their time. But pages aimed atfuture students typically do not state prominently that the course has amaximum time period, or how many subjects the student would need topass on average each year to finish within the allowed period.
In most universities, the maximum time for a degree implies thata student needs to average at least three passed subjects a year.Students who enrol in one or two subjects a year could not completea degree within any university’s maximum time, yet about 6 per centof commencing students start this way.82 By increasing the numberof subjects taken in subsequent years, this slow start can still lead toa degree – and indeed 40 per cent of students who start with two orfewer subjects do complete within eight years (Figure 3.4 on page 27).But most do not finish their degrees, raising questions about whetherthese students enrolled naively, and whether the university let themcommence without a credible plan to complete their course within itsmaximum time.
Prominently displaying advice on study schedule issues, particularly inparts of university websites aimed at the older students most likely tostudy part-time, could help students make better decisions – both onwhether getting a degree is realistic at all, and on how many subjectsthey need to do each year to stay on track.
Given the very high non-completion risks associated with part-timestudy, universities should do more to ensure, at each enrolment andre-enrolment point, that students are on-track to complete withinthe maximum time allowed for their degree.83 The spread of onlineenrolment systems over the past 20 years has made the process muchless time-consuming, but perhaps at the price of students getting lessadvice on their subject choices.
82. Some of these students are likely to have enrolled in more subjects but droppedthem before the relevant census date.
83. In public university policy documents, compliance with maximum time policies isgenerally in the context of unsatisfactory progress. It would be better to managethis issue earlier, when the student still has time to either remedy the problem orlimit their losses.
Grattan Institute 2018 41

Dropping out: the benefits and costs of trying university
Scheduling requirements should not be rigid. Students can havegood reasons for taking fewer than the necessary average number ofsubjects in a particular year, such as exploring whether university isright for them, managing other temporary time commitments, or waitingto take a subject only offered later. But for each enrolment period whenlow subject numbers would put the student at risk of not completing, acourse administrator should check that the student has a credible planfor completion. The administrator should review the student’s previousacademic performance, and how they propose to increase subjects insubsequent semesters to stay on track for completion.
6.2 Managing disengaged students before census dates
Domestic students don’t become liable to pay unless they are stillenrolled on the subject’s census date.84 This is also the day whenuniversities and the Government recognise students as officiallyenrolled, triggering tuition subsidies and HELP loans for eligiblestudents. By law, the census date is at least 20 per cent of the waybetween a subject’s commencement and completion dates.85 Inpractice, universities usually set census dates later than the legalminimum. In early 2018, the median undergraduate census date was25 per cent of the way between the subject’s start and finish dates.86 Inpractice, that means that most students have four weeks of classes todecide, at no cost in fees, whether to continue.
84. For international students, Australian university practices are much less generous.Although the census date is typically the point at which students incur full liabilityfor the subjects they are enrolled in, there are charges, and often substantialcharges, for withdrawing prior to the census date unless there are specialcircumstances.
85. DIICCSRTE (2013a, section 6.30).86. A semester is at least 16 weeks long for about three-quarters of universities and
at least 15-and-a-half weeks for more than 85 per cent of universities, based on adesktop survey for semester 1, 2018.
Trying university for a while can be a good way of finding out whetherit is the right choice. In other countries, an exploratory enrolment canbe more expensive than in Australia. Students must pay tuition feesbefore or soon after starting classes, and dropping out is often costly.In the United States, major universities typically only allow a week orless to leave with a full refund. In New Zealand, students typically havea couple of weeks into term to withdraw and get their money back.In England, most universities give students only one or two weeks tochange their minds.87 Australia gives its students a longer cost-free,try-before-you buy period than other countries.
Three or four weeks should usually give students enough time todecide whether their subjects are interesting, how difficult they find thework, if their teachers are good, and how much support they are likelyto get. They may have results and feedback from early tests or as-signments. For students with work or family responsibilities, problemsgetting everything done should already be apparent. During the firstfew weeks, the student acquires information about their preferencesand prospects that informs their next decision in the process of mutualselection. Most conclude that university is the right choice and continuewith their course; some do not.
As Section 1.1 showed, the census date is widely used by Australianstudents. Nearly 10 per cent of the students who accepted an offer for2014 did not reach a census date within the next two years, and did notpay any student contributions or incur any HELP debt (see Figure 1.2on page 11).
The census date system, and the generous way most universitiesinterpret the rules by allowing more time than legally required, is a
87. Based on desktop research of university websites. In the US, there is often apolicy of 100 per cent, 75 per cent, 50 per cent and 25 per cent refunds at differentdates. From 2018, the first year of university in New Zealand will be free forstudents who have not taken more than half a year’s tertiary study previously:Tertiary Education Commission (NZ) (2018).
Grattan Institute 2018 42

Dropping out: the benefits and costs of trying university
desirable aspect of the Australian admission and selection system, andhelps deal with the uncertainties faced by both prospective studentsand universities.
Although the late census date is a good feature overall, in commonwith overseas systems it allows disengaged students to default intopayment, when they should withdraw without charge. Unless studentsactively disenrol they become liable to pay their student contributions,usually by incurring a HECS-HELP debt. Some students never attendtheir classes, or soon stop attending, without officially telling theuniversity that they have gone.
Australia’s policy of imposing relatively few barriers to enrolling fordomestic students – low application fees, no upfront payments,universities that will take almost everyone who applies – results ina larger proportion of students who aren’t highly committed to theirstudies.88
The enrolment data cannot tell us exactly how many students inAustralia never seriously engage with their studies. But there are clues.About 7 per cent of students fail all their first semester subjects. Theyare probably disengaged students, who failed because they were nolonger trying. Of this 7 per cent, only about one-in-five show signsof engagement in second semester, including passing subjects orchanging their course. The rest look disengaged, either not beingenrolled (53 per cent) or failing all subjects again (26 per cent). Onthese indicators, the proportion of commencing students who aredisengaged is trending up (Figure 6.1). In 2015, nearly 6 per cent of
88. These differences help explain why attrition rates are higher for commencingundergraduate students (15 per cent) than international students (9 per cent):Department of Education and Training (2017c, appendix 4). International studentsare also more likely to pass subjects than domestic students despite reportinglower marks: Norton and Cakitaki (2016, pp. 75–76). This is consistent withinternational students persisting with their studies rather than dropping out andhaving a fail recorded.
Figure 6.1: Potentially disengaged students are a growing share of allcommencing bachelor degree studentsProportion of domestic bachelor degree students, per cent
0
1
2
3
4
5
6
2006 2007 2008 2009 2010 2011 2012 2013 2014 2015Notes: ‘Potentially disengaged students’ are those who failed all subjects in their firstsemester and either did not enrol in the second semester or remained in the samecourse in the second semester but failed all subjects. Remaining in the same courseis defined by having the same course code. Bachelor degree domestic studentswho commenced between 2006 and 2015 at public universities only. First semesteris defined by students’ first semester of enrolled subjects. Students with ‘not yetdetermined’ or ‘missing’ subject status are excluded. Students who attempted lessthan 0.25 EFTSL (two traditional subjects in the first semester) and students withabnormally high EFTSL (greater than 0.75 in the first semester) are excluded.
Source: Department of Education and Training (various years).
Grattan Institute 2018 43

Dropping out: the benefits and costs of trying university
commencing students reached the end of first year with nothing butfails on their academic record.
Most Australian universities have retention-oriented systems to identifydisengaged students, and at least some take steps to prevent studentsunnecessarily incurring HELP debts. The University of Tasmania,for example, requires two early engagement tasks in each subjectbefore the census date. Students not completing these tasks receiveautomated prompts, with follow-up advising them to seek support orwithdraw before the census date. Under the University of Tasmania’sterms and conditions of enrolment, students can be disenrolled if theyare not engaged by the census date.89
Similarly, Swinburne Online makes engagement with learning materialsbefore the census date an enrolment condition. If students havenot accessed their learning materials a minimum number of times,Swinburne Online contacts them two weeks before the census date,and again in the final week if necessary. Some students voluntarilyend their enrolment, take a leave of absence, or reduce their studyload. Students who are disenrolled by Swinburne Online can appeal ifthere are extenuating circumstances.90 Griffith University also monitorsearly engagement, and encourages ‘no show’ students to cancel theirenrolment.91
Particularly at universities with more students who are likely to beexploring their tertiary education options, more active managementof students prior to the census date could save students money. Thespread of ‘learning analytics’ software, which tracks student behaviourand outcomes to identify students at risk of dropping out, makes thesepolicies easier to implement.92
89. Brown (2017); and University of Tasmania (2018b).90. OES (2018).91. Griffith University (2017).92. Dawson et al. (2016); and West et al. (2015).
While initiatives to protect disengaged students are very welcome, theincentives for universities to implement them are mixed. Encouragingstudents to discontinue their studies before the first census date has afinancial cost for universities. The students who leave would otherwisehave paid for their studies, at least for a semester or two. However, highattrition potentially has a regulatory price, because it attracts increasedmonitoring by TEQSA (Chapter 7).
Chapter 8 examines how public policy could do more to protectdisengaged students.
6.3 Student support
The main original purpose of learning analytics software was to identifyat-risk students and provide them with appropriate assistance toimprove their prospects of success. That is an integral part of theprograms of all the universities mentioned in Section 6.2, and thehigher education sector’s main current approach to attrition. TheGovernment supports this work. Education Minister Simon Birminghamhas commissioned the Higher Education Standards Panel to investigateevidence-based support strategies, and the Panel has published someliterature review findings in a discussion paper.93 This report does notseek to replicate the Panel’s work, but to approach the issue primarilyfrom the perspective of the mutual selection process.
Although not this report’s main focus, student satisfaction with theuniversity experience influences decisions to stay or go. As Figure 6.2on the following page shows, students who are not satisfied with theiroverall experience at university are more than three times as likely toconsider leaving as those who are satisfied. In terms of (dis)satisfactionwith particular aspects of the university experience, dissatisfaction withteaching quality – which covers questions relating to whether academicstaff explained things clearly, were approachable and helpful, and gave
93. Higher Education Standards Panel (2017, p. 5, pp. 45–58).
Grattan Institute 2018 44

Dropping out: the benefits and costs of trying university
useful feedback – is most closely linked to whether students considerleaving.
Figure 6.2 also shows that more than 10 per cent of students who aresatisfied with their student experience are nevertheless consideringleaving. This reflects the fact that many things in students’ livescontribute to attrition but universities cannot directly control them all.
Figure 6.2: Students who are not satisfied with their university are morelikely to consider leavingPer cent of students who consider leaving
0
10
20
30
40
Learnerengagement
Studentsupport
Teachingquality
Skilldevelopment
Learningresources
OverallOverall
Satisfied students Unsatisfied students
Notes: Domestic bachelor students surveyed in 2016.
Source: Social Research Centre/Department of Education and Training (various years).
Grattan Institute 2018 45

Dropping out: the benefits and costs of trying university
7 Increased monitoring by TEQSA
The Tertiary Education Quality and Standards Agency (TEQSA) is theprimary regulator of Australia’s higher education system. It annuallyreviews university performance, including examining risk indicatorssuch as attrition and fail rates.
But university-level statistics can hide poor results for small groups ofstudents behind good results for most students. If TEQSA monitoredattrition rates for part-time and low-ATAR students, and looked at whatproportion of students fail multiple subjects, it could more easily identifyproblems with university performance
7.1 Interpretation and enforcement of the threshold standards
As noted in previous chapters, TEQSA enforces the ‘threshold stan-dards’ that all higher education providers must meet. The admissionstandards set out broad requirements for selecting students. TEQSAdecides whether a provider’s admission policies and practices complywith these standards, through annual monitoring and a re-registrationprocess that occurs every seven years. TEQSA’s signals to the highereducation sector on how they will enforce the standards are therefore asignificant influence on provider behaviour.
TEQSA interprets the admissions standards as primarily concerningacademic ability rather than other obstacles to success, such aspart-time study. On its ‘our commentary’ webpage, designed tohelp higher education providers implement the threshold standards,TEQSA says it requires that admitted students must be ‘. . . equippedto succeed’. Sample measures relate to academic preparation. Whereit acknowledges potential cohorts ‘initially at some known risk of notsucceeding’, it uses as an example ‘educationally disadvantaged’students, rather than time-poor students, and its suggested response
is ‘targeted support’, rather than any change to the admission processitself (these, of course, are not mutually exclusive).94
Similarly, part-time study is not evidently recognised as a risk factor inthe most detailed public evidence on TEQSA’s enforcement of the newstandards. TEQSA’s approach is reflected by the conditions it imposeson courses taught by non-university higher education providers (theirstudents are not included in this report’s statistical analysis).95 Theseconditions show TEQSA is concerned about English-language require-ments, how prior learning is assessed, monitoring of student outcomes,benchmarking of those outcomes, high attrition of online students, andcounselling students at risk of not completing.96 Part-time study maycontribute to these problems, but it is not separately identified.
Although TEQSA has not focused regulatory conditions on part-timestudy, it discussed the topic in a report. In 2017, TEQSA released astatistical analysis of institution-level first-year attrition. It identified highrates of part-time enrolment as a risk factor in some non-universityhigher education providers. For universities, however, it did not identifypart-time study as a risk factor.97 TEQSA’s current approach seems toignore the risk to completion associated with part-time study.
TEQSA could do more within its current legal powers to regulate theway universities handle part-time students. It could rely on the legal
94. TEQSA (2017c).95. See also the general information on admissions required at: TEQSA (2017d,
pp. 6–7). Public universities accredit their own courses, so none of them haveconditions attached to courses.
96. See the conditions attached to course accreditations for the Australian College ofPhysical Education, the Australian Institute of Professional Counsellors, MelbournePolytechnic, and Photography Holdings: TEQSA (2017e).
97. TEQSA (2017a, pp. 19–23).
Grattan Institute 2018 46

Dropping out: the benefits and costs of trying university
requirement that universities admit students only if there are ‘. . . noknown limitations that would be expected to impede [the admittedstudent’s] progression and completion’.98 Part-time study is a ‘knownlimitation’. It is a greater completion risk than ‘educational disad-vantage’ (which is regulated), because part-time study can impedestudents who are academically able, as well as those who are lessprepared for university study.
In its advice on how to interpret the threshold standards, TEQSAcould require higher education providers to make information onmaximum completion times more easily available. It could give otheradvice relevant to the student’s decision to study part-time, includinginformation about the risks involved in studying part-time, and howthese can be reduced. TEQSA could also require providers to checkthat students enrolling on a part-time basis have credible plans forcompleting their degrees, as discussed in Section 4.3.
7.2 Improvements in monitoring
TEQSA does not micro-manage universities. They are all self-accrediting, which means they approve their own courses, includingtheir admission requirements. Instead of examining the details of thou-sands of university courses, TEQSA annually uses an institution-levelrisk-based approach, only examining further when there is somereason to do so. It uses various indicators as triggers for consideration,but makes decisions based on expert judgment.99 These indicatorsinclude first-year attrition rates, pass/fail rates for all subjects, andnumbers of course completions.
TEQSA should continue with this approach, but could adapt its annualmonitoring to identify problems that may currently be hidden. Aweakness of institution-level monitoring is that satisfactory overall
98. Department of Education and Training (2015b, p. 3).99. TEQSA (2017a).
outcomes can hide poor results for particular groups of students. Forexample, although part-time and low-ATAR students are an increasingshare of all commencing bachelor-degree students, institution-levelresults are dominated by the much larger groups of full-time andhigh-ATAR students. Given that part-time and low-ATAR students areat elevated risk of not completing their courses, their attrition ratesshould be examined separately. The relevant data is already collectedand available to TEQSA; it would not require a lot of additional work toanalyse it.100
Institution pass/fail rates are currently calculated as percentages ofall subjects taken. While this indicator is interesting, students failingall or many subjects are the main attrition concern (Section 3.1.1). Asignificant proportion of students failing multiple subjects could be asign of poor admission practices, not managing disengaged studentswell, or problems with curriculum or teaching. As with attrition rates,the data needed to monitor fail rates is already collected and availableto TEQSA. Where potential issues become apparent, TEQSA shouldinvestigate in more detail to find the problem’s source.
If TEQSA changes its annual monitoring practices, the universities notalready carefully tracking their outcomes will have an added incentiveto do so. This would not be a major additional impost, because thethreshold standards already require monitoring on a range of levelsincluding course, cohort, educational background and entry pathway.101
100. In some cases, this is already done when TEQSA has reasons for concern aboutparticular groups of students. See TEQSA (2017f).
101. Department of Education and Training (2015b, section 1.3).
Grattan Institute 2018 47

Dropping out: the benefits and costs of trying university
8 New census date policies to increase student protection
With better advice, some prospective university students would notapply or enrol. But inevitably substantial numbers of people will stillenrol only to find that their course is not right for them. More can bedone to protect these students from unnecessary costs.
There are a number of options. The Government could give the censusdate a name that highlights its financial consequences for students.Universities could send students text messages shortly before thecensus date, reminding them of the deadline to dis-enrol and avoidcosts, along with providing contacts for support. Universities couldfollow up more intensively than they do at present with studentsshowing a pattern of disengagement before the census date of theirsecond semester. And universities could require students to proactivelyopt-in to confirm their enrolment by the census date.
Universities should trial these options to identify which strikes the bestbalance between protecting disengaged students from wasting timeand money, and imposing additional administrative burdens on allstudents.
8.1 Give the census date a more meaningful name
Many students do not understand that the census date is the day whenthey become liable to pay student contributions or fees. A small GrattanInstitute face-to-face survey found high levels of ignorance.102 Lessthan 40 per cent of the students sampled understood the census date.The others did not know what it was, or confused it with some otherimportant date, such as the last day to change subjects or the lastday to withdraw from a subject without fail. A small majority of survey
102. Grattan Institute conducted a face-to-face survey of about 50 students from eachof the University of Melbourne, RMIT University, Swinburne University and theAustralian Catholic University’s Fitzroy campus in Melbourne on 23 April 2018.
respondents were in their second or later year, suggesting that this isnot just an issue with first-year students.
A simple name change could help students appreciate the date’ssignificance. The term ‘census date’ reflects the perspective of univer-sity and government administrators – they need a count of students.But from the point-of-view of students what matters is not how manypeople have enrolled, but the fact that they are now liable to pay fortheir subjects. The name of the date should reflect this. The exactterminology should be chosen after appropriate testing with students.But it needs to highlight that this is a day with financial consequences.
8.2 Reminders about census dates
Even students who understand the census date do not always knowwhen it is or forget about it. In the census date survey, more than one-in-ten students missed the census date for a subject they wanted todrop.
Universities do typically remind students of the census date, butusually by email. As email inboxes are often cluttered, and emailis not necessarily the primary form of electronic communication forstudents, it is easy for this message to be missed. Other methods ofcommunication include information on learning management systems,and notices on campus. These are worthwhile, but won’t be seen bystudents who have already disengaged.
Though emails are often overlooked, mobile phone text messagesare known to be effective as reminders.103 Mobile phone use is nearuniversal in the main student age groups.104 Text messages to all
103. McLean et al. (2016).104. Deloitte (2017).
Grattan Institute 2018 48

Dropping out: the benefits and costs of trying university
students a week or so before each census date would help thosewho want to drop a subject, as well as those who want to leave theircourse. The message could also inform or remind students of wherethey can find advice or help with any problems they are having. Someuniversities already use text messages to get important information tostudents.
But text messages will not necessarily protect very disengagedstudents, who may ignore messages from their university, or not takethe necessary steps to discontinue their course.
8.3 Requiring universities to ensure students are engaged bythe census date
Eventually all students in bachelor degrees reach a decision pointwhere the default decision is to leave. This is re-enrolment, which isusually annual. Students who don’t re-enrol don’t incur any more HELPdebt. Section 1.1 reported that of the students who were still enrolled insecond semester of their first year, 9 per cent were not enrolled at anytime in their second year. The source of this data cannot distinguishbetween students who formally left (discontinued, took a leave ofabsence, or were excluded by their university) and those who just didnot re-enrol.105
While very disengaged students will eventually exit the system, theycan accrue a year of HELP debt before they do so. Modified censusdate rules, that require universities to take action when studentsare disengaged, could minimise the number of students needlesslyaccruing HELP debt.
In the non-university higher education sector, this is already required.Legislation passed in 2017 puts additional responsibilities on these
105. See Harvey et al. (2017, pp. 20–21), on the general issue. Federation Universitydata shows that more than half of its first year attrition was from people who didnot re-enrol and did not inform the university: Federation University (2018).
providers to check that students are ‘genuine’ in each subject by thecensus date. Tests of genuineness include participating in assessmentactivities, for online students logging in to the course website, andbeing ‘reasonably engaged’ in the course.106 If students are deemednot genuine, they lose their FEE-HELP loan eligibility.107 Unless theycan afford to pay upfront, students in this situation would have to leavetheir course.
Encouraging students to leave before the census date if they havenot engaged with their studies, as some universities already do(Section 6.2), is good practice. But the additional step of effectivelydisenrolling a student needs more protections than provided by the‘genuine student’ rules applying to FEE-HELP students. A student withsome engagement, albeit not enough to pass unless increased, couldbe deemed not genuine. If the rules for full-fee students were appliedto Commonwealth-supported students, if a university decides that astudent is not genuine, the student would effectively be expelled.108
In some cases, higher education providers should disenrol very disen-gaged students. But this major decision needs clear rules, announcedin advance, about what students need to do to remain enrolled, andabout what universities should do to encourage students to engage orto disenrol. Even nil or negligible engagement might sometimes have
106. At the time of writing, the detailed rules have not been published. However, theGovernment has said that they will be similar to those in the VET Student LoanRules 2016, from which these examples are taken.
107. FEE-HELP is the income contingent loan scheme for full-fee students. Thelegislation is the Education Legislation Amendment (Provider Integrity and OtherMeasures) Act 2017.
108. The FEE-HELP students covered by the current legislation can remain enrolled,but have to pay up-front if found not to be ‘genuine’. For a Commonwealth-supported student, ineligibility for funding would mean cancellation of enrolment:Higher Education Support Act 2003, section 36-40. There may be some legalways to work around this, such as the student declining to be Commonwealthsupported under section 36-10(3), or continuing in the same subjects on anot-for-degree basis. However, these would involve upfront fees.
Grattan Institute 2018 49

Dropping out: the benefits and costs of trying university
a reasonable explanation, such as illness. Students should be ableto appeal against an exclusion decision, as indeed higher educationregulation requires.109
The first census date timelines will often be too tight to follow allthese steps properly. These procedural and practical difficulties arereflected in university practice. Griffith University recognises theneed to distinguish ‘slow starters’, who show some engagement butare not attending small classes or submitting work, from ‘no shows’,who never turned up. Despite having the power to disenrol a studentduring semester, in practice the University of Tasmania withdraws thestudent from the unit only, without registering a ‘fail’.110 The studentstays enrolled and incurs a HELP debt, but their academic record isprotected.
There are other practical difficulties with excluding students by thefirst census date. Despite the spread of learning analytics software,not all institutions can easily monitor their students and follow up withthose showing signs of disengagement. The University of Tasmania’sexperience shows that managing disengaged students early is not justa technology issue. It changed course content, to ensure there weresufficient assessment tasks before the census date, to aid informeddecision making. The University of Tasmania created centralised teamsto follow up with disengaged students, because the task can be toomuch for course coordinators whose principal responsibility is to thestudents who are engaged with their studies.
By the second semester census date, it is easier to manage many ofthe informational and organisational issues. Each student’s patterns ofengagement will be easier to determine. By then, the results of courseassessment tasks, which are already recorded by all institutions, would
109. Higher Education Support Act 2003, section 19-45; Department of Education andTraining (2015b, section 2.4).
110. Brown (2017).
be available. A consistent pattern of failing to submit assignments,not sitting exams, and very low marks would be strong evidence ofdisengagement. At most universities, there are many weeks betweenthe end of first semester and the second semester census date. Thisallows time for careful assessment of each student’s case, and time forstudents to dispute decisions by the university.
8.4 Performance funding
The Government has announced that from 2020 it will link fundingto university performance, with attrition likely to be a performanceindicator.111 The details are yet to be announced, but it is likely thatuniversities with high rates of students leaving before their second yearwill receive a lower, or no, funding increase.
Performance funding would encourage universities to focus on disen-gaged students before the first census date of each new enrolment,as discussed in Section 6.2. Students who leave before the firstcensus date are never counted as enrolled for official attrition ratepurposes (Chapter 1). After the first census date, a financial rewardfor second-year enrolment would encourage universities to supportstudents who are considering leaving, but who could still successfullycomplete their course (Section 6.3).
But ‘performance’ in attrition is complex. For most students, staying en-rolled and completing a degree is the right outcome, and performancefunding supports that. But for students who are not likely to complete,their best interests are better served by concluding their enrolment atleast cost in time and money. Performance funding encourages that inthe early weeks of first year, but less so subsequently. It provides noincentive to review student progress after first semester.
111. Australian Government (2017a).
Grattan Institute 2018 50

Dropping out: the benefits and costs of trying university
Regardless of the incentives, in Australian higher education per-formance funding has a credibility problem. Previous performanceschemes suffered from changing goals and financial rewards thatwere abolished to provide Budget savings.112 The Government’s 2020proposal lacks detail and has not been legislated. With uncertainbenefits, universities may not change their existing policies on studentretention.
8.5 An opt-in course confirmation
With census date reminders, the default decision is to remain enrolled.Requiring universities to monitor disengaged students more carefullywould be more likely to protect them from HELP debt at the secondrather than the first census date. But the first census date is when thenumber of enrolled but potentially disengaged students is likely to benear its peak.
One possible policy response is to have a date early in first semesterthat is more like re-enrolment: the default decision is to leave ratherthan to stay. The date would be opt-in rather than opt-out: only studentswho agree to stay enrolled, and who formally accept enrolment’sfinancial consequences, would pay student contributions or incur aHELP debt.113
112. See Coaldrake and Stedman (2016, chapter 5) for a discussion of previousperformance funding schemes in Australia.
113. International students would be excluded from any legal requirement for anopt-in system. Their system of applying for entry is already designed to screenout experimental, keeping-options-open enrolment. It includes non-refundablefees, applying for a visa, and travel costs. They could also lose their right toremain in Australia if they leave their course. Opt-in has some potential to benefitdomestic postgraduate students. However, they are a more informed group whoshould already know about the census date if they completed their undergraduateeducation in Australia. Their patterns of subject fails and course attrition shouldbe researched further before considering opt-in.
Like re-enrolment, opting in would be a course-level decision, whichmakes it different from the census date, which can be a more limiteddecision about subjects taken. But whenever possible, to simplify theprocess, an opt-in course confirmation date should coincide with thesubject-level census date applying to first-year students.114 Its aimis a quick and cheap exit for disengaged students, while minimisinginconvenience to others.
To opt in, students would log back into their university’s enrolmentsystem, be shown which subjects they are enrolled in and how muchthese cost, and be asked to confirm, modify or end their enrolment.Students who choose to end their enrolment, or who don’t respond tothe request, would not incur any future charges.115 Universities couldoffer deferrals to students who want to postpone rather than terminatetheir studies.
To help students make an informed choice, a confirmation decisiondate should give them time to experience their course. In most casesexisting census dates achieve this goal. As noted in Section 6.2, themedian census date is four weeks into the teaching period, and fewuniversities have standard census dates less than three weeks intothe teaching period. The substantial numbers of students who leavein this period suggests that three or four weeks is enough time for manystudents to form a view about whether university is for them.
114. Universities could have different subject census dates and course confirmations,but the later student decision would over-ride the first. This might occur forsubjects typically taken by commencing students that can also be taken bystudents further into their course.
115. In the VET Student Loans system, students taking out loans are asked to confirmtheir enrolment with the Department of Education and Training every four months;Australian Government (2017c). This regular opt-in reflects a history of seriousproblems in the VET sector. The issues in the higher education sector are muchless serious, and one opt-in per course should be enough.
Grattan Institute 2018 51

Dropping out: the benefits and costs of trying university
When universities depart from semester or trimester systems, currentcensus date rules, based on a percentage of the way betweencommencement and completion of a subject, can produce muchshorter time periods. For example, under Victoria University’s newfirst-year model, students take subjects sequentially for intensivefour-week periods rather than simultaneously over a conventionalsemester of around 16 weeks. The census dates for these VictoriaUniversity subjects are currently about a week into the teaching period.Although these quick subjects may provide a wider range of academicexperiences early on, a week is still a very short time in which toexperience the course and university life.
To give students time to decide, the final date for a course confirmationshould be set in days. A minimum 21 days for students to confirm orleave would strike a balance between giving them time to decide andprotecting the financial interests of universities. The longer studentshave in a try-before-you buy phase, the more resources universitiesinvest in them.
For most universities, a 21-day confirmation period would make nodifference to the time students have to try before they buy. They arelikely to keep their census dates, which are often established parts ofuniversity academic calendars. Under an opt-in system, universitiesmay also want more than three weeks to evaluate student progress andfollow-up on students at risk of not completing. Some universities mightuse a later date as a selling point to prospective students.
A new opt-in system would need provisions to protect against mistakenexits. There should not be a single high-stakes day on which studentscan accidentally disenrol themselves.
To minimise accidental disenrolment, there could be a course confirma-tion period prior to the final decision day. For example, the confirmationperiod could start 14 days into the teaching period, to ensure thatstudents have some experience of university, and end on the course
confirmation date chosen by the university or after 7 days, whicheveris the later. A confirmation period gives universities time to advise andwarn students of the impending date. It gives students multiple days onwhich they can notify the university of their decision, before it becomesfinal at the end of the confirmation period. There could also be a timeafter the confirmation day when students could, for a late fee, correcttheir own or the default decision to discontinue.
Universities would have reason to promote course confirmation ina way they don’t currently emphasise the census date, since theycould lose substantial revenue from erroneous disenrolment. Courseconfirmation would create an added incentive for universities to identifyand support disengaged students. They probably now lose studentsthey could retain, as well as temporarily keep students who are toodisengaged even to end their enrolment. The Grattan survey of peoplewho left university without completing found that, knowing that theyknow now, nearly 20 per cent would not drop out.116 Another surveyof students who had left one university found that around 40 per centbelieved that the university could have done something to encouragethem to stay.117
8.6 Trialling different options
Australia’s higher education system is very open to people who wantto try to get a degree. But in providing opportunities, it also generatesrisks that some people will get little but a HELP debt from their enrol-ment. The main policy measure to limit these risks is a payment datethat, compared to other countries or international students in Australia,is well into the teaching period.
This chapter has suggested ways to better protect students whosehigher education experiment is not working out. Each suggestion
116. Of those who never acquired a degree.117. Harvey et al. (2017, p. 35).
Grattan Institute 2018 52

Dropping out: the benefits and costs of trying university
has strengths and weaknesses, and each could generate a variety ofbehavioural responses from students and universities.
One way to proceed may be to run policy trials to measure theeffectiveness of different measures. Text message reminders arevery suitable for a randomised controlled trial. Universities withgood learning analytics could investigate how students with differentlevels of engagement respond to reminders about the census date.If text message reminders prompt significant numbers of disengagedstudents to seek help or discontinue, more complicated measuressuch as requiring students to opt-in by the first census date may notbe necessary.
Universities under pressure from TEQSA to improve their attritionrates are free to impose conditions on enrolment that let them disenrolvery disengaged students. They could also create an opt-in courseconfirmation date. Policy makers could use these experiments to informpolicy for the sector as a whole.
Grattan Institute 2018 53
Dropping out: the benefits and costs of trying university
Appendix A: Mutual selection analysis methodology
The mutual selection analysis focuses on domestic bachelor degreeapplicants for the 2014 academic year. It uses both the highereducation student enrolment data and the applications and offersdata collected by the Department of Education and Training. Theapplications and offers dataset includes both applications throughtertiary admission centres and direct applications to universities.
Students were identified and tracked across datasets using theCommonwealth Higher Education Student Support Number (CHESSN).About 1 per cent of domestic bachelor degree applications do not havea CHESSN and were excluded. Since offers from the UniversitiesAdmissions Centre (the admission centre for NSW and ACT) andthe University of Tasmania have a high proportion of unknown offerresponses, they were also excluded.118
Students can apply to multiple universities and in different states(through tertiary admission centres), so some students receive morethan one offer. For students with multiple offers, their best responseis chosen according to the hierarchy: accept (including defer), reject(including offers deemed to have lapsed or superseded), and responseunknown. For example, if an applicant receives two offers and defersone and lets the other lapse, this analysis assumes she accepts.
In 2014, the Victorian Tertiary Admission Centre had a significantproportion of supplementary offers or unsolicited offers.119 These offersare ignored unless they were accepted or deferred.120
118. UAC’s unknown offer response rate is 23 per cent, UTAS’s is 33 per cent,Department of Education and Training (various years).
119. Offers without a corresponding application for the course.120. About 1 per cent of supplementary offers were accepted or deferred.
For students who accept or defer an offer, they are considered‘enrolled at the census date in semester one’ if they enrol in at leastone bachelor-degree subject in their first semester. A student’s firstsemester is assumed to be whenever she first enrols.121 For example, ifa student accepted an offer for the 2014 academic year and undertookno bachelor-level subject in semester one of the 2014 academic yearand some subjects in semester two, her first enrolment semester wouldbe semester two of the 2014 academic year. Her second semesterwould correspond to semester one of the 2015 academic year, andher second year would be semester 2 of the 2015 academic year andsemester 1 of the 2016 academic year. This time-shift approach forinitial enrolment allows deferred students to be included while ensuringthat their enrolment patterns are consistently analysed compared withthose who commence in semester one.122
Students who are not enrolled by semester two of the 2015 academicyear are classified as ‘not enrolled at the census date semester one’even if they have accepted or deferred an offer.
Once students commence, the analysis proceeds from their firstsemester. For example, students who first enrolled in semester oneof the 2014 academic year and did not take any bachelor-degree levelsubjects in semester two of the 2014 academic year but then tooksome subjects in semester one of the 2015 academic year wouldbe considered ‘not enrolled in semester two’ but ‘enrolled in secondyear’. These students are denoted in red on left panel (participating)on Figure 1.2 on page 11 and represent roughly 2 per cent of totalapplicants.
121. Starting from the 2014 academic year.122. Deferred students include any students who deferred or accepted an offer and did
not enrol in at least semester one of the 2014 academic year.
Grattan Institute 2018 54

Dropping out: the benefits and costs of trying university
Appendix B: Grattan survey of students who dropped out
Between 15 December 2017 and 5 January 2018, the Grattan Instituteconducted an online survey of students who dropped out of university– Incomplete University Survey. It was hosted on SurveyMonkey andpromoted via Grattan’s social media channels on Facebook, Twitter andLinkedIn. In addition, the Facebook post was advertised to people inAustralia aged between 18 and 50. About 90 per cent of responsescame through Facebook. Overall the survey received about 950responses.
About 100 respondents were excluded either because they did notdrop out of university (answered no to question 1) or because they didnot answer any subsequent questions.123 Except for the question onwhether the respondent has dropped out (question 1), answers wereoptional to reduce survey attrition and improve response quality.124
About 43 respondents dropped out from a sub-bachelor course, 116from a masters degree, and 55 from a doctorate degree, and are alsoexcluded from our analysis.125
For the 646 valid bachelor degree responses, Figure B.1 shows thedemographic mix of the online survey respondents compared to com-mencing students between 2005 and 2016. Two-fifths of respondentsgrew up in a rural area and nearly a quarter are from the highestsocio-economic decile. Both are slightly over-represented in the onlinesurvey compared to enrolments.
123. Respondents who said no to question 1 were blocked from taking the surveyagain on the same device.
124. Krosnick (1999, pp. 556–558).125. The qualification level of the survey respondents was similar to domestic higher
education enrolments.
Figure B.1: Distribution of Grattan survey respondents and universityenrolmentsPer cent
0
5
10
15
20
25
1 2 3 4 5 6 7 8 9 10Socio-economic status (IEO) decile
0
10
20
30
40
50
60
70
80
Enrolment
Grattan Survey
Year 12 locationCity Rural
Notes: Bachelor-degree only. IEO is the Index of Education and Occupation.
Source: Grattan online survey; Department of Education and Training (various years).
Grattan Institute 2018 55

Dropping out: the benefits and costs of trying university
There are no other comprehensive surveys of Australian students whodropped out to systematically benchmark the online survey results.126
The closest alternative is the Longitudinal Survey of Australian Youth(LSAY). It tracks students aged 15 to 25, meaning that students whodropped out after age 25 are excluded. Grattan’s online survey over-laps with the LSAY on one question – reasons for leaving university.
Restricting the online survey to those aged 25 or younger and wholeft their bachelor degree after 2007, Figure B.2 compares resultsfrom the two surveys.127 Respondents can choose multiple reasons,but many in the Grattan survey chose only one. In each survey, asimilar proportion of respondents chose health and financial reasons.But LSAY respondents were much more likely to also pick otherreasons, which could partly be explained by a greater tendency ofLSAY respondents to choose multiple reasons. The average numberof items selected in the Grattan survey was 2.4; for LSAY it was 3.2.128
LSAY subsequently asks for the main reason for dropping out. Usingthis question, which allows for only one reason per respondent, theresults of the two surveys are more comparable. But there are stillsubstantial discrepancies, as Figure B.2 shows (orange bar and blackline).
126. Both the Student Experience Survey and the first-year experience survey ask forreasons from students who consider leaving their institution. But the results arenot directly comparable. Nonetheless, the most common reason cited was healthor stress related for both surveys, Baik et al. (2015, p. 29) and Social ResearchCentre/Department of Education and Training (2017, p. 74).
127. The LSAY 2006 cohort is used because it is the most recent complete survey.128. The reasons for these substantial differences are unclear. One reason could be
that our online survey had a number of single-response questions preceding thereason-for-leaving question.
Grattan Institute 2018 56

Dropping out: the benefits and costs of trying university
Figure B.2: Comparing LSAY and the Grattan online survey resultsPer cent
0 10 20 30 40 50 60 70
The course was different to what I wantedThe course turned out to be not what you wanted
Financially it was too hard to keep studyingFinancially you couldn’t afford to continue
The course didn’t interest meYou just lost interest
Too many other commitments (work, family, etc)You had problems juggling study and work commitments
Too much study to doStudy load was too heavy
The course was too hardYou had been getting poor results
I never really wanted to get a degreeYou never really intended to complete the course
LSAY “main
reason” proportion
Grattan survey: Health or personal reasons interfered with studyLSAY 2006 cohort: Because of health or personal reasons
LSAY 2006
Notes: Using LSAY 2006 cohort, there are 289 students who dropped out by the age of 25. To make the Grattan online survey more consistent with LSAY (for this chart only), respondentsaged above 25 and those who dropped out were excluded, resulting in 166 observations. Respondents can choose multiple reasons (not for the main reason question). Five additionaloptions that are available in LSAY but omitted from the Grattan survey are: “just wanted to get a job, apprenticeship or traineeship” (11 per cent), “never really wanted to study” (2 per cent),“it wouldn’t have led to a good job or career” (3 per cent), “because problems with access or transport” (less than 1 per cent), and “other” (6 per cent).
Source: NCVER (2014); Grattan online survey.
Grattan Institute 2018 57

Dropping out: the benefits and costs of trying university
Table B.1: Incomplete University Survey Questions
Question Type ResponseRate
Q1 Have you ever dropped out of a university degree in Australia?[Options: yes; no]
Required,select Y/N
100.0%
Q2 What level was the incomplete degree?[Options: diploma/associates degree; masters degree (research); masters degree (coursework); bachelor degree;doctorate degree]
Select one 99.4%
Q3 What field was the incomplete degree in?[Options: agriculture; architecture, commerce; creative arts; education; engineering; hospitality; humanities;information technology; law; medical; nursing; other health; science; other (please specify)]
Select one+ other
100.0%
Q4 What year did you start? Text 99.4%
Q5 What year did you leave your incomplete degree? Text 99.3%
Q6 What was your highest level of education before starting the degree?[Options: had not finished year 12; finished year 12; cert I/II; cert III/IV; diploma/associate degree; bachelor degree;postgraduate; other (please specify)]
Select one 99.5%
Q7 What is your highest level of education now?[Options from Q6]
Select one 99.8%
Q8 Do you know how much HELP debt you owe?[Options: yes; no]
Select one,logic to Q9
99.5%
Q9 How much HELP debt do you owe? (Optional) Text 53.4%
Q10 Were there any benefits from the time you spent doing the incomplete degree?[Options: it helped clarify my careers goals; it taught me useful skills; it was interesting; I made lasting friend-ships/connections; attending university helped me get employed; no benefits]
Selectmany
92.2%
Q11 Please provide more details Text 71.5%
Continued on next page
Grattan Institute 2018 58

Dropping out: the benefits and costs of trying university
Table B.1 – continued from previous page
Question Type ResponseRate
Q12 Below is a list of reasons why people might leave their course. Check any that were a factor in your own decision.[Options: health or personal reasons interfered with study; financially it was too hard to keep studying; the coursewas different to what I wanted; too much study to do; the course was too hard; too many other commitments (work,family, etc.); the course didn’t interest me; I never really wanted to get a degree]
Selectmany
79.0%
Q13 Please provide more details Text 79.3%
Q14 In leaving your degree, did you ever feel that you let anyone down?[Options: yes; maybe; no]
Select one 94.2%
Q15 If yes, can you elaborate? Text 65.0%
Q16 Knowing what you know now, would you still have made the decision to start your degree?[Options: yes; no; unsure]
Select one 91.7%
Q17 Can you go into more detail? Text 78.7%
Q18 Also knowing what you know now, would you still have decided to leave your degree?[Options: yes; no; unsure]
Select one 91.5%
Q19 Can you go into more detail? Text 73.8%
Q20 Do you think you would be in a better position now if you had finished your degree?[Instruction on scale: 1= much worse; 4= about the same; 7= much better]
Scale 1-7 78.4%
Q21 Before starting your degree, what kind of information would have benefited you? Text 78.0%
Q22 Would you still have started your degree if you had more information before applying?[Options: yes; no; unsure]
Select one 91.9%
Q23 Do you think you will enrol in university again in the future?[Options: yes; no; unsure]
Select one 92.3%
Q24 Any further comments? Text 47.1%
Continued on next page
Grattan Institute 2018 59

Dropping out: the benefits and costs of trying university
Table B.1 – continued from previous page
Question Type ResponseRate
Q25 Would you like to answer some optional demographic questions?[Options: yes; no, finish the survey]
Select one 92.1%
Q26 What is your age? Text 84.5%
Q27 In which country were you born? Select one 84.2%
Q28 Did you grow up in a city or rural location?[Options: city; rural]
Select one 84.1%
Q29 What was your postcode growing up? Text 78.0%
Q30 What institution did you attempt your degree? Text 82.6%
Grattan Institute 2018 60
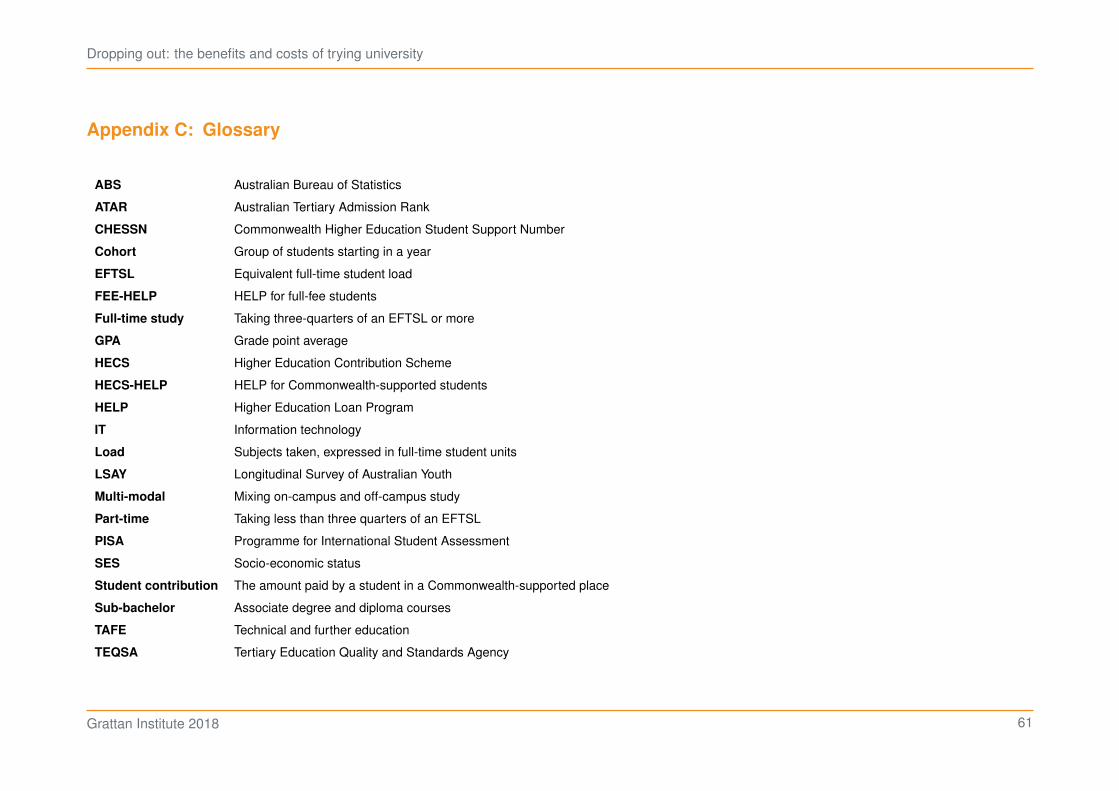
Dropping out: the benefits and costs of trying university
Appendix C: Glossary
ABS Australian Bureau of Statistics
ATAR Australian Tertiary Admission Rank
CHESSN Commonwealth Higher Education Student Support Number
Cohort Group of students starting in a year
EFTSL Equivalent full-time student load
FEE-HELP HELP for full-fee students
Full-time study Taking three-quarters of an EFTSL or more
GPA Grade point average
HECS Higher Education Contribution Scheme
HECS-HELP HELP for Commonwealth-supported students
HELP Higher Education Loan Program
IT Information technology
Load Subjects taken, expressed in full-time student units
LSAY Longitudinal Survey of Australian Youth
Multi-modal Mixing on-campus and off-campus study
Part-time Taking less than three quarters of an EFTSL
PISA Programme for International Student Assessment
SES Socio-economic status
Student contribution The amount paid by a student in a Commonwealth-supported place
Sub-bachelor Associate degree and diploma courses
TAFE Technical and further education
TEQSA Tertiary Education Quality and Standards Agency
Grattan Institute 2018 61

Dropping out: the benefits and costs of trying university
Bibliography
ABS (various years). Schools, Australia, Cat. 4221.0. Australian Bureau ofStatistics.
(2016a). Microdata: Qualifications and work, Australia, 2015, Cat.4235.0.55.001. Australian Bureau of Statistics.
(2016b). Microdata: Education and work, May 2016, Cat.6227.0.30.001. Australian Bureau of Statistics.
(2017). Microdata: Characteristics of employment, 2016, Cat.6333.0.00.001. Australian Bureau of Statistics.
ANOP/DEET (1994). Young people’s attitudes to post-compulsory educationand training. ANOP Research Services/Department of Employment,Education and Training.
Australian Government (2017a). Increased transparency and accountability:performance based funding growth for universities (information sheeton higher education reform package). Department of Education andTraining. https://docs.education.gov.au/node/47791.
(2017b). New schedule of repayment thresholds and indexationarrangements for the Higher Education Loan Program (HELP)(information sheet on higher education reform packge). Departmentof Education and Training. https://docs.education.gov.au/node/47776.
(2017c). Student engagement and progression: VET Student Loans.Department of Education and Training.
Baik et al. (2015). Baik, C., Naylor, R. and Arkoudis, S. The first yearexperience in Australian universities: findings from two decades1994-2014. University of Melbourne/Centre for the Study of HigherEducation.
Borland et al. (2000). Borland, J., Dawkins, P., Johnson, D. and Williams, R.Returns to investment in higher education. Melbourne Institute forApplied Economic and Social Research.
Brown, N. (2017). Early engagement initiative - memo to all unit and coursecoordinators. University of Tasmania.
Cardak et al. (2017). Cardak, B., Brett, M., Bowden, M., Vecci, J., Barry, P.,Bahtsevanoglou, J. and McAllister, R. Regional student participationand migration. National Centre for Student Equity in Higher Education(NCSEHE).https://www.ncsehe.edu.au/wp-content/uploads/2017/02/Regional-Student-Participation-and-Migration-20170227-Final.pdf.
Cherastidtham et al. (2018). Cherastidtham, I., Norton, A. and Mackey, W.University attrition: what helps and what hinders universitycompletion? Grattan Institute.
Cherastidtham, I. and Norton, A. (2018). Submission on redevelopment andaudit of the higher education data collection. Grattan Institute.
Coaldrake, P. and Stedman, L. (2016). Raising the stakes: Gambling with thefuture of universities (second edition). University of QueenslandPress.
Cvetkovski et al. (2012). Cvetkovski, S., Reavley, N. and Jorm, A. “Theprevalence and correlates of psychological distress in Australiantertiary students compared to their community peers”. Australian andNew Zealand Journal of Psychiatry 46.5, pp. 457–467.
Cvetkovski et al. (2018). Cvetkovski, S., Reavley, N. and Jorm, A. “Studentpsychological distress and degree dropout or completion: adiscrete-time, competing risks survival analysis”. Higher EducationResearch and Development 37.3, pp. 484–498.
Daly et al. (2012). Daly, A., Lewis, P., Corliss, M. and Heaslip, T. The privaterate of return to a university degree in Australia. Centre for LabourMarket Research.http://journals.sagepub.com/doi/pdf/10.1177/0004944114565117.
Grattan Institute 2018 62

Dropping out: the benefits and costs of trying university
Dawson et al. (2016). Dawson, S., Gasevic, D. and Rogers, T. Studentretention and learning analytics: a snapshot of Australian practicesand a framework for advancement. University of SouthAustralia/Office for Learning and Teaching.
Deloitte (2017). Smart everything, everywhere: mobile consumer survey 2017,The Australian Cut. Deloitte Technology, Media Telecommunications(TMT) Industry Group.https://www2.deloitte.com/au/mobile-consumer-survey.
Department of Education and Training (various years). Higher educationstatistics collection. Department of Education and Training.
(2015a). HEIMSHELP: Commonwealth Higher Education StudentSupport Number (CHESSN) scope.http://heimshelp.education.gov.au/sites/heimshelp/2015_data_requirements/2015higheredstudent/scope/pages/chessn (visited on11/11/2017).
(2015b). Higher Education Standards Framework (ThresholdStandards) 2015. Department of Education and Training.https://www.legislation.gov.au/Details/F2015L01639.
(2017a). Higher education statistics collection. Department ofEducation and Training.
(2017b). Completion rates of domestic bachelor degree students: acohort analysis, 2005-2015. Department of Education and Training.
(2017c). Students: Selected higher education statistics 2016.Department of Education and Training.
(2017d). Undergraduate applications, offers and acceptances 2017.Department of Education and Training.
(2017e). Allocation of units of study to funding clusters and studentcontribution bands according to field of education codes for 2017.Department of Education and Training. https://docs.education.gov.au/system/files/doc/other/2017_allocation_of_units_of_study_v2.pdf.
DIICCSRTE (2013a). Administration Guidelines 2012 (Higher EducationSupport Act 2003). Department of Industry, Innovation, ClimateChange, Science, Research and Tertiary Education.https://www.legislation.gov.au/Details/F2013C00519.
(2013b). Higher education standards framework (threshold standards)2011. Department of Industry, Innovation, Science, Research andTertiary Education.https://www.legislation.gov.au/Details/F2013C00169.
Federation University (2018). Initiative updates: Student retention and successproject - March 2018. https://federation.edu.au/staff/student-retention-and-success/the-plan/initiative-updates (visited on 12/04/2018).
Gore et al. (2017a). Gore, J., Ellis, H., Fray, L., Smith, M., Lloyd, A.,Berrigan, C., Lyell, A., Weaver, N. and Holmes, K. Choosing VET:investigating the VET aspirations of school students. National Centrefor Vocational Education Research. https://www.ncver.edu.au/__data/assets/pdf_file/0028/1142749/Choosing-VET-investigating-the-VET-aspirations-of-school-students.pdf.
Gore et al. (2017b). Gore, J., Holmes, K., Smith, M., Fray, L., McElduff, P.,Weaver, N. and Wallington, C. “Unpacking the career aspirations ofAustralian school students: towards an evidence base for universityequity initiatives in schools”. Higher Education Research andDevelopment 36.7, pp. 1383–1400.
Griffith University (2017). Griffith University website, learning and teachingsection: Students at risk.
Harvey et al. (2016). Harvey, A., Brett, M., Cardak, B., Sheridan, A.,Stratford, J., Tootell, N., McAllister, R. and Spicer, R. The adaptationof tertiary admissions practices to growth and diversity. La TrobeUniversity/UNE.
Harvey et al. (2017). Harvey, A., Szalkowicz, G. and Luckman, M. There-recruitment of students who have withdrawn from Australian highereducation. La Trobe University.
Grattan Institute 2018 63
Dropping out: the benefits and costs of trying university
Higher Education Standards Panel (2017). Discussion paper: Improvingretention, completion and success in higher education. Department ofEducation and Training. https://docs.education.gov.au/node/44116.
James, R. (2002). Socioeconomic background and higher educationparticipation: an analysis of school students’ expectations.Department of Education, Science and Training/Centre for the Studyof Higher Education.
Krosnick, J. A. (1999). “Survey Research”. Annual Review of Psychology 50,pp. 537–567.
Li, I. W. and Dockery, A. M. (2014). Socioeconomic status of schools anduniversity academic performance: implications for Australia’s highereducation expansion. National Centre for Student Equity in HigherEducation, Curtin University.
Lim, P. (2011). Measuring the socioeconomic status of Australian youth.National Centre for Vocational Education Research.
Long et al. (2006). Long, M., Ferrier, F. and Heagney, M. Stay, play or give itaway? Students continuing, changing or leaving university study infirst year. Monash University - ACER.
McLean et al. (2016). McLean, S., Booth, A., Gee, M., Salway, S., Cobb, M.,Bhanbhro, S. and Nancarrow, S. “Appointment reminder systems areeffective but not optimal: results of a systematic review and evidencesynthesis employing realist principles.” Patient Preference andAdherence. 10, pp. 479–499.
Messinis, G. and Sheehan, P. (2015). The Academic Performance of First YearStudents at Victoria University by Entry Score and SES, 2009-2013.Victoria University/Victoria Institute of Strategic Economic StudiesMelbourne. https://www.vu.edu.au/sites/default/files/cses/pdfs/the-academic-performance-of-first-year-students-at-VU-by-entry-score-and-SES-2009-2013.pdf.
Mission Australia (2016). Youth survey report 2016. Mission Australia.
Monash University (2018). How to apply for a Monash IT degree: Readmissionto courses. https://www.monash.edu/it/future-students/how-to-apply/readmission-to-courses (visited on 15/04/2018).
NCVER (2014). Longitudinal Survey of Australian Youth, 2006 cohort. NationalCentre for Vocational Education Research.
Norton, A. (2012). Graduate Winners: Assessing the public and privatebenefits of higher education. Grattan Institute.
(2016). “Equity and markets”. Student equity in higher education:Twenty-five years of A Fair Chance for All. Ed. by A. Harvey, M. Brettand C. Burnheim. Springer, pp. 183–206.
(2017). “Universities and the evolving graduate labour market”.Visions for Australian tertiary education. Ed. by R. James, S. Frenchand P. Kelly. Centre for the Study of Higher Education, University ofMelbourne, pp. 91–100.
Norton, A. and Cakitaki, B. (2016). Mapping Australian higher education 2016.Grattan Institute.
Norton, A. and Cherastidtham, I. (2017). Inquiry into the Higher EducationSupport Legislation Amendment (A More Sustainable, Responsiveand Transparent Higher Education System) Bill 2017. SenateEducation and Employment Legislation Committee/Grattan Institute.
OECD (2016). Education at a glance 2016. OECD.
OES (2018). OES un-enrolment process for disengaged students. OnlineEducation Services.
Parks et al. (2017). Parks, A., Mills, J., Weber, D., Westwell, M. andBarovich, K. Ready or not, here I come! Learning to support year 12students’ university student choices. University of SouthAustralia/What should I study? project.
Grattan Institute 2018 64

Dropping out: the benefits and costs of trying university
Roy Morgan Research (2009). Year 12 choices: a survey of factors influencingyear 12 decision-making on post-school destination, choice ofuniversity and preferred subject. Australian Department of Education,Employment and Workplace Relations.http://pandora.nla.gov.au/pan/127723/20110629-1522/www.deewr.gov.au/HigherEducation/Publications/Documents/Year12StudentChoicesReport.pdf.
Savage, J. and Norton, A. (2012). Non-financial benefits of higher education.Grattan Institute. http://grattan.edu.au/static/files/assets/0b7377cf/164_graduate_winners_non-financial_benefits.pdf.
Schnepf, S. (2017). “How do tertiary dropouts fare in the labour market?: Acomparison between EU countries”. Higher Education Quarterly 71.1,pp. 75–96.
Social Research Centre/Department of Education and Training (variousyears). Student Experience Survey, micro data. Social ResearchCentre/Department of Education and Training.
(2017). 2016 Student Experience Survey national report. SocialResearch Centre/Department of Education and Training.
Tembo et al. (2017). Tembo, C., Burns, S. and Kalembo, F. “The associationbetween levels of alcohol consumption and mental health problemsand academic performance among young university students”. PLOSOne. https://doi.org/10.1371/journal.pone.0178142.
TEQSA (2017a). TEQSA’s Risk Assessment Framework, Version 2.1. TertiaryEducation Quality and Standards Agency.
(2017b). Characteristics of Australian higher education providers andtheir relation to first-year student attrition. Tertiary Education Qualityand Standards Agency.
(2017c). HESF Domain 1: Student participation and attainment.Tertiary Education Quality and Standards Agency.
(2017d). Template beta initial course accreditation. Tertiary EducationQuality and Standards Agency.
(2017e). National register of higher education providers. TertiaryEducation Quality and Standards Agency.http://www.teqsa.gov.au/national-register.
(2017f). Risk ratings: examples of relevant context and providercontrols that TEQSA considers. Tertiary Education Quality andStandards Agency.https://www.teqsa.gov.au/latest-news/publications/risk-ratings-examples-relevant-context-and-provider-controls-teqsa.
Tertiary Education Commission (NZ) (2018). Tertiary EducationCommission/Te Amorangi Matauranga Matua: Frequently askedquestions on FeesFree.govt.nz. https://www.feesfree.govt.nz/faqs/(visited on 23/04/2018).
University of Melbourne (2017). Melbourne Policy Library: Academic ProgressReview Policy (MPF1291). http://policy.unimelb.edu.au/MPF1291.
University of Tasmania (2018a). Admission requirements. University ofTasmania.http://www.utas.edu.au/admissions/undergraduate/admission-requirements.
(2018b). Enrolments: terms and conditions. University of Tasmania.http://www.utas.edu.au/enrolments/terms-and-conditions.
UTS (2016). UTS admissions policy. University of Technology Sydney.http://www.gsu.uts.edu.au/policies/admissionspolicy.html.
Wei, H. (2010). Measuring Economic Returns to Post-School Education inAustralia. Australian Bureau of Statistics.
West et al. (2015). West, D., Huijser, H., Lizzio, A., Toohey, D., Miles, C.,Searle, B. and Bronnimann, J. Learning analytics: assistinguniversities with student retention, final report. Office for Learning andTeaching/Charles Darwin University.
Wilkins, R. (2016). The Household, Income and Labour Dynamics in AustraliaSurvey: Selected findings from waves 1 to 14, the 11th annualstatistical report of the HILDA survey. Melbourne Institute of AppliedEconomic and Social Research.
Grattan Institute 2018 65