Coagulation Disorders and Disseminated Intravascular Coagulation (DIC)

Droplets to Drops by Turbulent Coagulation
N. RIEMER*
Department of Mechanical and Aeronautical Engineering, University of California, Davis, Davis, California
A. S. WEXLER
Department of Mechanical and Aeronautical Engineering, Department of Civil and Environmental Engineering, andDepartment of Land, Air, and Water Resources, University of California, Davis, Davis, California
(Manuscript received 12 November 2003, in final form 30 September 2004)
ABSTRACT
This study addresses two central problems in cloud microphysics. The first is the source of large droplets,which initiates the rapid production of warm rain. The second is the broadening of the cloud dropletspectrum at both tails of the spectrum. The study explores how in-cloud turbulence can help to close thegaps in our understanding. With box model simulations, the development of cloud droplet spectra iscalculated using a coagulation kernel that recently has been derived from direct numerical simulations. Thiskernel includes both the effect of turbulence on the relative velocities of the droplets and on the localincreases in droplet concentration, the so-called accumulation effect. Under the assumption that this kernelcan be extrapolated to atmospheric Reynolds numbers, the results show that for typical atmosphericconditions, the turbulent coagulation kernel is several orders of magnitude larger than the sedimentationkernel for droplets smaller then 100 �m. While for calm air after 30-min simulation time, only 7% of thetotal mass is found in droplets with sizes over 100 �m, this increases to 79% for a dissipation rate of 100cm2 s�3 and 96% for 300 cm2 s�3 if a combined sedimentation and turbulent kernel is employed thatassumes that the sedimentation and turbulent kernel can be added. Hence, moderate turbulence canenhance significantly the formation of large droplets. Furthermore, a time-scale analysis shows that broad-ening at the upper end of the spectrum is caused by turbulent coagulation whereas thermodynamic effectsare responsible for broadening at the lower end.
1. Introduction
Rain formation and the role of clouds in climate andatmospheric chemistry are closely linked to evolutionof the cloud-droplet spectra. As recent reviews state,our understanding of these processes is still fragmen-tary (Beard and Ochs 1993; Pinsky et al. 2000). Thesource of large droplets required to initiate the rapidproduction of warm rain in both maritime and conti-nental clouds constitutes a major unknown in cloudphysics. A related and also unexplained phenomenon isthe observed broadening of the cloud-droplet spectrumwith increasing height from cloud base at both the smalland large ends of the spectrum (Warner 1969; Bren-guier and Chaumat 2001). Various theories have beenproposed to explain these observations, including mix-ing with the surroundings followed by fresh nucleation
(Lee and Pruppacher 1977), collisions of large dropletsarising from giant and ultragiant nuclei (Beard andOchs 1993; Yin et al. 2000) and the self-broadening ofthe droplet spectrum by collision of cloud droplets dueto the turbulence in clouds, which will be the topic ofour investigation.
Arenberg (1939) realized that clouds are an inher-ently turbulent medium where turbulence could influ-ence the droplet coagulation process, but this process isstill not well understood and therefore insufficientlyrepresented in current cloud models. In recent decades,several authors have revisited the area, some focusingon the industrial aspect of coagulating particles in aturbulent fluid (e.g., Kruis and Kusters 1997) and oth-ers on the atmosphere (e.g., Grover and Pruppacher1985; de Almeida 1976).
Khain et al. (2000) and Shaw (2003) reviewed thestate of the art of our understanding of particle–turbulence interactions in droplet-spectra evolution inclouds. They drew the conclusion that turbulence canenhance the collision kernel and hence the dropletgrowth significantly. More specifically, turbulence in-creases the geometric collision by three mechanisms.First, particle inertia leads to increased relative veloci-
* Current affiliation: Center for Turbulence Research, StanfordUniversity, Stanford, California.
Corresponding author: A. S. Wexler, University of California,Davis, One Shields Avenue, Davis, CA 95616.E-mail: [email protected]
1962 J O U R N A L O F T H E A T M O S P H E R I C S C I E N C E S VOLUME 62
© 2005 American Meteorological Society
JAS3431

ties and less-correlated velocity directions (accelerationeffect). Second, the wind field shear produces collisionsbetween particles even with the same inertia (shear ef-fect; Saffman and Turner 1956). The acceleration andthe shear effect are often referred to as the transporteffect. Third, coagulation rates are enhanced because oflocal concentration increases for particle responsetimes on the order of the Kolmorgorov scale. For thisphenomenon the terms “preferential concentration” or“accumulation effect” have been coined. Depending onthe relation between the governing time scales of thefluid and the particle response times, the impact of thetransport and accumulation effects varies. The trans-port effect is most dominant if the particle responsetime �p is on the order of the flow integral time scale Te,whereas the accumulation effect is most dominant if �p
is on the order of the Kolmogorov time scale �k (Wanget al. 2000; Reade and Collins 2000).
Furthermore, turbulence can also alter the collisionefficiency because of local aerodynamic droplet–droplet interactions. It should also be pointed out thatturbulence may also influence condensational growth(e.g., Grabowski and Vaillancourt 1999; Shaw 2000;Vaillancourt et al. 2002), a process beyond the scope ofthis paper.
The most frequently cited study concerning the im-pact of turbulence on coagulation is certainly the pio-neering work by Saffman and Turner (1956), which in-cluded the effect of turbulence on the relative velocityof the particles by the shear and accelerative mecha-nisms. However, as the authors clearly pointed out, itwas restricted to low-inertia particles. Yet, consideringthe turbulence levels in the atmosphere and the size ofcloud droplets, important inertial effects are expected.
In the mechanical engineering community, Abra-hamson (1975) derived an approximation for the colli-sion kernel for the large-particle limit treating the prob-lem of dust separation in industrial cyclones. Williamsand Crane (1983) combined Abrahamson’s large-par-ticle limit and Saffman and Turner’s (1956) small-par-ticle limit but only included the acceleration mecha-nism. Kruis and Kusters (1997) developed an improvedformulation based on Williams and Crane (1983),which included the shear effect as well as the accelera-tion mechanism and was also reduced to the Saffmanand Turner small-particle limit, which was not the casein the work of Williams and Crane (1983).
These aforementioned studies only treated the im-pact of turbulence on the relative velocity of droplets.Maxey (1987) first showed the phenomenon of prefer-ential concentration, which was expanded by Squiresand Eaton (1991) and Wang and Maxey (1993).Sundaram and Collins (1996) introduced the pair cor-relation function to quantify the effect of preferentialconcentration in the collision kernel. Since this work,further efforts have been made by Wang et al. (1998,2000) and Zhou et al. (2001) to develop a model for thecollision kernel on the basis of the solution of the Navier–
Stokes equations using direct numerical simulations(DNS). While Kruis and Kusters (1997) did not includethe accumulation effect, in these simulations both thetransport and the accumulation effect were included.
A limitation of these studies with respect to theirapplication to the atmosphere is certainly that they arecarried out for nonsedimenting droplets. However, sev-eral authors (e.g., Pinsky and Khain 2001; Kostinski andShaw 2001) measured the existence of small-scale con-centration fluctuations in clouds, which strengthens thehypothesis that preferential concentration is alsopresent in the atmosphere. Yet, our quantitative under-standing of the interplay of turbulence and sedimenta-tion is still poor and further efforts have to be under-taken to improve this situation.
Direct numerical simulations are furthermore limitedby the modest range of Reynolds numbers that can becovered. Wang et al. (2000) argued that the accumula-tion effect becomes even more pronounced for highReynolds number flow, which is typical for atmosphericconditions, but further work has to be done to supportor reject this hypothesis.
While most of the studies mentioned above focusedon engineering flows, Pinsky and Khain (1997a) ad-dressed the cloud physics community. In a series ofstudies these authors explored the impact of turbulenceon the collision of atmospheric droplets, starting from asimple shear flow (Khain and Pinsky 1995) to a modelof Batchelor turbulence (Pinsky and Khain 1996, 1997a,b;Khain and Pinsky 1997). To represent the accumulationeffect, Pinsky and Khain (1997a) added a term propor-tional to the rms drop-velocity flux divergence in thestochastic coalescence equation.
Finally, Pinsky et al. (1999) investigated the impact ofturbulence on the collision efficiency. The authors con-cluded that in turbulent flows the collision efficiency canbe significantly enhanced compared to that in calm air.
Experimental studies are rare compared to the theo-retical ones, especially in the parameter range that relatesto atmospheric clouds. Obviously, it is impossible to coverthe entire turbulent kinetic energy spectrum presentin natural clouds with laboratory experiments. Woodset al. (1972), Jonas and Goldsmith (1972), and Neiz-vestny and Kobzunenko (1986) all conclude from theirexperiments that turbulence enhances drop collision,however, their experiments were limited to relativelysmall collector drops. Vohl et al. (1999) confirmed forlarger collector drops that the droplets grow faster inturbulent flow compared to laminar flow.
As can be seen from the brief literature reviewabove, many of the theoretical studies have been de-voted to the derivation of collision kernels. Few studies,however, investigate the resulting development ofdroplet size distributions (Park et al. 2002; Pinsky andKhain 1997c). In light of the recent DNS-derived ker-nels we explore the possible impact of turbulence onthe droplet size distribution for atmospheric conditionssystematically, and address two questions, namely:
JUNE 2005 R I E M E R A N D W E X L E R 1963

Does turbulence have the potential to enhance thecoagulation process sufficiently to rapidly formlarge droplets and explain the observed productionof warm rain?
Can our predictions work toward reproducing theobserved broadening of the size distribution?
We will simulate the evolution of the droplet sizedistribution using the coagulation kernel presented byZhou et al. (2001), since their parameterization coversthe accumulation and the transport effects. By applyingthis parameterization to atmospheric conditions, thepotential influence of turbulent coagulation is evaluated.
It should be pointed out that investigations of turbu-lence on cloud microphysics are recently undergoing avery fast development and the analysis of various im-portant aspects of this topic has just started. Therefore,this study should be understood as a first approach toincorporate DNS results in atmospheric models, beingaware of the simplification that had to be made at thisstage. In particular, the limitations of our study consistof the following underlying assumptions: First, the DNSsimulations that are the basis for the turbulent coagu-lation kernel we used did not include gravitational ef-fects. Second, the DNS simulations were performed ata much lower Reynolds number than those present inthe atmosphere. The implications of both assumptionsare discussed later in this paper.
In the following section, the calculation of the turbu-lent collision kernel is outlined along with an overviewof the parameter values that are the basis for thosecalculations. Section 3 presents numerical results of abox model simulating the development of cloud-dropletspectra using the turbulent kernel for different atmo-spheric conditions. Furthermore, the concept of time-scale analysis is introduced comparing the time scale forcondensation and coagulation for atmospheric conditions.Finally, concluding remarks are given in section 4.
2. Method
a. The collision kernel
Zhou et al. (2001) provide a model to predict thegeometric collision kernel in a bidisperse system for aturbulent fluid, which is derived from direct numericalsimulations. This model includes both the turbulenttransport effect and the accumulation effect. In our
work, we apply this kernel to calculate the developmentof cloud-droplet spectra under atmospheric conditions.The following section outlines the calculation of thecollision kernel in a turbulent fluid.
The ensemble average of the collision kernel Kt(r1,r2) for two particles with the radii r1 and r2 in a turbu-lent fluid can be expressed in a generalized form by(Sundaram and Collins 1997):
Kt�r1, r2� � Et�0
�|wr�r1, r2� |��|wr,shear�r1, r2� |�
g12�R�, �1�
where R � r1 r2 is the collision radius and
�0 ��8�
15R3
�k
�
is the collision kernel for zero-inertia particles accord-ing to Saffman and Turner (1956), with the Kolmo-gorov velocity scale k � (��)1/4, where � is the viscosityof the fluid and � the dissipation rate. The Kolmogorovlength scale is � (�3/�)1/4 and Et is the turbulent col-lection efficiency.
The collection efficiency is Et defined as the productof the collision efficiency Ecol,t and the coalescence ef-ficiency Ecoa,t. The collision efficiency represents theratio of the actual number of collisions to the numberfor complete geometric sweep-out. However, collisiondoes not guarantee coalescence. The coalescence effi-ciency accounts for this fact and is defined as the ratioof the number of coalescences to the number of colli-sions.
The hydrodynamic interactions of droplets in turbu-lent flow are highly uncertain, but there are indicationsthat Ecol,t is larger in turbulence than in calm air (Pinskyet al. 1999). In our study we retain the value Ecol,t � 1,and we give an estimation of the impact of Ecol,t basedon the work of Pinsky et al. (1999) in the appendix.Even less is known about Ecoa,t, the coalescence effi-ciency in turbulent flow. Laboratory studies of smallcolliding droplets show that the coalescence efficiencyis close to 1 if the droplets are charged and an electricalfield is present (Rogers and Yau 1989). Because weakfields and charges exist in natural clouds, we thereforeassume Ecoa,t � 1 for the sake of simplicity.
The term �|wr(r1, r2) |�/�|wr,shear(r1, r2) |� with its twocomponents—shear and acceleration—represent theturbulent transport effect by
�|wr,shear�r1, r2� |� �� 215�
�k
R
�,
�|wr�r1, r2� |��|wr,shear�r1, r2� |�
� �1 15wr,accel
2
�k2 ��
R�2�1/2
wr,accel2
�k2 � Cw����u�
�k�2
�
� � 1 ���1 �2� �4�1�2
��1 �2�� 1 �1 �2
�1 �1��1 �2��
� � 1
�1 �1��1 �2��
1
�1 ��1��1 ��2��, �2�
1964 J O U R N A L O F T H E A T M O S P H E R I C S C I E N C E S VOLUME 62

where �i � 2.5 �p(ri)/Te (i � 1, 2) is proportional to theratio of particle response time �p � 2�pr2
i /(9��) to flowintegral time Te � u�2/�. Here, �p is the particle density,� the fluid density, ri particle radius, and u� the fluid rmsvelocity fluctuation.
Equation (2) is developed on the basis of the formu-lation by Kruis and Kusters (1997). To fit their numeri-cal results, Zhou et al. (2001) introduced the functionCw(� ) � 1.0 0.6 exp[�(� � 1)1.5] and the factor � �� � 0.183u�2/��� with � � max(�2/�1, �1/�2).
The factor
g12�R� � 1 12�g11�R� � 1�g22�R� � 1
is the bidisperse radial distribution function at contactand accounts for the accumulation effect, which is gov-erned by the monodisperse radial distribution functionsgii (i � 1, 2; no summation implied) and the concentra-tion correlation coefficient
12 � 2.6 exp��� 0.205 exp��0.0206�
×12�1 tanh� � 3��,
where � � max (�p2/�p1, �p1/�p2) and
gii � 1 y0����1 � z02���� R�z0
2����y1����1 � z1����
y2���z1��� y3���z2����. �3�
The functions y0(�), y1(�), y2(�), y3(�), z0(�), z1(�),and z2(�) are given in Table 1. Here, the argument � ��pi/�k is the Stokes number where �k � ��/� is theKolmogorov time scale.
The monodisperse radial distribution function gii
scales with the Taylor microscale Reynolds number,which is defined as R� � u��/� with the transverse Tay-lor microscale � � �15�u�2/�. The linear dependenceof gii on R� is based on the results of direct numericalsimulations, which only cover a range of low Reynoldsnumbers compared to atmospheric conditions. The ex-trapolation of this relationship to high Reynolds num-bers introduces therefore some uncertainty, which wemust keep in mind when interpreting our results.
Furthermore, Zhou et al. (2001) employ the follow-ing assumptions in their model: The size of the particlesis on the order of or less than the Kolmogorov lengthscale . The particle volume fraction and mass loadingare sufficiently low so that the presence of the particlesdoes not impact the gas turbulence. These assumptionsare valid for clouds as established in section 2.2.
Moreover, their DNS simulations do not include theeffect of gravity. In the atmosphere, both turbulenceand gravitation clearly affect the size distribution andtherefore it is necessary to formulate a collision kernelthat includes both mechanisms. The usual approach formodeling the impact of several coagulation mechanismssuch as Brownian motion and gravitational settling issimply to add the individual kernels. As Butuirat andKielkiewicz (1996) show, this method gives satisfying
results. They investigate two cases, namely Brownianand turbulent shear coagulation, and Brownian, gravi-tational, and turbulent shear coagulation. However ifthe accumulation effect is also involved, the formula-tion of the resulting kernel requires more caution. Vail-lancourt and Yau (2000) discuss the relative roles ofsedimentation and turbulence. An appropriate nondi-mensional diameter (S) is the ratio of the eddy turn-over time to the time it takes for the particles to sedi-ment across the eddy, which we can also express as theratio of the settling velocity of the particles T and theKolmogorov velocity scale k: S � T /k. If S 1sedimentation is negligible, if S �1 the particles willquickly sediment through the eddy which decreases theparticle–eddy interaction. For droplets of interest in theatmosphere, S is usually larger than 1, which meansthat the impact of gravitational settling might weakenthe impact of the accumulation effect. Indeed Wangand Maxey (1993) have shown that for Stokes numbersof 1, preferential concentration decreases slightly as Sincreases from 0 to 3. On the other hand, Wang andMaxey (1993) also show that the mean settling velocityfor particles with Stokes numbers around 1 increases ina turbulent flow compared to calm air. The overall ef-fect of the interaction of gravitation and turbulence onthe coagulation of particles is still not very well under-stood at this stage and represents an area where furtherresearch is needed.
If not otherwise indicated, we will consider the effectof gravity and turbulence separately. To estimate theinteraction of these processes, we simply add the tur-bulent and sedimentation kernels. This approach isclearly only preliminary and will be improved as re-search progresses.
In our investigation the sedimentation kernel Ks(r1,r2) for calm air will be employed for comparison, whichis given by
Ks�r1, r2� � ��r1 r2�2Es |�T�r1� � �T�r2� |. �4�
Here, Es is the collision efficiency for calm air where weuse the values provided by Hall (1980), and �(r1),
TABLE 1. Auxiliary functions for the radial distributionfunction gii.
y0(�) � 18 �2
y1(�) � 0.36�2.5 exp(��2.5)y2(�) � 0.24 exp(�0.5 �)y3(�) � 0.013 exp(�0.07 �)
z0��� �12�1 tanh
� � 0.50.25 �
z1��� �12�1 tanh
� � 1.250.1 �
z2��� �12�1 tanh
� � 6.52.5 �
JUNE 2005 R I E M E R A N D W E X L E R 1965

T(r2) are the terminal velocities of the droplets in calmair.
b. Calculation of the size distributions
The stochastic collection equation describes the evo-lution of a colliding and coalescing cloud droplet sizedistribution (Pruppacher and Klett 1997);
�n�m, t�
�t�
12 �m0
m
n�mc, t�K�mc, m��n�m�, t�dm�
� �m0
�
n�m, t�K�m, m��n�m�, t�dm�,
where n(m, t) is the drop number distribution functionat time t and K(mc, m�) is the collection kernel describ-ing the rate at which a droplet of mass mc � m � m� iscollected by a droplet of mass m� forming a droplet ofmass m. The following transformation of variablesleads to the stochastic collection equation for the masssize distribution g(y, t) (Berry 1967):
g�y, t�dy � mn�m, t�dm, n�m, t� �1
3m2 g�y, t�,
where y � lnr and r is the radius of droplets with massm; and
�g�y, t�
�t�
12 �y0
y m2
mc2m�
g�yc, t�K�yc, y��g�y�, t�dy�
� �y0
�
g�y, t�K�y, y��
m�g�y�, t�dy�. �5�
As an initial cloud droplet distribution we use aGamma function of the form n(m, t � 0) � Lw /m2
exp(�m/m), where Lw is the total cloud water contentand m is the mean droplet mass. Assuming sphericaldroplets, m and the mean droplet radius r, are relatedby m(r) � 4/3��pr3, where �p is the water density.
For our simulations, Lw is set to 1 g m�3, typical forwarm rain clouds and r to 10 �m, a typical cloud dropletsize. This means that the assumptions mentioned above(low mass loading and particles smaller than or on theorder of ) hold. The solution of the stochastic collec-tion Eq. (5) uses the flux method by Bott (1998), whichhas been proved to be both efficient and mass conser-vative. For the collection kernel K we employ the tur-bulent collision kernel Kt as described in section 2.1 fordifferent atmospheric conditions, and compare the re-sults to those obtained with the kernel for sedimenta-tion in calm air Ks [Eq. (4)].
Cloud dissipation rates � depend on cloud type andage. The values range from 10 cm2 s�3 for stratus cloudsto several 100 cm2 s�3 for cumuli and 1000 cm2 s�3 forcumulonimbus clouds (Pruppacher and Klett 1997).
Figure 1 shows measured dissipation rates � in clouds
with the corresponding rms velocity u� (MacPhersonand Isaac 1977). From dimensional arguments, a cubicrelation between � and u� is expected, since
� �u�3
L, �6�
as long as the characteristic length scale L is relativelyconstant. The broken line shows the fit to the datapoints for L � 1500 m. The solid line shows the radiusrk that fulfills the condition �p(rk) � �k(�), showing thatthe accumulation effect is important.
For values of � that occur in the atmosphere, thevalues for rk are in the range of observed cloud dropletsizes. Therefore, the accumulation effect is expected tobe significant for droplets between 30 and 100 �m. Thetransport effect, however, is less important since �p �Te applies for unreasonably large particle sizes underatmospheric conditions.
In the following, the values of � � 300 cm2 s�3 andu� � 3.5 m s�1 are used for the base case, which fulfillEq. (6) and represent in-cloud turbulence of moderateto high intensity.
3. Results and discussion
In this section we investigate various aspects of theinfluence of turbulence on the development of thedroplet size distribution. First, we compare the magni-tude of the coagulation kernel due to sedimentation tothe turbulent coagulation kernel according to Zhou etal. (2001) for atmospheric conditions. Then we evaluatethe influence of different turbulence levels on the evo-lution of the drop size spectra. Furthermore, we willintroduce the concept of a time-scale analysis, whichwill help us to interpret the results and to compare theprocesses of coagulation and condensation with respectto their ability to broaden the size distribution.
Figure 2 shows the turbulent coagulation kernel Kt
according to Eq. (1) for the base case, and Fig. 3 shows
FIG. 1. Measured values of u� and � in clouds (dots; MacPhersonand Isaac 1977). Broken line is the fit of measured data; solid lineis particle radius for which �p � �k .
1966 J O U R N A L O F T H E A T M O S P H E R I C S C I E N C E S VOLUME 62
the relative differences (Kt � Ks)/Ks to the sedimenta-tion kernel Ks according to Eq. (4). Given Eq. (4), it isclear that Ks becomes large if the sizes of the collidingdroplets are different and zero for equally sized drop-lets. The turbulent coagulation kernel Kt exhibits a dis-tinct local maximum for the combination of droplet ra-dii near 65 and 250 �m using the base case values for �and u�. The exact position, as well as the magnitude ofthis maximum, depends on � and u�. Note that this localmaximum in the 65- to 250-�m size range is not ofprimary importance for the onset of effective coagula-tion. To be effective, turbulent coagulation must helpparticle grow through the 10- to 40-�m gap; condensa-
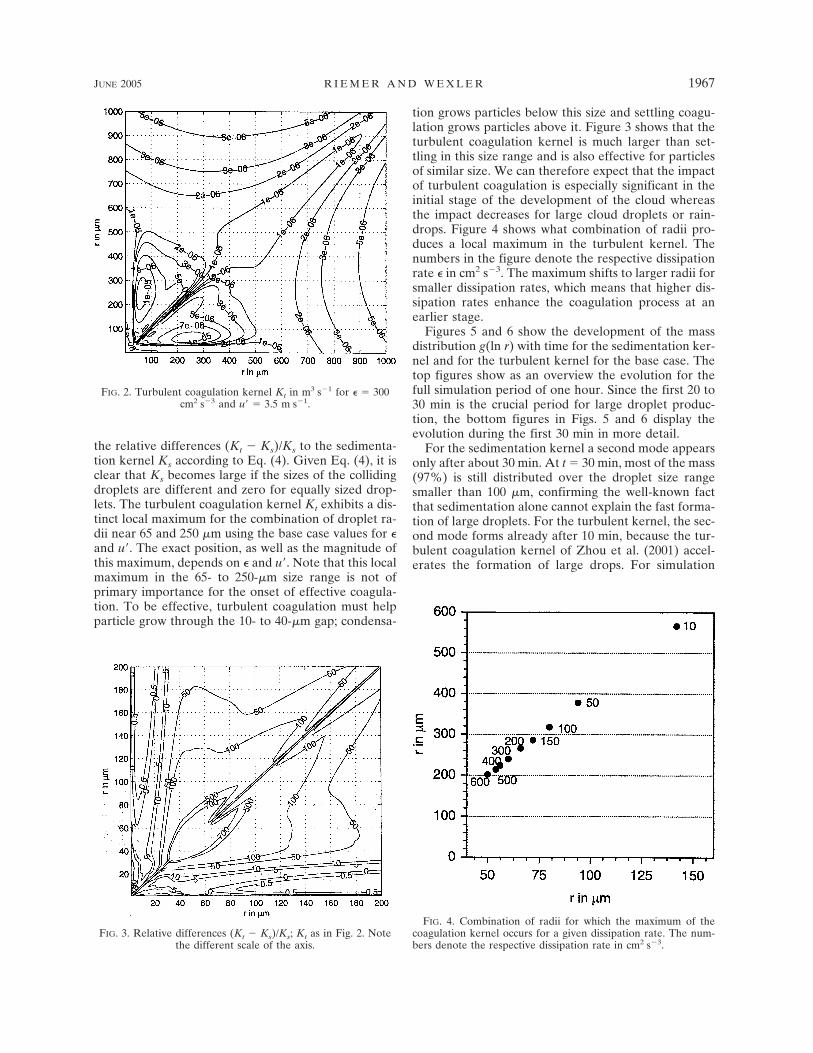
tion grows particles below this size and settling coagu-lation grows particles above it. Figure 3 shows that theturbulent coagulation kernel is much larger than set-tling in this size range and is also effective for particlesof similar size. We can therefore expect that the impactof turbulent coagulation is especially significant in theinitial stage of the development of the cloud whereasthe impact decreases for large cloud droplets or rain-drops. Figure 4 shows what combination of radii pro-duces a local maximum in the turbulent kernel. Thenumbers in the figure denote the respective dissipationrate � in cm2 s�3. The maximum shifts to larger radii forsmaller dissipation rates, which means that higher dis-sipation rates enhance the coagulation process at anearlier stage.
Figures 5 and 6 show the development of the massdistribution g(ln r) with time for the sedimentation ker-nel and for the turbulent kernel for the base case. Thetop figures show as an overview the evolution for thefull simulation period of one hour. Since the first 20 to30 min is the crucial period for large droplet produc-tion, the bottom figures in Figs. 5 and 6 display theevolution during the first 30 min in more detail.
For the sedimentation kernel a second mode appearsonly after about 30 min. At t � 30 min, most of the mass(97%) is still distributed over the droplet size rangesmaller than 100 �m, confirming the well-known factthat sedimentation alone cannot explain the fast forma-tion of large droplets. For the turbulent kernel, the sec-ond mode forms already after 10 min, because the tur-bulent coagulation kernel of Zhou et al. (2001) accel-erates the formation of large drops. For simulation
FIG. 3. Relative differences (Kt � Ks)/Ks; Kt as in Fig. 2. Notethe different scale of the axis.
FIG. 2. Turbulent coagulation kernel Kt in m3 s�1 for � � 300cm2 s�3 and u� � 3.5 m s�1.
FIG. 4. Combination of radii for which the maximum of thecoagulation kernel occurs for a given dissipation rate. The num-bers denote the respective dissipation rate in cm2 s�3.
JUNE 2005 R I E M E R A N D W E X L E R 1967

times around one hour, the sedimentation and turbu-lent kernels predict similar distributions, supporting thefinding that turbulence is especially important for theearly stage of the development of the cloud. Figure 7shows the effect of the combined sedimentation andturbulent kernel. For this case, the second mode be-comes visible after only 5 min, and after 30 min, 96% ofthe mass is transferred to sizes larger than 100 �m.
The sensitivity of the temporal evolution of the sizedistribution to � is displayed in Fig. 8. It shows thedevelopment of the mass distribution g(ln r) for � � 100cm2 s�3, � � 200 cm2 s�3, � � 300 cm2 s�3, and � � 400cm2 s�3 with the corresponding u� values according toEq. (6). It is obvious that higher dissipation rates causefaster formation of large droplets. While for � � 100cm2 s�3, the second mode appears after 25 min (com-parable to sedimentation only), for � � 400 cm2 s�3, itappears only after 5 min.
As mentioned above, some uncertainty is introducedin the calculation of the coagulation kernel since we
assume that the radial distribution function g12 dependslinearly on the Reynolds number. While this assump-tion holds for the range of Reynolds numbers that arecovered in direct numerical simulations, it is unknownif this will be still the case for Reynolds numbers in the
FIG. 7. Same as Fig. 5 but for the combined sedimentation andturbulent kernel.
FIG. 5. (a) Temporal evolution of the mass size distribution withsedimentation kernel according to Hall (1980). (b) Evolution forthe first 30 min in more detail.
FIG. 6. Same as Fig. 5 but for the turbulent kernel, base case.
1968 J O U R N A L O F T H E A T M O S P H E R I C S C I E N C E S VOLUME 62

atmosphere or if g12 will level off after some (likewiseunknown) threshold value is reached. Such behaviorhas been found for other problems in turbulence. Forinstance, Belin et al. (1997) show for the velocity gra-dient distributions in turbulence that a change in thedependence of the parameters of the distributions onthe Reynolds number can be found around R� � 700.To estimate the sensitivity in our model we carry out anadditional simulation where R� in Eq. (3) is set artifi-cially to 700 while � and u� are set to the base casevalues. Moreover, the combined sedimentation and tur-bulent kernel is employed. The result in Fig. 9 showsthat compared to Fig. 7, the development of large drop-lets is clearly delayed. However, compared to Fig. 5(sedimentation only), a strong acceleration of the largedroplet formation within the first 30 min can still benoticed.
Time-scale analysis
In all cases, a characteristic gap between the initialmode and the developing second mode is apparent.This gap becomes narrower for larger �, hence the dis-sipation rate controls the position of the second mode.Gaps in a size distribution imply that droplet lifetimes
are so short that the droplets leave this size range veryquickly. Here we develop a time-scale analysis to char-acterize the relevant processes and help to interpret theresults. This analysis will also be used to address theproblem of the size distribution broadening, a featureobserved for both tails of cloud droplet size distribu-
FIG. 9. Same as Fig. 7, but R� in Eq. (3) set to 700.
FIG. 8. Temporal evolution of the mass size distribution with turbulent kernel (a) � � 100 cm2 s�3, u� � 2.5, (b) � � 200 cm2 s�3,u� � 3.0 m s�1, (c) � � 300 cm2 s�3, u� � 3.5 m s�1, and (d) � � 400 cm2 s�3, u� � 3.7 m s�1.
JUNE 2005 R I E M E R A N D W E X L E R 1969

tions as the air parcel is ascending and cooling. Al-though this finding could partially be attributed to mea-surement artifacts, measured distributions at the cloudbase are still found, in fact, to be narrower than distri-butions at higher elevation (Brenguier and Chaumat2001).
Condensation and coagulation are both shaping thedroplet size distribution and can cause a narrowing orbroadening of the spectrum. While condensation typi-cally dominates the droplet growth when the dropletsare still small, coagulation becomes more important aslarger droplets form. The time scales indicate whichprocesses are faster, hence more important, for a givensize and time under given conditions. We will use thisanalysis to compare the growth time scales due to con-densation and turbulent coagulation.
The time scale �(r) for the growth of a spherical par-ticle of mass m(r) and radius r is generally given by(Friedlander 1977; Kerminen and Wexler 1995):
1��r�
�1r
dr
dt�
13m�r�
dm�r�
dt.
Broadening at the right tail of the distribution generallyimplies that �(r) is decreasing with increasing r, mean-ing that larger droplets grow faster than smaller ones.Broadening at the left tail of the distribution cannot beachieved by coagulation. It requires a droplet evapora-tion or the formation of new droplets. For the latter,entrainment processes are thought to be responsible (Leeand Pruppacher 1977). For evaporation, thermody-namic processes, such as the trading of water betweendroplets of different sizes, are a possible mechanism(Majeed and Wexler 2001). In the following, the timescales for condensation and coagulation are specified.
1) CONDENSATION
The time scale �cond is defined as (Majeed and Wex-ler 2001)
1�cond�r�
�1
3m�r�
dm�r�
dt�
13m�r�
�4�rD��Mwp��T����RT���RH � exp�A � B��
1 �4�rD��Mwp��T����RT�����H�Mw ��RT�����H� ��4�rk�aT��� exp�A � B�, �7�
with
A �2Mw�w
RTawr,
B � �m
Mw
Ms
ms
md � mp,
where Mw is the molecular weight of water vapor, Ms
the molecular weight of the solute, R the universal gasconstant, D� the water diffusivity corrected for noncon-tinuum effects, T� the temperature of the environment,Ta the droplet temperature, p°(T�) the water saturationpressure at T�, RH the relative humidity, �H the la-tent heat of water, k�a the thermal conductivity cor-rected for noncontinuum effects, w the air–water sur-face tension, �w the water density, �m the number ofions per solute molecule, and ms, md, and mp the massesof solute, droplet, and dry particle, respectively.
In their study, Majeed and Wexler (2001) consider anascending air parcel and show that the Kelvin effectleads to a characteristic trading of water between thesmall and the large droplets.
For our purpose, a state of equilibrium is consid-ered: The relative humidity is calculated so that thedroplets with the radius of the transport mean, r, havezero growth: dm(r)/dt � 0. The other initial conditionsare T� � 276 K, �m � 3, Ms � 142 g mole�1, and ms �10�19 kg.
Droplets with a radius smaller than r are evaporatingbecause of the Kelvin effect, droplets with a larger ra-dius are growing (however, very slowly). Equally sizeddroplets grow or evaporate all with the same rate.
2) COAGULATION
The crucial difference between growth by condensa-tion and coagulation is that coagulation causes particlesof the same size to grow at different rates. Dependingon the partner they coagulate with, droplets in a bin ofsize i will end up in different bins after one time step.Nevertheless a similar time scale for the growth can bedefined, however note that this is an averaged expres-sion for the growth of one particle of size r.
Given the size distribution n(r), where the total num-ber density N is given by N � !�0 n(r)dr, and the massdistribution g(r), where g(r) � m(r)n(r). The time scale�coag is then defined as
1�coag�r�
�1
3n�r�m�r� �0
�
n�r�K�r, r��n�r��m�r��dr�
�1
3m�r� �0
�
g�r��K�r, r��dr�. �8�
The numerator represents the increase in mass of thedroplets with radius r due to the coagulation with anyother droplets. Dividing by n(r) and normalizing by3m(r), this gives the growth rate per droplet and there-fore compares to �cond(r).
To help understand the effects of coagulation ongrowth, we define the time scales ��coag(r) and �coag(r) bymodifying the limits of the integral in Eq. (8). The timescale �coag(r) represents the growth due to larger drop-lets and ��coag(r) represents the growth due to smallerdroplets:
1970 J O U R N A L O F T H E A T M O S P H E R I C S C I E N C E S VOLUME 62

1
�coag� �r�
�1
3m�r� �0
r
g�r��K�r, r��dr� �9�
1
�coag �r�
�1
3m�r� �r
�
g�r��K�r, r��dr�. �10�
Figure 10 shows �coag, �coag, and ��coag for the base casefor different points in time. As defined above, �coag
represents the overall time scale due to coagulation,�coag is the time scale due to the uptake by larger drop-lets, ��coag is the time scale due to the uptake by smallerdroplets. All time scales show a characteristic minimumat rk � 42 �m, which is the size of the droplets havingthe same response time as the Kolmogorov time scale�k for � � 300 cm2 s�3. Droplets of this size coagulatevery fast so that they rush through this size range. The�coag curve is nonmonotonic and several regimes can beidentified. At the start of the simulation, it increases upto r � 15 �m then decreases with a local minimumaround r � rk, followed by an increase again. A broad-ening effect results if the time scale decreases with in-creasing radius. At the beginning of the simulation pe-riod this condition is fulfilled for droplets with radiusbetween 15 and 42 �m. Between these droplet sizes,�coag decreases over one magnitude. Later, this intervalshrinks until after 30 min, the time scale is monotoni-cally increasing. This means that a broadening effectdue to coagulation is only expected at the early stage ofcloud formation, which is however exactly the timewhen a mechanism is needed to enhance the formationof large droplets. Figure 10 also shows that once largedroplets are formed, the �coag curve flattens, whichmeans that all sizes grow with a similar speed. In Fig. 6,the size distributions after 40 min reflect this. The sec-ond mode with the large droplets shifts to the rightwithout changing shape significantly.
Comparing �coag and ��coag in Fig. 10 shows that thedroplets of size rk leave this size range because they aretaken up by larger droplets—except for the first fewminutes when the larger droplets are not yet formed.
Figure 11a displays �coag for different dissipationrates (t � 5 min.). The minimum of the time-scale shiftsto smaller radii as the dissipation rate � increases andthe minimum value decreases from 30 min for � � 50cm2 s�3 to 1 s for � � 500 cm2 s�3. This relates to thetime of the appearance of the second mode as well as toits position in Fig. 8. Larger dissipation rates decrease rk
and �coag causing the second mode to form earlier andcloser to the first mode. On the other hand, for small �,the size interval where a broadening effect can takeplace is larger. For � � 50 cm2 s�3, broadening occursfor the size range from 15 to 60 �m, whereas for � � 500cm2 s�3, this interval is shortened and ranges from only20 to 38 �m. Figure 11b shows that a variation of u� fora certain value of � has a large effect on the absolutevalue of � and affects the amplitude but not the positionof the minimum with respect to the droplet size. Smallvalues of u� favor the broadening effect.
Coagulation and condensation occur simultaneously,so the broadening or narrowing effect by one processcould therefore be enhanced or overcompensated bythe other. To explore the relationships, Fig. 12 com-pares the time scales �coag and �cond at the start of simu-lation where we assume that coagulation and conden-sation are decoupled. The time scale �cond is calculatedas described in section 3, so �cond has a singularity forthe transport mean radius of the distribution becausedroplets of this size are assumed to be in equilibrium.Droplet sizes smaller than the transport mean evapo-
FIG. 10. Time scales (a) �coag, (b) �coag, and (c) ��coag for thebase case.
JUNE 2005 R I E M E R A N D W E X L E R 1971

rate, while those larger than the transport mean grow.Figure 12 shows that for the case of a rini � 3 �m initialradius, �cond is by more than one magnitude smallerthan �coag up to the radius of 10 �m. For the initialradius of 5 �m, �coag and �cond are on the same order ofmagnitude for the left tail of the distribution. For theinitial radius of 7 and 10 �m, �cond exceeds �coag signifi-cantly.
Considering the size range smaller than the transportmean first, this behavior can be interpreted as follows:The small time scale �cond for the cases with small initialradii confirms the well-known finding that for verysmall droplets, condensation is the crucial process thatalters the size distribution. By assuming that most of thedroplets are in equilibrium with the ambient air, thesmall droplets are found to evaporate fast enough tobroaden the size distribution to the left. This broaden-ing occurs on a time scale shorter than �coag, whichmeans that, overall, a broadening effect is expected to-ward the small sizes. For an initial radius of 5 �m, bothprocesses have time scales of the same magnitude,
which means that the droplets are removed from thissize range by evaporation and by coagulation at a simi-lar rate. From this examination alone it cannot be con-cluded what the overall effect will be since coagulationand condensation are not coupled in our model.
Considering the sizes larger than the transport mean,we find that, at first, for small initial radii narrowingbecause of condensation dominates but is overcome bybroadening due to coagulation as the radii becomelarger.
4. Conclusions
In this paper we investigate the impact of turbulenceon the development of cloud droplet spectra. To ap-proach this problem, we solve the stochastic collectionequation using a recently developed model by Zhou etal. (2001) to calculate the collision kernel for atmo-spheric conditions. The collision kernel accounts bothfor the transport and the accumulation effect.
The major uncertainties in this study are that themodel by Zhou et al. (2001) was originally designed andvalidated for low Reynolds numbers and frozen turbu-lence. In our study we extrapolate their results to theatmosphere, an environment with extremely highReynolds numbers and characterized by strong inter-mittency, without being able to confirm at this stagethat this extrapolation holds. Furthermore, the kernelwe use was developed for nonsedimenting particles. Weapproximate the presence of gravity by adding the tur-bulent and sedimentation kernels linearly, an approachwhich has to be confirmed or possibly refined once theinteraction of turbulence and sedimentation is betterunderstood. Keeping these limitations in mind we focuson two central questions, namely, if the rapid formationof large droplets can be reproduced and if we can ex-
FIG. 11. (a) Time scales �coag for different dissipation rates. (b)Time scales �coag for � � 300 cm2 s�3 and different u�.
FIG. 12. Time scale �coag in comparison to �cond for differentinitial radii. The number in the legend denotes the respectiveinitial radii in �m.
1972 J O U R N A L O F T H E A T M O S P H E R I C S C I E N C E S VOLUME 62

plain the broadening of the size distribution towardboth ends of the spectrum.
Compared to the effect of sedimentation in calm aironly, we find that even moderate turbulence can en-hance the formation of large droplets significantly. Thelargest impact of turbulence is expected for similar-sized particles and/or for particles in the size rangesmaller than 100 �m. Here, the collision kernel is en-hanced by several orders of magnitude if turbulence isincluded, which accelerates the growth of droplets dra-matically. While for calm air after 30-min simulationtime, only 7% of the total mass is found in droplets withsizes over 100 �m, this is the case for 79% at a dissipa-tion rate of 100 cm2 s�3 and for 96% at 300 cm2 s�3 ifthe combined sedimentation and turbulent kernel isconsidered. The accumulation effect in turbulence isthe primary mechanism for this enhancement.
With a time-scale analysis we show that broadeningtoward the upper end of the spectrum is possible due tocoagulation for about the first 15 min of the cloud de-velopment, depending on the turbulence intensity.Lower turbulence intensity implies a longer time inter-val for broadening.
A comparison of the time scale of coagulation withthe time scale of condensation (for equilibrium condi-tions) shows that a trading of water between smalldroplets and large droplets due to the Kelvin effect canbe responsible for the broadening toward the small endof the spectrum. This is especially effective if the meanradius of the size distribution is smaller than about 5�m. If the mean radius is around 5 �m, the broadeningdue to evaporation for small droplets can be partiallycompensated by a narrowing due to coagulation. How-ever, further studies with a model that includes the cou-pling between coagulation and condensation are neces-sary to judge the overall effect.
Thus it appears that the growth of droplets to dropsis primarily due to the accumulation effect in turbu-lence when the droplet response times match the Kol-mogorov time scale, and this also explains the broad-ening to larger drops on the right-hand side of the dis-tributions. The broadening on the left can be explainedby Kelvin effect–driven evaporation.
APPENDIX
Turbulent Collision Efficiency
It is intuitively clear that the collision efficiency Ecol,t
must depend on the nature of the flow and particle size.The hydrodynamic interactions of droplets in turbulentflow are still an area of large uncertainties but there areindications that the collision efficiency is larger in aturbulent environment compared to calm air. Pinsky etal. (1999) have investigated this issue and conclude thatthe collision efficiency in a turbulent flow is a randomvalue with a significant dispersion, the maximum value
being several times larger than the mean value. To es-timate the impact of the collision efficiency, the resultsof the study by Pinsky et al. (1999) are introduced inour study. Since they considered the case � � 100cm2 s�3 we will do the same and adopt their results forthe averaged collision efficiency which is displayed inFig. 14 of their paper. Results are available for threecollector drop sizes (10, 20, and 30 �m). For collisionsof droplets with both radii smaller than 30 �m, thevalues for the collision efficiency are two-dimensionallyinterpolated on our radius grid. Unfortunately, resultsare not available for larger sizes. However, the graphsin their Fig. 14 show that the collision efficiency ap-proaches 1 as the collector droplets become larger. Forthe purposes of our estimation, we therefore use thevalue of 1 if one or both droplets are larger than 30 �m.To account for the randomness, we introduce for eachtime step random fluctuations around this averagedvalue of the collision efficiency in a way that the maxi-mum deviation from the average is "70%.
With this modification, a set of 100 simulations iscarried out. The results are shown for t � 30 min as graylines in Fig. A1. Also, the average of these 100 simula-tions is shown and the result for the case Ecol,t � 1.
In all cases, the coagulation kernel consists of thesum of Ks and Kt (� � 100 cm2 s�3 and u� � 2.5 m s�1).Regarding the averaged result, the development of thelarge droplets is retarded compared to the case withEcol,t � 1. However, a remarkable increase still has tobe noted compared to the case of sedimentation in calmair only (Fig. 5). Given that, at higher dissipation rates,the values for Ecol,t is expected to be even higher andconsidering the large uncertainties associated with theissue, it seems justified to retain the value Ecol,t � 1throughout the study.
FIG. A1. Mass size distribution for t � 30 min, combined sedi-mentation and turbulent kernel, � � 100 cm2 s�3. Gray lines areresults of 100 individual simulations with randomized collisionefficiency (see text for details). Solid black line is average forrandomized collision efficiency. Dotted black line is the case forEc � 1.
JUNE 2005 R I E M E R A N D W E X L E R 1973

REFERENCES
Abrahamson, J., 1975: Collision rates of small particles in a vig-orously turbulent fluid. Chem. Eng. Sci., 30, 1371–1379.
Arenberg, D., 1939: Turbulence as the major factor in the growthof cloud drops. Bull. Amer. Meteor. Soc., 20, 444–448.
Beard, K. V., and H. T. Ochs, 1993: Warm-rain initiation: Anoverview of microphysical mechanisms. J. Appl. Meteor., 32,608–625.
Belin, F., J. Maurer, P. Tabeling, and H. Willaime, 1997: Velocitygradient distributions in fully developed turbulence: An ex-perimental study. Phys. Fluids, 9, 3843–3850.
Berry, E. X., 1967: Cloud droplet growth by collection. J. Atmos.Sci., 24, 688–700.
Bott, A., 1998: A flux method for the numerical solution of thestochastic collection equation. J. Atmos. Sci., 55, 2284–2293.
Brenguier, J.-L., and L. Chaumat, 2001: Droplet spectra broad-ening in cumulus clouds. Part I: Broadening in adiabaticcores. J. Atmos. Sci., 58, 628–641.
Butuirat, F., and M. Kielkiewicz, 1996: On additivity of coagula-tion kernels. Ann. Nucl. Energy, 23, 1091–1096.
de Almeida, F. C., 1976: The collisional problem of cloud dropletsmoving in a turbulent environment—Part I: A method ofsolution. J. Atmos. Sci., 33, 1571–1578.
Friedlander, S. K., 1977: Smoke, Dust, and Haze. Wiley, 317 pp.Grabowski, W. W., and P. Vaillancourt, 1999: Comments on
“Preferential concentration of cloud droplets by turbulence:Effects of the early evolution of cumulus cloud droplet spec-tra.” J. Atmos. Sci., 56, 1433–1436.
Grover, S. N., and H. R. Pruppacher, 1985: The effect of verticalturbulent fluctuations in the atmosphere on the collection ofaerosol particles by cloud droplets. J. Atmos. Sci., 42, 2305–2318.
Hall, W. D., 1980: A detailed microphysical model within a two-dimensional dynamic framework: Model description and pre-liminary results. J. Atmos. Sci., 37, 2486–2507.
Jonas, P. R., and P. Goldsmith, 1972: The collection efficiencies ofsmall droplets falling through a sheared air flow. J. FluidMech., 52, 593–608.
Kerminen, V.-M., and A. S. Wexler, 1995: Growth laws for atmo-spheric aerosol particles: An examination of the bimodalityof the accumulation mode. Atmos. Environ., 29, 3262–3275.
Khain, A. P., and M. B. Pinsky, 1995: Drop inertia and its contri-bution to turbulent coalescence in convective clouds. Part I:Drop fall in the flow with random horizontal velocity. J. At-mos. Sci., 52, 196–206.
——, and ——, 1997: Turbulence effects on the collision kernel.II: Increase of the swept volume of colliding drops. Quart. J.Roy. Meteor. Soc., 123, 1543–1560.
——, M. Ovtchinnikov, M. Pinsky, A. Pokrovsky, and H.Krugliak, 2000: Notes of the state-of-the-art numerical mod-eling of cloud microphysics. Atmos. Res., 55, 159–224.
Kostinski, A. B., and R. A. Shaw, 2001: Scale-dependent dropletclustering in turbulent clouds. J. Fluid Mech., 434, 389–398.
Kruis, F. E., and K. A. Kusters, 1997: The collision rate of par-ticles in turbulent flow. Chem. Eng. Commun., 158, 201–230.
Lee, I. Y., and H. R. Pruppacher, 1977: A comparative study onthe growth of cloud drops by condensation using an air parcelmodel with and without entrainment. Pure Appl. Geophys.,115, 523–545.
MacPherson, J. I., and G. A. Isaac, 1977: Turbulent characteristicsof some Canadian cumulus clouds. J. Appl. Meteor., 16, 81–90.
Majeed, M. A., and A. S. Wexler, 2001: Microphysics of aqueousdroplets in clouds and fogs as applied to PM-fine modeling.Atmos. Environ., 35, 1639–1653.
Maxey, M. R., 1987: The gravitational settling of particles in ho-mogeneous turbulence and random flow fields. J. FluidMech., 174, 441–465.
Neizvestny, A. I., and A. G. Kobzunenko, 1986: Effect of small-scale turbulence on the coagulation growth rate of clouddroplets. Izv. Akad. Nauk SSSR, Fiz. Atmos. Okeana, 22,626–633.
Park, S. H., F. E. Kruis, K. W. Lee, and H. Fissan, 2002: Evolutionof particle size distributions due to turbulent and Browniancoagulation. Aerosol Sci. Technol., 36, 419–432.
Pinsky, M. B., and A. Khain, 1996: Simulations of drop fall in ahomogeneous isotropic turbulent flow. Atmos. Res., 40, 223–259.
——, and ——, 1997a: Formation of inhomogeneity in drop con-centration induced by the inertia of drops falling in a turbu-lent flow, and the influence of the inhomogeneity on thedrop-spectrum broadening. Quart. J. Roy. Meteor. Soc., 123,165–186.
——, and ——, 1997b: Turbulence effect on the collision kernel. I:Formation of velocity deviations of drops falling within aturbulent three-dimensional flow. Quart. J. Roy. Meteor.Soc., 123, 1517–1542.
——, and ——, 1997c: Turbulence effects on droplet growth andsize distribution in clouds—A review. J. Aerosol Sci., 28,1177–1214.
——, and ——, 2001: Fine structure of cloud droplet concentra-tion as seen from the Fast-FSSP measurements. Part I:Method of analysis and preliminary results. J. Appl. Meteor.,40, 1515–1537.
——, ——, and M. Shapiro, 1999: Collisions of small drops in aturbulent flow. Part I: Collision efficiency. Problem formula-tion and preliminary results. J. Atmos. Sci., 56, 2585–2600.
——, ——, and ——, 2000: Stochastic effects of cloud droplethydrodynamic interaction in a turbulent flow. Atmos. Res.,53, 131–169.
Pruppacher, H. R., and J. D. Klett, 1997. Microphysics of Cloudsand Precipitation. 2d ed. Kluwer Academic, 954 pp.
Reade, W. C., and L. R. Collins, 2000: Effect of preferential con-centration on turbulent collision rates. Phys. Fluids, 12, 2530–2540.
Rogers, R. R., and M. K. Yau, 1989. A Short Course in CloudPhysics. 3d ed. Butterworth-Heinemann, 290 pp.
Saffman, P. G., and J. S. Turner, 1956: On the collision of drops inturbulent clouds. J. Fluid Mech., 1, 16–30.
Shaw, R. A., 2000: Supersaturation intermittency in turbulentclouds. J. Atmos. Sci., 57, 3452–3456.
——, 2003: Particle–turbulence interactions in atmosphericclouds. Annu. Rev. Fluid Mech., 35, 183–227.
Squires, K. D., and J. K. Eaton, 1991: Preferential concentrationof particles by turbulence. Phys. Fluids, A3, 1169–1179.
Sundaram, S., and L. R. Collins, 1996: Numerical considerationsin simulating a turbulent suspension of finite-volume par-ticles. J. Comput. Phys., 124, 337–350.
——, and ——, 1997: Collision statistics in an isotropic, particle-laden turbulent suspension. I. Direct numerical simulations.J. Fluid Mech., 335, 75–110.
Vaillancourt, P. A., and M. K. Yau, 2000: Review of particle–turbulence interactions and consequences for cloud physics.Bull. Amer. Meteor. Soc., 81, 285–298.
——, ——, P. Bartello, and W. W. Grabowski, 2002: Microscopicapproach to cloud droplet growth by condensation. Part II:Turbulence, clustering and condensational growth. J. Atmos.Sci., 59, 3421–3435.
Vohl, O., S. K. Mitra, S. C. Wurzler, and H. R. Pruppacher, 1999:A wind tunnel study of the effects of turbulence on thegrowth of cloud drops by collision and coalescence. J. Atmos.Sci., 56, 4088–4099.
Wang, L.-P., and M. R. Maxey, 1993: Settling velocity and con-
1974 J O U R N A L O F T H E A T M O S P H E R I C S C I E N C E S VOLUME 62

centration distribution of heavy particles in homogeneousisotropic turbulence. J. Fluid Mech., 335, 27–68.
——, A. S. Wexler, and Y. Zhou, 1998: Statistical mechanicaldescription of turbulent coagulation. Phys. Fluids, 10, 2647–2651.
——, ——, and ——, 2000: Statistical mechanical description andmodelling of turbulent collision of inertial particles. J. FluidMech., 415, 117–153.
Warner, J., 1969: The microstructure of cumulus cloud. Part I.General features of the droplet spectrum. J. Atmos. Sci., 26,1049–1065.
Williams, J. J. E., and R. I. Crane, 1983: Particle collision rate inturbulent flow. Int. J. Multiphase Flow, 9, 421–435.
Woods, J. D., P. Goldsmith, and J. C. Drake, 1972: Coalescence ina turbulent cloud. Quart. J. Roy. Meteor. Soc., 98, 135–149.
Yin, Y., Z. Levin, T. Reisin, and S. Tzivion, 2000: The effects ofgiant cloud condensation nuclei on the development of pre-cipitation in convective clouds: A numerical study. Atmos.Res., 53, 91–116.
Zhou, Y., A. S. Wexler, and L.-P. Wang, 2001: Modelling turbu-lent collision of bidisperse inertial particles. J. Fluid Mech.,433, 77–104.
JUNE 2005 R I E M E R A N D W E X L E R 1975