

Driving Supply Chain Inventory Reduction via Strategic ... BK - Driving Supply... · Driving Supply...
30
Driving Supply Chain Inventory Reduction via Strategic Analysis & Robust Management Process Boon Kit, Straits SNO Leader
Transcript of Driving Supply Chain Inventory Reduction via Strategic ... BK - Driving Supply... · Driving Supply...
Driving Supply Chain Inventory Reduction via Strategic Analysis &
Robust Management Process
Boon Kit, Straits SNO Leader
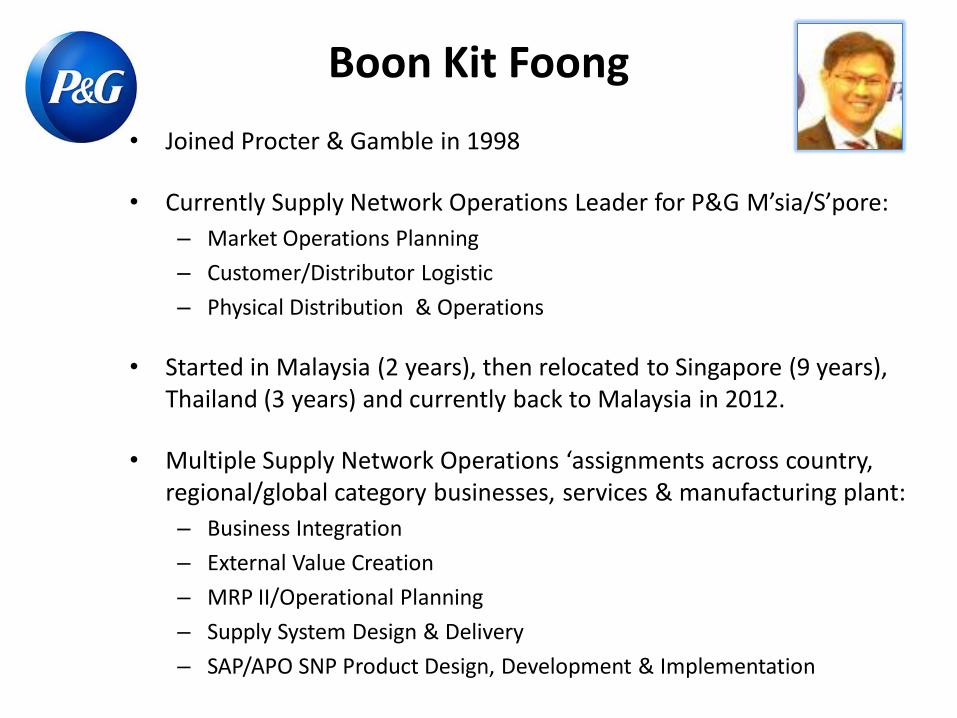
Boon Kit Foong
• Joined Procter & Gamble in 1998
• Currently Supply Network Operations Leader for P&G M’sia/S’pore:
– Market Operations Planning
– Customer/Distributor Logistic
– Physical Distribution & Operations
• Started in Malaysia (2 years), then relocated to Singapore (9 years), Thailand (3 years) and currently back to Malaysia in 2012.
• Multiple Supply Network Operations ‘assignments across country, regional/global category businesses, services & manufacturing plant:
– Business Integration
– External Value Creation
– MRP II/Operational Planning
– Supply System Design & Delivery
– SAP/APO SNP Product Design, Development & Implementation

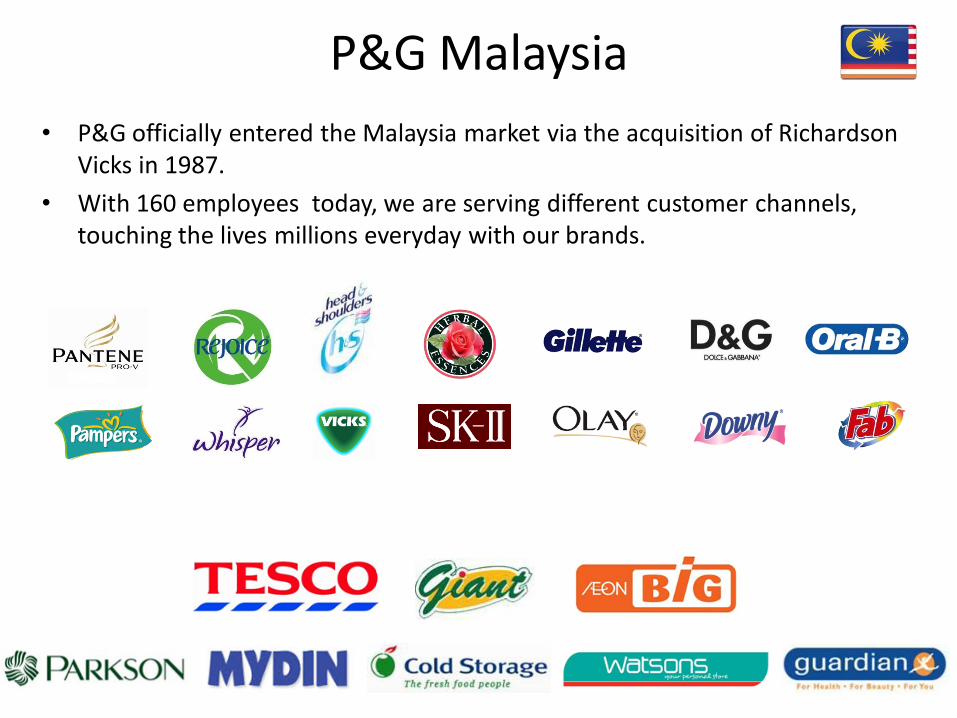
P&G Malaysia
• P&G officially entered the Malaysia market via the acquisition of Richardson Vicks in 1987.
• With 160 employees today, we are serving different customer channels, touching the lives millions everyday with our brands.
Driving Supply Chain Inventory Reduction via Strategic Analysis & Robust Management Process
• Supply Chain and Inventory
• Strategic Inventory Analysis
• Robust UPI Management Process
Supply Chain and Inventory
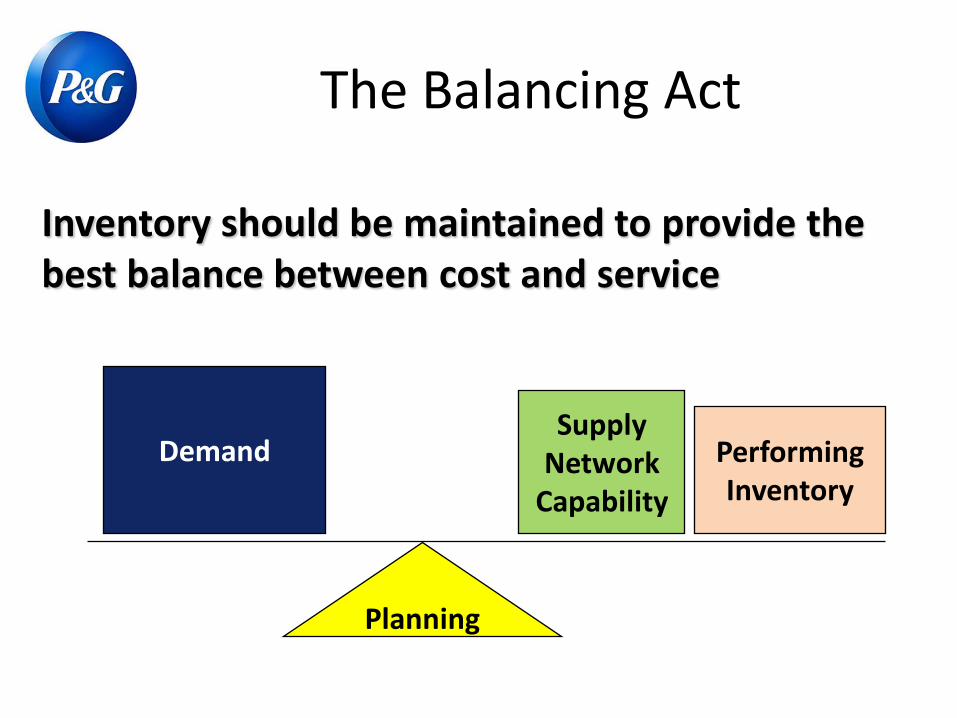
The Balancing Act
Inventory should be maintained to provide the best balance between cost and service
Demand Supply
Network Capability
Performing Inventory
Planning
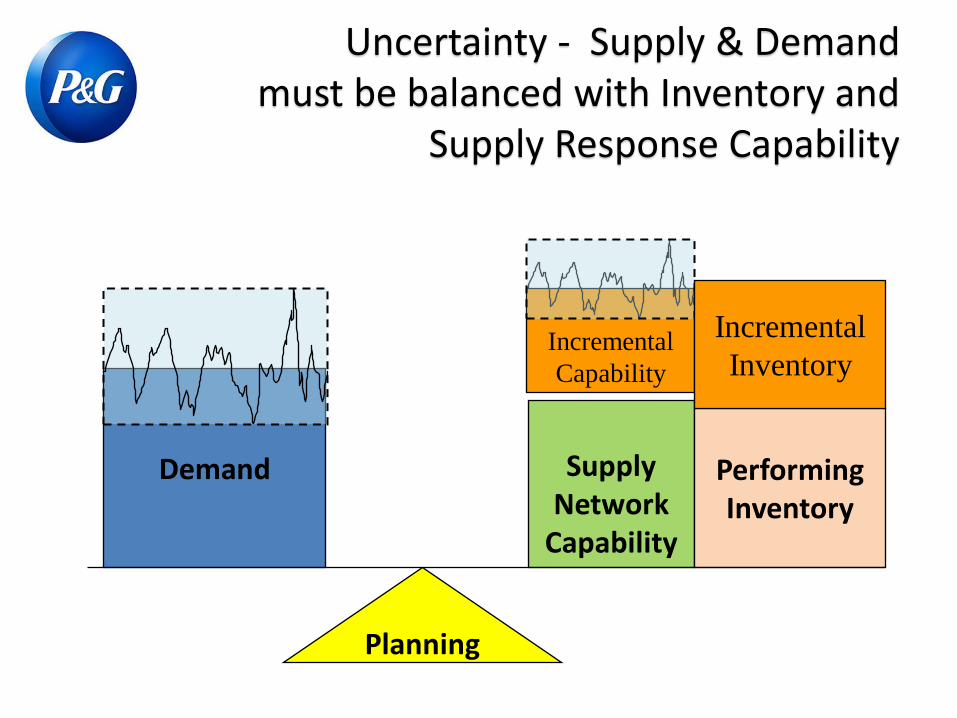
Uncertainty - Supply & Demand must be balanced with Inventory and
Supply Response Capability
Incremental
Capability
Demand
Supply
Network Capability
Performing Inventory
Planning
Incremental
Inventory
How do we reduce Inventory?
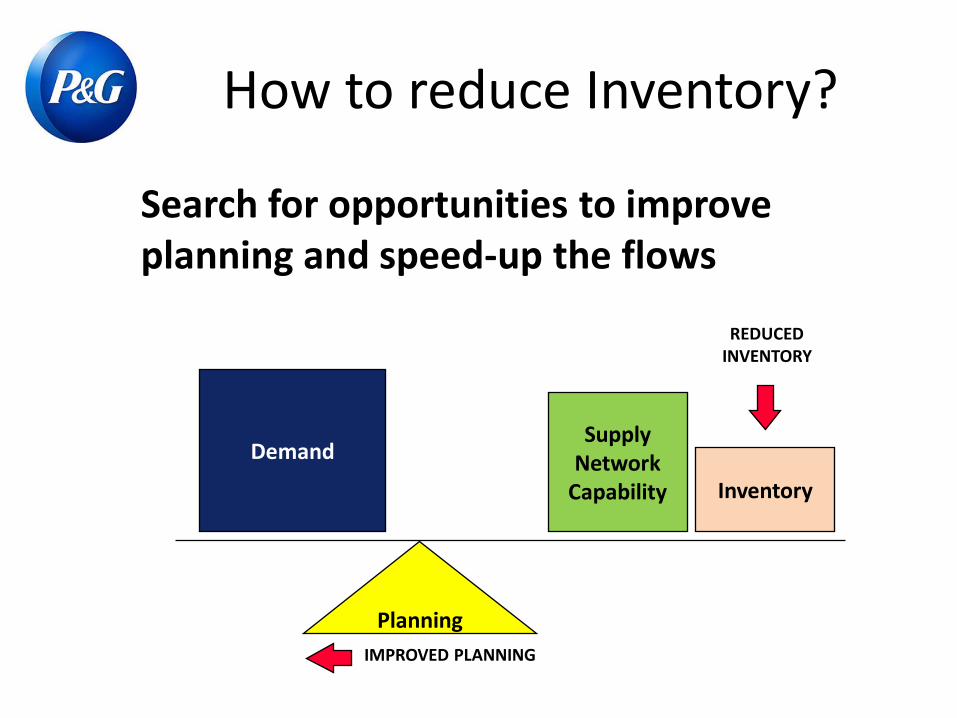
How to reduce Inventory?
Search for opportunities to improve planning and speed-up the flows
Demand Supply
Network Capability Inventory
Planning
IMPROVED PLANNING
REDUCED INVENTORY
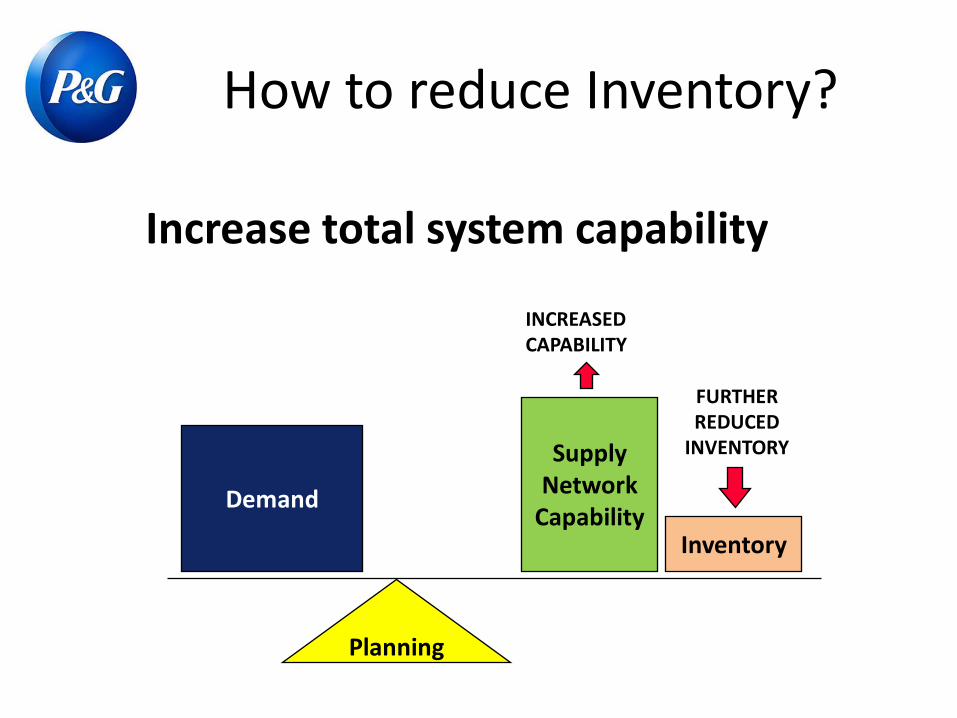
How to reduce Inventory?
Increase total system capability
Demand
Supply Network
Capability Inventory
Planning
FURTHER REDUCED
INVENTORY
INCREASED CAPABILITY
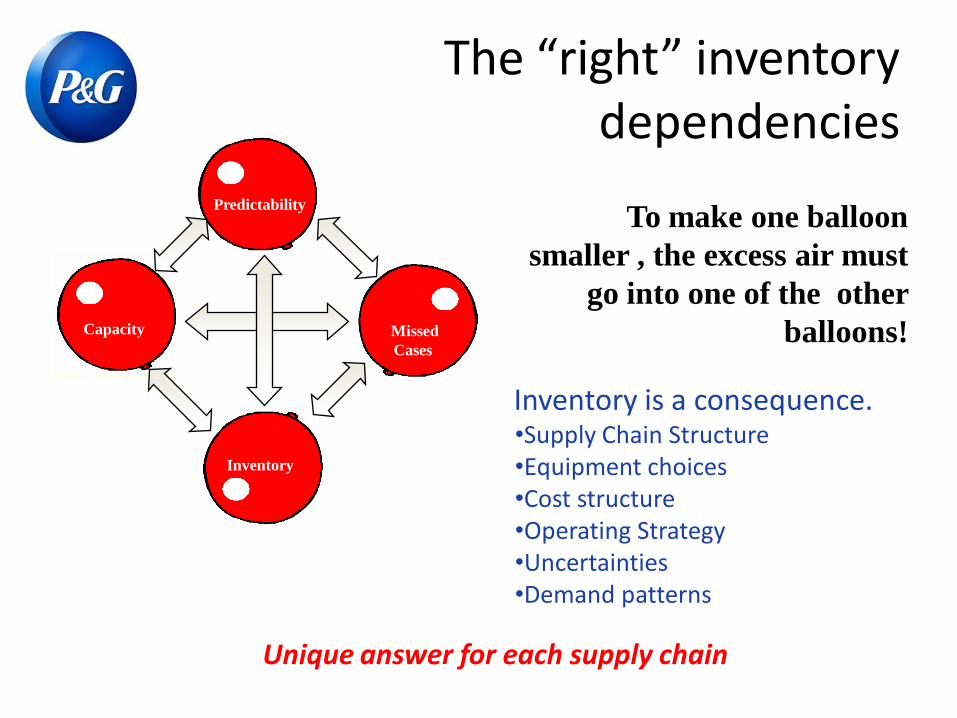
The “right” inventory dependencies
Missed
Cases
Inventory
Capacity
Predictability To make one balloon
smaller , the excess air must
go into one of the other
balloons!
Inventory is a consequence. •Supply Chain Structure •Equipment choices •Cost structure •Operating Strategy •Uncertainties •Demand patterns
Unique answer for each supply chain
Strategic Inventory Analysis
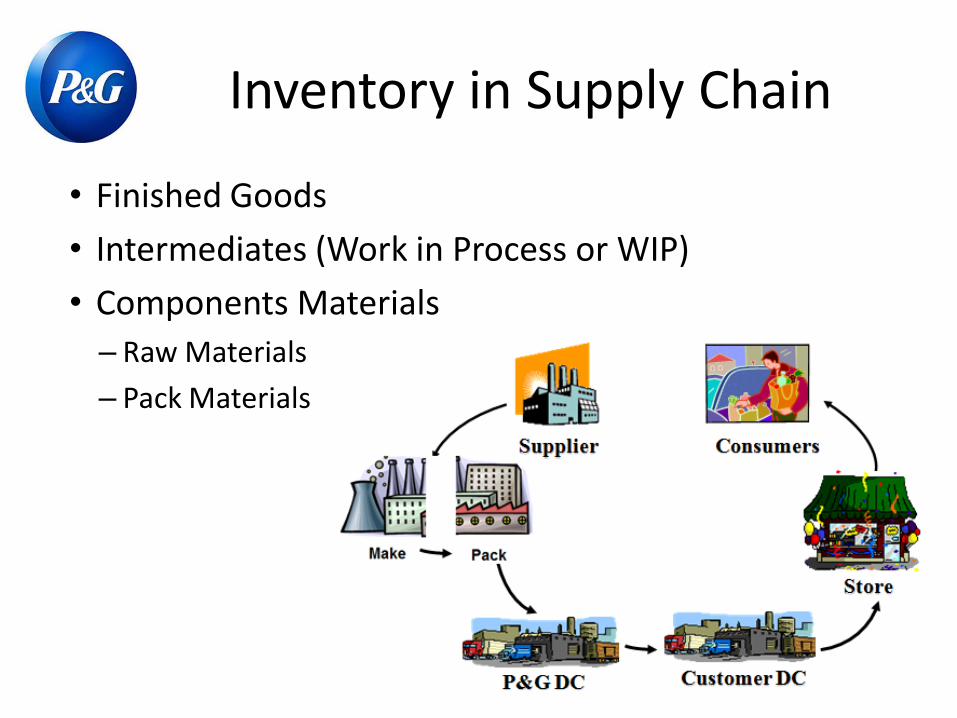
Inventory in Supply Chain
• Finished Goods
• Intermediates (Work in Process or WIP)
• Components Materials
– Raw Materials
– Pack Materials
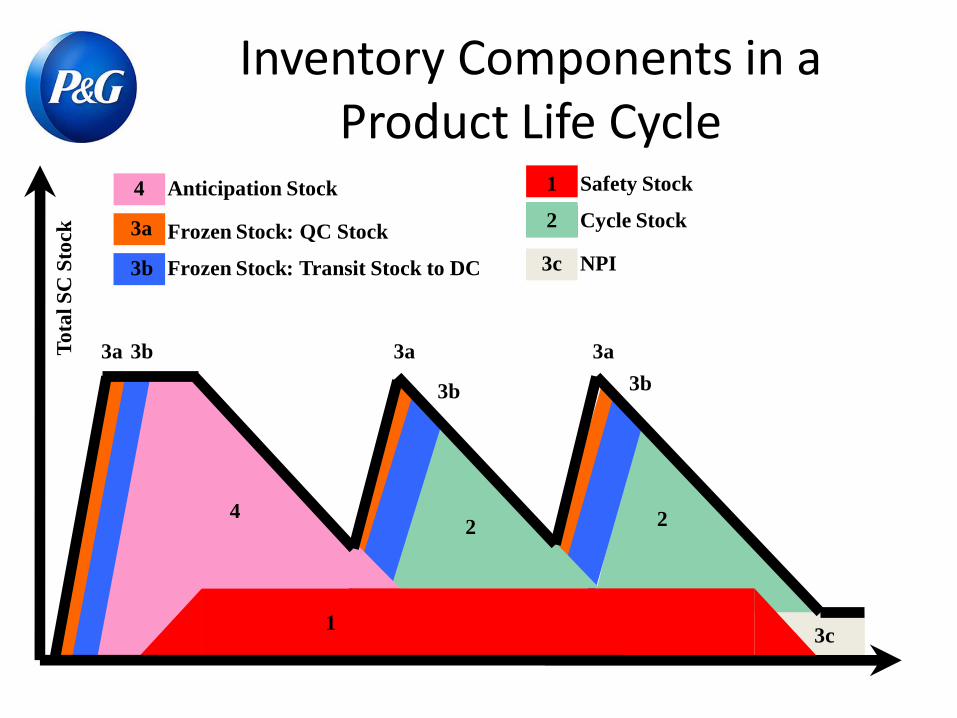
Inventory Components in a Product Life Cycle
Anticipation Stock 4
4
Frozen Stock: QC Stock
3a
3a
Frozen Stock: Transit Stock to DC 3b
3b
Safety Stock 1
1
To
tal S
C S
tock
Cycle Stock 2
2 2
3a 3a
3b 3b
NPI 3c
3c
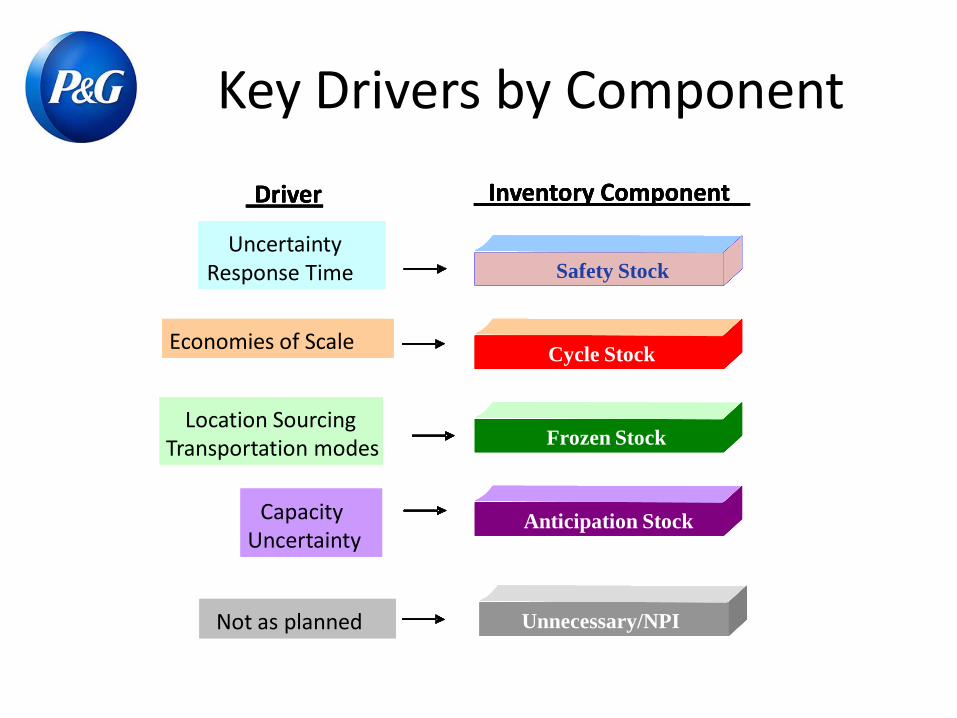
Key Drivers by Component
Not as planned
Uncertainty
Response Time
Economies of Scale
Location Sourcing
Capacity
Uncertainty
Driver
Safety Stock
Unnecessary/NPI
Cycle Stock
Frozen Stock
Anticipation Stock
Inventory Component
Not as planned
Uncertainty
Response Time
Economies of Scale
Location Sourcing
Capacity
Uncertainty
Driver
Not as planned
Uncertainty
Response Time
Economies of Scale
Location Sourcing
Transportation modes
Capacity
Uncertainty
Driver
Safety Stock
Unnecessary/NPI
Cycle Stock
Frozen Stock
Anticipation Stock
Inventory Component
Safety Stock
Unnecessary/NPI
Cycle Stock
Frozen Stock
Anticipation Stock
Inventory Component
Safety Stock Safety Stock
Unnecessary/NPI Unnecessary/NPI
Cycle Stock Cycle Stock
Inventory by Function
• Performing Inventory
• Unproductive Inventory (UPI)
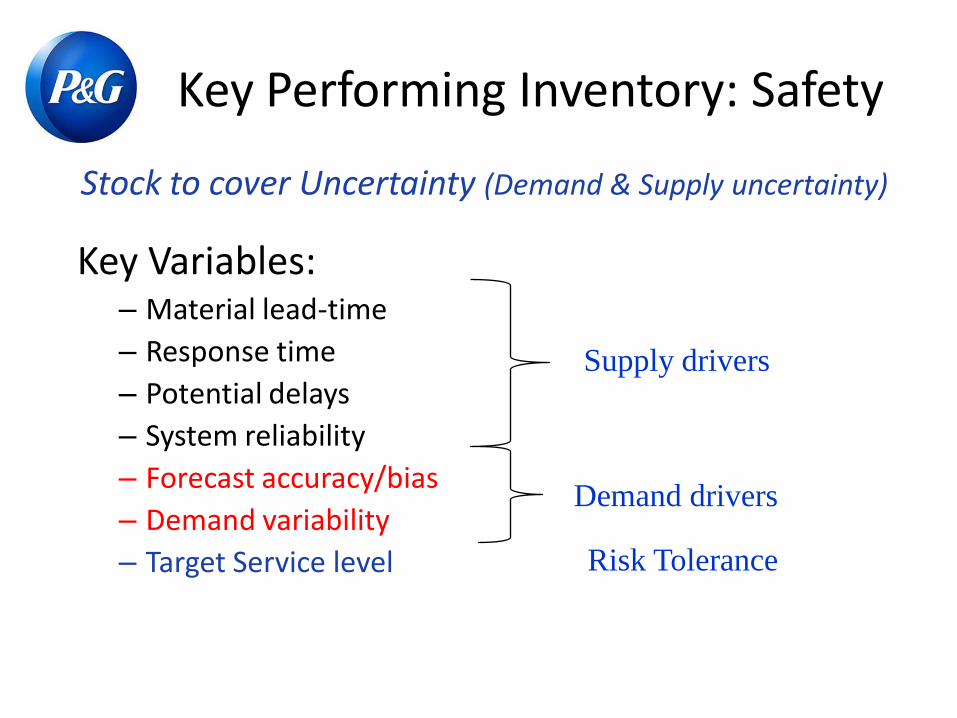
Key Performing Inventory: Safety
Stock to cover Uncertainty (Demand & Supply uncertainty)
Key Variables: – Material lead-time
– Response time
– Potential delays
– System reliability
– Forecast accuracy/bias
– Demand variability
– Target Service level
Supply drivers
Demand drivers
Risk Tolerance
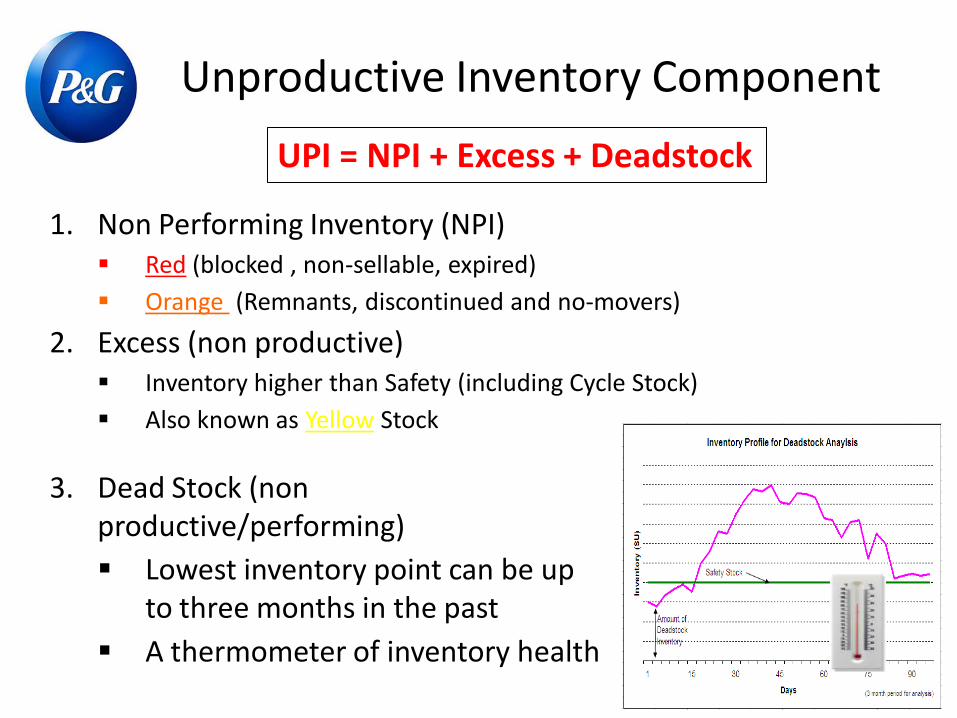
Unproductive Inventory Component
1. Non Performing Inventory (NPI) Red (blocked , non-sellable, expired)
Orange (Remnants, discontinued and no-movers)
2. Excess (non productive) Inventory higher than Safety (including Cycle Stock)
Also known as Yellow Stock
UPI = NPI + Excess + Deadstock
3. Dead Stock (non productive/performing)
Lowest inventory point can be up to three months in the past
A thermometer of inventory health
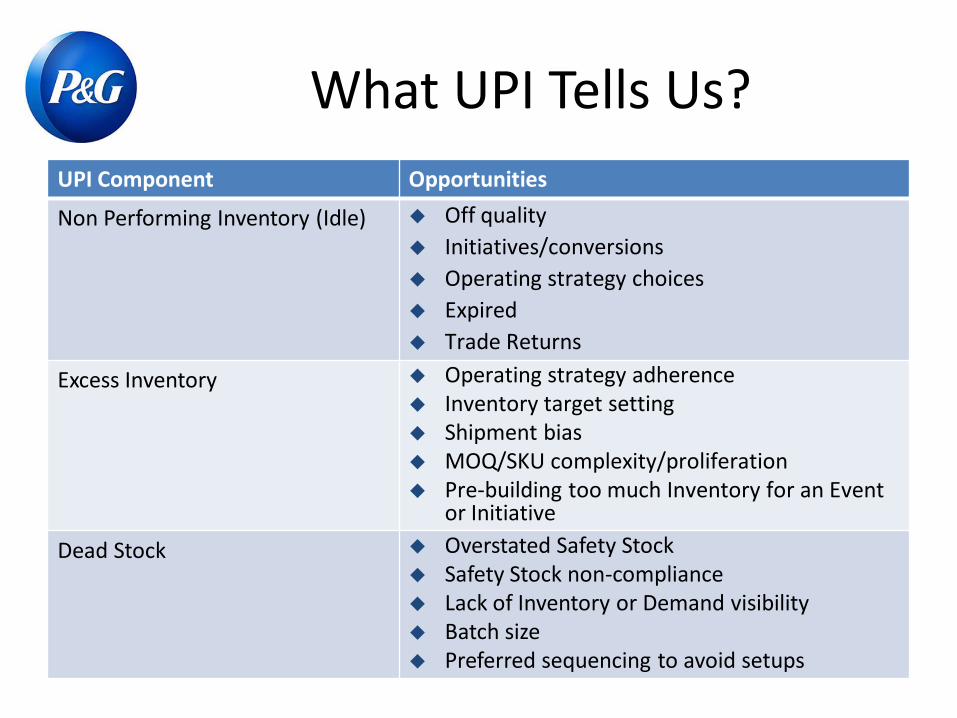
What UPI Tells Us?
UPI Component Opportunities
Non Performing Inventory (Idle) Off quality
Initiatives/conversions
Operating strategy choices
Expired
Trade Returns
Excess Inventory Operating strategy adherence Inventory target setting Shipment bias MOQ/SKU complexity/proliferation Pre-building too much Inventory for an Event
or Initiative
Dead Stock Overstated Safety Stock Safety Stock non-compliance Lack of Inventory or Demand visibility Batch size Preferred sequencing to avoid setups
Robust UPI Management Process
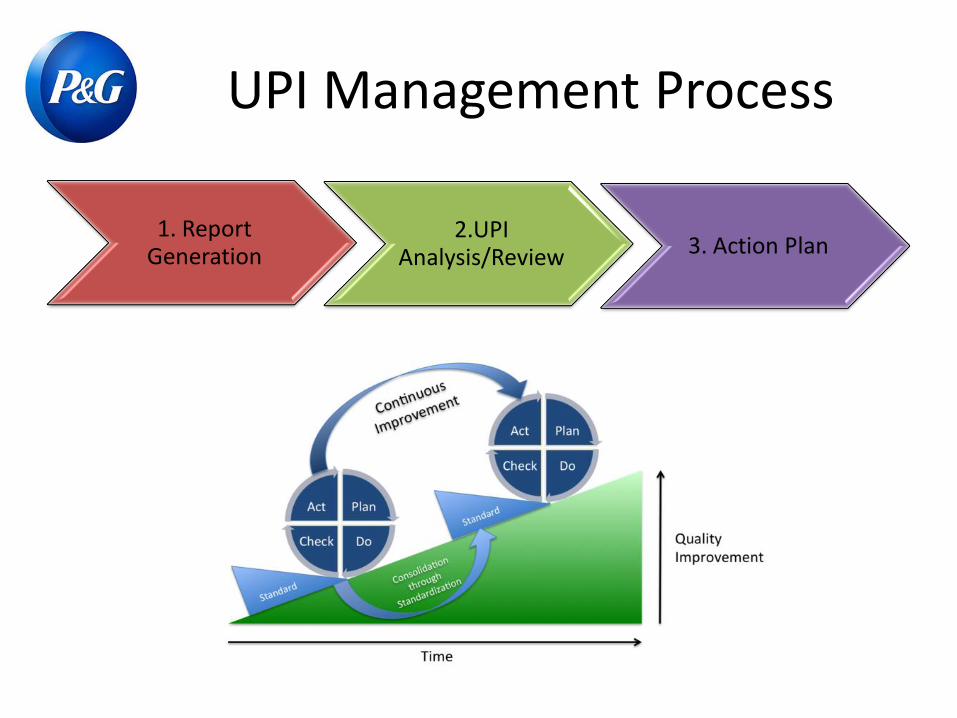
UPI Management Process
1. Report
Generation 2.UPI
Analysis/Review 3. Action Plan
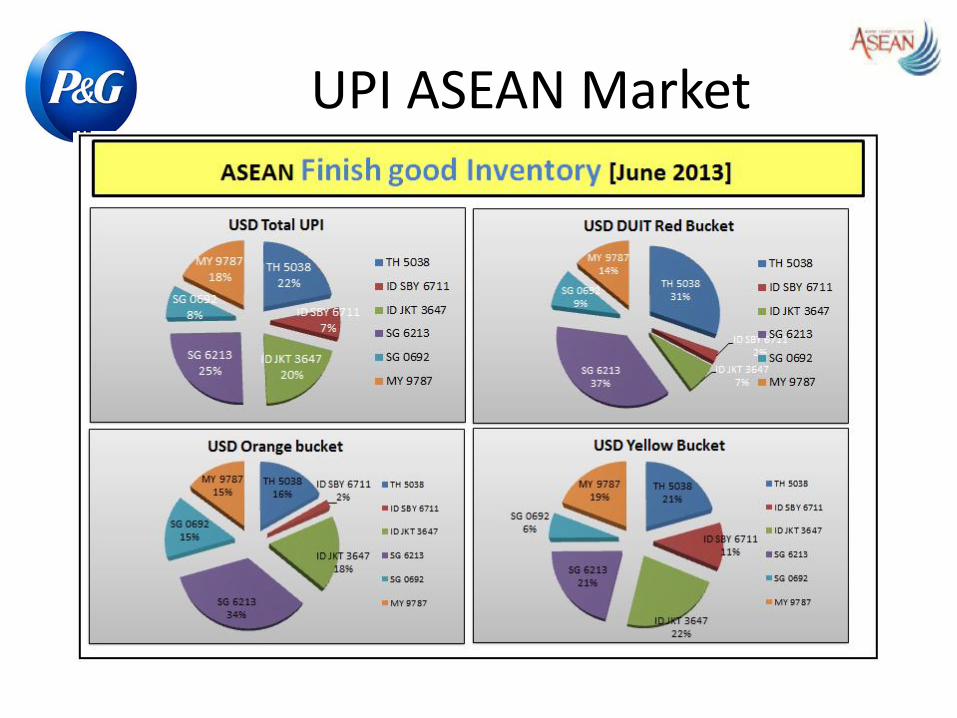
UPI ASEAN Market
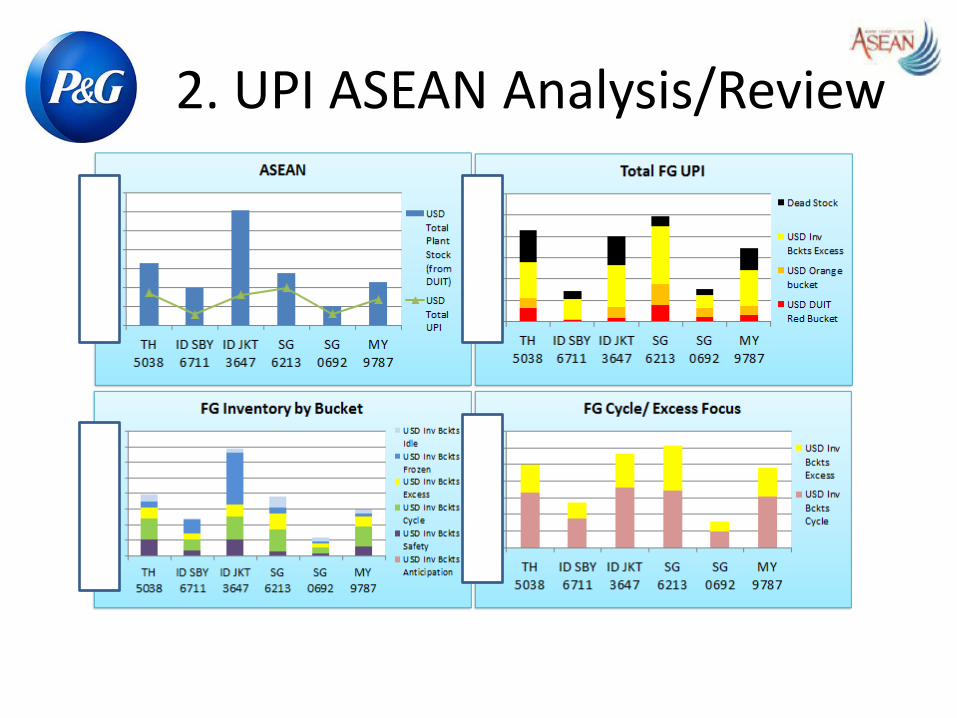
2. UPI ASEAN Analysis/Review
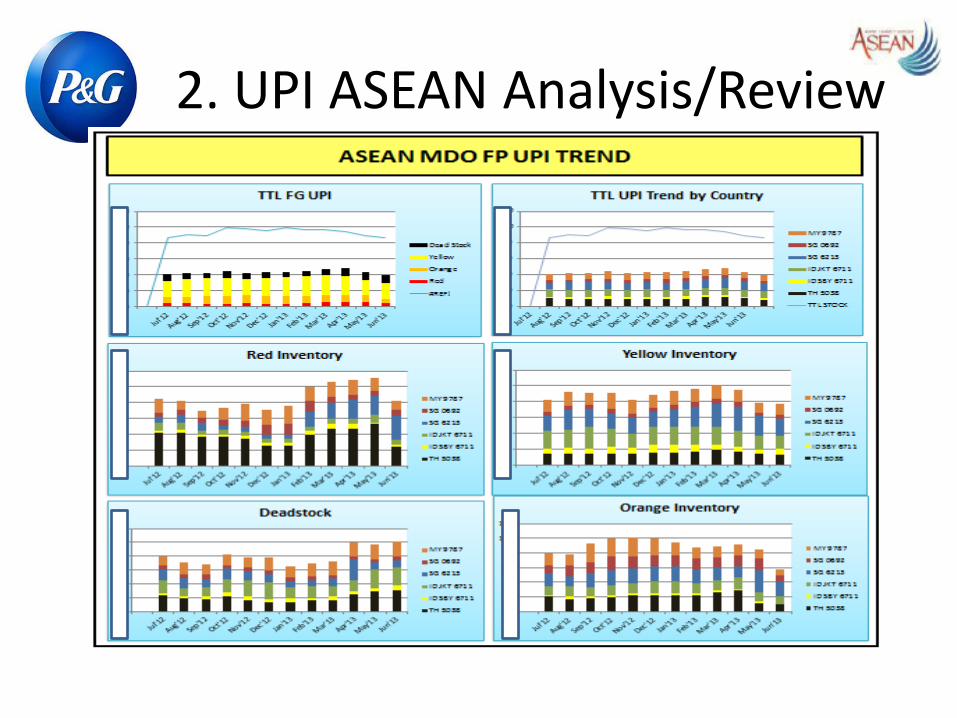
2. UPI ASEAN Analysis/Review
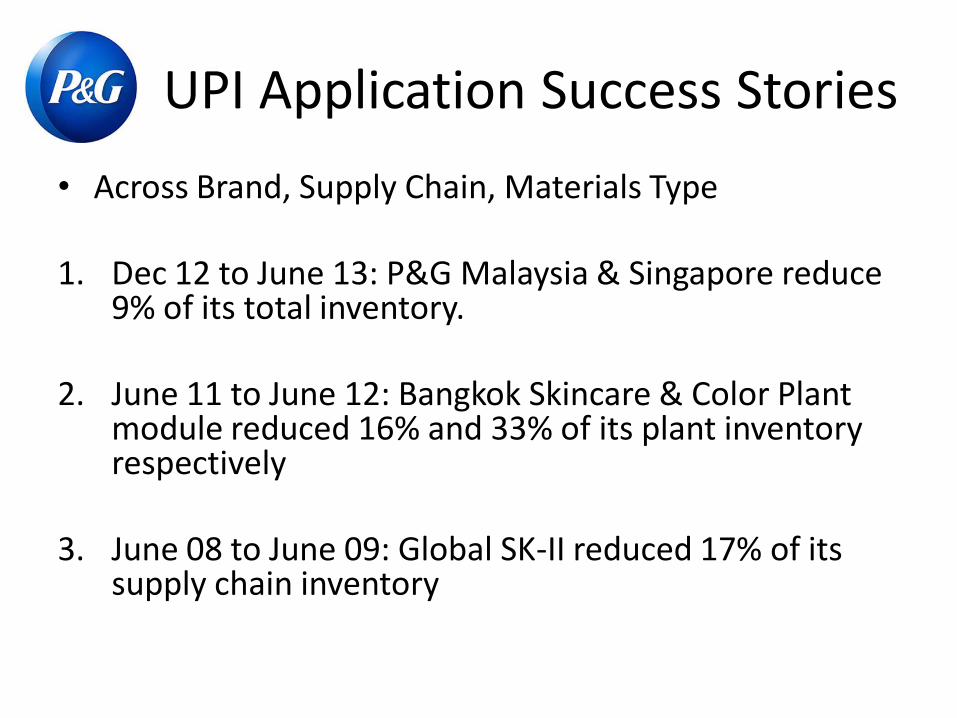
UPI Application Success Stories
• Across Brand, Supply Chain, Materials Type
1. Dec 12 to June 13: P&G Malaysia & Singapore reduce 9% of its total inventory.
2. June 11 to June 12: Bangkok Skincare & Color Plant module reduced 16% and 33% of its plant inventory respectively
3. June 08 to June 09: Global SK-II reduced 17% of its supply chain inventory
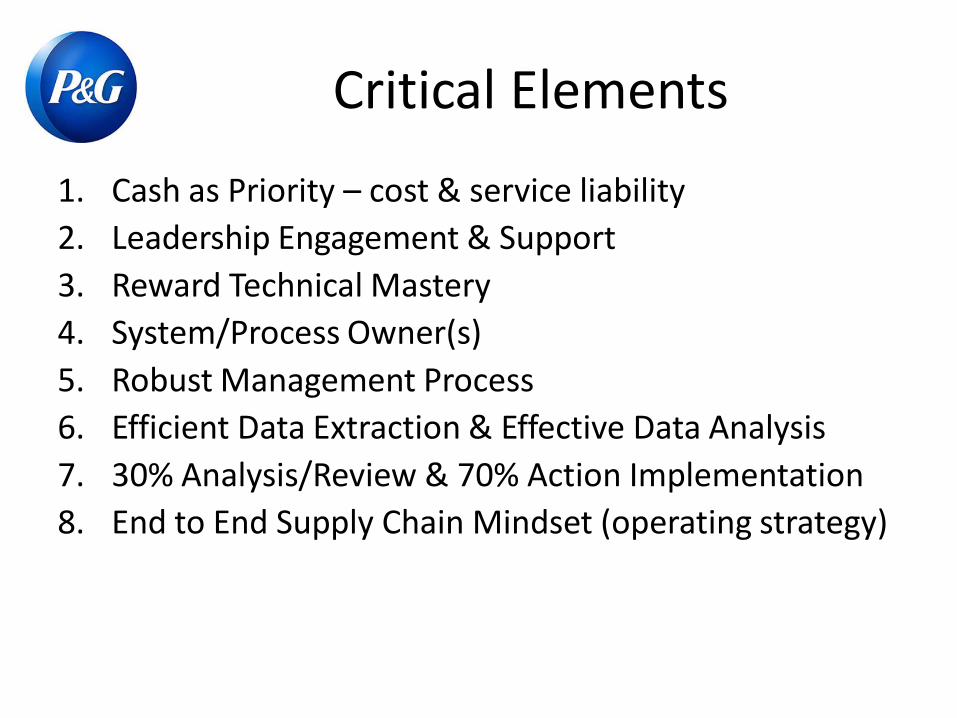
Critical Elements
1. Cash as Priority – cost & service liability
2. Leadership Engagement & Support
3. Reward Technical Mastery
4. System/Process Owner(s)
5. Robust Management Process
6. Efficient Data Extraction & Effective Data Analysis
7. 30% Analysis/Review & 70% Action Implementation
8. End to End Supply Chain Mindset (operating strategy)


![AN INTEGRATED SUPPLY CHAIN INVENTORY MODEL WITH … · H. J. Lin / An Integrated Supply Chain Inventory Model 89 [1,5,17,29,35,40,44,46], and others. Though, the aforementioned inventory](https://static.fdocuments.us/doc/165x107/5e768281c0901962624af760/an-integrated-supply-chain-inventory-model-with-h-j-lin-an-integrated-supply.jpg)