Driving Growth and Shareholder Returns
151
Slide 1 – Capital Markets Day 2016 – 10 November 2016 Driving Growth and Shareholder Returns Dr Bernd Scheifele, Group CEO HeidelbergCement Capital Markets Day London, 10 November 2016
Transcript of Driving Growth and Shareholder Returns

Slide 1 – Capital Markets Day 2016 – 10 November 2016
Driving Growth and Shareholder Returns
Dr Bernd Scheifele, Group CEO
HeidelbergCement Capital Markets Day
London, 10 November 2016

Slide 2 – Capital Markets Day 2016 – 10 November 2016
Disclaimer
This presentation contains forward-looking statements and information. Forward-looking statements and information are
statements that are not historical facts, related to future, not past, events. They include statements about our beliefs and
expectations and the underlying assumptions. These statements and information are based on plans, estimates,
projections as they are currently available to the management of HeidelbergCement. Forward-looking statements and
information therefore speak only as of the date they are made, and we undertake no obligation to update publicly any of
them in light of new information or future events.
By their very nature, forward-looking statements and information are subject to certain risks and uncertainties. A variety
of factors, many of which are beyond HeidelbergCements’ control, could cause actual results to differ materially from
those that may be expressed or implied by such forward-looking statement or information. For HeidelbergCement
particular uncertainties arise, among others, from changes in general economic and business conditions in Germany, in
Europe, in the United States and elsewhere from which we derive a substantial portion of our revenues and in which we
hold a substantial portion of our assets; the possibility that prices will decline to a greater extent than currently
anticipated by HeidelbergCements’ management as a result of continued adverse market conditions; developments in
the financial markets, including fluctuations in interest and exchange rates, commodity and equity prices, debt prices
(credit spreads) and financial assets generally; continued volatility and a further deterioration of capital markets; a
worsening in the conditions of the credit business and, in particular, additional uncertainties arising out of the subprime
financial market and liquidity crisis; the outcome of pending investigations and legal proceedings and actions resulting
from the findings of these investigations; as well as various other factors. Should one or more of these risks or
uncertainties materialize, or should underlying assumptions prove incorrect, actual results may vary materially from
those described in the relevant forward-looking statement or information as expected, anticipated, intended, planned,
believed, sought, estimated or projected.
Unless indicated otherwise, the financial information provided herein has been prepared under International Financial
Reporting Standards (IFRS).
Slide 3 – Capital Markets Day 2016 – 10 November 2016
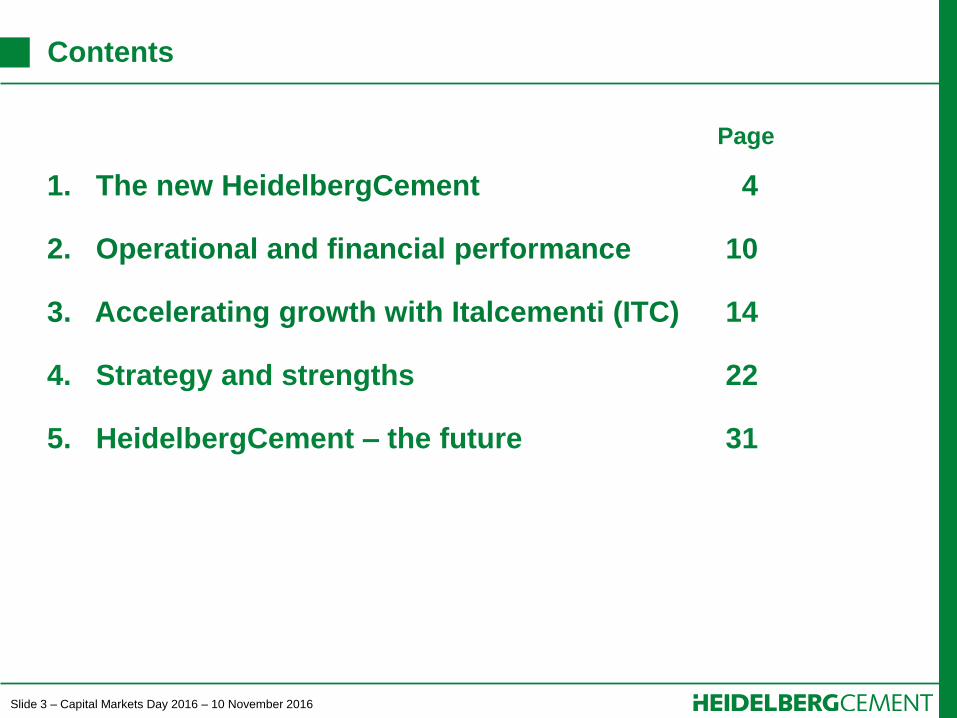
Contents
Page
1. The new HeidelbergCement 4
2. Operational and financial performance 10
3. Accelerating growth with Italcementi (ITC) 14
4. Strategy and strengths 22
5. HeidelbergCement – the future 31

Slide 4 – Capital Markets Day 2016 – 10 November 2016
Contents
Page
1. The new HeidelbergCement 4
2. Operational and financial performance 10
3. Accelerating growth with Italcementi (ITC) 14
4. Strategy and strengths 22
5. HeidelbergCement – the future 31

Slide 5 – Capital Markets Day 2016 – 10 November 2016
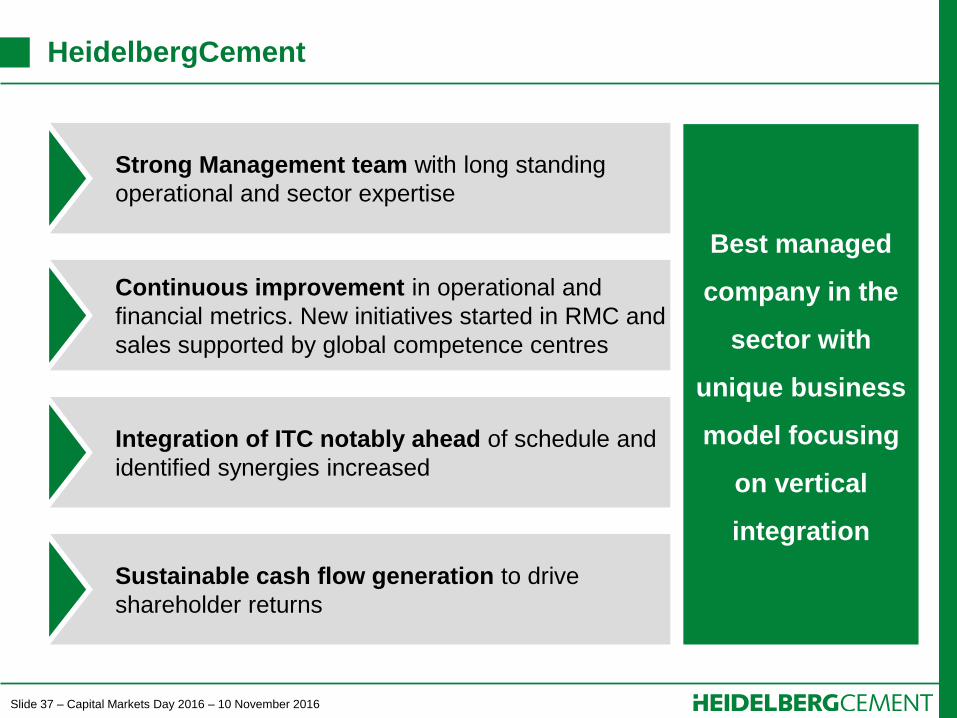
HeidelbergCement
Strong Management team with long standing
operational and sector expertise
Continuous improvement in operational and
financial metrics. New initiatives started in RMC and
sales supported by global competence centres
Sustainable cash flow generation to drive
shareholder returns
Best managed
company in the
sector with
unique business
model focusing
on vertical
integration
Integration of ITC notably ahead of schedule and
identified synergies increased

Slide 6 – Capital Markets Day 2016 – 10 November 2016
The new HeidelbergCement Group
Global:
#1 in Aggregates
#2 in Cement
#3 in Ready-mix concrete
One of the biggest global
trading services
Leading vertically
integrated player
€bn >17 Revenue1 and
€bn >3 EBITDA1
1st company in the sector
earning premium on WACC
1) Proforma 2015
Global/local centres of
excellence for all three core
business lines
Slide 7 – Capital Markets Day 2016 – 10 November 2016
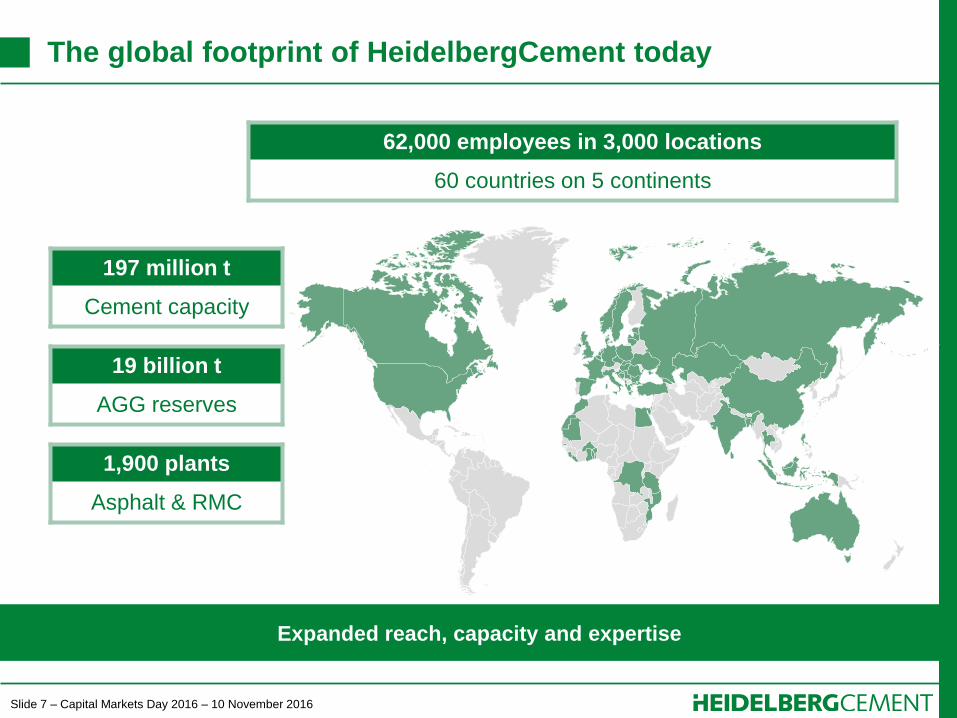
The global footprint of HeidelbergCement today
Expanded reach, capacity and expertise
197 million t
Cement capacity
19 billion t
AGG reserves
1,900 plants
Asphalt & RMC
62,000 employees in 3,000 locations
60 countries on 5 continents

Slide 8 – Capital Markets Day 2016 – 10 November 2016
New management: Combined 130 years of industry expertise
– Dual responsibilities: Region and Group function
Dr Bernd Scheifele
CEO
Strategy and Development
Group HR
Comm. & IR
Legal
Compliance
Internal Audit
since 2005
Dr Lorenz Näger
CFO
since 2004
Dr Dominik von Achten
Western & Southern Europe (Deputy Chairman)
Industry 4.0
Competence Center Materials
since 2007
Dr Albert Scheuer
Northern and Eastern Europe-Central Asia
Heidelberg Technology Center Cement
R&D/Product Innovation
Environmental Sustainability
since 1992
Kevin Gluskie
Asia-Pacific
Competence Center Readymix
Market Intelligence & Sales Processes
Product Marketing
since 1990 (through Pioneer and Hanson)
since 1992 (through Akcansa)
Jon Morrish
North America
Secondary cementitious materials
since 1999 (through Hanson)
Hakan Gurdal
Africa-Eastern Mediterranean Basin
Member of the HC Managing Board since 1 February 2016
Purchasing Reporting & Controlling
Corporate Finance
Tax
Treasury
IT
Insurance & Risk Management
Shared Service Center
Logistics
With HC Group
Slide 9 – Capital Markets Day 2016 – 10 November 2016
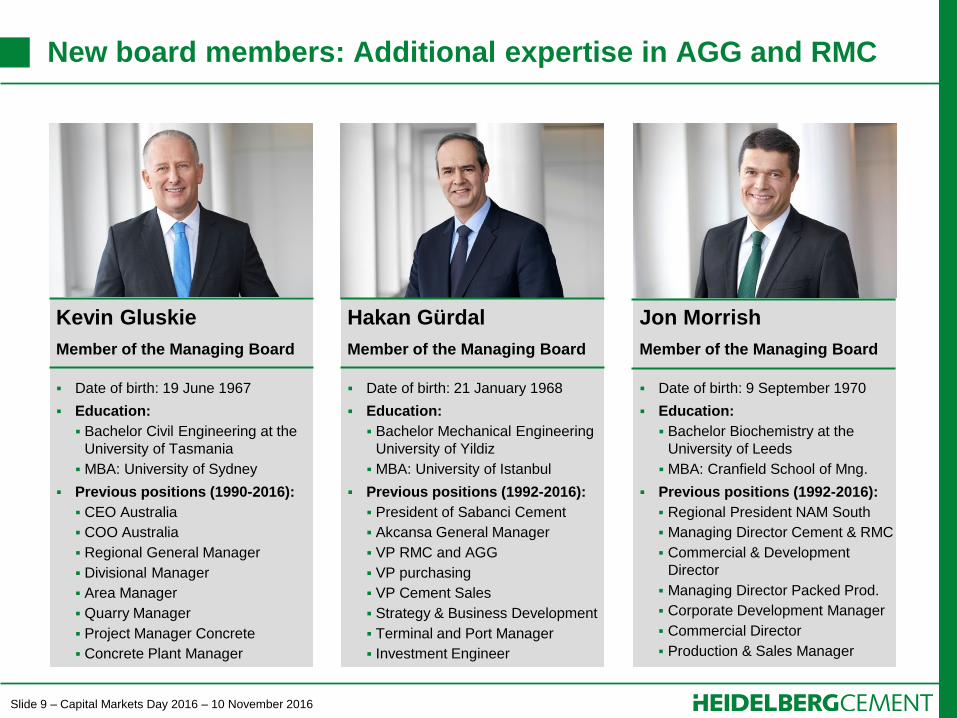
Hakan Gürdal
Member of the Managing Board
Date of birth: 21 January 1968
Education:
Bachelor Mechanical Engineering
University of Yildiz
MBA: University of Istanbul
Previous positions (1992-2016):
President of Sabanci Cement
Akcansa General Manager
VP RMC and AGG
VP purchasing
VP Cement Sales
Strategy & Business Development
Terminal and Port Manager
Investment Engineer
Jon Morrish
Member of the Managing Board
Date of birth: 9 September 1970
Education:
Bachelor Biochemistry at the
University of Leeds
MBA: Cranfield School of Mng.
Previous positions (1992-2016):
Regional President NAM South
Managing Director Cement & RMC
Commercial & Development
Director
Managing Director Packed Prod.
Corporate Development Manager
Commercial Director
Production & Sales Manager
New board members: Additional expertise in AGG and RMC
Kevin Gluskie
Member of the Managing Board
Date of birth: 19 June 1967
Education:
Bachelor Civil Engineering at the
University of Tasmania
MBA: University of Sydney
Previous positions (1990-2016):
CEO Australia
COO Australia
Regional General Manager
Divisional Manager
Area Manager
Quarry Manager
Project Manager Concrete
Concrete Plant Manager
Slide 10 – Capital Markets Day 2016 – 10 November 2016
Contents
Page
1. The new HeidelbergCement 4
2. Operational and financial performance 10
3. Accelerating growth with Italcementi (ITC) 14
4. Strategy and strengths 22
5. HeidelbergCement – the future 31

Slide 11 – Capital Markets Day 2016 – 10 November 2016
The past 18 months: Delivering on our strategy
Cost leadership
Competence centres (CEM, AGG, RMC) drive
Group-wide efficiency through global programs
Higher EBITDA and margin leading to increased
cash flow generation
Optimal geographic footprint
Superior global footprint further expanded by
ITC sites
Strong presence in growing urban centres
Vertical integration
Asset and process integration successfully
accomplished
Business integration well underway with
significant margin potential
Operating leverage
Capitalizing on recovery in mature markets
Tapping into emerging markets’ growth
momentum

Slide 12 – Capital Markets Day 2016 – 10 November 2016
Continuous improvement of financial metrics and returns
Jun 16
2,673
Mar 16
2,634
Dec 15
2,613
Sep 15
2,541
Jun 15
2,479
5,865
Mar 16
5,890
Dec 15
5,286
Sep 15
5,970
Jun 15
6,331
Jun 16
910811838
Jun 16
1,169
Mar 16
1,039
Dec 15 Sep 15 Jun 15
Earned premium on WACC
Share buyback approval obtained
Dividend increased
Continuous margin improvement and
increase in cash flow generation
Financial cost significantly reduced
EBITDA (LTM) in €m
Free cash flow1 (LTM) in €m
Net Debt in €m
1) Before growth Capex and disposals (incl. cash flow from discontinued operations)

Slide 13 – Capital Markets Day 2016 – 10 November 2016
Creating value and earning cost of capital
After the ITC acquisition, HC is still earning a premium on the cost of capital
3
4
5
6
7
8
9
10
11
2009 2010 2011 2012 2013 2014 2015 2016 2017 2018 2019
3.3
5.6 5.81
5.0
6.71
7.2
6.11
ROIC
in %
Before ITC acquisition After ITC acquisition
Reduction of WACC
after ITC acquisition
1) Adjusted for exceptional items
WACC: 6.9%
ROIC above
WACC
by end of 2016

Slide 14 – Capital Markets Day 2016 – 10 November 2016
Contents
Page
1. The new HeidelbergCement 4
2. Operational and financial performance 10
3. Accelerating growth with Italcementi (ITC) 14
4. Strategy and strengths 22
5. HeidelbergCement – the future 31
Slide 15 – Capital Markets Day 2016 – 10 November 2016
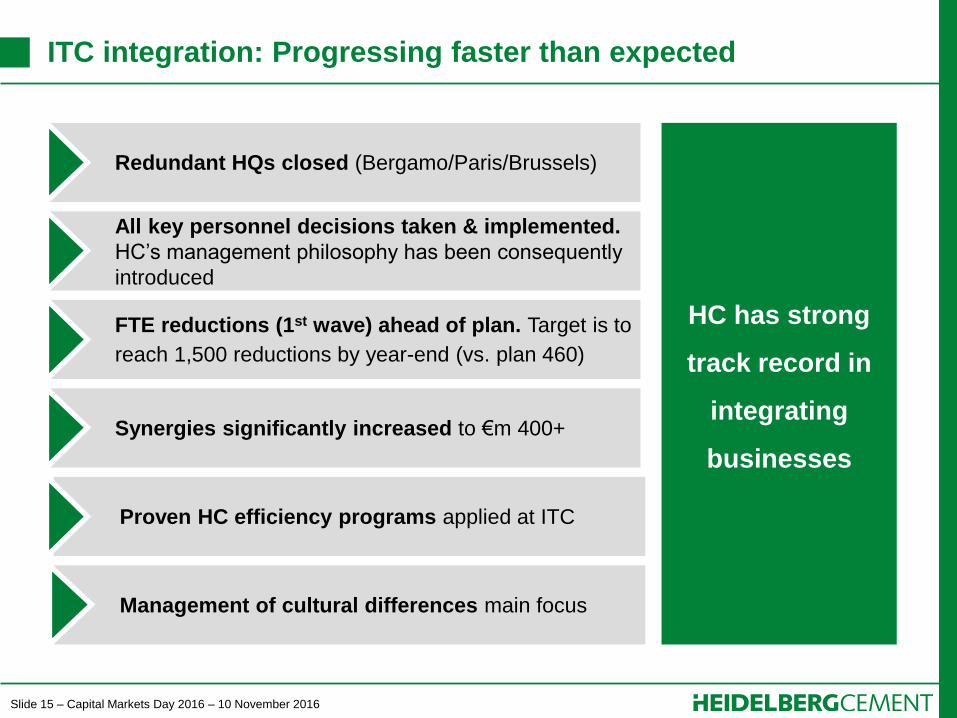
ITC integration: Progressing faster than expected
Integration & acquisition in HC DNA
Redundant HQs closed (Bergamo/Paris/Brussels)
All key personnel decisions taken & implemented.
HC’s management philosophy has been consequently
introduced
FTE reductions (1st wave) ahead of plan. Target is to
reach 1,500 reductions by year-end (vs. plan 460)
Synergies significantly increased to €m 400+
Proven HC efficiency programs applied at ITC
Management of cultural differences main focus
HC has strong
track record in
integrating
businesses

Slide 16 – Capital Markets Day 2016 – 10 November 2016
Timeline and milestones of ITC acquisition
Acquisition process and integration notably ahead of schedule
28 Jul
2015
Integration
preparation
Year-
end
2017
Announcement
of the transaction
Squeeze-out
and delisting
of ITC shares
Closing of
45% stake
acquisition
12 Oct
2016
Integration
completed
Year-
end
2018
€m 400+
synergy
savings
realised
Integration
execution
Disposals
in Belgium &
US
1 Jul
2016
Year-
end
2016
Reduction
1,500 FTE
Synergy
savings of
ca. €m 1351
1) Full year run rate

Slide 17 – Capital Markets Day 2016 – 10 November 2016
Strategic and operational actions taken
Streamlining country HQs
Rollout of HC’s proven efficiency programs started (MIP, CLIMB, OPEX, CIP)
Bundling
HQs
Organizational
changes
Efficiency
improvements
Validation of top-down synergy ambition by local owners completed
New HC Managing Board and leadership teams in all ITC countries in place
Implementing new supplier management to increase process automation
Leverage unused capacity through global trading network
Reduction of 1,500 FTEs by year end 2016; 2,500 FTEs by year end 2018
i.Lab (Bergamo) is home of the new Product Innovation Group function
ITC Group headquarters closed by YE, all functions moved to Heidelberg
Italian country headquarters relocated to i.Lab (Bergamo)

Slide 18 – Capital Markets Day 2016 – 10 November 2016
Closure of redundant Group & local headquarters
Heidelberg/Leimen also hub for regional staff of AEM and NEECA regions –
only APAC (Singapore) and NAM (Dallas) with local regional headquarters
Bergamo
Heidelberg
Brussels
Paris
Madrid
Malaga
Heidelberg/Leimen:
Group HQ (incl. tech. support)
Staff of EMEA regions
Germany HQ (country org.)
Bergamo (i.lab):
Italy HQ (country org.)
Product Innovation function
Closed: ITC Group HQ
Brussels:
BeNeLux HQ (country org.)
Closed: HC’s regional HQ (TEAM)
Paris/Guerville:
France HQ (country org.)
Closed: ITC Group HQ (“Ciments
Francais”)
Malaga:
Spain HQ (country org.)
To be closed: HC’s Spain HQ
(Madrid)
Headquarters in continental Western Europe

Slide 19 – Capital Markets Day 2016 – 10 November 2016
New leadership in all major ITC countries
Local management approach and strong signal of change into the markets
Trading
New General Managers in
all major ITC
country organizations
HC’s bonus system for
country management
already completely
implemented
North America
France
Italy
Spain
India
Kazakhstan
Morocco
Egypt
Thailand
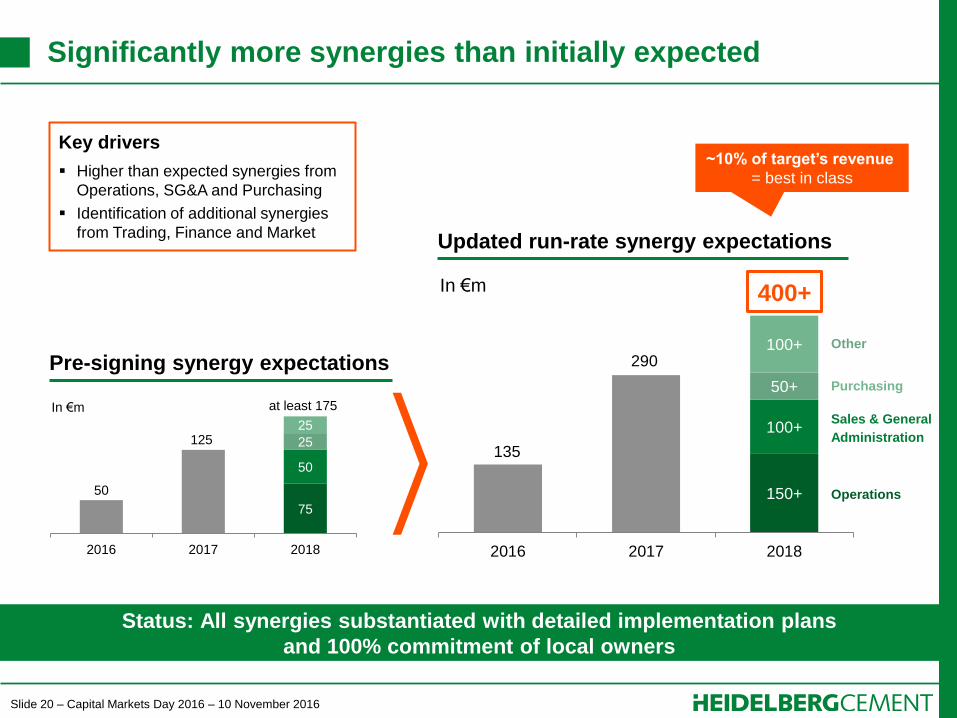
Slide 20 – Capital Markets Day 2016 – 10 November 2016
150+
100+
50+
100+
2016 2017 2018
Status: All synergies substantiated with detailed implementation plans
and 100% commitment of local owners
75
50
25
25
2016 2017 2018
at least 175
125
50
In €m
Pre-signing synergy expectations Other
Purchasing
Sales & General
Administration
Operations
290
135
In €m
Updated run-rate synergy expectations
Key drivers
Higher than expected synergies from
Operations, SG&A and Purchasing
Identification of additional synergies
from Trading, Finance and Market
400+
~10% of target’s revenue
= best in class
Significantly more synergies than initially expected
Slide 21 – Capital Markets Day 2016 – 10 November 2016
Operational synergies / focus on efficiency improvements
Operational synergy target already increased from original €m 75 to €m 150+
EGY U.S. IND BUL FRA KAZ ITA MOR
Plants: Suez Katta-
meya Torah Nazareth Speed
Yerra-
guntla
Sita-
puram Devnya
Couvrot &
Beaucaire
Shym-
kent Rezzato Aitbaha
Fuel Mix
Optimization
Fuel
Consumption
Improvement
Power
Consumption
Improvement
Maintenance
Costs
Immediate implementation of HC MIP practices in all countries
(Project already launched)
Slide 22 – Capital Markets Day 2016 – 10 November 2016
Contents
Page
1. The new HeidelbergCement 4
2. Operational and financial performance 10
3. Accelerating growth with Italcementi (ITC) 14
4. Strategy and strengths 22
5. HeidelbergCement – the future 31
Slide 23 – Capital Markets Day 2016 – 10 November 2016
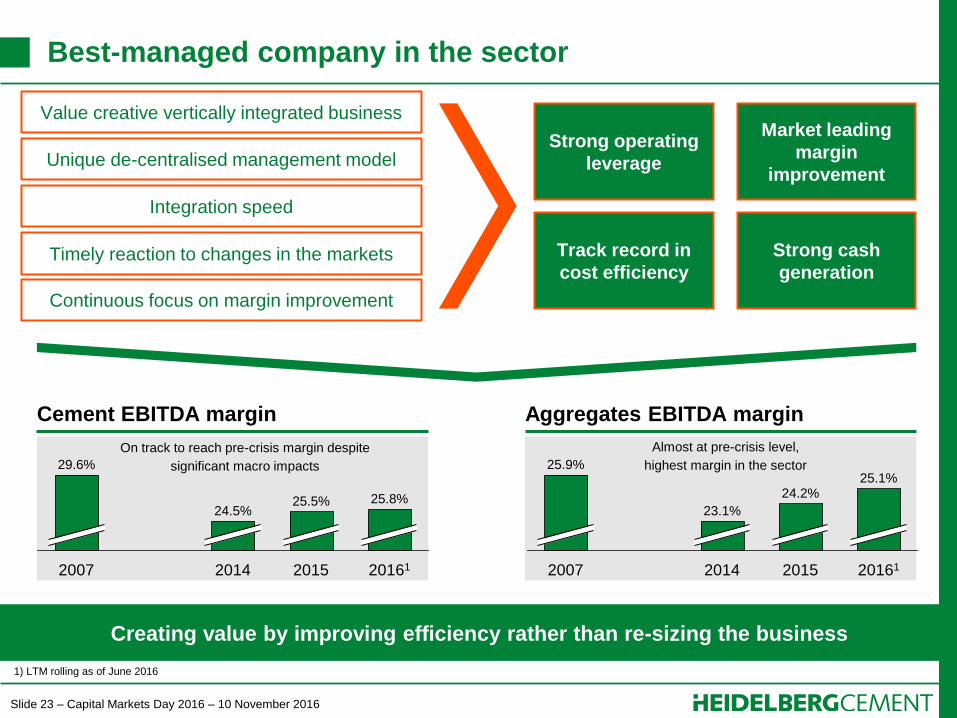
Best-managed company in the sector
Creating value by improving efficiency rather than re-sizing the business
Unique de-centralised management model Strong operating
leverage
Integration speed
Timely reaction to changes in the markets
Continuous focus on margin improvement
Market leading
margin
improvement
Track record in
cost efficiency
Strong cash
generation
25.8%
20161 2015
25.5%
2014
24.5%
2007
29.6%
23.1%
2007
24.2%
2014
25.9% 25.1%
2015 20161
On track to reach pre-crisis margin despite
significant macro impacts
Almost at pre-crisis level,
highest margin in the sector
Value creative vertically integrated business
1) LTM rolling as of June 2016
Cement EBITDA margin Aggregates EBITDA margin
Slide 24 – Capital Markets Day 2016 – 10 November 2016
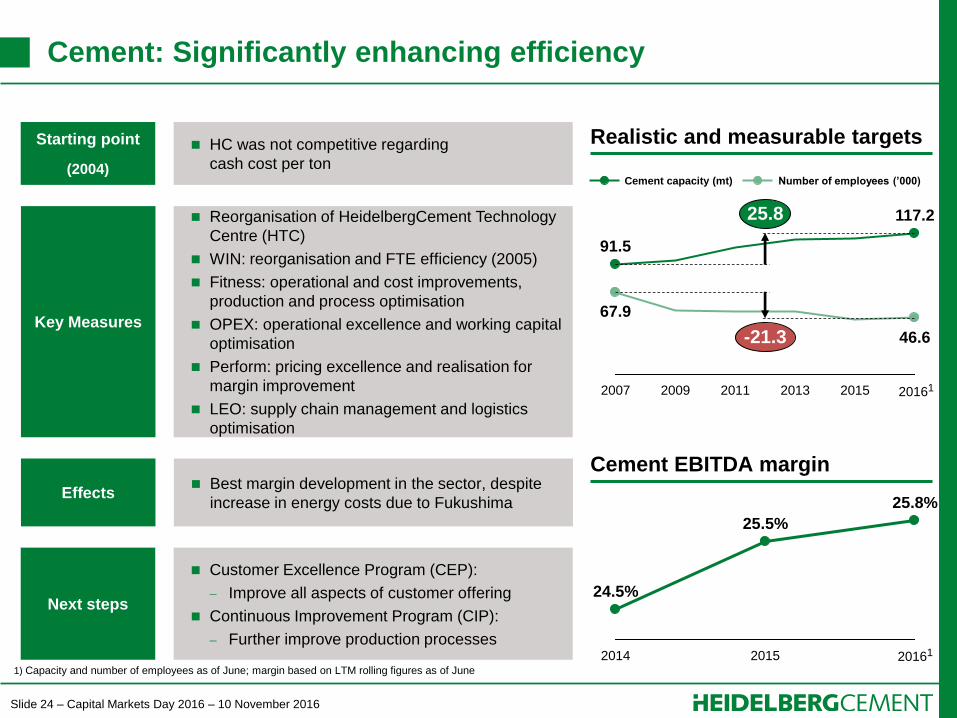
Cement: Significantly enhancing efficiency
HC was not competitive regarding
cash cost per ton
Starting point
(2004)
Best margin development in the sector, despite
increase in energy costs due to Fukushima Effects
Reorganisation of HeidelbergCement Technology
Centre (HTC)
WIN: reorganisation and FTE efficiency (2005)
Fitness: operational and cost improvements,
production and process optimisation
OPEX: operational excellence and working capital
optimisation
Perform: pricing excellence and realisation for
margin improvement
LEO: supply chain management and logistics
optimisation
Key Measures
Customer Excellence Program (CEP):
Improve all aspects of customer offering
Continuous Improvement Program (CIP):
Further improve production processes
Next steps
Realistic and measurable targets
Number of employees (’000) Cement capacity (mt)
25.8
-21.3 46.6
117.2
2015 2013 2011 2009 2007
67.9
91.5
25.8%
2015
25.5%
2014
24.5%
Cement EBITDA margin
1) Capacity and number of employees as of June; margin based on LTM rolling figures as of June
20161
20161
Slide 25 – Capital Markets Day 2016 – 10 November 2016
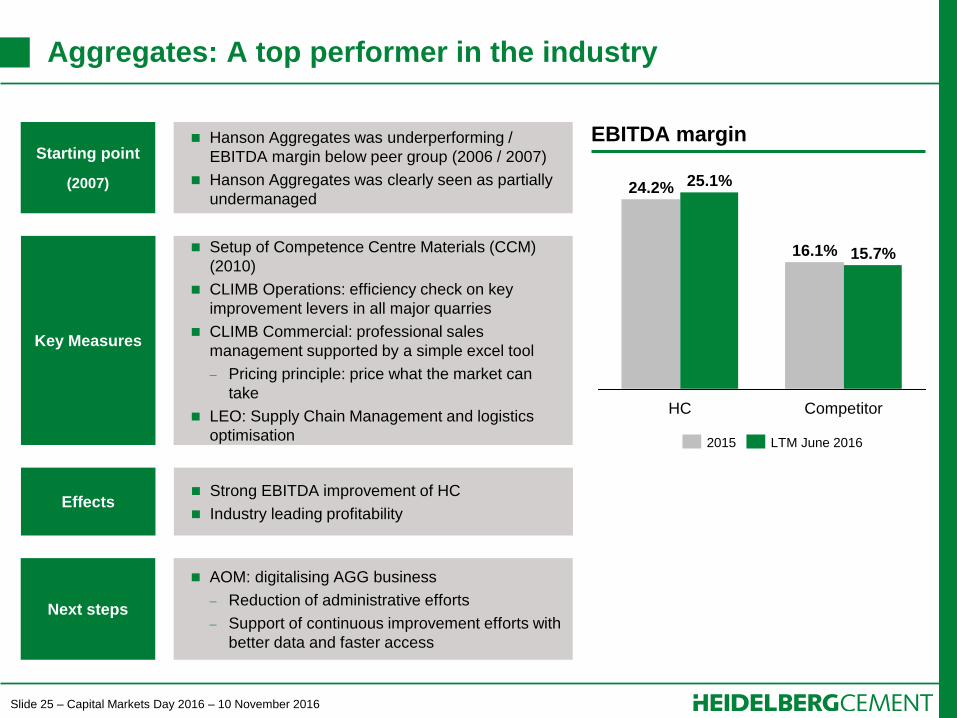
Aggregates: A top performer in the industry
Hanson Aggregates was underperforming /
EBITDA margin below peer group (2006 / 2007)
Hanson Aggregates was clearly seen as partially
undermanaged
Starting point
(2007)
Strong EBITDA improvement of HC
Industry leading profitability Effects
Setup of Competence Centre Materials (CCM)
(2010)
CLIMB Operations: efficiency check on key
improvement levers in all major quarries
CLIMB Commercial: professional sales
management supported by a simple excel tool
Pricing principle: price what the market can
take
LEO: Supply Chain Management and logistics
optimisation
Key Measures
AOM: digitalising AGG business
Reduction of administrative efforts
Support of continuous improvement efforts with
better data and faster access
Next steps
EBITDA margin
16.1%
24.2% 25.1%
15.7%
HC Competitor
2015 LTM June 2016
Slide 26 – Capital Markets Day 2016 – 10 November 2016
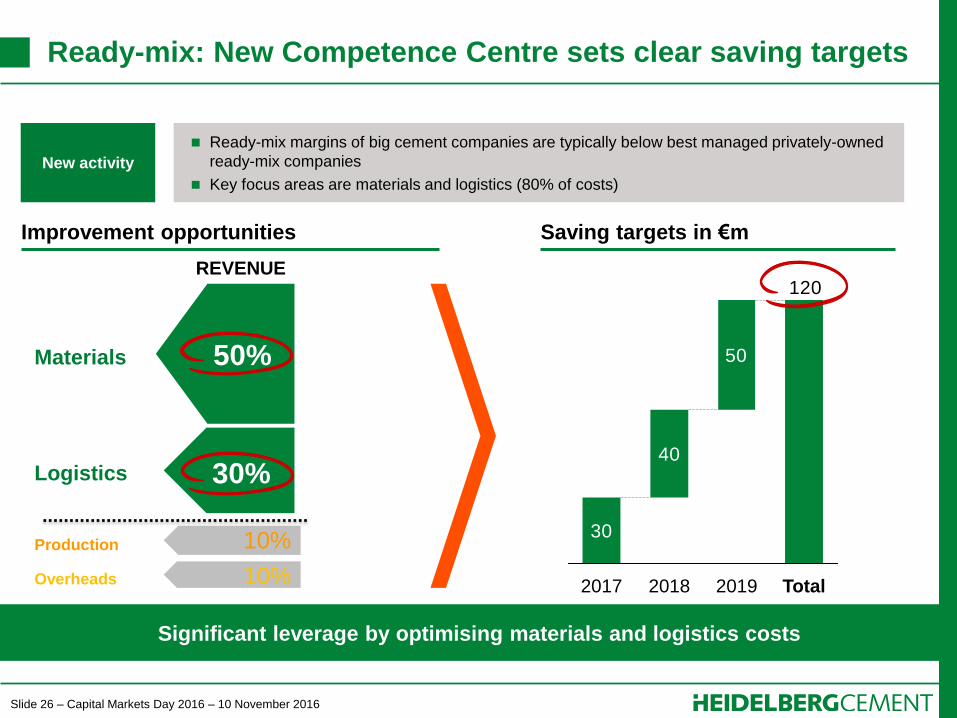
Ready-mix: New Competence Centre sets clear saving targets
Significant leverage by optimising materials and logistics costs
Ready-mix margins of big cement companies are typically below best managed privately-owned
ready-mix companies
Key focus areas are materials and logistics (80% of costs)
New activity
Improvement opportunities
REVENUE
Saving targets in €m
50%
30%
10%
10%
Materials
Logistics
Production
Overheads
30
40
50
120
Total 2017 2018 2019
Slide 27 – Capital Markets Day 2016 – 10 November 2016
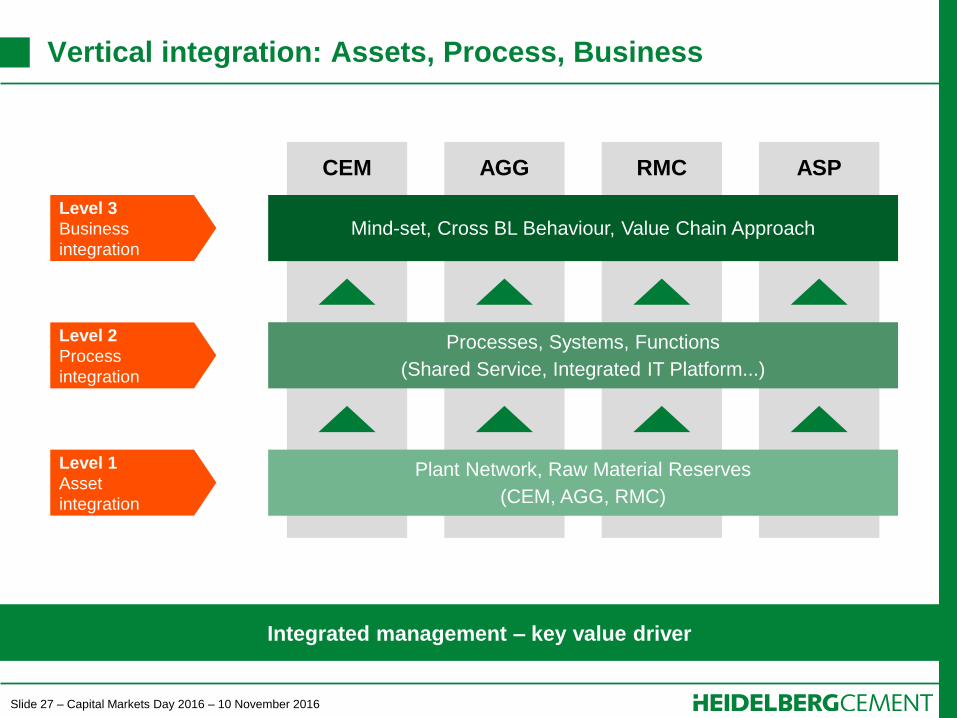
Vertical integration: Assets, Process, Business
Integrated management – key value driver
CEM AGG RMC ASP
Plant Network, Raw Material Reserves
(CEM, AGG, RMC)
Mind-set, Cross BL Behaviour, Value Chain Approach
Processes, Systems, Functions
(Shared Service, Integrated IT Platform...)
Level 3
Business
integration
Level 2
Process
integration
Level 1
Asset
integration
Slide 28 – Capital Markets Day 2016 – 10 November 2016
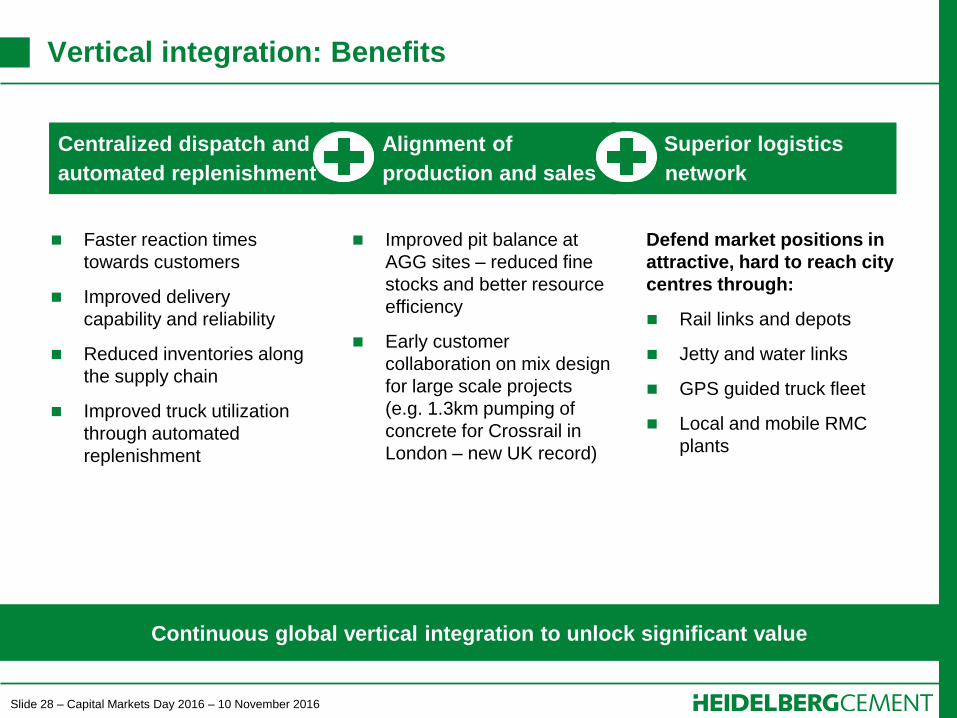
Vertical integration: Benefits
Continuous global vertical integration to unlock significant value
Centralized dispatch and
automated replenishment
Alignment of
production and sales
Superior logistics
network
Faster reaction times
towards customers
Improved delivery
capability and reliability
Reduced inventories along
the supply chain
Improved truck utilization
through automated
replenishment
Improved pit balance at
AGG sites – reduced fine
stocks and better resource
efficiency
Early customer
collaboration on mix design
for large scale projects
(e.g. 1.3km pumping of
concrete for Crossrail in
London – new UK record)
Defend market positions in
attractive, hard to reach city
centres through:
Rail links and depots
Jetty and water links
GPS guided truck fleet
Local and mobile RMC
plants
Slide 29 – Capital Markets Day 2016 – 10 November 2016
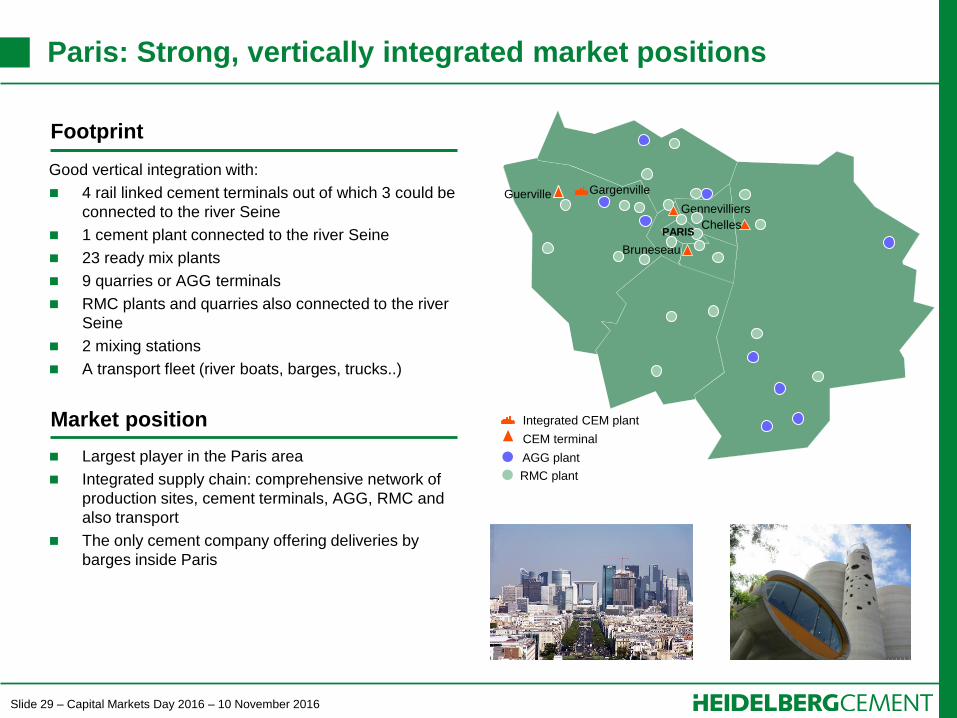
Paris: Strong, vertically integrated market positions
Guerville Gargenville
Gennevilliers
Chelles
Bruneseau
PARIS
Good vertical integration with:
4 rail linked cement terminals out of which 3 could be
connected to the river Seine
1 cement plant connected to the river Seine
23 ready mix plants
9 quarries or AGG terminals
RMC plants and quarries also connected to the river
Seine
2 mixing stations
A transport fleet (river boats, barges, trucks..)
Market position
Largest player in the Paris area
Integrated supply chain: comprehensive network of
production sites, cement terminals, AGG, RMC and
also transport
The only cement company offering deliveries by
barges inside Paris
Footprint
Integrated CEM plant
CEM terminal
AGG plant
RMC plant
Slide 30 – Capital Markets Day 2016 – 10 November 2016
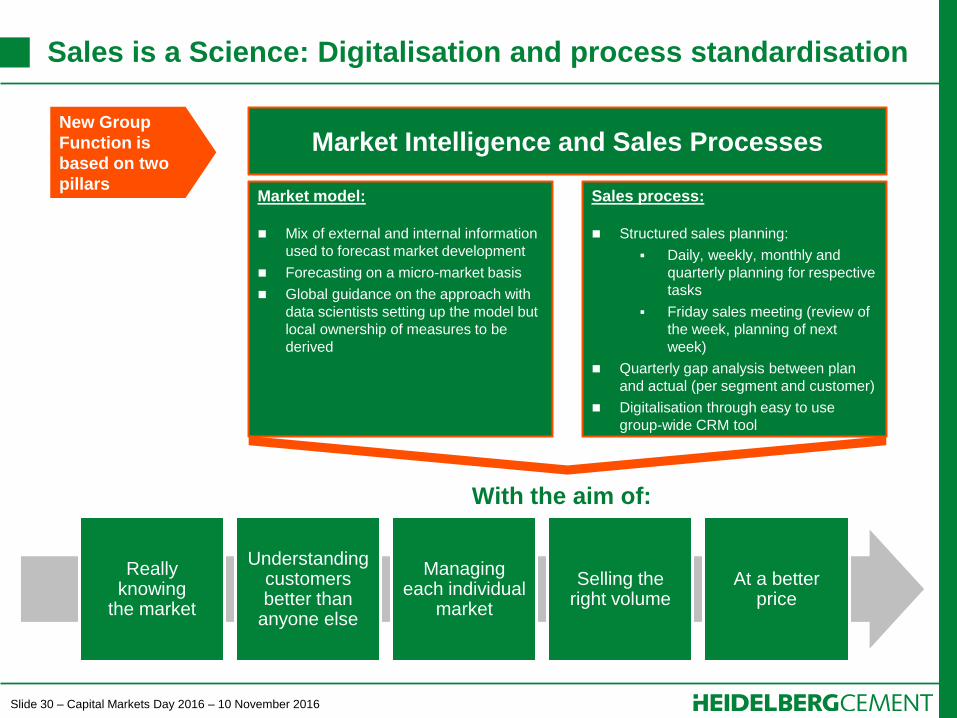
Sales is a Science: Digitalisation and process standardisation
Market model:
Mix of external and internal information
used to forecast market development
Forecasting on a micro-market basis
Global guidance on the approach with
data scientists setting up the model but
local ownership of measures to be
derived
Sales process:
Structured sales planning:
Daily, weekly, monthly and
quarterly planning for respective
tasks
Friday sales meeting (review of
the week, planning of next
week)
Quarterly gap analysis between plan
and actual (per segment and customer)
Digitalisation through easy to use
group-wide CRM tool
Really knowing
the market
Understanding customers better than
anyone else
Managing each individual
market
Selling the right volume
At a better price
With the aim of:
New Group
Function is
based on two
pillars
Market Intelligence and Sales Processes

Slide 31 – Capital Markets Day 2016 – 10 November 2016
Contents
Page
1. The new HeidelbergCement 4
2. Operational and financial performance 10
3. Accelerating growth with Italcementi (ITC) 14
4. Strategy and strengths 22
5. HeidelbergCement – the future 31

Slide 32 – Capital Markets Day 2016 – 10 November 2016
Global market outlook 2017
US continues to be strong:
Further improvement in
pricing as utilisation rates
get higher
Very good terminal
network to facilitate
profitable imports
Significant infrastructure
plan provides further
potential Things are turning in Africa:
Improving macroeconomics and big
infrastructure projects signals solid growth
Positive price environment in EGY, MOR and
most SSA markets
Difficult pricing situation in GHA and TZA due to
competition
Better year ahead in Asia Pacific:
Competitive market environment in
Indonesia but with positive outlook in
volume development after significant
increase in infrastructure spend
Further improvement in demand and
pricing in India, driven by government
actions in infrastructure
Moderate growth in volumes but clear
price improvement in Australia
Stable development in UK post Brexit:
Key infrastructure projects will secure
demand growth
Price increases to compensate cost
inflation linked to weak currency
Recovery to continue in Eastern Europe and
central Asia:
Demand growth to continue
RUS, UKR and KAZ on improving trend
Focus on pricing to compensate energy costs
Signs of improvement in Europe:
GER continues to grow
Northern Europe stays strong with pipeline of
infrastructure projects
Steady Benelux, negative trend stopped
Demand increase in FRA driven by big
infrastructure projects and housing recovery
Stabilization in ITA with price improvements
Overall positive macro data and growth is in line with IMF forecast
Slide 33 – Capital Markets Day 2016 – 10 November 2016
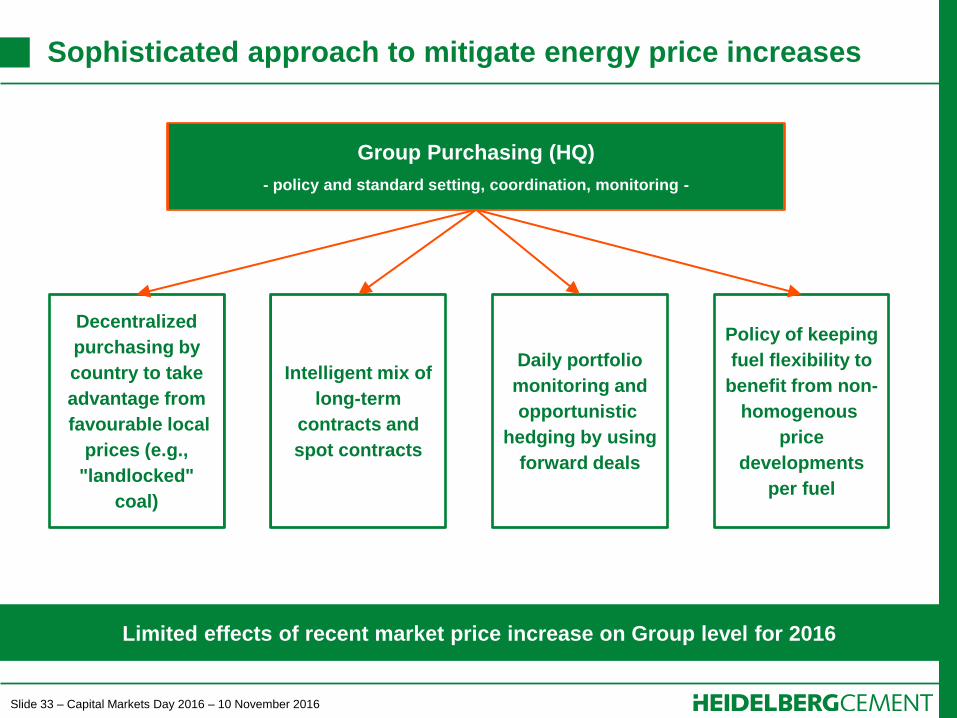
Sophisticated approach to mitigate energy price increases
Limited effects of recent market price increase on Group level for 2016
Group Purchasing (HQ)
- policy and standard setting, coordination, monitoring -
Decentralized
purchasing by
country to take
advantage from
favourable local
prices (e.g.,
"landlocked"
coal)
Intelligent mix of
long-term
contracts and
spot contracts
Daily portfolio
monitoring and
opportunistic
hedging by using
forward deals
Policy of keeping
fuel flexibility to
benefit from non-
homogenous
price
developments
per fuel
Slide 34 – Capital Markets Day 2016 – 10 November 2016
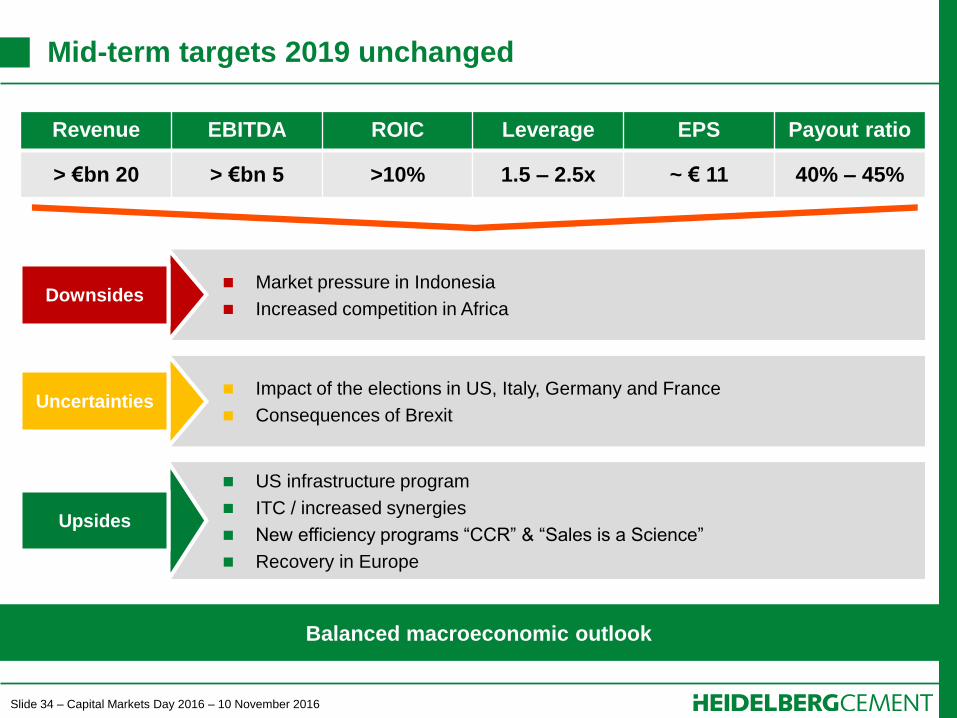
Mid-term targets 2019 unchanged
Revenue EBITDA ROIC Leverage EPS Payout ratio
> €bn 20 > €bn 5 >10% 1.5 – 2.5x ~ € 11 40% – 45%
Market pressure in Indonesia
Increased competition in Africa
US infrastructure program
ITC / increased synergies
New efficiency programs “CCR” & “Sales is a Science”
Recovery in Europe
Downsides
Upsides
Balanced macroeconomic outlook
Impact of the elections in US, Italy, Germany and France
Consequences of Brexit Uncertainties
Slide 35 – Capital Markets Day 2016 – 10 November 2016
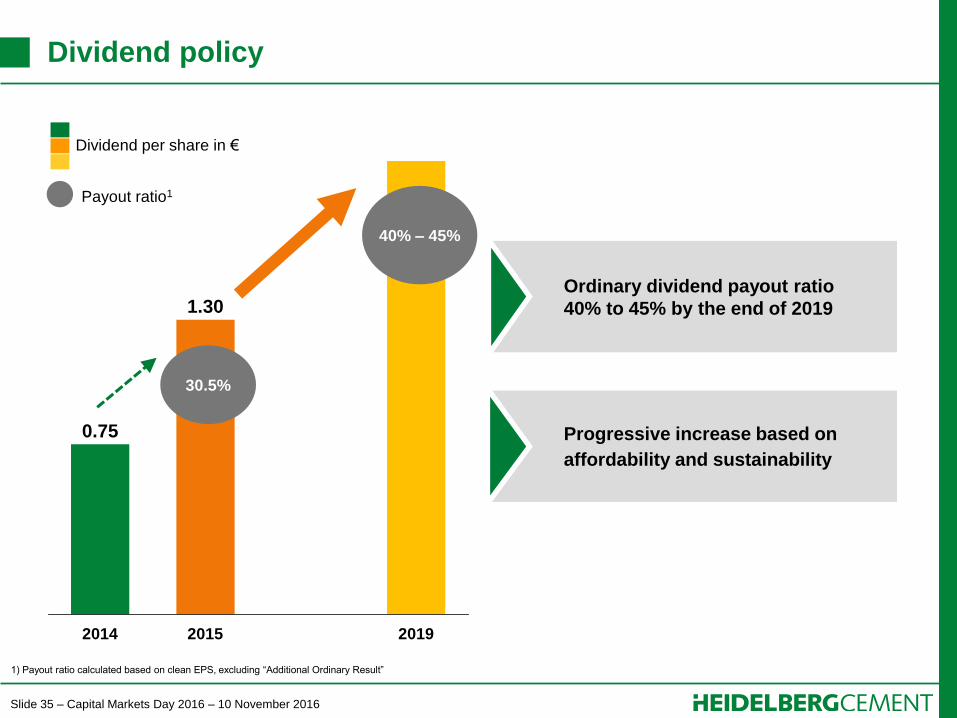
Dividend policy
Ordinary dividend payout ratio
40% to 45% by the end of 2019
Progressive increase based on
affordability and sustainability
Dividend per share in €
1.30
0.75
2019 2015 2014
40% – 45%
30.5%
Payout ratio1
1) Payout ratio calculated based on clean EPS, excluding “Additional Ordinary Result”
Slide 36 – Capital Markets Day 2016 – 10 November 2016
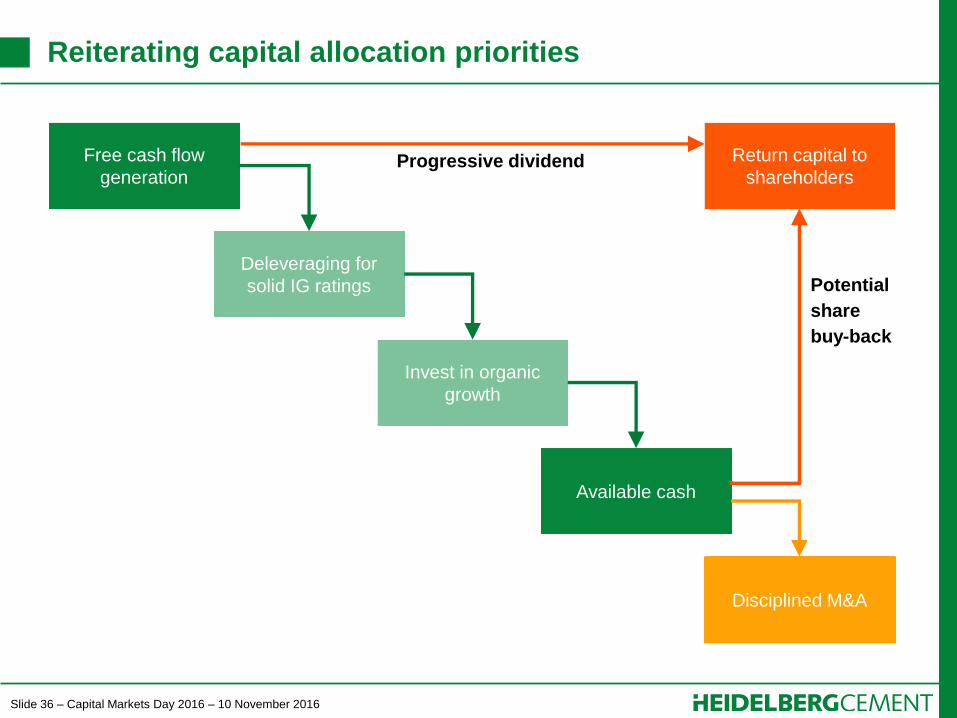
Reiterating capital allocation priorities
Free cash flow
generation
Deleveraging for
solid IG ratings
Invest in organic
growth
Available cash
Return capital to
shareholders
Disciplined M&A
Potential
share
buy-back
Progressive dividend
Slide 37 – Capital Markets Day 2016 – 10 November 2016
HeidelbergCement
Strong Management team with long standing
operational and sector expertise
Continuous improvement in operational and
financial metrics. New initiatives started in RMC and
sales supported by global competence centres
Sustainable cash flow generation to drive
shareholder returns
Best managed
company in the
sector with
unique business
model focusing
on vertical
integration
Integration of ITC notably ahead of schedule and
identified synergies increased

Slide 38 – Capital Markets Day 2016 – 10 November 2016
Driving Growth and Shareholder Returns
Dr Bernd Scheifele, Group CEO
HeidelbergCement Capital Markets Day
London, 10 November 2016

Slide 1 – Capital Markets Day 2016 – 10 November 2016
Dr. Dominik von Achten, Deputy Chairman of the Managing Board
HeidelbergCement Capital Markets Day
London, 10 November 2016
Integration of Italcementi

Slide 2 – Capital Markets Day 2016 – 10 November 2016
This presentation contains forward-looking statements and information. Forward-looking statements and information are
statements that are not historical facts, related to future, not past, events. They include statements about our beliefs and
expectations and the underlying assumptions. These statements and information are based on plans, estimates,
projections as they are currently available to the management of HeidelbergCement. Forward-looking statements and
information therefore speak only as of the date they are made, and we undertake no obligation to update publicly any of
them in light of new information or future events.
By their very nature, forward-looking statements and information are subject to certain risks and uncertainties. A variety
of factors, many of which are beyond HeidelbergCements’ control, could cause actual results to differ materially from
those that may be expressed or implied by such forward-looking statement or information. For HeidelbergCement
particular uncertainties arise, among others, from changes in general economic and business conditions in Germany, in
Europe, in the United States and elsewhere from which we derive a substantial portion of our revenues and in which we
hold a substantial portion of our assets; the possibility that prices will decline to a greater extent than currently
anticipated by HeidelbergCements’ management as a result of continued adverse market conditions; developments in
the financial markets, including fluctuations in interest and exchange rates, commodity and equity prices, debt prices
(credit spreads) and financial assets generally; continued volatility and a further deterioration of capital markets; a
worsening in the conditions of the credit business and, in particular, additional uncertainties arising out of the subprime
financial market and liquidity crisis; the outcome of pending investigations and legal proceedings and actions resulting
from the findings of these investigations; as well as various other factors. Should one or more of these risks or
uncertainties materialize, or should underlying assumptions prove incorrect, actual results may vary materially from
those described in the relevant forward-looking statement or information as expected, anticipated, intended, planned,
believed, sought, estimated or projected.
Unless indicated otherwise, the financial information provided herein has been prepared under International Financial
Reporting Standards (IFRS).
Disclaimer

Slide 3 – Capital Markets Day 2016 – 10 November 2016
Page
1. Timeline and milestones 4
2. Quality of assets and markets 6
3. Synergy update 10
4. Integration management 19
5. Next priorities & summary 22
Contents
Slide 4 – Capital Markets Day 2016 – 10 November 2016
Page
1. Timeline and milestones 4
2. Quality of assets and markets 6
3. Synergy update 10
4. Integration management 19
5. Next priorities & summary 22
Contents

Slide 5 – Capital Markets Day 2016 – 10 November 2016
Acquisition process and integration notably ahead of schedule
28 Jul
2015
Integration
preparation
Year-
end
2017
Announcement
of the transaction
Squeeze-out
and delisting
of ITC shares
Closing of
45% stake
acquisition
12 Oct
2016
Integration
completed
Year-
end
2018
€m 400+
synergy
savings
realised
Integration
execution
Disposals
in Belgium &
US
1 Jul
2016
Year-
end
2016
Reduction
1,500 FTE
Synergy
savings of
ca. €m 1351
1) Full year run rate
Timeline and milestones of ITC acquisition
Slide 6 – Capital Markets Day 2016 – 10 November 2016
Page
1. Timeline and milestones 4
2. Quality of assets and markets 6
3. Synergy update 10
4. Integration management 19
5. Next priorities & summary 22
Contents
Slide 7 – Capital Markets Day 2016 – 10 November 2016
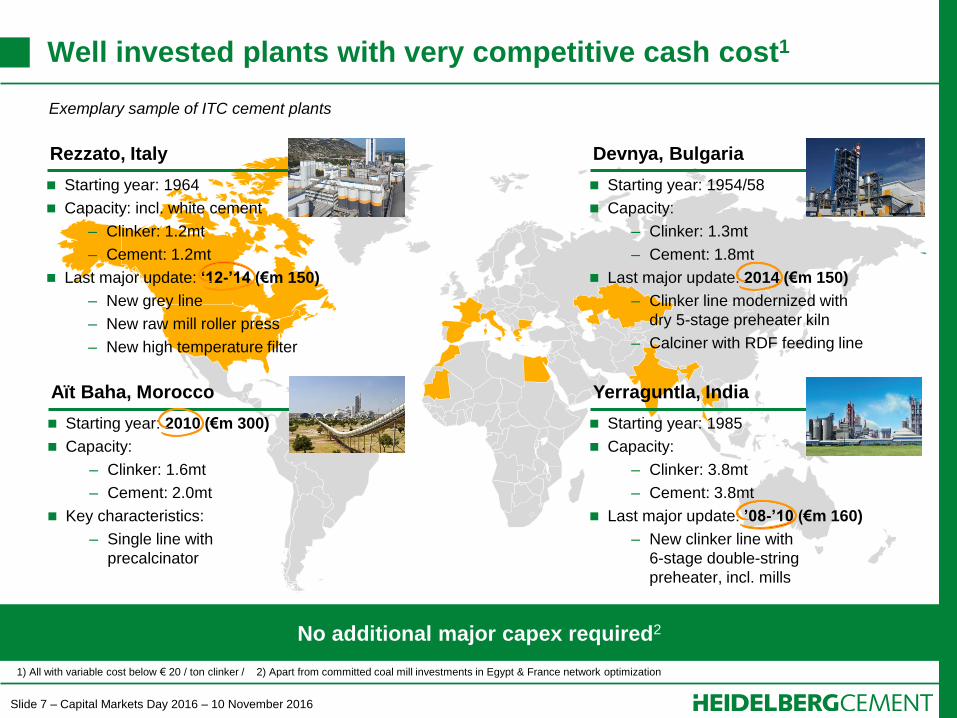
No additional major capex required2
Rezzato, Italy
Aït Baha, Morocco
Starting year: 2010 (€m 300)
Capacity:
– Clinker: 1.6mt
– Cement: 2.0mt
Key characteristics:
– Single line with
precalcinator
Devnya, Bulgaria
Yerraguntla, India
Starting year: 1985
Capacity:
– Clinker: 3.8mt
– Cement: 3.8mt
Last major update: ’08-’10 (€m 160)
– New clinker line with
6-stage double-string
preheater, incl. mills
Starting year: 1954/58
Capacity:
– Clinker: 1.3mt
– Cement: 1.8mt
Last major update: 2014 (€m 150)
– Clinker line modernized with
dry 5-stage preheater kiln
– Calciner with RDF feeding line
Exemplary sample of ITC cement plants
Starting year: 1964
Capacity: incl. white cement
– Clinker: 1.2mt
– Cement: 1.2mt
Last major update: ‘12-’14 (€m 150)
– New grey line
– New raw mill roller press
– New high temperature filter
1) All with variable cost below € 20 / ton clinker / 2) Apart from committed coal mill investments in Egypt & France network optimization
Well invested plants with very competitive cash cost1
Slide 8 – Capital Markets Day 2016 – 10 November 2016
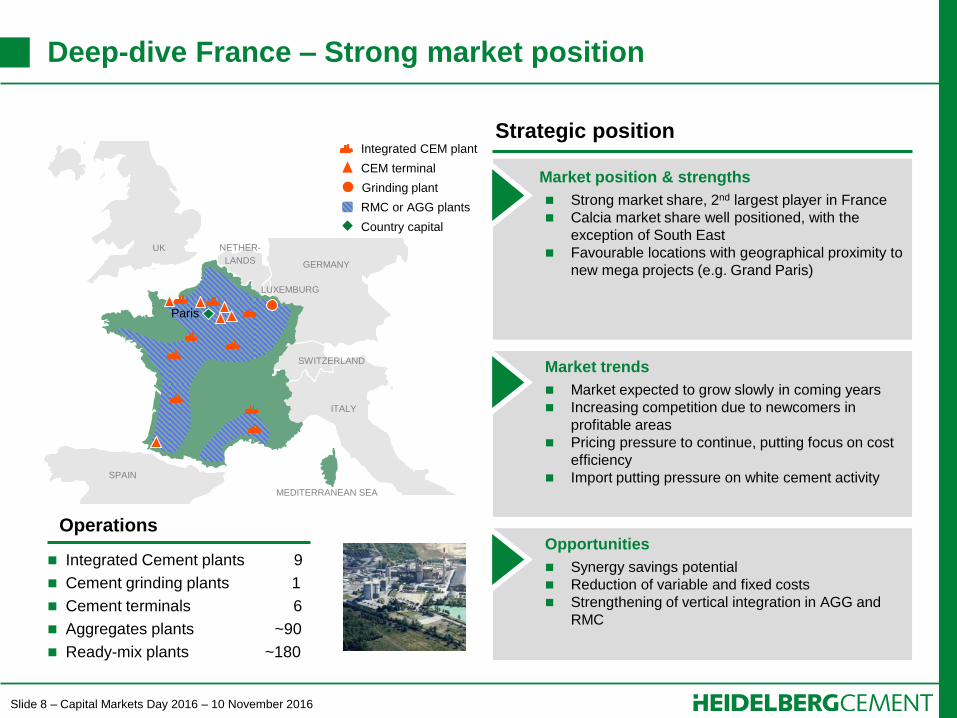
Deep-dive France – Strong market position
Market position & strengths
Strong market share, 2nd largest player in France
Calcia market share well positioned, with the
exception of South East
Favourable locations with geographical proximity to
new mega projects (e.g. Grand Paris)
Market trends
Market expected to grow slowly in coming years
Increasing competition due to newcomers in
profitable areas
Pricing pressure to continue, putting focus on cost
efficiency
Import putting pressure on white cement activity
Opportunities
Synergy savings potential
Reduction of variable and fixed costs
Strengthening of vertical integration in AGG and
RMC
Strategic position
Integrated Cement plants 9
Cement grinding plants 1
Cement terminals 6
Aggregates plants ~90
Ready-mix plants ~180
Operations
Integrated CEM plant
CEM terminal
RMC or AGG plants
Country capital
UK NETHER-
LANDS GERMANY
SPAIN
ITALY
SWITZERLAND
LUXEMBURG
MEDITERRANEAN SEA
Paris
Grinding plant
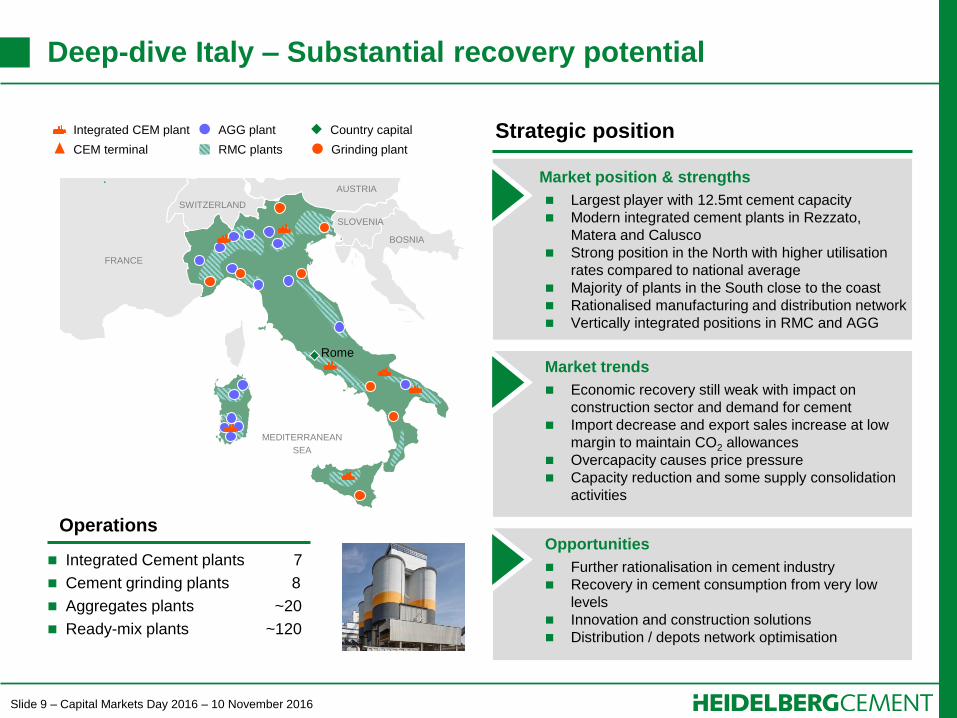
Slide 9 – Capital Markets Day 2016 – 10 November 2016
Market position & strengths
Largest player with 12.5mt cement capacity
Modern integrated cement plants in Rezzato,
Matera and Calusco
Strong position in the North with higher utilisation
rates compared to national average
Majority of plants in the South close to the coast
Rationalised manufacturing and distribution network
Vertically integrated positions in RMC and AGG
Market trends
Economic recovery still weak with impact on
construction sector and demand for cement
Import decrease and export sales increase at low
margin to maintain CO2 allowances
Overcapacity causes price pressure
Capacity reduction and some supply consolidation
activities
Opportunities
Further rationalisation in cement industry
Recovery in cement consumption from very low
levels
Innovation and construction solutions
Distribution / depots network optimisation
Strategic position
Integrated Cement plants 7
Cement grinding plants 8
Aggregates plants ~20
Ready-mix plants ~120
Operations
Country capital AGG plant
RMC plants Grinding plant
Integrated CEM plant
CEM terminal
FRANCE
SWITZERLAND
AUSTRIA
SLOVENIA
BOSNIA
MEDITERRANEAN
SEA
Rome
Deep-dive Italy – Substantial recovery potential
Slide 10 – Capital Markets Day 2016 – 10 November 2016
Page
1. Timeline and milestones 4
2. Quality of assets and markets 6
3. Synergy update 10
4. Integration management 19
5. Next priorities & summary 22
Contents
Slide 11 – Capital Markets Day 2016 – 10 November 2016
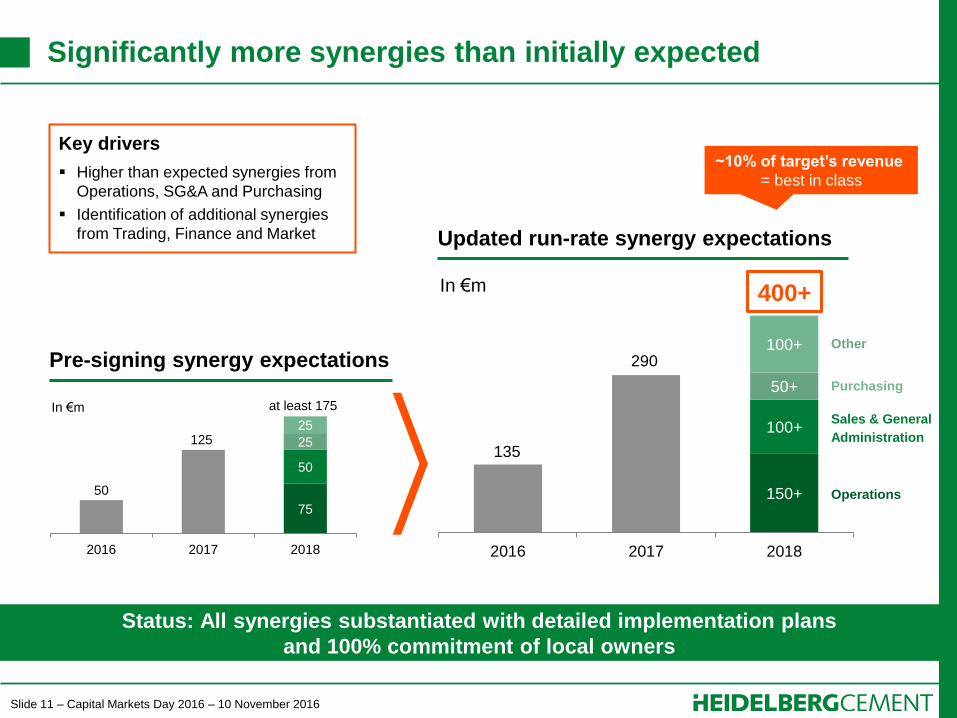
150+
100+
50+
100+
2016 2017 2018
Significantly more synergies than initially expected
Status: All synergies substantiated with detailed implementation plans
and 100% commitment of local owners
75
50
25
25
2016 2017 2018
at least 175
125
50
In €m
Pre-signing synergy expectations Other
Purchasing
Sales & General
Administration
Operations
290
135
In €m
Updated run-rate synergy expectations
Key drivers
Higher than expected synergies from
Operations, SG&A and Purchasing
Identification of additional synergies
from Trading, Finance and Market
400+
~10% of target’s revenue
= best in class
Slide 12 – Capital Markets Day 2016 – 10 November 2016
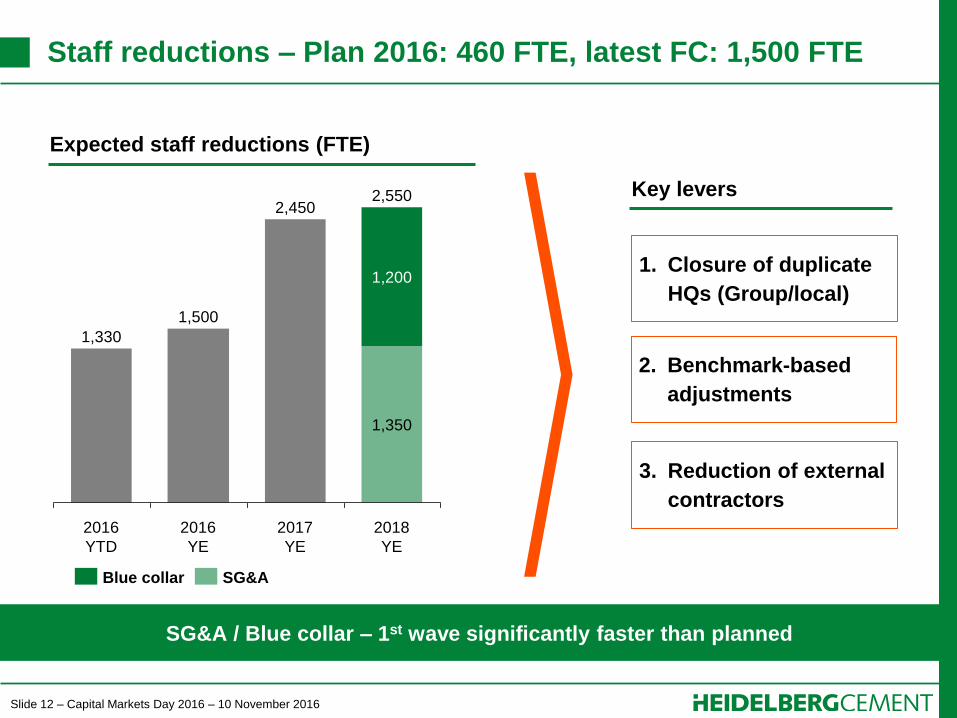
1. Closure of duplicate
HQs (Group/local)
2. Benchmark-based
adjustments
3. Reduction of external
contractors
2018
YE
2,450
1,350
2016
YE
2017
YE
2016
YTD
2,550
1,200
1,330
1,500
Key levers
Staff reductions – Plan 2016: 460 FTE, latest FC: 1,500 FTE
SG&A / Blue collar – 1st wave significantly faster than planned
Expected staff reductions (FTE)
SG&A Blue collar

Slide 13 – Capital Markets Day 2016 – 10 November 2016
Closure of redundant Group & local headquarters
Heidelberg/Leimen also hub for regional staff of AEM and NEECA regions –
only APAC (Singapore) and NAM (Dallas) with local regional headquarters
Bergamo
Heidelberg
Brussels
Paris
Madrid
Malaga
Heidelberg/Leimen:
Group HQ (incl. tech. support)
Staff of EMEA regions
Germany HQ (country org.)
Bergamo (i.lab):
Italy HQ (country org.)
Product Innovation function
Closed: ITC Group HQ
Brussels:
BeNeLux HQ (country org.)
Closed: HC’s regional HQ (TEAM)
Paris/Guerville:
France HQ (country org.)
Closed: ITC Group HQ (“Ciments
Francais”)
Malaga:
Spain HQ (country org.)
To be closed: HC’s Spain HQ
(Madrid)
Headquarters in continental Western Europe

Slide 14 – Capital Markets Day 2016 – 10 November 2016
Before acquisition:
– Italcementi Group HQ and
Italy country HQ co-located in
Via Camozzi, Bergamo
– i.lab hosted Italcementi’s R&D
and Product Innovation staff
After integration:
– Offices in Via Camozzi and
adjacent buildings closed by
year-end (also Brindisi lab)
– Italy country HQ (incl. SSC)
and new ‘Product Innovation’
function (with reduced staff)
bundled in i.lab
Example Italy – Fresh start of country organisation in i.lab
New country HQ together with new country management
provides strong basis for future success
Italy, i.lab / Bergamo
Slide 15 – Capital Markets Day 2016 – 10 November 2016
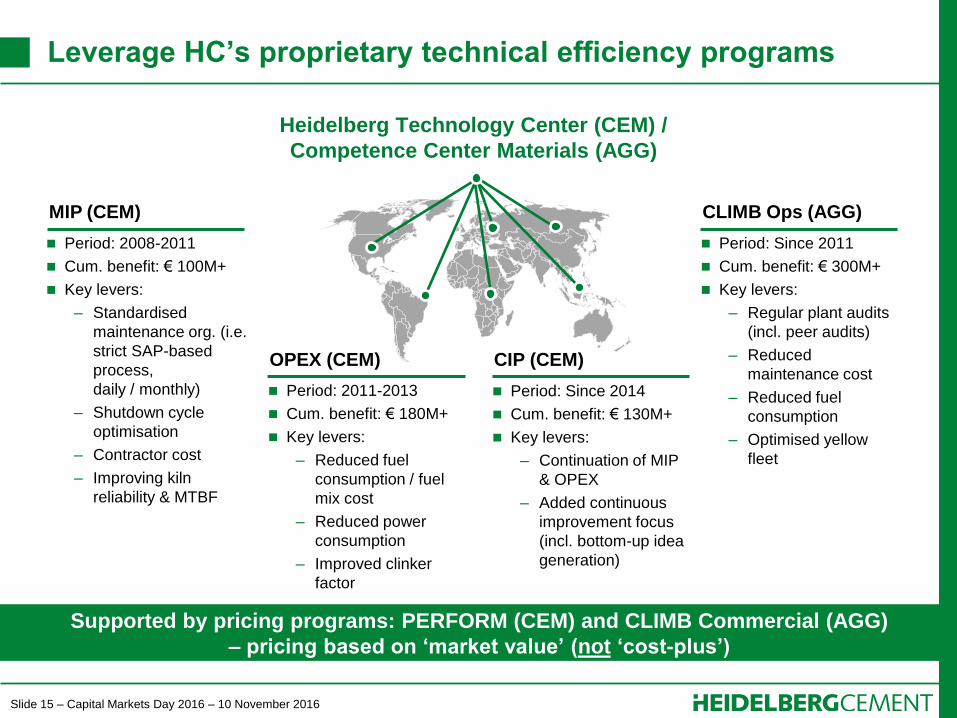
Leverage HC’s proprietary technical efficiency programs
Supported by pricing programs: PERFORM (CEM) and CLIMB Commercial (AGG)
– pricing based on ‘market value’ (not ‘cost-plus’)
Heidelberg Technology Center (CEM) /
Competence Center Materials (AGG)
MIP (CEM)
Period: 2008-2011
Cum. benefit: € 100M+
Key levers:
– Standardised
maintenance org. (i.e.
strict SAP-based
process,
daily / monthly)
– Shutdown cycle
optimisation
– Contractor cost
– Improving kiln
reliability & MTBF
CLIMB Ops (AGG)
OPEX (CEM)
Period: Since 2011
Cum. benefit: € 300M+
Key levers:
– Regular plant audits
(incl. peer audits)
– Reduced
maintenance cost
– Reduced fuel
consumption
– Optimised yellow
fleet
Period: 2011-2013
Cum. benefit: € 180M+
Key levers:
– Reduced fuel
consumption / fuel
mix cost
– Reduced power
consumption
– Improved clinker
factor
CIP (CEM)
Period: Since 2014
Cum. benefit: € 130M+
Key levers:
– Continuation of MIP
& OPEX
– Added continuous
improvement focus
(incl. bottom-up idea
generation)
Slide 16 – Capital Markets Day 2016 – 10 November 2016
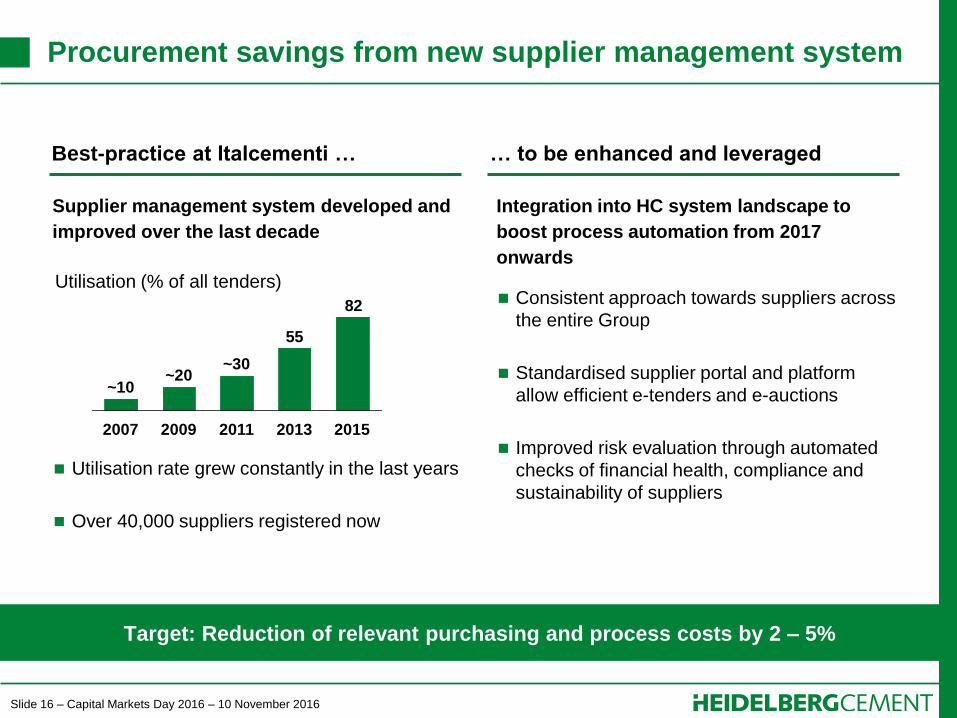
Procurement savings from new supplier management system
Target: Reduction of relevant purchasing and process costs by 2 – 5%
Best-practice at Italcementi … … to be enhanced and leveraged
Utilisation (% of all tenders)
Supplier management system developed and
improved over the last decade
82
55
2015 2013 2011
~30
2009
~20
2007
~10
Integration into HC system landscape to
boost process automation from 2017
onwards
Consistent approach towards suppliers across
the entire Group
Standardised supplier portal and platform
allow efficient e-tenders and e-auctions
Improved risk evaluation through automated
checks of financial health, compliance and
sustainability of suppliers
Utilisation rate grew constantly in the last years
Over 40,000 suppliers registered now

Slide 17 – Capital Markets Day 2016 – 10 November 2016
Significant potential from surplus capacity utilisation and improved logistics
Italcementi surplus capacity … … can be leveraged by HC Trading
HC Trading is one of the leading world-wide
building materials traders
Total revenue: €bn 1.1 (’15)
Total shipments: 21.7mt (’15)
Destinations/Countries: 175/76
Load Ports: 134
Overseas offices: 13
Italcementi’s available capacities logistically
well located, e.g.:
– Malaga, Spain
– Devnya, Bulgaria
– Halyps, Greece
HC with terminal locations in increasing
demand markets (e.g. NAM, Africa)
Leverage unused capacity through global trading network
Slide 18 – Capital Markets Day 2016 – 10 November 2016
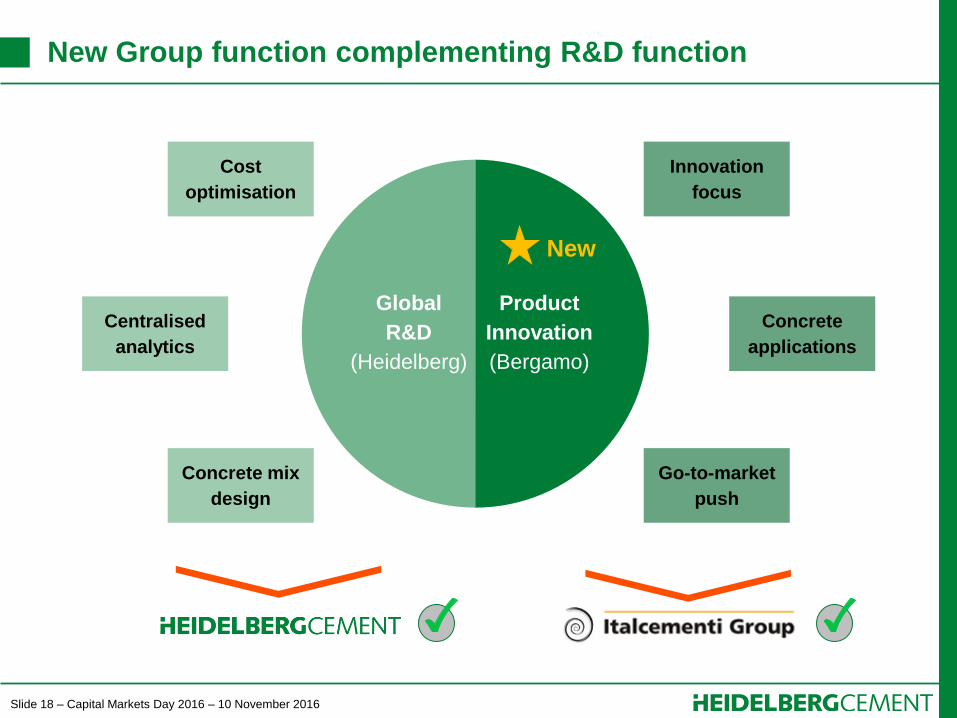
Innovation
focus
Cost
optimisation
Centralised
analytics
Go-to-market
push
Concrete
applications
Global
R&D
(Heidelberg)
Product
Innovation
(Bergamo)
Concrete mix
design
New
New Group function complementing R&D function

Slide 19 – Capital Markets Day 2016 – 10 November 2016
Page
1. Timeline and milestones 4
2. Quality of assets and markets 6
3. Synergy update 10
4. Integration management 19
5. Next priorities & summary 22
Contents
Slide 20 – Capital Markets Day 2016 – 10 November 2016
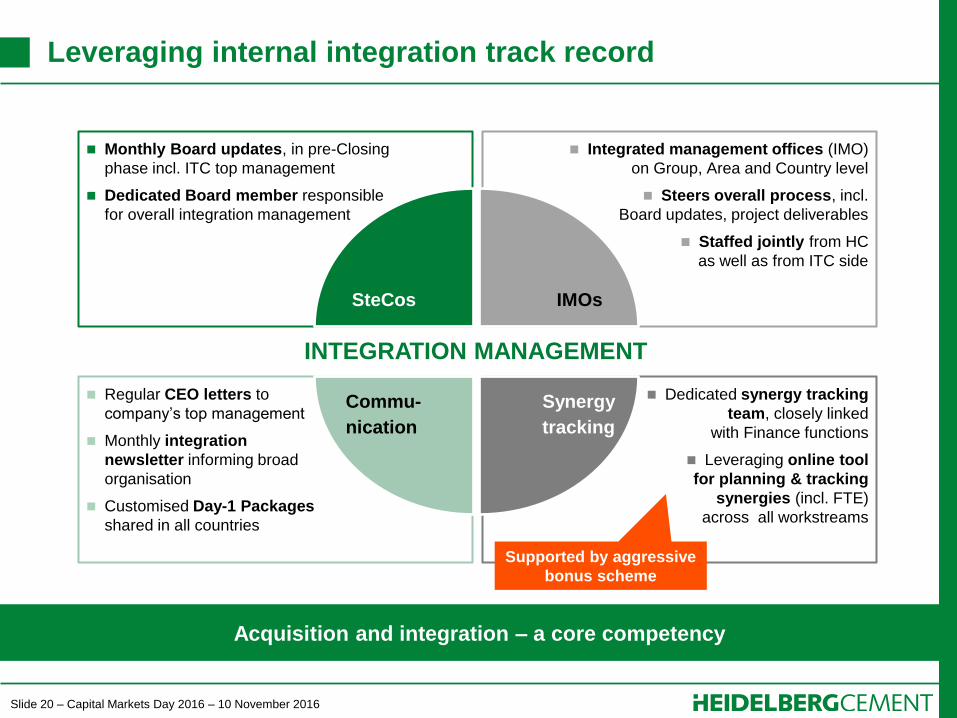
Leveraging internal integration track record
Acquisition and integration – a core competency
Dedicated synergy tracking
team, closely linked
with Finance functions
Leveraging online tool
for planning & tracking
synergies (incl. FTE)
across all workstreams
Regular CEO letters to
company’s top management
Monthly integration
newsletter informing broad
organisation
Customised Day-1 Packages
shared in all countries
Integrated management offices (IMO)
on Group, Area and Country level
Steers overall process, incl.
Board updates, project deliverables
Staffed jointly from HC
as well as from ITC side
Monthly Board updates, in pre-Closing
phase incl. ITC top management
Dedicated Board member responsible
for overall integration management
Commu-
nication
SteCos IMOs
Synergy
tracking
INTEGRATION MANAGEMENT
Supported by aggressive
bonus scheme
Slide 21 – Capital Markets Day 2016 – 10 November 2016
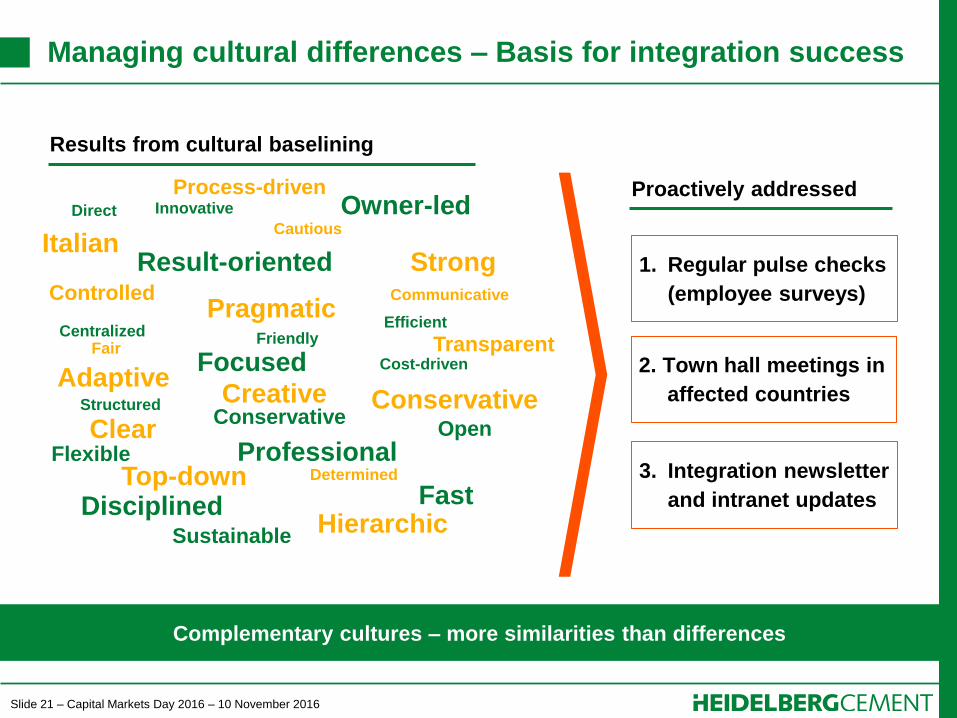
Managing cultural differences – Basis for integration success
Complementary cultures – more similarities than differences
1. Regular pulse checks
(employee surveys)
2. Town hall meetings in
affected countries
3. Integration newsletter
and intranet updates
Result-oriented
Focused
Professional
Direct
Efficient
Structured
Cost-driven
Owner-led
Disciplined
Innovative
Centralized
Open
Fast
Flexible
Conservative
Friendly
Sustainable
Fair
Strong
Process-driven
Transparent
Clear Conservative
Controlled Pragmatic
Top-down Determined
Creative
Italian
Hierarchic
Adaptive
Cautious
Communicative
Proactively addressed
Results from cultural baselining
Slide 22 – Capital Markets Day 2016 – 10 November 2016
Page
1. Timeline and milestones 4
2. Quality of assets and markets 6
3. Synergy update 10
4. Integration management 19
5. Next priorities & summary 22
Contents

Slide 23 – Capital Markets Day 2016 – 10 November 2016
November 2016 December 2018
By end of 2018
Realisation of
targeted
€m 400+ run-rate
synergies
Ensure
sustainability
of achieved
benefits
By end of 2017
Full
implementation
of integration
measures
90%+ of targeted
FTE reductions
realised
By end of 2016
Ramp-down IMO
org. / hand-over to
countries
Realisation of
€m 135 quick wins
(incl. procurement)
Next action steps clearly defined

Slide 24 – Capital Markets Day 2016 – 10 November 2016
ITC integration – Progressing faster than expected
Integration & acquisition in HC DNA
Redundant HQs closed (Bergamo/Paris/Brussels)
All key personnel decisions taken & implemented.
HC’s management philosophy has been consequently
introduced
FTE reductions (1st wave) ahead of plan. Target is to
reach 1,500 reductions by year-end (vs. plan 460)
Synergies significantly increased to €m 400+
Proven HC efficiency programs applied at ITC
Management of cultural differences main focus
HC has strong
track record in
integrating
businesses

Slide 25 – Capital Markets Day 2016 – 10 November 2016
Dr. Dominik von Achten, Deputy Chairman of the Managing Board
HeidelbergCement Capital Markets Day
London, 10 November 2016
Integration of Italcementi
Slide 1 – Capital Markets Day 2016 – 10 November 2016
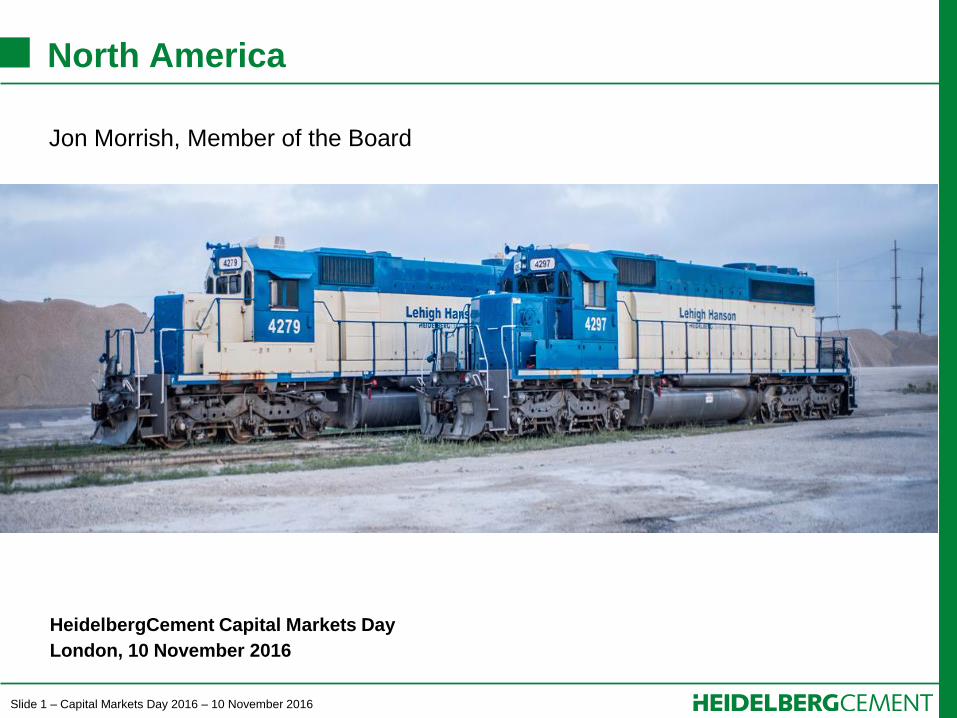
North America
HeidelbergCement Capital Markets Day
London, 10 November 2016
Jon Morrish, Member of the Board

Slide 2 – Capital Markets Day 2016 – 10 November 2016
Disclaimer
This presentation contains forward-looking statements and information. Forward-looking statements and information are
statements that are not historical facts, related to future, not past, events. They include statements about our beliefs and
expectations and the underlying assumptions. These statements and information are based on plans, estimates,
projections as they are currently available to the management of HeidelbergCement. Forward-looking statements and
information therefore speak only as of the date they are made, and we undertake no obligation to update publicly any of
them in light of new information or future events.
By their very nature, forward-looking statements and information are subject to certain risks and uncertainties. A variety
of factors, many of which are beyond HeidelbergCements’ control, could cause actual results to differ materially from
those that may be expressed or implied by such forward-looking statement or information. For HeidelbergCement
particular uncertainties arise, among others, from changes in general economic and business conditions in Germany, in
Europe, in the United States and elsewhere from which we derive a substantial portion of our revenues and in which we
hold a substantial portion of our assets; the possibility that prices will decline to a greater extent than currently
anticipated by HeidelbergCements’ management as a result of continued adverse market conditions; developments in
the financial markets, including fluctuations in interest and exchange rates, commodity and equity prices, debt prices
(credit spreads) and financial assets generally; continued volatility and a further deterioration of capital markets; a
worsening in the conditions of the credit business and, in particular, additional uncertainties arising out of the subprime
financial market and liquidity crisis; the outcome of pending investigations and legal proceedings and actions resulting
from the findings of these investigations; as well as various other factors. Should one or more of these risks or
uncertainties materialize, or should underlying assumptions prove incorrect, actual results may vary materially from
those described in the relevant forward-looking statement or information as expected, anticipated, intended, planned,
believed, sought, estimated or projected.
Unless indicated otherwise, the financial information provided herein has been prepared under International Financial
Reporting Standards (IFRS).
Slide 3 – Capital Markets Day 2016 – 10 November 2016
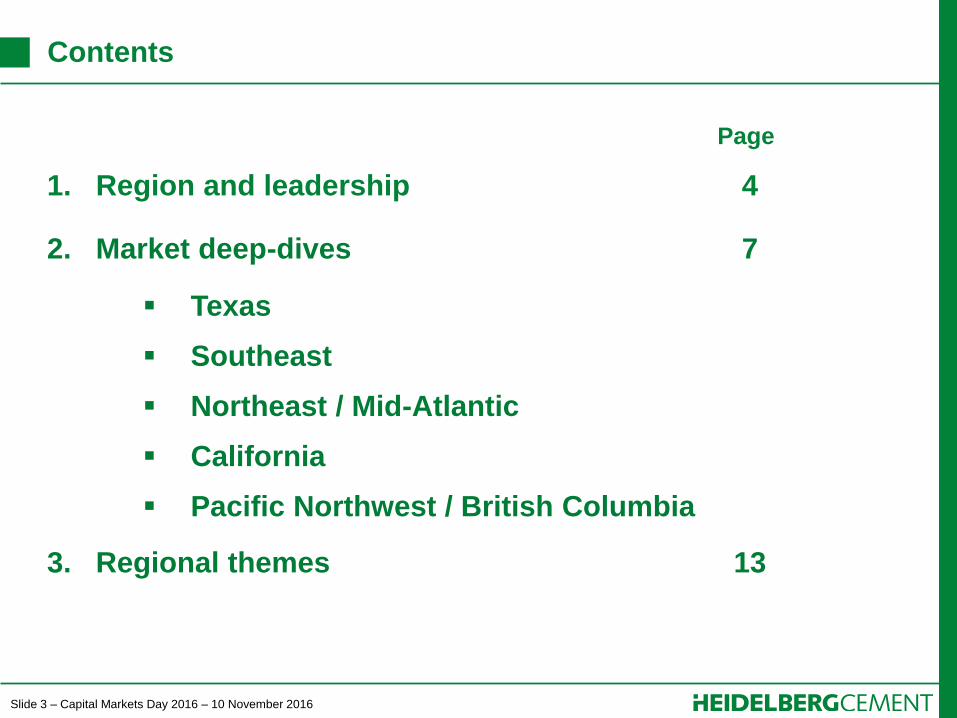
Contents
Page
1. Region and leadership 4
2. Market deep-dives 7
Texas
Southeast
Northeast / Mid-Atlantic
California
Pacific Northwest / British Columbia
3. Regional themes 13

Slide 4 – Capital Markets Day 2016 – 10 November 2016
Contents
Page
1. Region and leadership 4
2. Market deep-dives 7
Texas
Southeast
Northeast / Mid-Atlantic
California
Pacific Northwest / British Columbia
3. Regional themes 13

Slide 5 – Capital Markets Day 2016 – 10 November 2016
NAM – Leading market position, economic growth continues
Strong position - #2 in Cement with Essroc,
Top Aggregates producer, major Ready-Mix
producer
Footprint covers many top 20 fastest-growing
metro areas – Vancouver, Seattle, Bay Area,
Dallas, Houston, San Antonio, Raleigh
Rebounding housing, enacted FAST Act,
steady jobs growth continue to drive demand
Good coverage in most major markets –
Essroc strengthens this
18.6mt CEM capacity1
12.9bnt AGG reserves
€m 4,592 Revenue2
€m 998 EBITDA2
1) Incl. joint ventures
2) Proforma trailing twelve months September 2016, Essroc excl. Martinsburg disposal
Washington DC
Ottawa
Country capital
Regional footprint
Integrated Cement plants
Grinding plants
Blast furnace slag
Cement terminals
Aggregates plants
Aggregates terminals
Ready-Mix plants
Asphalt plants
Concrete pipe plants
19
2
3
78
217
30
172
41
3
Slide 6 – Capital Markets Day 2016 – 10 November 2016
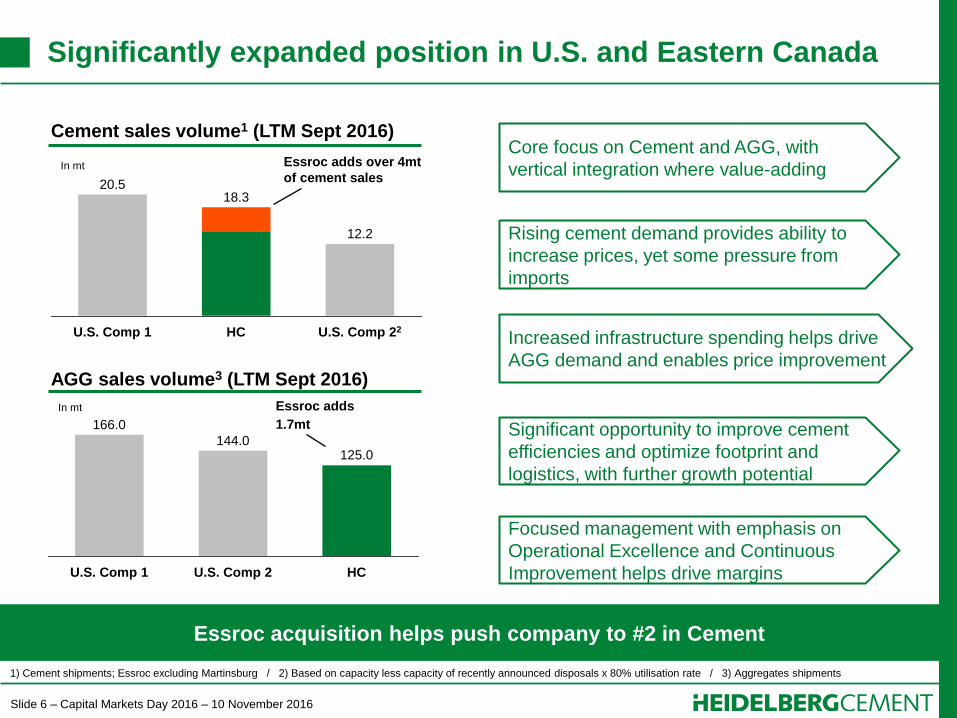
Significantly expanded position in U.S. and Eastern Canada
Essroc acquisition helps push company to #2 in Cement
Cement sales volume1 (LTM Sept 2016)
AGG sales volume3 (LTM Sept 2016)
Essroc adds
1.7mt
Essroc adds over 4mt
of cement sales
U.S. Comp 1
12.2
HC U.S. Comp 22
20.5 18.3
In mt
U.S. Comp 1
125.0
U.S. Comp 2 HC
166.0
144.0
In mt
1) Cement shipments; Essroc excluding Martinsburg / 2) Based on capacity less capacity of recently announced disposals x 80% utilisation rate / 3) Aggregates shipments
Core focus on Cement and AGG, with
vertical integration where value-adding
Rising cement demand provides ability to
increase prices, yet some pressure from
imports
Increased infrastructure spending helps drive
AGG demand and enables price improvement
Significant opportunity to improve cement
efficiencies and optimize footprint and
logistics, with further growth potential
Focused management with emphasis on
Operational Excellence and Continuous
Improvement helps drive margins
Slide 7 – Capital Markets Day 2016 – 10 November 2016
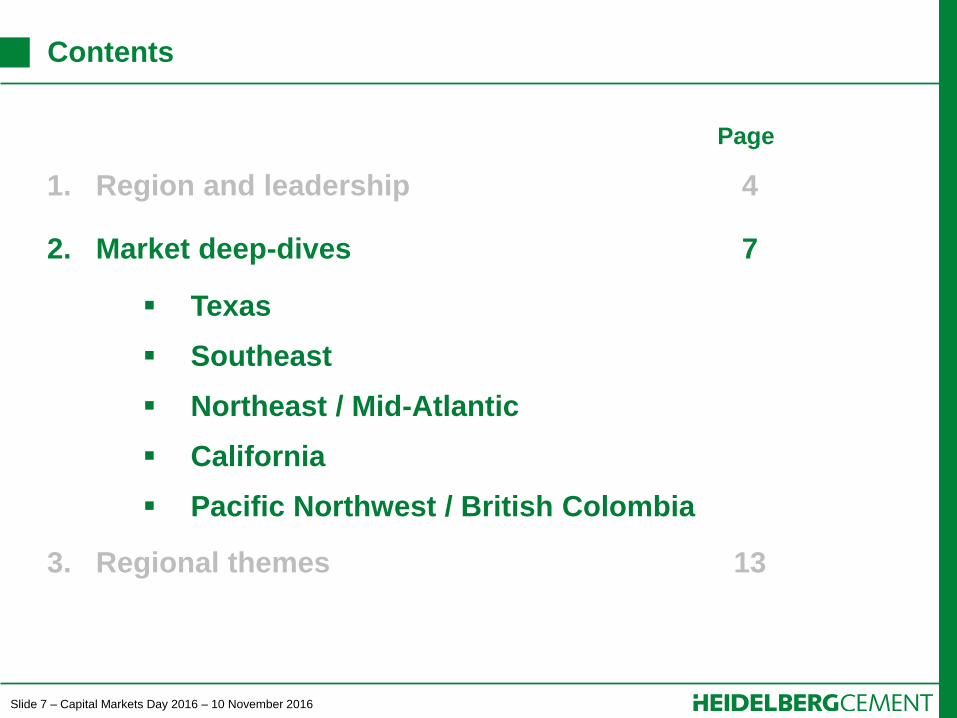
Contents
Page
1. Region and leadership 4
2. Market deep-dives 7
Texas
Southeast
Northeast / Mid-Atlantic
California
Pacific Northwest / British Colombia
3. Regional themes 13

Slide 8 – Capital Markets Day 2016 – 10 November 2016
Texas continues to grow despite a wet year
Market position & strengths
Strong cement position (Texas Lehigh JV) in
Central Texas, Houston, Corpus Christi
Major AGG player DFW, Houston, San Antonio
Vertically integrated in Houston market
(Campbell Ready-mix, Gulf Coast Stabilized)
Strong rail logistics in AGG and Cement
Market trends
North Texas attracting corporations to area
(Toyota, JP Morgan Chase, Liberty Mutual)
South Texas (Austin, San Antonio, Houston
triangle) one of U.S. fastest growing areas
Slowing economic development (oil and gas)
is a short-term economic challenge
Opportunities
Continue to grow AGG footprint across Texas
Continue to expand and enhance distribution
network across both North and South Texas
Further vertical integration upside
Cement capacity and logistics growth
1) Including White Cement plant in Waco, TX and Texas Lehigh Cement, a 50% JV, plant in Buda, TX
Integrated Cement plants 2
Cement terminals 6
Aggregates plants 15
Aggregates terminals 7
Ready-mix plants 20
Operations
Strategic position Integrated CEM plant AGG plant
Grinding plant
CEM terminal
RMC plant

Slide 9 – Capital Markets Day 2016 – 10 November 2016
Well-positioned in growing Sunbelt States
Market position & strengths
Strong AGG business in Georgia, North
Carolina and South Carolina
Cement benefitting from Atlanta recovery
Turnaround of Alabama Ready-mix business
Good cement import and slag business in
Florida
Market trends
Atlanta, Georgia recovery well underway
Atlanta – Charlotte – Raleigh ‘I-85 Corridor’
growing strongly
Raleigh, North Carolina one of the Top 10
fastest-growing metro areas in the U.S.
Opportunities
Cement and slag growth through network
investment
AGG growth by increasing reserves and
further M&A activity
Integrated Cement plants 1
Blast Furnace Slag 1
Cement terminals 16
Aggregates plants 31
Aggregates terminals 6
Ready-mix plants 18
Operations
Strategic position Integrated CEM plant AGG plant
Grinding plant
CEM terminal
RMC plant

Slide 10 – Capital Markets Day 2016 – 10 November 2016
Excellent product footprint across Northeast and Midwest
Market position & strengths
Essroc and Lehigh Cement combination
creates largest player in cement
Good productivity & strict cost control discipline
across large established AGG business
Capital investments in key assets to further
strengthen positions in key markets (e.g.
Chicago, Mid-Atlantic)
Market trends
Solid recovery in recent years for all key
micro-markets across most densely
populated areas of US
Good mix of public and private development,
plus urban renewal driving construction
demand
State infrastructure spending improving
Opportunities
Improving cement logistics network across
legacy and newly acquired Essroc facilities
Bringing Essroc production efficiencies up to
Lehigh levels
Synergies with Essroc acquisition (near-term)
Bolt-on deals to fill in AGG footprint and
further vertical integration
1) Includes Joint Ventures, Essroc excludes Martinsburg
Strategic position Integrated CEM plant AGG plant
Grinding plant
CEM terminal
RMC plant
Integrated Cement plants 10
Grinding plants 1
Blast Furnace Slag 2
Cement terminals 29
Aggregates plants 99
Aggregates terminals 7
Ready-mix plants 30
Asphalt plants 29
Operations1
Slide 11 – Capital Markets Day 2016 – 10 November 2016
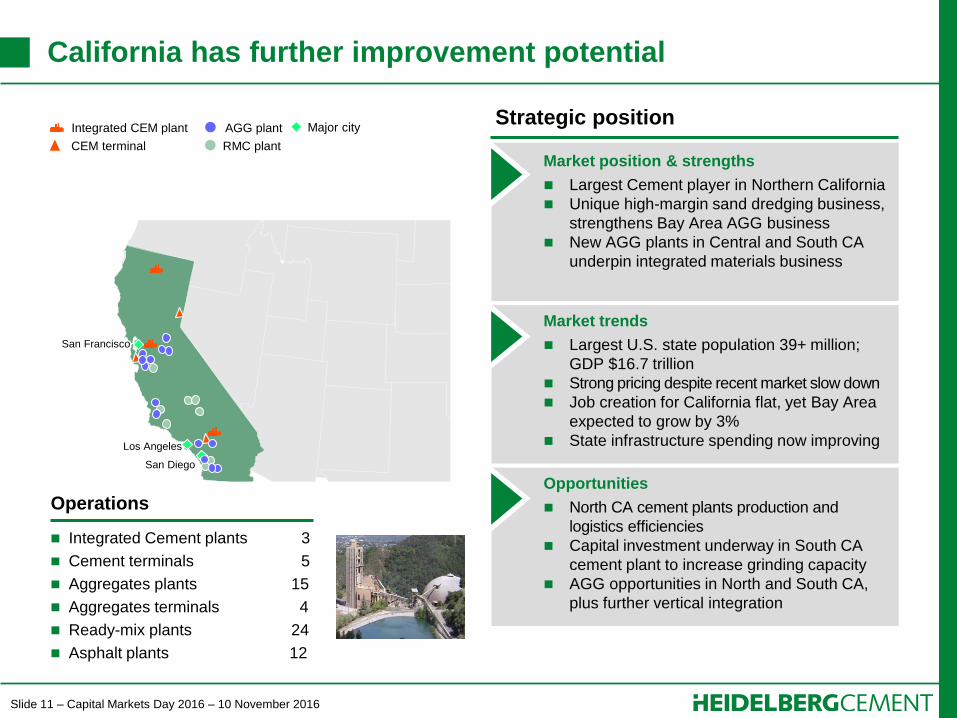
Integrated CEM plant AGG plant
RMC plant CEM terminal
Major city
Market position & strengths
Largest Cement player in Northern California
Unique high-margin sand dredging business,
strengthens Bay Area AGG business
New AGG plants in Central and South CA
underpin integrated materials business
Market trends
Largest U.S. state population 39+ million;
GDP $16.7 trillion
Strong pricing despite recent market slow down
Job creation for California flat, yet Bay Area
expected to grow by 3%
State infrastructure spending now improving
Opportunities
North CA cement plants production and
logistics efficiencies
Capital investment underway in South CA
cement plant to increase grinding capacity
AGG opportunities in North and South CA,
plus further vertical integration
California has further improvement potential
Integrated Cement plants 3
Cement terminals 5
Aggregates plants 15
Aggregates terminals 4
Ready-mix plants 24
Asphalt plants 12
Operations
Strategic position
San Francisco
San Diego
Los Angeles
Slide 12 – Capital Markets Day 2016 – 10 November 2016
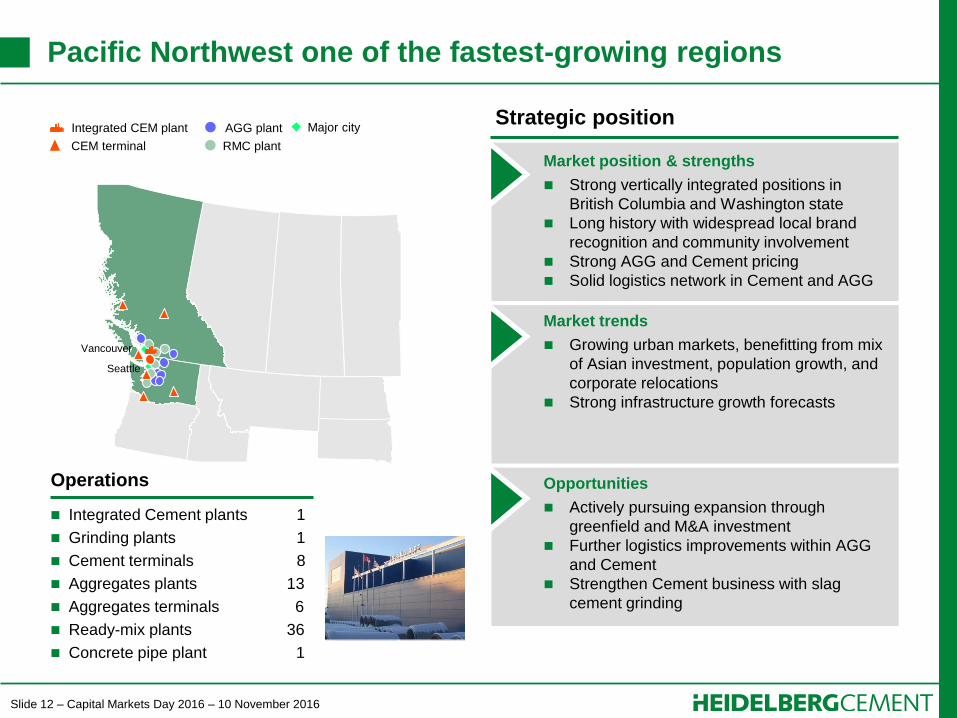
Pacific Northwest one of the fastest-growing regions
Market position & strengths
Strong vertically integrated positions in
British Columbia and Washington state
Long history with widespread local brand
recognition and community involvement
Strong AGG and Cement pricing
Solid logistics network in Cement and AGG
Market trends
Growing urban markets, benefitting from mix
of Asian investment, population growth, and
corporate relocations
Strong infrastructure growth forecasts
Opportunities
Actively pursuing expansion through
greenfield and M&A investment
Further logistics improvements within AGG
and Cement
Strengthen Cement business with slag
cement grinding
Integrated Cement plants 1
Grinding plants 1
Cement terminals 8
Aggregates plants 13
Aggregates terminals 6
Ready-mix plants 36
Concrete pipe plant 1
Operations
Strategic position Integrated CEM plant AGG plant
RMC plant CEM terminal
Major city
Seattle
Vancouver
Slide 13 – Capital Markets Day 2016 – 10 November 2016
Contents
Page
1. Region and leadership 4
2. Market deep-dives 7
Texas
Southeast
Northeast / Mid-Atlantic
California
Pacific Northwest / British Colombia
3. Regional themes 13

Slide 14 – Capital Markets Day 2016 – 10 November 2016
Ottawa
Washington DC
Integrated CEM plant
Grinding plant
CEM terminal
Country capital
Strong cement footprint, with further upside potential
Cement sales volume1 (LTM Sept 2016)
2020F
110.9
45.9
30.9
34.1
2019F
106.1
44.5
29.7
31.9
2018F
26.7
+4.4% +4.2%
101.4
43.2
28.2
30.1
2017F
97.2
41.9
26.8
28.5
2016E
93.2
40.7
25.8
+4.5% +4.6%
Public Non Residential Residential
#2 Cement producer
Essroc and Lehigh cement combination gives
excellent U.S. and Canada plant and rail
terminal network coverage
Significant synergies ($m 100+) already well
underway in operations, logistics, SG&A
Further potential to increase production
capacity and improve efficiencies through
management focus and modest capital
investment PCA Summer 2016 Forecast3
In mt
1) Cement shipments / 2) Based on capacity less capacity of recently announced disposals x 80% capacity utilisation
3) Source: Portland Cement Association; “Public Utility & Other”, “Farm Non-residential” and “Oil & Gas Wells” are included under “Non-residential”.
Essroc adds over 4mt
of cement sales
Comp 1
12.2
HC Comp 22
20.5 18.3
In mt
Slide 15 – Capital Markets Day 2016 – 10 November 2016
MEXICO
CANADA
PACIFIC
OCEAN
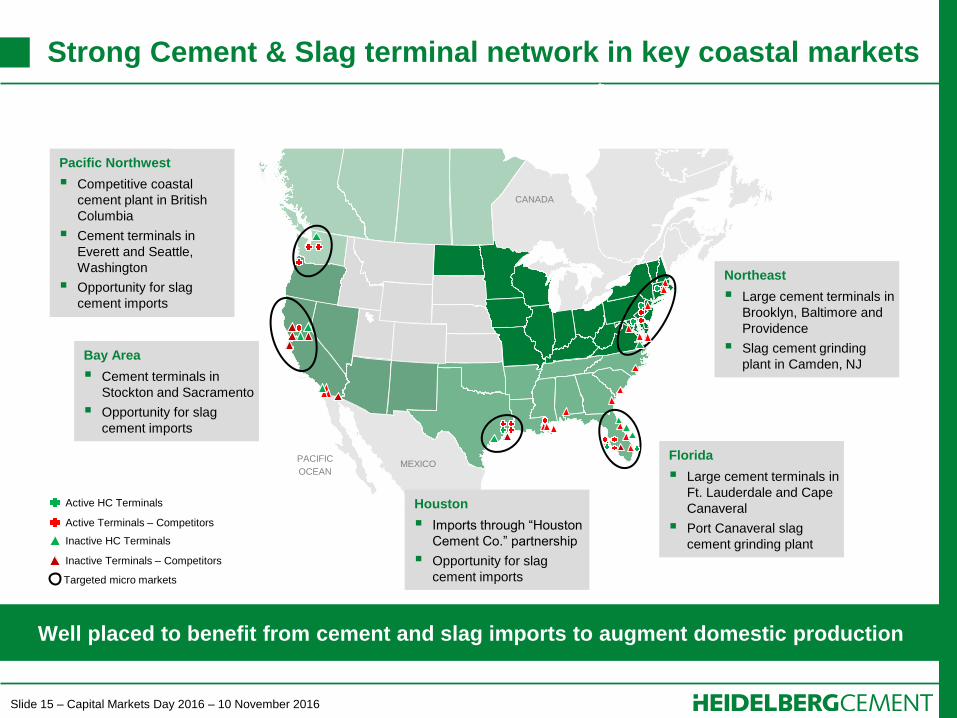
Strong Cement & Slag terminal network in key coastal markets
Well placed to benefit from cement and slag imports to augment domestic production
Florida
Large cement terminals in
Ft. Lauderdale and Cape
Canaveral
Port Canaveral slag
cement grinding plant
Bay Area
Cement terminals in
Stockton and Sacramento
Opportunity for slag
cement imports
Pacific Northwest
Competitive coastal
cement plant in British
Columbia
Cement terminals in
Everett and Seattle,
Washington
Opportunity for slag
cement imports
Houston
Imports through “Houston
Cement Co.” partnership
Opportunity for slag
cement imports
Northeast
Large cement terminals in
Brooklyn, Baltimore and
Providence
Slag cement grinding
plant in Camden, NJ
Inactive Terminals – Competitors
Inactive HC Terminals
Active Terminals – Competitors
Active HC Terminals
Targeted micro markets

Slide 16 – Capital Markets Day 2016 – 10 November 2016
Expanding AGG footprint, strong margin improvement
AGG sales volume1 (LTM Sept 2016)
AGG OIBD margin (LTM Sept 2016)
Top AGG producer
Essroc adds
1.7mt
HC
125.0
U.S. Comp 2
144.0
U.S. Comp 1
166.0
29.4%
Comp 12
26.2%
Comp 23 HC
29.5%
In mt
1) Aggregates shipments / 2) Selling, General & Administrative allocated based an aggregate sales
3) Depreciation calculated as non-cement depreciation
31 plants &
6 terminals
AGG plant
Country capital
AGG terminal
15 plants &
7 terminals
99 plants &
7 terminals
15 plants & 4 terminals
13 plants & 6 terminals
Excellent positions in numerous growth
markets
Industry leading margins through disciplined
cost control and price increases
Continuous improvement culture with
structured efficiency improvement programs
(i.e. CLIMB)
41 plants
3 plants

Slide 17 – Capital Markets Day 2016 – 10 November 2016
North America
HeidelbergCement Capital Markets Day
London, 10 November 2016
Jon Morrish, Member of the Board

Slide 1 – Capital Markets Day 2016 – 10 November 2016
Asia-Pacific
Kevin Gluskie, Member of the Board
HeidelbergCement Capital Markets Day
London, 10 November 2016
Slide 2 – Capital Markets Day 2016 – 10 November 2016
Disclaimer
This presentation contains forward-looking statements and information. Forward-looking statements and information are
statements that are not historical facts, related to future, not past, events. They include statements about our beliefs and
expectations and the underlying assumptions. These statements and information are based on plans, estimates,
projections as they are currently available to the management of HeidelbergCement. Forward-looking statements and
information therefore speak only as of the date they are made, and we undertake no obligation to update publicly any of
them in light of new information or future events.
By their very nature, forward-looking statements and information are subject to certain risks and uncertainties. A variety
of factors, many of which are beyond HeidelbergCements’ control, could cause actual results to differ materially from
those that may be expressed or implied by such forward-looking statement or information. For HeidelbergCement
particular uncertainties arise, among others, from changes in general economic and business conditions in Germany, in
Europe, in the United States and elsewhere from which we derive a substantial portion of our revenues and in which we
hold a substantial portion of our assets; the possibility that prices will decline to a greater extent than currently
anticipated by HeidelbergCements’ management as a result of continued adverse market conditions; developments in
the financial markets, including fluctuations in interest and exchange rates, commodity and equity prices, debt prices
(credit spreads) and financial assets generally; continued volatility and a further deterioration of capital markets; a
worsening in the conditions of the credit business and, in particular, additional uncertainties arising out of the subprime
financial market and liquidity crisis; the outcome of pending investigations and legal proceedings and actions resulting
from the findings of these investigations; as well as various other factors. Should one or more of these risks or
uncertainties materialize, or should underlying assumptions prove incorrect, actual results may vary materially from
those described in the relevant forward-looking statement or information as expected, anticipated, intended, planned,
believed, sought, estimated or projected.
Unless indicated otherwise, the financial information provided herein has been prepared under International Financial
Reporting Standards (IFRS).
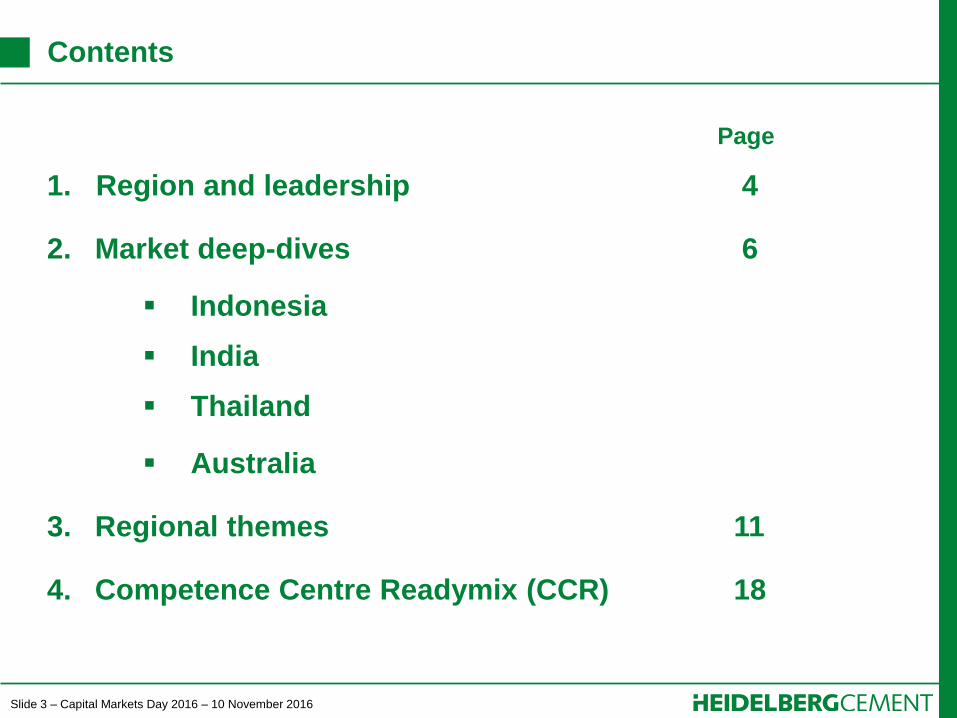
Slide 3 – Capital Markets Day 2016 – 10 November 2016
Contents
Page
1. Region and leadership 4
2. Market deep-dives 6
Indonesia
India
Thailand
Australia
3. Regional themes 11
4. Competence Centre Readymix (CCR) 18

Slide 4 – Capital Markets Day 2016 – 10 November 2016
Contents
Page
1. Region and leadership 4
2. Market deep-dives 6
Indonesia
India
Thailand
Australia
3. Regional themes 11
4. Competence Centre Readymix (CCR) 18
Slide 5 – Capital Markets Day 2016 – 10 November 2016
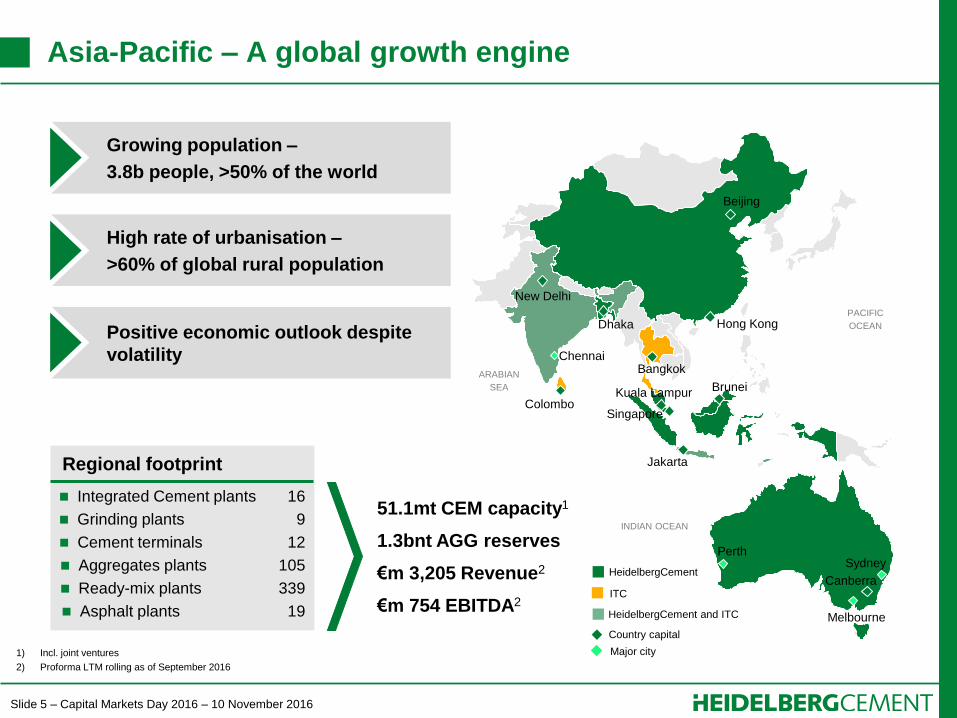
Asia-Pacific – A global growth engine
Growing population –
3.8b people, >50% of the world
High rate of urbanisation –
>60% of global rural population
Positive economic outlook despite
volatility
Regional footprint
Integrated Cement plants 16
Grinding plants 9
Cement terminals 12
Aggregates plants 105
Ready-mix plants 339
Asphalt plants 19
51.1mt CEM capacity1
1.3bnt AGG reserves
€m 3,205 Revenue2
€m 754 EBITDA2
1) Incl. joint ventures
2) Proforma LTM rolling as of September 2016
Canberra
Jakarta
New Delhi
Kuala Lampur
Singapore
Brunei
Bangkok
Hong Kong
Beijing
Colombo
ARABIAN
SEA
INDIAN OCEAN
PACIFIC
OCEAN Dhaka
Chennai
Perth Sydney
Melbourne
HeidelbergCement
ITC
HeidelbergCement and ITC
Country capital
Major city

Slide 6 – Capital Markets Day 2016 – 10 November 2016
Contents
Page
1. Region and leadership 4
2. Market deep-dives 6
Indonesia
India
Thailand
Australia
3. Regional themes 11
4. Competence Centre Readymix (CCR) 18
Slide 7 – Capital Markets Day 2016 – 10 November 2016
MALAYSIA
BRUNEI
ANDAMAN SEA
INDIAN OCEAN
Jakarta
Indonesia – Conquering in West Java, Jakarta area
Integrated Cement plants 3
Cement terminals 8
Aggregates plants 6
Ready-mix plants 39
Operations
Strategic position
Market position & strengths
Most profitable and 2nd largest player with
23mt capacity
Largest player in largest cement market
(West Java)
Strong vertically integrated business and
logistics network in Java
Market trends
Higher demand growth outside Java in 2016
Price pressure in mid-term due to
overcapacity
Well-funded infrastructure program
commencing
Strong GDP growth in mid-term
(2016-2020: CAGR ~ 5.6%)
Opportunities
Significant increase in cement consumption
expected: from ~243kg/capita (2016) to
~ 406kg/capita (2025)
Improve capacity and logistics network to
capture demand outside Java
Strengthen vertically integrated position in
AGG and RMC and bolster sales competency
to support #1 position in home market
Integrated CEM plant AGG plant
CEM terminal RMC plant
Country capital
Slide 8 – Capital Markets Day 2016 – 10 November 2016
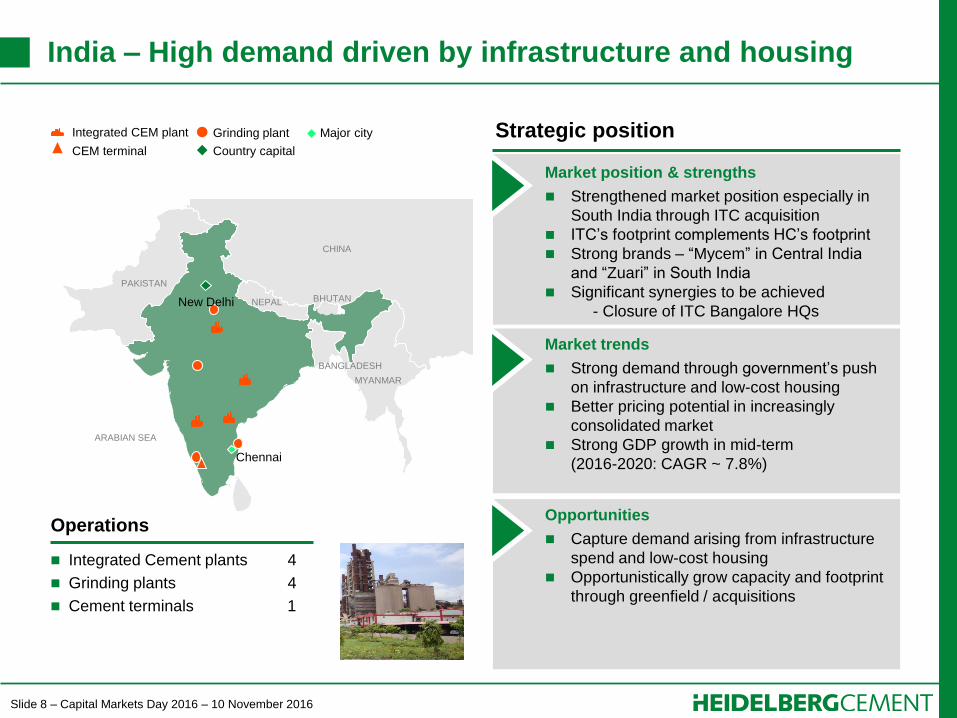
India – High demand driven by infrastructure and housing
Integrated Cement plants 4
Grinding plants 4
Cement terminals 1
Operations
Strategic position
Market position & strengths
Strengthened market position especially in
South India through ITC acquisition
ITC’s footprint complements HC’s footprint
Strong brands – “Mycem” in Central India
and “Zuari” in South India
Significant synergies to be achieved
- Closure of ITC Bangalore HQs
Market trends
Strong demand through government’s push
on infrastructure and low-cost housing
Better pricing potential in increasingly
consolidated market
Strong GDP growth in mid-term
(2016-2020: CAGR ~ 7.8%)
Opportunities
Capture demand arising from infrastructure
spend and low-cost housing
Opportunistically grow capacity and footprint
through greenfield / acquisitions
Integrated CEM plant
CEM terminal Country capital
Grinding plant
ARABIAN SEA
PAKISTAN
CHINA
NEPAL
MYANMAR
BANGLADESH
BHUTAN New Delhi
Chennai
Major city
Slide 9 – Capital Markets Day 2016 – 10 November 2016
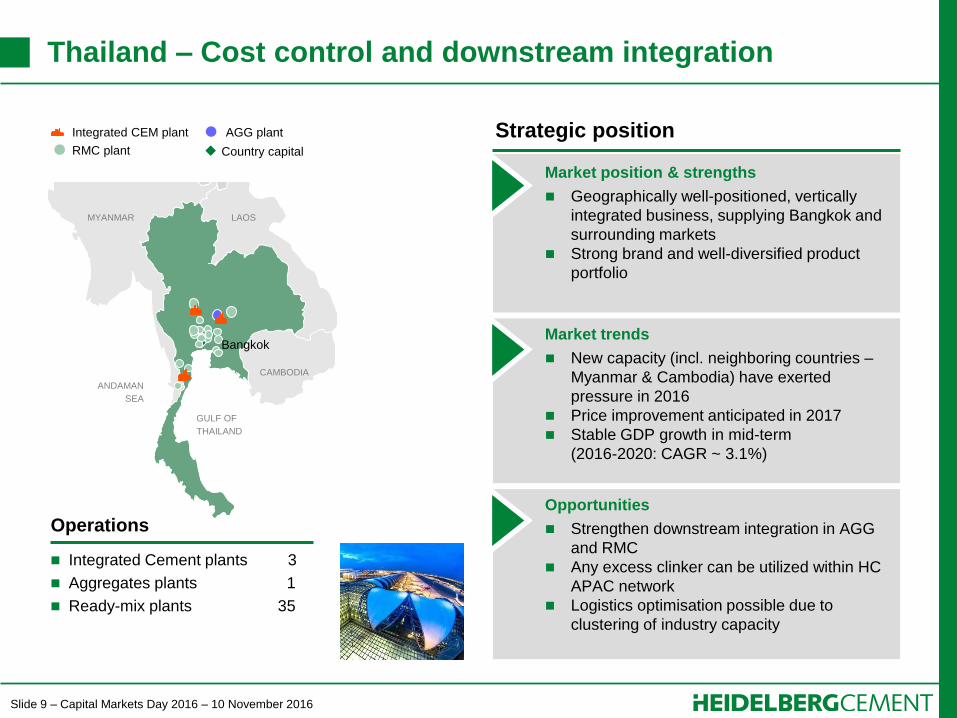
Thailand – Cost control and downstream integration
Integrated Cement plants 3
Aggregates plants 1
Ready-mix plants 35
Operations
Strategic position
Market position & strengths
Geographically well-positioned, vertically
integrated business, supplying Bangkok and
surrounding markets
Strong brand and well-diversified product
portfolio
Market trends
New capacity (incl. neighboring countries –
Myanmar & Cambodia) have exerted
pressure in 2016
Price improvement anticipated in 2017
Stable GDP growth in mid-term
(2016-2020: CAGR ~ 3.1%)
Opportunities
Strengthen downstream integration in AGG
and RMC
Any excess clinker can be utilized within HC
APAC network
Logistics optimisation possible due to
clustering of industry capacity
Integrated CEM plant AGG plant
RMC plant Country capital
CAMBODIA
LAOS MYANMAR
ANDAMAN
SEA
GULF OF
THAILAND
Bangkok

Slide 10 – Capital Markets Day 2016 – 10 November 2016
NEW ZEALAND
PAPUA NEW
GUINEA
INDIAN OCEAN
SOUTH PACIFIC
OCEAN
Canberra
Melbourne
Sydney
Perth
Australia – Growing through volume and margin optimisation
Integrated Cement plants 2
Grinding plants 2
Cement terminals 2
Aggregates plants 80
Ready-mix plants 315
Operations
Strategic position
Market position & strengths
Industry leaders in AGG and RMC
Fast growing business: Best practice in sales
& logistics has enabled business to outpace
market growth
Strong vertically integrated footprint across
all major cities
Strong cash generating business
Market trends
Stable price and volume developments in all
business lines expected for the mid-term
Demand growth to come from major
infrastructure projects; residential
construction slow down from 2017
Stable GDP growth in the mid-term
(2016-2020: CAGR ~ 2.9%)
Opportunities
Optimise volumes and margins in
consolidated market – “Sales is a Science”
Capture demand from major infrastructure
pipeline
Integrated CEM plant AGG plant
Grinding plant RMC plant
Country capital
Major city

Slide 11 – Capital Markets Day 2016 – 10 November 2016
Contents
Page
1. Region and leadership 4
2. Market deep-dives 6
Indonesia
India
Thailand
Australia
3. Regional themes 11
4. Competence Centre Readymix (CCR) 18

Slide 12 – Capital Markets Day 2016 – 10 November 2016
Indonesia – Challenging but promising market
Challenging, oversupplied market with many new
entrants
New entrants adopt low pricing policies to gain
market share
Direct pressure from government on cement prices
Infrastructure spend in 2016 directed away from
Java. Large projects expected in Java from 2017
onwards
Outlook
Strong cement demand growth will outgrow supply
growth in the long run
Leverage Indocement’s superior footprint and cost
leadership position
Increasing demand outside Java to be captured
Young working-age population offers economic
demographic dividend
Urbanisation expected to accelerate
Situation
90
127
2021F
117
+84% 134
+48%
2025F 2018F
112
73
2017F
104
68
2016E
91
64
2015
77
62
Capacity (Supply) Consumption (Demand)
In mt
Cement demand & supply
Slide 13 – Capital Markets Day 2016 – 10 November 2016
Improved Pricing
Consolidation Improved Margins
Optimised Production
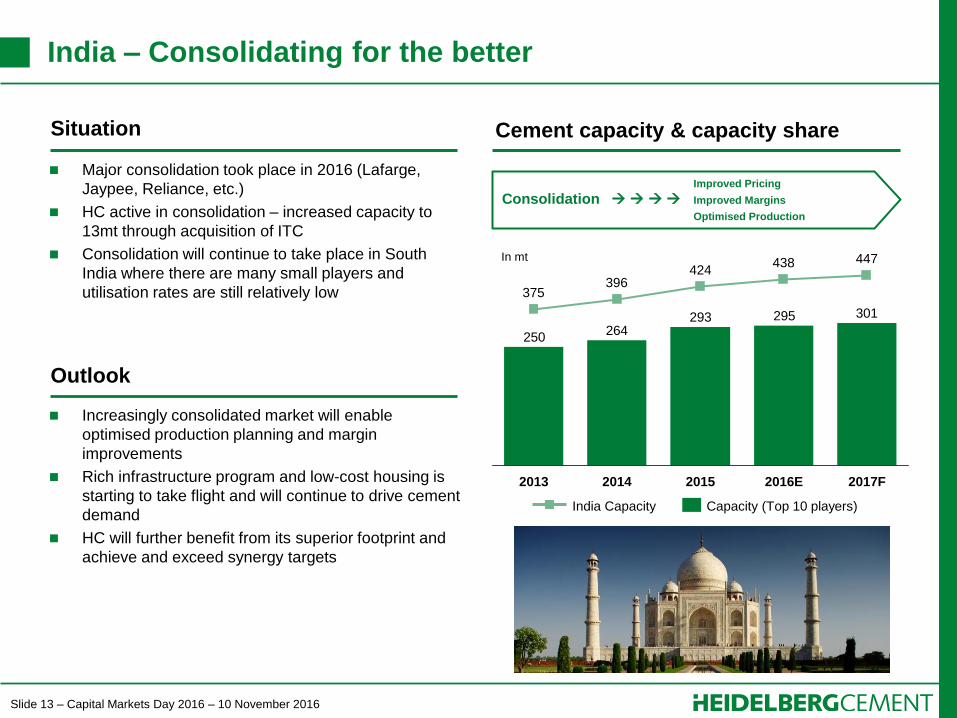
India – Consolidating for the better
301295293264
250
2017F
447
2016E
438
2015
424
2014
396
2013
375
Capacity (Top 10 players) India Capacity
Major consolidation took place in 2016 (Lafarge,
Jaypee, Reliance, etc.)
HC active in consolidation – increased capacity to
13mt through acquisition of ITC
Consolidation will continue to take place in South
India where there are many small players and
utilisation rates are still relatively low
Increasingly consolidated market will enable
optimised production planning and margin
improvements
Rich infrastructure program and low-cost housing is
starting to take flight and will continue to drive cement
demand
HC will further benefit from its superior footprint and
achieve and exceed synergy targets
Outlook
Situation Cement capacity & capacity share
In mt
Slide 14 – Capital Markets Day 2016 – 10 November 2016
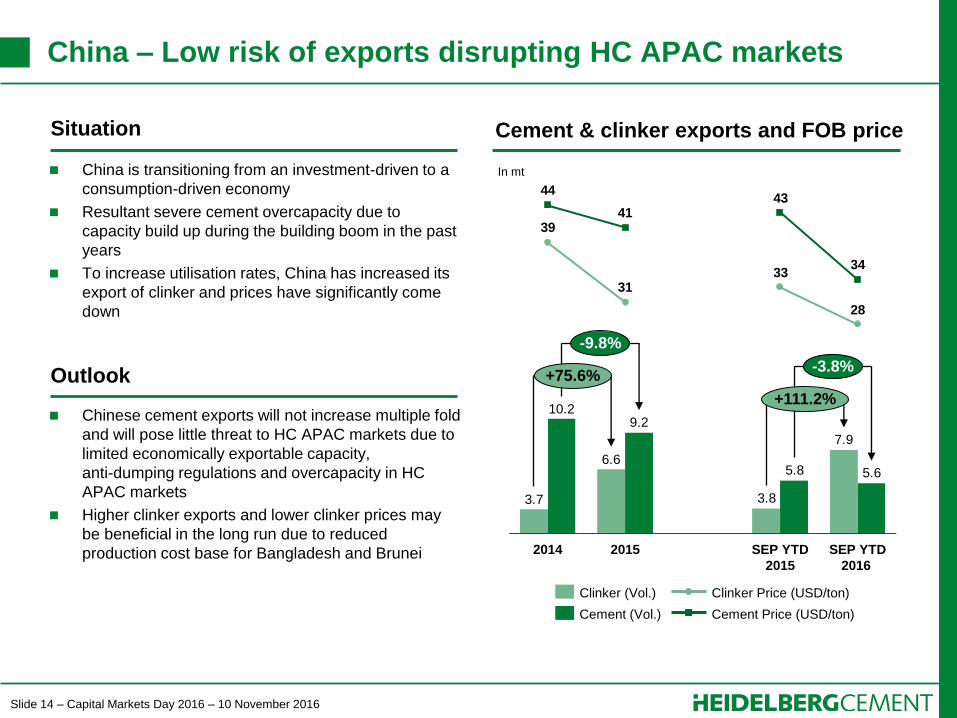
China – Low risk of exports disrupting HC APAC markets
7.9
3.8
6.6
3.7
5.65.8
9.210.2
28
3331
39
34
4341
44
+111.2%
+75.6%
SEP YTD
2016
SEP YTD
2015
2015 2014
-3.8%
-9.8%
Cement Price (USD/ton)
Clinker Price (USD/ton)
Cement (Vol.)
Clinker (Vol.)
China is transitioning from an investment-driven to a
consumption-driven economy
Resultant severe cement overcapacity due to
capacity build up during the building boom in the past
years
To increase utilisation rates, China has increased its
export of clinker and prices have significantly come
down
Chinese cement exports will not increase multiple fold
and will pose little threat to HC APAC markets due to
limited economically exportable capacity,
anti-dumping regulations and overcapacity in HC
APAC markets
Higher clinker exports and lower clinker prices may
be beneficial in the long run due to reduced
production cost base for Bangladesh and Brunei
In mt
Outlook
Situation Cement & clinker exports and FOB price

Slide 15 – Capital Markets Day 2016 – 10 November 2016
Australia – Strong GDP and population growth rates
2.7
2018F
3.0
2017F
2.9 2.9
24.8 2.4
23.9
2015 2020F
26.0
24.4
25.2
25.6
2016E 2019F
2.9
Population (in m) GDP Growth (in %)
Despite fall in mining investment, economy is still
resilient and growing due to current high demand for
housing, mining exports and domestic consumption
Market talk of a “housing bubble” imploding due to
high levels of household debt and housing
unaffordability
Housing market starting to cool with government
cooling measures and banks tightening lending
standards
Demand for housing still high due to strong economic
and population growth, but slowdown expected in
2017 and 2018 due to oversupply
Australian economy expected to continue to grow due
to low interest rates and surging commodity exports
Building materials demand to continue to grow with
major infrastructure projects in the pipelines
Strong price developments expected in 2017
Outlook
Situation Population & GDP growth rates
Slide 16 – Capital Markets Day 2016 – 10 November 2016
Sales is a Science – Strong Australian case acts as role model
“Sales is a Science” roll-out commenced in 2014
Initial focus on RMC and AGG; CEM now underway
Organisational, cultural and structural change put in place to professionalise the Sales Team
Additional resources added and comprehensive training supports change
Recurring OI improvement €
Successful implementation in both AGG and RMC proves SiaS can be used across all business lines
Professional salesforce, delivering value to our customers
CEM
AGG
RMC
Significant gains in margins in the right markets for our products
RE
SU
LT
S

Slide 17 – Capital Markets Day 2016 – 10 November 2016
Demand will continue rapid growth in mid-
term with government push on housing and
infrastructure development
Other APAC markets – Overall, a positive outlook
Outlook
Robust economy - growing income from
expatriate workers
Excellent market with strong demand
growth over the past 10 years
Situation
Brunei
Sri Lanka
Malaysia
Hong Kong
Bangladesh
Market is still adapting to competition law
and prices have slid in 2016
Enormous infrastructure program drawing
to a close
Turmoil with government
Weak property sector as result of past
overbuild
Peace consolidated after 36 year conflict
Cement deficit (approx. 2mt imported)
Oil dependent economy
80% of the cement consumption are
infrastructure projects and investment-
related
Strong residential projects pipeline
Achieve upside through implementation of
“Sales is a Science” and logistics
optimisation
Increased government spend on construction
expected before government elections (likely
in 2017)
Strong infrastructure pipeline
Strong cement demand in near-term arising
from reconstruction and urbanisation
Government’s budget deficit due to weak oil
market, leading to expected fall in cement
consumption from 2018 onwards
China Restructuring of investment driven to a
consumption driven economy
Demand and prices under pressure
Industry consolidation expected to pick up
pace
Price recovery in 2017 expected
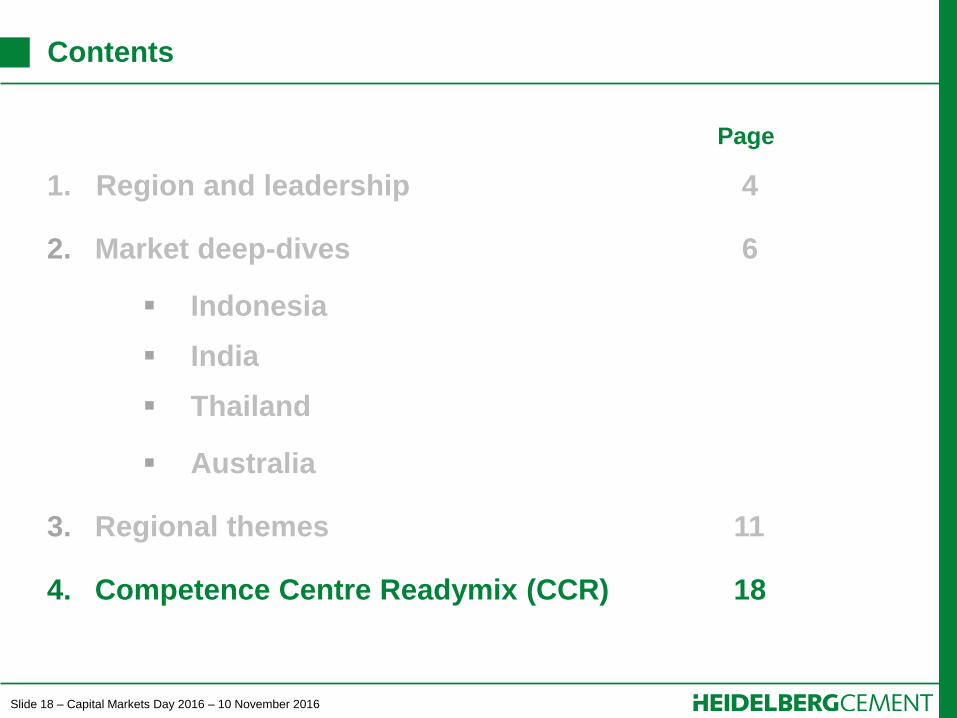
Slide 18 – Capital Markets Day 2016 – 10 November 2016
Contents
Page
1. Region and leadership 4
2. Market deep-dives 6
Indonesia
India
Thailand
Australia
3. Regional themes 11
4. Competence Centre Readymix (CCR) 18

Slide 19 – Capital Markets Day 2016 – 10 November 2016
Significant improvements to be unlocked through implementation of
CCR Strategy
Competence Centre Readymix (CCR) – A centre of excellence
CCR is a clear reflection of HC vertically integrated strategy
Competence Centre Readymix:
A new group focused on improving the total RMC Business
HTC CEM CCM
AGG
CCR RMC
Close collaboration
with Group
Functions
Best practice
implementation
Improve
knowledge
through training
Implement
consistent
management cycle
Identify
improvement
opportunities
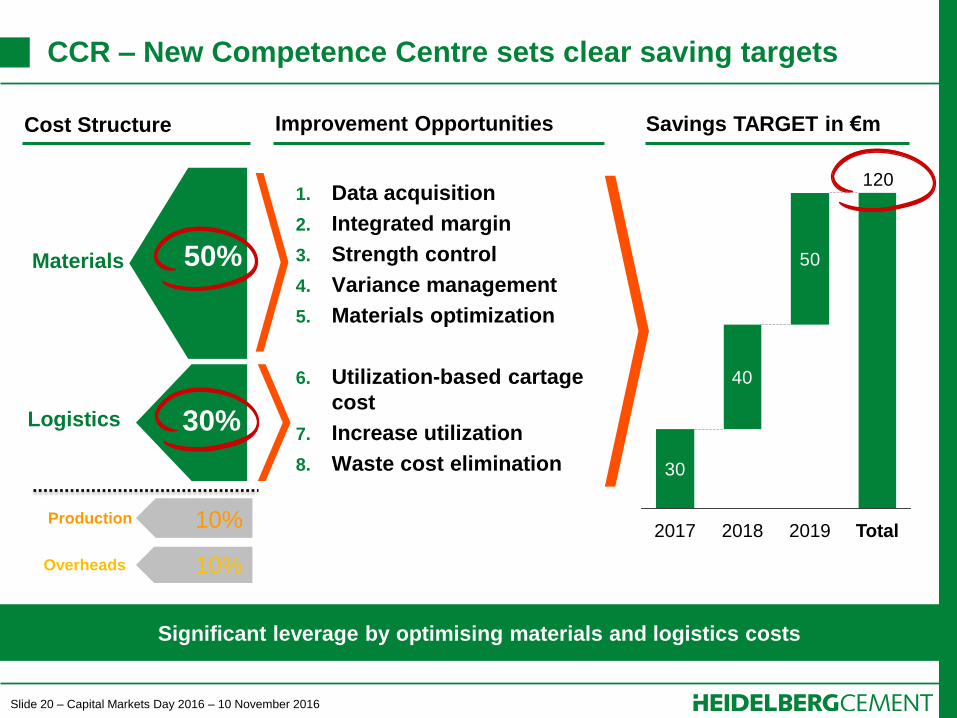
Slide 20 – Capital Markets Day 2016 – 10 November 2016
30
40
50
120
Total 2017 2018 2019
CCR – New Competence Centre sets clear saving targets
Significant leverage by optimising materials and logistics costs
50%
30%
10%
10%
Materials
Logistics
Production
Overheads
Cost Structure Improvement Opportunities Savings TARGET in €m
1. Data acquisition
2. Integrated margin
3. Strength control
4. Variance management
5. Materials optimization
6. Utilization-based cartage
cost
7. Increase utilization
8. Waste cost elimination

Slide 21 – Capital Markets Day 2016 – 10 November 2016
Asia-Pacific
Kevin Gluskie, Member of the Board
HeidelbergCement Capital Markets Day
London, 10 November 2016

Slide 1 – Capital Markets Day 2016 – 10 November 2016
Africa-Eastern Mediterranean Basin
Hakan Gurdal, Member of the Board
HeidelbergCement Capital Markets Day
London, 10 November 2016

Slide 2 – Capital Markets Day 2016 – 10 November 2016
Disclaimer
This presentation contains forward-looking statements and information. Forward-looking statements and information are
statements that are not historical facts, related to future, not past, events. They include statements about our beliefs and
expectations and the underlying assumptions. These statements and information are based on plans, estimates,
projections as they are currently available to the management of HeidelbergCement. Forward-looking statements and
information therefore speak only as of the date they are made, and we undertake no obligation to update publicly any of
them in light of new information or future events.
By their very nature, forward-looking statements and information are subject to certain risks and uncertainties. A variety
of factors, many of which are beyond HeidelbergCements’ control, could cause actual results to differ materially from
those that may be expressed or implied by such forward-looking statement or information. For HeidelbergCement
particular uncertainties arise, among others, from changes in general economic and business conditions in Germany, in
Europe, in the United States and elsewhere from which we derive a substantial portion of our revenues and in which we
hold a substantial portion of our assets; the possibility that prices will decline to a greater extent than currently
anticipated by HeidelbergCements’ management as a result of continued adverse market conditions; developments in
the financial markets, including fluctuations in interest and exchange rates, commodity and equity prices, debt prices
(credit spreads) and financial assets generally; continued volatility and a further deterioration of capital markets; a
worsening in the conditions of the credit business and, in particular, additional uncertainties arising out of the subprime
financial market and liquidity crisis; the outcome of pending investigations and legal proceedings and actions resulting
from the findings of these investigations; as well as various other factors. Should one or more of these risks or
uncertainties materialize, or should underlying assumptions prove incorrect, actual results may vary materially from
those described in the relevant forward-looking statement or information as expected, anticipated, intended, planned,
believed, sought, estimated or projected.
Unless indicated otherwise, the financial information provided herein has been prepared under International Financial
Reporting Standards (IFRS).

Slide 3 – Capital Markets Day 2016 – 10 November 2016
Contents
Page
1. Region and leadership 4
2. Market deep-dives 7
Egypt
Morocco
Sub-Saharan Africa
East Mediterranean
3. Regional themes 13

Slide 4 – Capital Markets Day 2016 – 10 November 2016
Contents
Page
1. Region and leadership 4
2. Market deep-dives 7
Egypt
Morocco
Sub-Saharan Africa
East Mediterranean
3. Regional themes 13

Slide 5 – Capital Markets Day 2016 – 10 November 2016
Africa-Eastern Mediterranean – Expanding in growth areas
Strong presence in growing megacities
(e.g. Cairo, Dar es Salaam, Istanbul)
Seven countries with market share
> 35%
Experienced local management and
established brands
ITC integration on target
Regional footprint
Integrated Cement plants 15
Grinding plants 12
Cement terminals 8
Aggregates plants 12
Ready-mix plants 113
Asphalt plants 2
33.9mt CEM capacity1
0.1bnt AGG reserves
€m 1,868 Revenue2
€m 442 EBITDA2
1) Incl. joint ventures
2) Proforma LTM rolling as of September 2016
Nouakchott
Rabat
Cairo
SOUTH ATLANTIC
OCEAN
GULF OF
ADEN
Monrovia Accra
Porto-Novo
Ouagadougou
Kinshasa
Dar es
Salaam
Maputo
Freetown
Ankara
MEDITERRANEAN
SEA
BLACK SEA
Lomé
Jerusalem
Country capital
HeidelbergCement
ITC
Major city
Istanbul

Slide 6 – Capital Markets Day 2016 – 10 November 2016
ITC integration – Balanced product mix
Well-diversified portfolio across both industrialised and emerging markets
with strong focus on vertical integration in the future
EBITDA contribution
Revenue contribution
Sub Saharan
Africa 33%
48% North Africa
20%
Eastern
Med. Basin
20%
North Africa
Eastern
Med. Basin
Sub Saharan
Africa
42%
38%
Nouakchott
Rabat
Cairo
SOUTH ATLANTIC
OCEAN
GULF
OF
ADEN
Monrovia Accra
Porto-Novo
Ouagadougou
Kinshasa
Dar es Salaam
Maputo
Jerusalem
Ankara
MEDITERRANEAN
SEA
BLACK SEA
Freetown
Country capital
HeidelbergCement
ITC
Lomé
Major city
Istanbul

Slide 7 – Capital Markets Day 2016 – 10 November 2016
Contents
Page
1. Region and leadership 4
2. Market deep-dives 7
Egypt
Morocco
Sub-Saharan Africa
East Mediterranean
3. Regional themes 13

Slide 8 – Capital Markets Day 2016 – 10 November 2016
Egypt – High potential operations
Market position & strengths
Largest player with 14.5mt production
capacity
Strong presence in megacity Cairo (>20m
metropolitan population) with three plants
Five integrated plants located along the most
populated Nile area
Market trends
Robust demand growth expected to continue,
especially in Cairo area
Competition is expected to increase in mid-
term due to new government licenses
Strong GDP growth in mid-term
(2016-2020: CAGR 5.0%)
Opportunities
High energy cost saving potential of up to
USDm 20 p.a., by investing into coal mill to
optimise fuel mix
Potential future synergy savings on fixed costs
Improvement of logistics network and export
options
Strategic position
Integrated Cement plants 5
Ready-mix plants 20
Operations
Integrated CEM plant
RMC plant
Country capital
LIBYA
SUDAN
MEDITERRANEAN
SEA
RED SEA
Cairo

Slide 9 – Capital Markets Day 2016 – 10 November 2016
Strong vertically integrated market positions in Cairo, Egypt
Total capacity of 12mt of grey cement
3 grey cement plants in the heart of the city
1 warehouse located in Delta
20 batching plants, located around Cairo
1 white cement plant with 500kt capacity, 250 km
from Cairo
2 bag factories with 300 mm bags capacity
Market position
Strongest player in Cairo and Egypt
Extensive geographical footprint covering all main
cement markets in Suez, Delta, Cairo and Minya
Ready-mix company supplies to all the megaprojects
and main infrastructure works of the country
Strongest brand equity among competitors: Suez,
Helwan and Tourah cement
Integrated from quarry to market – including
production of bags and transportation
Footprint
Giza
Cairo
Helwan Plant
WH Qalyubia
Cement Warehouse
Cement Factory
Batch Plant
Qattameya Plant
Limestone Quarry
RMC Helwan
Tourah Plant
RMC New Giza
RMC Palm Hills
Slide 10 – Capital Markets Day 2016 – 10 November 2016
Morocco – Vertically integrated with excellent reputation
Market position & strengths
Largest player in southern Morocco
Well-positioned in metropolitan areas (e.g.
Agadir, Casablanca, Marrakech)
Strong vertical integration across cement,
AGG and RMC operations
Market trends
Government spending on large infrastructure
projects will drive demand (e.g. highways,
harbours program)
Several major infrastructure projects about to
commence
GDP growth (2016-2020: CAGR: 4.5%)
Opportunities
Cost savings through use of alternative fuels
Strengthen intercompany alliance with HC
Trading to realise export potential
Potential to improve logistics and sourcing
Strategic position
Integrated Cement plants 3
Grinding plants 2
Aggregates plants 4
Ready-mix plants 26
Operations
WESTERN
SAHARA
ALGERIA
MAURITANIA
ATLANTIC OCEAN
Rabat
Integrated CEM plant AGG plant
Grinding plant RMC plant
Country capital
Slide 11 – Capital Markets Day 2016 – 10 November 2016
Integrated Cement plants 4
Grinding plants 8
Operations
Freetown
Monrovia Accra
Porto-Novo
Ouagadougou
Kinshasa
Dar es Salaam
Maputo
SOUTH
ATLANTIC
OCEAN
GULF
OF
ADEN
Sub-Saharan Africa – Strong growth outlook
Market position & strengths
Strongest player in majority of region
Geographically advantageous position to
supply megacities (e.g. Dar es Salaam, Accra)
Local raw material reserves to cover future
demand growth
Strong local brands (e.g. Ghacem)
Market trends
Increasing cement demand due to high
population growth rates
Price pressure expected due to new local
competitors and increasing overcapacities
Oil prices are critical for growth
GDP growth (2016-2020: CAGR: 3.7%)
Opportunities
Cement consumption per capita is increasing
from low levels <100 kg
Critical need for infrastructure
Synergy potential between neighbour
countries to be evaluated (e.g. Shared-
Service Centres)
Strategic position Integrated CEM plant
Grinding plant
Country capital
Lomé

Slide 12 – Capital Markets Day 2016 – 10 November 2016
Market position & strengths
Strongest player in most populated areas
(e.g. Marmara/Istanbul)
Supplier of major projects (e.g. 3rd Bosporus
bridge, 3rd airport)
Well established brand in local and export
markets
Market trends
Residential sector is expected to grow
significantly with a CAGR of 4.3%
(2016-2020)
Increasing competition from newcomers
The government is spending on infrastructure
Robust GDP growth (2016-2020: CAGR 3.2%)
Opportunities
Geographically positioned to supply future
big projects (e.g. Canakkale bridge, Channel
Istanbul)
Additional export potential to supply clinker
for operations in Western Africa and United
States of America
Strategic position
Integrated Cement plants 3
Grinding plants 1
Cement terminals 9
Aggregates plants 4
Ready-mix plants 38
Operations
Turkey – Key market in Mediterranean basin
Ankara
MEDITERRANEAN
SEA
BLACK SEA
SYRIA
BULGARIA
Integrated CEM plant AGG plant
CEM terminal RMC plant
Country capital
Grinding plant
Major city
Istanbul
Slide 13 – Capital Markets Day 2016 – 10 November 2016
Contents
Page
1. Region and leadership 4
2. Market deep-dives 7
Egypt
Morocco
Sub-Saharan Africa
East Mediterranean
3. Regional themes 13

Slide 14 – Capital Markets Day 2016 – 10 November 2016
Egypt is the largest cement market in Africa
64625957555352
CAGR:+4%
2020F 2019F 2018F 2017F 2016E 2015 2014
Established management with a strong track record
Synergy savings from integration on target
Investments in cost saving technology (e.g. coal mill)
ongoing
Well-diversified product portfolio (grey cement, white
cement, sulphide resistant cement)
Outlook
Geographical advantage for supplying new mega
projects (e.g. New Cairo)
IMF deal expected to contribute to Foreign Direct
Investments
Cement demand is expected to continue its upward
growth path
Situation Cement demand
In mt

Slide 15 – Capital Markets Day 2016 – 10 November 2016
Population growth to increase cement consumption in Africa
2.478
1.679
1.2031.1861.156
2016E 2015 2014
CAGR:+2%
2050F 2030F
Demonstrable correlation between cement demand
and population growth
Cost savings achieved from operational excellence
(e.g. Group projects)
Outperforming integrated plants in Western and
Eastern Africa
Increasing number of local competitors
Volatility of local currencies
Oil price decline affects overall demand growth
Outlook
Fastest growing population, expected to reach a
population of ca. 2.5bn in 2050
Trend for urbanization to be continued, from currently
ca. 40% to > 55% in 2050
HC expansion options in existing and new countries
evaluated on continuous basis
Consolidation of market players expected in
short/mid-term
No major impact on imports expected; development
of freight rates is closely monitored
Situation Population growth
In m
Slide 16 – Capital Markets Day 2016 – 10 November 2016
Africa-Eastern Mediterranean Basin
Hakan Gurdal, Member of the Board
HeidelbergCement Capital Markets Day
London, 10 November 2016

Slide 1 – Capital Markets Day 2016 – 10 November 2016
Driving Growth and Shareholder Returns
Dr Lorenz Näger, Group CFO
HeidelbergCement Capital Markets Day
London, 10 November 2016

Slide 2 – Capital Markets Day 2016 – 10 November 2016
Disclaimer
This presentation contains forward-looking statements and information. Forward-looking statements and information are
statements that are not historical facts, related to future, not past, events. They include statements about our beliefs and
expectations and the underlying assumptions. These statements and information are based on plans, estimates,
projections as they are currently available to the management of HeidelbergCement. Forward-looking statements and
information therefore speak only as of the date they are made, and we undertake no obligation to update publicly any of
them in light of new information or future events.
By their very nature, forward-looking statements and information are subject to certain risks and uncertainties. A variety
of factors, many of which are beyond HeidelbergCements’ control, could cause actual results to differ materially from
those that may be expressed or implied by such forward-looking statement or information. For HeidelbergCement
particular uncertainties arise, among others, from changes in general economic and business conditions in Germany, in
Europe, in the United States and elsewhere from which we derive a substantial portion of our revenues and in which we
hold a substantial portion of our assets; the possibility that prices will decline to a greater extent than currently
anticipated by HeidelbergCements’ management as a result of continued adverse market conditions; developments in
the financial markets, including fluctuations in interest and exchange rates, commodity and equity prices, debt prices
(credit spreads) and financial assets generally; continued volatility and a further deterioration of capital markets; a
worsening in the conditions of the credit business and, in particular, additional uncertainties arising out of the subprime
financial market and liquidity crisis; the outcome of pending investigations and legal proceedings and actions resulting
from the findings of these investigations; as well as various other factors. Should one or more of these risks or
uncertainties materialize, or should underlying assumptions prove incorrect, actual results may vary materially from
those described in the relevant forward-looking statement or information as expected, anticipated, intended, planned,
believed, sought, estimated or projected.
Unless indicated otherwise, the financial information provided herein has been prepared under International Financial
Reporting Standards (IFRS).

Slide 3 – Capital Markets Day 2016 – 10 November 2016
Contents
Page
1. Strong foundation for the future 4
2. ITC acquisition enhances financial profile 6
3. Outlook 2016 13
4. Capital allocation 17
5. Growth, returns and mid-term targets 27

Slide 4 – Capital Markets Day 2016 – 10 November 2016
Contents
Page
1. Strong foundation for the future 4
2. ITC acquisition enhances financial profile 6
3. Outlook 2016 13
4. Capital allocation 17
5. Growth, returns and mid-term targets 27

Slide 5 – Capital Markets Day 2016 – 10 November 2016
Delivering growth, performance and shareholder returns
Strengthened profitability –
EBITDA margin of HC increased to 20% (LTM)1
Synergy targets for ITC increased,
implementation ahead of schedule
Growth of free cash flow contributes to a
strong financial base
Clear focus on reduction of net debt & leverage
– Solid Investment Grade rating
HC is standing
on solid ground
and is well
positioned for
the future
Significantly improved dividend payment –
Share price outperformed DAX and peers
1) HC stand alone without ITC
Slide 6 – Capital Markets Day 2016 – 10 November 2016
Contents
Page
1. Strong foundation for the future 3
2. ITC acquisition enhances financial profile 6
3. Outlook 2016 13
4. Capital allocation 17
5. Growth, returns and mid-term targets 27
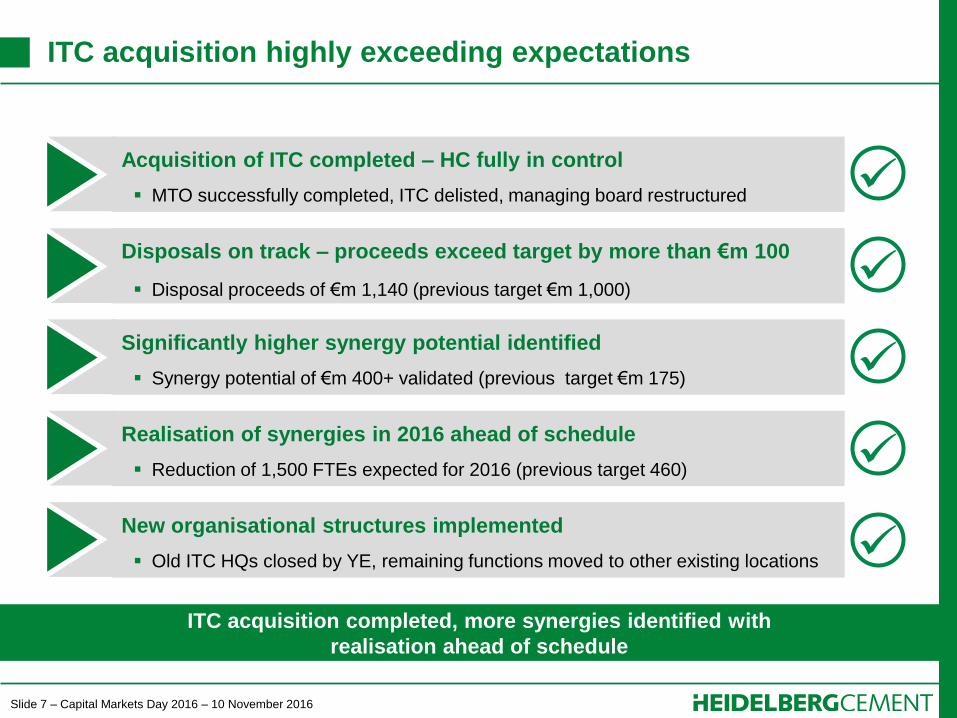
Slide 7 – Capital Markets Day 2016 – 10 November 2016
ITC acquisition highly exceeding expectations
ITC acquisition completed, more synergies identified with
realisation ahead of schedule
Acquisition of ITC completed – HC fully in control
MTO successfully completed, ITC delisted, managing board restructured
Disposals on track – proceeds exceed target by more than €m 100
Disposal proceeds of €m 1,140 (previous target €m 1,000)
Significantly higher synergy potential identified
Synergy potential of €m 400+ validated (previous target €m 175)
Realisation of synergies in 2016 ahead of schedule
Reduction of 1,500 FTEs expected for 2016 (previous target 460)
New organisational structures implemented
Old ITC HQs closed by YE, remaining functions moved to other existing locations

Slide 8 – Capital Markets Day 2016 – 10 November 2016
Disposals on track
Disposal proceeds exceed target by more than €m 100
€m 312
Disposal of
Belgian
business
US$m 660 Disposal of US
assets
€m 239
Disposal of
Italian non-
core assets
€m 1,140 Total
€m 1,000 Target
Expectations at signing Actual disposal proceeds

Slide 9 – Capital Markets Day 2016 – 10 November 2016
Synergies of €m 400+ – Significantly more than expected
Status: All synergies substantiated with detailed implementation plans
and 100% commitment of local owners
75
50
25
25
2016 2017 2018
at least 175
125
50
In €m
Pre-signing synergy expectations Other
Purchasing
Sales & General
Administration
Operational
In €m
Updated run-rate synergy expectations
Key Drivers
Higher than expected synergies in
initial categories (e.g. Operations,
SG&A, Purchasing)
Identification of additional synergies
from Trading, Finance and Market
~10% of target revenue
= best in class
150+
100+
50+
100+
2016 2017 2018
290
135
400+ Thereof €m 110
already implemented
2016 YTD

Slide 10 – Capital Markets Day 2016 – 10 November 2016
1. Closure of duplicate
offices (HQ/local)
2. Benchmark-based
adjustments
3. Reduction of external
contractors
2018
YE
2,450
1,350
2016
YE
2017
YE
2016
YTD
2,550
1,200
1,330
1,500
Key levers
SG&A / Blue Collar – First wave significantly faster than planned
Expected staff reductions (FTE)
SG&A Blue collar
Staff reductions ahead of plan in time and numbers

Slide 11 – Capital Markets Day 2016 – 10 November 2016
Majority of implementation costs incurred in 2016 & 2017
Full synergy benefit from 2019
Total
~ 340
2018
~25
2017
~155
2016
~155
In €m
~45%
~90%
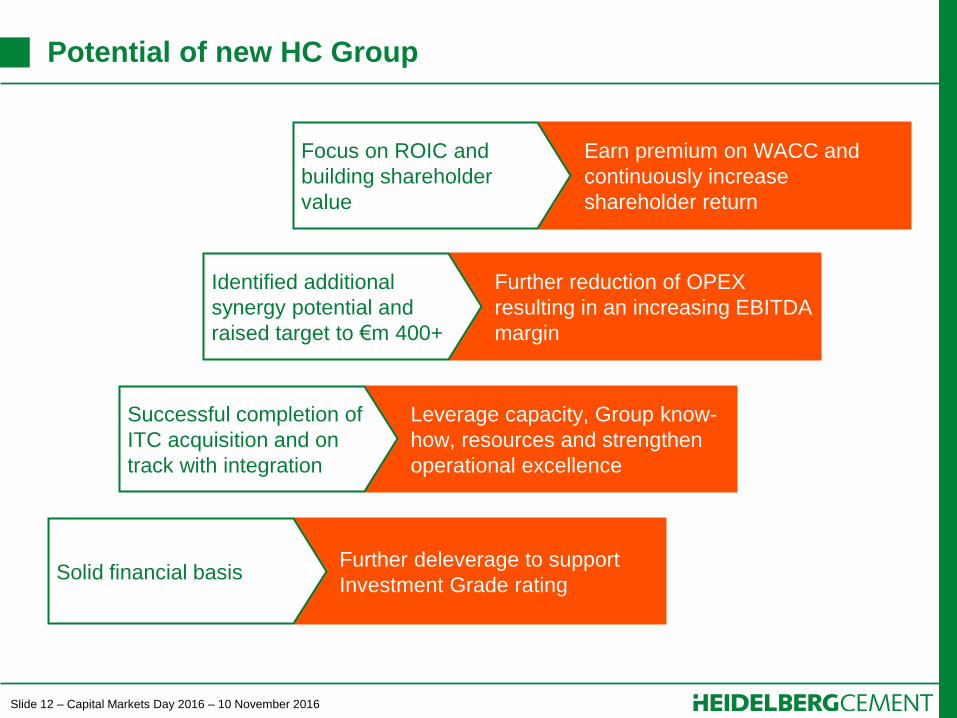
Slide 12 – Capital Markets Day 2016 – 10 November 2016
Further deleverage to support
Investment Grade rating
Leverage capacity, Group know-
how, resources and strengthen
operational excellence
Further reduction of OPEX
resulting in an increasing EBITDA
margin
Potential of new HC Group
Earn premium on WACC and
continuously increase
shareholder return
Focus on ROIC and
building shareholder
value
Identified additional
synergy potential and
raised target to €m 400+
Successful completion of
ITC acquisition and on
track with integration
Solid financial basis
Slide 13 – Capital Markets Day 2016 – 10 November 2016
Contents
Page
1. Strong foundation for the future 4
2. ITC acquisition enhances financial profile 6
3. Outlook 2016 13
4. Capital allocation 17
5. Growth, returns and mid-term targets 27

Slide 14 – Capital Markets Day 2016 – 10 November 2016
Acquisition related increase in net debt to around €m 8,900
Development of net debt within expectations
33901
279
170
788
Net Debt
2016E
< 8,900
Other Operating
Cash flow
~1,000
Capital
increase
PPA Acquisition
ITC (45%)
Operating
Cash flow
~2,100 8,868
ITC debt Net debt
Q3 2016
~1,900
1,800
Acquisition
ITC (55%)
HC Net
Debt Q2
2016
Disposals
proceeds
5,865
In €m

Slide 15 – Capital Markets Day 2016 – 10 November 2016
Refinancing at favourable market conditions
Significant decrease in interest expense as HC pays back high coupon bonds and
benefits from Investment Grade rating
1,637
1,480
2017
1,149
2018 2016 2019
1,000
Average coupon rate p.a.
5.7% 6.9% 6.9% 5.4%
2018 2019 2017 2016 2015
~ Significant reduction in
interest expenses from 2016
to 2019 expected due to
Investment Grade rating
~ Stable interest
expense despite
ITC acquisition
Bond maturity profile (in €m) Interest expense1 (in €m)
1) Exemplary calculation for bonds and debt certificates only; assumes refinancing of maturing bonds with a 2% coupon rate and deleveraging of €m 500 per year

Slide 16 – Capital Markets Day 2016 – 10 November 2016
Upcoming refinancing in 2017
Update EMTN Program in November
Debt maturity profile1 Refinancing plan
A well-balanced debt maturity profile ensures financial flexibility and provides room
for refinancing at attractive conditions
In €m
1) Excluding: reconciliation adjustments of liabilities of €m152; derivative liabilities of €m 75.8; puttable minorities of €m 85.7
HC bond of €m 1,000 due in Jan 2017
ITC bond of €m 500 due in April 2017
Looking for a window with favourable
conditions
Additional benefits from Investment
Grade rating
212
161
755
>2020
3,005
2,250
2020
1,842
1,800
42
2019
1,161
1,000
2018
1,566
1,480
86
2017
1,637
1,849
Bonds Financial instruments

Slide 17 – Capital Markets Day 2016 – 10 November 2016
Contents
Page
1. Strong foundation for the future 4
2. ITC acquisition enhances financial profile 6
3. Outlook 2016 13
4. Capital allocation 17
5. Growth, returns and mid-term targets 27

Slide 18 – Capital Markets Day 2016 – 10 November 2016
How to achieve capital allocating in the Group
A reasonable capital allocation is the basis for success
How to allocate
the Group
Capital?
Group
Capital
How much is
needed?
Working
Capital
Where
should we
invest?
Growth
Capex
How much is
sufficient?
Sustaining
Capex
Capital allocation based on analytical metrics and proven industrial logic
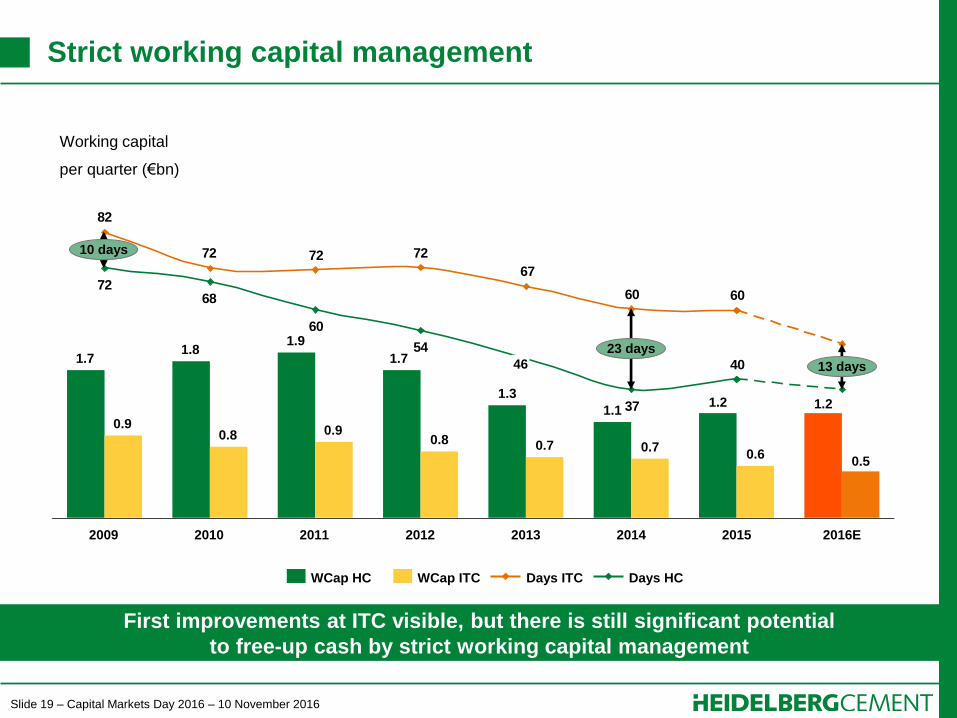
Slide 19 – Capital Markets Day 2016 – 10 November 2016
Strict working capital management
First improvements at ITC visible, but there is still significant potential
to free-up cash by strict working capital management
6060
67
727272
82
40
37
54
60
6872
1.7
2011
0.9
1.9
2010
1.1
2013
0.7
1.3
46
2012
0.8 0.8
1.8
2009
0.9
1.7 13 days
23 days
10 days
2016E
0.5
1.2
2015
0.6
1.2
2014
0.7
Days HC Days ITC WCap ITC WCap HC
Working capital
per quarter (€bn)
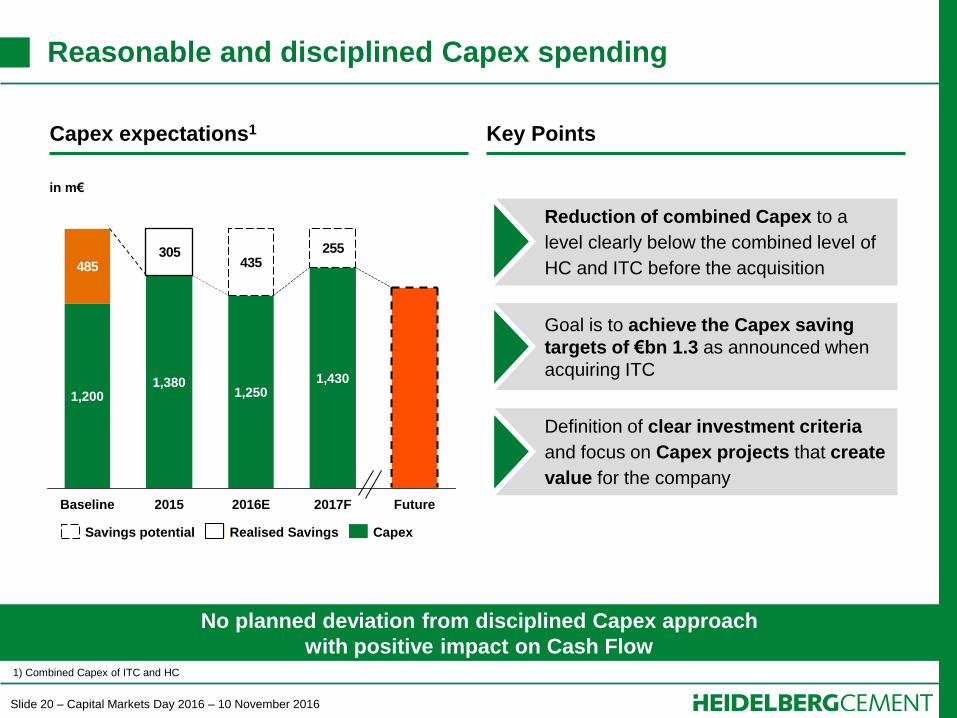
Slide 20 – Capital Markets Day 2016 – 10 November 2016
Reasonable and disciplined Capex spending
No planned deviation from disciplined Capex approach
with positive impact on Cash Flow
Reduction of combined Capex to a
level clearly below the combined level of
HC and ITC before the acquisition
Goal is to achieve the Capex saving
targets of €bn 1.3 as announced when
acquiring ITC
Definition of clear investment criteria
and focus on Capex projects that create
value for the company
in m€
305485
255435
1,200
Baseline 2016E 2015
1,380 1,250
Future 2017F
1,430
Capex Realised Savings Savings potential
1) Combined Capex of ITC and HC
Capex expectations1 Key Points
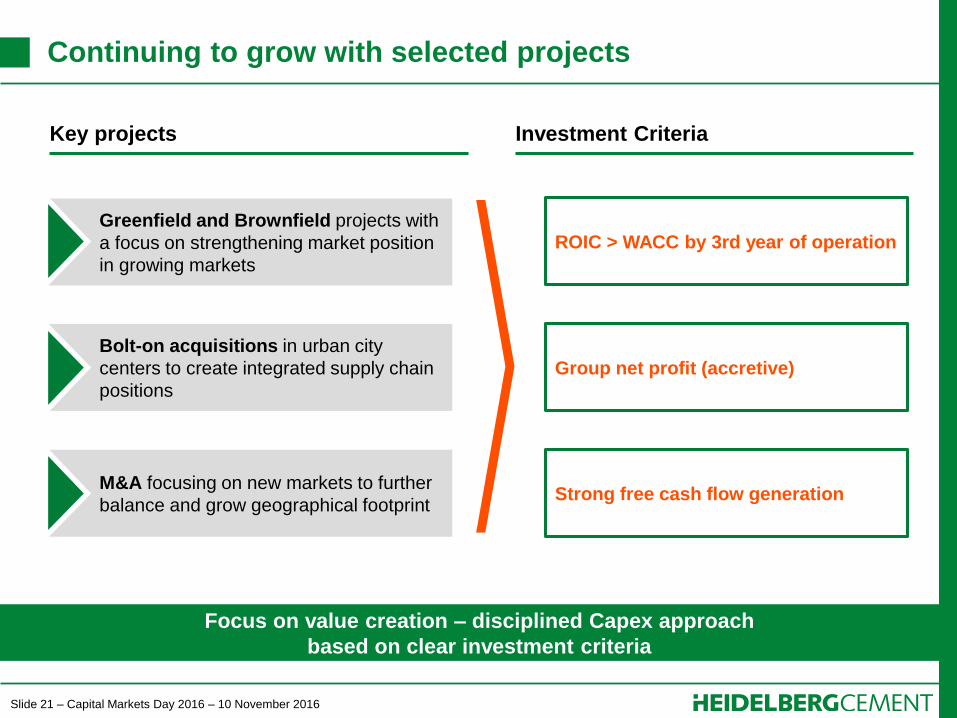
Slide 21 – Capital Markets Day 2016 – 10 November 2016
Continuing to grow with selected projects
Focus on value creation – disciplined Capex approach
based on clear investment criteria
Greenfield and Brownfield projects with
a focus on strengthening market position
in growing markets
ROIC > WACC by 3rd year of operation
Bolt-on acquisitions in urban city
centers to create integrated supply chain
positions
Group net profit (accretive)
M&A focusing on new markets to further
balance and grow geographical footprint Strong free cash flow generation
Key projects Investment Criteria

Slide 22 – Capital Markets Day 2016 – 10 November 2016
Targeted and disciplined approach to investment projects
A stringent analysis of all potential investments ensures
that Capex projects meet targets
Market attractiveness
Fit with current footprint
Project attractiveness
Strategy
Strategic fit, markets and
competition
Tools
DCF analysis
Financial statement
analysis
Monte Carlo Simulation
Risk assessment
Projected ROIC against
WACC
EPS accretion
Financial target analysis
(covenants, leverage)
Finance
Financial attractiveness
and risk evaluation
Project resources
Geological assessment
Engineering requirements
Supply constraints
Technical
Technical aspects of
any project
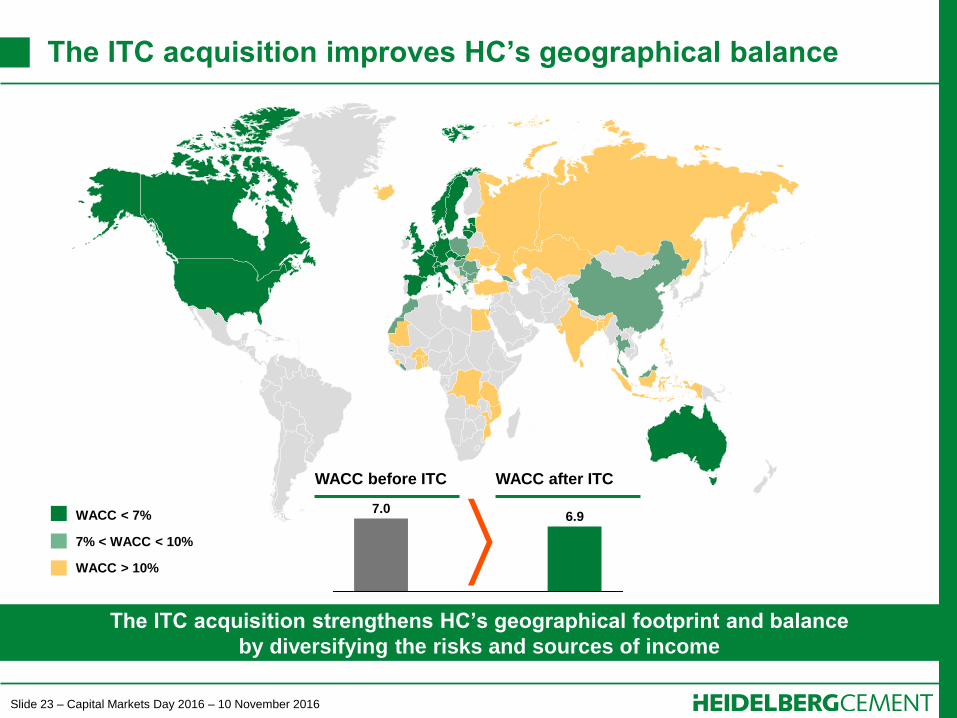
Slide 23 – Capital Markets Day 2016 – 10 November 2016
The ITC acquisition improves HC’s geographical balance
The ITC acquisition strengthens HC’s geographical footprint and balance
by diversifying the risks and sources of income
6.9 7.0
WACC before ITC WACC after ITC
WACC < 7%
7% < WACC < 10%
WACC > 10%

Slide 24 – Capital Markets Day 2016 – 10 November 2016
... and better balances HC's currency portfolio
Well balanced EBITDA generation
12% 12%
8%7% 5%
8% 8% 8%6%
11% 9% 9%
6%
6% 9%
7%
12% 10% 8% 8%
22%19%
15%11%
11%11%
10%15%
17%23% 24%
9%10%
6%
5% 8%
14%
2014 EBITDA 2015 EBITDA
Other
Scandinavia
AUD
CAD
GBP
EGP+MAD+THB
East EU
EUR
USD
LTM Sep 2016
IDR
2013 EBITDA
HeidelbergCement standalone Proforma combined

Slide 25 – Capital Markets Day 2016 – 10 November 2016
Development of ROIC
A high asset turnover is a key lever to increasing the ROIC,
even when the EBIT margin is stable
Dec 2012 Dec 2013 Dec 2014 Dec 2015 Sept 2016
Invested
Capital1 21,063 20,086 21,311 21,271 25,460
Turnover 14,020 12,128 12,614 13,465 14,319
Asset
turnover 66.6% 60.4% 59.2% 63.3% 56.2%
OPAT2 1,222 1,225 1,428 1,532 1,698
EBIT margin 8.7% 10.1% 11.3% 11.4% 11.8%
ROIC 5.8% 6.1% 6.7% 7.2% 7.0%
1) Sum of Equity and Net Debt (at the end of the quarter) / 2) Operating profit after tax = sum of EBIT (excl. AOR) and tax payments (12 months)

Slide 26 – Capital Markets Day 2016 – 10 November 2016
Creating value and earning cost of capital
Increasing the ROIC and earning a significant premium on our cost of capital
is a main target for HC
3
4
5
6
7
8
9
10
11
2009 2010 2011 2012 2013 2014 2015 2016 2017 2018 2019
3.3
5.6 5.81
5.0
6.71
7.2
6.11
ROIC
in %
Before ITC acquisition After ITC acquisition
Reduction of WACC
after ITC acquisition
1) Adjusted for exceptional items
WACC: 6.9%
ROIC above
WACC
by end of 2016

Slide 27 – Capital Markets Day 2016 – 10 November 2016
Contents
Page
1. Strong foundation for the future 4
2. ITC acquisition enhances financial profile 6
3. Outlook 2016 13
4. Capital allocation 17
5. Growth, returns and mid-term targets 27
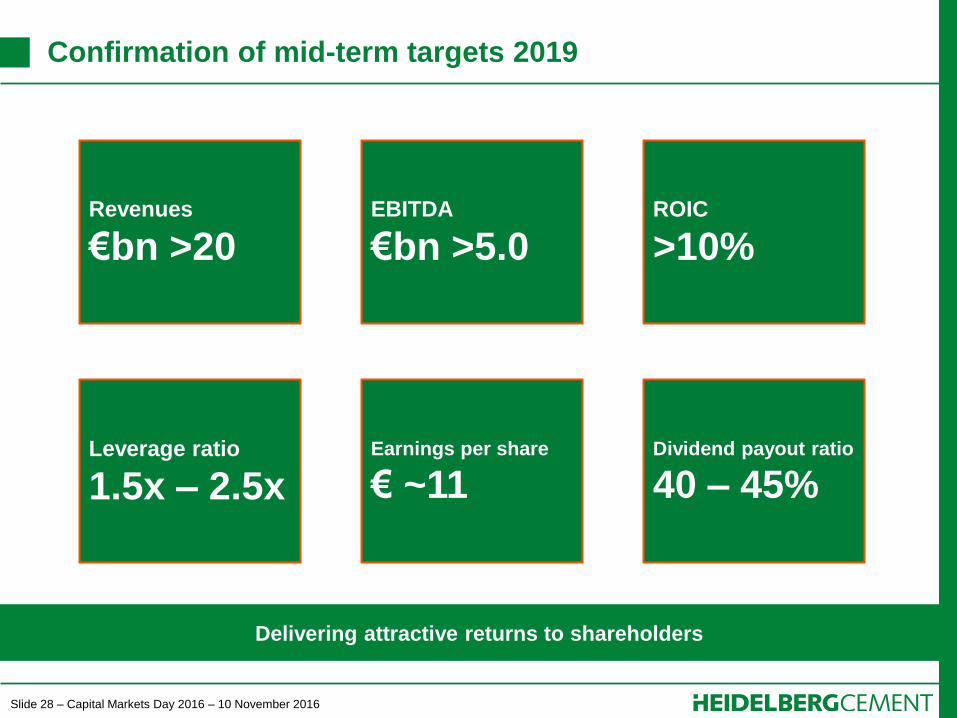
Slide 28 – Capital Markets Day 2016 – 10 November 2016
Confirmation of mid-term targets 2019
Delivering attractive returns to shareholders
Revenues
€bn >20 EBITDA
€bn >5.0 ROIC
>10%
Leverage ratio
1.5x – 2.5x Earnings per share
€ ~11 Dividend payout ratio
40 – 45%

Slide 29 – Capital Markets Day 2016 – 10 November 2016
Mid-term targets 2019 unchanged
Revenue EBITDA ROIC Leverage EPS Payout ratio
> €bn 20 > €bn 5 >10% 1.5 – 2.5x ~ € 11 40% – 45%
Market pressure in Indonesia
Increased competition in Africa
US infrastructure program
ITC / increased synergies
New efficiency programs “CCR” & “Sales is a Science”
Recovery in Europe
Downsides
Upsides
Balanced macroeconomic outlook
Impact of the elections in US, Italy, Germany and France
Consequences of Brexit Uncertainties

Slide 30 – Capital Markets Day 2016 – 10 November 2016
Strong free cash flow generation
5 years cumulative FCF2
€bn >10 1) Excluding proceeds from Building Products disposal
2) Before growth Capex and disposals
Free cash flow generation in €bn
€m ~250 reduction in interest
expense between 2014 and 2019
Total €bn 1.3 Capex savings in
five years
Stronger operating cash flow
generation
Sources of cash
2015 2019 2016 2017
1.21
2018
2.62

Slide 31 – Capital Markets Day 2016 – 10 November 2016
Shifting cash towards growth and shareholder returns
Deleveraging for solid IG ratings1
Return capital
to shareholders
Disciplined M&A
Potential
share
buy-back
Notes: 5 year cumulative figures (2015-2019)
1) Excluding proceeds from BP disposal;
2) Cash available after minority dividend payments and excluding inflows from potential re-leveraging to target leverage ratio
Free cash flow generation1
Progressive dividend €bn > 3.8
€bn ~10.9
€bn ~1.3
Invest in organic growth
€bn ~2.0
Available cash2
€bn > 2.0
Additional leverage potential
at 1.5x: €bn ~4 at 2.0x: €bn ~6 at 2.5x: €bn ~8
Capital allocation strategy
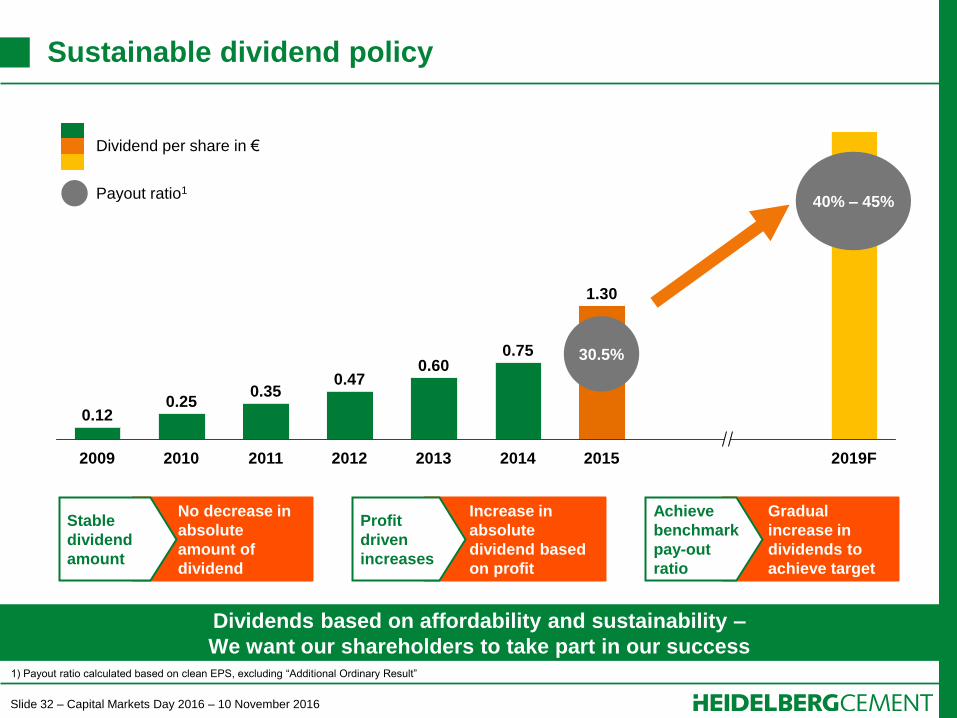
Slide 32 – Capital Markets Day 2016 – 10 November 2016
Sustainable dividend policy
Dividends based on affordability and sustainability –
We want our shareholders to take part in our success
2019F 2015
1.30
2014
0.75
2013
0.60
2012
0.47
2011
0.35
2010
0.25
2009
0.12
40% – 45%
30.5%
Dividend per share in €
Payout ratio1
1) Payout ratio calculated based on clean EPS, excluding “Additional Ordinary Result”
No decrease in
absolute
amount of
dividend
Stable
dividend
amount
Increase in
absolute
dividend based
on profit
Profit
driven
increases
Gradual
increase in
dividends to
achieve target
Achieve
benchmark
pay-out
ratio
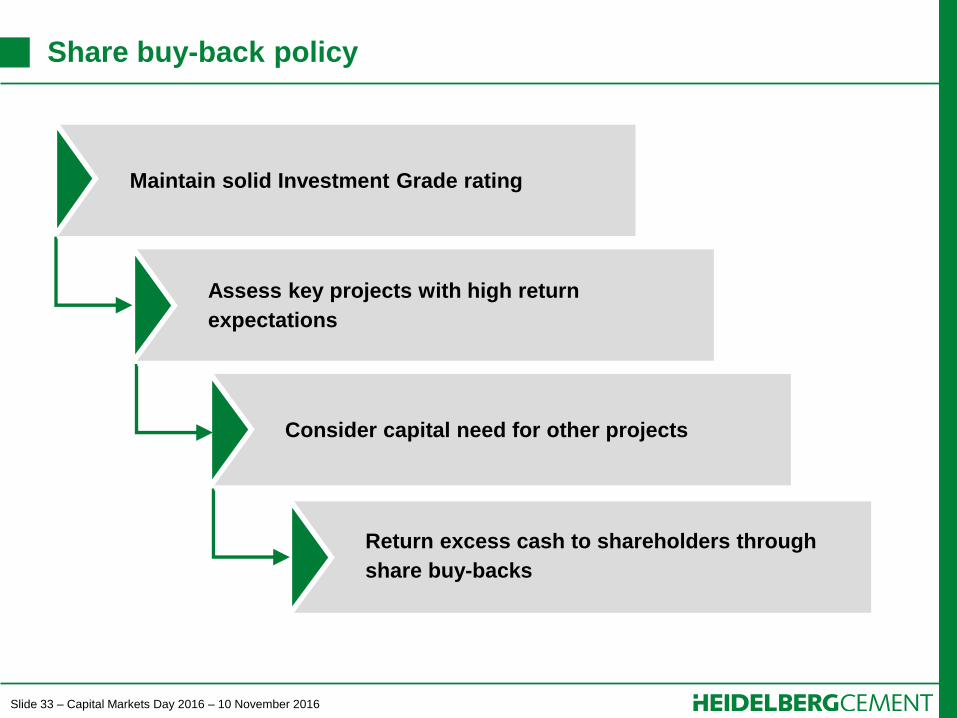
Slide 33 – Capital Markets Day 2016 – 10 November 2016
Share buy-back policy
Maintain solid Investment Grade rating
Assess key projects with high return
expectations
Consider capital need for other projects
Return excess cash to shareholders through
share buy-backs

Slide 34 – Capital Markets Day 2016 – 10 November 2016
Driving Growth and Shareholder Returns
Dr Lorenz Näger, Group CFO
HeidelbergCement Capital Markets Day
London, 10 November 2016