DRIVING FORCES OF LAND-USE CHANGE - Significance · Driving forces of land-use change Zondag and...
16
Driving forces of land-use change Zondag and Borsboom 1 DRIVING FORCES OF LAND-USE CHANGE Paper prepared for the 49 th ERSA conference August 2009 Lodz, Poland Authors: Barry Zondag Significance ([email protected]) Judith Borsboom Netherlands Environmental Assessment Agency (PBL) ([email protected]) Abstract This paper presents a multi-sectoral overview of the key driving forces of land-use change. As part of the design phase for a new land-use model for the Netherlands Environmental Assessment Agency, an overview was made of spatial processes and policies affecting land use. The overview was based on five sector-specific research efforts into the driving forces of land-use change, for each of the five largest land-occupying sectors (housing, employment, nature, water, and agriculture). Each research effort had a similar set-up and consisted of a leading expert, responsible for preparing a note on driving forces for a particular sector, and the input from leading experts, using workshops to collect views and insights from the field. In addition to the five largest land-using sectors, the research focused on the themes transport, energy, and recreation, which are related to nearly al other sectors as they have a large influence on spatial developments and evaluation indicators. For this paper, underlying research was used for discussing main drivers for the different sectors. Based on insights into main and upcoming driving forces, the main challenges to be addressed in the development of a new land-use model were identified.
Transcript of DRIVING FORCES OF LAND-USE CHANGE - Significance · Driving forces of land-use change Zondag and...
Driving forces of land-use change Zondag and Borsboom
1
DRIVING FORCES OF LAND-USE CHANGE Paper prepared for the 49
th ERSA conference
August 2009
Lodz, Poland
Authors:
Barry Zondag
Significance
Judith Borsboom
Netherlands Environmental Assessment Agency (PBL)
Abstract This paper presents a multi-sectoral overview of the key driving forces of land-use change.
As part of the design phase for a new land-use model for the Netherlands Environmental
Assessment Agency, an overview was made of spatial processes and policies affecting land
use. The overview was based on five sector-specific research efforts into the driving forces of
land-use change, for each of the five largest land-occupying sectors (housing, employment,
nature, water, and agriculture). Each research effort had a similar set-up and consisted of a
leading expert, responsible for preparing a note on driving forces for a particular sector, and
the input from leading experts, using workshops to collect views and insights from the field.
In addition to the five largest land-using sectors, the research focused on the themes transport,
energy, and recreation, which are related to nearly al other sectors as they have a large
influence on spatial developments and evaluation indicators.
For this paper, underlying research was used for discussing main drivers for the different
sectors. Based on insights into main and upcoming driving forces, the main challenges to be
addressed in the development of a new land-use model were identified.
Driving forces of land-use change Zondag and Borsboom
2
1. INTRODUCTION
The Netherlands Environmental Assessment Agency (PBL) actively applies land-use models
to support their policy studies. PBL land-use models, the Land Use Scanner (Hilferink and
Rietveld 1999) and the Environment Explorer (Nijs et al. 2001), since 1997, have contributed
substantially to several large-scale studies to research findings and policy recommendations
(see RIVM and Stichting DLO 2001 and 2002, MNP 2004a, MNP 2004b, MNP 2007,
Deltacommissie 2008, VROM 2008). The PBL now has the ambition to build a new or
second-generation land-use model. The new model will build on our experiences in this
field, and on advice obtained from an external audit committee on land-use models, which
evaluated the PBL models in 2007 (Timmermans et al. 2007). The main observation from the
audit committee stated that the existing land-use models of PBL were among the best in their
field, but the socio-economic activity perspective should be further embraced to adequately
address environmental risk assessments involving population distribution data, as well as
upcoming questions regarding prices and management. This implied either a substantial
redesign of the model, or the development of a new land-use model.
The ambition to make a new model (or adapt an existing one) opened up a rare opportunity to
look carefully at the building blocks of such modelling. What were the upcoming policy
issues, which drivers and processes needed to be modelled, and what was state-of-the-art in
land-use modelling? This paper by Borsboom and Zondag (2009) gives an overview of these
different components and discusses how these components were integrated into the design of
a new land-use model. The analysis or inventory of the driving forces behind land-use
change, as presented in this paper, is one of the components of this model’s design phase.
The results from the analysis present the driving forces and the important processes which
need to be included in the new land-use model.
The analysis of the driving forces focused on the five major land-occupying sectors in the
Netherlands: agriculture, housing, water, nature and employment. For each sector, a
comparable approach was used, consisting of a leading expert preparing a note on the driving
forces behind land use for that sector. Such a note reflected the knowledge of the leading
expert, and was supplemented – in one or two expert workshop – with the knowledge of an
expert panel on relevant driving forces and the impact on the spatial distribution of activities
and land use. Participants from different backgrounds, such as academic institutions,
government agencies and consultancy, were invited to these workshops, to capture the
differences in knowledge and opinions. Five sector-specific reports on the driving forces
behind land use resulted from this activity.
In addition to these five sectors, three themes were identified: transport, energy and
recreation, which interact strongly with the sectors and influence land-use predominantly
indirectly. For each theme, separate notes were written internally at PBL, based on literature
review and expert interviews. It should be noted that the sectors influence each other and the
driving forces of a sector are influenced by developments in the other sectors. A sector-
specific set-up was chosen for these notes to keep the scope manageable and to provide in-
depth information. The sector-specific notes were then used in a multi-sectoral workshop,
organised to discuss main interactions between the sectors.
Driving forces of land-use change Zondag and Borsboom
3
This paper presents selected main driving forces which influence land use in these sectors. In
Section 2, clusters of drivers affecting land use in most sectors are discussed briefly. These
clusters consist of a set of driving forces which influence land use in different ways. In
Section 3, particular effects of the driving forces on land use are discussed on sectoral level.
Per sector, tables provide an overview of the impact of the driving forces on land use. Finally,
Section 4 presents main challenges for the new land-use model, based on the analysis of the
driving forces.
2. CLUSTERS OF DRIVING FORCES OF LAND-USE CHANGE
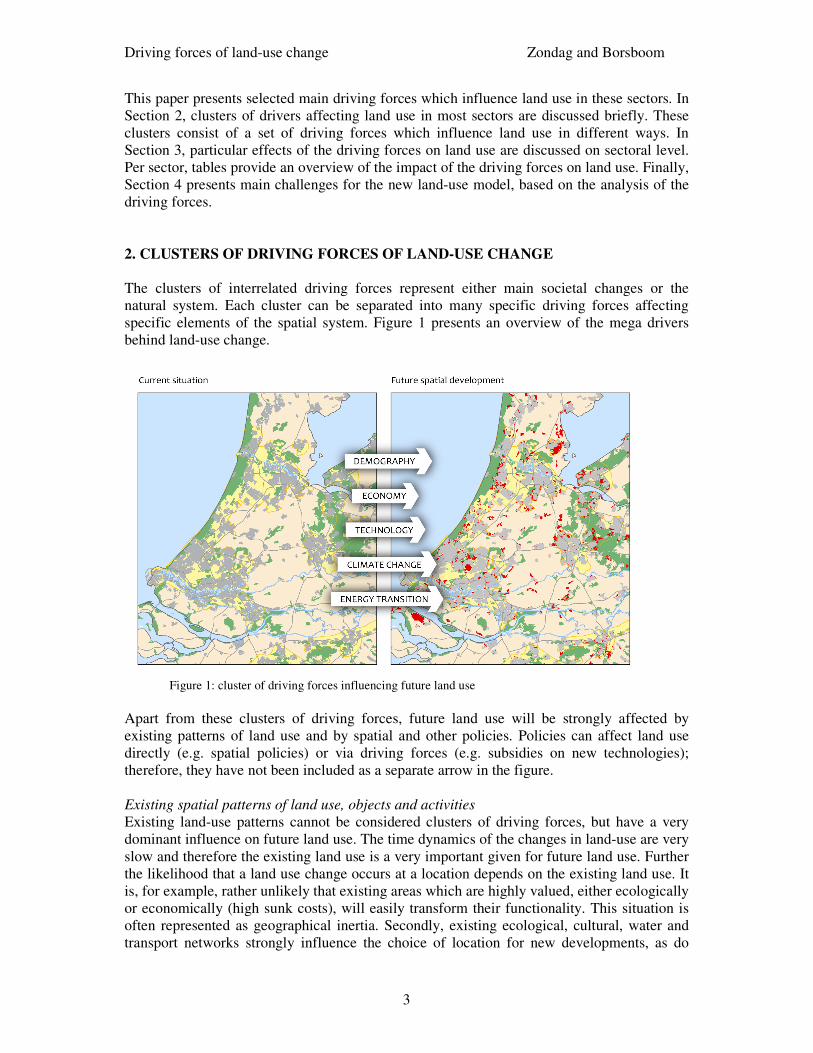
The clusters of interrelated driving forces represent either main societal changes or the
natural system. Each cluster can be separated into many specific driving forces affecting
specific elements of the spatial system. Figure 1 presents an overview of the mega drivers
behind land-use change.
Figure 1: cluster of driving forces influencing future land use
Apart from these clusters of driving forces, future land use will be strongly affected by
existing patterns of land use and by spatial and other policies. Policies can affect land use
directly (e.g. spatial policies) or via driving forces (e.g. subsidies on new technologies);
therefore, they have not been included as a separate arrow in the figure.
Existing spatial patterns of land use, objects and activities
Existing land-use patterns cannot be considered clusters of driving forces, but have a very
dominant influence on future land use. The time dynamics of the changes in land-use are very
slow and therefore the existing land use is a very important given for future land use. Further
the likelihood that a land use change occurs at a location depends on the existing land use. It
is, for example, rather unlikely that existing areas which are highly valued, either ecologically
or economically (high sunk costs), will easily transform their functionality. This situation is
often represented as geographical inertia. Secondly, existing ecological, cultural, water and
transport networks strongly influence the choice of location for new developments, as do
Driving forces of land-use change Zondag and Borsboom
4
residential and commercial activities. However, with the expanding stocks of residential and
commercial buildings, over the years, dynamics increasingly take place in the way of changes
or transformations within building stocks at existing locations.
Demography
‘Demography’ is a cluster of driving forces consisting of different components which affect
size and composition of population and households. Demographic developments are
especially influential, because the behaviour of actors is often related to demographic
characteristics.
Economy
Under the heading ‘economy’, a wide set of economic developments and determinants were
clustered. Examples of important economic developments affecting land use are: growth in
income and trust funds, rise in double-income households, changes in economic structure,
agglomeration forces, global and local market developments (e.g. agricultural products), and
organisation of production processes. Furthermore, each of these economic components is
also influenced by different factors; a description of these relationships can be found in the
supporting notes, per sector.
Technology
Technological developments are an important driving force behind developments in many
sectors and the organisation of society as a whole, which often results in land-use changes.
Examples are technological developments which increase productivity in agriculture,
technological options affecting underground storage or desalination of water, or internet
enabling online shopping.
Societal values and trends
Societal values have an important impact on almost any type of land use. For example,
changes in people’s lifestyles can directly affect housing types and locational preferences, as
well as consumption patterns, and with that the type and location of economic production.
More indirectly, societal values regarding nature, landscape or agricultural production, for
example, may affect governmental budgets, such as for nature development, and restrictions
and regulations could affect the size and type of agricultural production.
Climate change and energy transition
Climate change influences land use in multiple ways; for example, via rising sea levels,
periods of intensified rainfall or drought, changing temperatures and humidity affecting
conditions for biotopes or agricultural production. Consequences of climate change changes
policies, such as mitigation or adaptation strategies. The need for energy transition from
fossil fuels towards more sustainable energy production is driven by mitigation policies
addressing climate change, as well as by a growing scarcity of accessable fossil energy
sources. The impact of such a transition is likely to differ from sector to sector, because of the
varying complexities, possibilities and costs of such transitions. In transport, for example,
such a change of energy source is complicated, because of on-board storage of energy
sources (e.g., in cars and aircraft). If petroleum sources become scarce, and alternative fuels
remain rather unsuccessful, large price increases could affect the transport market and,
indirectly, the organisation of economic production and urban systems (processes such as
globalisation and urban sprawl).
Policies
Driving forces of land-use change Zondag and Borsboom
5
To realise governmennt ambitions, the various government levels have access to a large and
diverse set of policies affecting land-use. These policies can be categorised by dimension:
• Scale: international, national or local;
• Sectoral level: spatial planning or sector specific;
• Type: juridical and financial, and communication/information instruments.
The list of relevant policies is too numerous to include in this paper. Within the LUMOS
research project, a report has been prepared on ‘Policy questions and indicators for a new
land-use model’ (GeodanNext 2009).
3 DRIVING FORCES OF LAND-USE CHANGE, PER SECTOR
Within the LUMOS research project, an overview of the drivers of land-use change, per
sector, was presented in sector-specific notes written by leading experts in the field. The short
descriptions in this section are based on these notes, for more detail we refer to the
underlying notes (in Dutch):
• Driving forces behind housing demand and residential land use – Hugo Priemus and
Joris Hoekstra (OTB – Delft University of Technology)
• Driving forces behind land-use for employment – Oedzge Atzema, Piet Korteweg,
Jan Lambooy and Frank van Oort (University of Utrecht)
• Driving forces behind future land use for agriculture – Cees van Bruchem and Huib
Silvis (Agricultural Economics Research Institute (LEI))
• Driving forces behind changes in land use for nature and use of land for water–
Annemarie Groot, Eddy Moors and Claire Vos (Alterra – University of Wageningen)
The descriptions below reflect the interpretation and selection of the authors of the
underlying notes.
Driving forces of land-use change Zondag and Borsboom
6
3.1 Driving forces of land-use change in housing Historically, housing market developments are largely explained in connection to
demographic developments, such as birth rate, life expectancy, household formation and
dissolution, and international migration. The variety in types of households is increasing due
to factors, such as individualisation and an increasingly multi-ethnic society. A rather recent
phenomenon in some Dutch regions is demographic shrinkage instead of growth as a driver
of possible land-use change. These developments call for increased detailed information on
the types of households, to address differences in their preferences, and increased
regionalisation, to address the differences in the regional challenges (such as pressure on the
housing market due to growth around Amsterdam, versus shrinkage in some areas in the
periphery).
Another set of increasingly important driving factors are economic and financial drivers, such
as income (including an increase in double-income households) and capital development.
Many of the housing policy options of the government are also financial instruments, such as
taxation on housing transfer, fiscal support (tax deductions) for house owners, liberalising
rents, shift in housing subsidies for people on low incomes, from rental housing only, towards
all housing. To create a model simulation of these drivers, the financial position of
households, housing prices and financial interference of the government must all be explicitly
entered into the model.
The supply side of the housing market (housing stock by type and location), is affected by
other important policy drivers. For the supply side, the existing pattern of infrastructure,
houses, employment and land use (e.g. ecological areas) are important givens, as changes
happen slowly, and are strongly influenced by existing patterns. Changes within the existing
housing stock are becoming increasingly important, such as urban renewal or gentrification,
and urban facilities and qualities. In addition, the relationship between supply and demand is
changing and becoming more complex, as a result of increased ownership of second homes,
an unclear distinction between houses with a purely temporary, recreational function and
regular houses, and a more short-term occupation of houses (for example, seasonal or short-
term workers from Eastern Europe). Improving the inclusion of these aspects is hampered by
data restrictions, definitions and omissions. This applies, for example, to lack of data on
housing and substitute housing (holiday homes, caravans, boats, commercial buildings), or on
unregistered international migration.
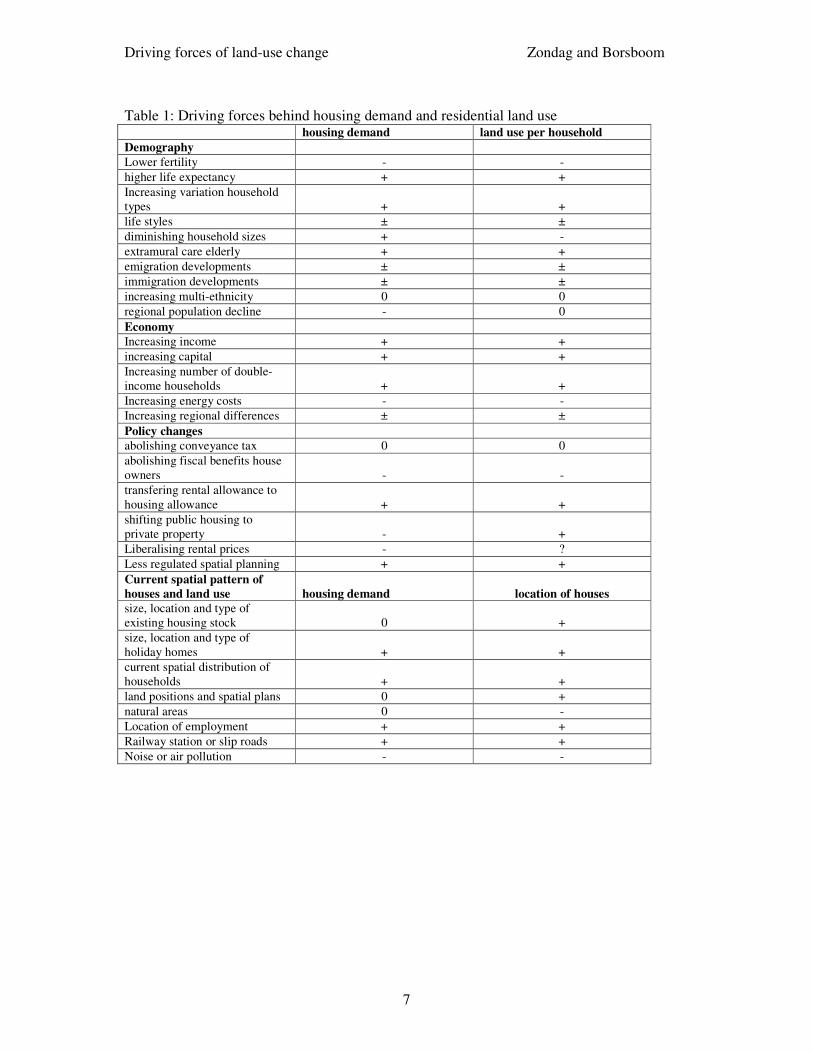
Table 1 presents a detailed overview of the driving forces behind the housing demand and
residential land use. For an in-depth understanding of the relationship between driver and
land-use changes, reference is made to the underlying report by Priemus and Hoekstra
(2009).
Driving forces of land-use change Zondag and Borsboom
7
Table 1: Driving forces behind housing demand and residential land use housing demand land use per household
Demography
Lower fertility - -
higher life expectancy + +
Increasing variation household
types + +
life styles ± ±
diminishing household sizes + -
extramural care elderly + +
emigration developments ± ±
immigration developments ± ±
increasing multi-ethnicity 0 0
regional population decline - 0
Economy
Increasing income + +
increasing capital + +
Increasing number of double-
income households + +
Increasing energy costs - -
Increasing regional differences ± ±
Policy changes
abolishing conveyance tax 0 0
abolishing fiscal benefits house
owners - -
transfering rental allowance to
housing allowance + +
shifting public housing to
private property - +
Liberalising rental prices - ?
Less regulated spatial planning + +
Current spatial pattern of
houses and land use housing demand location of houses
size, location and type of
existing housing stock 0 +
size, location and type of
holiday homes + +
current spatial distribution of
households + +
land positions and spatial plans 0 +
natural areas 0 -
Location of employment + +
Railway station or slip roads + +
Noise or air pollution - -
Driving forces of land-use change Zondag and Borsboom
8
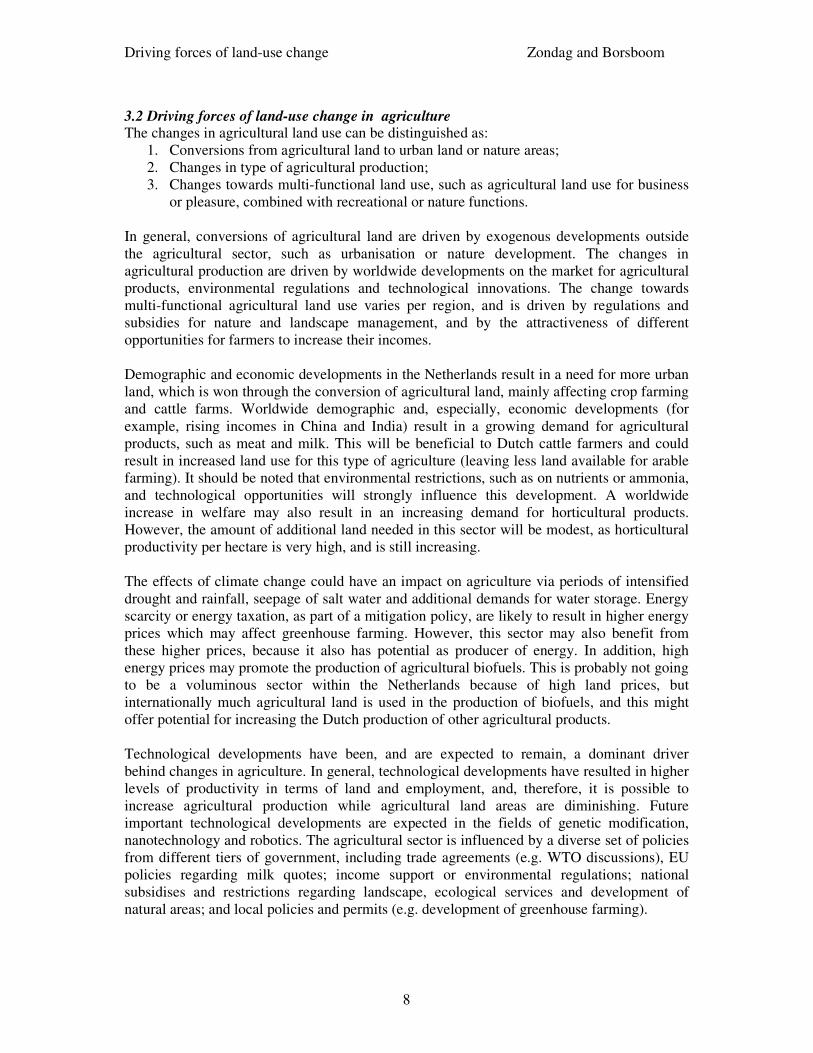
3.2 Driving forces of land-use change in agriculture The changes in agricultural land use can be distinguished as:
1. Conversions from agricultural land to urban land or nature areas;
2. Changes in type of agricultural production;
3. Changes towards multi-functional land use, such as agricultural land use for business
or pleasure, combined with recreational or nature functions.
In general, conversions of agricultural land are driven by exogenous developments outside
the agricultural sector, such as urbanisation or nature development. The changes in
agricultural production are driven by worldwide developments on the market for agricultural
products, environmental regulations and technological innovations. The change towards
multi-functional agricultural land use varies per region, and is driven by regulations and
subsidies for nature and landscape management, and by the attractiveness of different
opportunities for farmers to increase their incomes.
Demographic and economic developments in the Netherlands result in a need for more urban
land, which is won through the conversion of agricultural land, mainly affecting crop farming
and cattle farms. Worldwide demographic and, especially, economic developments (for
example, rising incomes in China and India) result in a growing demand for agricultural
products, such as meat and milk. This will be beneficial to Dutch cattle farmers and could
result in increased land use for this type of agriculture (leaving less land available for arable
farming). It should be noted that environmental restrictions, such as on nutrients or ammonia,
and technological opportunities will strongly influence this development. A worldwide
increase in welfare may also result in an increasing demand for horticultural products.
However, the amount of additional land needed in this sector will be modest, as horticultural
productivity per hectare is very high, and is still increasing.
The effects of climate change could have an impact on agriculture via periods of intensified
drought and rainfall, seepage of salt water and additional demands for water storage. Energy
scarcity or energy taxation, as part of a mitigation policy, are likely to result in higher energy
prices which may affect greenhouse farming. However, this sector may also benefit from
these higher prices, because it also has potential as producer of energy. In addition, high
energy prices may promote the production of agricultural biofuels. This is probably not going
to be a voluminous sector within the Netherlands because of high land prices, but
internationally much agricultural land is used in the production of biofuels, and this might
offer potential for increasing the Dutch production of other agricultural products.
Technological developments have been, and are expected to remain, a dominant driver
behind changes in agriculture. In general, technological developments have resulted in higher
levels of productivity in terms of land and employment, and, therefore, it is possible to
increase agricultural production while agricultural land areas are diminishing. Future
important technological developments are expected in the fields of genetic modification,
nanotechnology and robotics. The agricultural sector is influenced by a diverse set of policies
from different tiers of government, including trade agreements (e.g. WTO discussions), EU
policies regarding milk quotes; income support or environmental regulations; national
subsidises and restrictions regarding landscape, ecological services and development of
natural areas; and local policies and permits (e.g. development of greenhouse farming).
Driving forces of land-use change Zondag and Borsboom
9
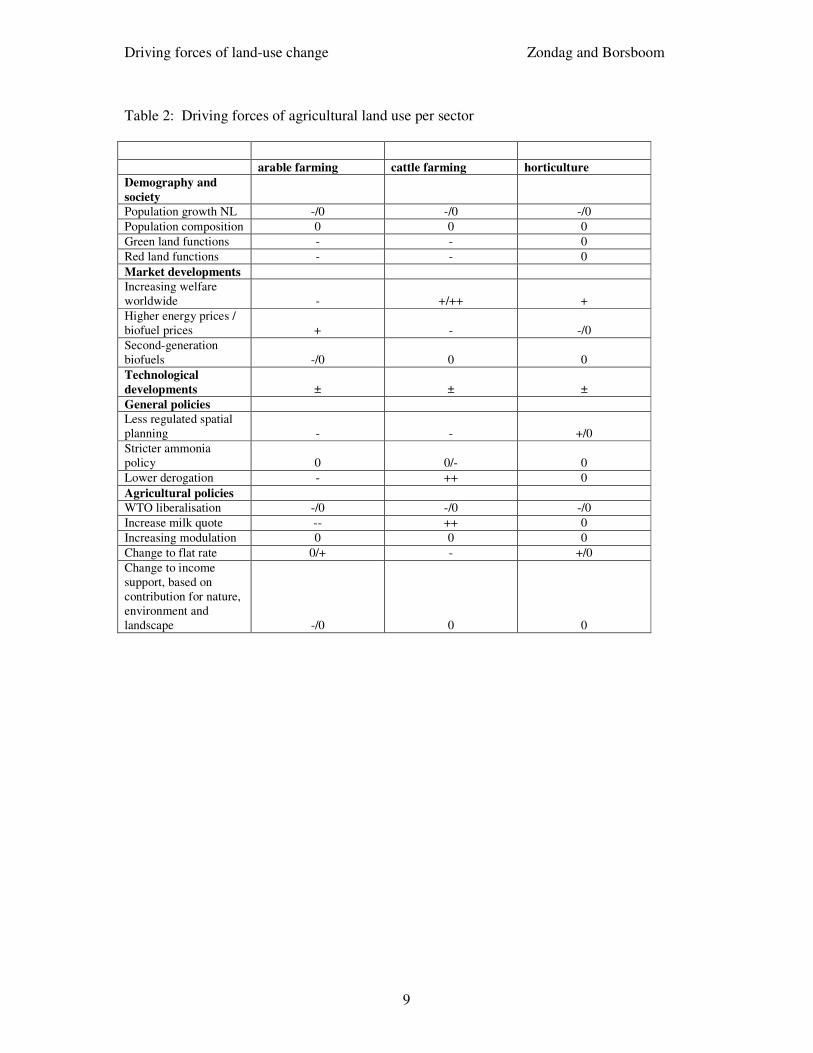
Table 2: Driving forces of agricultural land use per sector
arable farming cattle farming horticulture
Demography and
society
Population growth NL -/0 -/0 -/0
Population composition 0 0 0
Green land functions - - 0
Red land functions - - 0
Market developments
Increasing welfare
worldwide - +/++ +
Higher energy prices /
biofuel prices + - -/0
Second-generation
biofuels -/0 0 0
Technological
developments ± ± ±
General policies
Less regulated spatial
planning - - +/0
Stricter ammonia
policy 0 0/- 0
Lower derogation - ++ 0
Agricultural policies
WTO liberalisation -/0 -/0 -/0
Increase milk quote -- ++ 0
Increasing modulation 0 0 0
Change to flat rate 0/+ - +/0
Change to income
support, based on
contribution for nature,
environment and
landscape -/0 0 0
Driving forces of land-use change Zondag and Borsboom
10
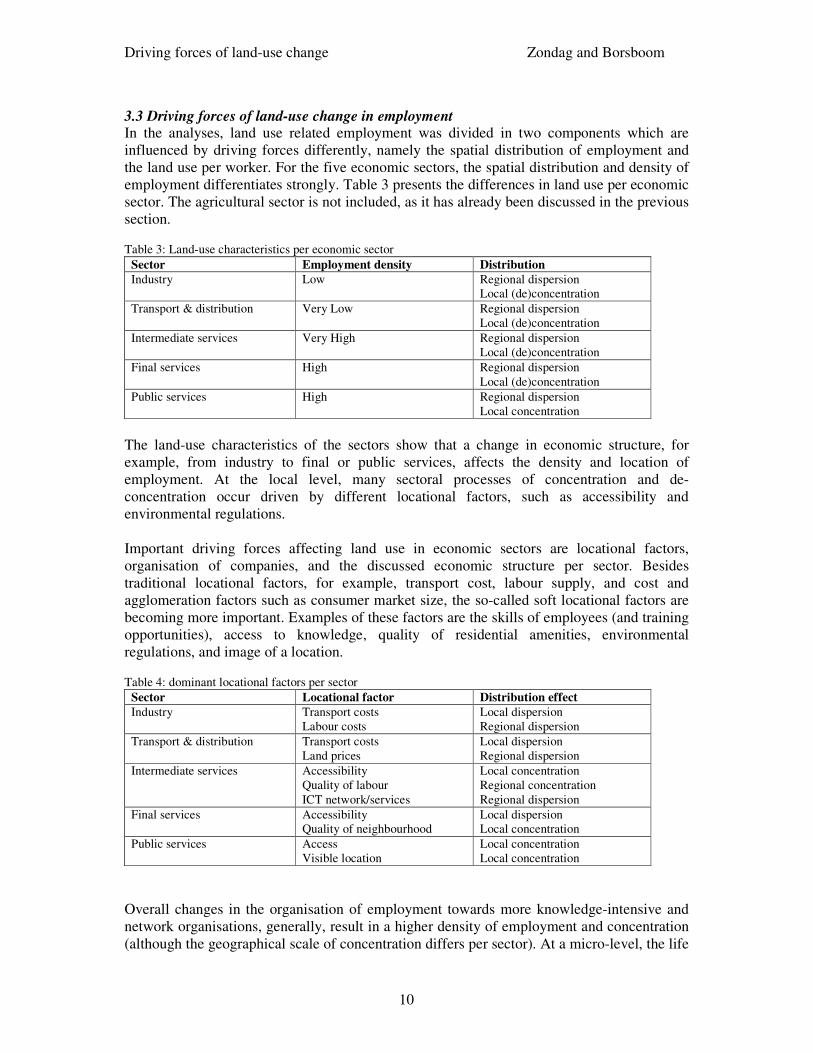
3.3 Driving forces of land-use change in employment In the analyses, land use related employment was divided in two components which are
influenced by driving forces differently, namely the spatial distribution of employment and
the land use per worker. For the five economic sectors, the spatial distribution and density of
employment differentiates strongly. Table 3 presents the differences in land use per economic
sector. The agricultural sector is not included, as it has already been discussed in the previous
section.
Table 3: Land-use characteristics per economic sector Sector Employment density Distribution
Industry Low Regional dispersion
Local (de)concentration
Transport & distribution Very Low Regional dispersion
Local (de)concentration
Intermediate services Very High Regional dispersion
Local (de)concentration
Final services High Regional dispersion
Local (de)concentration
Public services High Regional dispersion
Local concentration
The land-use characteristics of the sectors show that a change in economic structure, for
example, from industry to final or public services, affects the density and location of
employment. At the local level, many sectoral processes of concentration and de-
concentration occur driven by different locational factors, such as accessibility and
environmental regulations.
Important driving forces affecting land use in economic sectors are locational factors,
organisation of companies, and the discussed economic structure per sector. Besides
traditional locational factors, for example, transport cost, labour supply, and cost and
agglomeration factors such as consumer market size, the so-called soft locational factors are
becoming more important. Examples of these factors are the skills of employees (and training
opportunities), access to knowledge, quality of residential amenities, environmental
regulations, and image of a location.
Table 4: dominant locational factors per sector Sector Locational factor Distribution effect
Industry Transport costs
Labour costs
Local dispersion
Regional dispersion
Transport & distribution Transport costs
Land prices
Local dispersion
Regional dispersion
Intermediate services Accessibility
Quality of labour
ICT network/services
Local concentration
Regional concentration
Regional dispersion
Final services Accessibility
Quality of neighbourhood
Local dispersion
Local concentration
Public services Access
Visible location
Local concentration
Local concentration
Overall changes in the organisation of employment towards more knowledge-intensive and
network organisations, generally, result in a higher density of employment and concentration
(although the geographical scale of concentration differs per sector). At a micro-level, the life
Driving forces of land-use change Zondag and Borsboom
11
cycle of companies has an important impact on their location and land use, as growth is an
important factor, possibly resulting in relocation. For example, a region with a large share of
starting companies will have a high level of employment at non-business locations (e.g. in
residential areas), whereas regions with more established companies will have a higher
demand for commercial sites and business parks.
Important underlying drivers of land-use change are developments in the labour market, real
estate market, and in governmental policies. The demographic prognoses, affecting the
supply side (labour force) of the labour market, generally, show a rather stable population
size, but − due to an increasing number of elderly − a shrinking potential labour force. A
direct impact of this change in labour force can be mitigated by changes in labour
participation of especially woman and the elderly. The demographic developments differ
strongly between regions, as several regions have a shrinking labour force along their
periphery while, in the centre, the labour force is stable or even growing.
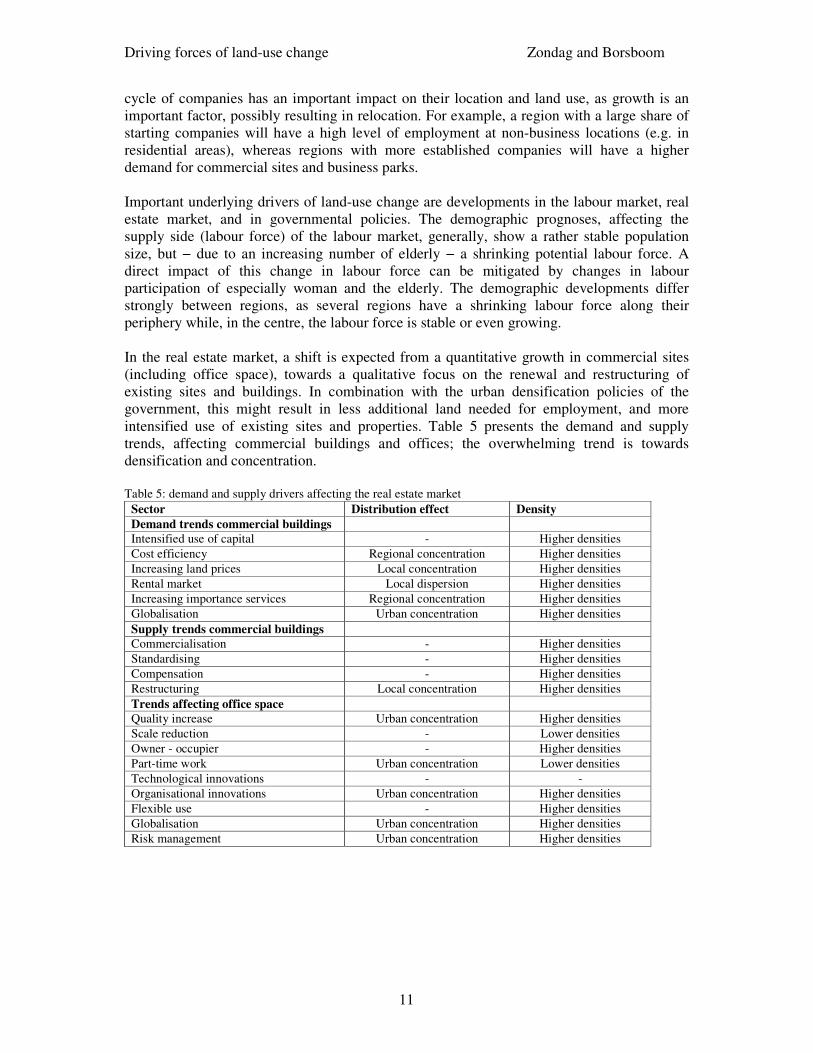
In the real estate market, a shift is expected from a quantitative growth in commercial sites
(including office space), towards a qualitative focus on the renewal and restructuring of
existing sites and buildings. In combination with the urban densification policies of the
government, this might result in less additional land needed for employment, and more
intensified use of existing sites and properties. Table 5 presents the demand and supply
trends, affecting commercial buildings and offices; the overwhelming trend is towards
densification and concentration.
Table 5: demand and supply drivers affecting the real estate market
Sector Distribution effect Density
Demand trends commercial buildings
Intensified use of capital - Higher densities
Cost efficiency Regional concentration Higher densities
Increasing land prices Local concentration Higher densities
Rental market Local dispersion Higher densities
Increasing importance services Regional concentration Higher densities
Globalisation Urban concentration Higher densities
Supply trends commercial buildings
Commercialisation - Higher densities
Standardising - Higher densities
Compensation - Higher densities
Restructuring Local concentration Higher densities
Trends affecting office space
Quality increase Urban concentration Higher densities
Scale reduction - Lower densities
Owner - occupier - Higher densities
Part-time work Urban concentration Lower densities
Technological innovations - -
Organisational innovations Urban concentration Higher densities
Flexible use - Higher densities
Globalisation Urban concentration Higher densities
Risk management Urban concentration Higher densities
Driving forces of land-use change Zondag and Borsboom
12
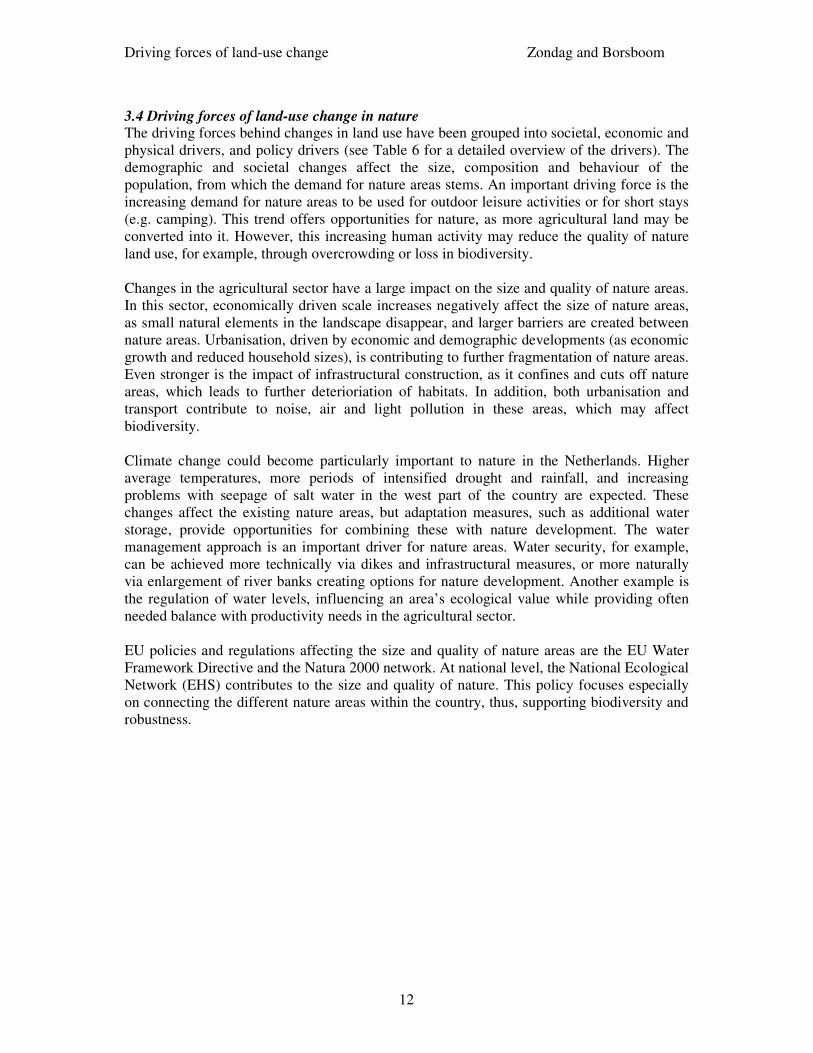
3.4 Driving forces of land-use change in nature The driving forces behind changes in land use have been grouped into societal, economic and
physical drivers, and policy drivers (see Table 6 for a detailed overview of the drivers). The
demographic and societal changes affect the size, composition and behaviour of the
population, from which the demand for nature areas stems. An important driving force is the
increasing demand for nature areas to be used for outdoor leisure activities or for short stays
(e.g. camping). This trend offers opportunities for nature, as more agricultural land may be
converted into it. However, this increasing human activity may reduce the quality of nature
land use, for example, through overcrowding or loss in biodiversity.
Changes in the agricultural sector have a large impact on the size and quality of nature areas.
In this sector, economically driven scale increases negatively affect the size of nature areas,
as small natural elements in the landscape disappear, and larger barriers are created between
nature areas. Urbanisation, driven by economic and demographic developments (as economic
growth and reduced household sizes), is contributing to further fragmentation of nature areas.
Even stronger is the impact of infrastructural construction, as it confines and cuts off nature
areas, which leads to further deterioriation of habitats. In addition, both urbanisation and
transport contribute to noise, air and light pollution in these areas, which may affect
biodiversity.
Climate change could become particularly important to nature in the Netherlands. Higher
average temperatures, more periods of intensified drought and rainfall, and increasing
problems with seepage of salt water in the west part of the country are expected. These
changes affect the existing nature areas, but adaptation measures, such as additional water
storage, provide opportunities for combining these with nature development. The water
management approach is an important driver for nature areas. Water security, for example,
can be achieved more technically via dikes and infrastructural measures, or more naturally
via enlargement of river banks creating options for nature development. Another example is
the regulation of water levels, influencing an area’s ecological value while providing often
needed balance with productivity needs in the agricultural sector.
EU policies and regulations affecting the size and quality of nature areas are the EU Water
Framework Directive and the Natura 2000 network. At national level, the National Ecological
Network (EHS) contributes to the size and quality of nature. This policy focuses especially
on connecting the different nature areas within the country, thus, supporting biodiversity and
robustness.
Driving forces of land-use change Zondag and Borsboom
13
Table 6: driving force behind changes of land use in nature
Land use for
nature
Effect on quality
of land use for
nature
Magnitude of
impacts on land
use
Societal drivers
Demography + - Reasonable
Recreation (daily) +/- +/- Reasonable
Recreation (accommodation) - - Reasonable
Residential use of countryside housing 0 +/- Small
Economic drivers
Environmental agriculture + -- Very large
Scale increase agriculture - -/+ Very large
Urbanisation 0 - Large
Infrastructure 0 - Very large
Mobility - - Large
Physical drivers
Intensified drought 0 - Reasonable
Seepage of salt water 0/+ -/+ Large
Intensified rainfall 0 - Small
Adaptation measures + -/+ Small
Water management -/+ -/+ Large
Water security -/+ -/+ Large
Air pollution 0 - Small
Areas with protected species 0 - local
Policies
EU Water Framework Directive + + Large
Natura 2000 network + + Large
National Ecological Network (EHS) + + Large
Driving forces of land-use change Zondag and Borsboom
14
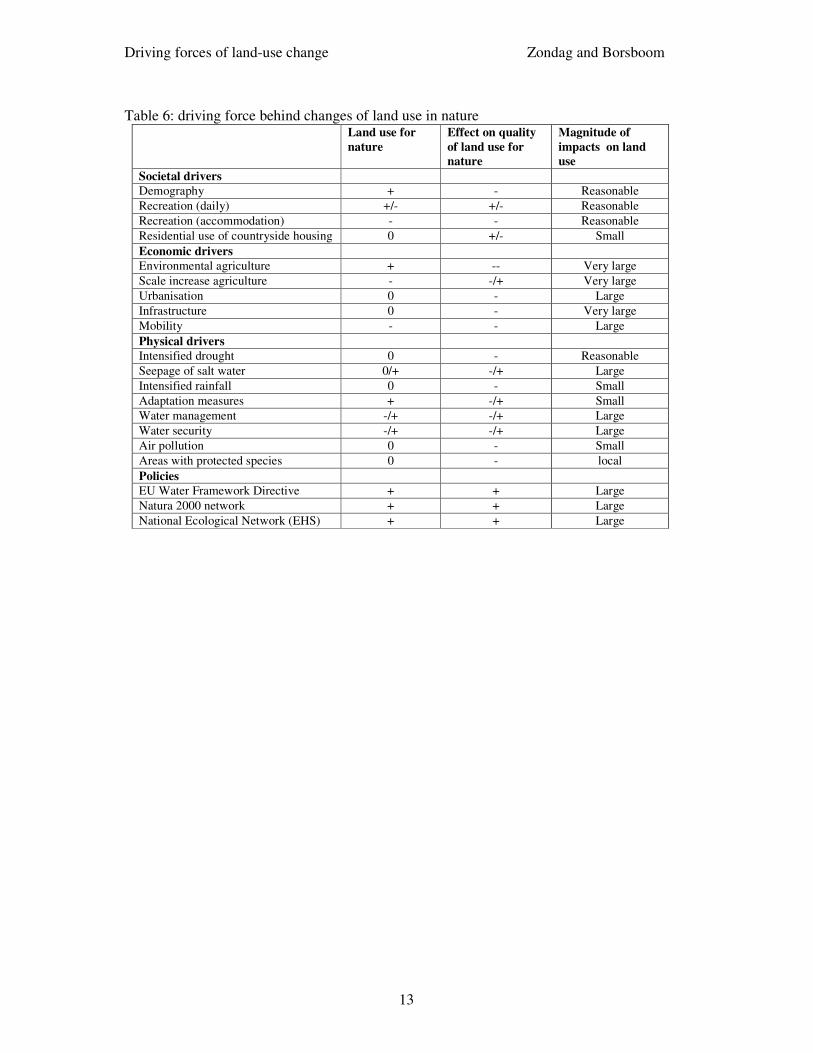
3.5 Driving forces of land-use change for water The underlying driving forces behind land use for water (namely societal, economic, physical
and policy drivers) are similar to those for nature, see Table 7 for a detailed overview of the
drivers. The interaction between land use and water consist of direct impacts on land use,
such as areas reserved for rivers or water storage, and indirect impacts of water affecting land
use via hydrological systems. Hydrological conditions support certain types of land use
(ecological systems or agricultural production), and these downstream conditions can be
protected by upstream regulations.
Appreciation of water for recreational purposes in residential environments and as landscape
elements is increasing, which results in increasing use of land for water. For example,
housing prices increase near the waterfront. Such trends can be combined with the demand
for additional water storage from intensified local rainfall in and around urban areas.
Economic and population growth in regions, increasing the potential flood damages, can
result in stricter guidelines for water safety to protect these regions. The water safety
measures can lead to additional land claims related to water.
Existing physical forces, such as land subsidence in the west of the Netherlands, in
combination with changing forces due to climate change, such as rising sea levels and
intensified rainfall and drought, have an important impact on the amount of land use for water
and water quality. Most physical drivers indicate that additional water storage is needed, the
consequences of land use for water are positive, but the amount of additional land needed for
water is uncertain depending on the preferred solutions (e.g. new lakes/reservoirs, raising
water levels or infrastructural measures).
EU policies and regulations consist mainly of supporting directives to reach water quality and
security goals. The Water Framework Directive and the Implementation of nitrates Directive
mainly affect the water quality. The Natura 2000 network and the Dutch National Ecological
Network both also protect water areas.
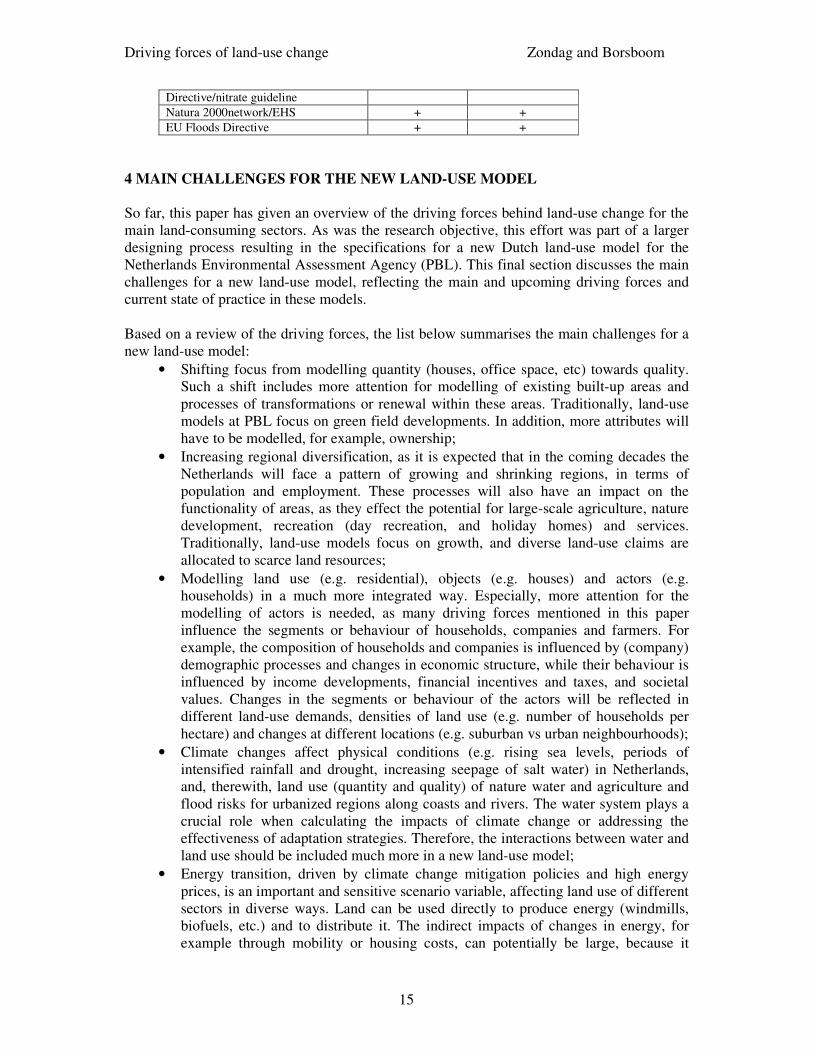
Table 7: driving forces behind changes of land use for water
land use for
water
Magnitude of
impacts on land
use
Societal drivers
Water-related recreation + +
Housing at the waterfront + ++
Urbanisation + +
Cultural values + ++
Economic drivers
Welfare + ++
Water safety incidents + ++
Transport on water + 0
Technology - --
Physical drivers
Water security + ++
Technology - --
Local water problems + ++
Mitigation seepage of salt water and
droughts +
++
Policies
EU Water Framework + +
Driving forces of land-use change Zondag and Borsboom
15
Directive/nitrate guideline
Natura 2000network/EHS + +
EU Floods Directive + +
4 MAIN CHALLENGES FOR THE NEW LAND-USE MODEL
So far, this paper has given an overview of the driving forces behind land-use change for the
main land-consuming sectors. As was the research objective, this effort was part of a larger
designing process resulting in the specifications for a new Dutch land-use model for the
Netherlands Environmental Assessment Agency (PBL). This final section discusses the main
challenges for a new land-use model, reflecting the main and upcoming driving forces and
current state of practice in these models.
Based on a review of the driving forces, the list below summarises the main challenges for a
new land-use model:
• Shifting focus from modelling quantity (houses, office space, etc) towards quality.
Such a shift includes more attention for modelling of existing built-up areas and
processes of transformations or renewal within these areas. Traditionally, land-use
models at PBL focus on green field developments. In addition, more attributes will
have to be modelled, for example, ownership;
• Increasing regional diversification, as it is expected that in the coming decades the
Netherlands will face a pattern of growing and shrinking regions, in terms of
population and employment. These processes will also have an impact on the
functionality of areas, as they effect the potential for large-scale agriculture, nature
development, recreation (day recreation, and holiday homes) and services.
Traditionally, land-use models focus on growth, and diverse land-use claims are
allocated to scarce land resources;
• Modelling land use (e.g. residential), objects (e.g. houses) and actors (e.g.
households) in a much more integrated way. Especially, more attention for the
modelling of actors is needed, as many driving forces mentioned in this paper
influence the segments or behaviour of households, companies and farmers. For
example, the composition of households and companies is influenced by (company)
demographic processes and changes in economic structure, while their behaviour is
influenced by income developments, financial incentives and taxes, and societal
values. Changes in the segments or behaviour of the actors will be reflected in
different land-use demands, densities of land use (e.g. number of households per
hectare) and changes at different locations (e.g. suburban vs urban neighbourhoods);
• Climate changes affect physical conditions (e.g. rising sea levels, periods of
intensified rainfall and drought, increasing seepage of salt water) in Netherlands,
and, therewith, land use (quantity and quality) of nature water and agriculture and
flood risks for urbanized regions along coasts and rivers. The water system plays a
crucial role when calculating the impacts of climate change or addressing the
effectiveness of adaptation strategies. Therefore, the interactions between water and
land use should be included much more in a new land-use model;
• Energy transition, driven by climate change mitigation policies and high energy
prices, is an important and sensitive scenario variable, affecting land use of different
sectors in diverse ways. Land can be used directly to produce energy (windmills,
biofuels, etc.) and to distribute it. The indirect impacts of changes in energy, for
example through mobility or housing costs, can potentially be large, because it
Driving forces of land-use change Zondag and Borsboom
16
affects the organisation of the production process and spatial developments, such as
suburbanisation.
LITERATURE
Atzema O., P. Korteweg, J. Lambooy and F. van Oort (draft), Drijvende krachten achter
ruimtegebruik van werken, report prepared for NEAA, University of Utrecht.
Bruchem, C. van en H. Silvis (2009), Drijvende krachten toekomstig landgebruik landbouw.
Den Haag, LEI
Deltacommissie 2008, Samen werken met water. Een Land dat leeft, bouwt aan zijn
toekomst. Secretariaat Deltacommissie, The Hague.
Geodan Next (draft), Beleidsvragen en indicatoren voor een nieuw ruimtegebruiksmodel,
report prepared for NEAA, Geodan Next, Amsterdam
Groot A, E. Moors, C. Vos, P. Vellinga and P. Opdam (draft), Drijvende krachten achter
veranderingen in ruimtegebruik voor de sectoren water en natuur, report prepared for
NEAA, University of Wageningen
Hilferink M, Rietveld P, 1999, “Land Use Scanner: an integrated model for long term
projectionsof land use in urban and rural areas” Journal of Geographical Information
Systems, No. 1, pp.155-177.
MNP, 2004a, Quality and the future. Sustainability Outlook (Netherlands Environmental
Assessment Agency/RIVM, Bilthoven)
MNP, 2004b, “Milieu- en Natuureffecten Nota Ruimte” [Environmental and Ecological
Effects of the National Spatial Strategy], RIVM-rapport 711931009, RIVM, Bilthoven.
Nijs, T. de, G. Engelen, R. White, H. van Delden, I. Uljee (2001), De
LeefOmgevingsVerkenner. Technische documentatie. RIVM rapport 408505007/2001.
Priemus, H. en J. Hoekstra (2009), Drijvende krachten achter woningvraag en ruimtegebruik
wonen, report prepared for NEAA, Delft Univeristy of Technology, Onderzoeksinstituut
OTB.
RIVM and Stichting DLO, 2001, “Who is afraid of red, green and blue? Toets van de Vijfde
Nota Ruimtelijke Ordening op ecologische effecten” [Who is afraid of red, green and
blue? The Fifth National Spatial Memorandum screened for ecological effects], RIVM-
rapportnr. 711931005, Wilco BV, Amersfoort.
RIVM and Stichting DLO 2002, National Nature Outlook 2: 2000-2030. Summary. RIVM
(National Institute for Public Health and the Environment, Bilthoven).
Schrojenstein Lantman, J. van, (2007), Overstromingsschade in Dijkring 14 - Een koppeling
van het Hoogwater Informatie Systeem aan de Ruimtescanner. MNP Rapport
500072002/2007. Bilthoven, MNP
Timmermans H., M. Batty, H. Couclelis, M. Wegener (2007), Report and Recommendations
of the Audit Committee, Scientific Audit of National Land Use Models. Bilthoven,
Netherlands Environmental Assessment Agency (MNP).
VROM 2008, Structruurvisie Randstad 2040, Naar een duurzame en concurrerende Europese
topregio. Ministry of Housing, Spatial Planning and Environment, The Hague.