
Driving B2B Customer Acquisition Through Powerful Data Management
46
©2015 Experian Information Solutions, Inc. All rights reserved. Experian and the marks used herein are service marks or registered trademarks of Experian Information Solutions, Inc. Other product and company names mentioned herein are the trademarks of their respective owners. No part of this copyrighted work may be reproduced, modified, or distributed in any form or manner without the prior written permission of Experian. Experian Public. Driving business-to-business customer acquisition through powerful data management
Transcript of Driving B2B Customer Acquisition Through Powerful Data Management
© 2015 Experian Information Solutions, Inc. All rights reserved. Experian and the marks used herein are service marks or registered trademarks of Experian Information Solutions, Inc.
Other product and company names mentioned herein are the trademarks of their respective owners. No part of this copyrighted work may be reproduced, modified, or distributed in
any form or manner without the prior written permission of Experian. Experian Public.
Driving business-to-business customer acquisition through powerful data management
© 2015 Experian Information Solutions, Inc. All rights reserved. Experian Public. 2
Paul Henry Experian
Introducing:
@ExperianVision | #vision2015
Follow us on Twitter:
3 © 2015 Experian Information Solutions, Inc. All rights reserved. Experian Public.
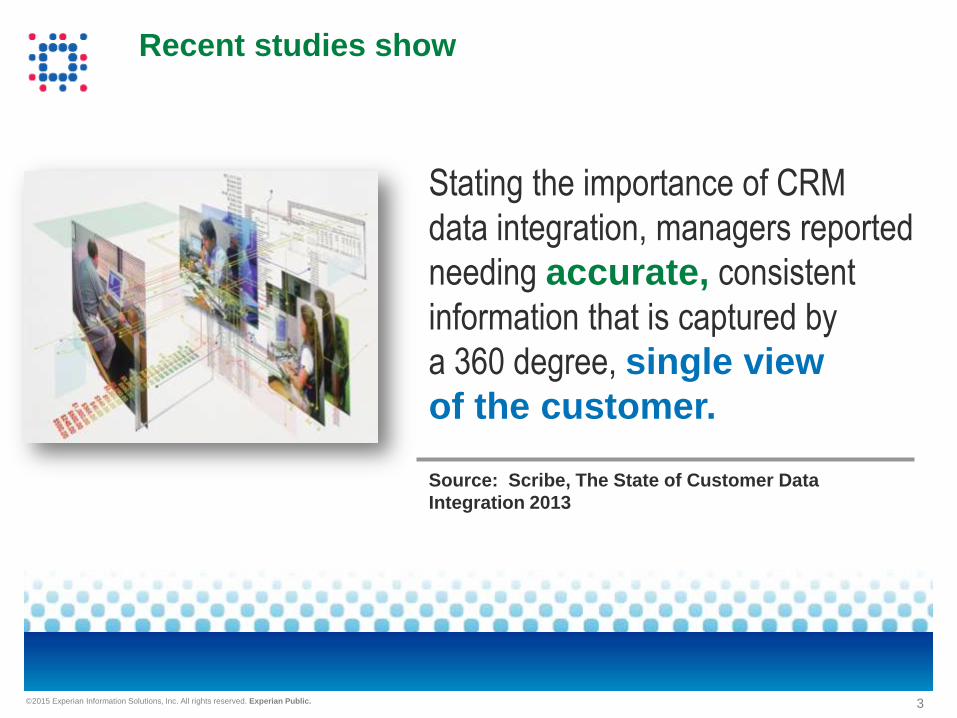
Recent studies show
Stating the importance of CRM
data integration, managers reported
needing accurate, consistent
information that is captured by
a 360 degree, single view
of the customer.
Source: Scribe, The State of Customer Data
Integration 2013
4 © 2015 Experian Information Solutions, Inc. All rights reserved. Experian Public.
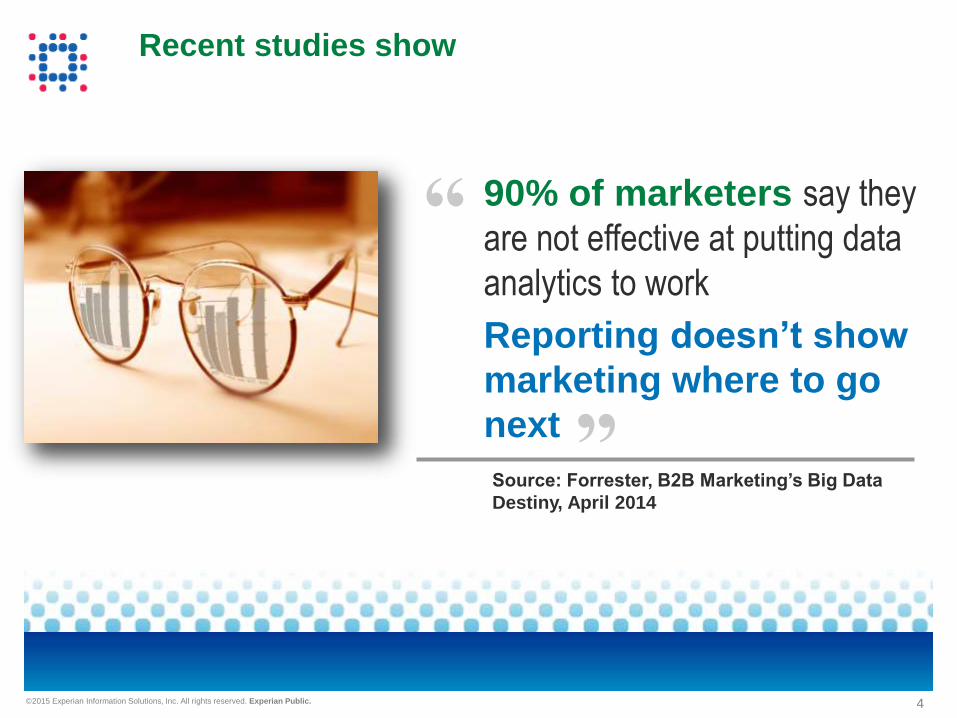
Recent studies show
90% of marketers say they
are not effective at putting data
analytics to work
Reporting doesn’t show
marketing where to go
next
Source: Forrester, B2B Marketing’s Big Data
Destiny, April 2014
“
”
5 © 2015 Experian Information Solutions, Inc. All rights reserved. Experian Public.
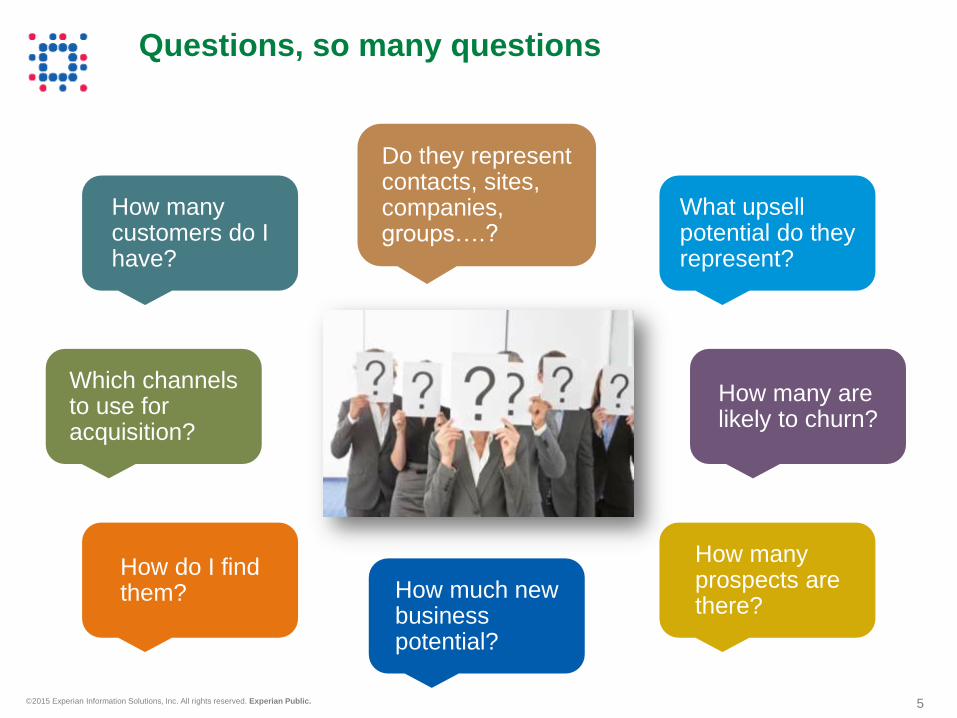
Questions, so many questions
How many customers do I have?
Do they represent contacts, sites, companies, groups….?
What upsell potential do they represent?
How many prospects are there?
Which channels to use for acquisition?
How much new business potential?
How do I find them?
How many are likely to churn?
6 © 2015 Experian Information Solutions, Inc. All rights reserved. Experian Public.
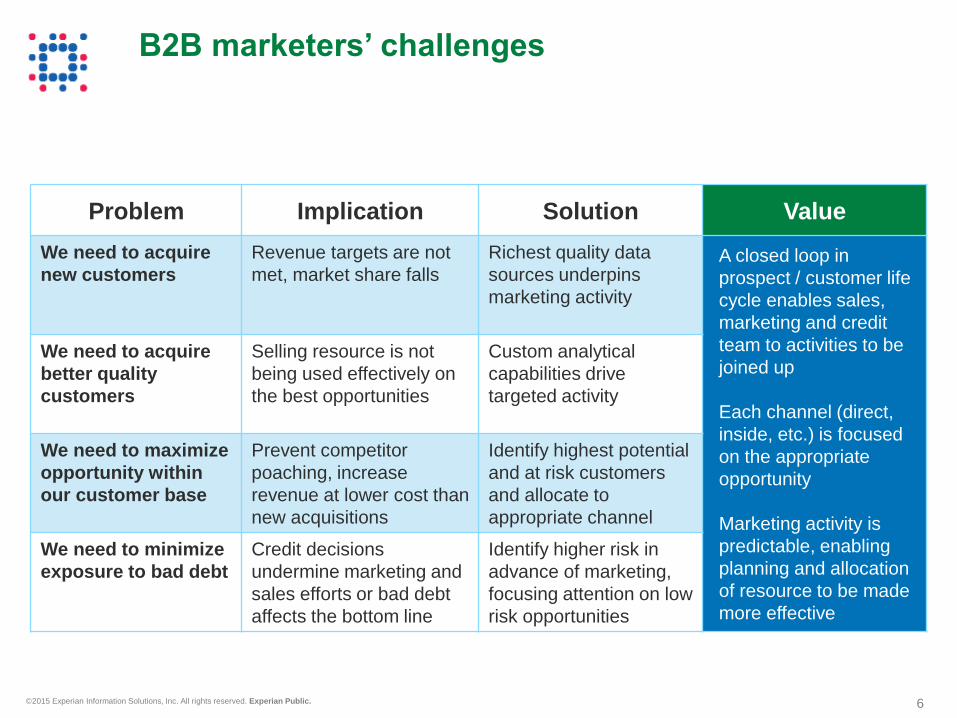
B2B marketers’ challenges
Problem Implication Solution Value
We need to acquire
new customers
Revenue targets are not
met, market share falls
Richest quality data
sources underpins
marketing activity
A closed loop in
prospect / customer life
cycle enables sales,
marketing and credit
team to activities to be
joined up
Each channel (direct,
inside, etc.) is focused
on the appropriate
opportunity
Marketing activity is
predictable, enabling
planning and allocation
of resource to be made
more effective
We need to acquire
better quality
customers
Selling resource is not
being used effectively on
the best opportunities
Custom analytical
capabilities drive
targeted activity
We need to maximize
opportunity within
our customer base
Prevent competitor
poaching, increase
revenue at lower cost than
new acquisitions
Identify highest potential
and at risk customers
and allocate to
appropriate channel
We need to minimize
exposure to bad debt
Credit decisions
undermine marketing and
sales efforts or bad debt
affects the bottom line
Identify higher risk in
advance of marketing,
focusing attention on low
risk opportunities
7 © 2015 Experian Information Solutions, Inc. All rights reserved. Experian Public.
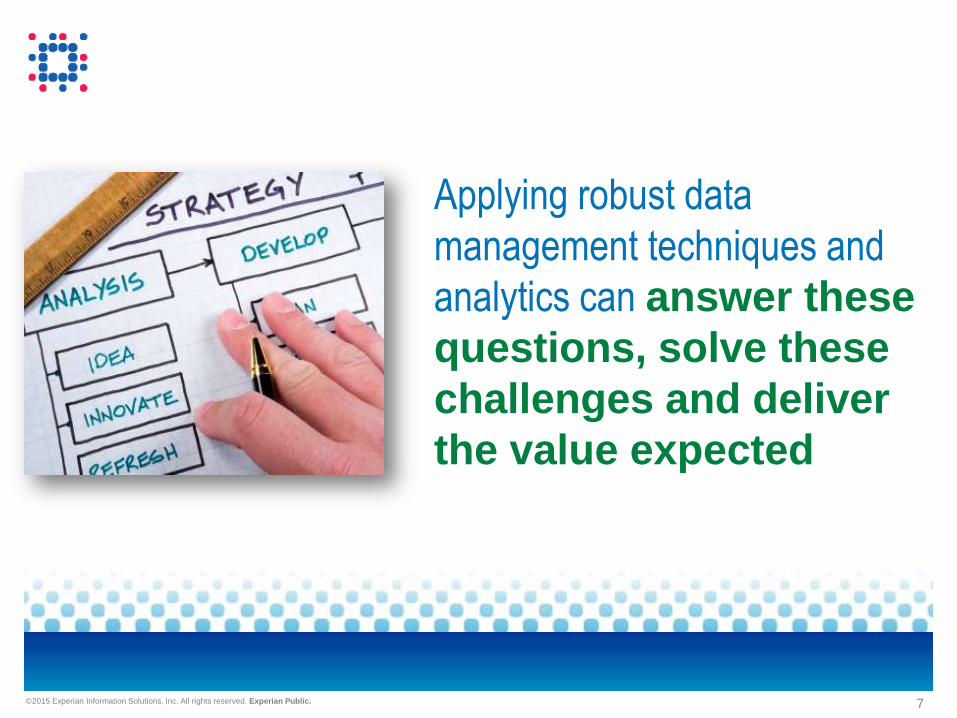
Applying robust data
management techniques and
analytics can answer these
questions, solve these
challenges and deliver
the value expected
8 © 2015 Experian Information Solutions, Inc. All rights reserved. Experian Public.
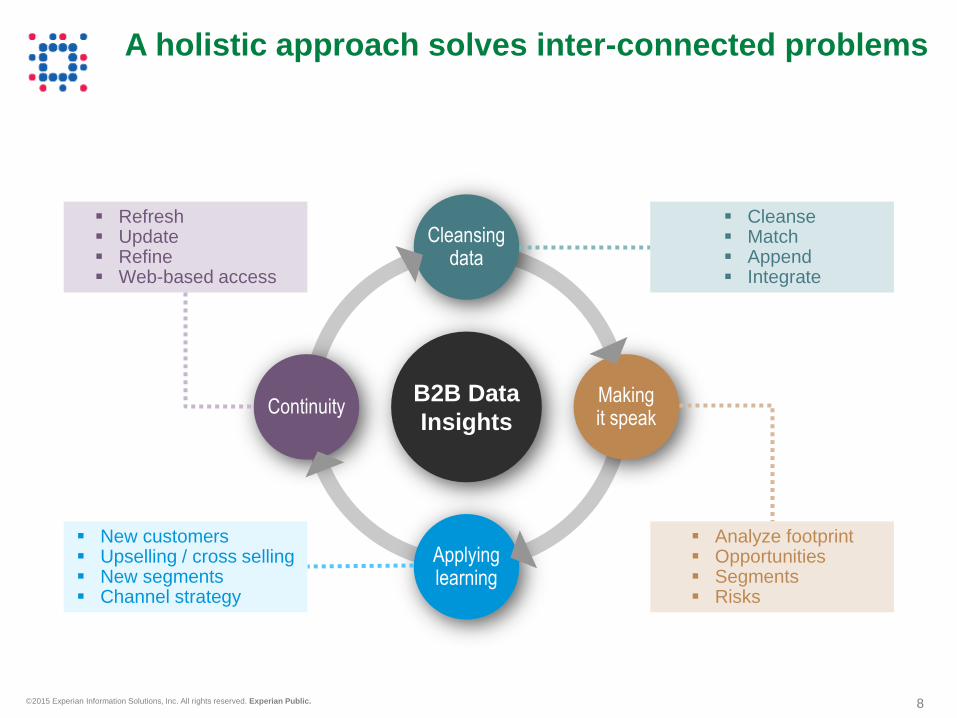
A holistic approach solves inter-connected problems
B2B Data
Insights
Cleansing data
Making it speak
Applying learning
Continuity
New customers Upselling / cross selling New segments Channel strategy
Analyze footprint Opportunities Segments Risks
Cleanse Match Append Integrate
Refresh Update Refine Web-based access
9 © 2015 Experian Information Solutions, Inc. All rights reserved. Experian Public.
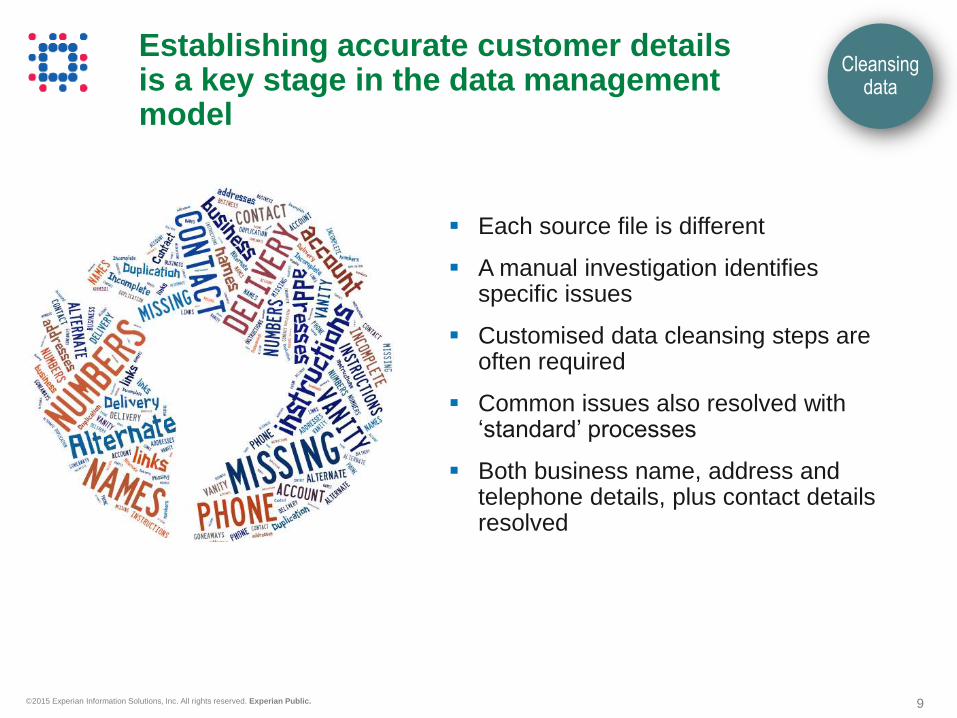
Each source file is different
A manual investigation identifies specific issues
Customised data cleansing steps are often required
Common issues also resolved with ‘standard’ processes
Both business name, address and telephone details, plus contact details resolved
Establishing accurate customer details is a key stage in the data management model
Cleansing data

10 © 2015 Experian Information Solutions, Inc. All rights reserved. Experian Public.
GSFA Customer Id Name Address Line 1 City State Post Code MainPhone#
USS93050854WL Personal 4725 Dunberry Lane Edina MN 55435 9522203733
USS93047509WL N/A 1285 sw amboy ave Port St Lucie FL 34953 5613101218
USS93051626WL self 1068 Gerard Avenue Apt 8B Bronx NY 10452 6466066930
USS93046820WL Student 39800 Fremont blvd apt 206 Fremont CA 94538 4085061610
USS93051315WL Non 8663 virgil St. Dearborn Hts MI 48127 3134851589
USS93051002WL home 6969 Collins Avenue - Apt. 1112 Miami Beach FL 33141 3057907001
USS93051612WL lambert reu lui ernotte 62 b1 Bruxell PA 01170 3248546217x3
USS93051924WL residents 3008 Summerville rd Phenix City AL 36867 2703006092
USS93051150WL Student 1718 West 14th Street Erie PA 16505 8018542414
USS93050938WL No company 100 Norway Street Apt.2A Boston MA 02115 6178695887
USS93046609WL dhl 12812 23rd ave s Seattle WA 98168 2067791678
USS93047564WL Personal 8 Sequoia Court Voorhees NJ 08043 8569387004
USS93046655WL N/A 105 Belmont Dayton KY 41074 8594627440
USS93051727WL NA 17026 Darien Wing San Antonio TX 78247 2146768797
USS93052066WL personal 1371 E Lexington Ave #13 El Cajon CA 92019 6196339747
Examples help to identify data capture issues and improve practices at source
Cleansing data
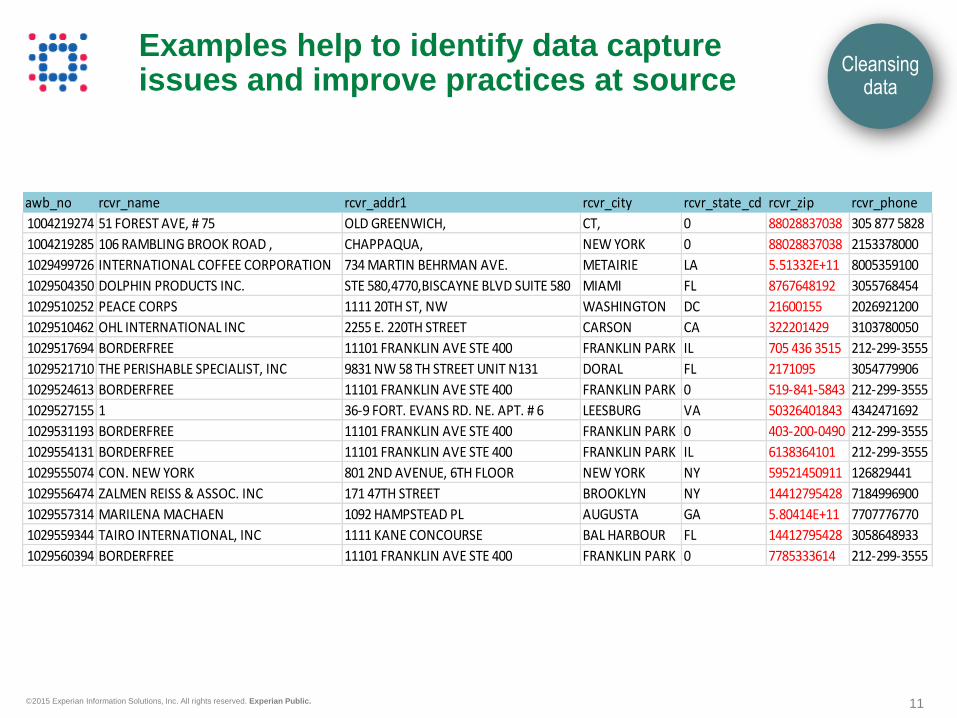
11 © 2015 Experian Information Solutions, Inc. All rights reserved. Experian Public.
Examples help to identify data capture issues and improve practices at source
awb_no rcvr_name rcvr_addr1 rcvr_city rcvr_state_cd rcvr_zip rcvr_phone
1004219274 51 FOREST AVE, # 75 OLD GREENWICH, CT, 0 88028837038 305 877 5828
1004219285 106 RAMBLING BROOK ROAD , CHAPPAQUA, NEW YORK 0 88028837038 2153378000
1029499726 INTERNATIONAL COFFEE CORPORATION 734 MARTIN BEHRMAN AVE. METAIRIE LA 5.51332E+11 8005359100
1029504350 DOLPHIN PRODUCTS INC. STE 580,4770,BISCAYNE BLVD SUITE 580 MIAMI FL 8767648192 3055768454
1029510252 PEACE CORPS 1111 20TH ST, NW WASHINGTON DC 21600155 2026921200
1029510462 OHL INTERNATIONAL INC 2255 E. 220TH STREET CARSON CA 322201429 3103780050
1029517694 BORDERFREE 11101 FRANKLIN AVE STE 400 FRANKLIN PARK IL 705 436 3515 212-299-3555
1029521710 THE PERISHABLE SPECIALIST, INC 9831 NW 58 TH STREET UNIT N131 DORAL FL 2171095 3054779906
1029524613 BORDERFREE 11101 FRANKLIN AVE STE 400 FRANKLIN PARK 0 519-841-5843 212-299-3555
1029527155 1 36-9 FORT. EVANS RD. NE. APT. # 6 LEESBURG VA 50326401843 4342471692
1029531193 BORDERFREE 11101 FRANKLIN AVE STE 400 FRANKLIN PARK 0 403-200-0490 212-299-3555
1029554131 BORDERFREE 11101 FRANKLIN AVE STE 400 FRANKLIN PARK IL 6138364101 212-299-3555
1029555074 CON. NEW YORK 801 2ND AVENUE, 6TH FLOOR NEW YORK NY 59521450911 126829441
1029556474 ZALMEN REISS & ASSOC. INC 171 47TH STREET BROOKLYN NY 14412795428 7184996900
1029557314 MARILENA MACHAEN 1092 HAMPSTEAD PL AUGUSTA GA 5.80414E+11 7707776770
1029559344 TAIRO INTERNATIONAL, INC 1111 KANE CONCOURSE BAL HARBOUR FL 14412795428 3058648933
1029560394 BORDERFREE 11101 FRANKLIN AVE STE 400 FRANKLIN PARK 0 7785333614 212-299-3555
Cleansing data
12 © 2015 Experian Information Solutions, Inc. All rights reserved. Experian Public.
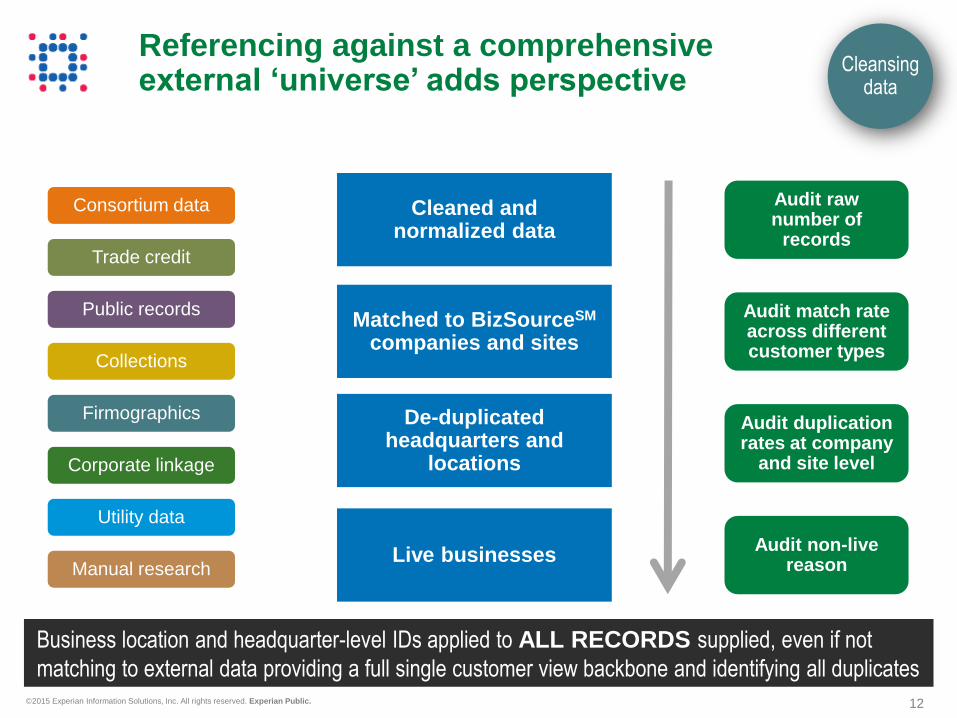
Referencing against a comprehensive external ‘universe’ adds perspective
Cleaned and normalized data
Matched to BizSourceSM companies and sites
De-duplicated headquarters and
locations
Live businesses
Business location and headquarter-level IDs applied to ALL RECORDS supplied, even if not
matching to external data providing a full single customer view backbone and identifying all duplicates
Consortium data
Trade credit
Public records
Collections
Firmographics
Corporate linkage
Utility data
Manual research
Cleansing data
Audit raw number of
records
Audit match rate across different customer types
Audit duplication rates at company
and site level
Audit non-live reason

13 © 2015 Experian Information Solutions, Inc. All rights reserved. Experian Public.
Typical match rates in the high 80% to 90% range reflect good quality data
83%
68%
88%
27%
86% 91%
80%
Prospects Suspects Billing Leads -Online
Leads - Local CRM Overall
Match rates vary with the quality of input data
Example:
Logistics business with six distinct sources of customer and prospect information
Cleansing data

14 © 2015 Experian Information Solutions, Inc. All rights reserved. Experian Public.
Even within a single source, an examination of match rates can reveal data management variations
Proportional
to number of
customers
Cleansing data
Example:
Business services company with a single source of customer data
15 © 2015 Experian Information Solutions, Inc. All rights reserved. Experian Public.
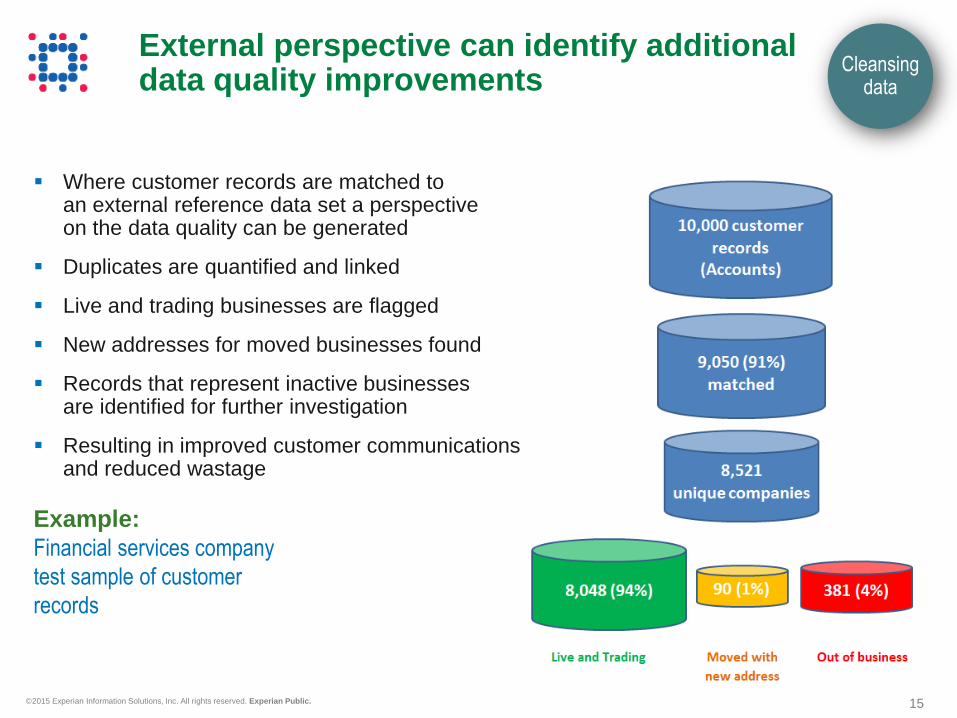
Where customer records are matched to an external reference data set a perspective on the data quality can be generated
Duplicates are quantified and linked
Live and trading businesses are flagged
New addresses for moved businesses found
Records that represent inactive businesses are identified for further investigation
Resulting in improved customer communications and reduced wastage
External perspective can identify additional data quality improvements
Cleansing data
Example:
Financial services company
test sample of customer
records
16 © 2015 Experian Information Solutions, Inc. All rights reserved. Experian Public.
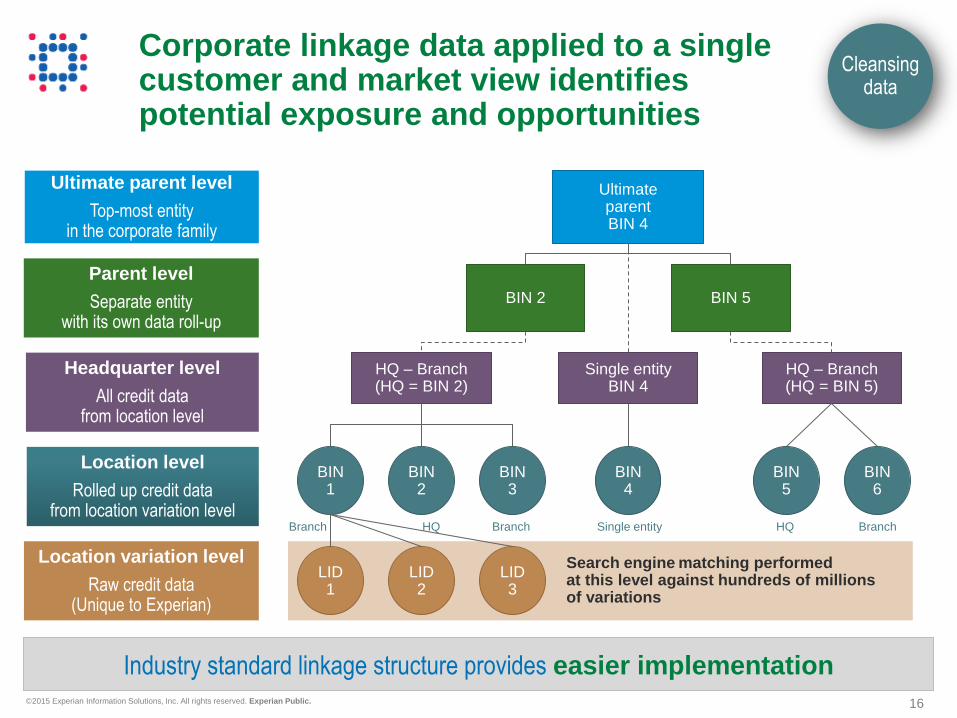
Corporate linkage data applied to a single customer and market view identifies potential exposure and opportunities
Location variation level
Raw credit data (Unique to Experian)
Parent level
Separate entity with its own data roll-up
Ultimate parent level
Top-most entity in the corporate family
Location level
Rolled up credit data from location variation level
Headquarter level
All credit data from location level
Industry standard linkage structure provides easier implementation
Cleansing data
Ultimate parent BIN 4
LID 1
LID 2
LID 3
HQ – Branch (HQ = BIN 2)
Single entity BIN 4
HQ – Branch (HQ = BIN 5)
BIN 2 BIN 5
BIN 1
BIN 5
BIN 6
BIN 2
HQ
BIN 3
Branch
BIN 4
Single entity Branch HQ Branch
Search engine matching performed at this level against hundreds of millions of variations
17 © 2015 Experian Information Solutions, Inc. All rights reserved. Experian Public.
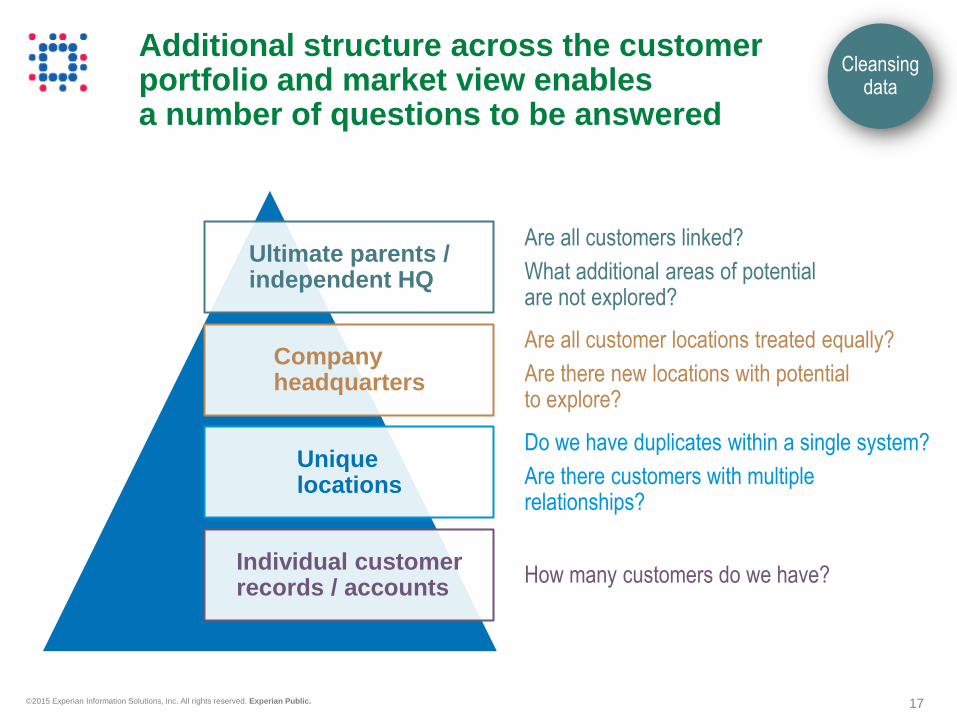
Additional structure across the customer portfolio and market view enables a number of questions to be answered
Cleansing data
Ultimate parents / independent HQ
Company headquarters
Unique locations
Individual customer records / accounts
Are all customers linked?
What additional areas of potential are not explored?
Are all customer locations treated equally?
Are there new locations with potential to explore?
Do we have duplicates within a single system?
Are there customers with multiple relationships?
How many customers do we have?
18 © 2015 Experian Information Solutions, Inc. All rights reserved. Experian Public.
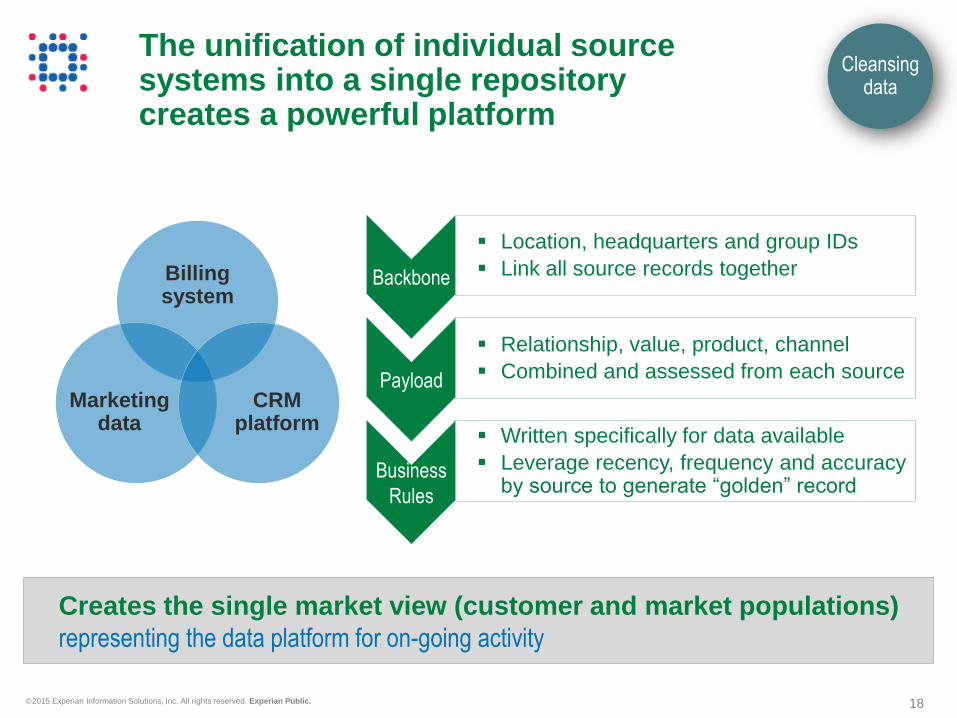
The unification of individual source systems into a single repository creates a powerful platform
Cleansing data
Backbone
Payload
Business
Rules
Location, headquarters and group IDs
Link all source records together Billing system
CRM platform
Marketing data
Relationship, value, product, channel
Combined and assessed from each source
Written specifically for data available
Leverage recency, frequency and accuracy by source to generate “golden” record
Creates the single market view (customer and market populations)
representing the data platform for on-going activity
19 © 2015 Experian Information Solutions, Inc. All rights reserved. Experian Public.
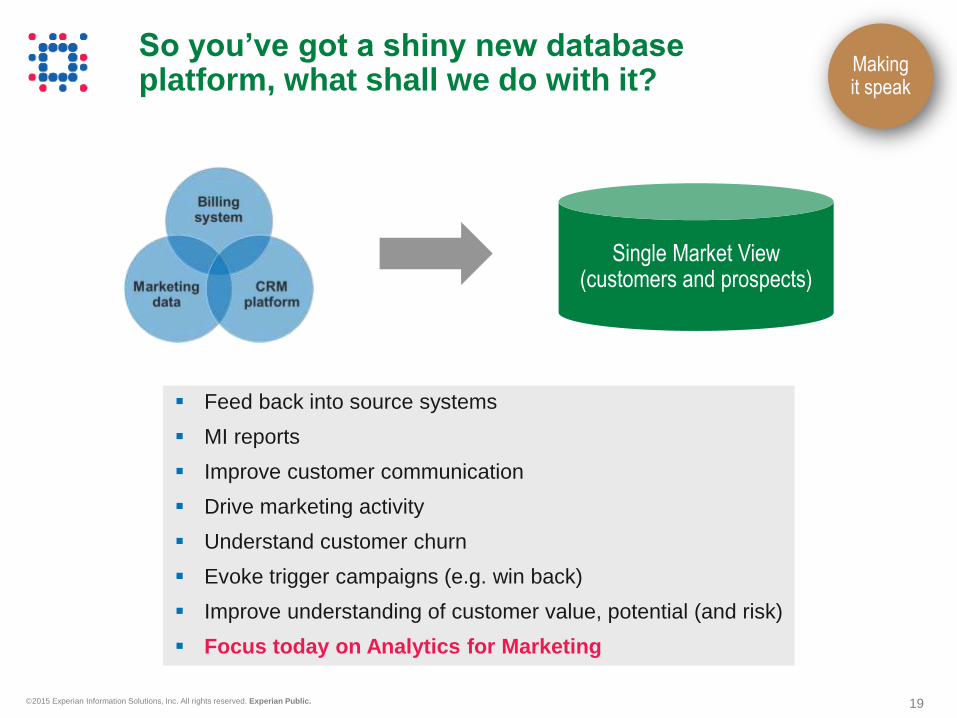
Feed back into source systems
MI reports
Improve customer communication
Drive marketing activity
Understand customer churn
Evoke trigger campaigns (e.g. win back)
Improve understanding of customer value, potential (and risk)
Focus today on Analytics for Marketing
So you’ve got a shiny new database platform, what shall we do with it?
Making it speak
Single Market View (customers and prospects)
20 © 2015 Experian Information Solutions, Inc. All rights reserved. Experian Public.
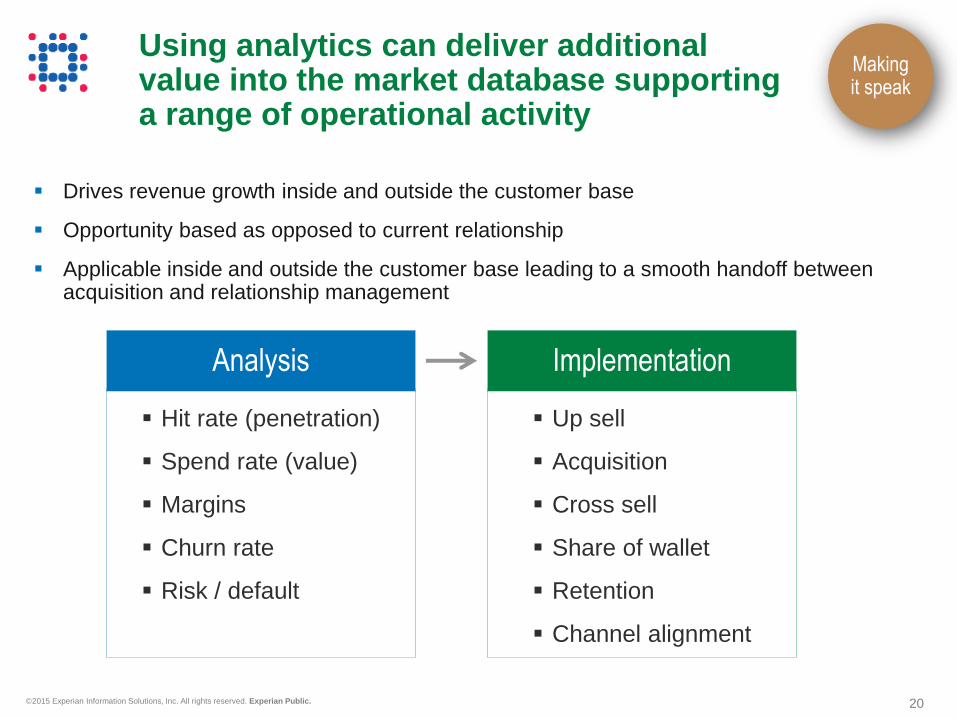
Drives revenue growth inside and outside the customer base
Opportunity based as opposed to current relationship
Applicable inside and outside the customer base leading to a smooth handoff between acquisition and relationship management
Using analytics can deliver additional value into the market database supporting a range of operational activity
Making it speak
Hit rate (penetration)
Spend rate (value)
Margins
Churn rate
Risk / default
Analysis
Up sell
Acquisition
Cross sell
Share of wallet
Retention
Channel alignment
Implementation
21 © 2015 Experian Information Solutions, Inc. All rights reserved. Experian Public.
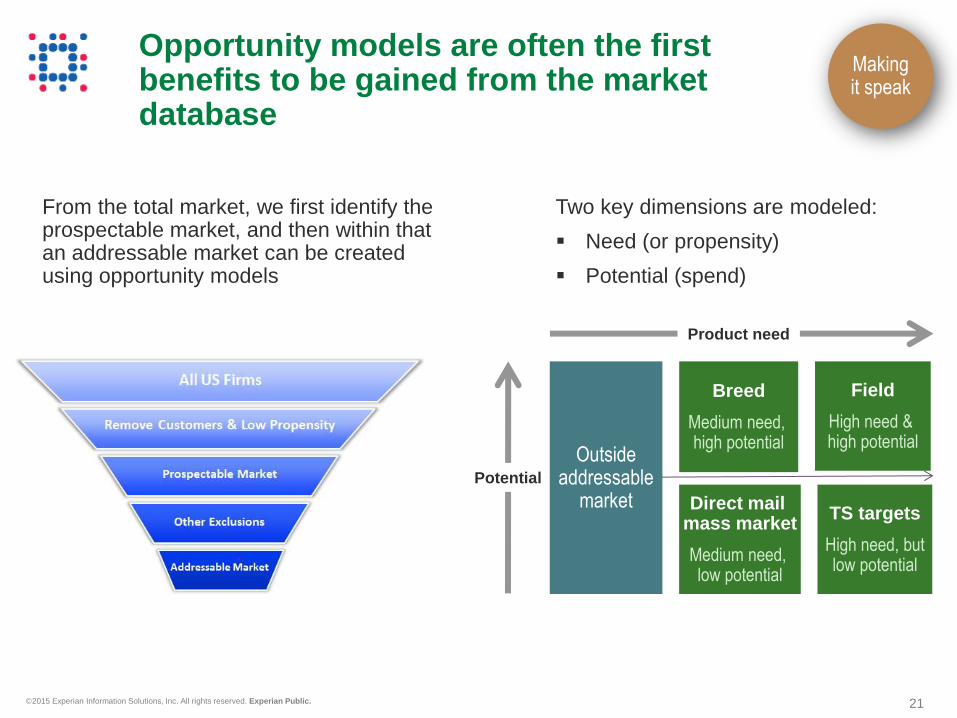
Opportunity models are often the first benefits to be gained from the market database
From the total market, we first identify the prospectable market, and then within that an addressable market can be created using opportunity models
Two key dimensions are modeled:
Need (or propensity)
Potential (spend)
Making it speak
Field
High need & high potential
TS targets
High need, but low potential
Direct mail mass market
Medium need, low potential
Breed
Medium need, high potential
Potential
Outside addressable
market
Product need
22 © 2015 Experian Information Solutions, Inc. All rights reserved. Experian Public.
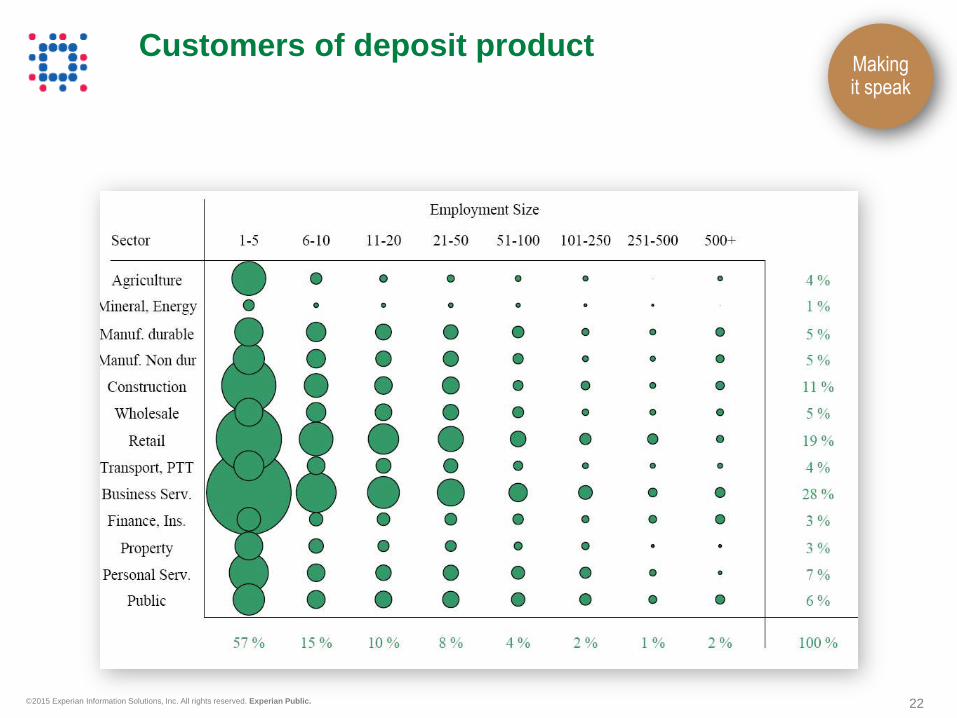
Customers of deposit product Making it speak
23 © 2015 Experian Information Solutions, Inc. All rights reserved. Experian Public.
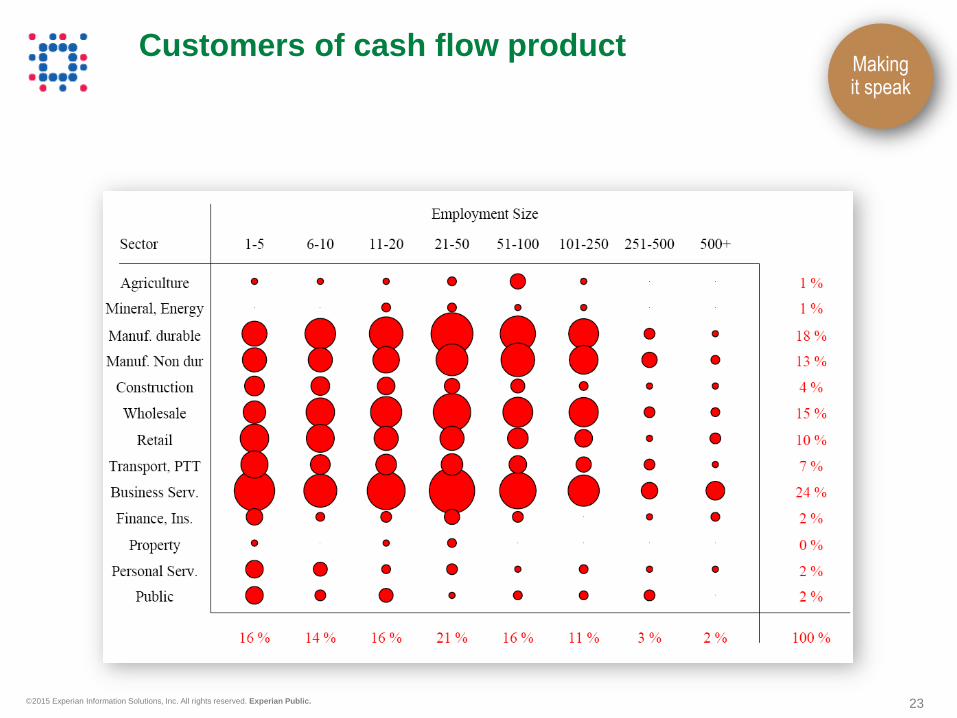
Customers of cash flow product Making it speak
24 © 2015 Experian Information Solutions, Inc. All rights reserved. Experian Public.
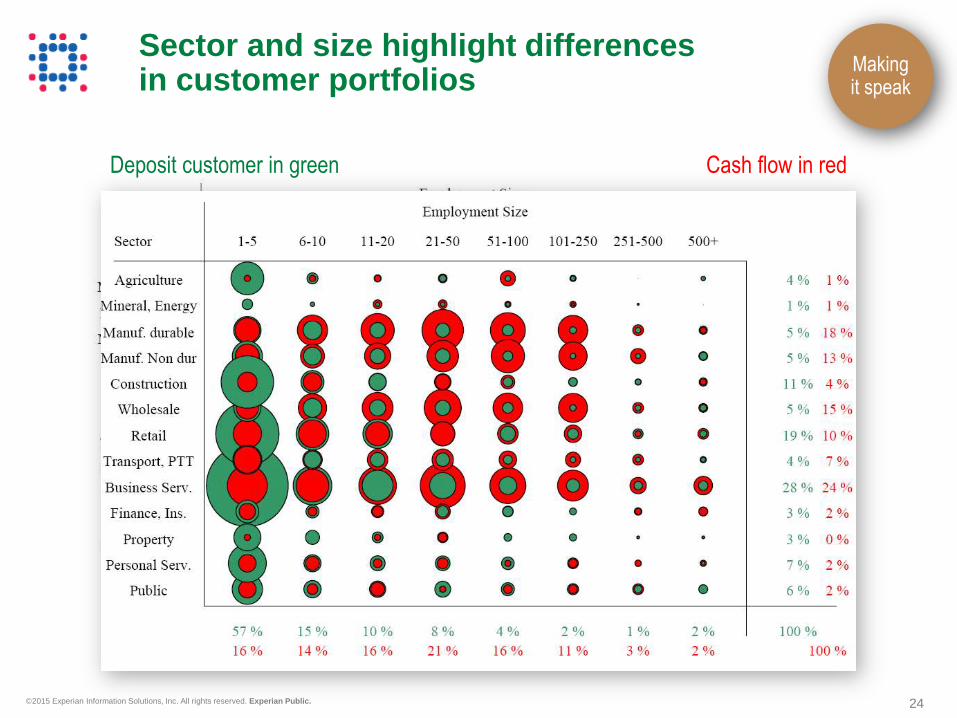
Sector and size highlight differences in customer portfolios
Making it speak
Deposit customer in green Cash flow in red

25 © 2015 Experian Information Solutions, Inc. All rights reserved. Experian Public.
0
0.5
1
1.5
2
2.5
Pre 1970 1970-1979 1980-1989 1990-1994 1995-1999 2000-2004 2005+
Year of Birth
Ind
exed
pen
etr
ati
on
rate
Deposit
Cash Flow
The same two portfolios also have distinct age profiles…
Making it speak

26 © 2015 Experian Information Solutions, Inc. All rights reserved. Experian Public.
… and financial health profiles
0
0.5
1
1.5
2
2.5
3
A B C D E
Megascore
Ind
exed
pen
etr
ati
on
rate
Deposit
Cash Flow
Credit Risk Rating
Making it speak
27 © 2015 Experian Information Solutions, Inc. All rights reserved. Experian Public.
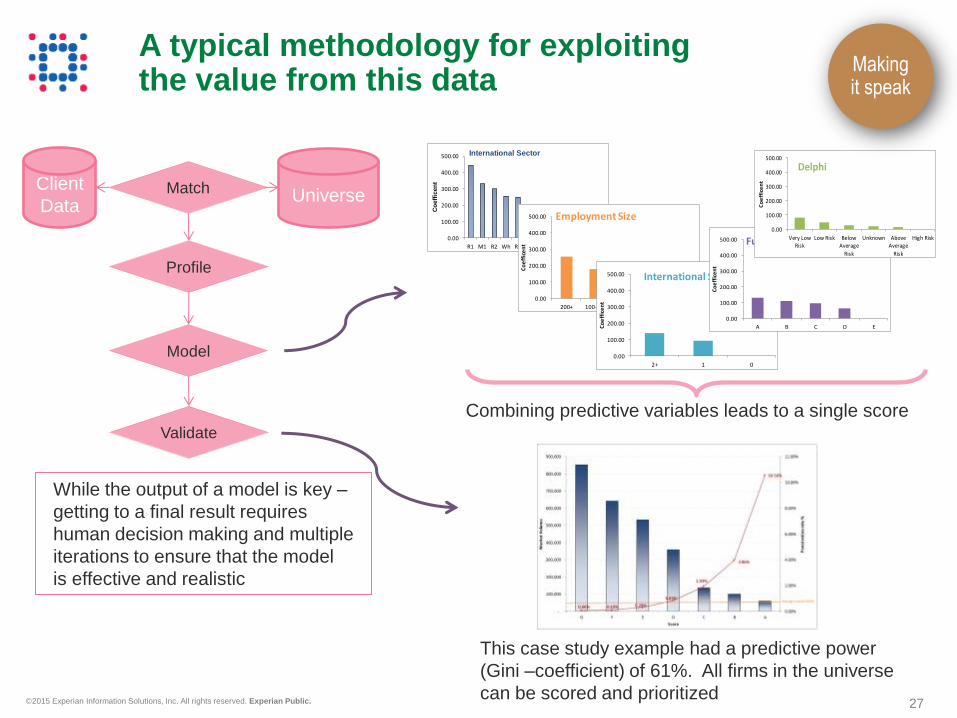
A typical methodology for exploiting the value from this data
This case study example had a predictive power
(Gini –coefficient) of 61%. All firms in the universe
can be scored and prioritized
While the output of a model is key –
getting to a final result requires
human decision making and multiple
iterations to ensure that the model
is effective and realistic
Profile
Client
Data Universe
Model
Validate
Match
Combining predictive variables leads to a single score
0.00
100.00
200.00
300.00
400.00
500.00
R1 M1 R2 Wh R3 B1 FI M2 PS B2 R4 OT
Co
eff
icen
t
International Sector
0.00
100.00
200.00
300.00
400.00
500.00
200+ 100-199 20-99 6-19 1-5
Co
eff
ice
nt
Employment Size
0.00
100.00
200.00
300.00
400.00
500.00
2+ 1 0
Co
eff
ice
nt
International Score
0.00
100.00
200.00
300.00
400.00
500.00
A B C D E
Co
eff
ice
nt
Future Growth Score0.00
100.00
200.00
300.00
400.00
500.00
Very LowRisk
Low Risk BelowAverage
Risk
Unknown AboveAverage
Risk
High Risk
Co
eff
ice
nt
Delphi
Making it speak
28 © 2015 Experian Information Solutions, Inc. All rights reserved. Experian Public.
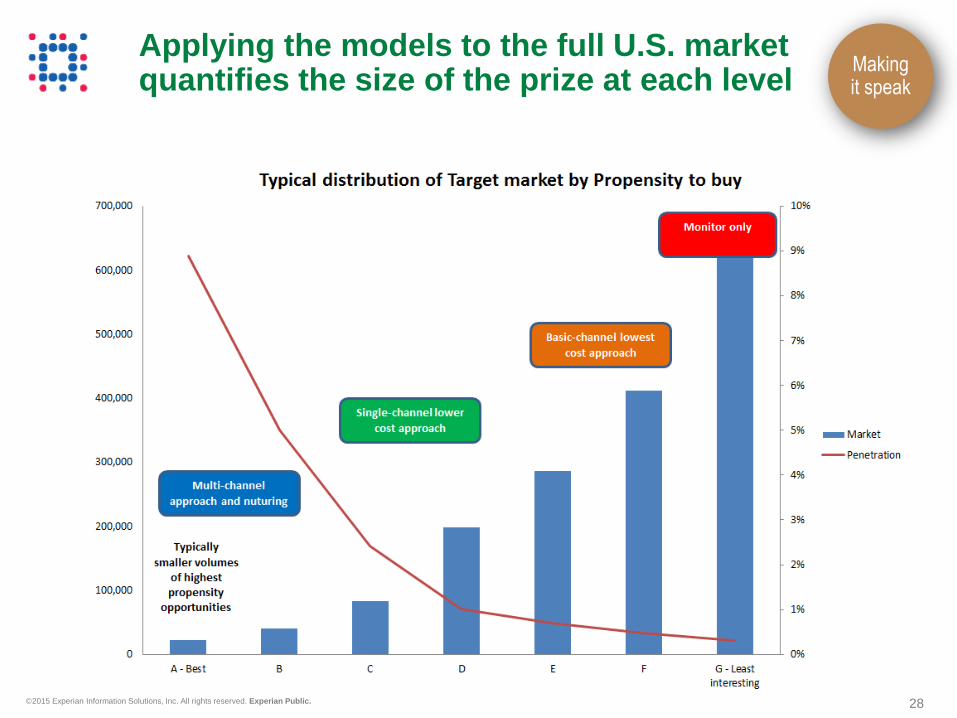
Applying the models to the full U.S. market quantifies the size of the prize at each level
Making it speak
29 © 2015 Experian Information Solutions, Inc. All rights reserved. Experian Public.
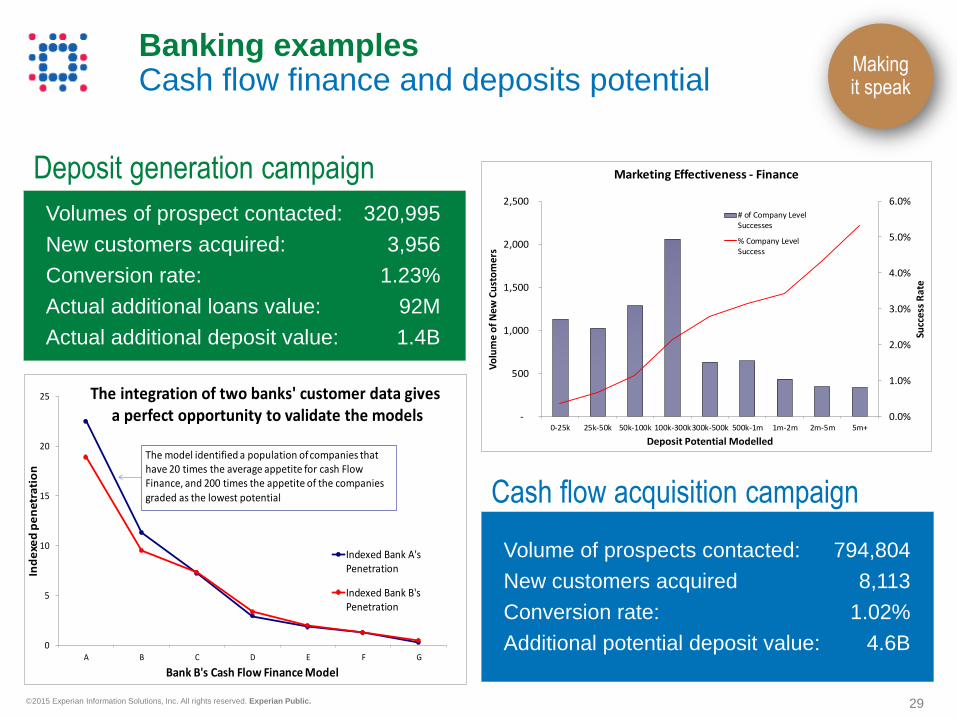
Banking examples Cash flow finance and deposits potential
Making it speak
0
5
10
15
20
25
A B C D E F G
Ind
exe
d p
en
etr
ati
on
Bank B's Cash Flow Finance Model
The integration of two banks' customer data givesa perfect opportunity to validate the models
Indexed Bank A'sPenetration
Indexed Bank B'sPenetration
The model identified a population of companies that have 20 times the average appetite for cash Flow Finance, and 200 times the appetite of the companies
graded as the lowest potential
Volumes of prospect contacted: 320,995
New customers acquired: 3,956
Conversion rate: 1.23%
Actual additional loans value: 92M
Actual additional deposit value: 1.4B
Deposit generation campaign
0.0%
1.0%
2.0%
3.0%
4.0%
5.0%
6.0%
-
500
1,000
1,500
2,000
2,500
0-25k 25k-50k 50k-100k 100k-300k300k-500k 500k-1m 1m-2m 2m-5m 5m+
Succ
ess
Rat
e
Vo
lum
e o
f N
ew C
ust
om
ers
Deposit Potential Modelled
Marketing Effectiveness - Finance
# of Company LevelSuccesses
% Company LevelSuccess
Volume of prospects contacted: 794,804
New customers acquired 8,113
Conversion rate: 1.02%
Additional potential deposit value: 4.6B
Cash flow acquisition campaign
30 © 2015 Experian Information Solutions, Inc. All rights reserved. Experian Public.
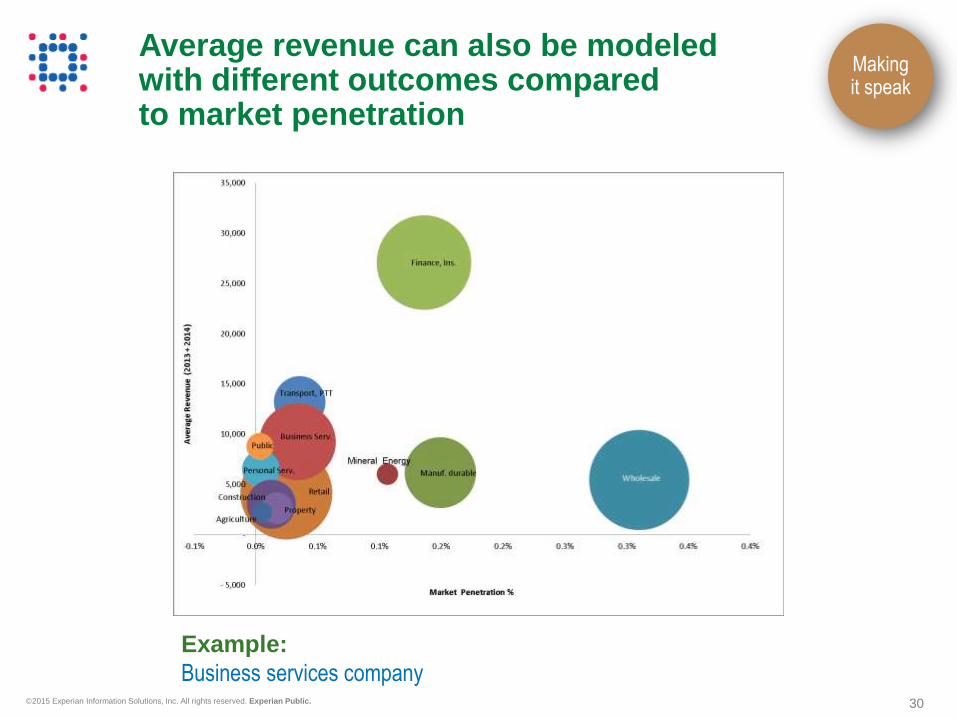
Average revenue can also be modeled with different outcomes compared to market penetration
Making it speak
Example:
Business services company
31 © 2015 Experian Information Solutions, Inc. All rights reserved. Experian Public.
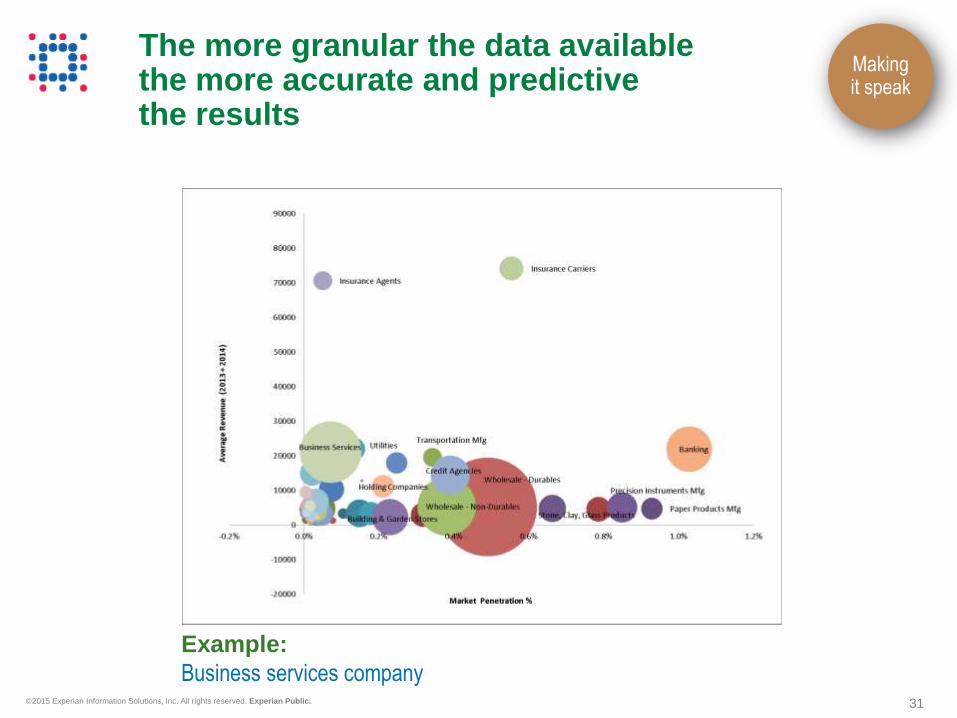
The more granular the data available the more accurate and predictive the results
Making it speak
Example:
Business services company
32 © 2015 Experian Information Solutions, Inc. All rights reserved. Experian Public.
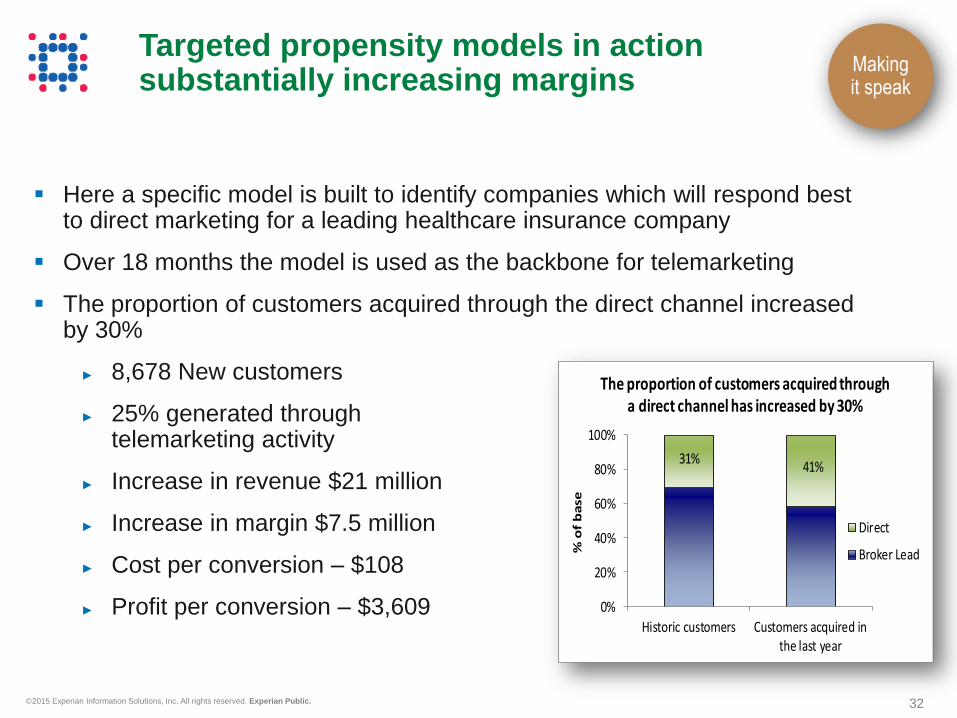
Here a specific model is built to identify companies which will respond best to direct marketing for a leading healthcare insurance company
Over 18 months the model is used as the backbone for telemarketing
The proportion of customers acquired through the direct channel increased by 30%
► 8,678 New customers
► 25% generated through telemarketing activity
► Increase in revenue $21 million
► Increase in margin $7.5 million
► Cost per conversion – $108
► Profit per conversion – $3,609
Targeted propensity models in action substantially increasing margins
0%
20%
40%
60%
80%
100%
Historic customers Customers acquired inthe last year
% o
f b
ase
The proportion of customers acquired through a direct channel has increased by 30%
Direct
Broker Lead
31% 41%
Making it speak
33 © 2015 Experian Information Solutions, Inc. All rights reserved. Experian Public.
Random
Selection
With
pH Model
Propensity model had Gini Score of 61% Total records 300,000 300,000
Client calls 300K records in an average
annual campaign Cost (Data + Calling) $319,500
Add model development $345,000
Lead generation was over 6 times higher
using the propensity model Leads generated
6,750
(2.3%)
46,574
(15.5%)
Cost-per-lead reduced by 85% Cost per lead $47 $7
A customized model was built to identify companies which have the highest propensity for a specific insurance product
Targeted propensity models in action substantially reducing costs per lead generated
Making it speak

34 © 2015 Experian Information Solutions, Inc. All rights reserved. Experian Public.
Looking at potential is important, but we ignore risk at our peril
Credit policy approach Minimum credit line Maximum credit line
Aggressive – Credit line higher than
average, generally at the 75th percentile $5,300 $378,500
Moderate – Credit line at the average,
generally at the 50th percentile $1,300 $118,500
Conservative – Credit line lower than
average, generally at the 25th percentile $300 $47,800
81
28
13 8 6 3.9 2.9 2.1 1.5 1
14.76%
7.40%
4.79%
3.58%
2.81% 2.27% 1.87% 1.54% 1.25% 0.98%
0%
4%
8%
12%
16%
0
30
60
90
1 2 3 4 5 6 7 8 9 10
Decile Bads Cum delinquent %
IntelliscoreSM screens
out 74% of risk in the
bottom 20% of scores
Credit guidance from
hundreds to hundreds
of thousands
Financial Stability Risk
ScoreSM captures 60%
of bads in bottom 10%
Making it speak
35 © 2015 Experian Information Solutions, Inc. All rights reserved. Experian Public.
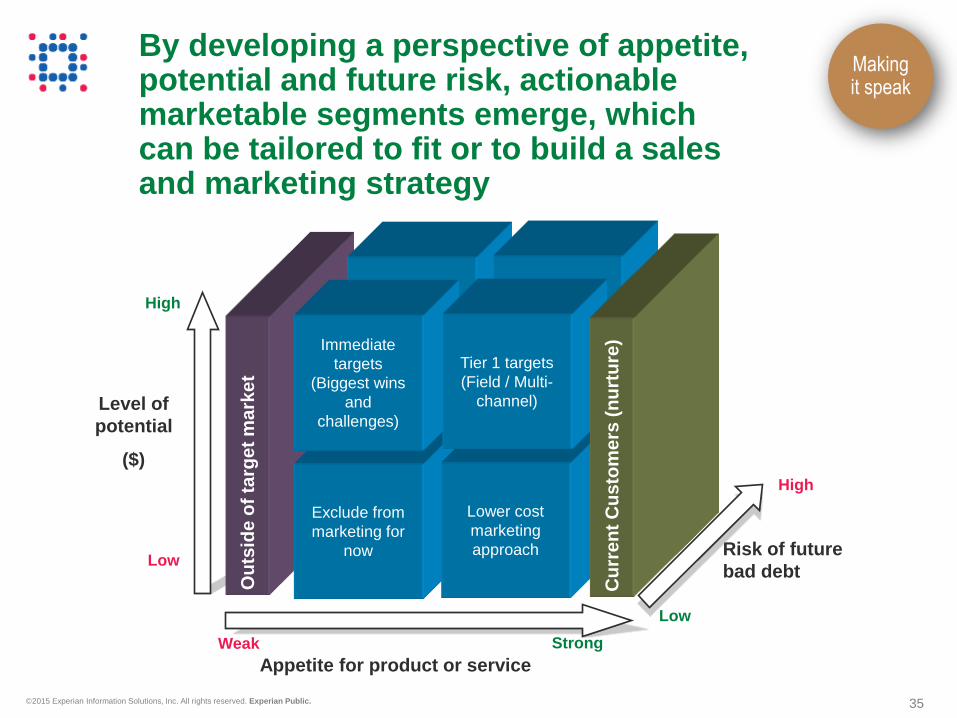
By developing a perspective of appetite, potential and future risk, actionable marketable segments emerge, which can be tailored to fit or to build a sales and marketing strategy
Appetite for product or service
Level of
potential
($)
Risk of future
bad debt
Strong Weak
Low
Low
High
High
Ou
tsid
e o
f ta
rge
t m
ark
et
Exclude from
marketing for
now
Lower cost
marketing
approach
Immediate
targets
(Biggest wins
and
challenges)
Tier 1 targets
(Field / Multi-
channel)
Cu
rre
nt
Cu
sto
me
rs (
nu
rtu
re)
Making it speak
36 © 2015 Experian Information Solutions, Inc. All rights reserved. Experian Public.
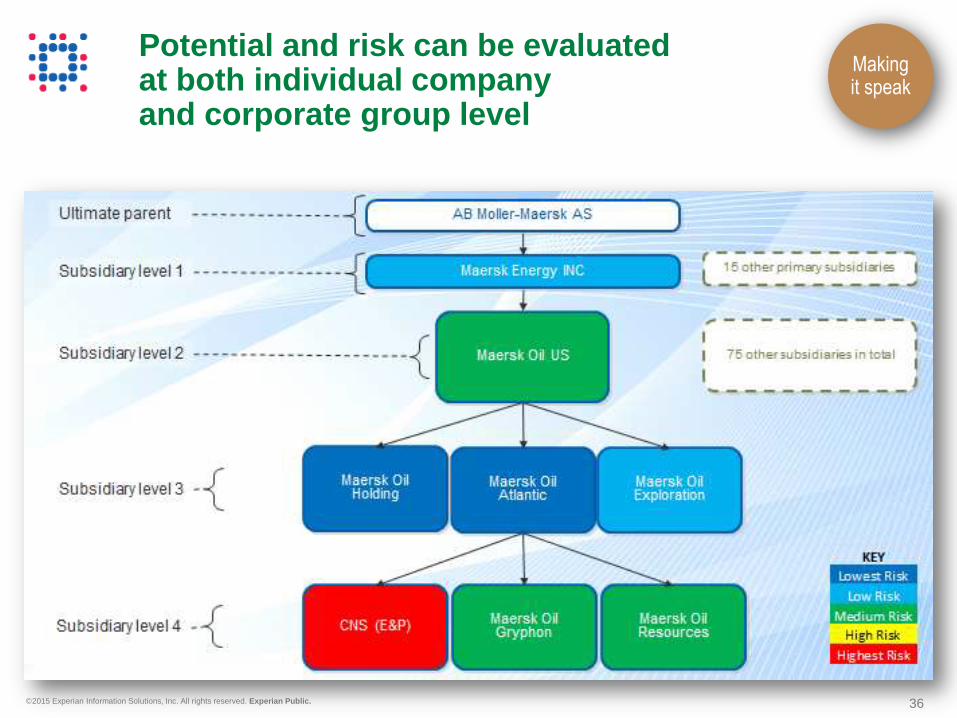
Potential and risk can be evaluated at both individual company and corporate group level
Making it speak
37 © 2015 Experian Information Solutions, Inc. All rights reserved. Experian Public.
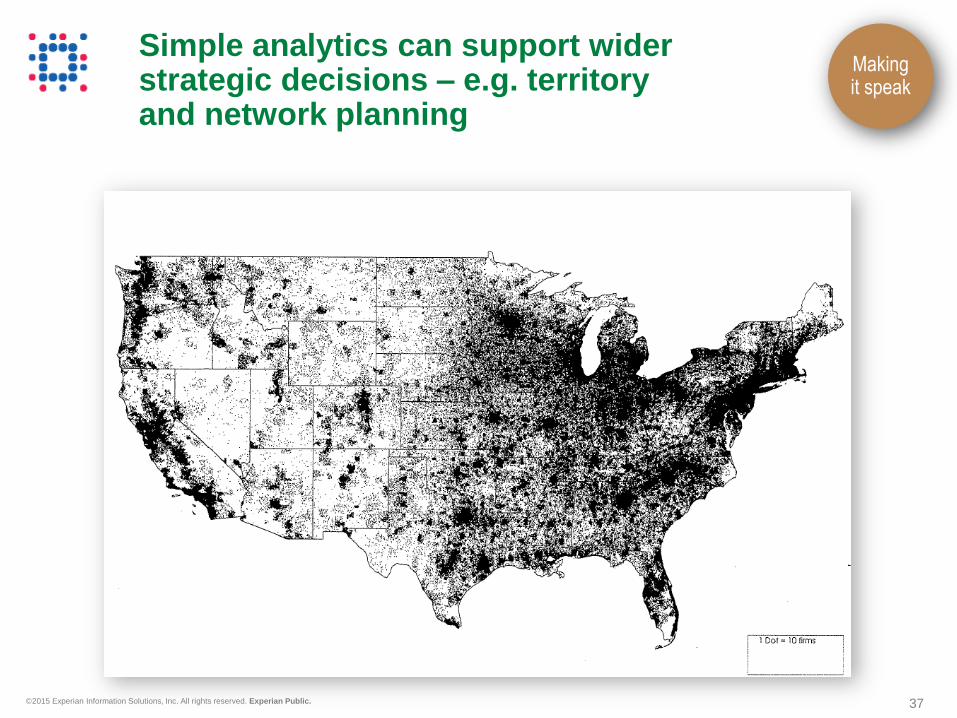
Simple analytics can support wider strategic decisions – e.g. territory and network planning
Making it speak
38 © 2015 Experian Information Solutions, Inc. All rights reserved. Experian Public.
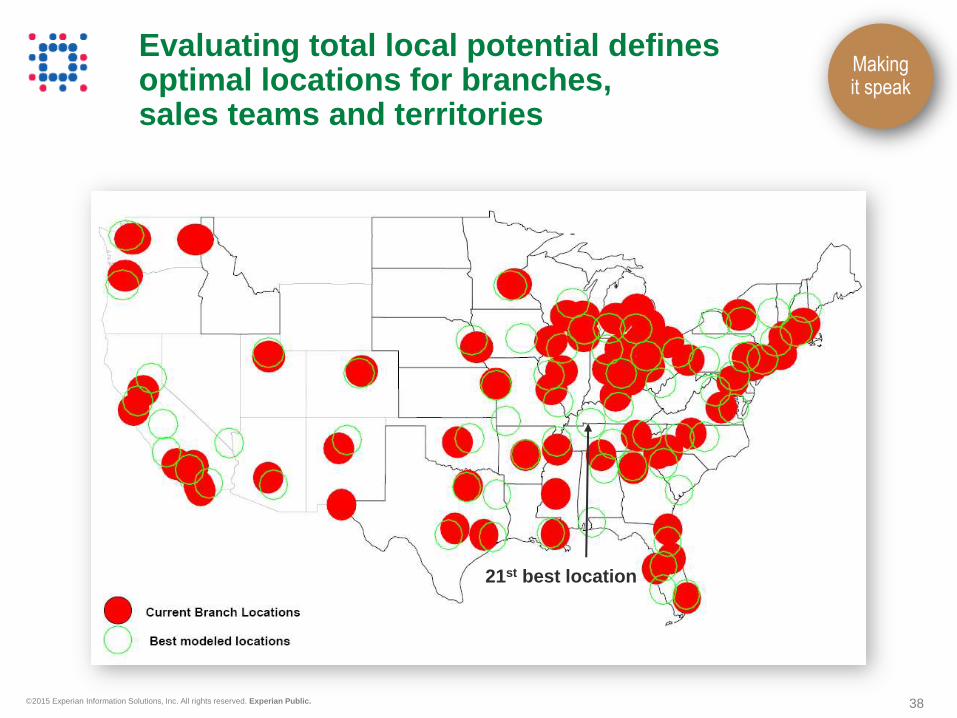
Evaluating total local potential defines optimal locations for branches, sales teams and territories
21st best location
Making it speak
39 © 2015 Experian Information Solutions, Inc. All rights reserved. Experian Public.
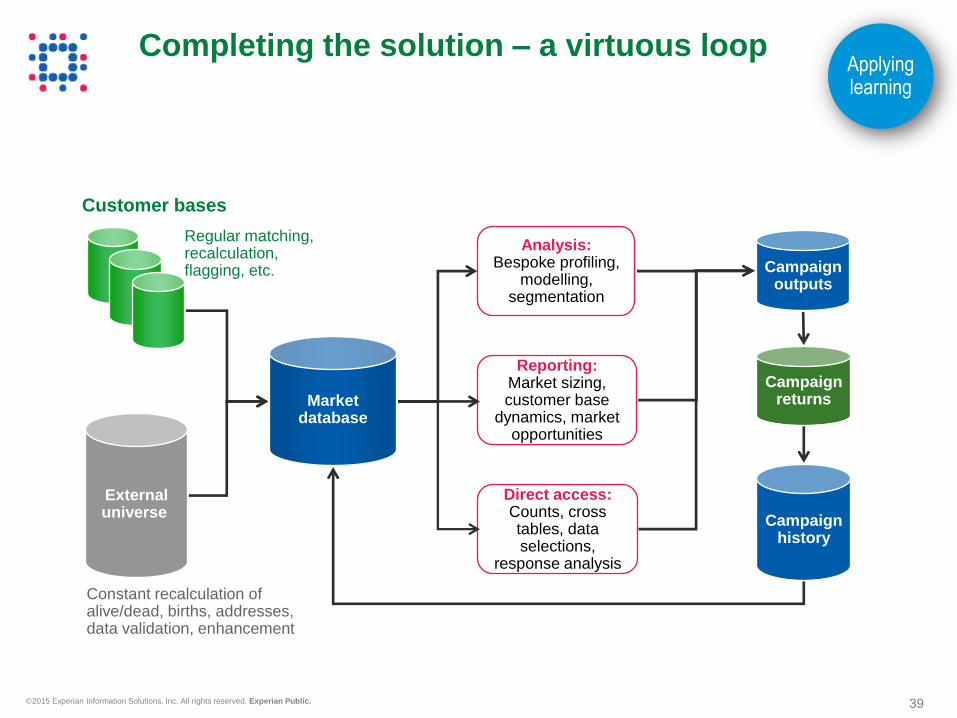
Constant recalculation of alive/dead, births, addresses, data validation, enhancement
Regular matching, recalculation, flagging, etc.
Completing the solution – a virtuous loop
External universe
Customer bases
Market database
Analysis: Bespoke profiling,
modelling, segmentation
Reporting: Market sizing, customer base
dynamics, market opportunities
Direct access: Counts, cross tables, data selections,
response analysis
Campaign returns
Campaign outputs
Campaign history
Applying learning
40 © 2015 Experian Information Solutions, Inc. All rights reserved. Experian Public.
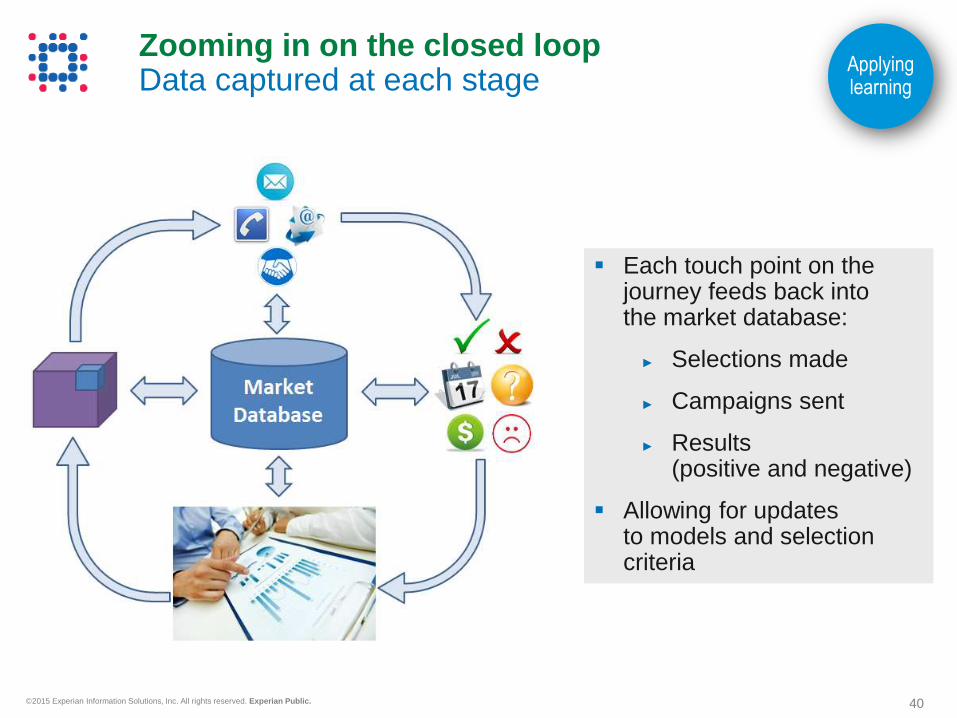
Each touch point on the journey feeds back into the market database:
► Selections made
► Campaigns sent
► Results (positive and negative)
Allowing for updates to models and selection criteria
Zooming in on the closed loop Data captured at each stage
Applying learning

41 © 2015 Experian Information Solutions, Inc. All rights reserved. Experian Public.
There are multiple options for gaining access to the data platform
Access available via stand alone web applications or software applications (analytics or campaign management) or via integration into a CRM platform such as salesforce.com
Web/Software Service
Client submits input files from source systems
External provider processes the files and provides data back to the client
Client loads output into their platform
Batch
External providers can host all client data
External team interact dynamically with internal client team to deliver analytics and marketing campaigns
Hosted
Directly integrated with CRM or analytics platforms via API
Integration
Continuity
42 © 2015 Experian Information Solutions, Inc. All rights reserved. Experian Public.
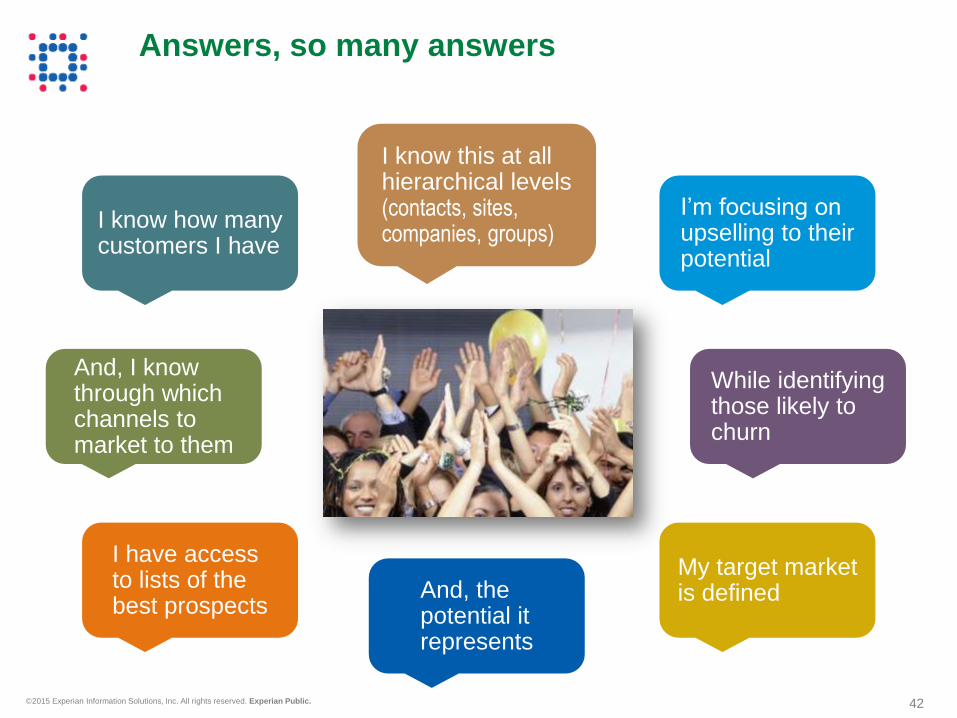
Answers, so many answers
I know how many customers I have
I know this at all hierarchical levels (contacts, sites, companies, groups)
I’m focusing on upselling to their potential
My target market is defined
And, I know through which channels to market to them
And, the potential it represents
I have access to lists of the best prospects
While identifying those likely to churn
43 © 2015 Experian Information Solutions, Inc. All rights reserved. Experian Public.
In summary
By skillful processing and analyzing data, you can make informed decisions
about the right businesses and people to talk at the right time and about the right
product / need ensuring you can acquire, develop and keep the most profitable business
customers
You need to think
creatively
Go beyond using the raw data
Add value with direct human intelligence, over and above the software
You need to be B2B
data experts
Business data is not the same as consumer data
Business decision making also has different drivers
You need flexible
solutions
To maximize success, the solution should be customized to fit your data and initial objectives
When more data is available the systems must adapt
© 2015 Experian Information Solutions, Inc. All rights reserved. Experian Public. 44
For additional information,
please contact:
@ExperianVision | #vision2015
Follow us on Twitter:

45 © 2015 Experian Information Solutions, Inc. All rights reserved. Experian Public.
Share your thoughts about Vision 2015!
Please take the time now to give us your feedback about this session. You can complete the survey in the mobile app or request a paper survey.
Select the breakout
session you attended
Select the Survey
button and complete 1 2

© 2015 Experian Information Solutions, Inc. All rights reserved. Experian Public.


!["Tactics of B2B Customer Acquisition," Yahoo Small Business >> Amit Kumar [COMMERCISM 2014]](https://static.fdocuments.us/doc/165x107/558cfd6ad8b42a534b8b4593/tactics-of-b2b-customer-acquisition-yahoo-small-business-amit-kumar-commercism-2014.jpg)


