drives hypertension and hypertensive end- A salt … · studies demonstrate that T cell SGK1 and...
14
A salt-sensing kinase in T lymphocytes, SGK1, drives hypertension and hypertensive end- organ damage Allison E. Norlander, … , David G. Harrison, Meena S. Madhur JCI Insight. 2017; 2(13):e92801. https://doi.org/10.1172/jci.insight.92801. We previously showed that angiotensin II (Ang II) increases T cell production of IL-17A, and that mice deficient in IL-17A have blunted hypertension and attenuated renal and vascular dysfunction. It was recently shown that salt enhances IL-17A production from CD4 + T cells via a serum- and glucocorticoid-regulated kinase 1–dependent (SGK1-dependent) pathway. Thus, we tested the hypothesis that SGK1 signaling in T cells promotes hypertension and contributes to end-organ damage. We show that loss of T cell SGK1 results in a blunted hypertensive response to Ang II infusion by 25 mmHg. Importantly, renal and vascular inflammation is abrogated in these mice compared with control mice. Furthermore, mice lacking T cell SGK1 are protected from Ang II–induced endothelial dysfunction and renal injury. Loss of T cell SGK1 also blunts blood pressure and vascular inflammation in response to deoxycorticosterone acetate–salt (DOCA-salt) hypertension. Finally, we demonstrate that the Na + -K + -2Cl – cotransporter 1 (NKCC1) is upregulated in Th17 cells and is necessary for the salt-induced increase in SGK1 and the IL-23 receptor. These studies demonstrate that T cell SGK1 and NKCC1 may be novel therapeutic targets for the treatment of hypertension and identify a potentially new mechanism by which salt contributes to hypertension. Research Article Cardiology Inflammation Find the latest version: http://jci.me/92801-pdf
Transcript of drives hypertension and hypertensive end- A salt … · studies demonstrate that T cell SGK1 and...

A salt-sensing kinase in T lymphocytes, SGK1,drives hypertension and hypertensive end-organ damage
Allison E. Norlander, … , David G. Harrison, Meena S.Madhur
JCI Insight. 2017;2(13):e92801. https://doi.org/10.1172/jci.insight.92801.
We previously showed that angiotensin II (Ang II) increases T cell production of IL-17A, andthat mice deficient in IL-17A have blunted hypertension and attenuated renal and vasculardysfunction. It was recently shown that salt enhances IL-17A production from CD4+ T cellsvia a serum- and glucocorticoid-regulated kinase 1–dependent (SGK1-dependent) pathway.Thus, we tested the hypothesis that SGK1 signaling in T cells promotes hypertension andcontributes to end-organ damage. We show that loss of T cell SGK1 results in a bluntedhypertensive response to Ang II infusion by 25 mmHg. Importantly, renal and vascularinflammation is abrogated in these mice compared with control mice. Furthermore, micelacking T cell SGK1 are protected from Ang II–induced endothelial dysfunction and renalinjury. Loss of T cell SGK1 also blunts blood pressure and vascular inflammation inresponse to deoxycorticosterone acetate–salt (DOCA-salt) hypertension. Finally, wedemonstrate that the Na+-K+-2Cl– cotransporter 1 (NKCC1) is upregulated in Th17 cellsand is necessary for the salt-induced increase in SGK1 and the IL-23 receptor. Thesestudies demonstrate that T cell SGK1 and NKCC1 may be novel therapeutic targets for thetreatment of hypertension and identify a potentially new mechanism by which saltcontributes to hypertension.
Research Article Cardiology Inflammation
Find the latest version:
http://jci.me/92801-pdf

1insight.jci.org https://doi.org/10.1172/jci.insight.92801
R E S E A R C H A R T I C L E
Conflict of interest: The authors have declared that no conflict of interest exists.
Submitted: January 11, 2017 Accepted: May 19, 2017 Published: July 6, 2017
Reference information: JCI Insight. 2017;2(13):e92801. https://doi.org/10.1172/jci.insight.92801.
A salt-sensing kinase in T lymphocytes, SGK1, drives hypertension and hypertensive end-organ damageAllison E. Norlander,1 Mohamed A. Saleh,2,3 Arvind K. Pandey,4 Hana A. Itani,2 Jing Wu,1 Liang Xiao,2 Jooeun Kang,1 Bethany L. Dale,1 Slavina B. Goleva,1 Fanny Laroumanie,2 Liping Du,5 David G. Harrison,1,2 and Meena S. Madhur1,2
1Department of Molecular Physiology and Biophysics, Vanderbilt University, Nashville, Tennessee, USA. 2Division of Clinical
Pharmacology, Department of Medicine, Vanderbilt University Medical Center, Nashville, Tennessee, USA. 3Department
of Pharmacology and Toxicology, Faculty of Pharmacy, Mansoura University, Mansoura, Egypt. 4Division of Cardiology,
Department of Medicine, Vanderbilt University Medical Center, Nashville, Tennessee, USA. 5Vanderbilt Center for
Quantitative Sciences, Vanderbilt University School of Medicine, Nashville, Tennessee, USA.
IntroductionHypertension is a leading cause of death and disability from cardiovascular and renal diseases including myocardial infarction, heart failure, stroke, and chronic kidney disease. The rising prevalence of hyperten-sion, due in part to changes in diet and food processing, makes it a major global health concern. In the U.S. alone, hypertension afflicts approximately one-third of all adults over 18 years of age, and this rises to two-thirds by the age of 60 (1). In 2010, high blood pressure (BP) was ranked as the leading single risk factor for global burden of disease (2).
Evidence from our group and others has demonstrated that hypertension is an inflammatory disease characterized by T cell activation, infiltration of target organs such as the kidney and vasculature, and production of cytokines that lead to salt and water retention, vascular dysfunction, and renal injury (3–6). Most notably, we previously demonstrated that mice deficient in the proinflammatory cytokine IL-17A exhibit blunted hypertension, attenuated vascular inflammation, and preservation of vascular function in response to angiotensin II–induced (Ang II–induced) hypertension (7). Recently, we showed that IL-17A regulates proximal and distal renal sodium transporters and contributes to Ang II–induced renal injury (6). IL-17A is produced by subsets of CD4+ T helper cells (Th17 cells), CD8+ cytotoxic T cells (Tc17 cells), and innate-like gamma delta T cells (γδT17 cells). We found that Th17 cells and γδT17 cells are the major sources of IL-17A in the kidney and vasculature following Ang II–induced hypertension (8).
Of note, numerous epidemiological and experimental studies have demonstrated a link between dietary salt intake and hypertension (9). Interestingly, there is now emerging evidence that salt can directly influence immune cell function. Two recent studies demonstrated that elevated extracellular
We previously showed that angiotensin II (Ang II) increases T cell production of IL-17A, and that mice deficient in IL-17A have blunted hypertension and attenuated renal and vascular dysfunction. It was recently shown that salt enhances IL-17A production from CD4+ T cells via a serum- and glucocorticoid-regulated kinase 1–dependent (SGK1-dependent) pathway. Thus, we tested the hypothesis that SGK1 signaling in T cells promotes hypertension and contributes to end-organ damage. We show that loss of T cell SGK1 results in a blunted hypertensive response to Ang II infusion by 25 mmHg. Importantly, renal and vascular inflammation is abrogated in these mice compared with control mice. Furthermore, mice lacking T cell SGK1 are protected from Ang II–induced endothelial dysfunction and renal injury. Loss of T cell SGK1 also blunts blood pressure and vascular inflammation in response to deoxycorticosterone acetate–salt (DOCA-salt) hypertension. Finally, we demonstrate that the Na+-K+-2Cl– cotransporter 1 (NKCC1) is upregulated in Th17 cells and is necessary for the salt-induced increase in SGK1 and the IL-23 receptor. These studies demonstrate that T cell SGK1 and NKCC1 may be novel therapeutic targets for the treatment of hypertension and identify a potentially new mechanism by which salt contributes to hypertension.
2insight.jci.org https://doi.org/10.1172/jci.insight.92801
R E S E A R C H A R T I C L E
sodium chloride concentrations of 190 mM, presumably similar to levels found in the inter-stitium of animals fed a high-salt diet (10, 11), promoted the polarization of naive T cells into Th17 cells through a serum- and glucocorticoid-regulated kinase 1–dependent (SGK1-depen-dent) pathway (12, 13). Using a mouse model of multiple sclerosis known as experimental autoimmune encephalomyelitis (EAE), Wu et al. (12) showed that high-salt feeding resulted in increased numbers of Th17 cells in the central nervous system and mesenteric lymph nodes and led to a more rapid and severe form of EAE, an IL-17A–mediated disease, in control animals. Interestingly, mice with T cell deficien-cy of SGK1 exhibited a significantly reduced EAE incidence and severity that was not further exacerbated by high-salt feeding. Thus, in addi-tion to regulating salt responsiveness of T cells, SGK1 appears to mediate salt-independent T cell, and particularly Th17 cell, pathogenicity in autoimmune disease.
Given the importance of IL-17A in hypertension, we therefore hypothesized that T cell SGK1 plays a key role in salt-dependent and -independent hypertension and hypertensive end-organ damage. To test this hypothesis, we generated mice with T cell–specific deletion of SGK1 and induced hypertension using Ang II infusion or uninephrectomy followed by deoxycorticosterone acetate–salt (DOCA-salt) treatment. We found that loss of SGK1 in T cells blunts hypertension, abrogates renal/vascular inflammation, and protects against hypertensive renal and vascular injury. Furthermore, we detected the expression of mul-tiple sodium channels and sodium transporters on T lymphocytes and provide evidence that the sodium-potassium-2 chloride cotransporter 1 (NKCC1) is upregulated in Th17 cells and mediates the salt-induced increase in SGK1 and the IL-23 receptor (IL-23R). Taken together, these results demonstrate that T cell SGK1 and NKCC1 may serve as novel therapeutic targets for the treatment of hypertension.
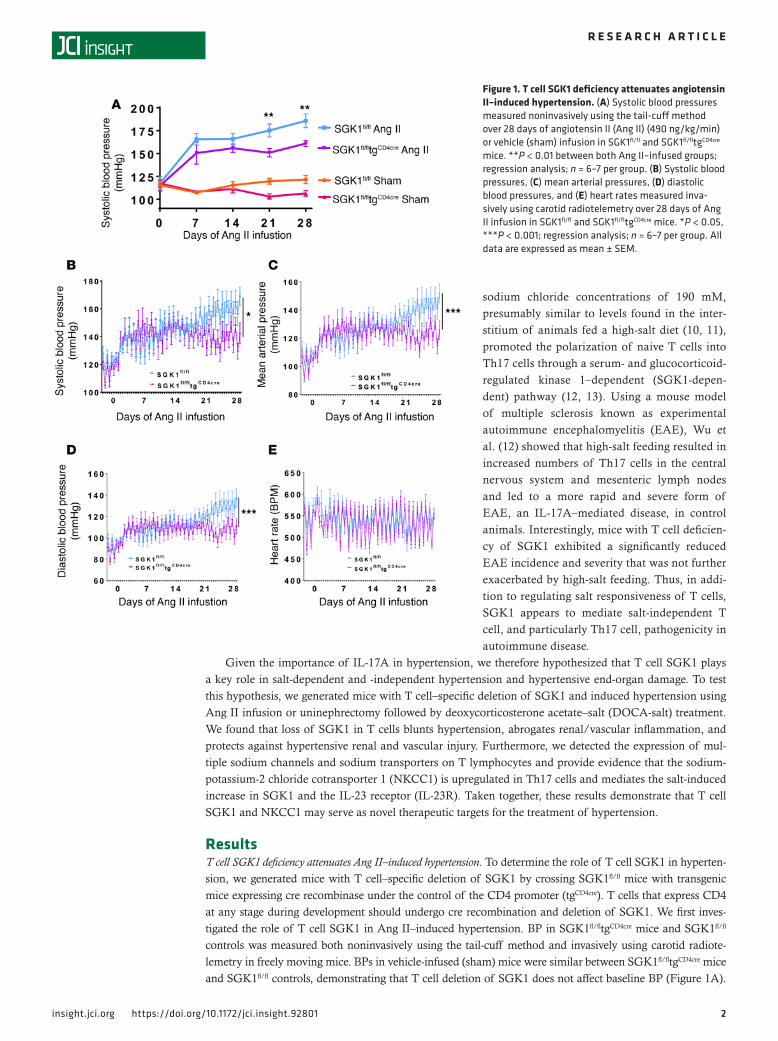
ResultsT cell SGK1 deficiency attenuates Ang II–induced hypertension. To determine the role of T cell SGK1 in hyperten-sion, we generated mice with T cell–specific deletion of SGK1 by crossing SGK1fl/fl mice with transgenic mice expressing cre recombinase under the control of the CD4 promoter (tgCD4cre). T cells that express CD4 at any stage during development should undergo cre recombination and deletion of SGK1. We first inves-tigated the role of T cell SGK1 in Ang II–induced hypertension. BP in SGK1fl/fltgCD4cre mice and SGK1fl/fl controls was measured both noninvasively using the tail-cuff method and invasively using carotid radiote-lemetry in freely moving mice. BPs in vehicle-infused (sham) mice were similar between SGK1fl/fltgCD4cre mice and SGK1fl/fl controls, demonstrating that T cell deletion of SGK1 does not affect baseline BP (Figure 1A).
Figure 1. T cell SGK1 deficiency attenuates angiotensin II–induced hypertension. (A) Systolic blood pressures measured noninvasively using the tail-cuff method over 28 days of angiotensin II (Ang II) (490 ng/kg/min) or vehicle (sham) infusion in SGK1fl/fl and SGK1fl/fltgCD4cre mice. **P < 0.01 between both Ang II–infused groups; regression analysis; n = 6–7 per group. (B) Systolic blood pressures, (C) mean arterial pressures, (D) diastolic blood pressures, and (E) heart rates measured inva-sively using carotid radiotelemetry over 28 days of Ang II infusion in SGK1fl/fl and SGK1fl/fltgCD4cre mice. *P < 0.05, ***P < 0.001; regression analysis; n = 6–7 per group. All data are expressed as mean ± SEM.
3insight.jci.org https://doi.org/10.1172/jci.insight.92801
R E S E A R C H A R T I C L E
However, following infusion of a pressor dose of Ang II (490/ng/kg/min) for 28 days, systolic BP was 25 mmHg lower in the SGK1fl/fltgCD4cre mice compared with the SGK1fl/fl controls, as measured by both tail cuff and telemetry (Figure 1, A and B). Diastolic BPs and mean arterial BPs were similarly reduced in the SGK1fl/fltgCD4cre mice compared with controls, while heart rates were similar between both groups (Figure 1, C–E). As a secondary control, to confirm that cre recombinase expression in T cells is not responsible for the blunted hypertensive phenotype, we measured BP in tgCD4cre mice at baseline and weekly (2 days per week) using carotid radiotelemetry during 28 days of Ang II infusion. The systolic, diastolic, and mean arterial pressures of the tgCD4cre mice increased similarly to those of the SGK1fl/fl controls (Supplemental Figure 1, A–C; supplemental material available online with this article; https://doi.org/10.1172/jci.insight.92801DS1). Heart rate was similar among all 3 groups of mice (Figure 1E and Supplemental Figure 1D).
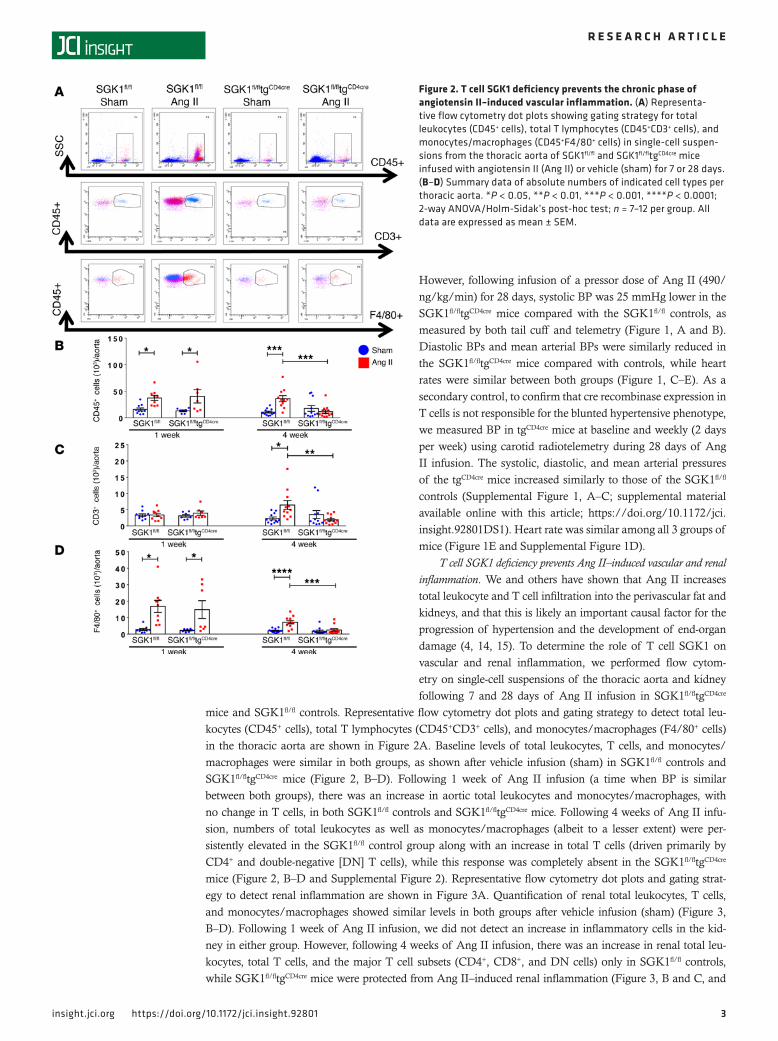
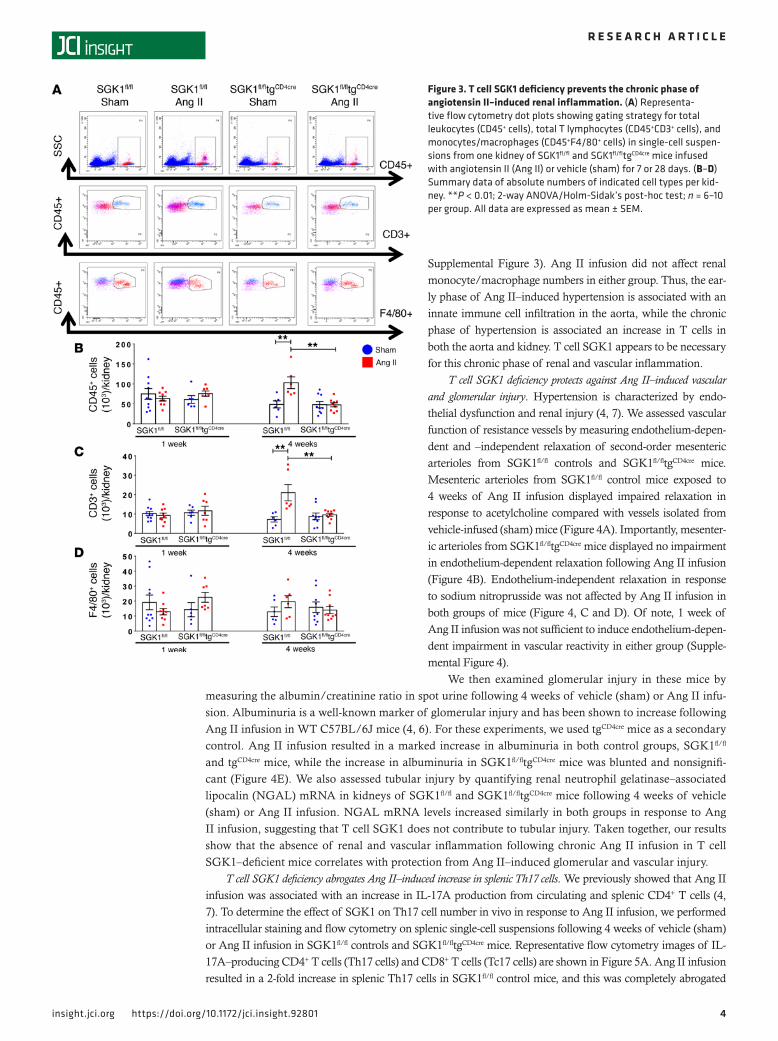
T cell SGK1 deficiency prevents Ang II–induced vascular and renal inflammation. We and others have shown that Ang II increases total leukocyte and T cell infiltration into the perivascular fat and kidneys, and that this is likely an important causal factor for the progression of hypertension and the development of end-organ damage (4, 14, 15). To determine the role of T cell SGK1 on vascular and renal inflammation, we performed flow cytom-etry on single-cell suspensions of the thoracic aorta and kidney following 7 and 28 days of Ang II infusion in SGK1fl/fltgCD4cre
mice and SGK1fl/fl controls. Representative flow cytometry dot plots and gating strategy to detect total leu-kocytes (CD45+ cells), total T lymphocytes (CD45+CD3+ cells), and monocytes/macrophages (F4/80+ cells) in the thoracic aorta are shown in Figure 2A. Baseline levels of total leukocytes, T cells, and monocytes/macrophages were similar in both groups, as shown after vehicle infusion (sham) in SGK1fl/fl controls and SGK1fl/fltgCD4cre mice (Figure 2, B–D). Following 1 week of Ang II infusion (a time when BP is similar between both groups), there was an increase in aortic total leukocytes and monocytes/macrophages, with no change in T cells, in both SGK1fl/fl controls and SGK1fl/fltgCD4cre mice. Following 4 weeks of Ang II infu-sion, numbers of total leukocytes as well as monocytes/macrophages (albeit to a lesser extent) were per-sistently elevated in the SGK1fl/fl control group along with an increase in total T cells (driven primarily by CD4+ and double-negative [DN] T cells), while this response was completely absent in the SGK1fl/fltgCD4cre mice (Figure 2, B–D and Supplemental Figure 2). Representative flow cytometry dot plots and gating strat-egy to detect renal inflammation are shown in Figure 3A. Quantification of renal total leukocytes, T cells, and monocytes/macrophages showed similar levels in both groups after vehicle infusion (sham) (Figure 3, B–D). Following 1 week of Ang II infusion, we did not detect an increase in inflammatory cells in the kid-ney in either group. However, following 4 weeks of Ang II infusion, there was an increase in renal total leu-kocytes, total T cells, and the major T cell subsets (CD4+, CD8+, and DN cells) only in SGK1fl/fl controls, while SGK1fl/fltgCD4cre mice were protected from Ang II–induced renal inflammation (Figure 3, B and C, and
Figure 2. T cell SGK1 deficiency prevents the chronic phase of angiotensin II–induced vascular inflammation. (A) Representa-tive flow cytometry dot plots showing gating strategy for total leukocytes (CD45+ cells), total T lymphocytes (CD45+CD3+ cells), and monocytes/macrophages (CD45+F4/80+ cells) in single-cell suspen-sions from the thoracic aorta of SGK1fl/fl and SGK1fl/fltgCD4cre mice infused with angiotensin II (Ang II) or vehicle (sham) for 7 or 28 days. (B–D) Summary data of absolute numbers of indicated cell types per thoracic aorta. *P < 0.05, **P < 0.01, ***P < 0.001, ****P < 0.0001; 2-way ANOVA/Holm-Sidak’s post-hoc test; n = 7–12 per group. All data are expressed as mean ± SEM.
4insight.jci.org https://doi.org/10.1172/jci.insight.92801
R E S E A R C H A R T I C L E
Supplemental Figure 3). Ang II infusion did not affect renal monocyte/macrophage numbers in either group. Thus, the ear-ly phase of Ang II–induced hypertension is associated with an innate immune cell infiltration in the aorta, while the chronic phase of hypertension is associated an increase in T cells in both the aorta and kidney. T cell SGK1 appears to be necessary for this chronic phase of renal and vascular inflammation.
T cell SGK1 deficiency protects against Ang II–induced vascular and glomerular injury. Hypertension is characterized by endo-thelial dysfunction and renal injury (4, 7). We assessed vascular function of resistance vessels by measuring endothelium-depen-dent and –independent relaxation of second-order mesenteric arterioles from SGK1fl/fl controls and SGK1fl/fltgCD4cre mice. Mesenteric arterioles from SGK1fl/fl control mice exposed to 4 weeks of Ang II infusion displayed impaired relaxation in response to acetylcholine compared with vessels isolated from vehicle-infused (sham) mice (Figure 4A). Importantly, mesenter-ic arterioles from SGK1fl/fltgCD4cre mice displayed no impairment in endothelium-dependent relaxation following Ang II infusion (Figure 4B). Endothelium-independent relaxation in response to sodium nitroprusside was not affected by Ang II infusion in both groups of mice (Figure 4, C and D). Of note, 1 week of Ang II infusion was not sufficient to induce endothelium-depen-dent impairment in vascular reactivity in either group (Supple-mental Figure 4).
We then examined glomerular injury in these mice by measuring the albumin/creatinine ratio in spot urine following 4 weeks of vehicle (sham) or Ang II infu-sion. Albuminuria is a well-known marker of glomerular injury and has been shown to increase following Ang II infusion in WT C57BL/6J mice (4, 6). For these experiments, we used tgCD4cre mice as a secondary control. Ang II infusion resulted in a marked increase in albuminuria in both control groups, SGK1fl/fl and tgCD4cre mice, while the increase in albuminuria in SGK1fl/fltgCD4cre mice was blunted and nonsignifi-cant (Figure 4E). We also assessed tubular injury by quantifying renal neutrophil gelatinase–associated lipocalin (NGAL) mRNA in kidneys of SGK1fl/fl and SGK1fl/fltgCD4cre mice following 4 weeks of vehicle (sham) or Ang II infusion. NGAL mRNA levels increased similarly in both groups in response to Ang II infusion, suggesting that T cell SGK1 does not contribute to tubular injury. Taken together, our results show that the absence of renal and vascular inflammation following chronic Ang II infusion in T cell SGK1–deficient mice correlates with protection from Ang II–induced glomerular and vascular injury.
T cell SGK1 deficiency abrogates Ang II–induced increase in splenic Th17 cells. We previously showed that Ang II infusion was associated with an increase in IL-17A production from circulating and splenic CD4+ T cells (4, 7). To determine the effect of SGK1 on Th17 cell number in vivo in response to Ang II infusion, we performed intracellular staining and flow cytometry on splenic single-cell suspensions following 4 weeks of vehicle (sham) or Ang II infusion in SGK1fl/fl controls and SGK1fl/fltgCD4cre mice. Representative flow cytometry images of IL-17A–producing CD4+ T cells (Th17 cells) and CD8+ T cells (Tc17 cells) are shown in Figure 5A. Ang II infusion resulted in a 2-fold increase in splenic Th17 cells in SGK1fl/fl control mice, and this was completely abrogated
Figure 3. T cell SGK1 deficiency prevents the chronic phase of angiotensin II–induced renal inflammation. (A) Representa-tive flow cytometry dot plots showing gating strategy for total leukocytes (CD45+ cells), total T lymphocytes (CD45+CD3+ cells), and monocytes/macrophages (CD45+F4/80+ cells) in single-cell suspen-sions from one kidney of SGK1fl/fl and SGK1fl/fltgCD4cre mice infused with angiotensin II (Ang II) or vehicle (sham) for 7 or 28 days. (B–D) Summary data of absolute numbers of indicated cell types per kid-ney. **P < 0.01; 2-way ANOVA/Holm-Sidak’s post-hoc test; n = 6–10 per group. All data are expressed as mean ± SEM.

5insight.jci.org https://doi.org/10.1172/jci.insight.92801
R E S E A R C H A R T I C L E
in SGK1fl/fltgCD4cre mice (Figure 5B). Splenic Tc17 cells were not affected by Ang II infusion or loss of T cell SGK1 (Figure 5C). IFN-γ is produced by CD4+ Th1 and CD8+ Tc1 cells and has been shown to play an important role in hypertension (4). By intracellular staining and flow cytometry, we did not detect any differences in splenic Th1 or Tc1 percentages in response to Ang II infusion or loss of T cell SGK1 (Supplemental Figure 5).
T cell SGK1 deficiency attenuates hypertension and vascular inflammation in a DOCA-salt model of hypertension. Since SGK1 has been shown to mediate salt-induced Th17 polarization and maintenance (12, 13), we investigated the role of T cell SGK1 in a DOCA-salt model of hyper-
tension in which uninephrectomy is accompanied by implantation of a DOCA pellet and supplementation of the drinking water with 1% NaCl. The development of hypertension was blunted in the SGK1fl/fltgCD4cre mice, with systolic BPs reaching 15 mmHg lower than SGK1fl/fl controls at days 14 and 21 of DOCA-salt treatment (Figure 6A). DOCA-salt treatment was associated with an increase in total CD45+ leukocytes, total CD3+ T cells, and F4/80+ monocytes/macrophages in the thoracic aorta in SGK1fl/fl control mice, and this was abrogated in SGK1fl/fltgCD4cre mice (Figure 6, B–D). Thus, T cell SGK1 appears to play an important role in both salt-dependent and -independent hypertension.
NKCC1 is upregulated in Th17 cells and mediates the salt-induced increase in SGK1. Previous studies have shown that SGK1 expression is increased in naive CD4+ T cells exposed to Th17-polarizing cytokines and further increased by the addition of an excess 40 mM NaCl in the presence of Th17-polarizing cytokines (12, 13). Furthermore, these authors demonstrated that SGK1 activation in T cells leads to increased tran-scription of the IL-23R through phosphorylation and inhibition of the transcriptional repressor FoxO1. To understand how T cells sense extracellular NaCl, we first isolated pan T cells from spleens of WT mice and performed reverse transcription PCR (RT-PCR) for a panel of sodium channels and transporters. We were able to detect expression of all the channels and transporters listed in Supplemental Table 1. Of note, NKCC2, a kidney-specific isoform of NKCC, was not detected in T cells.
To determine which of these channels/transporters might mediate the salt effect on T cells, we tested various pharmacological inhibitors of sodium transporters as well as an antagonist of the mineralocorti-coid receptor (which has been previously shown to regulate the Th17 response to DOCA-salt treatment in rats; see ref. 16). Naive splenic CD4+ T cells were cultured with Th17-polarizing cytokines or Th17-polarizing cytokines plus an extra 40 mM NaCl along with hydrochlorothiazide (inhibits the sodium
Figure 4. T cell SGK1 deficiency protects against angiotensin II–induced vascular and glomeru-lar injury. SGK1fl/fl controls, tgCD4cre controls, and SGK1fl/fltgCD4cre mice were infused with angiotensin II (Ang II) or vehicle (sham) for 28 days. Endothe-lium-dependent relaxation in response to increas-ing doses of acetylcholine (Ach) was measured in (A) SGK1fl/fl mice and (B) SGK1fl/fltgCD4cre mice, and endothelium-independent relaxation in response to increasing doses of sodium nitroprusside (SNP) was measured in (C) SGK1fl/fl mice and (D) SGK1fl/fltgCD4cre mice. ***P < 0.01; regression analysis; n = 4–6 per group. (E) Urinary albumin to creatinine ratio in the indicated groups. *P < 0.05, **P < 0.01, ***P < 0.001; 1-way ANOVA/Holm-Sidak’s post-hoc test; n = 8–14 per group. (F) Relative renal NGAL mRNA expression in the indicated groups. **P < 0.01; 2-way ANOVA/Holm-Sidak’s post-hoc test; n = 10 per group. All data are expressed as mean ± SEM. n.s., not significant.

6insight.jci.org https://doi.org/10.1172/jci.insight.92801
R E S E A R C H A R T I C L E
chloride cotransporter [NCC]), spironolactone (inhibits the mineralocorticoid receptor), furosemide (inhibits NKCC1), or bumetanide (inhibits NKCC1). SGK1 and IL-23R expression was measured by quantitative RT-PCR (qRT-PCR). Interestingly, treatment with either furosemide or bumetanide abrogated the salt-induced increase in T cell SGK1 and IL-23R expression, sug-gesting that NKCC1 plays a critical role in the ability of T cells to sense salt, while the other agents had no effect (Figure 7, A–H). We then quantified NKCC1 expression by qRT-PCR in naive splenic CD4+ T cells that were untreated or treated with Th17-polarizing cytokines ± salt. NKCC1 was significantly upregulated in CD4+ T cells cultured under Th17-polarizing conditions (Fig-ure 7I). Taken together, these results show that NKCC1 appears to be induced in Th17 cells and mediates the salt-induced increase in T cell SGK1 expression.
DiscussionHypertension is a major health concern worldwide, and its prevalence has been compounded by the high salt content of modern processed foods. Among patients with hypertension who report taking prescribed medica-tions, only two-thirds have their BP under control (1). Moreover, even in patients with reasonable BP control, hypertension is associated with an elevated risk of cardiovascular events (17, 18), presumably due to an unad-dressed inflammatory process. But how do salt and inflammation converge to cause hypertension and end-organ damage? Here we show that the salt-sensing kinase, SGK1, in T lymphocytes is critical to the development of hypertension in response to 2 different hypertensive stimuli — Ang II infusion and DOCA-salt treatment. Fur-thermore, we show that NKCC1 is upregulated in Th17 cells and mediates the T cell response to salt. While loss of T cell SGK1 resulted in a significant reduction in the BP response to both stimuli, it should be noted that BP was still elevated above normal in both models. However, despite this persistent mild elevation in BP, it is remark-able that vascular and renal inflammation and vascular and renal injury were virtually completely abolished by the loss of SGK1 in T cells. This highlights the need to possibly redefine treatment goals in hypertension to focus on reducing the inflammatory substrate that leads to end-organ damage rather than just focusing on the BP itself.
SGK1 is well known for its role in modulating sodium transport in renal epithelial cells of the distal convoluted tubule through upregulation of the epithelial sodium channel (ENaC) and NCC (19). Recently, Wu et al. and Kleinewietfeld et al. described a novel role for SGK1 in the stability and maintenance of Th17 cells by phosphorylation and inactivation of FoxO1, a direct repressor of the IL-23R. IL-23 signal-ing in Th17 cells maintains the Th17 cell phenotype (12, 13). Hernandez et al. and Safa et al. subsequently showed that SGK1 inhibits T regulatory (Treg) cells at least in part by phosphorylating and inhibiting both FoxO1 and FoxO3, which are important in regulating Foxp3 expression. Foxp3 is the signature transcrip-tion factor required for Treg function (20, 21). Treg cells have been shown to suppress Ang II–induced hypertension and vascular injury (22). Thus, the mechanism by which loss of T cell SGK1 protects against hypertension and end-organ damage may be through a shift in the Th17/Treg balance. Indeed, we observed a reduction in percentage of Th17 cells in the spleen following Ang II infusion in our T cell SGK1–deficient mice compared with SGK1fl/fl controls (Figure 5B).
Figure 5. T cell SGK1 deficiency abrogates angiotensin II–induced increase in splenic Th17 cells. (A) Representative flow cytometry dot plots for CD4+IL-17A+ Th17 cells and CD8+IL-17A+ Tc17 cells in splenic single-cell suspensions from SGK1fl/fl and SGK1fl/fltgCD4cre mice infused with angiotensin II (Ang II) or vehi-cle (sham) for 28 days. (B and C) Summary data of percentages of CD4+IL-17A+ Th17 cells out of total CD4+ cells and CD8+IL-17A+ Tc17 out of total CD8+ cells in the indicated groups. *P < 0.05; 1-way ANOVA/Holm-Sidak’s post-hoc test; n = 8–12 per group. All data are expressed as mean ± SEM.

7insight.jci.org https://doi.org/10.1172/jci.insight.92801
R E S E A R C H A R T I C L E
Salt has also recently been shown to influence antigen-presenting cells such as macrophages. Salt boosts the activation of classical, lipopolysaccharide-induced M1 macrophages and blunts the activation of alternative M2 macrophages (23, 24). Zhang et al. described a specific activation state of macrophages induced by high salt, which they termed M(Na). This state is characterized by enhanced expression of pro-inflammatory genes and suppressed expression of antiinflammatory genes (25). Kirabo et al. demonstrated that dendritic cells activate T cells in hypertension through presentation of isoketal-modified peptides (26). Of note, the cytokines released by these activated dendritic cells are Th17-polarizing cytokines (IL-6, IL-1β, and IL-23). Thus, in addition to a direct effect of salt on T cells, salt-induced activation of T cells in vivo could be potentiated through enhanced activation of antigen-presenting cells. Nevertheless, our results demonstrate that deleting SGK1 in T cells alone is sufficient to protect against hypertension and more importantly, against the renal and vascular damage that accompanies hypertension.
An important result of our study is that loss of T cell SGK1 was protective in a salt-independent Ang II model of hypertension. There are at least 2 possible explanations for this. First, Ang II would be predicted to increase aldosterone, which would then lead to sodium and water retention in the kidney. Indeed, we have shown that animals retain sodium and water after Ang II infusion (27). Recent work by Titze and colleagues has challenged conventional paradigms of salt homeostasis by demonstrating that animals and humans can store sodium in their skin, muscle, and lymphatics at concentrations exceeding that of plasma without a commensurate increase in water (28). Thus, Ang II infusion may be associated with increased tissue levels of sodium. Alternatively, Ang II may directly or indirectly increase T cell SGK1 expression or function. We did not detect an increase in T cell SGK1 expression when we added Ang II to our T cell culture media (data not shown). However, this does not exclude an effect of Ang II on T cell SGK1 expression or function in vivo. Of note, Ang II has been shown to increase SGK1 expression and phosphorylation in other cell types (29, 30). Moreover, other signals associated with hypertension such as endothelin, glucocorticoids, oxidative stress, and certain cytokines have been shown to activate SGK1 transcription in various contexts (31). Thus, T cell SGK1 may be a final common pathway by which multiple stimuli cause T cell activation in hypertension.
Figure 6. T cell SGK1 deficiency attenuates hypertension and vascular inflammation in a DOCA-salt model of hypertension. (A) Systolic blood pres-sures measured noninvasively using the tail-cuff method in SGK1fl/fl and SGK1fl/fltgCD4cre mice in response to deoxycorticosterone acetate–salt (DOCA-salt) treatment over 21 days. *P < 0.05, **P < 0.01; regression analysis; n = 8–10 per group. (B–F) Summary flow cytometry data of absolute numbers of total leukocytes (CD45+ cells), total T lymphocytes (CD45+CD3+ cells), and monocytes/macrophages (CD45+F4/80+ cells) per thoracic aorta in SGK1fl/fl and SGK1fl/fltgCD4cre mice after 21 days of DOCA-salt or vehicle (sham) treatment. *P < 0.05, **P < 0.01; 2-way ANOVA/Holm-Sidak’s post-hoc test; n = 8–14 per group. All data are expressed as mean ± SEM.

8insight.jci.org https://doi.org/10.1172/jci.insight.92801
R E S E A R C H A R T I C L E
Interestingly, in the Ang II–induced hypertension model, the BP protection conferred by T cell SGK1 deficiency was not seen until after 14 days of Ang II infusion. Of note, we have seen a similar pattern in mice with IL-17A deficiency (7). Characterization of the inflammatory cells in the aorta following 1 week and 4 weeks of Ang II infusion revealed an early increase in innate immune cells in both groups. Mice lack-ing T cell SGK1 resolved this acute innate immune response and did not develop a chronic, sustained adap-tive immune response to Ang II infusion (Figure 2 and Supplemental Figure 2). Furthermore, impairment in endothelium-dependent relaxation was not seen in either group after 1 week of Ang II infusion but was present in the SGK1fl/fl control mice by 4 weeks (Figure 4 and Supplemental Figure 4). Thus, the vascular dysfunction that occurs in the setting of Ang II infusion seems to correlate with timing of T cell infiltration.
Figure 7. NKCC1 is upregulated in Th17 cells and mediates the salt-induced increase in SGK1 and IL-23R. (A) Naive splenic CD4+ T cells were isolated from C57BL/6J WT mice and cultured for 72 hours on anti-CD3/anti-CD28–coated plates in the presence or absence of Th17-polarizing cytokines (Cytokines), an excess 40 mM NaCl (Salt), and cotreated with hydrochlorothiazide (HCTZ; A and E), spironolactone (B and F), furosemide (C and G), bumetanide (D and H), or corresponding vehicle (DMSO or ethanol). SGK1 expression (A–D) or IL-23 receptor (IL-23R) expres-sion (E–H) was quantified by qRT-PCR and expressed as fold change relative to untreated cells (A–D) or relative to Cytokine-treated cells (E–H). (I) Naive splenic CD4+ T cells from WT mice were cultured as described above and sodium-potassium-2 chloride cotransporter 1 (NKCC1) expression was quantified by qRT-PCR and expressed as fold change relative to untreated cells. *P < 0.05, **P < 0.01, ***P < 0.001; ratio-paired t test was per-formed between the indicated groups with Bonferroni correction; n = 5–9 per group. NS, not significant.

9insight.jci.org https://doi.org/10.1172/jci.insight.92801
R E S E A R C H A R T I C L E
Finally, renal inflammatory cells did not increase in either group after 1 week of Ang II infusion. However, following 4 weeks of Ang II infusion, there was an increase in T cells in the SGK1fl/fl control mice that did not develop in mice lacking SGK1 (Figure 3 and Supplemental Figure 3).
The mechanism by which T cell SGK1 deficiency inhibits T cell accumulation in the aorta and kidney is unclear. One possibility is that SGK1 affects chemokine receptors on T cells. However, we performed qRT-PCR screening for the chemokine receptors CCR1, CCR2, CCR5, CXCR2, and CXCR6 on T cells from SGK1fl/fl controls and SGK1fl/fltgCD4cre mice following Ang II infusion and did not detect any major differences in chemokine receptor expression (data not shown). We and others have shown that IL-17A can induce chemokine expression in mouse mesangial cells and human aortic smooth muscle cells (7, 32). These chemokines are involved in the recruitment of T cells and monocytes. Thus, loss of T cell SGK1 may be associated with reduced chemokine expression and thus attenuated inflammatory cell recruitment into these tissues. Another intriguing possibility is that SGK1 is involved in T cell migration. Using furosemide and bumetanide, we showed that ion transport through NKCC1 mediates SGK1 and IL-23R upregulation in high-salt conditions. Kochl et al. recently demonstrated that With No Lysine 1 (WNK1) kinase regulates T cell migration through an NKCC1-dependent pathway (33). The authors showed that NKCC1 deficiency or treatment with bumetanide reduced CCL21-induced migration of CD4+ T cells. Further studies are needed to determine whether NKCC1-mediated T cell migration may involve signaling through SGK1.
The finding that furosemide and bumetanide inhibit salt-induced T cell SGK1 and IL-23R expression suggests that these commonly used diuretics may actually have a previously unrecognized antiinflamma-tory effect. It is interesting to speculate that these drugs not only help to excrete sodium, but that they may also block the effect of dietary salt on T cells. Future studies are needed to determine the role of T cell NKCC1 in BP regulation and whether blocking NKCC1 specifically in T lymphocytes would have a benefi-cial effect on hypertension and hypertensive end-organ damage.
One limitation of this study is that we deleted SGK1 primarily in CD4+ and CD8+ T cells and only a subset of γδ T cells. We previously showed that γδ T cells are a major source of IL-17A in the kidney and vasculature in Ang II–induced hypertension (8). The role of SGK1 and/or salt on γδ T cell function is unknown. Nevertheless, we did see a major effect on hypertension and renal/vascular inflammation in our model, suggesting that loss of SGK1 in primarily CD4+ and CD8+ T cells is sufficient to confer protection from hypertensive stimuli. Another limitation is that it is unclear how the excess salt concentrations that we and others have used in vitro correlates with tissue sodium concentrations in vivo in hypertensive animals and humans. It is difficult to quantify tissue sodium in animals, although one study by Wiig et al. using energy-dispersive X-ray spectrometry/scanning electron microscopy (EDX-SEM) demonstrated that sodi-um concentrations in the lymph capillaries of DOCA-salt–treated rats reached levels comparable to what we used in cell culture (11). In humans, 23Na magnetic resonance imaging has demonstrated an increase in skin and muscle sodium with aging and hypertension, but due to the methodology used to quantify tissue sodium, a direct correlation with cell culture sodium concentrations is not possible (11).
In conclusion, we have demonstrated that the salt-sensing kinase SGK1 in T lymphocytes plays a criti-cal role in regulating BP and more importantly, renal and vascular inflammation and injury in experimental models of hypertension. Moreover, NKCC1 in T cells may play an important role in how T cells sense and respond to elevated sodium chloride in the extracellular environment. Future studies into how much and where we store sodium and how other signals in addition to sodium activate T cell SGK1 will lead to a deeper understanding of the interplay between salt, inflammation, and hypertension and lead to novel therapeutic targets for this widespread disease.
MethodsStudy design. The goals of the current study were to determine the role of T cell SGK1 in salt-dependent and -independent hypertension in experimental animal models and elucidate how T cells sense excess sodium chloride in the extracellular environment. Mice containing homozygous floxed SGK1 alleles (SGK1fl/fl) were crossed with transgenic mice expressing cre recombinase under the control of the CD4 promoter (tgCD4Cre) to generate mice in which SGK1 would be genetically deleted from all cells that express CD4 at any time during development (SGK1fl/fltgCD4cre). CD8+ T cells and a subset of γδ T cells undergo transient CD4 expres-sion in the thymus during development (34, 35). We verified that SGK1 expression was indeed abolished in CD4+ and CD8+ T cells and reduced in γδ T cells isolated from the spleen by T cell isolation and culture followed by qRT-PCR (Supplemental Figure 6, A–C). We further confirmed specificity of SGK1 deletion by

1 0insight.jci.org https://doi.org/10.1172/jci.insight.92801
R E S E A R C H A R T I C L E
extracting RNA from T and non-T peripheral blood mononuclear cells (PBMCs) and demonstrating that the SGK1 expression was unchanged in non–T cells but virtually abolished in T cells from SGK1fl/fltgCD4cre mice compared with SGK1fl/fl controls (Supplemental Figure 6, D and E). Age-matched SGK1fl/fl mice were used as controls in all experiments. For some experiments, tgCD4Cre mice were used as a secondary control. Hyper-tension was induced by Ang II infusion for 1 or 4 weeks (salt-independent hypertension) or by uninephrec-tomy followed by DOCA-salt treatment for 3 weeks (salt-dependent hypertension) as described below. Sample numbers for each experiment are detailed in the figure legends.
Animals and BP measurement. C57BL/6J WT mice and tgCD4cre mice were purchased from Jackson Labo-ratories. SGK1fl/fl mice were obtained as a gift from Aniko Naray-Fejes-Toth (Dartmouth College, Hanover, New Hampshire, USA) and were generated as previously described (36). Male mice approximately 10–12 weeks of age were used. Mice were anesthetized with ketamine/xylazine (90–120 mg/kg + 10 mg/kg; 1:1 volume ratio) and 4-week osmotic minipumps (Alzet, DURECT Corporation, model 2004) containing Ang II (490 ng/kg/min) or vehicle (0.08 M sodium chloride/1% acetic acid solution) were inserted sub-cutaneously. Mice were euthanized after either 1 or 4 weeks. For the DOCA-salt hypertension model, the left kidney was surgically removed, a DOCA pellet (100 mg) was inserted subcutaneously, and the drinking water was supplemented with 1% NaCl for 21 days. Control (sham) mice underwent a similar surgical inci-sion but without nephrectomy and received a placebo pellet. Sham mice received regular drinking water with no NaCl supplementation. BP was measured noninvasively using tail cuff or invasively using carotid radiotelemetry as previously described (7). Following telemetry implantation, mice were allowed to recover for 10 days prior to implantation of osmotic minipumps. At the end of all experiments, mice were sacri-ficed using CO2 inhalation.
Flow cytometry of renal and aortic leukocytes. Single-cell suspensions of one kidney or the thoracic aorta with surrounding perivascular fat were prepared as previously described (4). Tissue homogenates were fil-tered through a 40-μm cell strainer after digestion. Single-cell suspensions were stained for flow cytometry using the following antibodies/stain: Pacific LIVE/DEAD Fixable Violet Dead Cell Stain (Life Technolo-gies), brilliant violet-510–conjugated (BV510) anti-CD45 antibody (BioLegend, clone 30-F11), peridinin chlorophyll protein-cyanin-5.5–conjugated (PerCP-Cy5.5) anti-CD3 antibody (BioLegend, clone 17A2), phycoerythrin-cyanin-7–conjugated (PE-Cy7) anti-CD8 antibody (BioLegend, clone 53-6.7), allophycocy-anin-Hilite-7–conjugated (APC-H7) anti-CD4 antibody (BD Biosciences, clone GK1.5), and Alexa Fluor 488–conjugated anti-F4/80 antibody (BioLegend, clone BM8). A known quantity of calibration (counting) beads (123count eBeads, eBioscience) was added to each sample prior to analysis. Samples were run on a BD FACSCanto II system and analyzed using BD FACSDiva software (BD Biosciences). Gates were set using fluorescence minus one (FMO) controls. Results were normalized using the bead count and expressed as number of cells per kidney or per thoracic aorta.
Intracellular staining for cytokine-producing lymphocytes from spleen. Spleens were ground and filtered through a 40-μm cell strainer and then subjected to RBC lysis using RBC lysis buffer (eBioscience). Approx-imately 3 × 10⁶ cells were resuspended in RPMI medium containing 5% FBS and subsequently stimulated with 4 μl of Cell Activation Cocktail containing PMA, ionomycin, and the Golgi inhibitor brefeldin A (BioLegend) at 37°C for 3 hours. Cells were then washed and stained first with LIVE/DEAD Fixable Violet dead cell stain (Life Technologies). The following surface antibodies were then added to the cells for 30 minutes: PerCP-Cy5.5–conjugated anti-CD3 antibody (BioLegend, clone 17A2), BV510-conjugated anti-CD8 antibody (BioLegend, clone 53-6.7), and APC-H7–conjugated anti-CD4 antibody (BD Biosci-ences, clone GK1.5). Intracellular staining was then performed using the BD Transcription Factor Buf-fer set according to the manufacturer’s instructions (BD Biosciences). Antibodies used for intracellular staining were Alexa Fluor 488–conjugated anti–IFN-γ antibody (BD Biosciences, clone XMG1.2) and PE-conjugated anti–IL-17A antibody (Biolegend, clone TC11-18H10.1). Results are expressed as percentage of cytokine-positive cells relative to total CD4+ or CD8+ cells.
Measurements of vascular reactivity. Isometric tension studies of mesenteric arterioles were performed using 2-mm segments of second-order mouse mesenteric arterioles dissected free of perivascular fat. Studies were performed in a small vessel horizontal wire myograph (Danish Myo Technology, models 610M and 620M) containing a physiological salt solution composed of 130 mM NaCl, 4.7 mM KCl, 1.2 mM MgSO4, 1.2 mM KH2PO4, 25 mM NaHCO3, 5 mM glucose, and 1.6 mM CaCl2. The isometric tone was recorded for each vessel using LabChart Pro v7.3.7 (AD Instruments). The vessels were equilibrated over a 20-minute period at 37°C. A passive circumference-tension curve was generated for each vessel to

1 1insight.jci.org https://doi.org/10.1172/jci.insight.92801
R E S E A R C H A R T I C L E
determine optimum passive tension to simulate an in vivo transmural pressure of 100 mmHg according to the manufacturer’s protocol, as previously described with modifications (37). After normalization, vessels were contracted with 60 mM KCl to assess the integrity of the vessel, and then endothelium-dependent and -independent vascular relaxations were tested using increasing concentrations of acetyl-choline or sodium nitroprusside, respectively, after preconstriction with norepinephrine (10 μM).
Measurements of urinary excretion of albumin and creatinine. Albumin and creatinine concentrations were measured from a spot urine sample (obtained after 4 weeks of Ang II infusion) using ELISA kits from Exocell. Albumin concentration was divided by creatinine concentration in each sample to determine the albumin/creatinine ratio.
Splenic T cell isolation and culture. Spleens were isolated from mice and single-cell suspensions were pre-pared as described above. CD4+ and CD8+ naive T cells, γδ T cells, or CD3+ pan T cells were isolated using Miltenyi cell separation kits according to the manufacturer’s instructions and an AutoMACS magnetic cell sorter (Miltenyi Biotec). Cells were plated in RPMI 1640 media containing 10% FBS, 1% penicillin/streptomycin, and 50 μM β-mercaptoethanol at a density of 200,000 cells/well in a 96-well plate that was precoated with no-azide/low-endotoxin anti-CD3 (2 μg/ml) and anti-CD28 (2 μg/ml) (BD Biosciences). To induce Th17 polarization, cells were treated with 20 ng/ml IL-6, 5 ng/ml TGF-β1, 10 ng/ml IL-1β, and 10 ng/ml of IL-23 for 72 hours at 37°C. These cytokines were purchased from R&D Systems. To determine the effect of NaCl on IL-17A and SGK1 expression, some samples received an additional 40 mM NaCl in addition to the Th17-polarizing cytokines described above. For the pharmacological inhibitor studies, cells were pretreated for 30 minutes with 100 μM hydrochlorothiazide, 5 μM spironolactone, 100 μM furosemide, 100 μM bumetanide, or the corresponding vehicle (ethanol or DMSO). These drugs were purchased from Sigma-Aldrich. After 30 minutes, cells were treated with Th17-polarizing cytokines with or without an extra 40 mM NaCl as indicated. In these studies, cells were retreated with the appropriate inhibitors or vehicle after 48 hours and then harvested after an additional 24 hours for a total of 72 hours of incubation at 37°C.
Peripheral blood T and non–T cell isolation. Blood was isolated from the hearts of euthanized mice using heparinized syringes. RBCs were lysed using RBC lysis buffer (eBioscience). CD3+ T cells were positively selected using a Miltenyi cell separation kit according to the manufacturer’s instructions and an AutoMACS magnetic cell sorter. The negative fraction containing all other PBMCs was also obtained. Cells were spun down, and RNA was isolated from the cell pellets as described below.
RNA isolation and qRT-PCR. Whole kidneys were homogenized in TRIzol using Lysing Matrix D tubes (MP Biomedicals) and a MiniBeadBeater homogenizer (BioSpec). Lysates were then subjected to phenol-chloroform extraction. RNA was subsequently isolated from the aqueous phase using an RNeasy mini kit (Qiagen) accord-ing to the manufacturer’s instructions. RNA was also isolated from T cells and PBMCs using an RNeasy mini kit (Qiagen). Total RNA was quantified using a DS-11 Spectrophotometer (DeNovix). cDNA was made using a High-Capacity cDNA Reverse Transcription kit (Applied Biosystems) according to the manufacturer’s instruc-tions. A Taqman assay system and probes (Thermo Fisher Scientific) were used to detect NGAL, SGK1, IL-23R, NKCC1, αENaC, βENaC, γENaC, NCC, NCX1, NCX2, NHE1, NHE6, and SCN5A. A Taqman assay system and probe for GAPDH (Thermo Fisher Scientific) was used as an endogenous control. Gene expression values were calculated based on the comparative Ct method normalized to GAPDH and displayed as either rela-tive quantification (with one of the control samples set to ‘1’) or fold change with every control sample set to ‘1’.
Statistics. Data are expressed as mean ± SEM. BP and vascular reactivity data were analyzed using linear regression with robust standard errors and consideration of clusters of mice. Time or dose was modeled using restricted cubic spline nonlinearly in the model. In addition to the time (or dose) and group identity variable, the interaction between them was included in the model. The P value for the interaction is reported. All other analyses were performed in GraphPad Prism using 2-way ANOVA, 1-way ANOVA, ratio-paired t test, or Student’s t test with Holm-Sidak’s post-hoc test or Bonferroni cor-rection as specified in the figure legends. P values less than or equal to 0.05 were considered significant.
Study approval. All animal procedures were approved by the Vanderbilt University IACUC.
Author contributionsAEN, MAS, and MSM designed the study. AEN, MAS, AKP, HAI, JW, LX, JK, BLD, SBG, and FL con-ducted the experiments. AEN, MAS, AKP, JK, SBG, LD, and MSM analyzed the data. LD was the con-sulting statistician. AEN, MAS, DGH, and MSM obtained funding. AEN and MSM wrote the manuscript. JW, DGH, and MSM reviewed the manuscript.
1 2insight.jci.org https://doi.org/10.1172/jci.insight.92801
R E S E A R C H A R T I C L E
AcknowledgmentsWe thank Aniko Naray-Fejes-Toth (Dartmouth College) for providing the SGK1-floxed mice. This work was supported by a T32 training grant from the NIH (HL069765-11A1) and an NIH NRSA F31 award (HL127986) to AEN, an American Heart Association (AHA) Post-doctoral Fellowship award (14POST20420025) to MAS, an AHA Strategically Focused Prevention Research Network award to DGH and MSM, an NIH NHLBI K08 award (HL121671), a Gilead Cardiovascular Scholars Grant, and an NIH DP2 award (HL137166) to MSM.
Address correspondence to: Meena S. Madhur, 2215 Garland Avenue, P415D Medical Research Building IV, Nashville, Tennessee 37232-6601, USA. Phone: 615.875.3273; Email: [email protected].
JW’s current address is: Department of Pharmacology, The University of Iowa Carver College of Medi-cine, Iowa City, Iowa, USA.
1. Nwankwo T, Yoon SS, Burt V, Gu Q. 2013. Hypertension Among Adults in the United States: National Health and Nutrition Examination Survey, 2011-2012. NCHS Data Brief. 2013;(133):1–8.
2. Bromfield S, Muntner P. High blood pressure: the leading global burden of disease risk factor and the need for worldwide pre-vention programs. Curr Hypertens Rep. 2013;15(3):134–136.
3. McMaster WG, Kirabo A, Madhur MS, Harrison DG. Inflammation, immunity, and hypertensive end-organ damage. Circ Res. 2015;116(6):1022–1033.
4. Saleh MA, et al. Lymphocyte adaptor protein LNK deficiency exacerbates hypertension and end-organ inflammation. J Clin Invest. 2015;125(3):1189–1202.
5. Kamat NV, et al. Renal transporter activation during angiotensin-II hypertension is blunted in interferon-γ-/- and interleukin-17A-/- mice. Hypertension. 2015;65(3):569–576.
6. Norlander AE, et al. Interleukin-17A Regulates renal sodium transporters and renal injury in angiotensin II-induced hyperten-sion. Hypertension. 2016;68(1):167–174.
7. Madhur MS, et al. Interleukin 17 promotes angiotensin II-induced hypertension and vascular dysfunction. Hypertension. 2010;55(2):500–507.
8. Saleh MA, Norlander AE, Madhur MS. Inhibition of interleukin 17-A but not interleukin-17F signaling lowers blood pressure and reduces end-organ inflammation in angiotensin II-induced hypertension. JACC Basic Transl Sci. 2016;1(7):606–616.
9. Lev-Ran A, Porta M. Salt and hypertension: a phylogenetic perspective. Diabetes Metab Res Rev. 2005;21(2):118–131. 10. Machnik A, et al. Macrophages regulate salt-dependent volume and blood pressure by a vascular endothelial growth factor-C-
dependent buffering mechanism. Nat Med. 2009;15(5):545–552. 11. Wiig H, et al. Immune cells control skin lymphatic electrolyte homeostasis and blood pressure. J Clin Invest. 2013;123(7):2803–2815. 12. Wu C, et al. Induction of pathogenic TH17 cells by inducible salt-sensing kinase SGK1. Nature. 2013;496(7446):513–517. 13. Kleinewietfeld M, et al. Sodium chloride drives autoimmune disease by the induction of pathogenic TH17 cells. Nature.
2013;496(7446):518–522. 14. Guzik TJ, et al. Role of the T cell in the genesis of angiotensin II induced hypertension and vascular dysfunction. J Exp Med.
2007;204(10):2449–2460. 15. Mikolajczyk TP, et al. Role of chemokine RANTES in the regulation of perivascular inflammation, T-cell accumulation, and
vascular dysfunction in hypertension. FASEB J. 2016;30(5):1987–1999. 16. Amador CA, et al. Spironolactone decreases DOCA-salt-induced organ damage by blocking the activation of T helper 17 and
the downregulation of regulatory T lymphocytes. Hypertension. 2014;63(4):797–803. 17. Blacher J, et al. Residual cardiovascular risk in treated hypertension and hyperlipidaemia: the PRIME Study. J Hum Hypertens.
2010;24(1):19–26. 18. Struthers AD. A new approach to residual risk in treated hypertension--3P screening. Hypertension. 2013;62(2):236–239. 19. Ellison DH. Ubiquitylation and the pathogenesis of hypertension. J Clin Invest. 2013;123(2):546–548. 20. Safa K, et al. Salt accelerates allograft rejection through serum- and glucocorticoid-regulated kinase-1-dependent inhibition of
regulatory T cells. J Am Soc Nephrol. 2015;26(10):2341–2347. 21. Hernandez AL, et al. Sodium chloride inhibits the suppressive function of FOXP3+ regulatory T cells. J Clin Invest.
2015;125(11):4212–4222. 22. Barhoumi T, et al. T regulatory lymphocytes prevent angiotensin II-induced hypertension and vascular injury. Hypertension.
2011;57(3):469–476. 23. Jantsch J, et al. Cutaneous Na+ storage strengthens the antimicrobial barrier function of the skin and boosts macrophage-driven
host defense. Cell Metab. 2015;21(3):493–501. 24. Binger KJ, et al. High salt reduces the activation of IL-4- and IL-13-stimulated macrophages. J Clin Invest. 2015;125(11):4223–4238. 25. Zhang WC, et al. High salt primes a specific activation state of macrophages, M(Na). Cell Res. 2015;25(8):893–910. 26. Kirabo A, et al. DC isoketal-modified proteins activate T cells and promote hypertension. J Clin Invest. 2014;124(10):4642–4656. 27. Trott DW, et al. Oligoclonal CD8+ T cells play a critical role in the development of hypertension. Hypertension. 2014;64(5):1108–1115. 28. Titze J. Sodium balance is not just a renal affair. Curr Opin Nephrol Hypertens. 2014;23(2):101–105. 29. Stevens VA, Saad S, Poronnik P, Fenton-Lee CA, Polhill TS, Pollock CA. The role of SGK-1 in angiotensin II-mediated sodium
reabsorption in human proximal tubular cells. Nephrol Dial Transplant. 2008;23(6):1834–1843. 30. Baskin R, Sayeski PP. Angiotensin II mediates cell survival through upregulation and activation of the serum and glucocorticoid

1 3insight.jci.org https://doi.org/10.1172/jci.insight.92801
R E S E A R C H A R T I C L E
inducible kinase 1. Cell Signal. 2012;24(2):435–442. 31. Lang F, Artunc F, Vallon V. The physiological impact of the serum and glucocorticoid-inducible kinase SGK1. Curr Opin
Nephrol Hypertens. 2009;18(5):439–448. 32. Paust HJ, et al. The IL-23/Th17 axis contributes to renal injury in experimental glomerulonephritis. J Am Soc Nephrol.
2009;20(5):969–979. 33. Köchl R, et al. WNK1 kinase balances T cell adhesion versus migration in vivo. Nat Immunol. 2016;17(9):1075–1083. 34. Vantourout P, Hayday A. Six-of-the-best: unique contributions of γδ T cells to immunology. Nat Rev Immunol. 2013;13(2):88–100. 35. Fisher AG, Ceredig R. Gamma delta T cells expressing CD8 or CD4low appear early in murine foetal thymus development. Int
Immunol. 1991;3(12):1323–1328. 36. Fejes-Tóth G, Frindt G, Náray-Fejes-Tóth A, Palmer LG. Epithelial Na+ channel activation and processing in mice lacking
SGK1. Am J Physiol Renal Physiol. 2008;294(6):F1298–F1305. 37. Bridges LE, Williams CL, Pointer MA, Awumey EM. Mesenteric artery contraction and relaxation studies using automated
wire myography. J Vis Exp. 2011;(55):3119.