DRIVERS OF ECONOMIC GROWTH IN DEVELOPING COUNTRIES
12
Eastern Illinois University e Keep Faculty Research and Creative Activity Economics January 2014 DRIVERS OF ECONOMIC GROWTH IN DEVELOPING COUNTRIES Minh Dao Eastern Illinois University, [email protected] Follow this and additional works at: hp://thekeep.eiu.edu/economics_fac Part of the Economics Commons is Article is brought to you for free and open access by the Economics at e Keep. It has been accepted for inclusion in Faculty Research and Creative Activity by an authorized administrator of e Keep. For more information, please contact [email protected]. Recommended Citation Dao, Minh, "DRIVERS OF ECONOMIC GROWTH IN DEVELOPING COUNTRIES" (2014). Faculty Research and Creative Activity. 10. hp://thekeep.eiu.edu/economics_fac/10
Transcript of DRIVERS OF ECONOMIC GROWTH IN DEVELOPING COUNTRIES

Eastern Illinois UniversityThe Keep
Faculty Research and Creative Activity Economics
January 2014
DRIVERS OF ECONOMIC GROWTH INDEVELOPING COUNTRIESMinh DaoEastern Illinois University, [email protected]
Follow this and additional works at: http://thekeep.eiu.edu/economics_fac
Part of the Economics Commons
This Article is brought to you for free and open access by the Economics at The Keep. It has been accepted for inclusion in Faculty Research andCreative Activity by an authorized administrator of The Keep. For more information, please contact [email protected].
Recommended CitationDao, Minh, "DRIVERS OF ECONOMIC GROWTH IN DEVELOPING COUNTRIES" (2014). Faculty Research and CreativeActivity. 10.http://thekeep.eiu.edu/economics_fac/10
J.STUD.ECON.ECONOMETRICS, 2014, 38(1) 75
DRIVERS OF ECONOMIC GROWTH IN
DEVELOPING COUNTRIES
MQ Dao*
Abstract
his paper examines the impact of the drivers of economic growth in developing countries. We modify the conventional neoclassical
growth model to account for the impact of the increase in the number of people working relative to the total population and that of the increase in the value added per worker over time. Based on data from the World Bank for the 1995-2010 period and a sample of thirty-eight developing economies we find that the growth rate of per capita GDP is linearly dependent on technological progress, gross capital formation, the initial level of output per capita, and labour productivity growth, measured as the growth rate of the value added per worker, as well as human capital formation, measured as the growth rate of the average number of years of formal schooling among all persons aged 15 and above. We observe that all coefficient estimates except one have their expected sign and these explanatory variables except one are found to be statistically significant. We note that the increase in the number of people working, relative to the total population does not help explain cross-country differences in per capita GDP growth in developing economies. Statistical results of such empirical examination will assist governments in developing countries identify policy fundamentals that are essential for economic growth.
1. Introduction
This study examines the impact of the drivers of economic growth in developing
countries. According to the 2013 World Development Report: Jobs, there are
essentially four main forces that lie behind increases in an economy’s per capita
GDP. The first one is the use of more capital per unit of labour. Second, as fertility
declines and the proportion of adults in the total population increases, coupled with
women’s shift from household chores to income-generating activities, the number
of people working increases relative to the total population. The third one is an
increase in labour productivity, made possible through the acquisition of skills, also
referred to as human capital accumulation, allowing a worker to produce more
while using the same amount of capital. According to the 2013 World
________________________ *Eastern Illinois University, 600 E Lincoln Avenue, Charleston, IL 61920, USA; Email:
T
76 J.STUD.ECON.ECONOMETRICS, 2014, 38(1)
Development Report, good nutrition, health, and education outcomes not only
ameliorate people’s lives but also equip them for productive employment. Finally,
technological progress, measured as a change in total factor productivity, combines
capital, both physical and human, and labour more efficiently, while at the same
time applying new knowledge.
This paper attempts to estimate the impact of the drivers of economic growth in
developing countries. Based on data from the World Bank for the 1995-2010
period and a sample of thirty-eight1 developing economies we find that the growth
rate of per capita GDP is linearly dependent on technological progress, gross capital
formation, the initial level of output per capita, and labour productivity growth,
measured as the growth rate of the value added per worker, as well as human
capital formation, measured as the growth rate of the average number of years of
formal schooling among all persons aged 15 and above. We observe that all but
one coefficient estimates have their expected sign and these explanatory variables
except one are found to be statistically significant. We note that the increase in the
number of people working, relative to the total population does not help explain
cross-country differences in per capita GDP growth in developing economies. We
address the endogeneity problem by performing a Durbin-Wu-Hausman test and
find that OLS is not a consistent estimation technique. We then apply the 2SLS
technique and are able to get more robust results. We also observe that the
coefficient estimate on the growth rate of the average number of years of schooling
variable has the unexpected negative sign and suspect that this may be due to
multicollinearity. Statistical results of such empirical examination will assist
governments in developing countries identify policy fundamentals that are essential
for economic growth.
This paper is organized as follows. In the next section, a selected review of the
economic literature on the drivers of economic growth is discussed. This is
followed by the development of a theoretical model and the formulation of a
statistical model to be estimated. Statistical results are reported in the subsequent
section. A final section gives concluding remarks as well as policy
recommendations.
2. Selected review of the literature
Romer (1986) presents a fully specified model of long-run growth in which he
assumes that knowledge is an input in the production function that has increasing
marginal productivity. He then shows that growth rates can be increasing over
time, while the effects of small disturbances may be magnified by the actions of
private agents, and large countries may always grow faster than small countries.
Lucas (1988) considers the prospects for constructing a neoclassical theory of
growth and international trade that is consistent with some of the main features of
1 The sample consists of the following countries: Argentina, Bangladesh, Bolivia, Brazil, Bulgaria,
Chile, China, Colombia, Costa Rica, Croatia, Czech Republic, Dominican Republic, Ecuador, El
Salvador, Estonia, Honduras, Hungary, India, Indonesia, Latvia, Lithuania, Mauritius, Mexico,
Pakistan, Panama, Paraguay, Peru, Philippines, Poland, Portugal, Romania, Slovak Republic, Slovenia,
Sri Lanka, Thailand, Turkey, Uruguay, and Vietnam.

J.STUD.ECON.ECONOMETRICS, 2014, 38(1) 77
economic development. He considers three models and compares them to evidence:
a model emphasizing physical capital accumulation and technological change, a
model emphasizing human capital accumulation through schooling, and a model
emphasizing specialized human capital accumulation through learning-by-doing.
Romer (1990) develops a model in which growth is driven by technological change
that arises from intentional investment decisions made by profit-maximizing firms.
His main conclusions are that the stock of human capital determines the rate of
growth, that integration into world markets will increase growth rates, and that
having a large population is not sufficient to generate growth.
Caballé and Santos (1993) develop a class of models in which the economy’s rate
of growth will be determined endogenously by the interaction among the
technology of human capital accumulation and agents’ preferences. Their analysis
helps to understand the role played by the technologies of both physical and human
capital in the process of accumulation and to evaluate the effect of policies aimed at
achieving higher levels of capital. Using a panel of about 100 countries for the
1960-90 period, Barro (1996) finds that higher initial schooling and life expectancy,
lower fertility, lower government consumption, better maintenance of the rule of
law, lower inflation and improvements in the terms of trade all contribute positively
to economic growth, given an initial level of real per capita GDP. The general
notion of conditional convergence is strongly supported as growth is negatively
related to the starting level of real per capita GDP. Barro and Sala-i-Martin (1997)
construct a model combining elements of endogenous growth with the convergence
implications of the neoclassical growth model. They show that in the long run
discoveries in the technologically advanced economies drive the world growth rate.
Since copying is less costly than innovation over some range, followers converge
toward the leaders. As copying costs tend to increase and hence reduce followers’
growth rates, this generates a pattern of conditional convergence.
Empirical studies of cross-country growth by DeLong and Summers (1991) and by
Mankiw, Romer, and Weil (1992) also report the important positive role of the ratio
of investment to GDP. A high ratio raises the steady-state level of output per
effective worker and hence raises the growth rate for a given initial value of GDP.
Barro (2003) finds that growth depends positively on the rule of law and the
investment ratio and negatively on the fertility rate, the share of government
consumption in the GDP, and the inflation rate, for given per capita GDP and
human capital in the forms of educational attainment and health. Using a sample of
sixty-two developing economies and data from the World Bank, Dao (2011) finds
that per capita GDP growth is linearly dependent upon the percentage of the urban
population with sanitation services, the percentage of the urban population with
water access, that of the rural population with water access, gross capital formation
as a percent of GDP, the adult literacy rate, the ratio of bank liquid reserves to bank
assets, the globalization index, and social and political globalization. Regression
results also show external debt to exports ratio does not linearly influence growth
for this sample of countries. However, for a sample of twenty-seven Heavily
Indebted Poor Countries (HIPC), external debt as a percent of GDP does exert a
78 J.STUD.ECON.ECONOMETRICS, 2014, 38(1)
negative impact on growth. On the other hand, using another sample of fifty-two
developing economies, he is able to show that public debt as a percent of GDP
positively affects growth.
This paper attempts to estimate the impact of the drivers of economic growth in
developing countries. We first formulate a neoclassical growth model based on the
aggregate production function. We then specify the statistical model to be
estimated while giving the theoretical underpinnings for the inclusion of
explanatory variables. Empirical results are presented in a subsequent section. The
final section gives concluding remarks as well as policy implications.
3. The theoretical framework
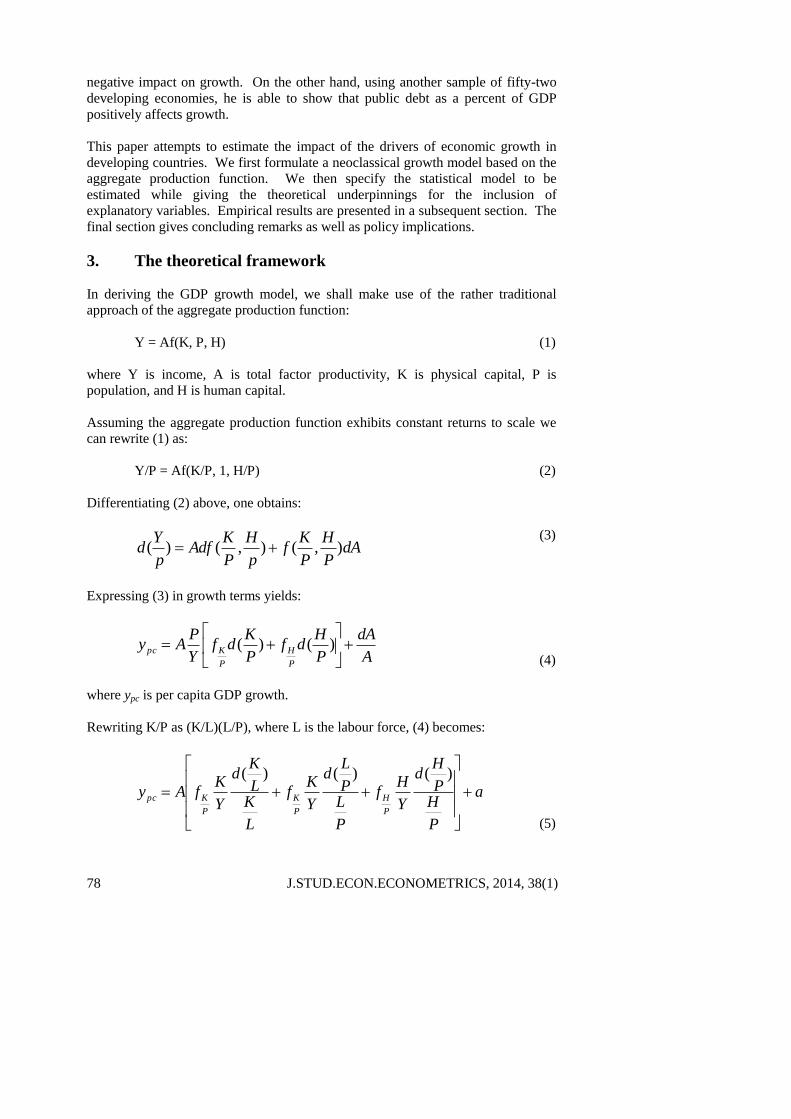
In deriving the GDP growth model, we shall make use of the rather traditional
approach of the aggregate production function:
Y = Af(K, P, H) (1)
where Y is income, A is total factor productivity, K is physical capital, P is
population, and H is human capital.
Assuming the aggregate production function exhibits constant returns to scale we
can rewrite (1) as:
Y/P = Af(K/P, 1, H/P) (2)
Differentiating (2) above, one obtains:
dAP
H
P
Kf
p
H
P
KAdf
p
Yd ),(),()(
(3)
Expressing (3) in growth terms yields:
A
dA
P
Hdf
P
Kdf
Y
PAy
P
H
P
Kpc
)()(
(4)
where ypc is per capita GDP growth.
Rewriting K/P as (K/L)(L/P), where L is the labour force, (4) becomes:
a
P
HP
Hd
Y
Hf
P
LP
Ld
Y
Kf
L
KL
Kd
Y
KfAy
P
H
P
K
P
Kpc
)()()(
(5)
J.STUD.ECON.ECONOMETRICS, 2014, 38(1) 79
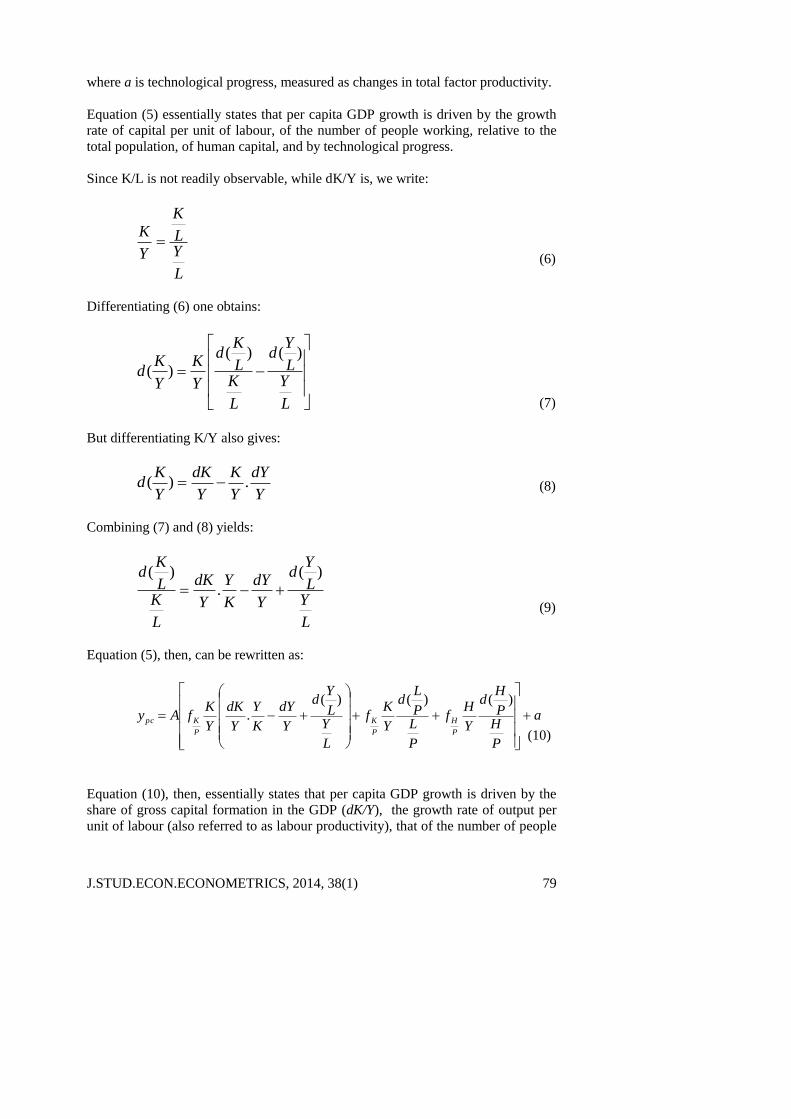
where a is technological progress, measured as changes in total factor productivity.
Equation (5) essentially states that per capita GDP growth is driven by the growth
rate of capital per unit of labour, of the number of people working, relative to the
total population, of human capital, and by technological progress.
Since K/L is not readily observable, while dK/Y is, we write:
L
YL
K
Y
K
(6)
Differentiating (6) one obtains:
L
YL
Yd
L
KL
Kd
Y
K
Y
Kd
)()()(
(7)
But differentiating K/Y also gives:
Y
dY
Y
K
Y
dK
Y
Kd .)(
(8)
Combining (7) and (8) yields:
L
YL
Yd
Y
dY
K
Y
Y
dK
L
KL
Kd )(
.)(
(9)
Equation (5), then, can be rewritten as:
a
P
HP
Hd
Y
Hf
P
LP
Ld
Y
Kf
L
YL
Yd
Y
dY
K
Y
Y
dK
Y
KfAy
P
H
P
K
P
Kpc
)()()(
.
(10)
Equation (10), then, essentially states that per capita GDP growth is driven by the
share of gross capital formation in the GDP (dK/Y), the growth rate of output per
unit of labour (also referred to as labour productivity), that of the number of people

80 J.STUD.ECON.ECONOMETRICS, 2014, 38(1)
working, relative to the total population, that of human capital, and by
technological progress.
4. The statistical model
Based on equation (10), we proceed to test it by specifying the following statistical
model2:
ypc = β0 + β1I/Y + β2wrkpop + β3educ + β4ypw + β5PGDP00 +ϵ
(+) (+) (+) (+) (-) (11)
where ypc = Average annual growth rate of per capita GDP, 2000-10.
I/Y = Share of gross capital formation in the GDP, in 2010.
wrkpop = Average annual growth rate of the number of people working,
relative to the total population, 2005-2010.
educ = Average annual growth rate of the average number of years of
schooling, 1995-2005.
ypw = Average annual growth rate of the value added per worker, 1995-
2005.
PGDP00 = per capita GDP, in US$, in 2000.
We use the 2000-2010 GDP per capita growth rate at market prices based on
constant local currency for ypc. For I/Y, we use the share of gross capital formation
(formerly known as gross domestic investment). As far as human capital is
concerned, we use the growth rate of the average number of years of schooling. In
order to capture the effect of a decline in fertility and of an increase in the share of
adults in the total population as well as a shift of women’s work from household
chores to income-generating activities on growth, we include the growth rate of the
number of people working, relative to the total population.
In addition, addressing the effect of an increase in labour productivity on growth,
we include the growth rate of the value added per worker. We expect the
coefficient estimates for all these four variables to have a positive sign.
Finally, to capture the tendency for poor countries to grow faster than rich
countries, termed β-convergence, as shown by Barro and Sala i Martin (1990) we
include the initial (2000) level of real per capita GDP. The primary reason for this
convergence result in neoclassical growth models is diminishing returns to physical
capital. We thus expect that the coefficient estimate on this variable to have a
negative sign.
2 Following a reviewer’s comments we include trade openness measured as exports and imports as a
percentage of GDP and the share of net FDI in the GDP as explanatory variables but find them to be
statistically significant and thus remove them from the statistical model.

J.STUD.ECON.ECONOMETRICS, 2014, 38(1) 81
Data for all variables are from the 2013 World Development Report and the 2012
World Bank Indicators.
5. Empirical results
Table 1 gives least-squares estimates of regression coefficients in equation (11) for
a sample of thirty-eight developing countries. We observe that three out of five
explanatory variables are statistically significant at the 5 percent or lower level and
two coefficient estimates do not have their anticipated sign. The goodness of fit of
the model is quite good as indicated by the value of 0,537 of the adjusted
coefficient of determination.
Table 1: Dependent variable: Per capita GDP growth rate
Coefficient Estimates t -Statistics
Intercept 1,191 1,038
I/Y 0,145 4,432*
wrkpop -0,349 -0,544
educ -0,173 -0,724
ypw 0,078 2,332*
PGDP00 -0,0002 -2,004**
Adjusted R2 = 0,537
*Significant at the 1 percent level.
**Significant at the 5percent level.
One concern is that the growth rate of the average number of years of schooling
variable may be endogenous, i.e., it may be correlated with the error term. A
possible source of this endogeneity may lie in the simultaneity between this
variable and per capita GDP growth. To test for endogeneity we perform a Durbin-
Wu-Hausman test. We first perform the following regression
educ = α0 + α1PubHlth + α2PolityIV + α3ypc + u
(-) (+) (+)
(12)
where PubHlth = share of public health expenditures in the GDP, in 2010.
PolityIV = Polity index of Democracy/Autocracy, with value of -10 for
fully autocratic, and 10 for fully democratic, in 2010.
ypc = Average annual growth rate of per capita GDP, 2000-10.
The formulation of this model is based on Dao (2005). He argues that public
expenditure on health care may affect the level of educational attainment in two
ways: from a demand for education standpoint, in countries afflicted by debilitating
diseases such as AIDS, children may have to stay at home to care for sick parents
or orphaned siblings, while, from a supply side, in light of limited government
resources, higher public expenditures on health care may divert these resources
away from education at all levels.
Another supply-side impediment occurs when publicly financed schools may be a
low priority as the economic and political elites send their children to private

82 J.STUD.ECON.ECONOMETRICS, 2014, 38(1)
schools or when limited resources are channelled from primary to higher education
in the service of these elites. Using the polity index of democracy, where high
values are associated with more democratic government systems, Dao (2005)
hypothesizes that in countries where the voices of their citizens are heard, more
children would be enrolled in schools, thus resulting in a higher level of educational
attainment.
Since cost is a primary consideration in the demand for education, the poorer a
household is, the less likely it will be able to afford an education for its children.
Thus, one would expect countries with slow economic growth to have lower
educational attainment growth rates.
Using the residuals from this regression, we then perform an augmented regression:
ypc = γ0 + γ1I/Y + γ2wrkpop + γ3educ + γ4ypw + γ5PGDP00 +
γ6res + e
(13)
where res = residuals from the regression using equation (12) and the remaining
variables are as defined in equation (11).
Results of this augmented regression are reported in Table 2. Since the coefficient
of res is different from zero, OLS is not consistent. To account for endogeneity we
obtain the predicted values of the education variable from the regression using
equation (12) and then use them in the estimation of equation (11) above. Results
of this 2SLS regression are reported in Table 3. We observe that three out of five
explanatory variables are statistically significant at the 1 percent level and two
coefficient estimates do not have their anticipated sign3. The goodness of fit of the
model is superior to that of the OLS regression as indicated by the higher value of
0,637 of the adjusted coefficient of determination. We note that the intercept term,
which captures the effect of technological progress, is statistically significant at the
5 percent level. As the share of gross capital formation in the GDP of a developing
country increases by 1 percentage point, we would expect an increase of 0,16
percentage point in per capita GDP growth rate, other things being equal. Per
capita GDP growth rate is expected to decrease by about 0,03 percentage point for
every one-hundred dollar increase in the 2000 per capita GDP level. This latter
result is consistent with β-convergence, even though its effect is rather weak.
3 We are indebted to a reviewer for providing a possible explanation for the negative sign of the
coefficient estimate of the increase in the employed population as a share of the total population. It
might be the case that in developing countries with high unemployment and fast growing populations
increased labour force participation is unimportant for growth. This participation is only important in
countries like China where unemployment is low and population growth slow.

J.STUD.ECON.ECONOMETRICS, 2014, 38(1) 83
Table 2: Dependent variable: Per capital GDP growth rate (augmented
regression) Coefficient Estimate t-Statistic
Intercept 2,837 2,442*
I/Y 0,166 5,537*
ypw 0,037 1,130
wrkpop -0,315 -0,549
educ -1,250 -3,004*
PGDP00 -0,0003 -3,319*
res 1,404 3,015*
Adjusted R2 = 0,630
*Significant at the 1 percent level.
Table 3: Dependent variable: Per capita GDP growth rate (2SLS) Coefficient Estimate t-Statistic
Intercept 2,967 2,618*
I/Y 0,162 5,595*
ypw 0,040 1,224
wrkpop -0,250 -0,446
educ -1,268 -3,083*
PGDP00 -0,0003 -3,480*
Adjusted R2 = 0,637
*Significant at the 1 percent level.
A backward elimination stepwise method was applied to arrive at a revised model,
the regression results of which are reported in Table 4. We note that the goodness
of fit of the model to the data is better as indicated by the higher value of 0,646 of
the adjusted coefficient of determination.
Table 4: Dependent variable: Per capita GDP growth rate (2SLS) (Revised) Coefficient Estimate t-Statistic
Intercept 2,816 2,636*
I/Y 0,164 5,809*
ypw 0,042 1,317
educ -1,289 -3,193*
PGDP00 -0,0003 -3,536*
Adjusted R2 = 0,646
*Significant at the 1 percent level.
We observe that qualitatively the results remain the same. We also note that the
annual growth rate of the value added per worker, while not statistically significant
when using t-test, does in fact linearly affect per capita GDP growth rate as its
removal from the statistical model results in a lower adjusted coefficient of
determination. We suspect that this may be due to multicollinearity, the extent of
which is reported in Table 5. As the share of gross capital formation in the GDP of
a developing country increases by 1 percentage point, we would expect an increase
of 0,16 percentage point in per capita GDP growth rate, other things being equal.
All else equal, a one-percentage point increase in the annual growth rate of the
value added per worker is expected to lead to an increase of 0,04 percentage point
in per capita GDP growth rate, while this rate is expected to decrease by about 0,03
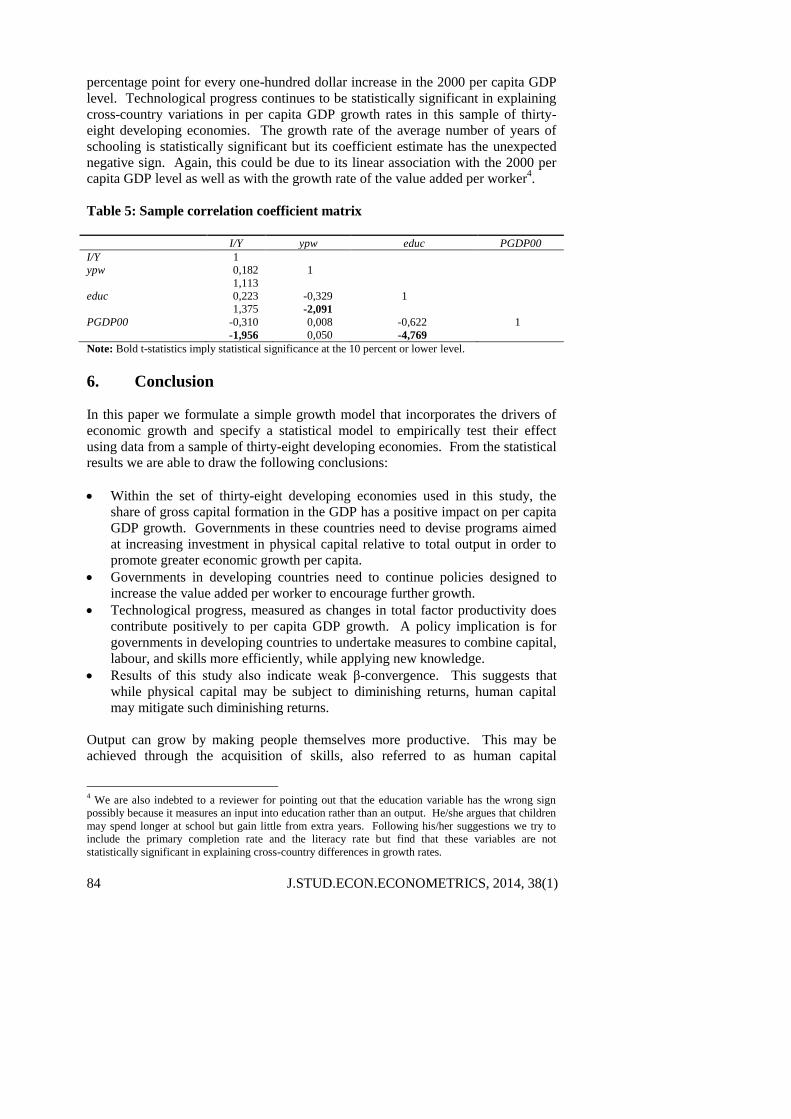
84 J.STUD.ECON.ECONOMETRICS, 2014, 38(1)
percentage point for every one-hundred dollar increase in the 2000 per capita GDP
level. Technological progress continues to be statistically significant in explaining
cross-country variations in per capita GDP growth rates in this sample of thirty-
eight developing economies. The growth rate of the average number of years of
schooling is statistically significant but its coefficient estimate has the unexpected
negative sign. Again, this could be due to its linear association with the 2000 per
capita GDP level as well as with the growth rate of the value added per worker4.
Table 5: Sample correlation coefficient matrix
I/Y ypw educ PGDP00
I/Y 1
ypw 0,182 1
1,113
educ 0,223 -0,329 1
1,375 -2,091
PGDP00 -0,310 0,008 -0,622 1
-1,956 0,050 -4,769
Note: Bold t-statistics imply statistical significance at the 10 percent or lower level.
6. Conclusion In this paper we formulate a simple growth model that incorporates the drivers of
economic growth and specify a statistical model to empirically test their effect
using data from a sample of thirty-eight developing economies. From the statistical
results we are able to draw the following conclusions:
Within the set of thirty-eight developing economies used in this study, the
share of gross capital formation in the GDP has a positive impact on per capita
GDP growth. Governments in these countries need to devise programs aimed
at increasing investment in physical capital relative to total output in order to
promote greater economic growth per capita.
Governments in developing countries need to continue policies designed to
increase the value added per worker to encourage further growth.
Technological progress, measured as changes in total factor productivity does
contribute positively to per capita GDP growth. A policy implication is for
governments in developing countries to undertake measures to combine capital,
labour, and skills more efficiently, while applying new knowledge.
Results of this study also indicate weak β-convergence. This suggests that
while physical capital may be subject to diminishing returns, human capital
may mitigate such diminishing returns.
Output can grow by making people themselves more productive. This may be
achieved through the acquisition of skills, also referred to as human capital
4 We are also indebted to a reviewer for pointing out that the education variable has the wrong sign
possibly because it measures an input into education rather than an output. He/she argues that children
may spend longer at school but gain little from extra years. Following his/her suggestions we try to
include the primary completion rate and the literacy rate but find that these variables are not
statistically significant in explaining cross-country differences in growth rates.

J.STUD.ECON.ECONOMETRICS, 2014, 38(1) 85
accumulation, which enables a person to do more using the same amount of capital.
Governments in developing countries need to seek ways of increasing their
citizens’ stock of human capital through expanding the educational attainment of
their population.
References
Barro, R. J. 1996. ‘Determinants of economic growth: A cross-country empirical study’, NBER
Working Paper 5698.
Barro, R. J. 2003. ‘Determinants of economic growth in a panel of countries’, Annals of Economics and
Finance, 4, 2 (November), 231-274.
Barro, R. J and Sala-i-Martin, X. 1990. ‘Public finance in the theory of economic growth’, unpublished
manuscript.
Barro, R. J. 1997. ‘Technological diffusion, convergence, and Growth’, Journal of Economic Growth,
2, 1 (March), 1-27.
Caballé, J., and Santos, M. 1993. ‘On endogenous growth with physical and human capital’, Journal of
Political Economy, 101, 6 (December), 1042-1067.
Dao, M.Q. 2005. ‘Educating children in developing countries: An empirical analysis’, Studi Economici,
85, 1, 89- 104.
Dao, M.Q. 2011. ‘Debt and growth in developing countries’, Economia Internazionale/International
Economics, LXIV, 2 (May), 173-193.
DeLong, J.B. and Summers, L.H. 1991. ‘Equipment investment and economic growth’, Quarterly
Journal of Economics, 106, 2 (May), 445-502.
Lucas, R.E. Jr. 1988. ‘On the mechanics of economic development’, Journal of Monetary Economics,
22, 1 (July), 3-42.
Mankiw, N.G, Romer, D. and Weil, D.N. 1992. ‘A contribution to the empirics of economic growth’,
Quarterly Journal of Economics, 107, 2 (May), 407-437.
Romer, P.M. 1986. ‘Increasing returns and long-run growth’, Journal of Political Economy, 94, 5
(October), 1002-1037.
Romer, P.M. 1990. ‘Endogenous technological change’, Journal of Political Economy, 98, 5 (October):
pt. II, S71-S102.
World Bank. 2012. World Development Indicators, Oxford University Press: New York.
World Bank. 2013. World Development Report 2013: Jobs, Oxford University Press: New York.