Driver Inattention Detection based on Eye Gaze–Road...
28
Luke Fletcher Department of Information Engineering, RSISE, Australian National University Canberra, Australia [email protected] Alexander Zelinsky CSIRO ICT Centre, Canberra, Australia, [email protected] Driver Inattention Detection based on Eye Gaze–Road Event Correlation Abstract Current road safety initiatives are approaching the limit of their effec- tiveness in developed countries. A paradigm shift is needed to address the preventable deaths of thousands on our roads. Previous systems have focused on one or two aspects of driving: environmental sensing, vehicle dynamics or driver monitoring. Our approach is to consider the driver and the vehicle as part of a combined system, operating within the road environment. A driver assistance system is imple- mented that is not only responsive to the road environment and the driver’s actions but also designed to correlate the driver’s eye gaze with road events to determine the driver’s observations. Driver ob- servation monitoring enables an immediate in-vehicle system able to detect and act on driver inattentiveness, providing the precious sec- onds for an inattentive human driver to react. We present a prototype system capable of estimating the driver’s observations and detecting driver inattentiveness. Due to the “look but not see” case it is not possible to prove that a road event has been observed by the driver. We show, however, that it is possible to detect missed road events and warn the driver appropriately. 1. Introduction The daily occurrence of traffic accidents has become a hor- rific price of modern life. Complacency about the dangers of driving contribute to the death of more than one million peo- ple worldwide in traffic accidents each year (WHO 2001). Fifty million more are seriously injured (WHO 2001). In The The International Journal of Robotics Research Vol. 28, No. 6, June 2009, pp. 774–801 DOI: 10.1177/0278364908099459 c The Author(s), 2009. Reprints and permissions: http://www.sagepub.co.uk/journalsPermissions.nav Figures 1–2, 4–6, 8–39 appear in color online: http://ijr.sagepub.com Organization for Economic Co-operation and Development (OECD) member countries, road accidents are the primary cause of death for males under the age of 25 (OECD 2006). There is no doubt that driver error is at the heart of road fatalities (Treat et al. 1979). In their landmark study Neale et al. (2005) used 100 vehicles equipped with video and sensor logging equipment to study how people drive and why they crash. They found that 78% of accidents and 67% of near acci- dents they witnessed involved momentary inattention (within 3 seconds) before the incident. We propose to detect and act upon momentary driver inat- tention. Cars offer unique challenges in human–machine inter- action. Vehicles are becoming, in effect, robotic systems that collaborate with the driver. To detect inattention we attempt to estimate the driver’s observations in real-time within the ve- hicle. Through the integration of driver eye-gaze tracking and road scene event detection the driver behavior can be validated against a model of expected behavior to determine cases of momentary driver inattention. Next, we conduct a brief analysis of the problem of death and injury on the road. In Section 2 we review related work and derive our approach to road safety. Section 3 details sys- tem components developed to implement our research. Sec- tion 4 describes several inattention detection systems used to verify the efficacy of driver observation monitoring. The paper concludes with a discussion of the next potential steps in road safety in the light of these results. 1.1. Motivation Law enforcement, improved vehicle and road design and pub- lic awareness campaigns have had a marked effect on accident rates since the 1970s (ATSB 2004 OECD 2006). Little, how- ever, has been achieved on the hard cases of road safety, such as fatigue, distraction and inattention (Treat et al. 1979 Stutts et al. 2001 Neale et al. 2005). 774
Transcript of Driver Inattention Detection based on Eye Gaze–Road...

Luke Fletcher
Department of Information Engineering, RSISE,
Australian National University
Canberra, Australia
Alexander Zelinsky
CSIRO ICT Centre,
Canberra, Australia,
Driver InattentionDetection based on EyeGaze–Road EventCorrelation
Abstract
Current road safety initiatives are approaching the limit of their effec-
tiveness in developed countries. A paradigm shift is needed to address
the preventable deaths of thousands on our roads. Previous systems
have focused on one or two aspects of driving: environmental sensing,
vehicle dynamics or driver monitoring. Our approach is to consider
the driver and the vehicle as part of a combined system, operating
within the road environment. A driver assistance system is imple-
mented that is not only responsive to the road environment and the
driver’s actions but also designed to correlate the driver’s eye gaze
with road events to determine the driver’s observations. Driver ob-
servation monitoring enables an immediate in-vehicle system able to
detect and act on driver inattentiveness, providing the precious sec-
onds for an inattentive human driver to react. We present a prototype
system capable of estimating the driver’s observations and detecting
driver inattentiveness. Due to the “look but not see” case it is not
possible to prove that a road event has been observed by the driver.
We show, however, that it is possible to detect missed road events and
warn the driver appropriately.
1. Introduction
The daily occurrence of traffic accidents has become a hor-
rific price of modern life. Complacency about the dangers of
driving contribute to the death of more than one million peo-
ple worldwide in traffic accidents each year (WHO 2001).
Fifty million more are seriously injured (WHO 2001). In The
The International Journal of Robotics Research
Vol. 28, No. 6, June 2009, pp. 774–801
DOI: 10.1177/0278364908099459
c�The Author(s), 2009. Reprints and permissions:
http://www.sagepub.co.uk/journalsPermissions.nav
Figures 1–2, 4–6, 8–39 appear in color online: http://ijr.sagepub.com
Organization for Economic Co-operation and Development
(OECD) member countries, road accidents are the primary
cause of death for males under the age of 25 (OECD 2006).
There is no doubt that driver error is at the heart of road
fatalities (Treat et al. 1979). In their landmark study Neale et
al. (2005) used 100 vehicles equipped with video and sensor
logging equipment to study how people drive and why they
crash. They found that 78% of accidents and 67% of near acci-
dents they witnessed involved momentary inattention (within
3 seconds) before the incident.
We propose to detect and act upon momentary driver inat-
tention. Cars offer unique challenges in human–machine inter-
action. Vehicles are becoming, in effect, robotic systems that
collaborate with the driver. To detect inattention we attempt to
estimate the driver’s observations in real-time within the ve-
hicle. Through the integration of driver eye-gaze tracking and
road scene event detection the driver behavior can be validated
against a model of expected behavior to determine cases of
momentary driver inattention.
Next, we conduct a brief analysis of the problem of death
and injury on the road. In Section 2 we review related work
and derive our approach to road safety. Section 3 details sys-
tem components developed to implement our research. Sec-
tion 4 describes several inattention detection systems used to
verify the efficacy of driver observation monitoring. The paper
concludes with a discussion of the next potential steps in road
safety in the light of these results.
1.1. Motivation
Law enforcement, improved vehicle and road design and pub-
lic awareness campaigns have had a marked effect on accident
rates since the 1970s (ATSB 2004� OECD 2006). Little, how-
ever, has been achieved on the hard cases of road safety, such
as fatigue, distraction and inattention (Treat et al. 1979� Stutts
et al. 2001� Neale et al. 2005).
774

Fletcher and Zelinsky / Driver Inattention Detection based on Eye Gaze–Road Event Correlation 775
Fig. 1. Road fatalities from 1990 to 2004 per million vehicles across selected OECD countries. Data from OECD (2006).
Fig. 2. Fatigue correlated accidents and all fatal crashes. Data from ATSB (2006).
Figure 1 plots the number of road fatalities for several
OECD countries over the past 15 years. While many countries
such as France and Spain, which were starting from a high
base, have steady declines, countries with the lowest fatality
rates, such as Sweden and the UK, no longer have a constant
decline. Instead, the decrease in fatalities in these countries ap-
pears to be slowing (OECD/ECMT 2006). In fact, most OECD
countries are losing traction toward the OECD aim of a 50%
reduction in road fatalities from 2000 by 2012 (OECD/ECMT
2006).
One reason for this trend is that as road fatalities from
speeding and drink-driving fall, the difficult cases in road
safety, fatigue, distraction and inattention, are becoming more
prominent. To gauge this trend we extracted data likely to cor-
relate well with fatigue-induced accidents from the Australian
Road Crash Database (ATSB 2006)1. Figure 2 plots night-time
single vehicle crashes with the total number of fatal crashes.
The plot shows that there is no significant downward trend in
(likely) fatigue induced crashes despite a clear downward trend
in fatal crashes per se.
1. The data extracted was the number of fatal single vehicle crashes during the
night (22:00–7:00) compared with the total number of fatal crashes

776 THE INTERNATIONAL JOURNAL OF ROBOTICS RESEARCH / June 2009
Fig. 3. Diminishing returns of vehicle autonomy. On high-
ways: University of Bundeswehr, Munich (UBM’s) “Va-
MORS” in 1987, Carnegie Mellon University (CMU’s)
“Navlab 5” in 1995.
It is natural to conclude that the key to eliminating road
fatalities is to usurp the failing component, the human driver.
There have been a number of impressive feats of autonomous
driving. A famous early system pioneered by Dickmanns and
Graefe (1988a,b) was able to steer a vehicle at well over 150
km/h on well formed roads. In the 1990s demonstrations of
subsequent work in the field were also impressive, e.g. the
Navlab “No Hands Across America” trial steered 98% of the
4500 km trip (Pomerleau and Jochem 1996). However, having
an automated system address the remaining 2% of road sce-
narios proved extremely difficult.
As illustrated in Figure 3 autonomous vehicle capabili-
ties have a diminishing return on effort as the capabilities
become more advanced. Urban scenes contain substantially
more complexity and variance than the highway cases mean-
ing that 100% autonomy in urban and highway scenarios is
much further away (Franke et al. 1998). In recent years the
United States Defense Advanced Research Projects Agency
(DARPA) Grand Challenge, in which road vehicles have been
automated to drive in on-road off-road competitions, has gen-
erated renewed interest in full vehicle automation (DARPA
2004, 2005). The events while modelled on the “real world”
are carefully constrained (DARPA 2007). While challenging
to robots the test courses would offer little difficulty to an ex-
perienced driver as, again, handling the difficult cases is still a
significant time away (Thrun et al. 2006).
Although autonomous technologies in vehicles work very
well in their element (over 98% of the time), these systems are
highly susceptible to being “tricked” by extreme or unlikely
circumstances due to the models they are built on. Humans on
the other hand are remarkably flexible. They are able to prob-
lem solve on the fly, even when prompted by the most improb-
able situations. Yet they are susceptible to fatigue, distraction
and inattention.
Maltz and Shinar (2004) showed that even an imperfect au-
tonomous technology for driver assistance could provide a sig-
nificant road safety benefit. So the research agenda shifted to
driver support. Here we can use autonomous capabilities to
support the driver.
Table 1 summarizes the complementary competencies of
a human and an automated driver. Instead of the traditional
model of a driver applying the control signal to the vehicle
to move through the road environment, we can consider two
drivers: the human driver and the autonomous driver, collab-
orating to control the vehicle. The critical question then be-
comes how do we combine the behavior of the two controlling
agents?
2. Our Approach
Fortunately there is a ready analogy where two drivers are in
charge of the one vehicle. Almost every driver has experienced
a warning from a passenger, perhaps alerting him or her to
an obscured car while merging lanes, or a jaywalking pedes-
trian in a blind spot. These warnings of inattention save count-
less lives every day. In a recent keynote address (Regan 2005),
Road Safety Researcher Professor Michael Regan2 highlighted
the fact that, unlike other complex, potentially dangerous ve-
hicles such as planes and ships, road vehicles are operated by
a single person. That single person is prone to error and may
be, due to the day-to-day nature of driving, slow to recognize
potential hazards. Professor Regan speculated that the intro-
duction of co-drivers in road vehicles could be the key to a
substantial reduction in road accidents.
Our research investigates the implementation of an auto-
mated co-driver as a realization of a road vehicle equivalent to
aircraft pilot and co-pilot collaboration.
A human aircraft co-pilot provides relief to the pilot by
assuming control of the vehicle, but the co-pilot also double
checks life-critical actions and shares the burden of adminis-
tration. We envisage that an Automated Co-driver would pro-
vide a role in road vehicles which is an amalgam of a vigi-
lant passenger, driver aid and a safety system. An Automated
Co-driver could: double check life-critical actions� relieve the
driver of tedious activities� and, crucially, warn about missed
road events maximizing the reaction time available for the
driver.
2.1. Driver Inattention
Given the high proportion of road accidents that involve inat-
tention, it is our conjecture that the primary contributing fac-
tors to road fatalities, speed, drink-driving, fatigue and distrac-
2. Professor Michael Regan is a Research Director at INRETS (The French
National. Institute for Transport and Safety Research)

Fletcher and Zelinsky / Driver Inattention Detection based on Eye Gaze–Road Event Correlation 777
Table 1. Competencies of human and automated drivers.
Human driver Automated driver
Competent to drive in 100% of road conditions Competent to drive in 98% of highway conditions
Distractible, inattentive Vigilant
Susceptible to fatigue Tireless
Subject to boredom, tedium Consistent, multitasking, servile
Highly adaptable Limited programmed behaviour change
High ambiguity and uncertainty tolerance Limited programmed uncertainty tolerance
Highly evolved yet fixed sensory perception system Limited yet extendable sensory system, not confined to range of
human senses (e.g. millimeter-wave radar)
Limited reaction time Near instantaneous reaction time
Fig. 4. Accident contributing factors that lead to inattention
which leads to road fatalities.
tions, are all actually causes of inattention. The contributing
factors all impair the driver’s ability to react in time to critical
road events. Figure 4 illustrates this point. The primary causes
of accidents induce driver inattention which can lead to road
fatalities.
By concentrating our efforts on driver inattention interven-
tions, we could break these event chains leading to a sub-
stantial reduction of road fatalities across many road scena-
rios.
2.2. Driver Observation Monitoring
Driver inattention is a highly transient state, and can be due to
an identifiable distraction or simply concentration on a com-
peting driving task. Monitoring the vehicle provides knowl-
edge of the vehicle state and the driver’s actions. Monitoring
the road scene enables us to identify road scene events. How-
ever, only driver inaction, not inattention, can be estimated us-
ing vehicle and road scene monitoring alone. Given a time win-
dow of a few seconds, driver inaction detection will occur too
late to intervene (Neale et al. 2005). To detect true driver inat-
tention, what the driver has or has not seen must be identified.
As illustrated in Figure 5, to detect driver inattention requires
accurate real-time driver eye-gaze monitoring combined with
vehicle and road scene state.
Our experiments will concentrate on combining driver
monitoring with road scene feature extraction to achieve driver
observation monitoring.
Direct driver monitoring has been the subject of clinical
trials for decades� however, monitoring for use in Advanced
Driver Assistance Systems is relatively new.
Head position and eye closure have been identified as
strong indicators of fatigue (Haworth et al. 1988). How-
ever, when augmented with information about the vehicle and
traffic, additional inferences can be made.
Gordon A. D. (1966) conducted an in-depth analysis of per-
ceptual cues used for driving. He described driving as a track-
ing problem. In on-road systems, Land and Lee (1994) investi-
gated the correlation between eye-gaze direction and road cur-
vature, finding that the driver tended to fixate on the tangent of
the road ahead. Apostoloff and Zelinsky (2004) used gaze and
lane tracking to verify this correlation on logged data, also ob-
serving that the driver frequently monitored oncoming traffic.
Ishikawa et al. (2004) explored back projecting the driver’s
gaze direction onto the scene, but scene features were not iden-
tified. Takemura et al. (2003) demonstrated a number of corre-
lations between head and gaze direction and driving tasks on
logged data.
Driver monitoring can also be used for validating road
scene activity. By monitoring where the driver is looking, us-
ability of the safety system can be improved by suppressing
many unnecessary warnings. As long as a road event, such
as an overtaking car or wandering pedestrian, is noted by the
driver no action needs to be taken.
The behavior of the driver several seconds before and after
an important detected road event is used to decide whether to
issue a warning. Driver monitoring is achieved via an eye-gaze
tracking system and vehicle instrumentation.

778 THE INTERNATIONAL JOURNAL OF ROBOTICS RESEARCH / June 2009
Fig. 5. Driver observation monitoring: driver eye-gaze tracking and critical road scene feature detection are combined to deter-
mine what the driver is seeing (or not seeing).
2.3. Autonomous Functions For Driver Support
Many groups have tackled specific sensing and control prob-
lems for driver support. A quick survey of the Intelli-
gent Transport Systems (ITS) literature reveals much work
in lane tracking/keeping (Dickmanns and Graefe 1988b�
Pomerleau and Jochem 1996� Bertozzi et al. 2000), obsta-
cle/vehicle/pedestrian/sign detection (Hsu and Huang 2001�
Franke and Heinrich 2002� Labayrade et al. 2002� Grubb and
Zelinsky 2004), and driver monitoring (Takemura et al. 2003).
However, fewer groups have combined different classes of
components to form integrated support systems, with some re-
cent notable exceptions being Takemura et al. (2003), Trivedi
et al. (2005) and Holzmann et al. (2006). Interest in integration
is emerging with the goals of multidisciplinary networks such
as the EU Humanist and AIDE road safety projects (Amditis
et al. 2006).
2.4. Vehicle–Driver Interaction
Holzmann et al. (2006) recently outlined an architecture for
predictive path planning using a “virtual driver” model, where
the driver’s actions in addition to other inputs are fed into
the driver assistance system. The system, based on its own
confidence and the estimated fitness of the driver, generates a
safe vehicle control action. No direct driver monitoring seemed
to be used. This architecture would be a great complementary
component to our system. Gerdes and Rossetter (2001) used
force feedback through the steering wheel as a natural human
machine interface for lane-keeping. The driver feels a gen-
tle force through the steering wheel encouraging the driver
to maintain a central position in the lane. The perception to
the driver is that the car is being guided down the lane as if
it is on rails, or driving along a trough. The applied force is
weak enough, however, that the driver can override the force
to overtake or depart. Similarly, Similarly, Carsten and Tate
(2001) used feedback through the accelerator for speed con-
trol. The accelerator pedal becomes increasingly difficult to
depress as the speed limit is exceeded. These interfaces are
perfect examples of how a system can give feedback to the
driver in a natural unobtrusive way. To permit us to drive on
public roads we could not use actuated systems in our experi-
ments. However, these feedback interfaces are how we envis-
age a final system to operate.
A particularly strong group due to the inclusion of hu-
man factors and intelligent vehicle researchers, used a sensor-
rich vehicle for driver behavior modeling. Moving from driver
behavior analysis to assistance systems the group has re-
cently been correlating driver head pose with road scene per-
ception (Trivedi et al. 2005). They show an improved clas-
sification of the driver intent to change lane when head pose
data is included in the modeling.
Matsumoto et al. (1999) demonstrated head pose and eye-
gaze tracking as a potential human–machine interface. The re-
search has been developed by Seeing Machines (2001) into
an in-vehicle system. The system can accurately track head
pose and eye-gaze direction down to �1�. We will use this
system to determine eye gaze to correlate with road scene
events.

Fletcher and Zelinsky / Driver Inattention Detection based on Eye Gaze–Road Event Correlation 779
Fig. 6. (a) The cameras on-board the vehicle. The CeDAR active vision platform containing the stereo road scene cameras and
faceLABTM passive stereo cameras observing the driver. (b) CeDAR: Cable Drive Active vision Robot in vehicle. Four cameras
are arranged in two stereo pairs. Cameras are fitted with polarizing filters and far-field cameras use glare hoods.
Using this system, Victor (2005) developed the Percentage
Road Centre (PRC) metric which integrates driver eye gaze
over time into a histogram to detect driver alertness. The group
used a trail of colored lights to lead the driver’s attention back
to the road when the PRC metric indicated a visual or cognitive
distraction preoccupying the driver. Since we are monitoring
the instantaneous gaze direction of the driver we prefer not to
cause rival visual stimuli to the driving task so we will use
auditory messages.
2.5. Judging Driver Behavior
The task of driving is often described as a tracking task (Gor-
don A. D. 1966� Land and Lee 1994). The driver interprets the
road scene primarily by vision and then applies the required
control signal to the vehicle to maintain the correct relative
position.
Gordon A. D. (1966) reported on a mathematical analy-
sis of the motion of the road scene to the driver. He con-
cluded that, while driving, the road appears in steady state to
the driver. Driving then becomes a lateral tracking (lane keep-
ing) problem. Road boundaries, not focus of expansion (as of-
ten thought), is the dominant cue for aligning the vehicle in
the lanes. If the vehicle is misaligned laterally the whole view
field moves as a result. Summala and Nicminen (1996) demon-
strated that peripheral vision was sufficient for short-term lane
keeping. When the driver is lane keeping the peripheral vision
is capable of verifying that small motions in the road scene
indicate that the vehicle is on track. When the vehicle starts
to diverge from the lane direction, the induced whole view
field motion alerts the driver to take direct notice. Correlat-
ing the driver eye gaze with the road scene this means that for
lane keeping the driver does not always need to fixate on the
road for safe driving. However, when the vehicle is misaligned
with the road ahead, such as during lane departures, the driver
would receive a strong visual cue to monitor the road position.
If the driver is not observing the road at this time, then this is
a significant indicator of inattention.
This leads to the question of where the driver would look
in the road scene for attentive lane tracking. In a clinical
trial Land and Lee (1994) investigated the correlation between
eye-gaze direction and road curvature. The group found that
the driver tended to fixate on the tangent of the road ahead.
Road scene features such as signs, pedestrians and obsta-
cles require foveated vision. Maltz and Shinar (2004) proved
that peripheral vision is insufficient for road hazard detection.
For our system, this means that to have seen a critical road ob-
ject the driver must have, at some stage, directed their eye gaze
directly at the object.
3. Developed Capabilities
The vehicle has been fitted with sensors to gather odometric
information as well as sensors for monitoring the driver’s ac-
tions such as strain gauges on the steering shaft, turning in-
dicator and brake sensors. The principle sensors used on the
vehicle are video cameras. Figure 6 shows the vision systems
configuration. Computing is done on-board the vehicle using
several standard desktop computers.
3.1. Gaze Monitoring in Vehicles
The vehicle is fitted with a faceLABTM eye-gaze tracking sys-
tem. faceLABTM is a driver monitoring system developed by
SeeingMachines (Seeing Machines 2001) in conjunction with

780 THE INTERNATIONAL JOURNAL OF ROBOTICS RESEARCH / June 2009
Fig. 7. The Distillation algorithm is composed of a Cue processor and a Particle filter running concurrently.
the Australian National University (ANU) and Volvo Tech-
nological Development. It uses a passive stereo pair of cam-
eras mounted on the dashboard to capture video images of the
driver’s head. These images are processed in real-time to de-
termine the 3D pose of the driver’s head (to �1 mm, �1�) as
well as the eye-gaze direction (to �1�). Blink rates and eye
closure can also be measured.
3.1.1. Lane Tracking
A common problem in lane tracking is road appearance
changes due to shadows, glare and road works (Pomerleau
and Jochem 1996� Bertozzi et al. 2000). With the exception
of the physical limits of the sensor, in order to achieve robust
lane tracking multiple methods of image processing need to be
undertaken and integrated based on the prevailing road con-
ditions. The generic Distillation algorithm was developed for
this purpose. The Distillation algorithm is a visual cue process-
ing framework (see Figure 7). The framework consists of two
cycles. The first cycle, the cue fusion cycle, performs a cost–
benefit analysis of the various visual cues to distill the com-
bination of cues which provide the best tracking discrimina-
tion. The second cycle is a particle filter (condensation algo-
rithm (Isard and Blake 1996)) to estimate the state distribution.
A detailed discussion of the algorithm is given in Apostoloff
and Zelinsky (2004). Figure 7 shows a typical lane estimate,
where the initial system has been extended to use a clothoidal
road curvature model and a covariance metric is used to in-
crementally vary the look ahead distance. The lane tracker has
been tested on data from a 1800 km round trip tracking the
road along a variety of road types without adjustment.
3.2. Obstacle Detection
The Distillation algorithm has also been applied in the ob-
stacle detection system. The obstacle detection system uses a
set of visual cues to segment and track obstacles. The detec-
tion phase of the system segments potential obstacles from the
stereo depth map, edge and motion images. These potential
obstacles are very rough guesses with many false positives.
These candidates are injected into the Distillation algorithm
mentioned above. True obstacles form clusters within the par-
ticle space, whereas false detects dissipate. Obstacle samples
are defined with respect to the lateral and longitudinal lane
positions, size and velocity. While the state space is in world
coordinates the sample evaluation is done by projecting back
into the sensor image space.
The following equation is used to evaluate each sample:
P�e� j�t �s
it � �
1
� � N
�
� �
N�
p
I� j�t �s�i�p �
�
� (1)
where s�i�p is the pth pixel from the set of pixels S generated by
particle i , I� j�t �s� is the value of pixel s from the observation
image I used for the j th cue, N is the number of pixels in the
region in image space, and � (set to 0�001) is used to support
the possibility that the sensor is in error. Figure 9 shows the
leading vehicle tracked by the algorithm.
3.3. Sign Recognition
Symbolic signs are detected by locating sign-like shapes in the
image stream. The system uses the fast radial symmetry oper-
ator (originally developed for eye detection (Loy and Zelinsky
2003)) with online image enhancement. The system was used
to effectively detect speed signs as they are the most frequent
signs encountered, but a similar method could be used to detect
symbolic road signs (Fletcher et al. 2005b). Figure 10 shows
the algorithm applied to circular signs in poor road condi-
tions.

Fletcher and Zelinsky / Driver Inattention Detection based on Eye Gaze–Road Event Correlation 781
Fig. 8. Lane tracking look ahead distance varies with certainty measured by the sample spread of the dominant mode.
3.4. Pedestrian Detection
A pedestrian detection system was developed by Grubb and
Zelinsky (2004) (see Figure 11). The system used stereo cam-
eras, V-disparity and support vector machines to achieve a
high false-negative rate. This system and the work of Viola
et al. (2005) has sponsored the development of a second sys-
tem by our project collaborators, the National ICT Australia
group (Rasolzadeh et al. 2006). Viola et al. (2005) imple-
mented a method of detecting pedestrians using Haar features
and Ada-boost3. The module is used to detect and track pedes-
trians for our assistance system.
3.5. Visual Monotony Estimation
A great irony of transport systems research is that advances
in road and vehicle safety can end up causing new threats to
road users. Thiffault and Bergeron (2003) found that the vi-
sual monotony is a key input to driver fatigue. Car manufactur-
ers and infrastructure authorities have collaborated to attenuate
3. Ada-boost is a method of taking a collection of weak classifiers and “boost-
ing” them so that together a combination of classifiers is derived that can
strongly classify the data set
stimulation from the off-driving tasks and ease the on-driving
task. An unfortunate consequence is that sections of road that
were once prone, for example, to head on collisions are be-
coming (after road upgrades) fatigue accident zones.
To automatically measure the visual monotony in a road se-
quence requires a metric of the variance (or information con-
tent) of the video sequence over time. Moving Picture Experts
Group (MPEG) encoding fills this requirement. MPEG ex-
ploits the property that in moving pictures only small regions
of the image actually change substantially between frames. En-
coding a set of frames over a sliding time window has shown
a strong correlation to a human judged monotony scale. One
failing of the MPEG compression as a monotony detector is
in situations of poor visibility such as fog. The task was not
monotonous yet the video will compress well. We use the lane
tracking look ahead distance to detect these types of cases.
We conducted day, dusk and night road trials. To investi-
gate how best to use MPEG encoding to represent monotony
we encoded a set of movies with varying sampling rates, ratios
and sequence lengths. Figure 12 shows a result of one trial.
Trends of smaller compression ratio (or increased monotony)
appear as the vehicle leaves the city for the highway and along
the country road in day and night trials. The lane tracking look
ahead distance is effective at identifying sections of road with
a lower monotony than expected by the MPEG compression

782 THE INTERNATIONAL JOURNAL OF ROBOTICS RESEARCH / June 2009
Fig. 9. Distillation algorithm tracking the leading vehicle. Left: Dominant mode projected onto the image. Right: Visualization
of the dominant mode in the particle space.
Fig. 10. Sign detection using Fast Radial Symmetry Transform (FRST). The bottom left corner shows the FRST image, where
the red crosses highlight detected signs.
alone (Fletcher et al. 2005a). The initial trials were later vali-
dated by a 1800 km round trip along a variety of roads and for
different traffic types. The metric was highly correlated with
the human-perceived monotony.

Fletcher and Zelinsky / Driver Inattention Detection based on Eye Gaze–Road Event Correlation 783
Fig. 11. Online pedestrian detection. The basis for the system used in the Automated Co-driver.
Fig. 12. MPEG compression and lane tracking look ahead during an afternoon trial on city and arterial roads. Sample images
from the camera are shown at the corresponding numbered points with the lane tracking look ahead distance. The different traces
in the graph represent various frame rate (0.5–4 Hz) and sliding time window (2.5–10 minute) combinations. Higher frame rates
capture periodic yet potentially monotonous scenes. Longer time windows smooth transient periods of little motion but add
latency to the monotony detection.
4. Driver Inattention Experiments
To investigate driver inattention detection we developed a
number of prototype systems:
� Road center inattention detection – A simple application
using the driver observation monitoring and the vehi-
cle speed alone. This system implements instantaneous
driver inattention detection using an assumed road cen-
ter.
� Road event inattention detection – This system inte-
grates a single road event source, namely speed signs,
with gaze monitoring to demonstrate the basic cases of
driver observation monitoring according to the matrix in
Table 2.

784 THE INTERNATIONAL JOURNAL OF ROBOTICS RESEARCH / June 2009
Table 2. Driver behavior matrix used by the system to
determine the appropriate state. OK: no action required.
INFO: provide on-screen reminder to operator. WARN:
provide auditory reminder to driver.
Driver “Seen” Missed Acknowledge
Driver Behavior OK OK INFO OK
Driver Behavior Not OK INFO WARN INFO
Fig. 13. The scene camera and gaze direction is analogous to a
two-camera system.
� Multiple road event inattention detection – The final
system integrates all available subsystems to demon-
strate our best approximation of a fully functional driver
inattention detection system.
Our approach is to consider the driving task as a closed loop
system involving the vehicle, driver and the road environment.
The system selected interventions according to the behavior
matrix in Table 2.
4.1. Correlating Eye Gaze with the Road Scene
Scene camera and eye configuration is analogous to a two-
camera system (see Figure 13). Gaze directions trace out
epipolar lines in the scene camera. If we had a depth esti-
mate of the driver’s gaze, we could project to a point in the
scene camera. Similarly, if we had the object depth we could
re-project on to the eye and estimate the required gaze. A depth
estimate of the gaze is hard to obtain. A common assumption
is that the gaze angle and angle in the scene camera are the
same. In practice this assumption amounts to supposing that
either the scene camera is sufficiently close to the driver’s head
(equivalent to a trivial baseline) or that the objects of interest
are near infinity (Land and Lee 1994� Takemura et al. 2003�
Ishikawa et al. 2004). In these cases error bounds on the gaze
direction (not fixation duration) are infrequently used and even
less frequently justified.
The object depth could be estimated using a second scene
camera running the same detection software or assumptions
on object size and/or road layout. However, it is desirable to
maintain flexibility of the implemented object detection sys-
tems which could use a single camera and have no strong as-
sumptions on the object scale. If we assume that the depth of
the object is unknown, we can instead model the effect of the
disparity error in our confidence estimate.
The effect of an unknown stereo disparity will be a dis-
placement along the epipolar line defined by the gaze direc-
tion on to the scene camera. The disparity, as with any stereo
configuration, will be most apparent for close objects and re-
duce by a 1�x relationship with distance from the baseline. The
angular deviation reduces as the angle becomes more obtuse.
To get an upper bound of the likely disparity deviation we can
compute the worst-case disparity for our camera configuration.
With reference to Figure 13, and using the scene camera center
as a world reference frame, the scene camera and gaze angles
for a sign at �Xsign� Ysign� Zsign� can easily be derived:
�� � �� cam � � gaze�
� arctanXsign
Zsign
� arctanXsign � Xgaze
Zsign � Zgaze
� (2)
� � �cam � gaze�
� arctanYsign
Zsign
� arctanYsign � Ygaze
Zsign � Zgaze
� (3)
The worst-case disparity then translates to when the object is
closest to the vehicle on the driver’s side of the road, equiv-
alent to an object on the right shoulder of a single-lane road
(note that our system is in a right-hand drive vehicle). The
field of view of the scene camera limits the closest point at
which the object is visible. The closest visible object is at
��3�0��1�6� 8�0� for the 50� field of view of the camera. The
worst-case height of the object relative to the scene camera,
�1�6, would be when it is on the ground (this is worse than
any actual case as the object would not be visible due to the
bonnet). With pessimistic estimates of the driver (far) eye po-
sition relative to the scene camera manually measured to be
�Xgaze � 0�22� Ygaze � 0�1� Zgaze � 0�2�, the final errors be-
come
�� � �� cam � � gaze� � �20�6� � 18�7�� � 1�9�� (4)
� � �cam � gaze� � �11�3� � 10�4�� � 0�9�� (5)

Fletcher and Zelinsky / Driver Inattention Detection based on Eye Gaze–Road Event Correlation 785
Therefore, the worst expected deviation due to stereo disparity
is �1�9� horizontally and �0�9� vertically, which is on a par
with other error sources in the system. The expected deviation
for the majority of cases where the sign is further away is sig-
nificantly less. The deviation is twice as large in the horizontal
direction, implying that a suitable approximation of the toler-
ance region will be an ellipse with a horizontal major axis.
To determine the overall tolerance of the system, two fur-
ther factors need to be accommodated. The gaze tracking sys-
tem has an accuracy of �3� and the field of view of the
foveated region of the eye is estimated to be around �2�6�
(Wandell 1995). The accumulated tolerance is the sum of these
sources which for our experimental setup comes to�7�5� hor-
izontally and �6�6� vertically. This allows us to claim that the
driver was very unlikely to have seen the object if the object
and gaze directions deviate by more than this tolerance.
Verifying the Foveated Field of View
To get a sense of the field of object discrimination ability of the
driver, a simple trial was constructed using a desktop PC. Wan-
dell (1995) states the foveated region of the eye to be around
�2�6�, although a substantial cone density exists up to around
20�. A simple program was made to present speed signs featur-
ing varying speeds to the subject at different positions on the
screen. Highway road footage was shown in the background
to add a small amount of realism to the scene. The test sub-
ject was asked to fix their gaze on a stationary cross on the
screen and to press the corresponding number on the keypad
to match the presented sign. If the subject broke their gaze or
otherwise invalidated the trial, they pressed no key or “0” and
the result was discarded. Figure 14 presents a typical screen-
shot from the test program. A set of five subjects with normal
(or corrected) eye sight were each presented with 200 signs
(100 fixating to the left, 100 fixating toward the right). The re-
sults (see Figure 15) show that reliable discrimination ability
drops off at over 4� from the fixation point. The use of the trial
was to provide a rule of thumb for the discrimination ability
of the driver in the context of the road objects. The estimated
field of discrimination will be used to judge whether the driver
would be able to see a particular road object.
In-vehicle Verification
We conducted a verification experiment to test that the system
was indeed going to be able to detect whether the driver missed
an object. The driver was asked to fix their gaze on an object in
the scene. A sign was then placed at a certain distance from the
fixation point. The driver was then asked to identify the object.
The object was one of eight possibilities. The proportion of
correct classifications was logged along with the driver-gaze
angle and apparent sign position in the scene camera. 30 m,
Fig. 14. Screen-shot of PC test application to gather data on
gaze object recognition field of view. A test subject is re-
quested to fix their gaze on the cross. The Speed sign peri-
odically varies in position and speed (10,20,30,...,90). A road
video sequence was played in the background to add context
for the trials. The subject entered the “guessed” sign via a nu-
meric keypad (“1”–“9”).
20 m and 10 m depths were tested against four different dis-
placements between the object and fixation point. The object
size was 0�45 m in diameter. For each combination of depth
and displacement, ten trials were done.
Figure 16 shows the driver’s object classification error rate
versus the angle between gaze and object position. Expected
recognition rates fall as the object becomes more peripheral
in the driver’s field of view. The results of this trial verify our
expectation that, while it is hard to prove the driver saw an
object, it is possible to estimate, with reasonable confidence,
when the driver was unlikely to have seen the object. A curious
effect was noticed (represented by a cross in the middle of the
graph) when the driver was very close to the object. The large
apparent size of the object in the driver’s field of view seemed
to aid the recognition rate. However, this only occurred when
objects were close to the vehicle, which is not when drivers
typically see road objects. The driver reported not consciously
being able to see the object in this case.
This verification demonstrates the expected strength of the
system: the ability to detect when the driver has missed an ob-
ject. It is impossible to determine whether the driver saw the
object, as, even with perfect measurement of a perfect gaze di-
rection match, the driver’s attention and depth of focus cannot
be determined. If the driver is looking in the direction of the
object, it is an ambiguous case whether the driver noticed the
object, thus no warning is issued.

786 THE INTERNATIONAL JOURNAL OF ROBOTICS RESEARCH / June 2009
Fig. 15. Gaze PC test error rate. Above a 4�5� angle from the fixation point the test subjects were recognizing one in two signs
correctly.
Fig. 16. Driver recognition rate of objects in peripheral vision
for various depths. The dotted horizontal line shows expected
value due to chance. The vertical dashed line represents�7�5�
derived tolerance. Squares, 30 m points� circles, 20 m points�
crosses, 10 m points.
4.2. Assistance System Design
The Automated Co-drivers can be thought of (and are imple-
mented) as instances of the Advanced Driver Assistance Sys-
tems (ADAS) logic engine shown in Figure 17.
4.3. Road Centre Inattention Detection
The first system was developed to demonstrate the benefits of
the immediacy of direct driver gaze monitoring. Previous sys-
tems used in simulation or road trials have used metrics such as
the variance in steering wheel movements to gauge the fatigue
level of the driver. Because these systems compute statistics
over time, there is a significant lag between driver inattention
and action by the system. Online real-time driver gaze moni-
toring can easily be used to detect short periods of driver dis-
traction.
Similar to the percentage road center metric (Victor 2005),
driver gaze can be analyzed to detect even shorter periods of
driver distraction. The faceLABTM system readily allows the
implementation of an online distraction detector. The gaze di-
rection is used to reset a counter. When the driver looks for-
ward at the road scene, the counter is reset. As the driver’s gaze
diverges, the counter begins. When the gaze has been diverted
for more than a specific time period, a warning is given. The
time period of permitted distraction is a function of the speed
of the vehicle. As the speed increases, the permitted time pe-
riod could drop off either as the inverse (reflecting time to im-
pact) or the inverse squared (reflecting the stopping distance).
We use the inverse square. Once the driver is observed to have
had a stable gaze at the road ahead, the counter and the warn-
ing is reset until the next diversion. As the vehicle speed is
considered, normal driving does not raise the alarm since dra-
matic movements such as over the shoulder head checks occur
at slow speeds, and the overted gaze tolerance is longer. Situa-
tions when the vehicle is not moving, such as waiting to merge,
permit the driver to look away from the road ahead indefinitely
without raising the alarm.
Using the faceLABTM system, we monitor driver head pose
and eye-gaze direction via the driver state engine. The watch-
dog timer inside the driver state engine will be used to verify
whether the driver has not looked at the road for a significant
period of time. An auditory warning is given if the driver is
seen to be inattentive.

Fletcher and Zelinsky / Driver Inattention Detection based on Eye Gaze–Road Event Correlation 787
Fig. 17. Implemented ADAS software component architecture.
Fig. 18. Road scene inattention detection Automated Co-driver screen-shot.
On-road Trials
Figure 19 is a sequence of screen-shots showing the typical
response with a distracted driver. Once the distraction thresh-
old is crossed for the given speed, audio warnings increase
until the driver looks forward again. Then the warnings are re-
set until next time. One conclusion from the trials was that a
road position estimate would help the system. In some cases,
when the road had significant curvature, the system was trig-
gered because the gaze direction was substantially away from
the straight ahead position.

788 THE INTERNATIONAL JOURNAL OF ROBOTICS RESEARCH / June 2009
Fig. 19. Road scene inattention detection sequence. Circles represent driver gaze. (a) Driver looking forward. (b) Driver looking
at right mirror, alarm sounding. (c) Driver still distracted, alarm louder. (d) Driver gaze has returned to the road ahead, alarm
silenced.
4.4. Road Event Inattention Detection
In this system an autonomous detection system recognizes a
road event, in this case a speed sign. At the same time, a driver
monitoring system verifies whether the driver has looked in
the direction of the road sign. If it appears that the driver is
aware of the road sign, the information can be made available
passively to the driver. If it appears that the driver is unaware
of the information, an auditory warning is generated.
For this case, if the driver appears to have seen a speed
sign, the current speed limit can be simply recorded on the
dashboard adjacent to the speedometer. However, if it appears
that the driver has not looked at the road sign and, over time,
a speed adjustment is expected and has not occurred, a more
prominent warning would be given. This still leaves the driver
in control of the critical decision, but supports them in a way
that aims not to be overly intrusive. Warnings are only given
when the driver is not aware of the change of conditions.
Finally, the warning can also be cancelled by observing the
driver: a glance at the speedometer confirms that the driver is
aware of their speed and the new detected limit.
Using the reasoning in Section 4.1, the worst expected de-
viation due to stereo disparity is�1�9� horizontally and�0�9�
vertically which is on a par with other error sources in the sys-
tem. The expected deviation for the majority of cases where
the sign is further away is significantly less. The deviation is
twice as large in the horizontal direction, implying that a suit-
able approximation of the tolerance region will be an ellipse
with a horizontal major axis.
To determine the overall tolerance of the system, two
further factors need to be accommodated. The gaze track-
ing system has an accuracy of �3� and the field of view
of the foveated region of the eye is estimated to be around
�2�6� (Wandell 1995). The accumulated tolerance is the sum
of these sources, which for our experimental setup comes to
�7�5� horizontally and �6�6� vertically. This allows us to
claim that the driver was very unlikely to have seen the sign
if the sign and gaze directions deviate by more than this toler-
ance.
To correlate the eye gaze with the sign position, the his-
tories of the two information sources are examined. The sign
detection sub-system provides a history of the sign location

Fletcher and Zelinsky / Driver Inattention Detection based on Eye Gaze–Road Event Correlation 789
Fig. 20. Screen-shot showing “60” sign detected and seen by driver. Top left: Live video showing eye gaze (large circles) and
status (overlaid text). Bottom left: Last detected sign (small circles) and eye gaze (large circles). Top right: 3D model of cur-
rent vehicle position, eye gaze (oversize head) and sign location. Bottom right: Current detected speed limit, vehicle speed,
acceleration and count down for speeding grace period in frames.
since detected. This includes all frames from when the sign
was first detected before the sign was able to be verified or
classified. Similarly, the faceLABTM data provides the histor-
ical head pose and gaze direction. When a sign has been clas-
sified, the sign angles and gaze directions are checked back
in time to when the sign was first detected. If the angles from
any previous frame fall within the tolerance, the sign is re-
ported as being seen by the driver. If the angles never coin-
cide, the sign is reported as missed. The system provides a
4 second tolerance for the driver to achieve the speed limit.
The timer is instigated when the measured speed exceeds the
limit and the measured acceleration is not significantly decrea-
sing.
On-road Trials
The system was able to detect speed signs around the Uni-
versity and evaluate the implications for the driver. Figure 20
shows a screen-shot of the system demonstrating a typical
case. Figures 21 and 22 illustrate the primary scenarios en-
countered. In Figure 21(a) the driver was watching a pedes-
trian and failed to notice a “40” sign. The Automated Co-driver
has detected that the driver did not see the sign and has issued
a red sign: missed! warning. Figure 21(b) shows an instance
where an “80” sign was detected� the driver saw the sign and
the vehicle was not speeding so no red warning was issued.
Similarly, in Figure 22(a) a “40” sign was detected. The driver
saw the sign, the system assumed the driver was intentionally
speeding so a warning was displayed but no sound alert gener-
ated. In Figure 22(b) the driver has missed the last sign and is
speeding for more than a predefined grace period without de-
celerating. The SLOW DOWN! warning is shown and an alert
sound issued.
Figure 23 shows the sign and the gaze direction separa-
tion angle for typical signs classified as “seen” by the system.
Note the troughs in the separation angle graphs reflecting times
when the driver looked toward the sign.
At one location in the test area there was a speed sign just
past an entry road to the University. Due to the intersection
geometry and a bend shortly along the entry road the road sign,
while in plain view on the road shoulder, was not prominent.
After passing the sign the drivers were asked whether they saw
the sign, and none of them did. Figure 24 shows the sign and
the gaze direction separation angle for three test drivers. The
system classifies these signs as missed. Notice the lack of di-

790 THE INTERNATIONAL JOURNAL OF ROBOTICS RESEARCH / June 2009
Fig. 21. The two columns are typical cases for the speed sign inattention system when the vehicle was not speeding. (a) The
system detected that the driver most likely missed the road sign. (b) The driver most likely observed the sign. Top row: Live
video feeds showing current view, eye gaze (dots/large circles) and current status (overlaid text) during screen-shot. Bottom row:
Last detected signs (small circles) and eye gaze during detection (dots/large circles). The small circles on the hood and in the sky
in the bottom row are due to a rendering bug at the time of test. They coincide with stale returns that had a strong momentary
circular return but failed classification.
rected gaze toward the sign, instead gaze is steady on the road
and merging traffic to the right.
In Figure 25 some border line sign gaze angle separation
cases are shown. There appears to be some directed eye move-
ment but the angle is greater than the angle error tolerance.
Watching the gaze and sign detection it becomes obvious that
the sign may be read well before the sign is detectable in the
image. The driver eye with much better acuity than the video
camera can recognize the sign further away.
To address this case we projected the sign position back
according to the recent vehicle egomotion. The sign–gaze sep-
aration angle was then taken as the minimum distance to this
path. Figure 26 shows the projected paths and the revised sign–
gaze angle separation. Now we see that Figures 26(a) and (b)
are classified as seen and (c) remains classified as missed. Sim-
ilar to Figure 24, in Figure 26(c) the sign is on a bend in the
road so the sign location remains on the left of the camera im-
age.
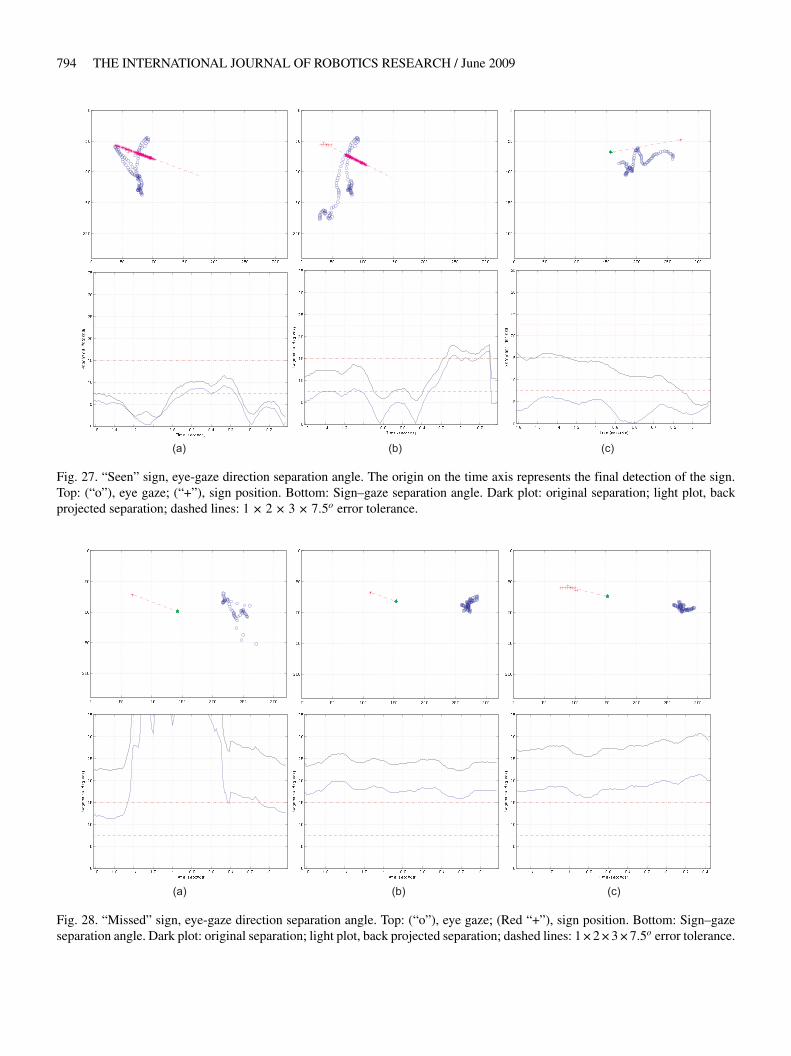
For completeness we include Figures 27 and 28 showing
the impact of the back projection of the “seen” and “missed”
signs. The classifications remain unchanged.
4.5. Multiple Road Event Inattention Detection
The final experiment is an integration of the subsystems out-
lined above. That is, visual monotony estimation, sign reading,
lane tracking, vehicle detection and pedestrian detection com-
bined with driver gaze monitoring.
Road Departure Calculation
To determine whether the vehicle will depart the lane we use
the intersection of the estimated lane geometry with the Ack-

Fletcher and Zelinsky / Driver Inattention Detection based on Eye Gaze–Road Event Correlation 791
Fig. 22. Typical cases for speed the sign inattention system when the vehicle was speeding. Left: Live video feed showing current
view, eye gaze ( dots/large circles) and current status (overlaid text) during screen-shot. Right: Last detected sign (small circles)
and eye gaze (dots/large circles).
erman motion model of the vehicle (see Figure 29). The inter-
section point provides a time until departure estimate assuming
that the driver maintains the current steering angle. To find this
point we solve the lane model and Ackerman equations nu-
merically to find the arc length to departure and, for a known
speed, the time until departure.
To determine whether a lane departure is intentional we
use the departure point, the turning indicators and the driver
eye gaze. If the turning indicators are operating and the lane
departure point is in the same direction the warning is sup-
pressed. The warning is also suppressed if the driver gaze has
been sufficiently close to the departure point. If neither of these
criteria are met an auditory warning is given.
On-line Road Trials
Now follows some illustrative cases of the combined sys-
tem. Like all of our systems the interface is for the experi-
menter not the driver, as audio warnings and gaze cancella-
tion provide the interface to the driver. The application cycles
through a decision tree to determine possible alerts. First po-
tential pedestrian collisions, then obstacles then lane depar-
tures are verified. Then sign events, inattention, vehicle sta-
tus and finally monotony events are checked. Alerts are given
with unique sounds. Approaching obstacles and pedestrians
observed by the driver are not warned, nor are lane departures
provided the driver is indicating or has gazed in the departure
direction.
Figure 30 shows the Automated Co-driver detecting a speed
sign. The vehicle was not speeding so no warning was given.
The system detects an acknowledgement when the driver looks
at the speedometer anyway.
Figure 31 shows inattention detected by gaze monitoring.
A glance back at the road resets the inattention alarm.
In Figure 32 the inattention alarm has been reset although
now the driver is speeding. Direct driver observation enabled
the system to verify that the speed sign had been observed so
a visual warning is given, the auditory alarm is suppressed.

792 THE INTERNATIONAL JOURNAL OF ROBOTICS RESEARCH / June 2009
Fig. 23. “Seen” sign, eye-gaze direction separation angle. The origin on the time axis represents the final detection of the sign.
Top: (“o”), eye gaze� (“+”), sign position. Bottom: Sign–gaze separation angle. Dashed lines: 1 2 3 7�5o error tolerance.
Fig. 24. “Missed” sign, eye-gaze direction separation angle. Top: (“o”), eye gaze� (“+”), sign position. Bottom: Sign–gaze sepa-
ration angle. Dashed lines: 1 2 3 7�5o error tolerance.

Fletcher and Zelinsky / Driver Inattention Detection based on Eye Gaze–Road Event Correlation 793
Fig. 25. “Borderline” sign, eye-gaze direction separation angle. Top: (“o”), eye gaze� (“+”), sign position. Bottom: Sign–gaze
separation angle. Dashed lines: 1 2 3 7�5o error tolerance.
Fig. 26. Sign position projected back in time to estimate sign–gaze direction separation angle before the sign was large enough
to track. Top: (“o”), eye gaze� (“+”), sign position� (“*”), projected gaze point on sign path. Bottom: Sign–gaze separation angle.
Dark plot: original separation� light plot, back projected separation� dashed lines: 1 2 3 7�5o error tolerance.
794 THE INTERNATIONAL JOURNAL OF ROBOTICS RESEARCH / June 2009
Fig. 27. “Seen” sign, eye-gaze direction separation angle. The origin on the time axis represents the final detection of the sign.
Top: (“o”), eye gaze� (“+”), sign position. Bottom: Sign–gaze separation angle. Dark plot: original separation� light plot, back
projected separation� dashed lines: 1 2 3 7�5o error tolerance.
Fig. 28. “Missed” sign, eye-gaze direction separation angle. Top: (“o”), eye gaze� (Red “+”), sign position. Bottom: Sign–gaze
separation angle. Dark plot: original separation� light plot, back projected separation� dashed lines: 1237�5o error tolerance.

Fletcher and Zelinsky / Driver Inattention Detection based on Eye Gaze–Road Event Correlation 795
Fig. 29. The current lane departure point is found at the intersection of the estimated lane geometry and the vehicle motion model.
Fig. 30. Co-driver DAS screen-shot. Circles represent driver gaze. (a) Sign detected. (b) Driver glanced at speedometer.

796 THE INTERNATIONAL JOURNAL OF ROBOTICS RESEARCH / June 2009
Fig. 31. Screen-shots of the Automated Co-driver. Prolonged
inattention detected. Large circles: no circles are shown in
this case as the driver’s gaze is outside the field of view of
the camera (consistent with the driver inattention detected).
Fig. 32. Screen-shots of the Automated Co-driver. Vehi-
cle speeding, although last speed sign was observed by the
driver. Large circles: driver gaze.
Fig. 33. A sequence of screen-shots of the Automated Co-driver. A lane departure that was seen by the driver is shown. Large
circles: driver gaze.
Figures 33 and 34 demonstrate cases of detected lane de-
partures. Direct driver observation enables the Automated Co-
driver to permit the driver to depart the lane in the sequence in
Figures 33.
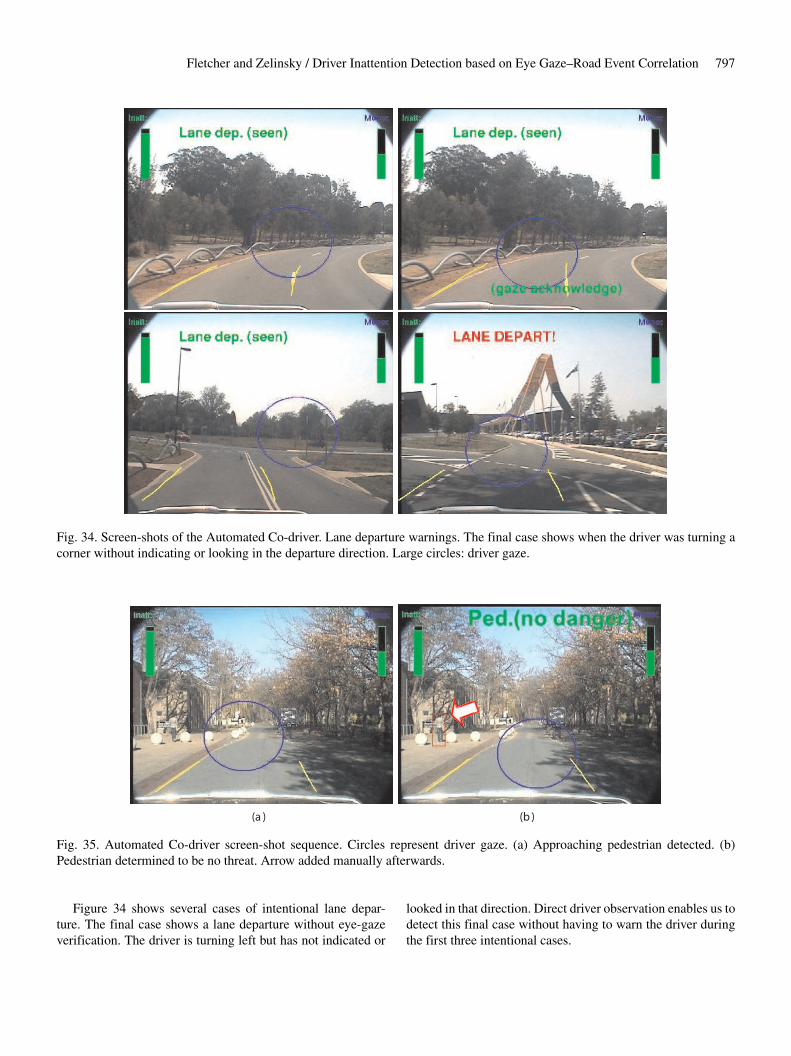
Fletcher and Zelinsky / Driver Inattention Detection based on Eye Gaze–Road Event Correlation 797
Fig. 34. Screen-shots of the Automated Co-driver. Lane departure warnings. The final case shows when the driver was turning a
corner without indicating or looking in the departure direction. Large circles: driver gaze.
Fig. 35. Automated Co-driver screen-shot sequence. Circles represent driver gaze. (a) Approaching pedestrian detected. (b)
Pedestrian determined to be no threat. Arrow added manually afterwards.
Figure 34 shows several cases of intentional lane depar-
ture. The final case shows a lane departure without eye-gaze
verification. The driver is turning left but has not indicated or
looked in that direction. Direct driver observation enables us to
detect this final case without having to warn the driver during
the first three intentional cases.

798 THE INTERNATIONAL JOURNAL OF ROBOTICS RESEARCH / June 2009
Fig. 36. (a) Approaching pedestrian detected. (b) Pedestrian seen by driver. Arrow added manually afterward.
Fig. 37. Sequence of screen-shots of the Automated Co-driver showing a monotony warning occurring. Large circles: driver gaze.

Fletcher and Zelinsky / Driver Inattention Detection based on Eye Gaze–Road Event Correlation 799
Fig. 38. (a) Gaze change at 19.3 seconds then intended lane
change at 19.9 seconds. (b) Gaze change at 44.9 seconds then
intended lane change at 45.3 seconds. (Green “o” and lines),
sampled gaze error extents projected onto ground plane� (Red
“x” and lines), sampled lane position and width.
Figures 35 and 36 show cases where direct driver observa-
tion enabled the system to verify that the pedestrian threat had
been observed, so an alert could be suppressed.
Finally, Figure 37 demonstrates a case of a visually
monotonous stretch of highway. Visual monotony is detected
after several minutes of monotonous road conditions. A vi-
sual alert is given indicating the heightened fatigue risk in this
scenario. The monotony is broken as the driver approaches a
slower vehicle.
Figure 38 shows the lane estimate with gaze direction pro-
jected onto the ground plane. In these cases the driver eye
Fig. 39. Unintended lane change. No discernable gaze change
to correlate with lane change at 20.6 seconds. Driver reverts to
the original lane at 21.4 seconds. (Green “o” and lines), sam-
pled gaze error extents projected onto ground plane, (Red “x”
and lines), sampled lane position and width.
gaze shifts focus to the destination lane before the lane change.
These cases are detected as intended lane changes.
In contrast Figure 39 shows an unintended lane change. The
vehicle moves into the adjacent lane without an eye-gaze tran-
sition. The system reports this case as an unintended lane de-
parture. The driver then corrects lane position bringing the ve-
hicle back into the original lane.
Strong direct sunlight caused some uncertainty in the lane
tracking and, at times, even disrupted the gaze tracking. When
gaze tracking was strong and the driver was attentive at the lane
center, uncertainty in the road scene vision did not warrant a
warning.
Due to the safety requirements of the vehicle the trial
drivers were staff and students of the group but not specifically
of this research. The constraint made it hard to detect genuine
inattentive behaviour. Nonetheless, the system performed as
intended during the trials and did produce occasional warnings
during other times which were likely to be genuine warnings
of inattentiveness.
5. Conclusion
Observing the complementary strengths and weaknesses of hu-
mans and autonomous systems, it is reasonable that an integra-
tion of the two provides the best hope to improve road safety,
thus combining the flexibility and frailty of human drivers with
the tirelessness and inflexibility of automated systems. Our
conjecture was that a system capable of estimating what the

800 THE INTERNATIONAL JOURNAL OF ROBOTICS RESEARCH / June 2009
driver has seen (the driver’s observations) is key to addressing
driver inattention – a common underlying factor in many road
fatalities.
The use of driver eye gaze combined with road events to
estimate the to driver’s observations was developed and the
feasibility of the approach was verified. Due to the “looking
but not seeing” case, it is not possible to determine that road
events are seen for certain by the driver. However, it was shown
that road events almost certainly missed by the driver could be
identified.
The systems correlate the driver eye gaze with road scene
events to estimate the driver’s observations. The benefit of
driver observation monitoring was also demonstrated to sup-
press redundant warnings and cancel warning “with a glance”.
These systems have the potential to provide the detection or
earlier warning of missed road events. The timely knowledge
of these missed events would hopefully provide the precious
extra seconds for human reaction time.
References
Amditis, A. et al. (2006). System architecture for integrated
adaptive HMI Solutions. Proceedings of IEEE Intelligent
Vehicles Symposium. June, pp. 388–393.
Apostoloff, N. and Zelinsky, A. (2004). Vision in and out of
vehicles: integrated driver and road scene monitoring. Inter-
national Journal of Robotics Research, 23(4-5): 513–538.
ATSB (2004). Australian Transport Safety Bureau, Serious in-
jury due to road crashes: road safety statistics report. Tech-
nical Report, Australian Government.
ATSB (2006). Australian Transport Safety Bureau, Fatal Road
Crash Database. http:www.atsb.gov.auroadfatal_road_
crash_database.aspx.
Bertozzi, M., Broggi, A. and Fascioli, A. (2000). Vision-based
intelligent vehicles: State of the art and perspectives. Ro-
botics and Autonomous Systems, 32: 1–16.
Carsten, O. and Tate, F. (2001). Intelligent speed adaptation:
The best collision avoidance system? Proceedings of the
17th International Technical Conference on the Enhanced
Safety of Vehicles, June, Amsterdam.
DARPA (2004). Defense Advanced Research Projects
Agency, Grand Challenge 2004. http://www.darpa.mil/
grandchallenge04/index.htm.
DARPA (2005). Defense Advanced Research Projects
Agency, Grand Challenge 2005. http://www.darpa.mil/
grandchallenge05/index.htm.
DARPA (2007). Defense Advanced Research Projects
Agency, Grand Challenge 2007. http://www.darpa.mil/
grandchallenge.
Dickmanns, E. D. and Graefe, V. (1988a). Applications of dy-
namic monocular machine vision. Machine Vision and Ap-
plications, 1(4): 241–261.
Dickmanns, E. D. and Graefe, V. (1988b). Dynamic monocu-
lar machine vision. Machine Vision and Applications, 1(4):
223–240.
Fletcher, L., Petersson, L., and Zelinsky, A. (2005a). Road
Scene Monotony Detection in a Fatigue Management
Driver Assistance System. Proceedings of the IEEE Intelli-
gent Vehicles Symposium.
Fletcher, L. et al. (2005b). Correlating driver gaze with the
road scene for driver assistance systems. Robotics and Au-
tonomous Systems, 52(1): 71–84.
Franke, U. et al. (1998). Autonomous driving approaches
downtown. IEEE Intelligent Systems, 9(6): 40–48.
Franke, U. and Heinrich, S. (2002). Fast obstacle detection for
urban traffic situations. IEEE Transactions on Intelligent
Transportation Systems, 3(3): 173–181.
Gerdes, J. C. and Rossetter, E. J. (2001). A unified approach to
driver assistance systems based on artificial potential fields.
Journal of Dynamic Systems, Measurement and Control,
123(3): 431–438.
Gordon, A. D. (1966). Perceptual basis of vehicular guidance.
Public Roads, 34(3): 53–68.
Grubb, G. and Zelinsky, A. (2004). 3D vision sensing for im-
proved pedestrian safety. Proceedings of the IEEE Intelli-
gent Vehicles Symposium. June, pp. 19–24.
Haworth, N. L., Triggs, T. J. and Grey, E. M. (1988). Driver fa-
tigue: Concepts, measurement and crash countermeasures.
Technical Report, Federal Office of Road Safety Contract
Report 72, Human Factors Group, Monash University, De-
partment of Psychology.
Holzmann, F. et al. (2006). Introduction of a full redundant
architecture into a vehicle by integration of a virtual driver.
Proceedings of the IEEE Intelligent Vehicles Symposium,
June, pp. 126–131.
Hsu, S.-H. and Huang, C.-L. (2001). Road sign detection and
recognition using matching pursuit method. Image and Vi-
sion Computing, 19: 119–129.
Isard, M. and Blake, A. (1996). Contour tracking by stochastic
propagation of conditional density. Proceedings of the Eu-
ropean Conference on Computer Vision, April, Vol. 1, pp.
343–356.
Ishikawa, T., Baker, S. and Kanade, T. (2004). Passive driver
gaze tracking with active appearance models. Proceedings
of the 11th World Congress on Intelligent Transportation
Systems. October.
Labayrade, R., Aubert, D. and Tarel, J.-P. (2002). Real time
obstacle detection in stereovision on non flat road geom-
etry through v-disparity representation. Proceedings of the
IEEE Intelligent Vehicle Symposium, France, June, pp. 646–
651.
Land, M. and Lee, D. (1994). Where we look when we steer.
Nature, 369(6483): 742–744.
Loy, G. and Zelinsky, A. (2003). Fast radial symmetry
for detecting points of interest. IEEE Transactions on Pat-
tern Analysis and Machine Intelligence, 25(8): 959–973.

Fletcher and Zelinsky / Driver Inattention Detection based on Eye Gaze–Road Event Correlation 801
Maltz, M. and Shinar, D. (2004). Imperfect in-vehicle collision
avoidance warning systems can aid drivers. Human Factors,
46(2): 357–366.
Matsumoto, Y., Heinzmann, J. and Zelinsky, A. (1999). The
essential components of human-friendly robots. Proceed-
ings of the International Conference on Field and Service
Robotics FSR’99, August, pp. 43–51.
Neale, V. L. et al. (2005). Overview of the 100-Car Natural-
istic study and findings. Proceedings of the International
Conference on Enhanced Safety of Vehicles, June.
OECD (2006). Organisation for Economic Co-operation and
Development, Factbook 2006 – Economic, Environment
and Social Statistics: Quality of life. http://www.sourcecd.
org, December.
OECD/ECMT (2006). Ambitious Road Safety Targets and the
Safe System Approach, OECD Publishing.
Pomerleau, D. and Jochem, T. (1996). Rapidly adapting ma-
chine vision for automated vehicle steering. IEEE Expert:
Special Issue on Intelligent Systems and their Applications,
11(2): 19–27.
Rasolzadeh, B., Petersson, L. and Pettersson N. (2006). Re-
sponse binning: improved weak classifiers for boosting.
Proceedings of the IEEE Intelligent Vehicles Symposium,
June, pp. 344–349.
Regan, M. A. (2005). Keynote address. Proceedings of the
Australasian College of Road Safety (acrs), NSW Joint
parliamentary standing committee (Staysafe) International
Conference on Driver Distraction, June, pp. 29–73.
Seeing Machines (2001). FaceLAB: A face and eye tracking
system. http:www.seeingmachines.com.
Stutts, J. et al. (2001). The role of driver distraction in traffic
crashes. Technical Report, Foundation for Traffic Safety,
USA.
Summala, H. and Nicminen, T. (1996). Maintaining lane posi-
tion with peripheral vision during in-vehicle tasks. Human
Factors, 38: 442–451.
Takemura, K. et al. (2003). Driver monitoring system based on
non-contact measurement system of driver’s focus of visual
attention. Proceedings of the IEEE Symposium on Intelli-
gent Vehicles, June, pp. 581–586.
Thiffault, P. and Bergeron, J. (2003). Monotony of road en-
vironment and driver fatigue: a simulator study. Accident
Analysis and Prevention, 35: 381–391.
Thrun, S. et al. (2006). Stanley: the robot that won the DARPA
Grand Challenge. Field Robotics, 23(9): 661–692.
Treat, J. et al. (1979). Tri-level study of the causes of traffic
accidents: �nal report – executive summary. Technical Re-
port DOT-HS-034-3-535-79-TAC(S), Institute for Research
in Public Safety, University of Indiana, USA.
Trivedi, M. M., Gandhi, T., and McCall, J. (2005). Looking-
in and looking out of a vehicle: selected investigations in
computer vision based enhanced vehicle safety. IEEE In-
ternational Conference on Vehicular Electronics and Safety,
October, pp. 29–64.
Victor, T. (2005). Keeping eye and mind on the road. Ph.D.
Thesis, Department of Psychology, Uppsala University,
Sweden.
Viola, P., Jones, M. J. and Snow, D. (2005). Detecting pedestri-
ans using patterns of motion and appearance. International
Journal of Computer Vision, 63(2): 153–161.
Wandell, B. A. (1995). Foundations of Vision. Sunderland,
USA, Sinauer Associates.
WHO (2001). World health report. Technical Report, World
Health Organisation, http://www.who.int/whr2001/2001/
main/en/index.htm.