Driven by Data
46
July 2021 Driven by Data Using licensure tests to build a strong, diverse teacher workforce
Transcript of Driven by Data

July 2021
Driven by Data Using licensure tests to build a strong diverse teacher workforce
C O N T E N T S
Introduction
Data collection amp methodology
The three hallmarks of a strong testing system
Analysis Best-attempt pass rate
First-attempt pass rate
Walk-away rates
Three or more attempts
Pass rates by admissions selectivity
Pass rates by socioeconomic factors
Supporting candidates of color
Supporting program improvement
Explore your statersquos data
Recommendations A vision for what is possible
3
5
10
15 16
17
19
20
21
22
24
27
29
32
NCTQ Driven by Data | Using licensure tests to build a strong diverse teacher workforce (2021) 3
I N T R O D U C T I O N
The nation needs a strong diverse teacher workforce to fulfill its promise of equal
opportunity for all The quality of the teacher workforce is of paramount importance in
the early grades a time when teachers bear an extraordinary responsibility for laying the
foundational skills that will not only determine studentsrsquo success in later grades but also in
their future lives1
Building a strong diverse teacher workforce in sufficient numbers requires us to
understand the points along the pathway into the teaching profession where we are
most likely to lose aspiring teachers Currently policymakers state education agencies
and teacher prep programs have limited insight into the obstacles along this pathway
largely due to incomplete or inaccurate data This makes it hard to identify when and why
prospective teachers particularly persons of color elect not to consider teaching or having
started down the pathway exit prematurely
In this study NCTQ focuses on a pivotal point for elementary teachers when teacher
candidates take their licensure tests on the content knowledge defined by states as
necessary for the job of teaching States generally expect elementary teachers to have
foundational knowledge in Englishlanguage arts mathematics science and social studies
Low rates of candidates passing licensure tests especially for candidates of color have
become the subject of considerable debate in states across the country and have some
states questioning their testing regimes2 These low pass rates present a challenge for
policymakers and educator preparation programs working to both diversify the profession
and also ensure that every classroom is staffed with a well-prepared teacher
Elementary teacher candidates regardless of race and ethnicity are too often poorly
prepared and supported to pass their state licensure tests The data in this report shows
55 of test takers failing on their first attempt in states that use a well-structured licensure
test which does not exempt some candidates nor allows a candidates high score in one
subject area (eg English language arts) to compensate for a low score in another (eg
mathematics)
The burden of this uniquely high rate of failure is placed on teacher candidates rather than
on an education system that has failed them This burden is significant as candidates are
beset by costly retakes delays and no doubt angst
The data needed to document the extent of this problem has until now remained largely
hidden from public view The US Congress tried twice to get this data made public and
its efforts have been met with mixed success The data obtained from programs and
states reported under Title II of the Higher Education Act are a source of confusion in
that for much of the history of Title II data collection programs have been permitted to
NCTQ Driven by Data | Using licensure tests to build a strong diverse teacher workforce (2021) 4
exclude candidates who did not pass the test from their reported counts obfuscating the
intent of Congress some pass rate data reported via Title II is still limited to only program
completers The data has other limitations telling little about the struggles required to
achieve a passing score3 This data cannot show how many candidates pass on their first
attempt what the breakdown of pass rate by race or ethnicity is how many attempts
candidates need to ultimately pass the test or what proportion of candidates pass all
subtests of a licensure test4
Having more accurate publicly accessible data is a foundational first step to shift the burden
from candidates to the entities that prepare them Over the past two years NCTQ has worked
with state education agencies and their testing companies to gather far more comprehensive
licensure test data than has been available to date including first-attempt pass rates number
of attempts and best-attempt pass rate data for all test takers as well as pass rates broken out
by race and ethnicity5 admissions selectivity and socioeconomic indicators The collected
data was gathered prior to the pandemic and therefore has not been affected by statesrsquo
changes to licensure test policies during the pandemic
Each perspective conveys important insights on the quality of program preparation the level
of encouragement for retaking a failed test persistence on the part of test takers as
well as commitment and innovation to overcome educational inequities and inadequate
K-12 preparation
Questions sometimes arise about the value of licensure tests To explore the full breadth
of research on licensure tests NCTQ identified thousands of potentially relevant studies
published over the last three decades6 Of these only 15 were directly relevant to the question
of whether licensure tests predict teacher effectiveness as measured by student outcomes
Of these 11 found a statistically significant positive relationship between a teacherrsquos test
scores (or a binary measure of whether or not they passed the content licensure test) and
that teacherrsquos effectiveness in the classroom7 Among the four remaining studies one
reported finding no statistically significant relationship between licensure test performance
We cannot fix a problem we cannot see or fully understand
The effort presented here encourages states and programs to consider multiple perspectives on licensure test pass rates
NCTQ Driven by Data | Using licensure tests to build a strong diverse teacher workforce (2021) 5
and effectiveness8 while two found a mixed effect (generally some models or subtests were
predictive of effectiveness while others were not)9 The last of these four studies found no
relationship in most models and a negative relationship between Californiarsquos CSET exam and
studentsrsquo reading achievement10
For more on the research exploring whether licensure tests predict teacher effectiveness
see Appendix B
This paper provides the framework for the pass rate data available for each state While
the focus here is on elementary content licensure tests the analysis can be applied to any
assessment on any subject or grade span
Aspiring teachersrsquo content preparation started when they were young students and continues
throughout college and teacher preparation Supporting candidates in learning the content
they need to succeed on licensure tests and in the classroom especially for aspiring teachers
who reach college without a firm grasp of core subjects requires a concerted effort from both
states and teacher preparation programs in collaboration with their broader institutions
Better data can shed more light on current circumstances and can help guide efforts toward
where they are most needed
The overwhelming majority of research studies found a positive relationship between licensure tests and student outcomes
Positive relationship (11 Negative relationship (1Mixed results (2 No relationship (1
6NCTQ Driven by Data | Using licensure tests to build a strong diverse teacher workforce (2021)
NCTQ collected the data for this report over a two-year period 2019-202111 Requested data included the topics listed below both for the 2017-2018 school year and aggregated across the 2015-2018 school years12 Unless otherwise indicated pass rates are based on the three-year time period and reflect the proportion of test takers who took the test and passed within that window13 This report captures all of the data that was turned in by 37 states as of April 13 2021 (listed below)14 While new data from additional states will be added to the state dashboards as it is submitted this summary report will not be updated
This data was gathered prior to the pandemic and therefore is not affected by statesrsquo changes to licensure test policies during the pandemic
NCTQ requested the following data from states for the 2015-2016 through 2017-2018 academic years
bull State-level number of test takers and first-attempt and best-attempt pass rate data for alltest takers in aggregate and disaggregated into White non-Hispanic test takers and Testtakers of color (aggregated test takers of racial and ethnic groups other than White non-Hispanic)15
bull Institution-level number of test takers and first-attempt and best-attempt pass rate data for all test takers and disaggregated into White non-Hispanic test takers and Test takers ofcolor (aggregated test takers of racial and ethnic groups other than White non-Hispanic)16
bull Number of times test takers took the test at the state and institution level disaggregatedby the racial groups described above
bull Technical reports or other reports offering information about the validity or specification ofthe licensure test
bull The formal contract between contract between the state and the testing company
NCTQ obtained the data by reaching out to the schools chief in each state multiple times if necessary In the absence of a response to these requests NCTQ submitted formal open records requests to 24 states
States varied in the extent to which they were able to provide the requested data Few states were able to fulfill the request based on their own data system and therefore most states enlisted the support of their testing companies ETS andor Pearson ETS was able to provide state- and institution-level data both for composite tests (ie pass rates representing the proportion of test takers who passed all subtests) and broken out by subtest free of charge Pearson was only able to provide state- and institution-level data by subtest but not for composite tests However some Pearson states with more advanced data systems such as Florida were still able to provide composite data based on their own records In cases
Data collection amp methodology
7NCTQ Driven by Data | Using licensure tests to build a strong diverse teacher workforce (2021)
where Pearson had to create a new report to produce the requested data Pearson charged their states a fee to provide the pass rate data which NCTQ agreed to pay on behalf of states when requested In addition Pearson provided data that was not fully responsive to NCTQs request for data on test takers number of attempts over a three year period and asserted that it would not provide new data unless states submitted a new request (which may incur additional fees) Many states chose not to do so
States that have provided institutional pass rate data included in this report
Providing ldquofull datardquo means that states have provided first- and best-attempt pass rates atthe state and institution level for all test takers and disaggregated by raceethnicity as well asdata on test takersrsquo number of attempts
Kansas and Tennessee provided data after this report was finalized and so are not includedin this report but are included in data dashboards
States data not included in report because of data limitations (eg providing subtest databut not composite data) or because of missing data
For information on the specific data provided by each state see Appendix A
Alabama
Alaska
Arkansas
Colorado
Connecticut
Delaware
District of Columbia
Florida
Hawaii
Idaho
Illinois
Kentucky
Louisiana
Maryland
Massachusetts
Michigan
Minnesota
Missouri
Nebraska
Nevada
New Hampshire
New Jersey
New York
North Dakota
Ohio
Oregon
Pennsylvania
Rhode Island
South Carolina
Texas
Vermont
Virginia
West Virginia
Wyoming
Arizona
California
Indiana
Iowa
Mississippi
New Mexico
Oklahoma
Washington
Georgia
Kansas
Maine
Montana
North Carolina
South Dakota
Tennessee
Utah
Wisconsin
Full data Partial data No data
8NCTQ Driven by Data | Using licensure tests to build a strong diverse teacher workforce (2021)
Important notes about this dataThe institutional pass rate data provided for this initiative offer much richer and more layered
information than the pass rates that states currently report through the Title II requirement
of the Higher Education Act
Even with the more meaningful data in this report several notable limitations exist
States have different eligibility rules for who can take licensure tests17 An NCTQ survey of
state education agencies found that most states allow anyone to take a licensure test though
a small number of states control who can take the test by a variety of eligibility requirements
such as the approval by a teacher preparation program being a licensed teacher seeking
additional certification applying to an alternative certification program or moving from
another state These rules mean that in many states individuals taking the test who are not
enrolled in a program may report an affiliation with an institution and therefore be included
in that institutions pass rate count Many states assert that they cannot positively identify
test takers who are enrolled in the teacher preparation program without also examining
the programs enrollment rosters a step that is taken when submitting pass rate data
under Title II to the federal government18 For the NCTQ data request three states (Florida
Massachusetts and Texas) took this extra step but most did not
Few states set eligibility requirements to take licensure tests (N=43 STATE RESPONDENTS)
20
30
40
10
0State has elgibility requirements
State is unsure if it can distinguish between teacher candidates and other test takers or it depends on information test takers provide
State has eligibility requirements
State is not able to distinguish between teacher candidates and other test takers
Anyone can take test
5
19
8
11
Num
ber o
f Sta
tes
State is able to distinguish between teacher candidates and other test takers
Of the 43 states that responded to NCTQs survey exploring this issue nearly all states allow anyone to take content licensure tests
9NCTQ Driven by Data | Using licensure tests to build a strong diverse teacher workforce (2021)
In many states data on test taker race and ethnicity is limited by small numbers of test takers
To report data on race and ethnicity states were asked to group their test takers into two
categories White non-Hispanic and aggregated test takers of racial and ethnic groups other
than White non-Hispanic19 The reason for this grouping was to mitigate against lost data due
to small numbers of people of color in some states and institutions An accepted convention
for protecting test taker privacy is to not report aggregated data for small subgroups (although
states vary in their standard for ldquosmallrdquo) Despite this level of aggregation many institutions
still do not have data on test takers of color because of small sample sizes
The dearth of test takers of color in many states is itself valuable information when addressing
the lack of diversity in the teaching force Many states and institutions of higher education are
launching initiatives to attract prepare and support teacher candidates of color Access to
reliable data can support these efforts
Most data systems cannot calculate pass rates at the program level only the institution level As
a result most colleges and universities with multiple programs (eg undergraduate graduate
alternative route) do not provide separate designations or codes for these programs at test
registration This is a problem because there are differences in coursework and approaches
between undergraduate and graduate programs at the same institution20 and because this
lack of disaggregation complicates efforts to identify strong performers among preparation
programs In this study all data is reported at the institution level rather than the program
level although three states were able to provide program level data21
Programs vary with regard to when during the program they ask candidates to take or pass
the licensure test For example some require passing the test as a condition of completing the
program and others require it prior to student teaching Some preparation program leaders
raised a concern that programsrsquo using licensure tests as diagnostic assessments may drive lower
pass rates NCTQ reviewed admissions materials for 894 undergraduate elementary education
programs and 324 elementary graduate programs and found that only 3 require taking or
passing a test of content knowledge as a diagnostic for admission to the program22
Few programs appear to use the licensure test as a diagnostic of candidatesrsquo knowledge at admission into the program
For more about the caveats to each statersquos data see the state dashboards
1 0NCTQ Driven by Data | Using licensure tests to build a strong diverse teacher workforce (2021)
Three key parts of a licensure test system affect the quality of data that states teacher preparation programs and others can glean from the test results whom the state requires to take the test whether each subject is separately tested and the point where the minimum passing score is set
The test is required of all candidates Requiring every candidate to pass the test before earning a teaching license provides insight into whether all candidates enter the classroom knowing core content When states allow alternative assessments or exemptions they need to consider whether these alternatives measure the same breadth of content knowledge with the same validity and reliability that strong licensure tests do For example one state permits candidates to use a degree or major in the content area in lieu of passing a licensure test If the degree requirements do not include appropriate content coursework for teaching elementary grades this could be weak proxy for a licensure test and does not provide results that can be reliably compared across institutions
The test is structured to separately score each content area Elementary content tests most often look for teachers knowledge of the four subjects they will be licensed to teach Combining multiple subjects under one subscore makes it harder to identify weaknesses especially systemic weaknesses across candidates which is important for directing candidates to the targeted coursework to address specific areas For example one statersquos elementary content test includes a subtest that comprises language and literacy development (66 of the subtest) and social studies arts and humanities (34 of the subtest) Consequently this test will offer little
information about whether a teacher is sufficiently knowledgeable in any single area
The minimum passing score or the cut score adheres to the recommended scores resulting from the formal standard setting process The passing scores that are determined by experts and practitioners in standard setting are considered to represent ldquothe level of knowledge for a test taker to be considered minimally qualified
The three hallmarks of a strong testing system
1
2
3
1 1NCTQ Driven by Data | Using licensure tests to build a strong diverse teacher workforce (2021)
for independent beginning practicerdquo23 Licensure tests offer a more valid measure of candidatesrsquo knowledge if states use the recommended score For example on the most commonly required elementary content test the ETS Elementary Education Multiple Subjects (5001) test the multistate standard-setting study recommended a minimum score of 155 on the Social Studies subtest Most states follow this recommendation but several set lower scores24 Some states do not make public the recommended score from the standard setting process making it impossible to determine if the state adheres to this recommended score
State and teacher preparation program leaders now have an opportunity to access more accurate and robust data and to connect it with other available information
Twenty-one states meet the hallmarks of a strong testing system
For more information about the strength of each statersquos licensure test requirements see Appendix C
Missouri and Texas meet most hallmarks of a strong testing system but do not makepublic the recommended cut score established in the standard setting process
To learn more visit the pass rate data dashboards for each state
As states continue to provide pass rate data more state dashboards will be added
Arkansas Texas Alabama Montana
Colorado Utah Alaska Nebraska
Connecticut Vermont Arizona Nevada
Delaware Virginia California New Mexico
District of Columbia West Virginia Georgia New York
Florida Wyoming Hawaii North Carolina
Idaho Illinois North Dakota
Kentucky Indiana Ohio
Louisiana Iowa Oklahoma
Maine Kansas Oregon
Missouri Maryland Pennsylvania
New Hampshire Massachusetts South Dakota
New Jersey Michigan Tennessee
Rhode Island Minnesota Washington
South Carolina Mississippi Wisconsin
States with stronger testing system States with weaker testing system
1 2NCTQ Driven by Data | Using licensure tests to build a strong diverse teacher workforce (2021)
Bypassing licensure tests
States often consider alternatives to licensing tests as measures of content knowledge Six states offer the following alternatives to elementary content licensure tests
bull A degree or major in the content area (Arizona Hawaii Oregon)
bull An exemption for candidates who fail a licensure test by 5 or less but who have a 35 GPA or higher (New Jersey)
bull Completion of a subject-matter preparation program (California)
bull A content-based portfolio (Wisconsin)
bull Coursework in the content area (Arizona Hawaii)
bull A cumulative GPA of 30 or higher in the subject area (Wisconsin)
bull National Board Certification (Arizona Hawaii)
bull Prior teaching experience or work experience in the subject area (Arizona)
bull A score of 70 or higher on the Teacher Standards and Practices Commission (TSPC) content preparation matrix The matrix factors in scores from the applicable content test (Oregon)
Three states do not require any content test before becoming a teacher of record Iowa allows candidates to substitute the edTPA which is not a content test Ohio only requires a content test of early childhood teachers who are adding an endorsement to teach grades 4 and 5 North Carolina only requires teachers to pass a math subtest and they can teach for three years before passing
1 3NCTQ Driven by Data | Using licensure tests to build a strong diverse teacher workforce (2021)
Data in states that meet all three hallmarks of a strong testing system can
help identify and remedy systematic weaknesses in candidatesrsquo preparation
When states require all candidates to pass the same licensure test when they structure their
tests appropriately so they can pinpoint the subjects where candidates excel or struggle and
when they adhere to the recommended score needed to pass it stands to reason that fewer
candidates pass
States with stronger testing systems are able to more rigorously measure candidatesrsquo
knowledge of the subjects they will be expected to teach25
In states with stronger test systems the average first-attempt pass rate is 45
However most of the test takers in states with stronger testing systems 79 eventually do succeed and meet the statesrsquo higher expectations
45 79
Best-attempt pass rate
First-attempt pass rate
1 4NCTQ Driven by Data | Using licensure tests to build a strong diverse teacher workforce (2021)
States that have weaker testing systems have much higher first attempt pass rates Itrsquos not clear
that these states ultimately gain much though with best attempt pass rates only 10 percentage
points higher than those with stronger test systems26 Lower guardrails for entry into the
profession mean that states may allow teachers into the classroom who have not mastered core
knowledge These teachers some of whom might not have qualified to teach in a state with
higher standards may struggle to meet the needs of their students
Preparation programs may also receive less information about where their candidates struggle
when tests data output does not distinguish among individual subjects making it more
difficult for them to recommend the appropriate coursework and other targeted support
76 89
In states with weaker testing systems the average first-attempt pass rate is 76
In states with weaker testing systems 89 of test takers pass the test on their best attempt
Best-attempt pass rate
First-attempt pass rate
1 5NCTQ Driven by Data | Using licensure tests to build a strong diverse teacher workforce (2021)
Providing targeted preparation and support to teacher candidates to meet state standards is
the best way to ensure that every teacher has the knowledge and skills needed for the job
Pass rate data can shed light on a teacherrsquos pathway into the classroom Equipped with the
data included here state and teacher prep program leaders can determine what outcomes
they value with regard to building a strong diverse knowledgeable teacher workforce and
can evaluate the data through the lens of those values
The following section illustrates different approaches to analyzing pass rate data and how
these approaches can help identify strong preparation programs that may offer guidance for
their peers offering examples from real statesrsquo data
Analysis
ldquoThinking about students knowledge gap background knowledge matters You remember things because you connect them to prior points of reference You have to have something to connect new information tordquo
Stefanie 15th year teaching (Current first grade teacher)
TEACHER QUOTE
Click here to see these graphs for your state and to download a file with this data for further analysis
1 6NCTQ Driven by Data | Using licensure tests to build a strong diverse teacher workforce (2021)
50
75
100
25
Institution
Pass
Rat
e
E X A M P L E
Best-attempt pass rates in Virginia
Best-attempt pass rateIn all states candidates have multiple opportunities to pass their test To explore
where most test takers are passing regardless of the number of attempts examine institutionsrsquo best-attempt pass rates
Best-attempt pass rates demonstrate the culmination of efforts to help test takers succeed on
licensure tests While this data does not address questions of efficiency of preparation or of
the challenges faced by candidates who must make repeated attempts to pass it does offer a
window into which institutions are achieving the greatest final results27
The following example using real pass rate data from Virginia illustrates the variation among
institutions within the state using best-attempt pass rate data
The above graph illustrates data from Virginias Praxis Elementary Education Multiple Subjects (5001) test While the average best-attempt pass rate for all test takers in the state is 87 this ranges among institutions from 8 to 100
Highest-performing
Best-Attempt Pass Rate
Lowest-performing
The average best-attempt pass rate across all states that provided data is 83 with an average 44 percentage point gap between the lowest- and highest-performing institutions with in each state 44 PERCENTAGE
POINT
83
44 percentage point gap
Highest-performing
Best-Attempt Pass Rate
Lowest-performing
The average best-attempt pass rate across all states that provided data is 83 with an average 44 percentage point gap between the lowest- and highest-performing institutions with in each state 44 PERCENTAGE
POINT
83
1 7NCTQ Driven by Data | Using licensure tests to build a strong diverse teacher workforce (2021)
First-attempt pass rateTo explore where test takers are mastering content on their first try examine
institutionsrsquo first-attempt pass rates
First-attempt pass rates may indicate how well test takersrsquo institutions and preparation
programs have prepared them in the core content knowledge aligned with the states
expectations28 As the data from Virginia (see graph below) illustrates first-attempt pass
rates show greater variation among institutions within each state than do best-attempt
pass rates
I spent a lot of time searching online to figure out what I needed to knowmdashsome of it credible sources and some not at allrdquo
Sarah (veteran 1st grade teacher)
TEACHER QUOTE
In six states there is at least one state-approved institution where not a single test taker
passes on his or her first attempt on his or her first attempt29
There are startling differences in pass rates among institutions within the same state On average there is a 56 percentage point gap between the highest and lowest performing institutions
1 8NCTQ Driven by Data | Using licensure tests to build a strong diverse teacher workforce (2021)
The above graph illustrates data from Virginias Praxis Elementary Education Multiple Subjects (5001) test The state illustrates tremendous variation among institutions as no test takers at one institution pass on their first attempt (A) and all test takers at another (B) pass on their first attempt
E X A M P L E
First-attempt pass rates in Virginia
50
75
100
25
A B
0
Institution
Pass
Rat
e
ldquoI was prepared to teach the subjects that I am teaching now but I could have been more prepared in breaking down the components within the content knowledge and standards Yes I did struggle some to pass my tests because of what I didnt understand however after several years of teaching my own content knowledge has enriched my instruction and gave my students a deeper meaning to reading literature and informational text Building student knowledge is so important to their critical thinking skills in that the students are able to comprehend make real world connections and become problem-solvers within any genre of text they are readingrdquo
Beatrice (5th grade teacher)
TEACHER QUOTE
50
75
100
25
A B
0
Institution
Pass
Rat
e
A B
1 9NCTQ Driven by Data | Using licensure tests to build a strong diverse teacher workforce (2021)
Walk-away rateTo examine where aspiring teachers are lost from the pathway toward teaching examine the ldquowalk-away raterdquo or the proportion of test takers who fail on their
first attempt and do not retake the test
When teacher candidates fail the licensure test they hit a fork in their pathway to the
classroom They can regroup study more seek out additional support even take more
coursework to address their weaknesses and then take the test again But faced with this
decision point some aspiring teachers do not make another attempt Consistent with other
research test takers of color who do not pass on their first attempt are less likely to retake the
licensure test30
Across all states that provided relevant data31 a quarter of test takers who do not pass
the test the first time do not retake it within the three-year period32 That number climbs
significantly for test takers of color with 34 of those who fail on their first try not making
another attempt
While more test takers ultimately pass the test after multiple attempts this exit from
the pathway to teaching after the first test failure represents a substantial loss of aspiring
teachers Walk-away rates can be calculated for individual institutions to identify those that
help test takers persist on their journey into the classroom
Walk-away rates across 24 states
Test takers who fail the first time and do not retake the test
Test takers of color who fail the first time and do not retake the test
3022
2 0NCTQ Driven by Data | Using licensure tests to build a strong diverse teacher workforce (2021)
Pass rates by selectivity in admissions
To identify and scale practices from institutions that successfully support all groups of candidates sort pass rate data by categories such as admissions
selectivity or the proportion of students who receive Pell grants
In general more selective institutions have higher pass rates on licensure tests However this
trend is not universally true By sorting first-attempt or best-attempt pass rate data based on
the admissions selectivity of the institution or teacher preparation program33 as illustrated
below leaders can identify institutions that stand out for supporting their test takers and
defying this trend
E X A M P L E
First-attempt pass rates in Pennsylvania grouped by selectivity
The above graph illustrates data from Pennsylvaniarsquos Module 3 subtest34 (which tests mathematics science and health) and finds that while more selective institutions have higher pass rates on average several moderately selective and less selective institutions (identified by the orange boxes) exceed the statersquos average pass rate Conversely several very selective institutions have pass rates well below the states average
Importantly there are 56 institutions that have relatively open admissions standards
and exceed their statersquos average first-attempt pass rate35
To learn more see the lists of Standout Institutions
50
75
100
25
0
Institution
Pass
Rat
e
State Average (62Very Selective Selective Moderately Selective Less Selective
2 1NCTQ Driven by Data | Using licensure tests to build a strong diverse teacher workforce (2021)
Pass rates by socioeconomic factors Institutions with fewer students who receive Pell grants a measure of studentsrsquo financial
need also tend to have higher first-time pass rates However sorting pass-rate data by the
proportion of students who receive Pell grants36 can help identify institutions with greater
economic diversity where test takers are surpassing the statersquos average pass rate
E X A M P L E
First-attempt pass rates in Illinois grouped by proportion of undergraduate Pell grant recipients
The above graph illustrates data from Illinoisrsquo Subtest 137 and finds that while institutions with a lower proportion of students receiving Pell grants have higher pass rates on average several institutions with more Pell grant recipients than the national average exceed the statersquos average pass rate (for example see those highlighted in the orange box)
Note that this analysis uses the proportion of all undergraduate students who receive Pell
grants data that is publicly available via the IPEDS database However state education
agencies and preparation programs have the opportunity to collaborate to use more targeted
data such as Pell grant recipient status or first-generation college-going status linked to
individual test takers
There are 161 institutions with relatively high percentages of Pell grant recipients where
the first-attempt pass rate exceeds the state average38
To learn more see the lists of Standout Institutions
50
75
100
25
0
Institution
Pass
Rat
e
Low or average proportion of Pell grant recipients Above-average proportion of Pell grant recipents
2 2NCTQ Driven by Data | Using licensure tests to build a strong diverse teacher workforce (2021)
Three or more attemptsTo explore where candidates are more likely to succeed with the least amount of time and money spent on test taking examine institutions proportion of test
takers who retake the test numerous times
While states want to give candidates the opportunity to retake their licensure tests if they
fail the fewer retakes the better Each retake costs candidates time and money and may
necessitate additional support from programs
One way to measure which programs help candidates get through this hurdle more
efficiently is to calculate what proportion of test takers take the test three or more times39
While most states allow test takers an unlimited number of attempts the vast majority of
test takers take the test only once or twice40 Several states (eg Texas and Tennessee) use
pass rates on the first two attempts as an indication of preparation program quality as
both the state and preparation programs agree that most candidates should be able to pass
within only two attempts
E X A M P L E
Percent of test takers making 3+ attempts in Connecticut
The above figure illustrates data from Connecticutrsquos Science subtest of the Praxis 5001 Elementary Education Multiple Subjects test In Connecticut there are some institutions where less than 10 of individuals take the test three or more times compared with about a third of test takers at other institutions
20
30
40
10
Institution
0 0 0
Less than 10 take the test three or more times 30 or more take the test three or more times
2 3NCTQ Driven by Data | Using licensure tests to build a strong diverse teacher workforce (2021)
This data could be coupled with best-attempt pass rates to identify which institutions help
test takers pass the test with relatively fewer attempts Also while the figure above sets the
number of retakes at three or more this analysis could instead set the bar for number of
attempts higher or lower
Leaders can use pass rate data to consider other ways that institutions add or mitigate the
burden on test takers41 Beyond the ldquowalk-away raterdquo described previously one could
explore the effectiveness of the support that institutions and prep programs provide to those
who struggle through a measure of ldquoretake successrdquo This measure could be as simple as
calculating the proportion of those who retake the test and end up passing or it could be
calculated as an institutionrsquos incremental pass rate gain per retake
2 4NCTQ Driven by Data | Using licensure tests to build a strong diverse teacher workforce (2021)
Building a racially diverse teacher workforce offers clear benefits for all students especially
for Black students who have the opportunity to learn from Black teachers The country
has seen some progress in the last 20 years but Black and Hispanic teachers still comprise
roughly 18 of the teaching populationmdashmaking the teaching workforce not only far more
White than the student body but also more White than the US adult population42
Teachers of color who bring tremendous benefits to their students and especially their
students of color43 face many challenges on the pathway into the classroom likely stemming
in large part from systemic inequities in the broader educational system44 Once they earn a
teaching license teachers of color are more likely to choose to teach in high-needs schools
which tend to have higher teacher attrition While teachers of color have better retention
in these more challenging schools than their White colleagues working in these
challenging settings means that teachers of color overall have a lower retention rate than
White teachers45
Given these challenges in diversifying the workforce it is that much more imperative that aspiring teachers of color receive the preparation and support they need to reach the classroom equipped with the knowledge and skills they will need to be successful
Inadequate content preparation disproportionately affects test takers of color with first-
attempt pass rates averaging 43 compared with 58 for White test takers -- a 15 percentage
point gap46 That gap is in the double-digits in all but a handful of states (Kentucky Nebraska
and West Virginia)
Supporting candidates of color
2 5NCTQ Driven by Data | Using licensure tests to build a strong diverse teacher workforce (2021)
To identify institutions supporting teachers of color in entering the workforce examine pass rate data for test takers of color
E X A M P L E
First-attempt and best-attempt pass rates for test takers of color in New Jersey
The above figure illustrating pass-rate data for test takers of color on New Jerseyrsquos Praxis 5001 Elementary Education Multiple Subjects test demonstrates that test takers of color achieve much greater success at some institutions than at others At institutions C and D test takers of color achieve high first-attempt and best-attempt pass rates At institutions A and B test takers of color have similarly low first-attempt pass rates but the pass rate rises dramatically for institution B after test takers have had the opportunity to retake the test
Another way to analyze pass rate data is to focus on how many test takers of color are
successfully passing licensure tests at each institution and how many are falling short (see
figure below) This information can help focus efforts on institutions that are serving many
aspiring teachers of color and that could substantially contribute to the diversity of the
teacher workforce if their test takers were more successful on licensure tests
50
75
100
25
0
Institution
Pass
Rat
e
First attempt Best attempt
A B C D
50
75
100
25
0
Institution
Pass
Rat
e
First attempt Best attempt
A B C D
First-attempt Best-attemptFirst-attempt Best-attempt
2 6NCTQ Driven by Data | Using licensure tests to build a strong diverse teacher workforce (2021)
E X A M P L E
Number of test takers of color passing and failing best-attempt in New Jersey
The above figure illustrating pass-rate data for New Jerseys test takers of color on the Praxis 5001 Elementary Education Multiple Subjects test illustrates that many more test takers of color are successful at some institutions than others even among those with similar numbers of test takers of color The two highlighted institutions in the graph each have about 100 test takers of color but far more test takers pass in one institution than the other potentially keeping many aspiring teachers of color from entering the classroom
To further the goal of educational equity the disparities in pass rates for White test takers
and test takers of color within the same institution will be important Analysis could include
comparing first- and best-attempt pass rates ldquowalk awayrdquo rates or the number of times test
takers retake the test
There are 153 institutions where the first-attempt pass rate for test takers of color exceeded
the statersquos average first-attempt pass rate for all test takers47
To learn more see the lists of Standout Institutions
300
100
0
200
Num
ber o
f tes
t tak
ers
Institution
Passing Failing 100 or more test takers
300
100
0
200
Num
ber o
f tes
t tak
ers
Institution
Passing Failing 100 or more test takers
300
100
0
200
Num
ber o
f tes
t tak
ers
Institution
Passing Failing 100 or more test takers
300
100
0
200
Num
ber o
f tes
t tak
ers
Institution
Passing Failing 100 or more test takers
300
100
0
200
Num
ber o
f tes
t tak
ers
Institution
Passing Failing 100 or more test takers
2 7NCTQ Driven by Data | Using licensure tests to build a strong diverse teacher workforce (2021)
In addition to the analyses described above leaders of teacher preparation programs can conduct additional analyses to diagnose strengths and opportunities in their own programs and institutions
For example examining test takersrsquo pass rates on each subtest across institutions can point to both broad systemic issues across a state as well as institution-specific issues These findings may suggest an opportunity for programs to examine their own practices and to learn from others
E X A M P L E
Subtest pass rates for a subset of Arkansas institutions
Institutionsrsquo pass rates on subtests of the Praxis 5001 Elementary Education Multiple Subjects test shows nearly every institution struggles with science and social studies far more than ELA and mathematics However IHE 11 seems to be performing exceptionally well in science and IHE 1 has lower scores in ELA than the other subjects
Institutions can also explore their internal data to compare outcomes among different groups of students based on criteria such as race and ethnicity gender socioeconomic status pathways into the program (eg through the university versus a community college) as a way to identify groups that tend to need more support and to proactively provide that support
Supporting program improvement
50
75
100
25
0
Institution
Pass
Rat
e
IHE 1 IHE 2 IHE 3 IHE 5 IHE 6 IHE 7 IHE 8 IHE 9 IHE 10 IHE 11IHE 4
ELA Math Social Studies Science
2 8NCTQ Driven by Data | Using licensure tests to build a strong diverse teacher workforce (2021)
T E AC H E R S TO R Y
Lacey (4th grade teacher in Tennessee)
Thinking back I did not feel prepared on many different levels when I first started teaching I
think there are so many extra things that no one prepares you for your first year is basically
survival mode For me diving deeper into the content comes that second year when you have
some experience under your belt Initially our county did not have a universal curriculum for
reading We had to find our own great quality resources to teach the standards We have since
adopted Core Knowledge curriculum This was a huge help (that is even an understatement)
to me Most Tennessee standards are embedded in this curriculum
With that said many of the topics in Core Knowledge contain a great deal of information I
spend a good amount of time during summer breaks learning more about the actual topics
(American Revolution Middle Ages etc) This takes time I can say with confidence that if
teachers dont take the time to truly dig into their subjectstopics it is a struggle You have to
commit to still being a learner yourself I can also speak from experience to the fact that when
you know your contentstudent success automatically goes up
I was able to pass the state licensing test the first time I took it I used my mentor teachers
that had already taken it to seek advice from I purchased Praxis study books and read those
backwards and forward I took as many practice tests as I could find The reason I spent so
much time studying and preparing was because I had friends and acquaintances that were not
able to pass the test the first time and even the second time they took it I knew it was going
to be tough
I believe being well-prepared in content knowledge helped me because I was confident in the
classroom Im not saying that happens every single day but you HAVE to be willing to be a
continuous learner to be a good teacher Just like our studentswe have to put in the time
and effort to WANT to become experts on our topics Read trade books about your subject Go
to trainings on your time off Watch documentaries about those subject areas Talk to people
that have wisdom and experience
If Im being honest Im not sure any actual program prepared me for the classroom or
content knowledge development Its a personal drive you have to have within yourself to
push you I can say that having mentors in the program would be a huge benefit Individuals
that are preparing to become teachers can learn so much from people thathave gone through
it and use their experience to help navigate each step There is an abundance of content
knowledge out there to soak up Study books from my prep program were also beneficial to
me as well
When you are excited about what you teach it carries over to your students and you see first hand the actual learning taking place It never gets old
2 9NCTQ Driven by Data | Using licensure tests to build a strong diverse teacher workforce (2021)
Want to know more about test takersrsquo success on elementary content licensure tests in your
state While the data available varies by state most states dashboards include
bull First-attempt and best-attempt pass rates for all test takers in the state
bull Estimates of the proportion of all test takers and of test takers of color who fail the test
and do not retake it
bull Institution-level best-attempt pass rates
bull Institution-level calculations of the proportion of test takers who take the test three or
more times
bull Institution-level first-time pass rates grouped by admissions selectivity
bull Institution-level first-time pass rates grouped by the proportion of undergraduate
students who receive Pell grants
bull Institution-level first- and best-attempt pass rates for test takers of color
bull A list of notable institutions in your state that have above-average pass rates and lower
levels of admissions selectivity greater socioeconomic diversity or above-average pass
rates for test takers of color
In addition your statersquos pass rate data is available to download As states continue to
provide pass rate data more state dashboards will be added States must provide a
minimum of institution-level first-attempt and best-attempt pass rate data in order to
have a state-level dashboard developed
For more on how to interpret the downloadable data see Appendix E
Explore your states data
Visit your statersquos dashboard
3 0NCTQ Driven by Data | Using licensure tests to build a strong diverse teacher workforce (2021)
Every student deserves to learn from teachers who enter the classroom with a firm grasp of
the content they teach Every student deserves the opportunity to learn from teachers who
look like them and share their background at least at some points during their education
And teachers should not be expected to learn an entire curriculum as they go staying up
late every night just to stay ahead of their students Being a teacher especially a new one is
hard enough already
The field overwhelmingly agrees that new teachers should demonstrate that they know
what theyrsquoll be able to teach before they enter the classroom
A recent NCTQ survey found that leaders from prep programs and leaders from state
education agencies agree that elementary teachers should demonstrate they have core
knowledge before they begin teaching (see the FAQs for more information) Moreover
virtually all teachers agree that teachers should have to demonstrate their knowledge
before earning a teaching license48 Licensure tests offer a valuable guardrail to verify
that knowledge and the data from these tests provides unparalleled insights into the
preparation candidates receive
Percentage that agree teachers should have to demonstrate knowledge before entering the classroom
A vision for what is possible
84 95 98of prep program leaders of state education agency leaders of teachers
3 1NCTQ Driven by Data | Using licensure tests to build a strong diverse teacher workforce (2021)
Revising our education system so that it supports all teacher candidates in achieving the
necessary level of core knowledge can be done High-performing institutions show that
higher pass rates are possible Success in other professions such as nursing illustrate that
higher pass rates are possible49
Despite the numerous benefits that teachers of color bring to the classroom decades of
systemic inequities in education have led to the inevitable byproduct of low pass rates for
candidates of color on licensure exams
By shoring up content preparation we can support more candidates and especially more
candidates of color on their pathway into the profession with a strong background in the
subjects they will teach Doing so will mean more enriching engaging lessons for students
a stronger foundation to support reading comprehension and better outcomes for students
of color
These changes require deliberate action from all levels Institutions with teacher prep
programs should work with those programs to leverage existing general education
coursework Teacher prep programs should provide better guidance to candidates on what
courses to take so that they learn core content States need to push for stronger more
aligned preparation by gathering and using pass rate data And testing companies must be
partners in this work ensuring that states and prep programs are equipped with the data
they need to make good decisions based on unbiased valid assessments
Better information about pass rate data offers one key piece in a teacher workforce
data system Pass rate data can help identify where programs are better supporting
their candidates where candidates are being lost before they earn a license and where
candidates of color are most likely to be successful
NCTQrsquos state dashboards are just the beginning With these state and program leaders can
start conversations about what the data demonstrates what questions remain and what
steps they may want to explore NCTQ is eager to support further inquiry into statesrsquo pass
rate data
Pass rate data transparency can be the compass pointing toward stronger programs and
policies that others can learn from and helping programs with lower pass rates discover
that they have strayed from their mission Publishing this data and building out the data
system to support it is a crucial step in statesrsquo effort to better identify their greatest needs
and greatest challenges
Teacher prep programs did not create these problems but they can be a bulwark against this vicious cycle ensuring that future generations of students can benefit from a strong diverse teacher workforce
3 2NCTQ Driven by Data | Using licensure tests to build a strong diverse teacher workforce (2021)
Recommendations
Building a stronger more diverse teacher workforce by building teacher candidatesrsquo
content knowledge is a critical task that requires the support of actors at many levels The
following recommendations address direct actions that can be taken by state licensing
agencies educator preparation programs (and their collegesuniversities) and test
publishers mdash either alone or in collaboration
Recommendation for collaborative action
Working together state education agencies teacher prep programs test publishers and school districts need to establish or verify alignment between teacher preparation licensure tests and the job demands of elementary classrooms
These four entities must together establish requirements that reflect state standards and
select appropriate licensure tests mdash whether national or customized mdash that align with
the requirements The alignment should be apparent in the statersquos standards for teacher
preparation the coursework that programs require and the licensure tests that teachers
must pass
It is possible to modify tests to make them more predictive of teachersrsquo effectiveness
As economist Dan Goldhaber has suggested key decisions about licensure testsrsquo
development and design are made in the absence of empirical evidence on their connection
to teacher or student outcomes In particular the determination of the specific items
included in licensure tests as well as the required passing score is based on expert
judgment An alternative approach would be to use empirical evidence on the relationship
between teacher candidates performance on individual items and the student outcomes
they achieve once in the classroom to better inform the weights attached to each item ie
weight items more heavily that are more predictive of valued teacher and student outcomes
more heavily
NCTQ Driven by Data | Using licensure tests to build a strong diverse teacher workforce (2021) 3 3
Recommendations for States
1 Use a valid and reliable elementary education licensure test that separately measures knowledge of language arts mathematics science and social studies
Given the nature of elementary teaching a strong licensure test must be able to
generate separate scores in the four core subject areas to provide a) the state
education agency (SEA) with the necessary evidence to be confident in granting
an initial license and b) teacher candidates and their preparation programs with
information to better identify strengths and weaknesses These high-quality
tests are currently in place in 25 states A compensatory elementary education
licensure assessment as currently required in some form or another in 18 states
(one that combines two or more subject areas into a single score) is unable to
determine whether teacher candidates are sufficiently knowledgeable in each of
the subjects they will be asked to teach
States seeking alternatives to licensure tests need to consider evidence that a
proposed alternative is sufficiently broad in the scope of content that is being
measured and that it is both a valid and reliable measure of content knowledge
Set the minimum score needed to pass the licensure test at the score that has been recommended by the standard setting process
The minimum score needed to pass a licensure test should be determined by
a formal standard setting process in which practitioners and experts analyze
test items and scoring for the purpose of deciding the minimum knowledge
needed for the job While the responsibility for establishing the passing scores
rests ultimately with the state which acts upon the recommendations from
the standard-setting process states should align minimum passing scores with
the foundational psychometric work that is developed by expert practitioners
Deciding to lower the recommended passing score so that higher numbers of
candidates will pass is not only harmful to the aspiring teachermdashgiving him a
false sense of preparednessmdashbut also harms the students whose teacher may
lack adequate subject-matter knowledge
States should make the recommended score part of the public record as well as
any rationale behind a decision to change the score
2
NCTQ Driven by Data | Using licensure tests to build a strong diverse teacher workforce (2021) 3 4
3 Improve access to and use of assessment data
Build a data system that helps answer important questions about the statersquos
supply of teachers
States need data systems that can inform an understanding of the statesrsquo supply of
teachers as well as identify challenges in the pipeline Better systems support the
ability to examine data through multiple perspectives providing insight on a range
of important questions This data offers the opportunity to pinpoint how to better
support aspiring teachers and strengthen teacher quality overall
For examples of states that have accomplished this goal see the case studies on
Illinois Florida Massachusetts and Texas For states that are early in the process
of developing such a system their licensure test providerrsquos data management
system is a valuable resource For more complex analyses such as customizing
subgroups of test takers or combining pass rates across subtests to create composite
pass rates states need contractual arrangements that can accommodate the
additional help of testing providers
One challenge many states face is that they do not currently link test takers
to their teacher preparation programs To resolve this challenge states can
consider implementing an eligibility system for taking licensure tests as states
such as Georgia Iowa and Texas have done Another approach would be to
work with the existing data management system and require preparation
programs to provide rosters of candidates by program that can be matched to
the testing records Linking test takers back to their preparation programs can
lay the groundwork for later improvements to the data system such as tracking
candidates into the classroom
For more on this process see Appendix D
Leverage the many uses of a strong data system These data systems offer myriad benefits For example states with data on
enrollment and completion of preparation programs can use this information
to vet the accuracy of Title II data submitted by teacher preparation programs
States can use this data in program approval processes currently 22 states
publish teacher preparation program performance data in either program report
cards or a dashboard and 14 states tie that data to program accountability Many
NCTQ Driven by Data | Using licensure tests to build a strong diverse teacher workforce (2021) 3 5
4 Make sure that the statersquos needs are reflected in agreements made with licensure test publishers
State licensing agencies should expect test publishers to support the state
teacher preparation programs and teacher candidates States should require
from their testing companies
bull The sound validity evidence that guided the design and development of the
assessments If the test publisher conducts standard-setting studies results
of the studies whether multistate or state-specific should be provided to
the state licensing agency andor published (The state should make this
information public)
bull Regular reporting of psychometric and statistics results as well as
disaggregated summary results of licensure test outcomes to assist with
ongoing monitoring and improvement initiatives (The state should make this
information public)
bull The ability to apply preparation programsrsquo roster verification from Title II
data to all pass rate data making it possible to generate the pass rates for
individual programs
bull Access to a data management system with training staff assistance and the
ability to build customized reports A number of states seeking to supply NCTQ
with the data for this report were charged by their test publisher due to the
nature of their contractual arrangements
states that start this work find that preparation programs themselves are eager
to have better data systems as they use this information in the accreditation
process and benefit from statesrsquo broader reach in gathering data This data offers
an opportunity to extend conversations about rooting policy and practice in
localized data
NCTQ Driven by Data | Using licensure tests to build a strong diverse teacher workforce (2021) 3 6
Recommendations for Teacher Preparation Programs
1 Look to coursework not just test prep strategies to best prepare candidates in the content they need to teach elementary grades
Align coursework requirements with the content elementary teachers will
need to know Teacher preparation programs must align coursework and fieldwork requirements with the statersquos standards for teacher preparation programs and for elementary students as well as with the assessments their candidates will need to pass To support this effort test publishers can supply test specifications for the required assessments Preparation programs need to crosswalk required course content with the state standards and test specifications to determine if each teacher candidate has the opportunity mdash or multiple opportunities mdash to learn the content they will be expected to know and teach
Provide additional guidance on course requirements when needed Coursework can include both general education requirements and specific preparation program requirements Trends in higher education have recently shifted these requirements to give students greater flexibility in how they meet requirements When candidates can choose from among several course options in a subject teacher prep programs need to give additional guidance for course requirements In many institutions teacher prep programs can set specific requirements about which course a candidate must take to satisfy a general education requirement In the few cases where states do not allow teacher prep programs to take this step they can still recommend which courses a candidate takes or they may be able to require selected courses as prerequisites for the
education major
Enlist the support of other colleges in the institution To facilitate candidatesrsquo ability to take relevant courses some programs have found success in working with their institutions to set aside seats in key classes specifically for teacher candidates or create separate sections of a course for teacher candidates Successful programs have employed strategies including having the universityrsquos provost take the lead in creating collaboration between
NCTQ Driven by Data | Using licensure tests to build a strong diverse teacher workforce (2021) 3 7
3
2 Review and act on pass rate data to monitor program effectiveness and to inform improvements
Preparation programs should review all available pass rate information for
their candidates If the preparation program has access to a data management
system staff should be trained to query the data to inform decisions Programs
should review pass rate data for teacher candidates overall and by demographic
groups to identify areas for growth For licensure tests that provide subscores
in specific content areas programs can use disaggregated data to monitor
course requirements and course effectiveness
Key stakeholders in the institution including both teacher prep programs and
liberal arts faculty should build a strategy to act on this data Many protocols
exist to support data-driven meetings including ATLAS Looking at Data
from National School Reform Faculty and Data-Driven Analysis Meetings by
Paul Bambrick-Santoyo
Use diagnostic testing to identify candidates strengths and weaknesses
For students applying to an elementary education program diagnostic
testing can be used to address strengths and weaknesses stemming from
coursework required before the students declared a major Early testing is
perhaps even more valuable for graduate programs that much like alternative
route programs rarely spend much time on content coursework Preparation
programs can explore the use of test prep materials available from its statersquos
test provider (eg practice tests) to flag potential weaknesses early and
guide students to courses or other supports If practice tests are not available
preparation programs could collaborate with testing companies to design low-
cost low-stakes assessment to pinpoint strengths and weaknesses or they
could use existing commercially available options
education faculty and liberal arts faculty and inviting liberal arts faculty to regular education faculty meetings on relevant topics
Programs where large numbers of students transfer from a community college should work with the community college to advise future teachers on the best courses to take during the early part of their college career
NCTQ Driven by Data | Using licensure tests to build a strong diverse teacher workforce (2021) 3 8
Recommendations for Testing Companies
1 Standard operating procedure should be to provide first-attempt and best-attempt pass rate data and data on the number of attempts for all test takers at the institution level to state education agencies and preparation programs
Testing companies have access to much of the data that states and programs
need on licensure tests but this data is not always easily accessible
Compounding the problem the state licensing agency or preparation program
may not have the technical expertise to access the data Therefore testing
companies should automatically provide regular detailed pass rate reports
Strengthen data collection to provide more accurate program-level data
Testing companies already work with preparation programs in many states
to help programs ldquoclaimrdquo candidates for Title II reporting requirements A
similar process can be used to connect all test takers back to their preparation
programs allowing for more targeted reporting and simplifying the process for
future Title II reports
The test publisher should work with higher education institutions to support
disaggregation of results by programs housed within the institution A large
number of institutions offer undergraduate graduate andor alternative
preparation programs Without having a straightforward way to disaggregate
the data it is difficult for the state and the institution to identify strong
programs or those that need additional support
Work with the education field to explore concerns around bias in testing
While testing companies already have a process in place to identify and
mitigate bias the education field has ongoing concerns about bias permeating
licensure test results Testing companies should communicate the process
they currently have in place and engage diverse stakeholders in an ongoing
process to determine what additional steps can be taken Testing companies
should publish results of their efforts to inform stakeholders and spur ongoing
conversations
2
3
3 9NCTQ Driven by Data | Using licensure tests to build a strong diverse teacher workforce (2021)
AC K N O W L E D G M E N T S
NCTQ President
Kate Walsh
Project Leads
Hannah Putman amp Ashley Kincaid
NCTQ Staff
Amber Moorer Andrea Browne Taylor Christie Ellis
Clyde Reese Danielle Wilcox Jamie Ekatomatis Kelli
Lakis Ken Wagner Laura Pomerance Lisa Staresina
Nicole Gerber Ruth Oyeyemi Shannon Bradford
Shannon Holston Shayna Levitan and Tirza Buelto
Funders
Alice Walton through the Walton Family Foundation
Bill and Melinda Gates Foundation
Sid W Richardson Foundation
Barr Foundation
Gates Family Foundation
Content Matters Advisory Committee
Dawn Basinger Louisiana Tech University Mary Bivens
Colorado Department of Education Anika Burtin
University of the District of Columbia Abigail Cohen
Data Quality Campaign James Cibulka Consultant
Former President Council for the Accreditation of
Educator Preparation Edward Crowe TPI-US Eric
Duncan The Education Trust Deb Eldridge Western
Governors University Cheryl Ensley Grambling
State University Emily Fox Illinois State Board of
Education Edith Gummer Arizona State University
Simone Hardeman-Jones GreenLight Twin Cities Jerri
Haynes Tennessee State University Tanji Reed Marshall
The Education Trust Tiffany McDole Education
Commission of the States Jessica McLoughlin Texas
Education Agency Daniel Moore Florida Department
of Education Daniel Robinson University of Texas
at Arlington Deborah Scheffel Colorado Christian
University Evan Stone Educators for Excellence
Additional Guidance and Input
Ryan Franklin Kelvey Oeser and Mark Olofson Texas
Education Agency
Elizabeth Ross and Joelle Lastica Hlava Office of the
State Superintendent of Education Washington DC
Massachusetts Department of Elementary and
Secondary Education
Florida Department of Education
Nermin Zubaca Delaware Department of Education
Emily Fox and Jason Helfer Illinois State Board of
Education
Dan Goldhaber Center for Analysis of Longitudinal
Data in Education Research amp University of Washington
Meagan Comb Boston University Wheelock Educational
Policy Center
Design and Technical Development
Katy Hinz Katrina Keane Teal Media
Jeff Hale EFA Solutions
Legal Expertise
Teri Peeples (formerly of Sidley Austin LLP) Tanisha
Singh and Symone Yancey Sidley Austin LLP
Recommended citation for report
Putman H amp Walsh K (2021) Driven by Data Using
Licensure Tests to Build a Strong Diverse Teacher
Workforce Washington DC National Council on
Teacher Quality
Recommended citation for state dashboards
NCTQ (2021) [STATE] Licensure test data Learning
from institutional pass rates on elementary content
teacher licensure tests Washington DC National
Council on Teacher Quality Retrieved from passrates
nctqorg
The findings and conclusions contained within are those of the authors and do not necessarily reflect positions or policies of any funders project advisors or other entities
4 0NCTQ Driven by Data | Using licensure tests to build a strong diverse teacher workforce (2021)
1 For example students in higher-quality K-3 classrooms have higher rates of college attendance and greater earnings Chetty R Friedman J N Hilger N Saez E Schanzenbach D W amp Yagan D (2011) How does your kindergarten classroom affect your earnings Evidence from Project STAR The Quarterly Journal of Economics 126(4) 1593-1660 Students who are not able to read proficiently by the end of third grade are less likely to finish high school Hernandez D J (2011) Double Jeopardy How Third-Grade Reading Skills and Poverty Influence High School Graduation Annie E Casey Foundation Black male students who have just one Black elementary teacher are more likely to graduate high school and attend college Gershenson S Hart C M Hyman J Lindsay C amp Papageorge N W (2018) The long-run impacts of same-race teachers (No w25254) National Bureau of Economic Research
2 See for example Program Evaluation Division North Carolina General Assembly (2020) Lack of a dedicated state-level effort challenges North Carolinarsquos capacity to increase teacher diversity Final report to the Joint Legislative Program Evaluation Oversight Committee Report Number 2020-09 Retrieved from httpswwwncleggovPEDReportsdocumentsTeacher_DiversityTeacher_Diversity_Reportpdf Kats R (2021) Education committee considers changes to the teacher licensure system Minnesota Legislature Retrieved from httpswwwhouselegstatemnusSessionDailyStory15699
3 Title II reporting gathers two sets of pass rate data Summary pass rates and Single-assessment pass rates Summary pass rates represent ldquothe percentage of students who passed all tests they took for their area of specializationrdquo US Department of Education Office of Postsecondary Education (2014) Higher Education Act Title II State Report Card System (STRC) User Manual Retrieved April 27 2021 from httpswebarchiveorgweb20170508023138httpstitle2edgovPublicTASTRCManualpdf These pass rates are only reported for program completers and are only reported in aggregate at the institution level (not disaggregated by program or assessment) For this summary pass rate programs can require that candidates pass their licensure test in order to complete the program and therefore can report a 100 pass rate US Department of Education Office of Postsecondary Education (2016) Preparing and credentialing the nationrsquos teachers The Secretaryrsquos 10th report on teacher quality Retrieved March 29 2018 from https title2edgovPublicTitleIIReport16pdf
The second set of pass rate data is the ldquosingle assessment pass raterdquo which is the ldquopercentage of students who passed the assessment among all who took the assessmentrdquo US Department of Education Office of Postsecondary Education (2014) Higher Education Act Title II State Report Card System [STRC] User Manual Retrieved April 27 2021 from httpswebarchiveorgweb20170508023138httpstitle2edgovPublicTASTRCManualpdf This pass rate is reported for all teacher candidates both those enrolled in the program and those who have completed it The data is reported at the assessment level for licensure tests with multiple subtests the pass rates are reported at the subtest level but not the composite level
4 In states with non-compensatory elementary education licensure testing requirements (ie separate tests for core subjects) Title II passing rates are reported for the separate subtests and not the composite passing rate for the set of subtests Reporting passing rates for the components could mask the difficulty candidates may have with one or more subject areas
5 Protecting candidates personally identifiable information is essential and limits the reporting of even aggregated results for small subgroups The number of candidates of color at many educator preparation programs remains small and limits subgroup reporting To maximize reporting for candidates of color NCTQ has collapsed raceethnicity data into two subgroupsmdashWhite non-Hispanic test takers and aggregated test takers of racial and ethnic groups other than White non-Hispanic
E N D N OT E S
4 1NCTQ Driven by Data | Using licensure tests to build a strong diverse teacher workforce (2021)
6
7
8
9
10
11
12
13
14
These studies were identified using combinations of the search terms ldquoelementary content ldquolicens testrdquo ldquocertification testrdquo ldquoteacherrdquo ldquostudent outcomesrdquo ldquoelementaryrdquo ldquocore subjectsrdquo
ldquocore knowledgerdquo ldquooutcomesrdquo ldquostudent learningrdquo ldquolearning gainsrdquo ldquoPraxisrdquo ldquoteacher effectiverdquo ldquoracerdquo ldquoBlackrdquo ldquoLatinordquo ldquoHispanicrdquo ldquoLatinxrdquo ldquopredictive validityrdquo ldquopredictrdquo ldquolicensingrdquo
ldquocertificationrdquo ldquoPearsonrdquo
Araujo P M D Heineck G amp Cruz Aguayo Y (2020) Does test-based teacher recruitment work
in the developing world Experimental evidence from Ecuador (No 165) BERG Working Paper
Series Boyd D Lankford H Loeb S Rockoff J amp Wyckoff J (2008) The narrowing gap in
New York City teacher qualifications and its implications for student achievement in high-poverty
schools (No w14021) National Bureau of Economic Research Chingos M M amp Peterson P E
(2011) Its easier to pick a good teacher than to train one Familiar and new results on the correlates of teacher effectiveness Economics of Education Review 30(3) 449-465 Clotfelter
C T Ladd H F amp Vigdor J L (2006) Teacher-student matching and the assessment of teacher effectiveness The Journal of Human Resources 41(4) 778- 820 Clotfelter C T Ladd H F
amp Vigdor J L (2007) How and why do teacher credentials matter for student achievement
(No w12828) National Bureau of Economic Research Ferguson R F (1991) Paying for public education New evidence on how and why money matters Harvard Journal on Legislation 28
465ndash498 Goldhaber D (2007) Everyonersquos doing it but what does teacher testing tell us about teacher effectiveness Journal of Human Resources 42(4) 765-794 Cowan J Goldhaber D
Jin Z amp Theobald R (2020) Teacher licensure tests Barrier or predictive tool CALDER
Working Paper No 245-1020 Shuls J V amp Trivitt J R (2012) What makes a teacher effective An analysis of teacher credentials and student achievement In Annual Conference Association
for Education Finance and Policy Boston MA Shuls J V amp Trivitt J R (2015) Teacher effectiveness An analysis of licensure screens Educational Policy 29(4) 645-675 Shuls J V
(2018) Raising the bar on teacher quality Assessing the impact of increasing licensure exam cut-scores Educational Policy 32 (7) 969-992
Rockoff J E Jacob B A Kane T J amp Staiger D O (2011) Can you recognize an effective teacher when you recruit one Education Finance and Policy 6(1) 43ndash74
Hanushek E A (1997) Assessing the effects of school resources on student performance An update Educational Evaluation and Policy Analysis 19(2) 141-164 Goldhaber D amp Hansen
M (2010) Race gender and teacher testing How informative a tool is teacher licensure testing American Educational Research Journal 47(1) 218-251
Buddin R amp Zamarro G (2009) Teacher qualifications and student achievement in urban elementary schools Journal of Urban Economics 66(2) 103-115
Data collection began with a pilot test of a sample of states on a subset of test data the data request was modified based on lessons learned from that pilot test including the addition of all subtests and numbers of attempts and the exclusion of requests for basic skills test pass rates
Data was requested for September 1 2015 to August 31 2018 with the caveat that states could adjust the time period to better align with their data system outputs if needed
Test takers may have retaken and passed the test after the three-year window
The 37 states provided at minimum first-attempt and best-attempt data at the state and
institution levels on either subtests or the composite test States that did not provide composite data were not included in calculations of first-attempt and best-attempt pass rates Several other states provided some portions of data (eg best-attempt data at the institution level) and may be included in specific analyses but are not included in this count The 37 states that provided partial
or complete data for inclusion in this report are Alabama Alaska Arizona Arkansas Colorado Connecticut Delaware District of Columbia Florida Hawaii Idaho Illinois Indiana Iowa Kentucky Louisiana Maryland Massachusetts Michigan Minnesota Missouri Nebraska Nevada New Hampshire New Jersey New York North Dakota Ohio Oregon Pennsylvania Rhode Island South Carolina Texas Vermont Virginia West Virginia and Wyoming Because not all states provided all pieces of information the number of states included in each piece of analysis varies
4 2NCTQ Driven by Data | Using licensure tests to build a strong diverse teacher workforce (2021)
15 Note that during the pilot test we learned that disaggregating racial and ethnic groups further would lead to missing data due to small N sizes because most states will not publicly report data on groups that fall below a certain threshold ranging from five to 20 people
16 Program-level data was also requested but most states were not able to provide data at the program level
17 Passing licensure tests is generally only one of several state requirements to earn a teaching license States often also require completing an approved preparation program completing a supervised practicum experience and possessing a bachelorrsquos degree among other requirements
18 Test providers may invite preparation programs the opportunity to ldquoscrubrdquo the roster of test takers who designated it as the attending institution but this review is not required or consistent across programs
19 States using ETS reported data grouped into White All Other Ethnicities (ie non-White) Two or More Races and No Response For this study ldquoAll Other Ethnicitiesrdquo and ldquoTwo or More Racesrdquo were grouped into the ldquotest takers of colorrdquo category In some cases states receiving data from Pearson followed the disaggregation into two groups and in others states using Pearson tests broke out race and ethnicity data into multiple more discrete categories When that occured NCTQ aggregated the data into the two described groups
20 Greenberg J amp Dugan N (2015) Incoherent by design What you should know about differences between undergraduate and graduate training of elementary teachers National Council on Teacher Quality Retrieved from httpswwwnctqorgpublicationsIncoherent-By-Design
21 Massachusetts Texas and Colorado for part of the request (Colorado provided program-level data in response to the pilot study request but worked with ETS and provided only institution-level data in response to the full-scale study request)
22 Not all of these programs require candidates to pass the test for admission into the program only to take it Note that there are several programs located in California where candidates applying to state-approved 2042 programs can bypass the licensure test
23 According to one study ldquo[S]tates rely on a panel of education experts who attempt to relate the minimum levels of content and teaching knowledge required of beginning teachers to what is measured by the various licensure testsmdashthe resulting cutoff score is where they deem a minimally qualified teacher candidate should performrdquo Goldhaber D (2007) Everyonersquos doing it but what does teacher testing tell us about teacher effectiveness Journal of Human Resources 42(4) 765-794 ETS confirms this approach for their exams ETS (2018) Standard-setting studies Retrieved March 29 2018 from httpswwwetsorgpraxis states_ agenciesadoption_processstandard_setting_studies
24 Alabamarsquos social studies cut score is 142 and South Dakotarsquos is 147
25 Of the 21 states that meet the hallmarks of a strong testing system 17 provided data for this study These first-attempt averages are based on composite pass rates On tests with multiple subtests candidates must pass all of them These pass rates reflect the proportion of test takers who pass all subtests known as the composite pass rate The average pass rate across these 17 states was calculated with the state as the unit of analysis averages are not weighted by number of test takers Only Delaware had two different content tests in operation during the relevant time period but the number of test takers taking the newer 7801 test was too low to report pass rate data The states included in this calculation are Arkansas Colorado Connecticut Delaware District of Columbia Florida Idaho Kentucky Louisiana New Hampshire New Jersey Rhode Island South Carolina Vermont Virginia West Virginia and Wyoming Iowa provided first-attempt data but was omitted from this calculation because of questions about the datarsquos accuracy specifically the first-attempt pass rate it provided appeared higher than the best-attempt pass rate First-time pass rates ranged from 32 in Louisiana to 59 in the District of Columbia
Best-attempt pass rates in these states range from 62 in Louisiana to 87 in Virginia Best-attempt pass rates reflect the proportion of test takers who pass within the three-year data window the academic years of September 1 2015 to August 31 2018
4 3NCTQ Driven by Data | Using licensure tests to build a strong diverse teacher workforce (2021)
26 These average first-attempt pass rates are based on composite pass rates On tests with multiple subtests candidates must pass all subtests These pass rates reflect the proportion of test takers who pass all subtests known as the composite pass rate Nine of the states with weaker testing systems provided composite pass rate data these statesrsquo pass rates are included in this calculation Alabama Alaska Hawaii Indiana Maryland Michigan Nebraska Nevada and North Dakota This average best-attempt pass rate is 10 percentage points higher than in states with stronger systems but is brought down by four states that reported data on higher-quality tests--Hawaii and Alaska--which give the Praxis 5001 (Elementary Education Multiple Subjects) as an option Alabama which uses the Praxis 5001 but allows a lower passing score than the one recommended by the standards-setting committee and Maryland which recently transitioned to the Praxis 7801 (Elementary Education Content Knowledge for Teaching) and consequently few test takers have been able to retake the test Best-attempt pass rates for states with weaker testing systems includes data for Alabama Alaska Hawaii Illinois Indiana Iowa Maryland Michigan Nebraska Nevada and North Dakota
Average first-attempt pass rates ranged from 38 in Hawaii (Hawaii offers candidates ways to demonstrate content knowledge other than a licensure test including having a degree in the content area coursework in the content area or National Board Certification) to 90 in Nebraska For this analysis averages are calculated with the state as the unit of analysis meaning that pass rates are averaged across all states regardless of the number of test takers in a state In the two states that reported pass rates on multiple tests (Alaska because candidates can choose among several tests and Maryland because the state was transitioning among tests during the time period) the statersquos average pass rates were weighted based on the number of people taking each test
27 This reflects the average best-attempt pass rate on the composite test across 28 states that provided best-attempt composite data Alabama Alaska Arkansas Colorado Connecticut Delaware District of Columbia Florida Hawaii Idaho Illinois Indiana Iowa Kentucky Louisiana Maryland Michigan Nebraska Nevada New Hampshire New Jersey North Dakota Rhode Island South Carolina Vermont Virginia West Virginia and Wyoming In Alaska and Maryland which had multiple tests in use during the relevant time period pass rates reflect a weighted average based on the number of people taking each test
This data tells the story at a high level but is ripe for further exploration For example preparation programs can use a roster verification process like they do for Title II data to learn more about which program at the institution the test takers were enrolled in (if any) what courses they were taking when in their preparation they took the licensure test and so on
28 State education agencies and preparation programs can use this data as a starting point and can dig deeper to understand the passing rates The percentage point difference in first-attempt pass rates is based on composite pass rates for 25 states Alabama Alaska Arkansas ColoradoConnecticut Delaware District of Columbia Florida Hawaii Idaho Kentucky LouisianaMaryland Michigan Nebraska Nevada New Hampshire New Jersey North Dakota Rhode IslandSouth Carolina Vermont Virginia West Virginia and Wyoming In Alaska only one of three testsreported pass rates for multiple institutions the other two tests had low numbers of test takers InMaryland the ranges between institutions were 45 percentage points on one test and 49 percentagepoints on the other these ranges were averaged together to calculate the statersquos range in pass ratesamong institutions
29 These states are Connecticut Florida Louisiana New Jersey South Carolina and Virginia
30 A study of Massachusettsrsquo MTEL test found that teacher candidates of color who fail on theirfirst attempt are 7 to 13 percentage points less likely to retake the test within one year Cowan J Goldhaber D Jin Z amp Theobald R (2020) Teacher licensure tests Barrier or predictive tool
CALDER Working Paper No 245-1020 Retrieved from httpscaldercenterorgpublicationsteacher-licensure-tests-barrier-or-predictive-tool
4 4NCTQ Driven by Data | Using licensure tests to build a strong diverse teacher workforce (2021)
31 In states with a test with multiple subtests candidates who fail any part of the test can retake a single subtest again For that reason data on test takersrsquo number of attempts is only available at the subtest level and not at the composite-test level NCTQ selected the subtest with the lowest first-attempt pass rate in each state for this analysis as candidates must pass all subtests in order to pass the overall test Most commonly social studies had the lowest pass rate (in 13 states) The states included in this calculation of ldquowalk-away ratesrdquo are Alabama Alaska Arkansas Colorado Connecticut Delaware District of Columbia Florida Hawaii Idaho Kentucky Louisiana Maryland Nebraska Nevada New Hampshire New Jersey North Dakota Rhode Island South Carolina Vermont Virginia West Virginia and Wyoming
Note that Florida is able to distinguish between test takers who are enrolled in teacher prep programs (ldquoprogram test takerrdquo) and those who are not Because the purpose of this analysis is to learn what proportion of aspiring teachers stay in the teacher pipeline all non-program test takers were excluded from the analysis of Floridarsquos data If all Florida test takers were included 28 of all test takers and 36 of test takers of color who failed on their first attempt would not retake the test during the testing window
Note that only data for Marylandrsquos test The Praxis 5019 (Elementary Education Instructional Practice and Applications) which is no longer in use is used here The Praxis 7801 (Elementary Education Content Knowledge for Teaching) test had not been in place long enough for most test takers to have the opportunity to retake the test during the relevant time period and therefore would not be meaningful for this analysis
32 To calculate the ldquowalk-away raterdquo we first calculate how many people fail on the first attempt (all people who take the test the first time minus those who pass on their first attempt) We then calculate how many people fail the test and donrsquot retake it (the number who take the test only once based on data on the number of attempts minus the number who pass on their first attempt) To calculate the ldquowalk-away raterdquo or the proportion of test takers who fail the test on their first attempt and do not retake it we divide the number of test takers who fail the test and donrsquot retake it by the total number who failed on the first attempt While this calculation is imperfect (because test takers may choose to retake the test after the three-year window and because some states offer alternative means to demonstrate content knowledge besides a licensure test) it gives a good approximation of the proportion of aspiring teachers who leave the pathway into the classroom at this point
33 Admissions selectivity is measured using undergraduate elementary program ratings from the 2021 Teacher Prep Review which considers mean university SATACT scores Barronrsquos selectivity ratings (in the absence of data on SATACT scores) minimum GPA and admissions test requirements for the preparation program and mean GPA for the most recently admitted cohort of teacher candidates provided by the program ldquoVery selectiverdquo represents an A on the Teacher Prep Review Admissions standard ldquoSelectiverdquo a B ldquoModerately selectiverdquo a C ldquoLess selectiverdquo a D and ldquoNot selectiverdquo an F This report only uses the Admissions standard grade for undergraduate programs and not for graduate programs For more information about these categories and the scoring methodology see httpswwwnctqorgreviewstandardAdmissionsabout
34 Pennsylvania was able to provide subtest-level pass rates but not composite pass rates The Module 3 subtest includes math science and health Note that institutions that were not rated on selectivity are excluded from this figure
35 When available this analysis uses pass rates on the composite test When states were not able to provide composite pass rates this analysis uses pass rates on the subtest that had the lowest state average passing rate based on the assumption that the subtest represented the greatest challenge to test takers
36 This analysis uses the proportion of all undergraduate students at the institution who receive Pell grants based on IPEDS data The Pell grant recipient data is not specific to test takers or to those enrolled in teacher preparation programs
4 5NCTQ Driven by Data | Using licensure tests to build a strong diverse teacher workforce (2021)
On average for the time period of interest (2015-2018 academic years) 353 of undergraduate students received Pell grants (US Department of Education National Center for Education Statistics Integrated Postsecondary Education Data System (IPEDS) Student Financial Aid component final data (2008-09 - 2017-18) and provisional data (2018-19) Financial Aid What is the percent of undergraduate students awarded Pell grants Retrieved from httpsncesedgovipedsTrendGeneratorappanswer835) For that reason institutions are grouped by 35 or fewer undergraduates receiving Pell grants and 36 or more receiving Pell grants
37 Illinois was able to provide subtest-level pass rates but not composite pass rates The Subtest 1 includes language and literacy
38 When available this analysis uses pass rates on the composite test When states were not able to provide composite pass rates this analysis used pass rates on the subtest that had the lowest state average passing rate based on the assumption that the subtest represented the greatest challenge to test takers
39 It is possible that someone could pass the test and still take it again to raise her score However this is unlikely as state licensure generally only requires passing the test and anecdotal evidence suggests that licensure test scores are rarely a factor in the teacher hiring process
40
41
42
43
Data on the most commonly required elementary education content test the Praxis 5001 (Elementary Education Multiple Subjects) previously shared with NCTQ by ETS demonstrates that between 89 to 95 of test takers take each subtest only once or twice
The following examples require data on first-attempt and best-attempt pass rates and the number of test takers as well as the number of attempts for test takers
Racial composition of the teacher workforce drawn from US Department of Education Institute of Education Sciences National Center for Education Statistics (2019) Table 20922 Number and percentage distribution of teachers in public elementary and secondary schools by instructional level and selected teacher and school characteristics 1999-2000 and 2017-2018 In US Department of Education National Center for Education Statistics (Ed) Digest of education statistics Retrieved from httpsncesedgovprogramsdigestd19tablesdt19_20922
aspcurrent=yes
Racial diversity of the student population drawn from US Department of Education Institute of Education Sciences National Center for Education Statistics (2020) Table 20370 Percentage distribution of enrollment in public elementary and secondary schools by raceethnicity and state or jurisdiction Fall 2000 and fall 2018 In US Department of Education National Center for Education Statistics (Ed) Digest of education statistics Retrieved from
httpsncesedgovprogramsdigestd20tablesdt20_20370aspcurrent=yes
Racial diversity of the adult population is drawn from The Annie E Casey Foundation (2020) Adult population by race in the United States Kids Count
Data Center The Annie E Casey Foundation Retrieved from httpsdatacenterkidscountorgdatatables6539-adult-population-by-racedetailed1anyfalse172937871870573869368688671336869671270667128001351713518
For example students of color see greater achievement gains when taught by same-race teachers (Egalite A Kisida B amp Winters M (2015) Representation in the classroom The effect of own race teachers on student achievement Economics on Education Review 45 44-52 Goldhaber
D amp Hansen M (2010) Race gender and teacher testing How informative a tool is teacher licensure testing and how does it impact student achievement American Educational Research Journal 47(1) 218-51 Dee T S (2004) Teachers race and student achievement in a randomized experiment The Review of Economics and Statistics 86(1) 195-210) and for Black students
having even one Black teacher in elementary school is associated with an increased likelihood of high school graduation and college matriculation (Gershenson S Hart C M D Hyman J Lindsay C amp Papageorge N W (2018) The long-run impacts of same-race teachers (NBER
Working Paper No 25254) Retrieved from httpswwwnberorgpapersw25254)
4 6NCTQ Driven by Data | Using licensure tests to build a strong diverse teacher workforce (2021)
44
45
46
47
48
49
Goldhaber D Lavery L amp Theobald R (2015) Uneven playing field Assessing the teacher quality gap between advantaged and disadvantaged students Educational Researcher 44(5)
293-307 Goldhaber D Quince V amp Theobald R (2018) How did it get this way Disentangling
the sources of teacher quality gaps across two states Working Paper No 209-1118-1 National
Center for Analysis of Longitudinal Data in Education Research (CALDER) Retrieved from https
caldercenterorgsitesdefaultfilesCALDER20WP20209-1118-1pdf Goldhaber D Quince
V amp Theobald R (2018) Has it always been this way Tracing the evolution of teacher quality gaps in US public schools American Educational Research Journal 55(1) 171-201
Putman H Hansen M Walsh K amp Quintero D (2016) High hopes and harsh realities The
real challenges to building a diverse workforce Brookings Institution Hopper E B Robinson
D amp Fitchett P (2021) Early career African American teachers and the impact of administrative support Urban Education 0042085920988335
For this analysis averages are calculated with the state as the unit of analysis meaning that pass rates are averaged across all states regardless of the number of test takers in a state In the two states that reported pass rates on multiple tests (Alaska because candidates can choose among several tests and Maryland because the state was transitioning among tests during the time period) the average pass rates were weighted based on the number of people taking each test
When available this analysis uses pass rates on the composite test When states were not able to provide composite pass rates this analysis used pass rates on the subtest that had the lowest state average passing rate based on the assumption that the subtest represented the greatest challenge to test takers
Educators for Excellence (2020) Voices from the classroom A survey of Americarsquos educators Retrieved from httpse4eorgsitesdefaultfilesvoices_from_the_classroom_2020pdf
First-time pass rates in most other professions are much higher than in education For example the first-time pass rate for nurses is 85 and for nuclear engineers it is 71 Putman H amp Walsh K (2019) A Fair Chance Simple steps to strengthen and diversify the teacher workforce National Council on Teacher Quality Retrieved from httpswwwnctqorg
publicationsA-Fair-Chance
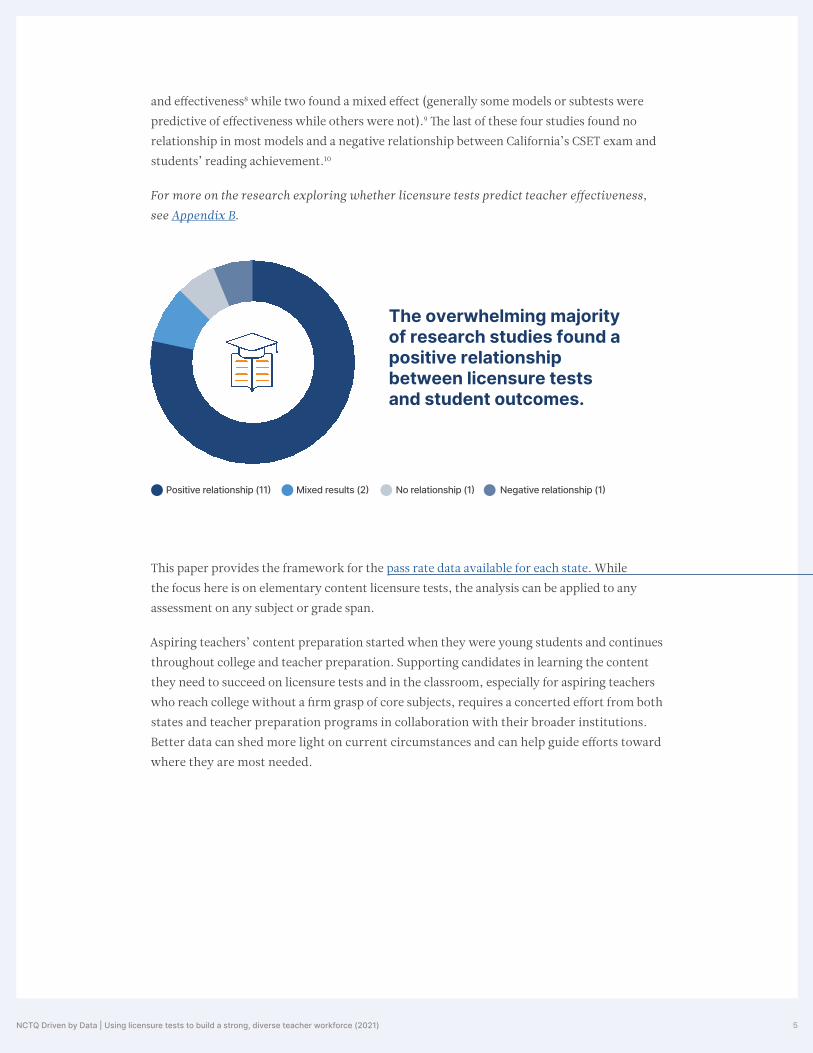
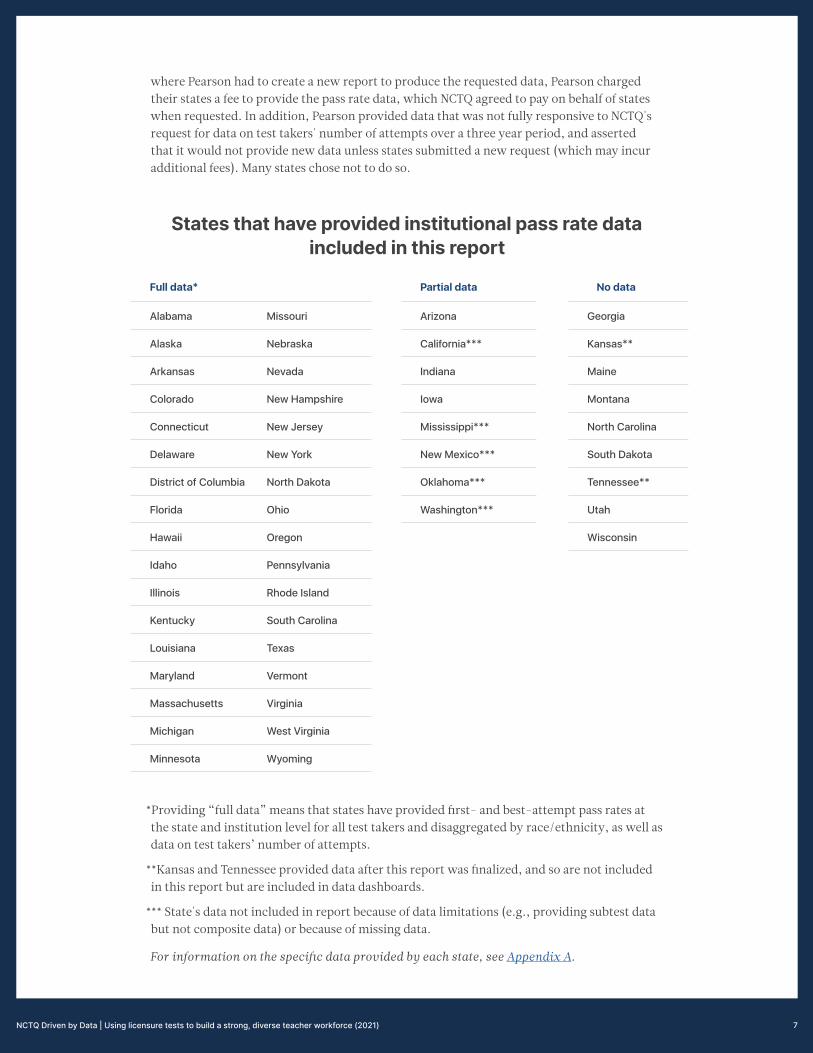
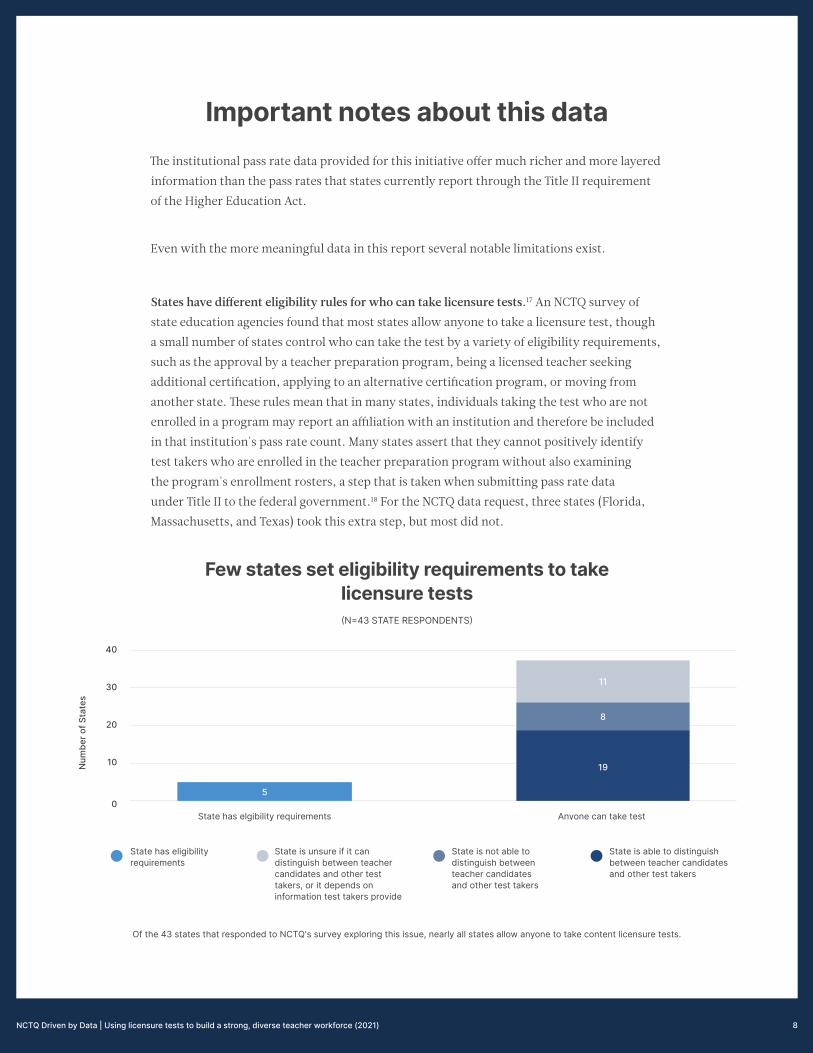
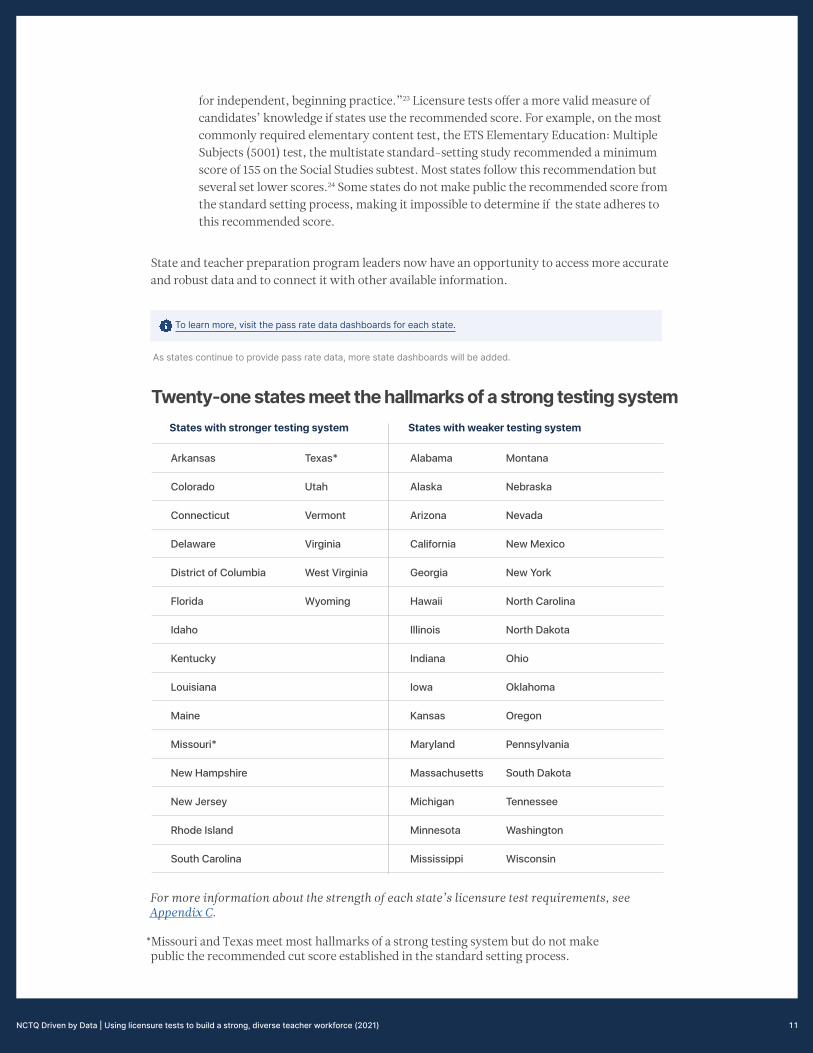
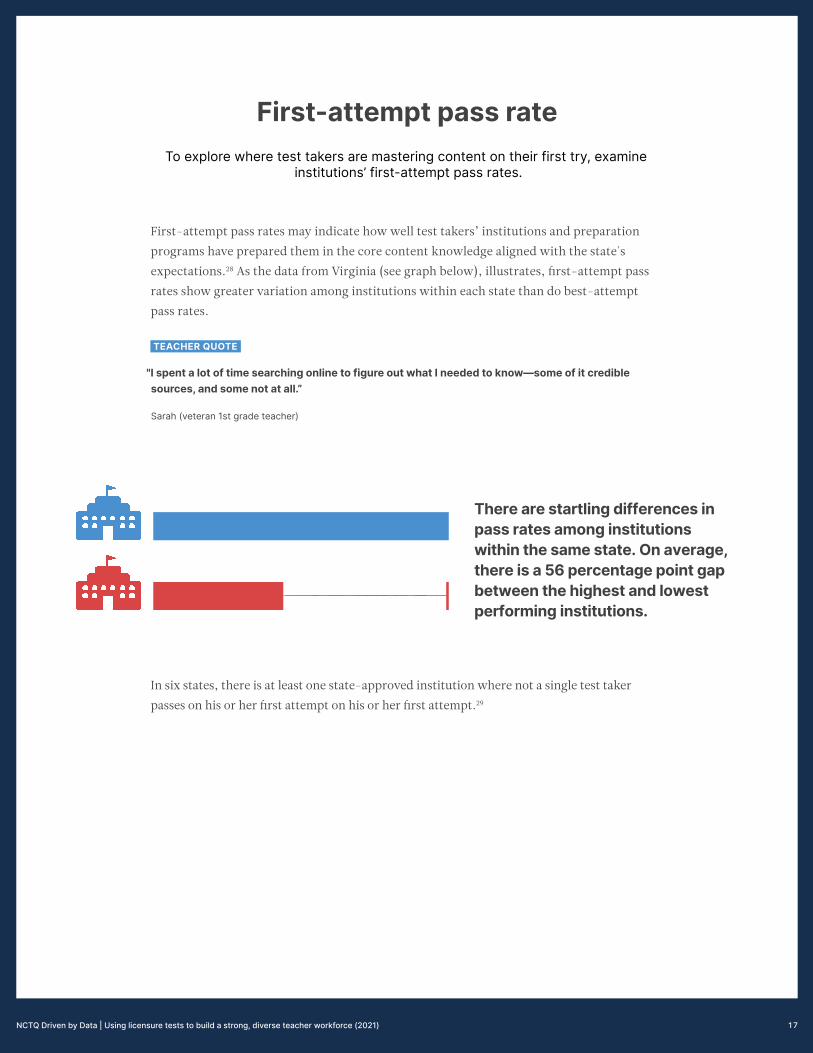
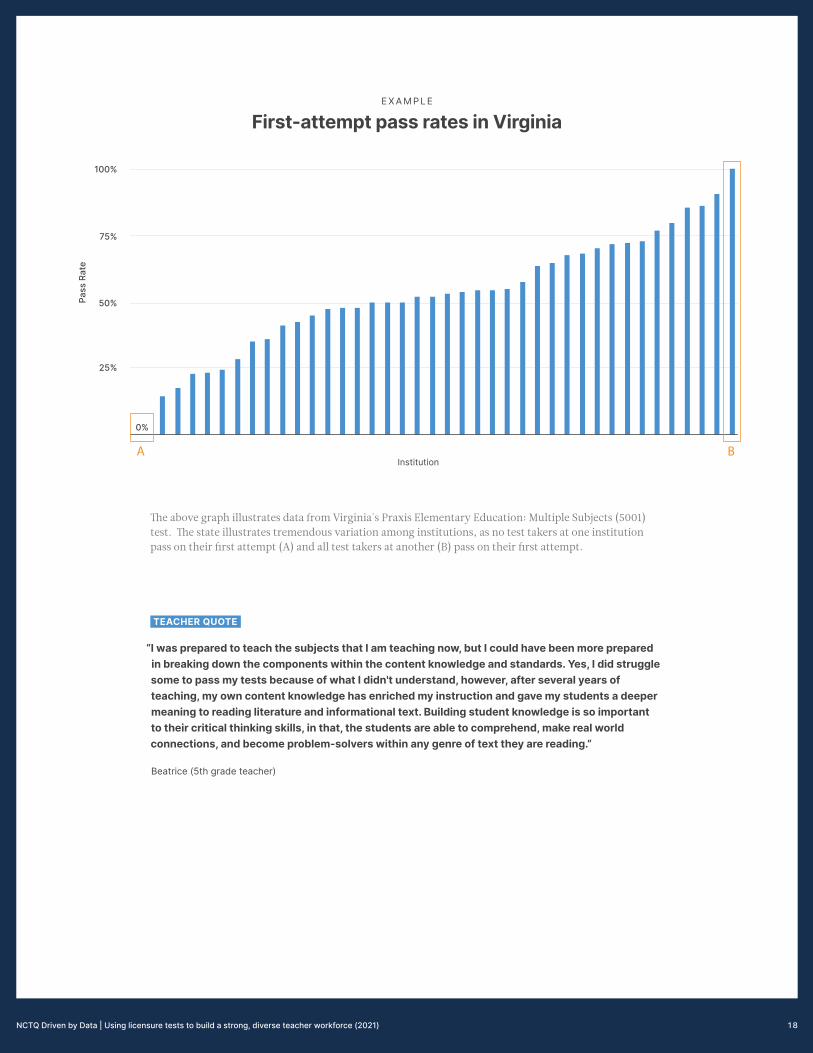
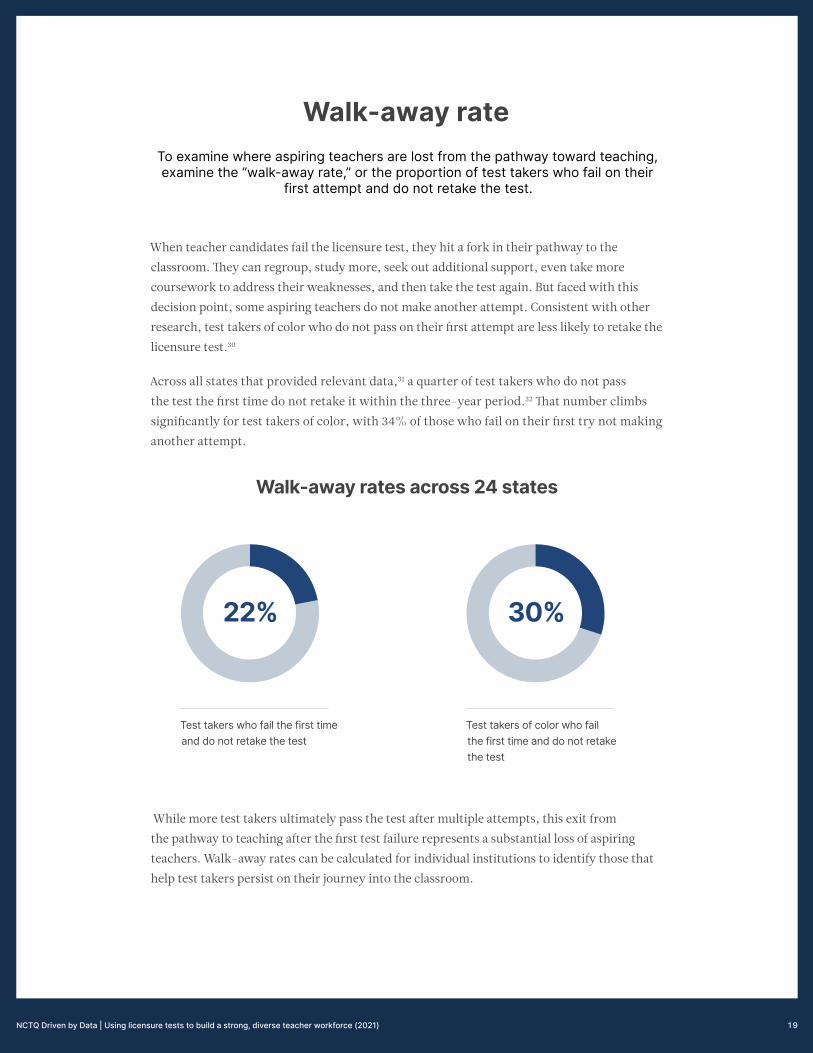
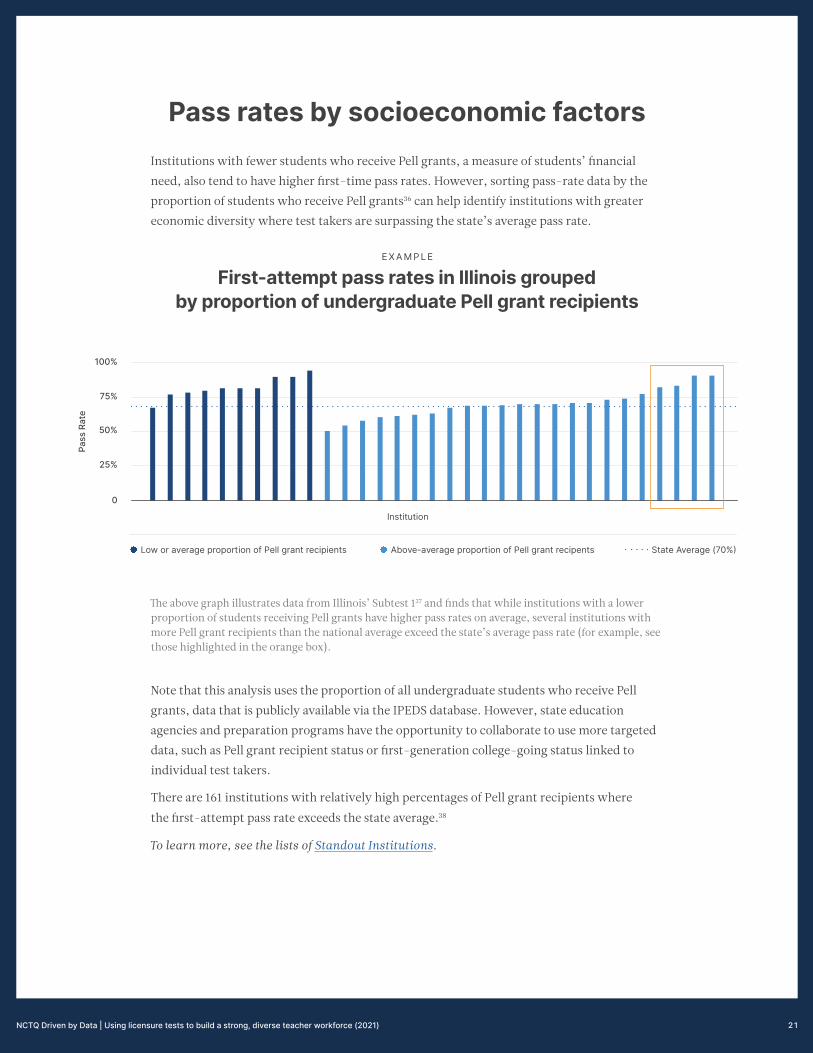
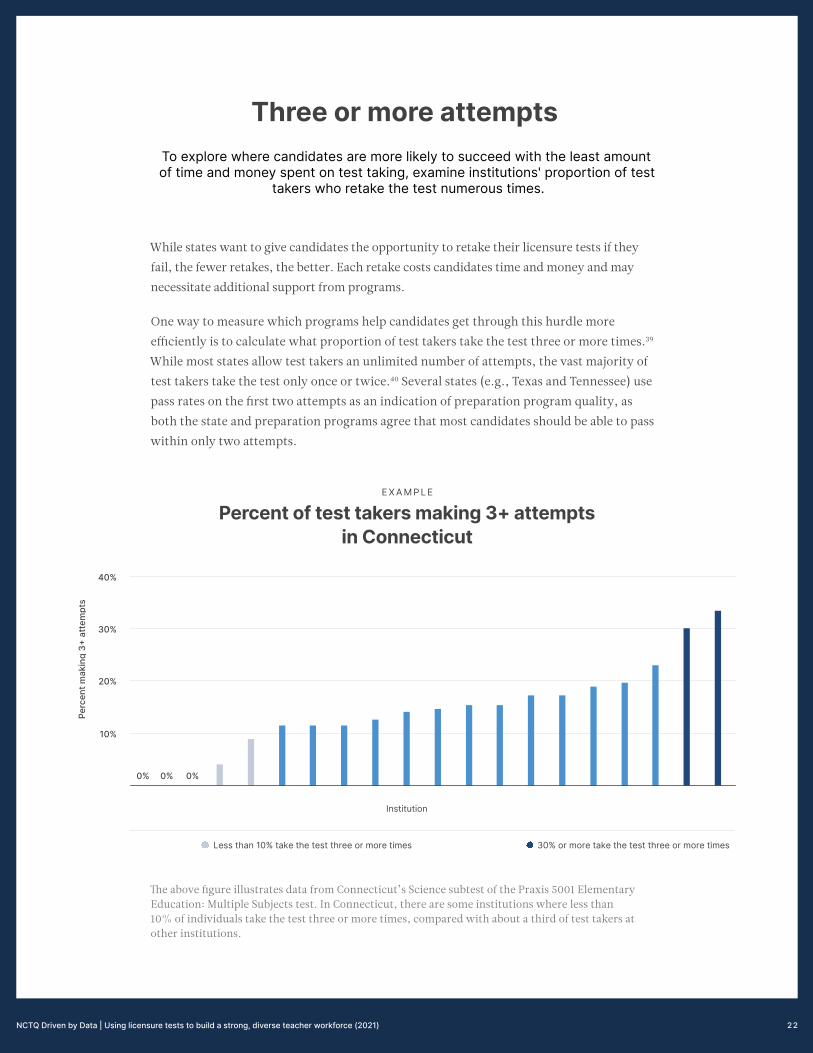


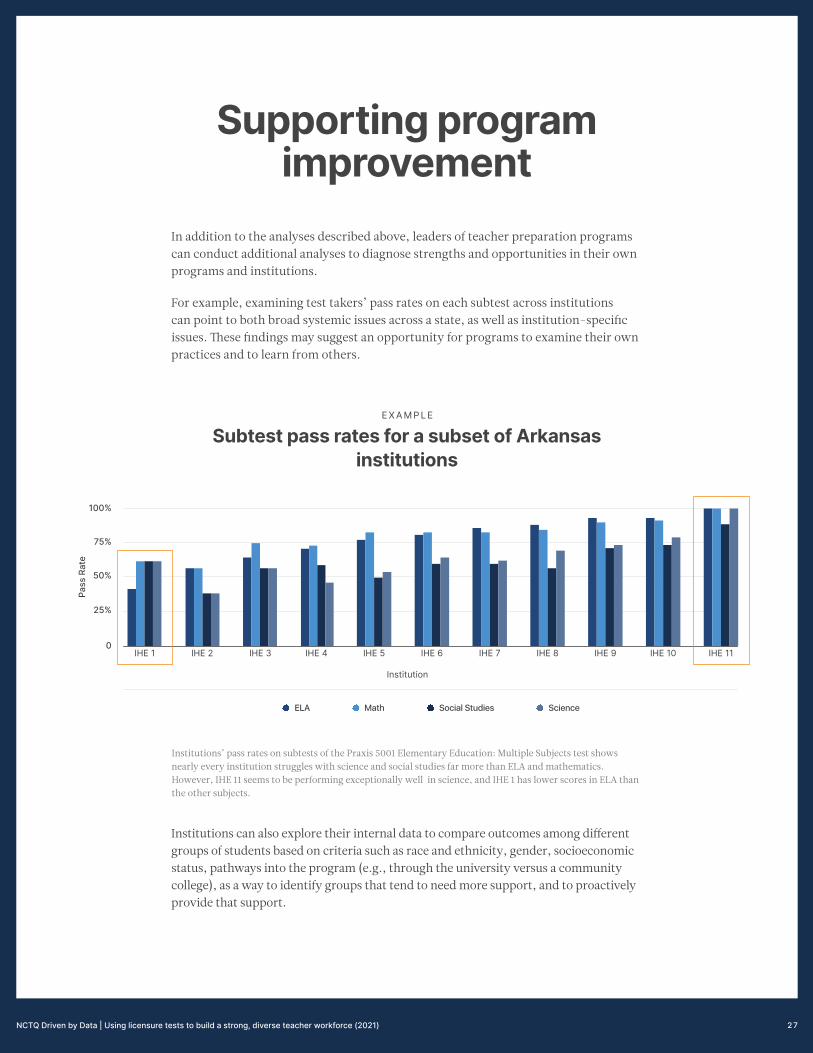


.pdfBCLK Bit clock line, driven by external oscillator. FSYNC The frame sync line. This is driven by the master. DATA Data line, driven by one of](https://static.fdocuments.us/doc/165x107/61179666f7ae9450565803da/i2stdm-library-userguide300rc2pdf-bclk-bit-clock-line-driven-by-external.jpg)
![A repository of real-world datasets for data-driven …...driven by data collected in simulations or experiments are formulated as data-driven optimization problems [1], which pose](https://static.fdocuments.us/doc/165x107/5fbea7f5eb1b96684e6dbf57/a-repository-of-real-world-datasets-for-data-driven-driven-by-data-collected.jpg)