Drive suppliers Continuous Improvement through 3 key steps - Kabadi … · Drive suppliers’...
24
Drive supplier s’ Continuous Improvement through 3 key s t eps Self-assessment and reporting Level 3: Delivering improvements Level 2: Setting goals Impr ovement Capacity Building Level 1: Measuring performance and demonstrating compliance
Transcript of Drive suppliers Continuous Improvement through 3 key steps - Kabadi … · Drive suppliers’...
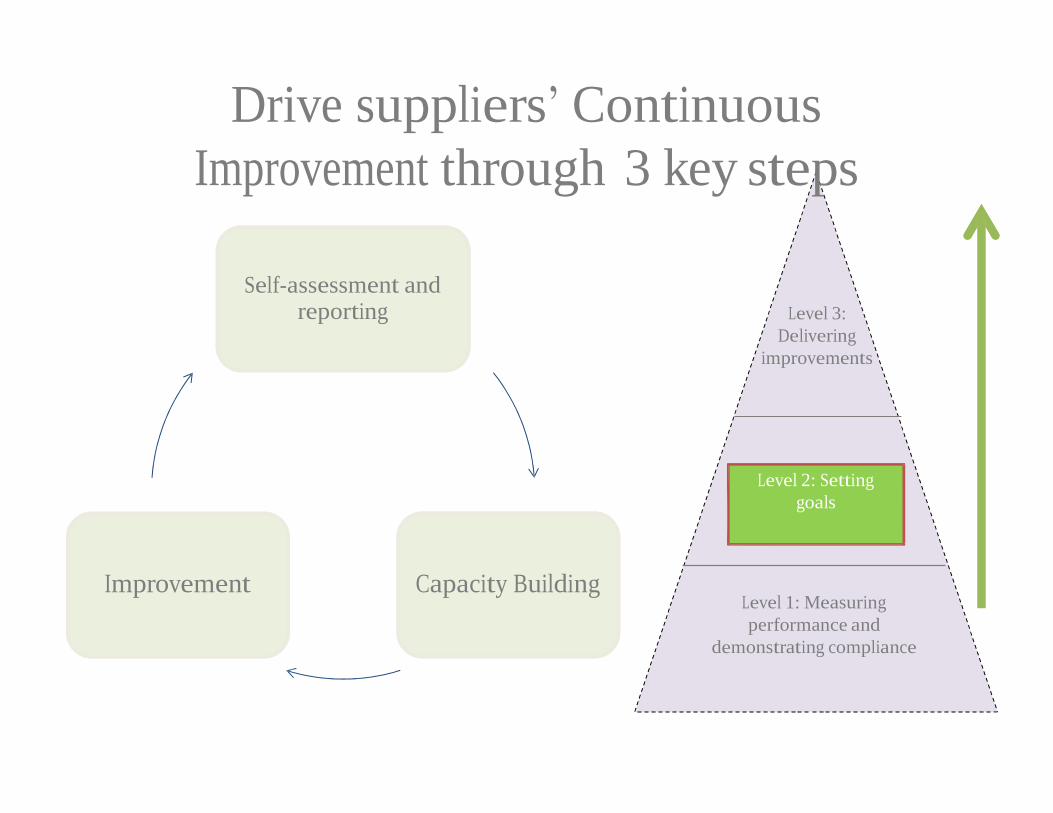
Drive suppliers’ Continuous
Improvement through 3 key steps
Self-assessment and reporting
Level 3:
Delivering
improvements
Level 2: Setting
goals
Improvement Capacity Building
Level 1: Measuring
performance and
demonstrating compliance
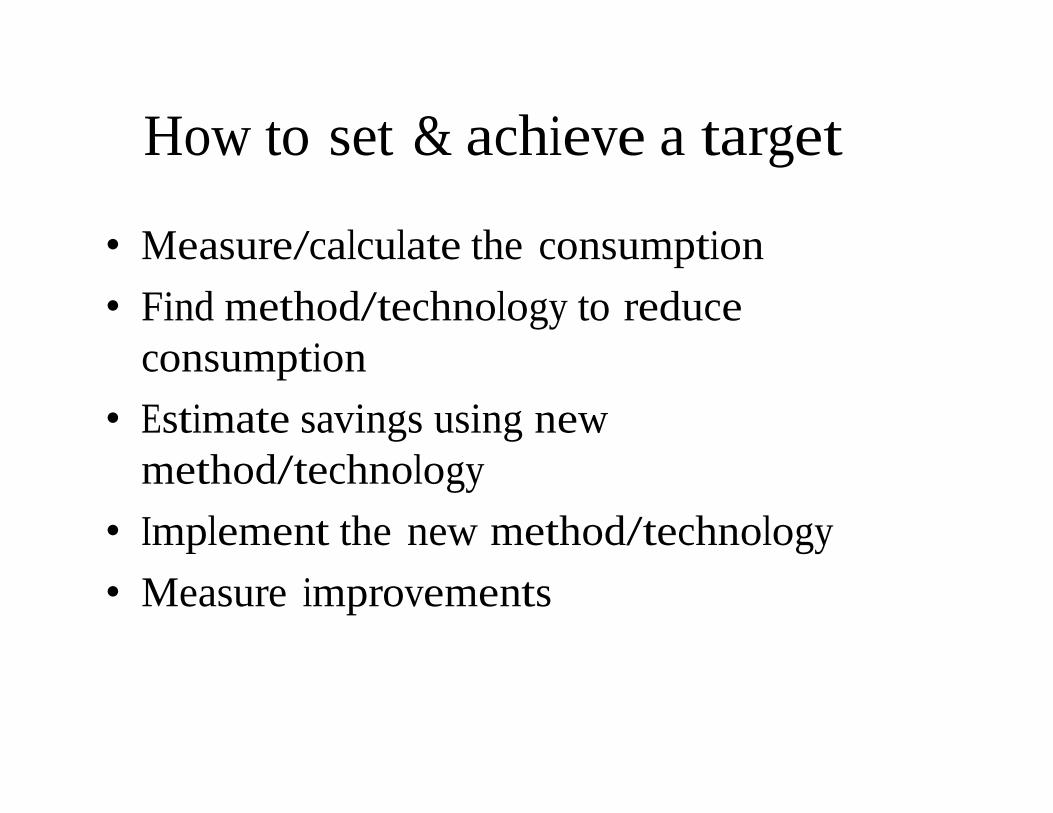
How to set & achieve a target
• Measure/calculate the consumption
• Find method/technology to reduce
consumption
• Estimate savings using new
method/technology
• Implement the new method/technology
• Measure improvements
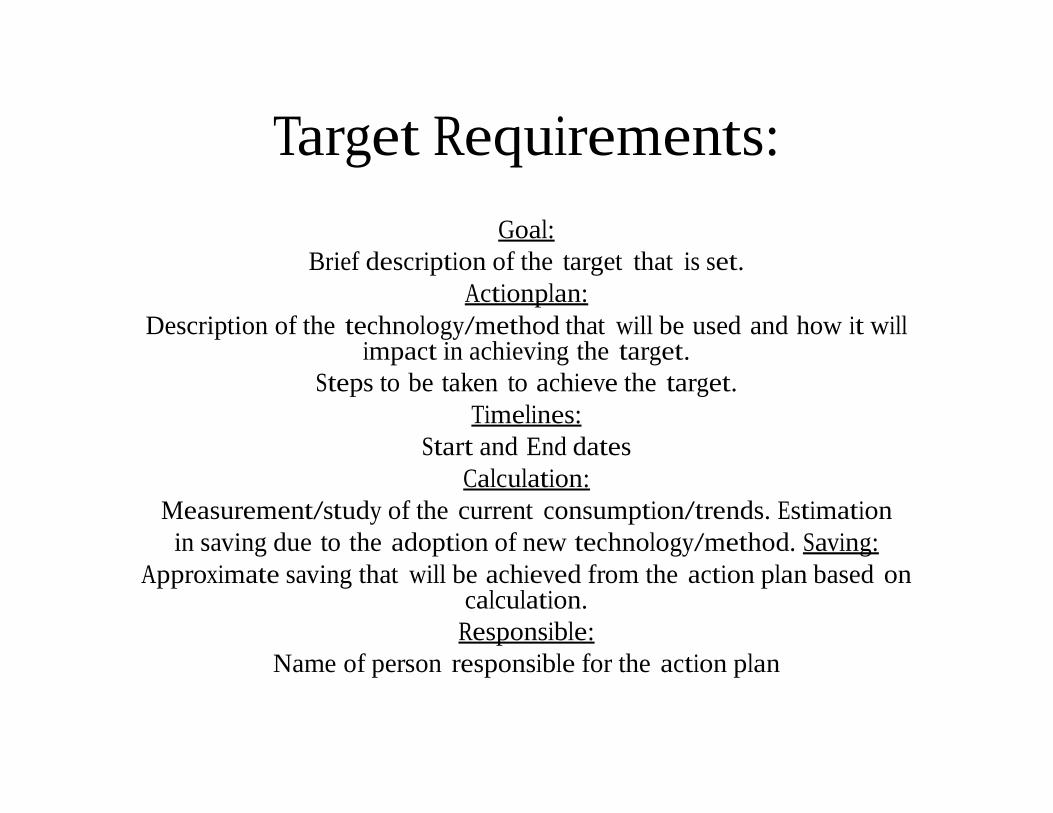
Target Requirements:
Goal:
Brief description of the target that is set.
Action plan:
Description of the technology/method that will be used and how it will impact in achieving the target.
Steps to be taken to achieve the target.
Timelines:
Start and End dates
Calculation:
Measurement/study of the current consumption/trends. Estimation
in saving due to the adoption of new technology/method. Saving:
Approximate saving that will be achieved from the action plan based on calculation.
Responsible:
Name of person responsible for the action plan
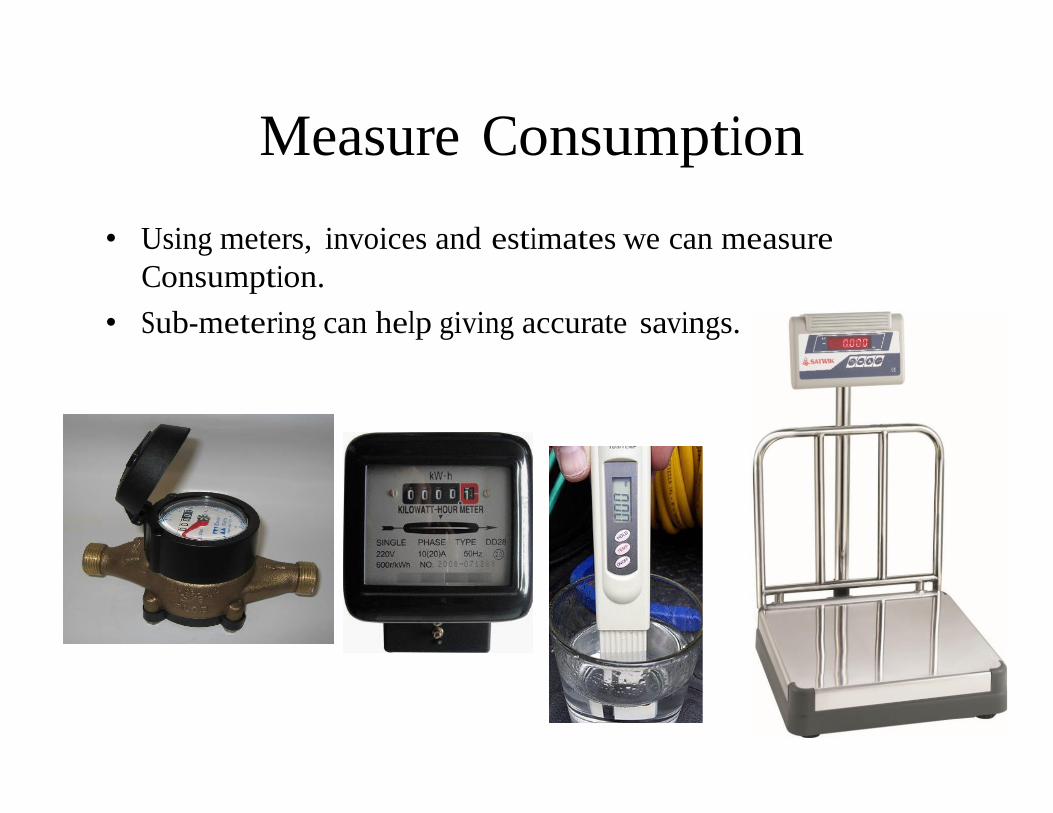
Measure Consumption
• Using meters, invoices and estimates we can measure
Consumption.
• Sub-metering can help giving accurate savings.
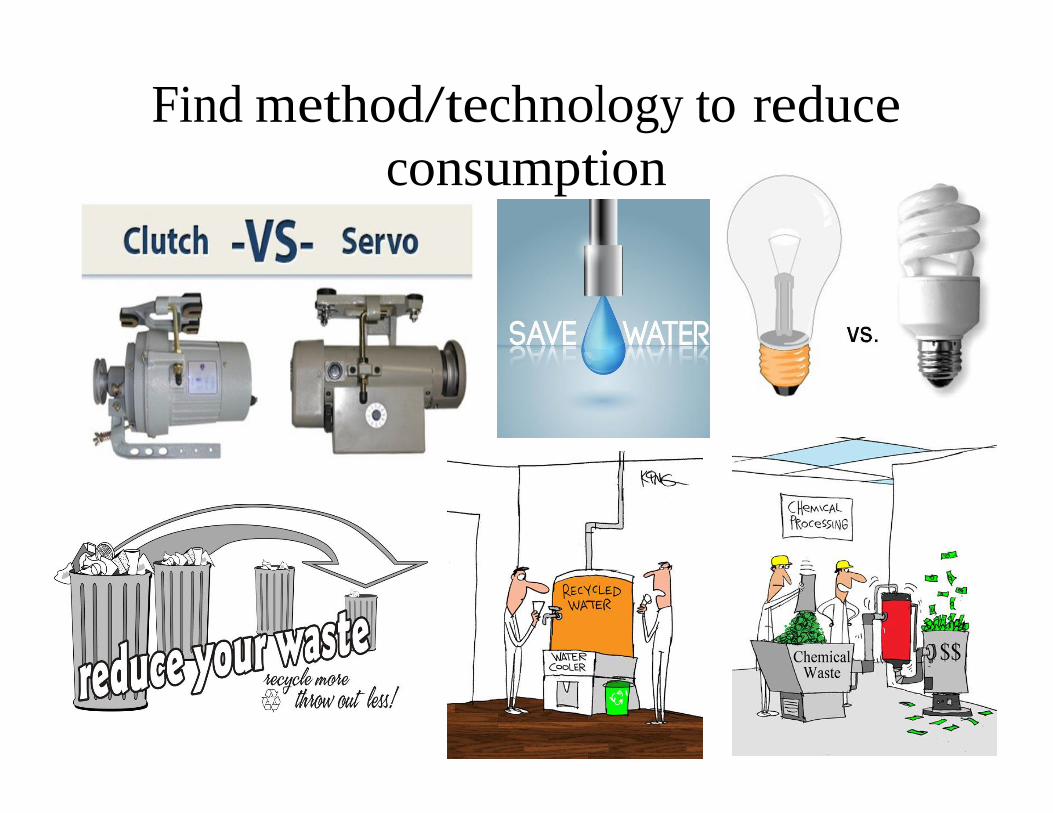
Find method/technology to reduce
consumption
Energy Use
Energy & GHG Level 2
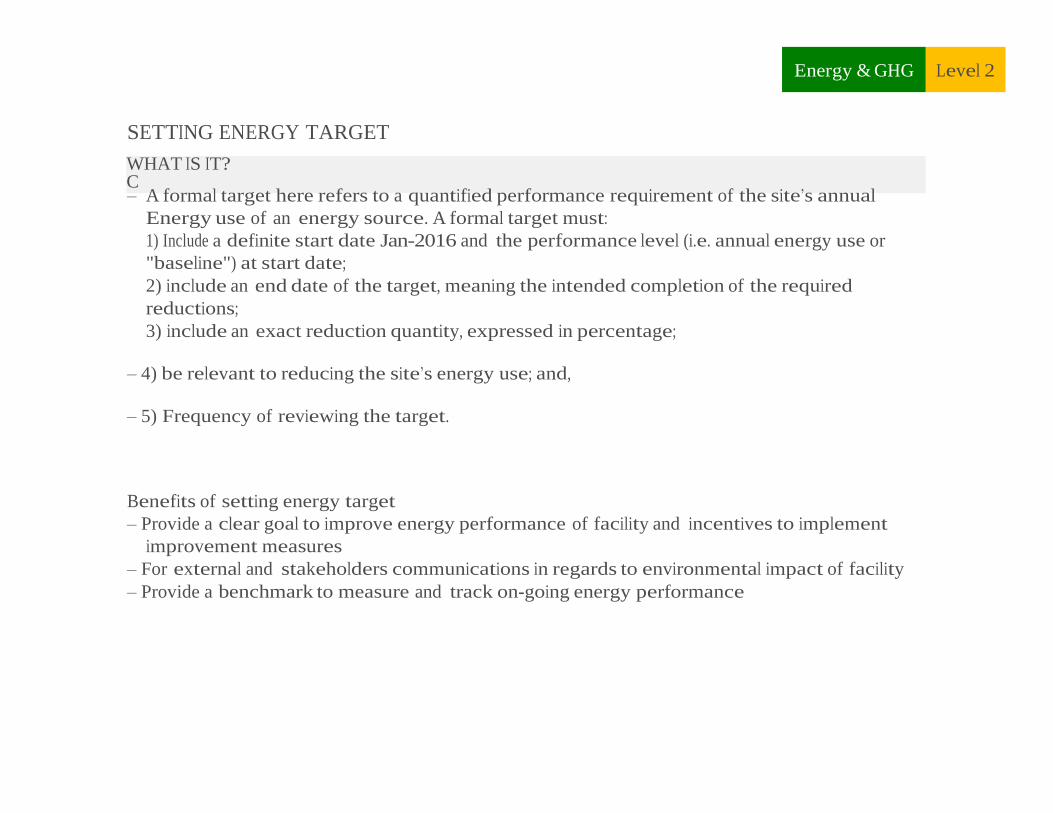
SETTING ENERGY TARGET
WHAT IS IT? C – A formal target here refers to a quantified performance requirement of the site’s annual
Energy use of an energy source. A formal target must:
1) Include a definite start date Jan-2016 and the performance level (i.e. annual energy use or
"baseline") at start date;
2) include an end date of the target, meaning the intended completion of the required
reductions;
3) include an exact reduction quantity, expressed in percentage;
– 4) be relevant to reducing the site’s energy use; and,
– 5) Frequency of reviewing the target.
Benefits of setting energy target
– Provide a clear goal to improve energy performance of facility and incentives to implement
improvement measures
– For external and stakeholders communications in regards to environmental impact of facility
– Provide a benchmark to measure and track on-going energy performance
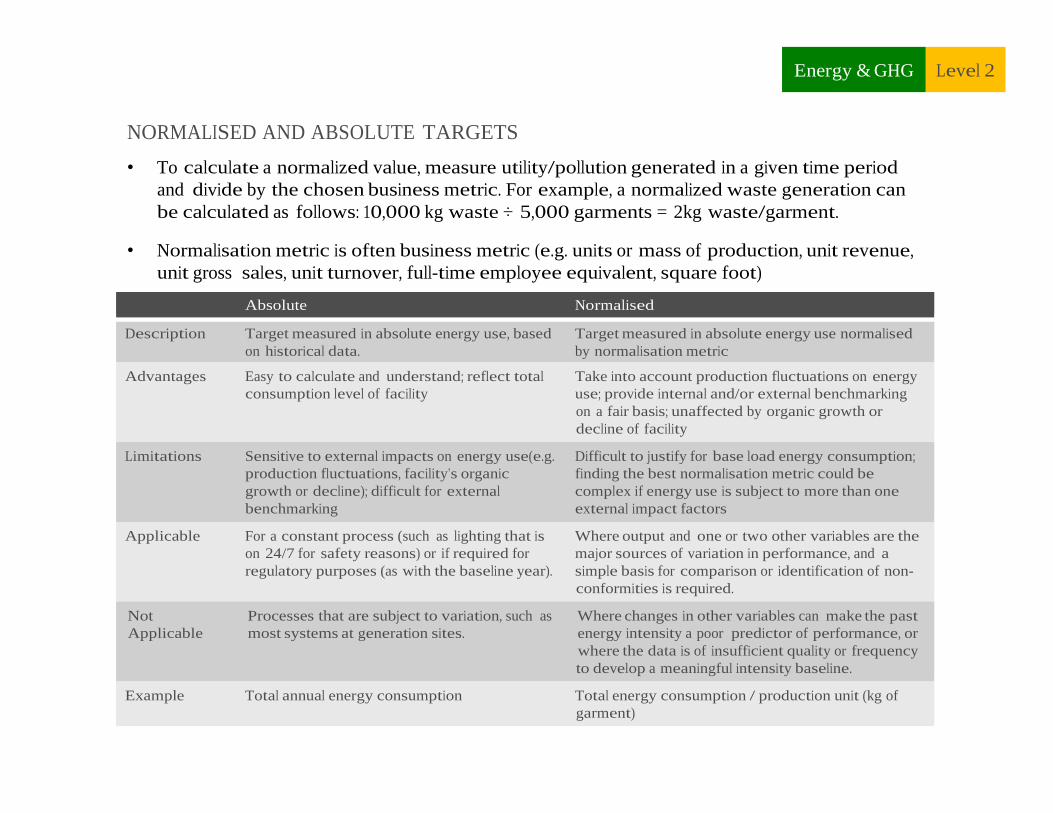
Absolute Normalised
Description Target measured in absolute energy use, based Target measured in absolute energy use normalised
on historical data. by normalisation metric
Advantages Easy to calculate and understand; reflect total Take into account production fluctuations on energy
consumption level of facility use; provide internal and/or external benchmarking
on a fair basis; unaffected by organic growth or
decline of facility
Limitations Sensitive to external impacts on energy use(e.g. Difficult to justify for base load energy consumption;
production fluctuations, facility’s organic finding the best normalisation metric could be
growth or decline); difficult for external complex if energy use is subject to more than one
benchmarking external impact factors
Applicable For a constant process (such as lighting that is Where output and one or two other variables are the
on 24/7 for safety reasons) or if required for major sources of variation in performance, and a
regulatory purposes (as with the baseline year). simple basis for comparison or identification of non-
conformities is required.
Not Processes that are subject to variation, such as Where changes in other variables can make the past
Applicable most systems at generation sites. energy intensity a poor predictor of performance, or
where the data is of insufficient quality or frequency
to develop a meaningful intensity baseline.
Example Total annual energy consumption Total energy consumption / production unit (kg of
garment)
Energy & GHG Level 2
NORMALISED AND ABSOLUTE TARGETS
• To calculate a normalized value, measure utility/pollution generated in a given time period
and divide by the chosen business metric. For example, a normalized waste generation can
be calculated as follows: 10,000 kg waste ÷ 5,000 garments = 2kg waste/garment.
• Normalisation metric is often business metric (e.g. units or mass of production, unit revenue,
unit gross sales, unit turnover, full-time employee equivalent, square foot)
Energy & GHG Level 2
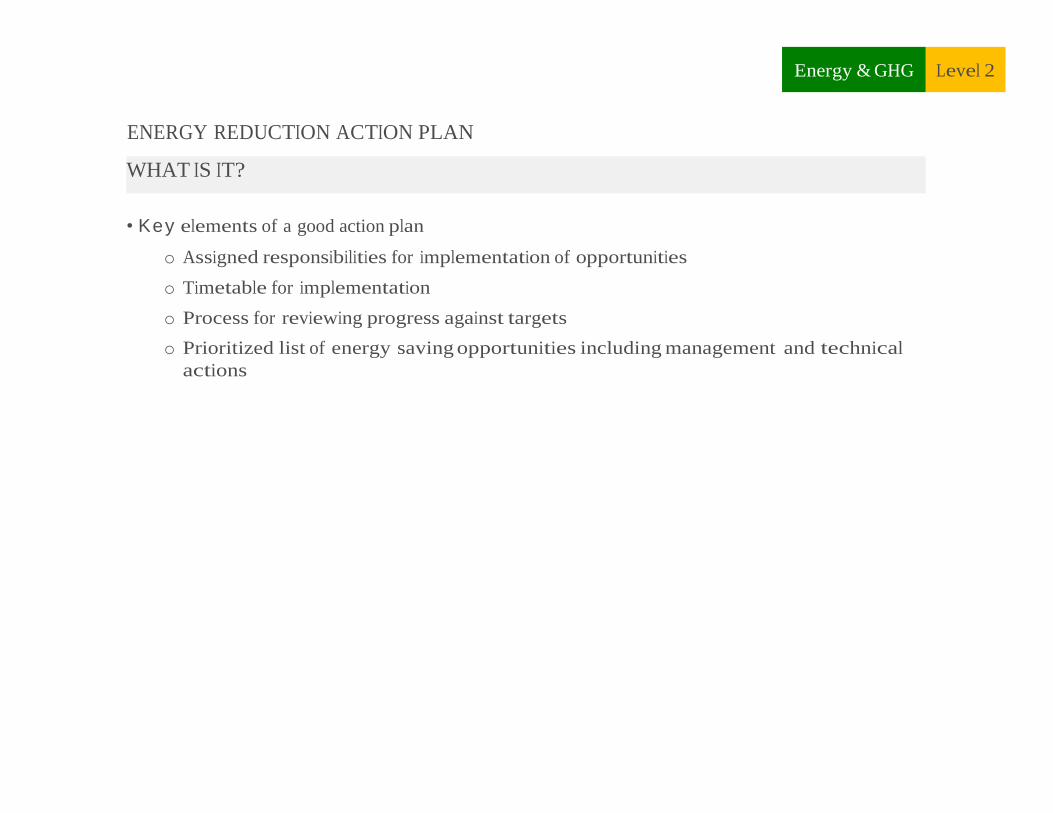
ENERGY REDUCTION ACTION PLAN
WHAT IS IT?
• Key elements of a good action plan
o Assigned responsibilities for implementation of opportunities
o Timetable for implementation
o Process for reviewing progress against targets
o Prioritized list of energy saving opportunities including management and technical
actions
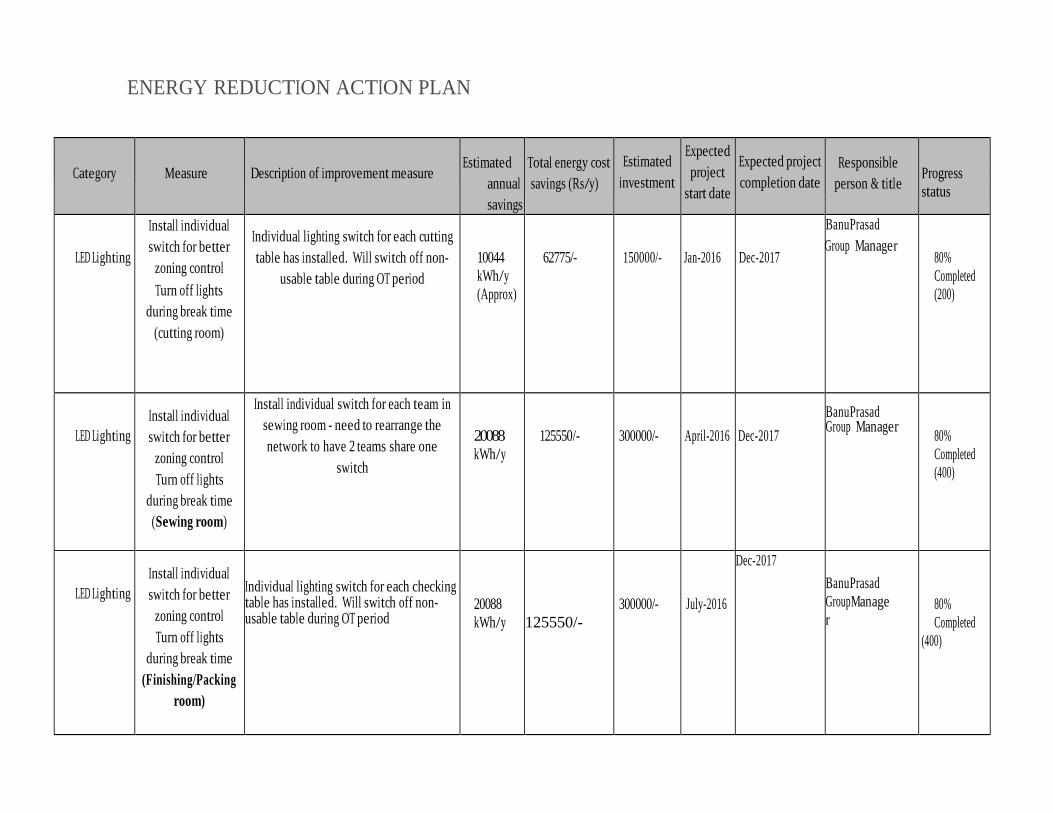
ENERGY REDUCTION ACTION PLAN
Category
Measure
Description of improvement measure
Estimated
annual
savings
Total energy cost
savings (Rs/y)
Estimated
investment
Expected
project
start date
Expected project
completion date
Responsible
person & title
Progress
status
LED Lighting
Install individual
switch for better
zoning control
Turn off lights
during break time
(cutting room)
Individual lighting switch for each cutting
table has installed. Will switch off non-
usable table during OT period
10044
kWh/y
(Approx)
62775/-
150000/-
Jan-2016
Dec-2017
BanuPrasad
Group Manager
80%
Completed
(200)
LED Lighting
Install individual
switch for better
zoning control
Turn off lights
during break time
(Sewing room)
Install individual switch for each team in
sewing room - need to rearrange the
network to have 2 teams share one
switch
20088
kWh/y
125550/-
300000/-
April-2016
Dec-2017
BanuPrasad Group Manager
80%
Completed
(400)
LED Lighting
Install individual
switch for better
zoning control
Turn off lights
during break time
(Finishing/Packing
room)
Individual lighting switch for each checking table has installed. Will switch off non-usable table during OT period
20088
kWh/y
125550/-
300000/-
July-2016
Dec-2017
BanuPrasad
GroupManage
r
80%
Completed
(400)
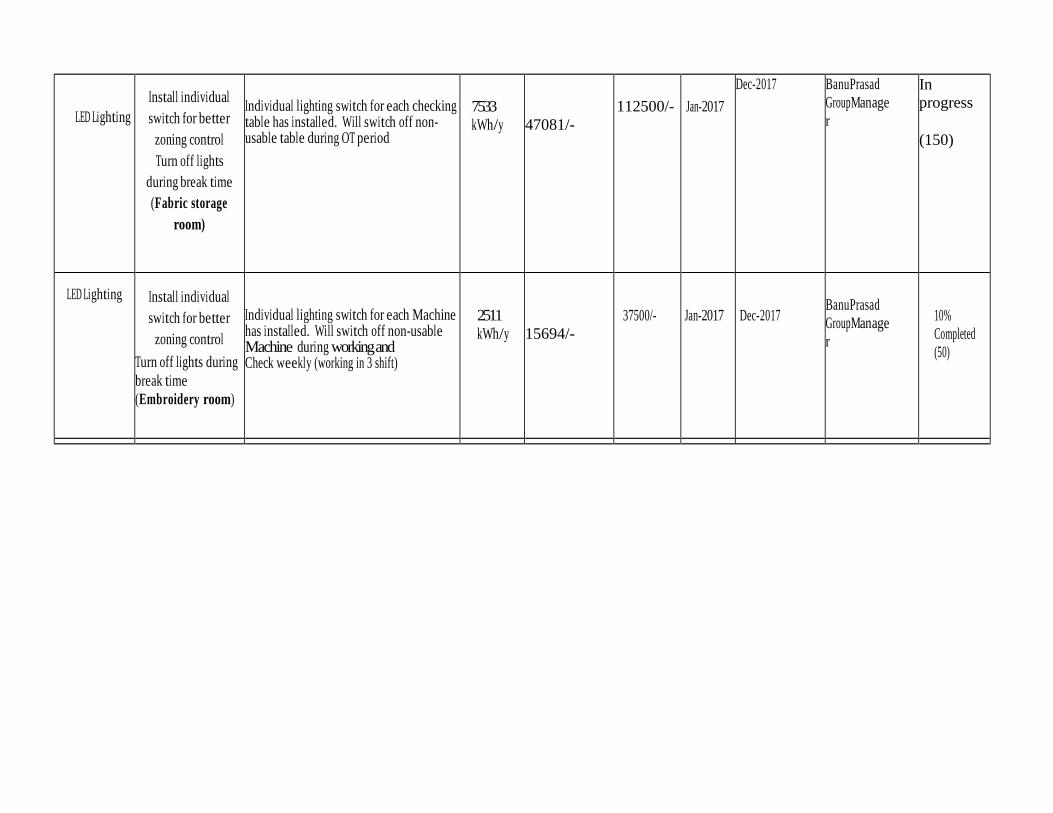
LED Lighting
Install individual
switch for better
zoning control
Turn off lights
during break time
(Fabric storage
room)
Individual lighting switch for each checking table has installed. Will switch off non-usable table during OT period
7533
kWh/y
47081/-
112500/-
Jan-2017
Dec-2017 BanuPrasad
GroupManage
r
In
progress
(150)
LED Lighting
Install individual
switch for better
zoning control
Turn off lights during
break time
(Embroidery room)
Individual lighting switch for each Machine has installed. Will switch off non-usable Machine during working and Check weekly (working in 3 shift)
2511
kWh/y
15694/-
37500/-
Jan-2017
Dec-2017
BanuPrasad
GroupManage
r
10%
Completed
(50)
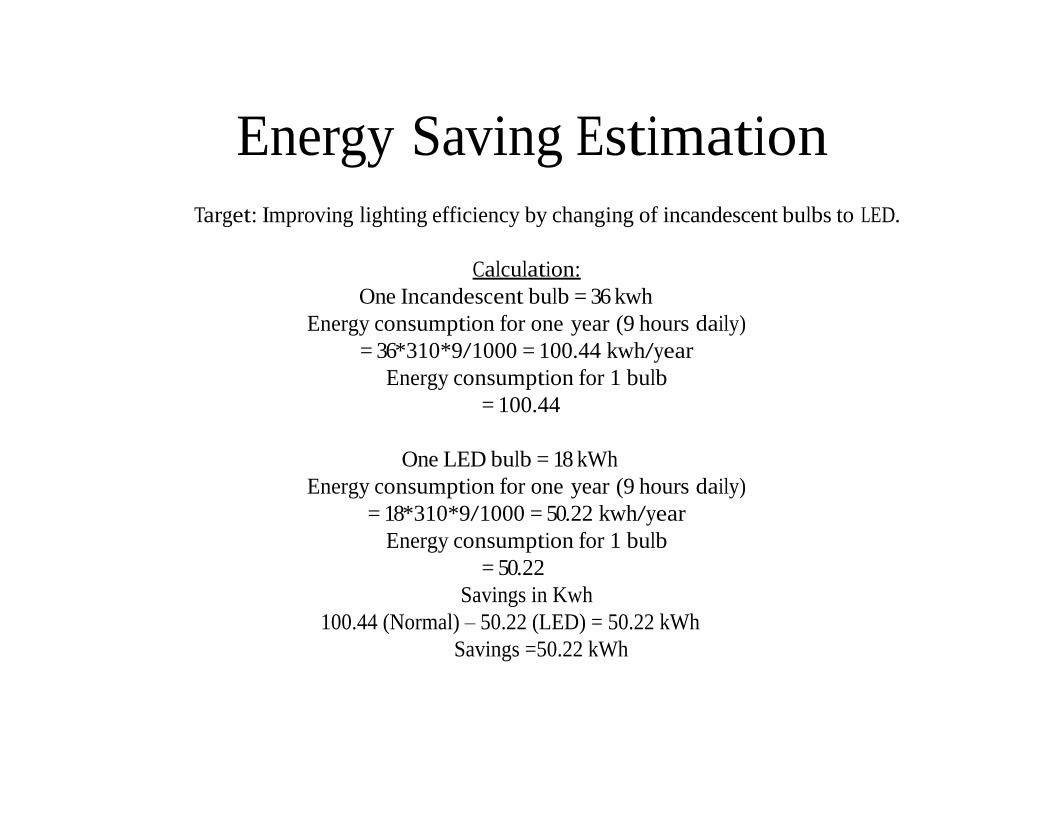
Energy Saving Estimation
Target: Improving lighting efficiency by changing of incandescent bulbs to LED.
Calculation:
One Incandescent bulb = 36 kwh
Energy consumption for one year (9 hours daily)
= 36*310*9/1000 = 100.44 kwh/year
Energy consumption for 1 bulb
= 100.44
One LED bulb = 18 kWh
Energy consumption for one year (9 hours daily)
= 18*310*9/1000 = 50.22 kwh/year
Energy consumption for 1 bulb
= 50.22
Savings in Kwh
100.44 (Normal) – 50.22 (LED) = 50.22 kWh
Savings =50.22 kWh
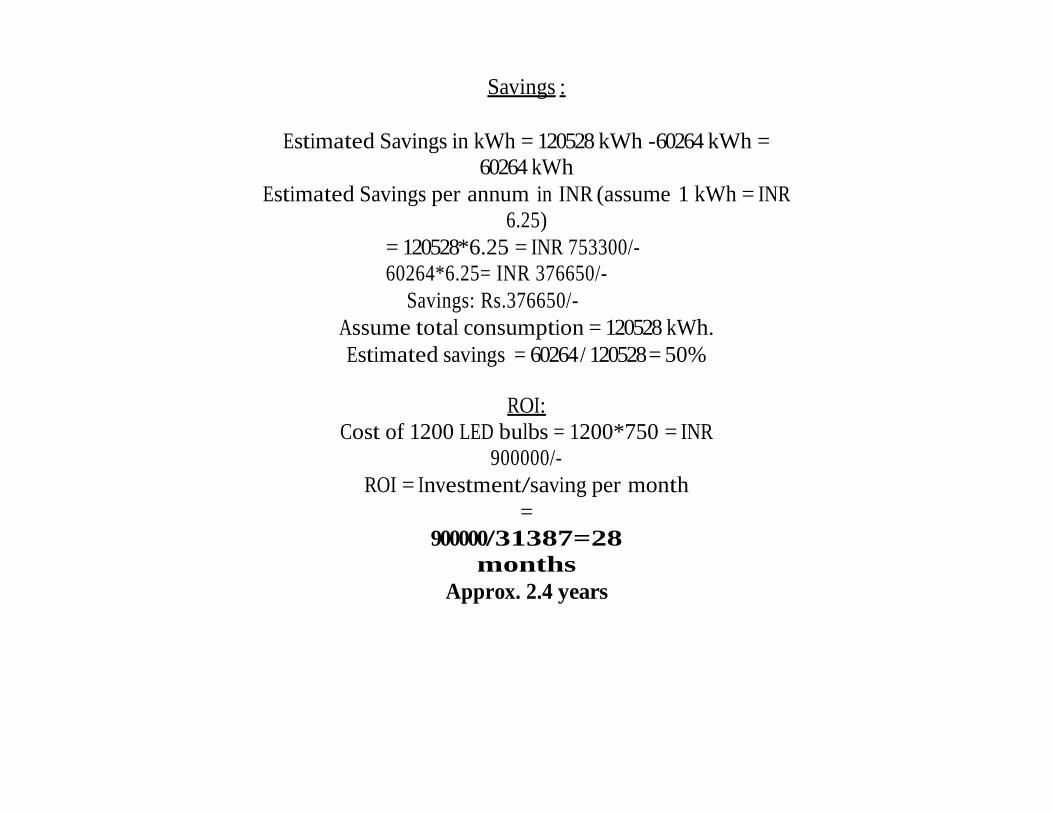
Savings :
Estimated Savings in kWh = 120528 kWh -60264 kWh =
60264 kWh
Estimated Savings per annum in INR (assume 1 kWh = INR
6.25)
= 120528*6.25 = INR 753300/-
60264*6.25= INR 376650/-
Savings: Rs.376650/-
Assume total consumption = 120528 kWh.
Estimated savings = 60264 / 120528 = 50%
ROI:
Cost of 1200 LED bulbs = 1200*750 = INR
900000/-
ROI = Investment/saving per month
=
900000/31387=28
months
Approx. 2.4 years
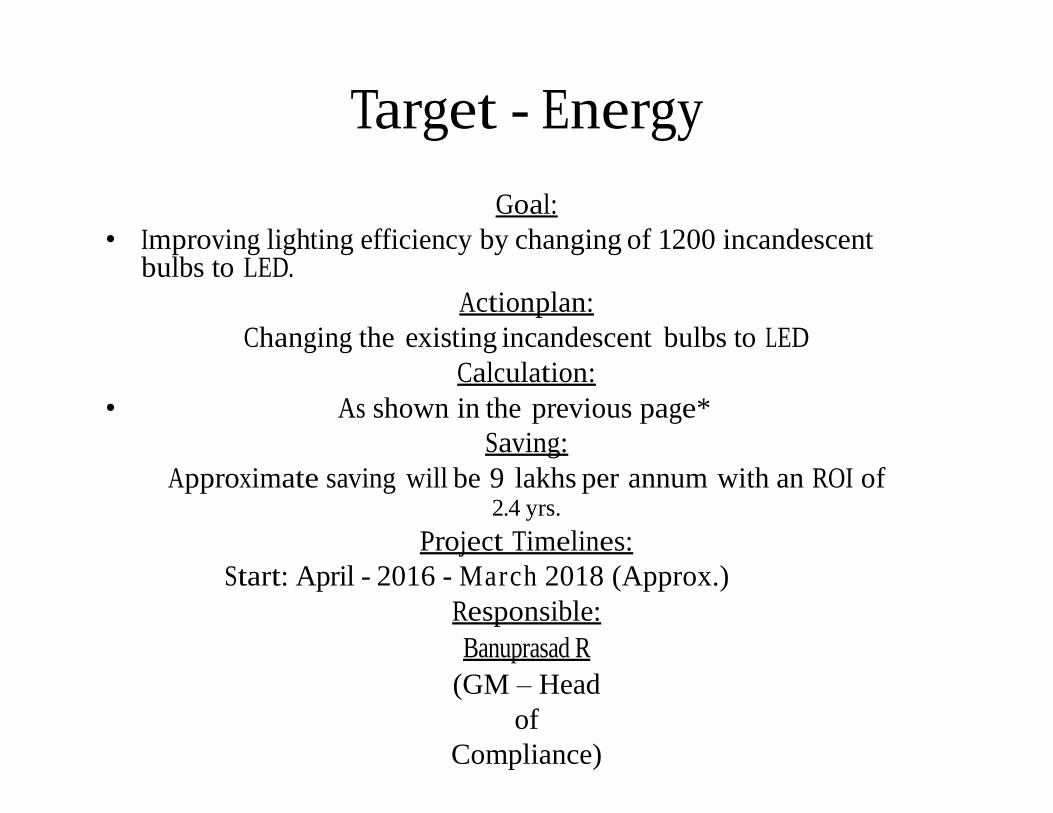
Target - Energy
Goal:
• Improving lighting efficiency by changing of 1200 incandescent bulbs to LED.
Action plan:
Changing the existing incandescent bulbs to LED
Calculation:
• As shown in the previous page*
Saving:
Approximate saving will be 9 lakhs per annum with an ROI of 2.4 yrs.
Project Timelines:
Start: April - 2016 - March 2018 (Approx.)
Responsible:
Banuprasad R
(GM – Head
of
Compliance)

Water Use
Water Level 2
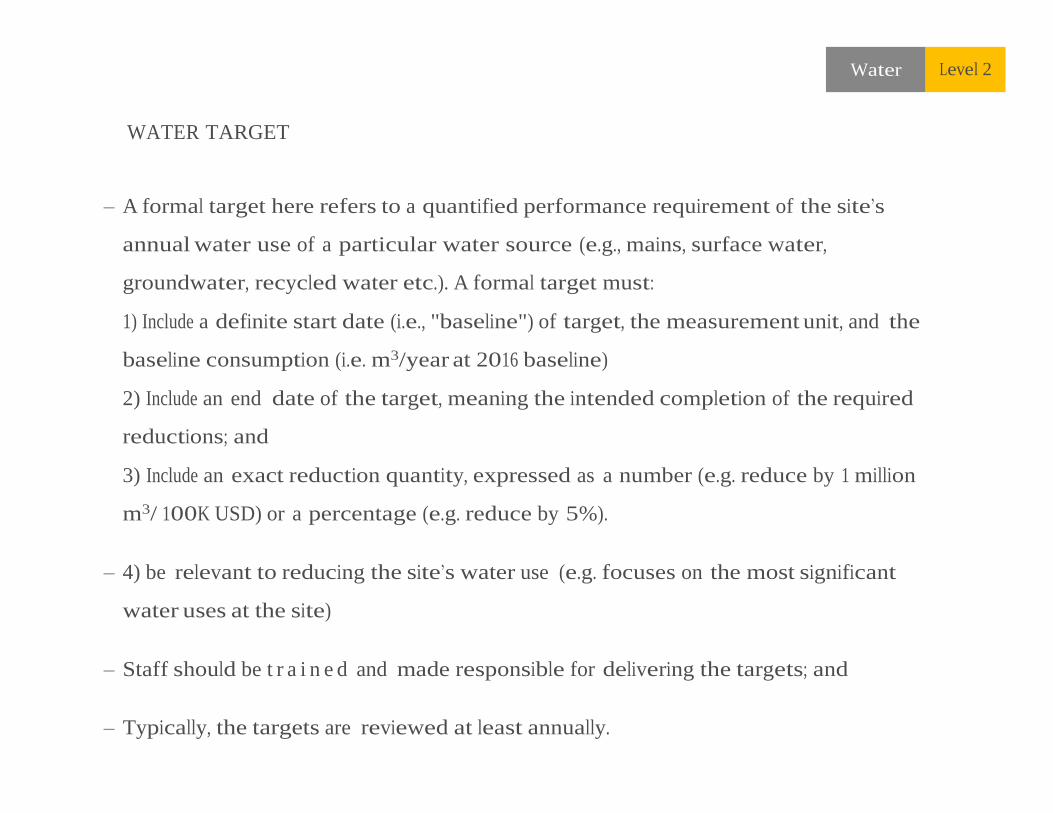
WATER TARGET
– A formal target here refers to a quantified performance requirement of the site’s
annual water use of a particular water source (e.g., mains, surface water,
groundwater, recycled water etc.). A formal target must:
1) Include a definite start date (i.e., "baseline") of target, the measurement unit, and the
baseline consumption (i.e. m3/year at 2016 baseline)
2) Include an end date of the target, meaning the intended completion of the required
reductions; and
3) Include an exact reduction quantity, expressed as a number (e.g. reduce by 1 million
m3/ 100K USD) or a percentage (e.g. reduce by 5%).
– 4) be relevant to reducing the site’s water use (e.g. focuses on the most significant
water uses at the site)
– Staff should be t r a i n e d and made responsible for delivering the targets; and
– Typically, the targets are reviewed at least annually.
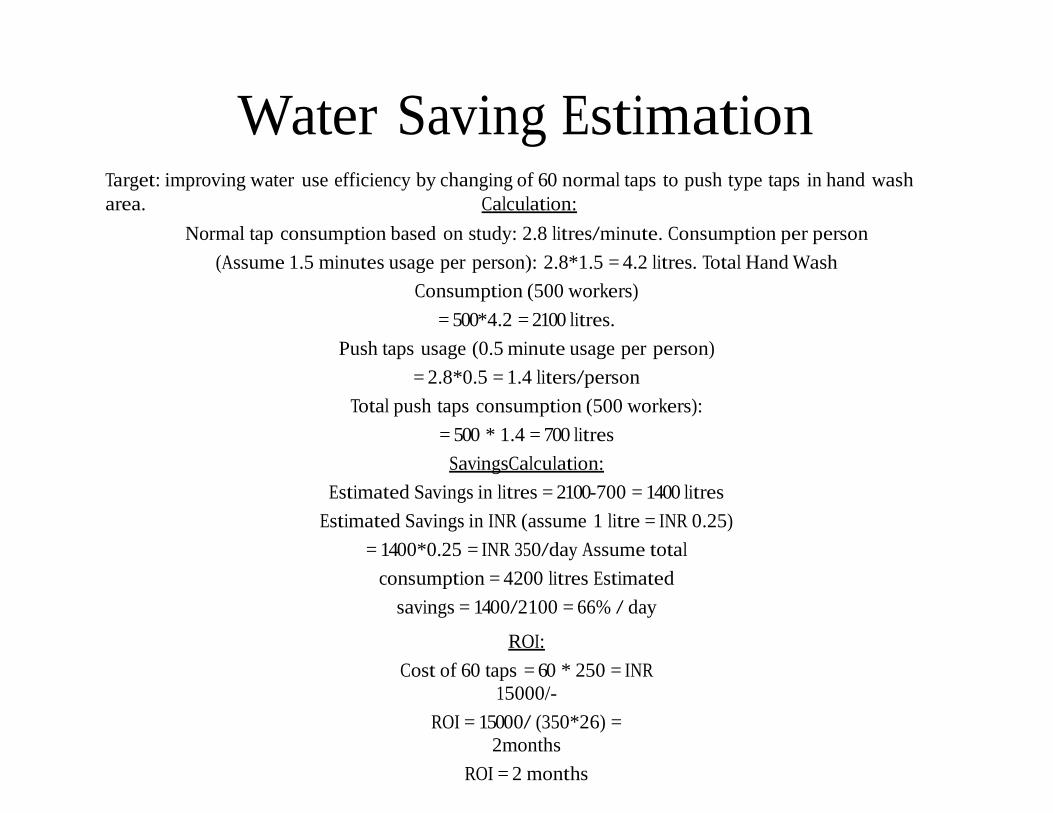
Water Saving Estimation Target: improving water use efficiency by changing of 60 normal taps to push type taps in hand wash
area. Calculation:
Normal tap consumption based on study: 2.8 litres/minute. Consumption per person
(Assume 1.5 minutes usage per person): 2.8*1.5 = 4.2 litres. Total Hand Wash
Consumption (500 workers)
= 500*4.2 = 2100 litres.
Push taps usage (0.5 minute usage per person)
= 2.8*0.5 = 1.4 liters/person
Total push taps consumption (500 workers):
= 500 * 1.4 = 700 litres
Savings Calculation:
Estimated Savings in litres = 2100-700 = 1400 litres
Estimated Savings in INR (assume 1 litre = INR 0.25)
= 1400*0.25 = INR 350/day Assume total
consumption = 4200 litres Estimated
savings = 1400/2100 = 66% / day
ROI:
Cost of 60 taps = 60 * 250 = INR
15000/-
ROI = 15000/ (350*26) =
2months
ROI = 2 months
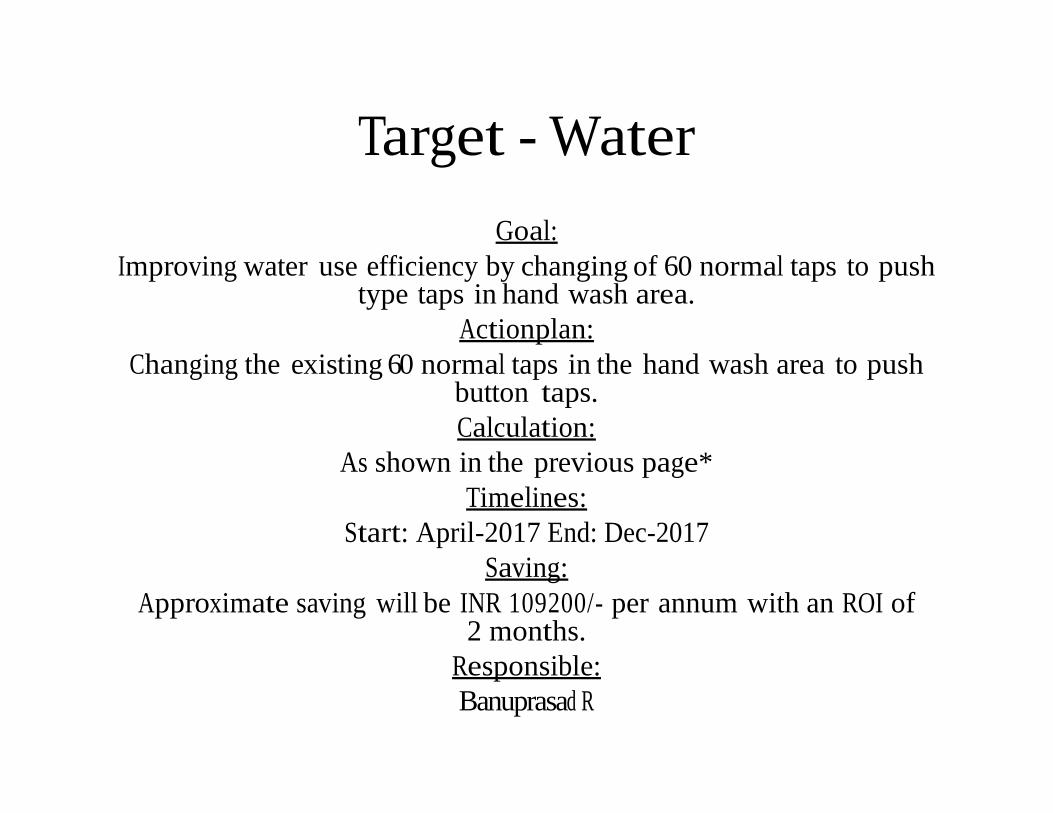
Target - Water
Goal:
Improving water use efficiency by changing of 60 normal taps to push type taps in hand wash area.
Action plan:
Changing the existing 60 normal taps in the hand wash area to push button taps.
Calculation:
As shown in the previous page*
Timelines:
Start: April-2017 End: Dec-2017
Saving:
Approximate saving will be INR 109200/- per annum with an ROI of 2 months.
Responsible:
Banuprasad R

Wastewater
(Under progress)
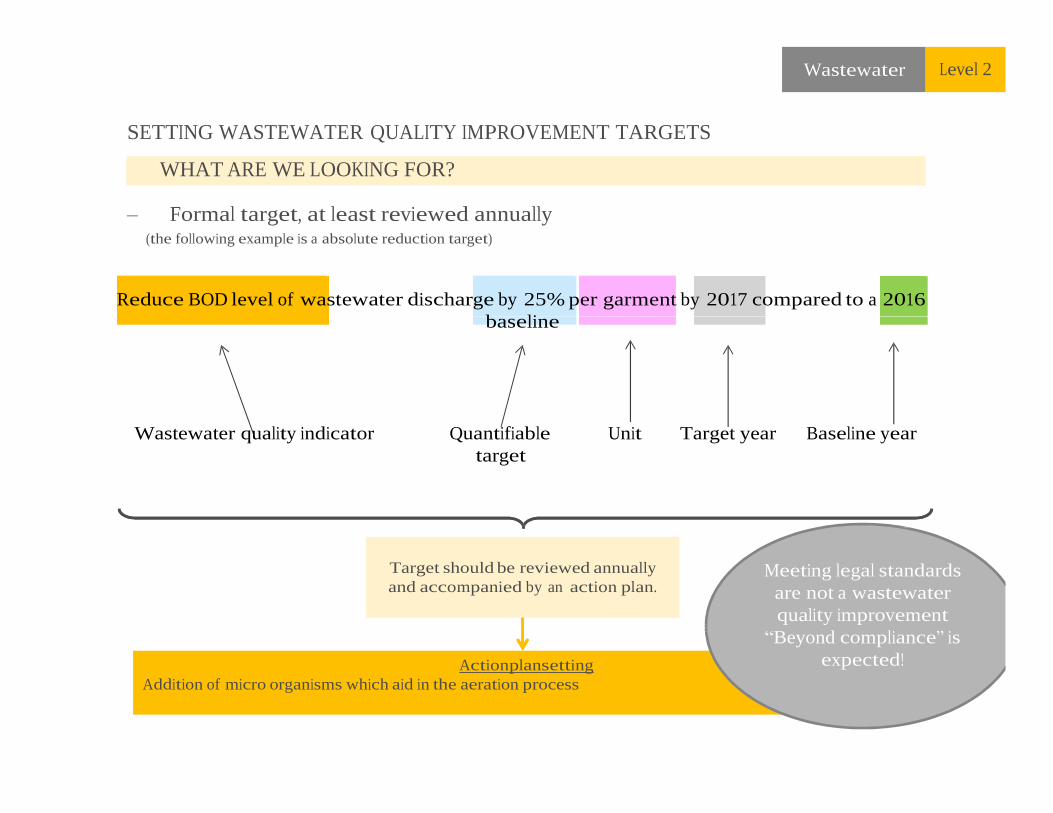
Wastewater Level 2
SETTING WASTEWATER QUALITY IMPROVEMENT TARGETS
WHAT ARE WE LOOKING FOR?
– Formal target, at least reviewed annually (the following example is a absolute reduction target)
Reduce BOD level of wastewater discharge by 25% per garment by 2017 compared to a 2016
baseline
Wastewater quality indicator Quantifiable
target
Unit Target year Baseline year
Target should be reviewed annually
and accompanied by an action plan.
Action plan setting
Addition of micro organisms which aid in the aeration process
Meeting legal standards
are not a wastewater
quality improvement
“Beyond compliance” is
expected!

AIR EMISSIONS
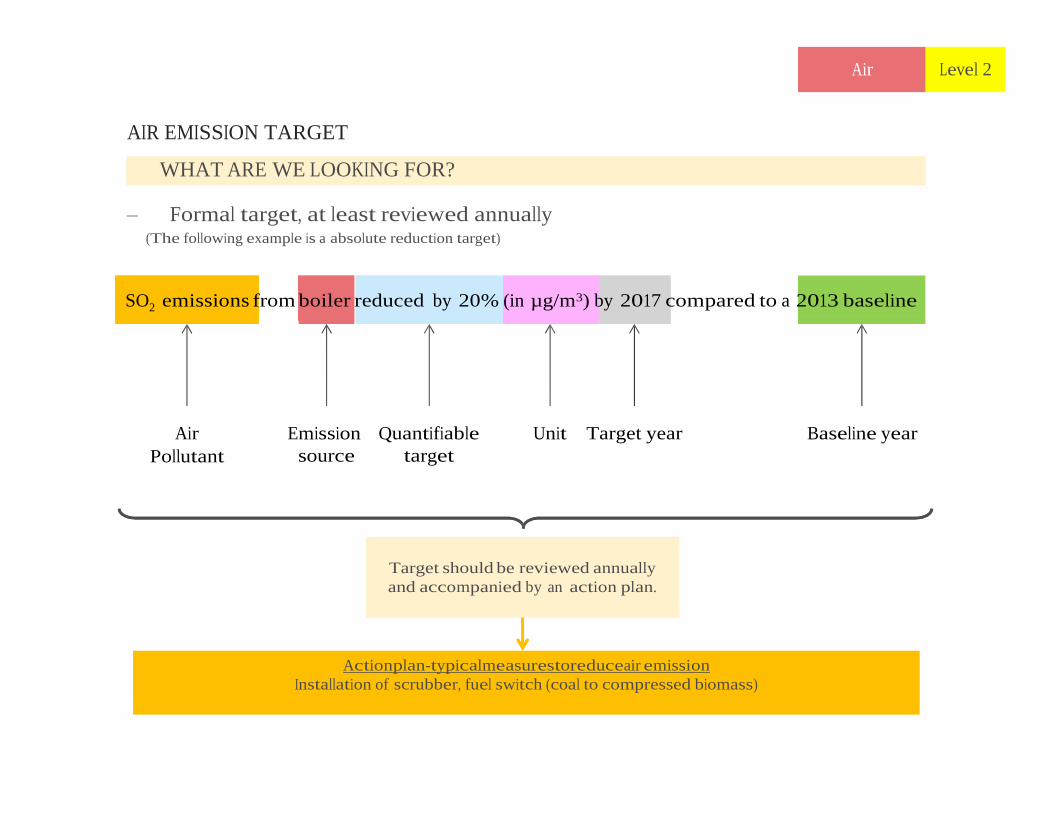
Air Level 2
AIR EMISSION TARGET
WHAT ARE WE LOOKING FOR?
– Formal target, at least reviewed annually (The following example is a absolute reduction target)
SO2 emissions from boiler reduced by 20% (in µg/m3) by 2017 compared to a 2013 baseline
Air
Pollutant
Emission
source
Quantifiable
target
Unit Target year Baseline year
Target should be reviewed annually
and accompanied by an action plan.
Action plan - typical measures to reduce air emission
Installation of scrubber, fuel switch (coal to compressed biomass)
Thank you!
We look forward to working together!
By,
Banuprasad R
GM - Head of Compliance
Kabadi Shankarsa and Company
# 1, West of Chord Road,
Rajajinagar Industrial area,
Bangalore-560044, India.
Mobile: 9945320760
E Mail: [email protected]