Drinking Water Infrastructure Needs of New York State Water Infrastructure Needs of New York State...
21
New York State Department of Health www.health.state.ny.us Drinking Water Infrastructure Needs of New York State November 2008 David Paterson, Governor Richard F. Daines, M.D., Commissioner
Transcript of Drinking Water Infrastructure Needs of New York State Water Infrastructure Needs of New York State...

New York State Department of Healthwww.health.state.ny.us
Drinking Water InfrastructureNeeds of New York State
November 2008
David Paterson, Governor Richard F. Daines, M.D., Commissioner

Acknowledgments
The Department would like to acknowledge the effort of Mr. Stephen Marshall, the primary author ofthis report, of the Bureau of Water Supply Protection's Design Section. His efforts in coordinating theNew York State portion of USEPA's 2007 Drinking Water Infrastructure Needs Survey and thisdocument have helped support the Clean and Safe Water Infrastructure Initiative in New York. TheDepartment would also like to acknowledge Richard Svenson, Director of the Division ofEnvironmental Health Protection, and Victor Pisani, Director of the Bureau of Water Supply Protection,for their guidance throughout the development of this report. Other Bureau of Water Supply Protectioncontributors included Jack Dunn, Michael Montysko, Roger Sokol and Ben Pierson.
Table of ContentsList of Acronyms 2
Executive Summary 3
Drinking Water Infrastructure 3Overview 3New York Water Systems 4Drinking Water Infrastructure Life Cycles 5Other Infrastructure Issues 5
Drinking Water Regulation History 5Safe Drinking Water Act 51986 Amendments to the SDWA 61996 Amendments to the SDWA 6Disinfection By-Products and Enhancement of the SWTR 6Ground Water Rule 7Conclusion 8
Drinking Water State Revolving Fund History 8
Data Sources, Evaluation and Extrapolation 10Data Sources 10Evaluation 10Extrapolation 11
Small System Infrastructure Needs 11
New York City Infrastructure Needs 12Population and Average Daily Demand 12Existing Water Supply Source and Infrastructure 12Age of Critical System Components 14Current Water System Expenditures 14System Dependability and Redundancy 14New York City Estimated 20 Year Capital Infrastructure Need 14
Infrastructure Needs for Dams 15
20-Year Estimate of Drinking Water Infrastructure Needs in New York 16
Private Residential Water Infrastructure 16
Drinking Water Funding Sources 16
Conclusion 17
References 18
1
List of Acronyms
CWS Community Water SystemDepartment New York State Department of HealthDWINS Drinking Water Infrastructure Needs SurveyDWSRF Drinking Water State Revolving FundEFC New York State Environmental Facilities CorporationFBRR Filter Backwash Recycling RuleGWR Ground Water RuleIESWTR Interim Enhanced Surface Water Treatment RuleLCR Lead and Copper RuleLT1ESWTR Long Term 1 Enhanced Surface Water Treatment Rule LT2ESWTR Long Term 2 Enhanced Surface Water Treatment Rule MCL Maximum Contaminant LevelMCLG Maximum Contaminant Level GoalNIPDWR National Interim Primary Drinking Water RegulationsNYC New York CityS1DBPR Stage 1 Disinfection By-Product RuleS2DBPR Stage 2 Disinfection By-Product RuleSDWA Safe Drinking Water ActSWTR Surface Water Treatment RuleTCR Total Coliform RuleTTHM Total Trihalomethane RuleUSEPA United States Environmental Protection Agency
2

Executive SummaryThe conservative cost estimate of repairing, replacing, and updating New York's drinking waterinfrastructure is $38.7 billion over the next 20 years. In 1996, the Drinking Water State RevolvingFund (DWSRF) was created by the federal and New York State governments to provide low interestloans and grants for water system improvement projects. Since that time, New York State has investedalmost $2.4 billion in drinking water infrastructure through the DWSRF program.
Despite this level of investment, approximately 95 percent of the projects submitted for inclusion in theDWSRF program remain unfunded due to a lack of available funds.
New York State's DWSRF program has worked diligently to stretch its allocated funds in the most costeffective and efficient way possible by utilizing 3 to 1 leveraging, hardship awards and short-termfinancings. New York continues to implement improvements to the program with recent changesincluding the introduction of bond guarantee financing, the promotion of smart growth principles indrinking water project design and streamlining of the application package/procedures. Theseinnovations allow the DWSRF program to consistently provide affordable financing for water systemimprovement projects.
As a result of these efforts, the New York State Department of Health and Environmental FacilitiesCorporation (EFC) received the United States Environmental Protection Agency's (USEPA) 2007DWSRF Award for Sustainable Public Health Protection for showing exceptional creativity indesigning projects that promote sustainability and protect public health.
Unfortunately, DWSRF funds can only stretch so far and with limited federal and state assistanceavailable, the burden of maintaining drinking water infrastructure falls on local governments. Manylocal municipalities have trouble convincing their residents that infrastructure must be managedproactively, including planning for repairs and replacement and charging rates that cover those costs.While many municipalities may have a capital improvement plan for their drinking water systems, theyoften only look at immediate needs or plan for five to ten years into the future. Except fortransportation infrastructure, water and wastewater infrastructure are the largest municipal assets. Thisreport is an initial step toward the development of a sustainable infrastructure funding program at thefederal, state and local levels. Adequate drinking water infrastructure funding is a critical component ofurban revitalization, smart economic growth, energy efficiency and property tax relief. It is essential forthe protection of public health and the environment.
Drinking Water InfrastructureOverview
Drinking water infrastructure is a term used to describe an entire drinking water system, from thesource to the tap. The needs associated with the components of a drinking water system can be brokendown into the following five groups: source, treatment, storage, transmission/distribution and other.
Source projects include the installation and rehabilitation of ground water sources (wells) and surface
3

water intakes to ensure an adequate supply of water is available to meet daily demands.
Treatment projects include those needed to reduce contaminants through processes such as filtration,disinfection, corrosion control and aeration. The installation, upgrade or rehabilitation of treatmentinfrastructure also enables removal of contaminants that can cause chronic health effects or taste, odorand other aesthetic problems.
Storage projects construct new or rehabilitate existing raw and/or finished water storage tanks.Construction of new tanks is necessary if the system cannot provide adequate flows and pressureduring peak demand periods. Many projects in this category involve rehabilitating existing tanks toprevent structural failures or sanitary defects that can allow microbiological contamination.
The transmission and distribution category includes the installation and rehabilitation of raw andfinished water transmission and distribution mains, as well as the replacement of lead service lines,flushing hydrants, valves, meters and backflow prevention devices. Utilities need to install andmaintain distribution systems to provide potable water to their customers while preventingcontamination of that water prior to delivery. Although treatment plants or elevated storage tanks areusually the most visible components of a water system, most of a system’s infrastructure isunderground in the form of transmission and distribution mains. Failure of transmission anddistribution mains can interrupt the delivery of water leading to a loss of pressure, possibly allowing abackflow of contaminated water into the system. Broken transmission lines also can disrupt thetreatment process.
The “other” category reflects needs that cannot be assigned to one of the prior categories. Examplesinclude emergency power generators not associated with a specific system component, computer andautomation equipment, and projects for system security (fencing, security cameras, etc.).
New York Water Systems
In New York State there are approximately 10,147 regulated water systems (3,312 community watersystems, 6,080 non-community transient water systems, and 755 non-transient non-community watersystems), serving a population of approximately 18.2 million people. These figures do not include thesignificant number of private residential wells being utilized throughout the state.
4
�������������� �����
�������� ������������ ��������������
������������
A community water system is a public water system which serves at least five service connections usedby year-round residents or regularly serves at least 25 year-round residents. A non-community watersystem is a public water system that is not a community water system. A non-transient, non-community water system is a public water system that is not a community water system but is a subsetof a non-community water system that regularly serves at least 25 of the same people, four hours ormore per day, for four or more days per week, for 26 or more weeks per year.
Drinking Water Infrastructure Life Cycles
Many of the systems mentioned above, including New York City, are nearing or have already exceeded100 years of age and still utilize some of their original drinking water infrastructure. Various watersystem components have life cycles which can range from 20 years (pumps, filter media, etc.) to 50years (storage tanks, treatment plants) to over 100 years (transmission and distribution mains). Climaterelated factors including snow load, ice formation and freeze/thaw cycles can significantly shorten theuseful life of certain water system components. While regular rehabilitation and maintenance canextend the useful life of many water system components, eventually, they will all require replacement.
Other Infrastructure Issues
When water systems' infrastructure needs are evaluated, issues other than the repair or replacement ofexisting physical infrastructures are assessed. Allowable drinking water contaminant levels arecontinually lowered as new federal regulations are promulgated and proposed, pushing municipalitiesto improve their water systems' existing facilities or install new treatment systems. Ever changinginternational relations continue to illustrate the need for increased security measures (fencing, cameras,etc.) to protect water sources and other infrastructure from potential terrorist activity. Potential growthand economic development are also assessed when making decisions for the future. In addition,significant increases in the cost of energy have led municipalities to investigate ways in which watersystems can reduce costs associated with producing water (e.g. energy efficient pumps, reduction oflost water, etc.).
Drinking Water Regulation HistorySafe Drinking Water Act
Since the early 1970's, there have been many regulations passed by the federal government in an effortto protect public health and our nation's drinking water resources. In 1974, the landmark Safe DrinkingWater Act (SDWA) was passed, giving the USEPA the authority to establish federal drinking waterstandards for contaminants that have the potential to adversely impact human health.
Between 1975 and 1976, the National Interim Primary Drinking Water Regulations (NIPDWR) wereenacted, regulating 22 contaminants including arsenic, lead, mercury and radium. TotalTrihalomethanes (TTHM), volatile organic compounds that form when natural organic matter found insource waters react with disinfectants, were regulated in 1979.
5
While the original SDWA did help to improve drinking water quality, it only covered a small portion ofthe potentially harmful contaminants threatening public water systems. Congress had intended that theUSEPA enact additional drinking water standards quickly, however, the original terms of the SDWAlead to a relatively slow pace of standard setting.
1986 Amendments to the Safe Drinking Water Act
In an effort to strengthen the original SDWA, in 1986, Congress passed amendments to the SDWA,requiring the USEPA to regulate 85 contaminants by 1989. The 1986 amendments also directed theUSEPA to enact regulations requiring public water systems served by surface water, or ground waterunder the influence of surface water, to disinfect and/or filter their water supplies.
To comply with the 1986 amendments, the Total Coliform Rule (TCR) and Surface Water TreatmentRule (SWTR) were enacted in 1989. The TCR revised the maximum contaminant level (MCL) andmonitoring requirements for total coliform bacteria while requiring fecal coliform and E. coli testing.The SWTR established maximum contaminant level goals (MCLG), a non-enforceable health goalrequiring the use of a certain treatment technique, for Giardia lamblia, Legionella, viruses andturbidity. The SWTR also established disinfection requirements and criteria under which filtrationwould be required.
The 1986 amendments also led to the 1991 enactment of the Lead and Copper Rule (LCR), whichrequired that water systems establish corrosion control measures, replace lead water service piping andinform water consumers when action levels for lead and copper were exceeded.
1996 Amendments to the Safe Drinking Water Act
The requirements of the original SDWA and the 1986 amendments were very ambitious, makingcompliance by states and public water systems very difficult due to the aggressive schedules and lackof available water infrastructure funding.
To remedy this situation, in 1996, Congress passed additional amendments to the SDWA. Highlights ofthe 1996 amendments include: requiring the USEPA to strengthen protection for microbialcontamination and disinfection by-products; requiring the USEPA to complete a cost-benefit analysisfor proposed new standards; the requirement that water systems prepare and distribute consumerconfidence reports; and the requirement that states conduct source water assessments.
However, the most significant part of the 1996 amendments was the establishment of the DWSRF thatprovides funding to water systems to assist them in efforts to comply with drinking water regulations.The DWSRF is discussed in further detail later in this report.
Disinfection By-Products and Enhancement of the Surface Water Treatment Rule
Promulgated in December 1998 and effective in February 1999, the Stage 1 Disinfection By-ProductRule (S1DBPR) and Interim Enhanced Surface Water Treatment Rule (IESWTR) began complyingwith the 1996 amendments to the SWTR.
6

The S1DBPR updated and superseded the 1979 regulations for TTHM's. The rule establishedmaximum residual disinfectant level goals (MRDLG's) and maximum residual disinfectant levels(MRDL's) for three chemical disinfectants: chlorine, chloramine and chlorine dioxide. It alsoestablished MCLG's and MCL's for total trihalomethanes, haloacetic acids, chlorite and bromate.
The IESWTR amended the existing SWTR to strengthen microbial protection, including provisionsspecifically to address Cryptosporidium, and to address risk trade-offs with disinfection byproducts.The final rule included treatment requirements for waterborne pathogens (Cryptosporidium). Inaddition, systems were required to continue to meet existing requirements for Giardia lamblia andviruses. The rule, with tightened turbidity performance criteria and individual filter monitoringrequirements, was designed to optimize treatment reliability and to enhance physical removalefficiencies to minimize the Cryptosporidium levels in finished water. In addition, continuous turbiditymonitoring was now required for individual filters.
In 2001, the Filter Backwash Recycling Rule (FBRR) was enacted to address the practice of returningfilter backwash water to the head of a filtration plant. The FBRR required that all recycled water bereturned to a point in the treatment plant which ensures that all of the processes of the filtration systemwill be employed. It also required water systems that follow this practice to notify the state of such andmaintain specific records relating to the backwash recycling.
In 2002, the Long Term 1 Enhanced Surface Water Treatment Rule (LT1ESWTR) was passed toaddress systems serving fewer than 10,000 persons and build upon the framework established for largersystems in the IESWTR. This rule established Cryptosporidium removal requirements for systemsserving fewer than 10,000 persons and also required that all new finished water storage reservoirs becovered.
In 2006, the Stage 2 Disinfection By-Product Rule (S2DBPR) was promulgated to reduce potentialcancer and reproductive and developmental health risks from disinfection by-products in drinkingwater, which form when disinfectants are used to control microbial pathogens. This rule requiredwater systems to meet MCL's as an average at representative monitoring locations (not as a system-wide average as in previous rules). The rule targeted systems with the greatest risk and built uponexisting rules.
Also in 2006, the Long Term 2 Enhanced Surface Water Treatment Rule (LT2ESWTR) was passed.This rule bolstered the existing regulations by targeting additional Cryptosporidium treatmentrequirements to higher risk systems and requiring that all finished water storage reservoirs be coveredor install treatment for the reservoir discharge.
Ground Water Rule
Having dealt with surface water and ground water under the influence of surface water with the SWTR,the USEPA turned their attention to ground water sources and in November 2006 passed the GroundWater Rule (GWR). This risk based rule relies on four programmatic components: periodic sanitarysurveys; triggered source water monitoring when a system identifies a positive sample during its TCRmonitoring; corrective action and compliance monitoring.
7

The potential corrective actions available to water systems under the GWR include the correction of allsignificant deficiencies, the provision of another source of water, elimination of the source ofcontamination or the provision of treatment for viruses.
Conclusion
The last 30 years have seen a significant increase in the number of drinking water regulations, coveringsystems of every size and water source. As research technologies change and improve, additionalregulations may be enacted as new potential health effects are discovered. The cost of complying withnew and increasingly stringent regulations is a challenge that all water systems face.
SDWA Safe Drinking Water ActNIPDWR National Interim Primary Drinking Water RegulationsTTHM Total Trihalomethane RuleSDWA86 1986 Amendments to the Safe Drinking Water ActTCR Total Coliform RuleSWTR Surface Water Treatment RuleLCR Lead and Copper RuleSDWA96 1996 Amendments to the Safe Drinking Water ActIESWTR Interim Enhanced Surface Water Treatment RuleS1DBPR Stage 1 Disinfection By-Product RuleFBRR Filter Backwash Recycling RuleLT1ESWTR Long Term 1 Enhanced Surface Water Treatment Rule S2DBPR Stage 2 Disinfection By-Product RuleLT2ESWTR Long Term 2 Enhanced Surface Water Treatment Rule GWR Ground Water Rule
Drinking Water State Revolving Fund HistoryThe DWSRF was created in 1996 as a result of New York State's enactment of Chapter 413 of the Lawsof 1996 (Clean Water/Clean Air Bond Act, "Bond Act") and passage of the 1996 Amendments to theSafe Drinking Water Act (Public Law 104-182) by the U.S. Congress. The DWSRF provides a financialincentive for municipally and privately owned public water systems to undertake needed drinkingwater infrastructure improvements (e.g., treatment plants, distribution mains, storage facilities). Thisprogram provides below market rate financing for the construction of certain eligible public watersystem projects. As financing is repaid, money is made available for new financing - a true revolvingfund. For communities with demonstrated financial hardship, interest rates can be reduced to zeropercent. The program is administered jointly by the Department and the EFC.
8
1972 1974 1976 1978 1980 1982 1984 1986 1988 1990 1992 1994 1996 1998 2000 2002 2004 2006 2008
SDWA
NIPDWR
TTHM SDWA86 TCR
SWTR
LCR SDWA96 IESWTR
S1DBPR
FBRR
LT1ESWTR
S2DBPR
LT2ESWTR
GWR������������� �������������������

Sections 1452(h) and 1452(i)(4) of the SDWA direct the USEPA to conduct an assessment of drinkingwater infrastructure needs every four years. The results of the Drinking Water Infrastructure NeedsSurvey (DWINS) are then used to allocate DWSRF monies to the states. The Department isresponsible for coordinating the DWINS for New York State, and upon completion of the datacollection and evaluation period, USEPA submits a final report to the United States Congress.
Since the start of the DWSRF program, the state has received approximately $612.5 million in DWSRFcapitalization grants from the federal government and contributed an additional $355 million in matchdollars. In 2008, New York received $36.2 million from the federal government for the DWSRFprogram, down from $59.2 million in 1997.
Despite receiving only $967.5 million over the last 12 years, New York State's DWSRF program hassuccessfully leveraged those funds and provided approximately $2.38 billion in financing to 330 watersystems. This financing includes low interest loans, State Assistance Payment grants totaling $90million, and Federal Assistance Payment grants totaling $151.5 million.
Although the DWSRF program has been very successful in providing funding for water systemimprovement projects, the majority of the projects which apply to the DWSRF can not be reached forfinancing due to lack of funds, indicating that the financial need is significantly higher than theDWSRF alone can provide.
9
���� ���� ���� ���� ���� ���� ���� ���� ���� ��� ���� ����
�
��
��
��
��
��
�
��
��������������!�"#��$��%�&�����'����
#��(%����
)�*�%%���
Data Sources, Evaluation and ExtrapolationData Sources
In preparing this report, the Department used existing drinking water infrastructure needs data,primarily from the USEPA's DWINS reports. The majority of the data contained in this reportoriginates from the 2003 DWINS Final Report and the data collected for the 2007 DWINS effort.
Prior surveys were conducted in 1995, 1999, 2003 and 2007. The results of the first three DWINS areavailable for public review (http://www.epa.gov/safewater/needssurvey/index.html), with the 2007DWINS report due to be presented to Congress in February 2009.
Evaluation
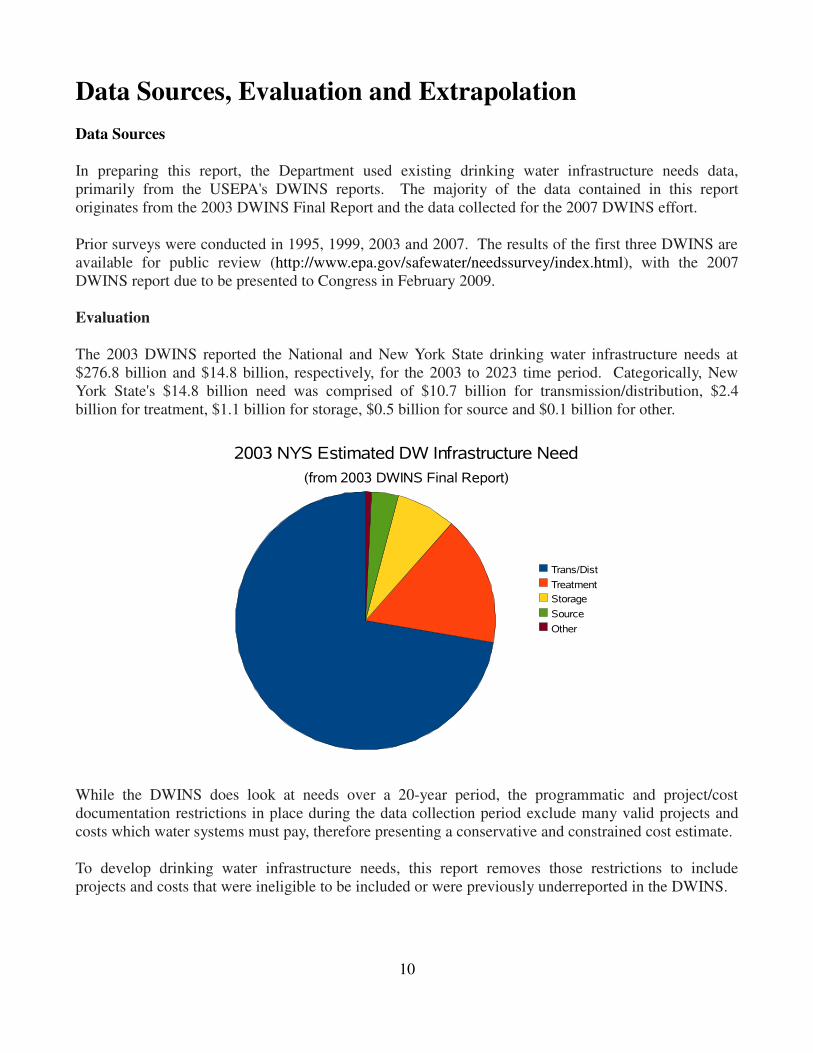
The 2003 DWINS reported the National and New York State drinking water infrastructure needs at$276.8 billion and $14.8 billion, respectively, for the 2003 to 2023 time period. Categorically, NewYork State's $14.8 billion need was comprised of $10.7 billion for transmission/distribution, $2.4billion for treatment, $1.1 billion for storage, $0.5 billion for source and $0.1 billion for other.
While the DWINS does look at needs over a 20-year period, the programmatic and project/costdocumentation restrictions in place during the data collection period exclude many valid projects andcosts which water systems must pay, therefore presenting a conservative and constrained cost estimate.
To develop drinking water infrastructure needs, this report removes those restrictions to includeprojects and costs that were ineligible to be included or were previously underreported in the DWINS.
10
���������+������,�!�-�.�����(��������,
/.���������!-���#��%�"�$���0
����1!���
��������
����2�
����(�
3�4��

Extrapolation
The DWINS obtains data via questionnaires completed by the water systems. Rather than sendquestionnaires to every qualifying water system, questionnaires are sent to a representative sample of astate's water systems serving more than 3,300 people, stratified by water source (surface, ground, orpurchased) and system size (medium or large). The water system sample includes all water systemswith a population of 100,000 or greater. Once the data has been collected, the USEPA extrapolates theresults of these surveys to produce a need estimate for all water systems statewide.
A national sample of small systems, those serving less than 3,300 people, received on-site visits fromUSEPA contractors to gather data for small system needs. The data for small system needs will bepresented in a separate section of the DWINS report and is discussed below.
Not all projects accepted for inclusion in the DWINS have documented cost estimates associated withthem. In those cases, the USEPA utilizes cost models, using the data collected for the Needs Survey aswell as other outside sources, and assigns a cost to the project to put towards the state's bottom line.Having now completed four Needs Surveys, the Department can confidently state that the majority ofthe projects submitted for inclusion in the DWINS do not have a cost document and will requiremodeling.
The data collection period for the 2007 DWINS closed in late 2007. The Department collected datafrom 65 water systems, including New York City, totaling approximately 1,500 separate water systemimprovement projects. Based on the projects accepted by the USEPA, including those with and withoutcost documentation, the Department's preliminary estimate of New York State's 2007 DWINS is atminimum $12.4 billion. However, this estimate does not include costs to be modeled by the USEPAor the extrapolation of the DWINS sample to represent all of New York State's water systems,and therefore, the Department expects New York State's needs in the 2007 DWINS final report tobe significantly higher.
New York City accounts for approximately $10.7 billion of the $12.4 billion estimated DWINS need,leaving approximately $1.7 billion from the remaining 64 systems in New York State's DWINS watersystem sample (approximately $26.56 million per system).
According to June 2008 SDWIS data, New York State contains 311 Community Water Systems (CWS),serving more than 3,300 people. Subtracting the 65 CWS from the DWINS sample leaves 246 CWSwhich were not included in the 2007 DWINS and will have their needs modeled by the USEPA. Usingthe $26.56 million per system number from above, DOH estimates this modeled need to be $6.5 billion,bringing the total non-NYC DWINS need to $8.2 billion.
Small System Infrastructure Needs
The estimates above only include CWS's that serve more than 3,300 people. With roughly 3,000CWS's within New York State serving fewer than 3,300 people, the infrastructure needs of smallsystems can not be ignored. Small systems face the same drinking water infrastructure challenges aslarger systems, but with fewer users available to pay for improvements, the high per user cost of
11
maintaining and improving the water system renders the projects impossible without outside financialassistance.
The Department was not directly involved in the small system data collection effort for the 2007DWINS, making it difficult to estimate the infrastructure need. For the purposes of this report, theDepartment will utilize the $2.0 billion small system infrastructure need as reported in the 2003DWINS final report to Congress.
New York City Infrastructure Needs
Population and Average Daily Demand
At more than 150 years old, with an average daily demand of approximately 1.2 billion gallons per day,New York City is one of the oldest and largest water systems in the world. The U.S. Census Bureau's2006 population estimate for New York City is 8.2 million people, which represents more than 40percent of the population of New York State.
Existing Water Supply Source and Infrastructure
The majority of the City's drinking water comes from three surface water supplies - the Croton, Catskilland Delaware systems - which are comprised of a network of 19 reservoirs and three controlled lakes ina 1,972 square-mile watershed that extends 125 miles north and west of the City. Water is delivered bygravity from reservoirs within each of these systems through a series of aqueducts and tunnels. Inaddition to the surface water supply, The City operates a groundwater system that supplies fewer than100,000 people in southeastern Queens.
The Croton System, placed into service in the 1890's, is the oldest of the three surface water systemsand normally provides approximately 10 percent of the City’s daily water needs. The Croton Systemconsists of twelve reservoirs and three controlled lakes located directly north of the City in Westchesterand Putnam counties. The water from upstream reservoirs flows through natural streams to downstreamreservoirs terminating at the New Croton Reservoir. Water is conveyed from the New Croton Reservoirto Jerome Park Reservoir in the Bronx through the New Croton Aqueduct, a 33 mile long tunnel.
The Catskill System, which provides approximately 40 percent of the City's daily water supply, collectswater from the Esopus and Schoharie Creek watersheds in the eastern Catskill Mountains. Water fromthese two watersheds is stored in the Schoharie and Ashokan Reservoirs. Water from the SchoharieReservoir is diverted through the 18 mile long Shandaken Tunnel to the Esopus Creek and ultimatelyinto the Ashokan Reservoir. From here, water is conveyed to the City through the Catskill Aqueduct.The Catskill System was placed into service in 1915.
The Delaware System, the newest component of the City’s water supply system, providesapproximately 50 percent of the City’s daily water supply. Three reservoirs - the Cannonsville,Pepacton and Neversink - collect water from the two branches and one tributary of the Delaware River.These reservoirs feed eastward through separate rock tunnels to Rondout Reservoir where the DelawareAqueduct begins. The Delaware Aqueduct conveys water to the City through an 85-mile long concrete-
12
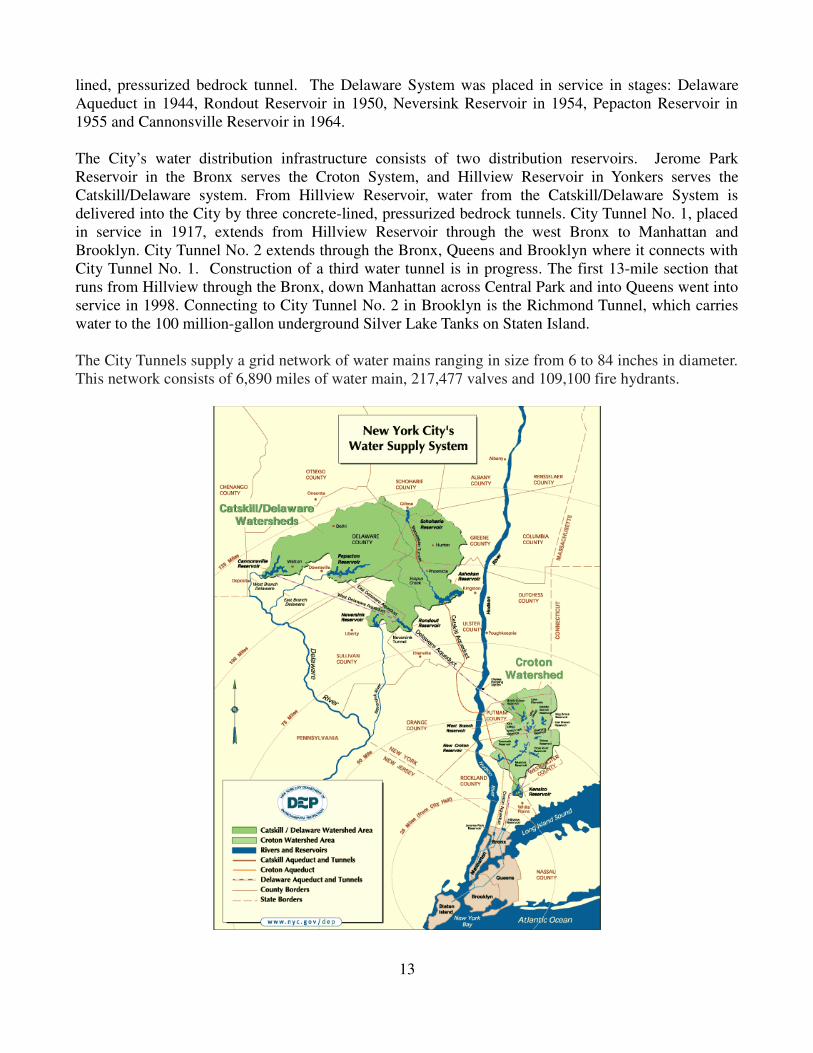
lined, pressurized bedrock tunnel. The Delaware System was placed in service in stages: DelawareAqueduct in 1944, Rondout Reservoir in 1950, Neversink Reservoir in 1954, Pepacton Reservoir in1955 and Cannonsville Reservoir in 1964. The City’s water distribution infrastructure consists of two distribution reservoirs. Jerome ParkReservoir in the Bronx serves the Croton System, and Hillview Reservoir in Yonkers serves theCatskill/Delaware system. From Hillview Reservoir, water from the Catskill/Delaware System isdelivered into the City by three concrete-lined, pressurized bedrock tunnels. City Tunnel No. 1, placedin service in 1917, extends from Hillview Reservoir through the west Bronx to Manhattan andBrooklyn. City Tunnel No. 2 extends through the Bronx, Queens and Brooklyn where it connects withCity Tunnel No. 1. Construction of a third water tunnel is in progress. The first 13-mile section thatruns from Hillview through the Bronx, down Manhattan across Central Park and into Queens went intoservice in 1998. Connecting to City Tunnel No. 2 in Brooklyn is the Richmond Tunnel, which carrieswater to the 100 million-gallon underground Silver Lake Tanks on Staten Island.
The City Tunnels supply a grid network of water mains ranging in size from 6 to 84 inches in diameter.This network consists of 6,890 miles of water main, 217,477 valves and 109,100 fire hydrants.
13

Age of Critical System Components
Many of the City's critical water system components have reached or exceeded their design life andmust be repaired or replaced. Maintaining and repairing an aging and complex water system such asthe one in New York City presents many unique challenges. For example, the Catskill and DelawareAqueducts have been in continuous service for more than 90 and 65 years, respectively. Taking eitherof the Aqueducts out of service for maintenance would reduce the available source capacity by morethan 500 million gallons per day, making repair of the Aqueducts almost impossible.
Current Water System Expenditures
The New York City water system consists of more than 6,800 miles of distribution mains, numerousstorage tanks and pump stations, water meters and other water system components. Keeping such anexpansive water system running on a day to day basis is quite costly, with the City's water systemcapital budget ranging from $2 billion to $3 billion annually.
In addition to the projects needed to maintain daily operations, the City is in the beginning stages ofthree substantial water system improvement projects: the Catskill/Delaware Ultraviolet Disinfectionfacility, the Croton filtration plant, and the Kensico-City Tunnel. The cost of these three projects aloneexceeds $7 billion.
System Dependability and Redundancy
As New York City works to maintain its existing infrastructure, it must also look ahead to the long termviability of the water system. The dependability of a water supply which serves more than 8 millionpeople every day is a very important aspect of facility planning which the City has been exploring.Anticipated projects include those to provide redundancy for the Catskill and Delaware Aqueducts,increase capacity of the ground water system, and the use of aquifer storage and recovery wells.
New York City Estimated 20-Year Capital Infrastructure Need
The Department works closely with New York City to adequately address capital water project needsfor the next 20 years and beyond. Those projects include: the Catskill/Delaware UV and Crotonfiltration plants; groundwater rehabilitation and development; storage tank and pump stationrehabilitation; Catskill and Delaware Aqueduct rehabilitation, the completion of the Kensico-CityTunnel; distribution main replacement and rehabilitation; lead service line replacement; water meterrehabilitation; and water system dependability/redundancy projects (construction of a new aqueduct,additional groundwater development, etc.).
Based on our familiarity with the short- and long-term challenges facing the New York City watersupply system, and the projects being currently undertaken or in the exploration phase, the Departmentestimates New York City's 20-year capital need to be in excess of $28 billion.
14
Infrastructure Needs for Dams
Dams provide many benefits including water supply for drinking, irrigation and industrial use;hydroelectric power; recreation; flood control and navigation. As with other components of watersystem infrastructure, dams require maintenance and rehabilitation to ensure proper operation.Neglecting these vital pieces of infrastructure can lead to dam failures, which in turn can causeeconomic loss, environmental damage and even loss of life. Age, inadequate maintenance and adverseweather conditions are leading factors which can contribute to dam failure.
According to the New York State Department of Environmental Conservation's Dam Safety Section,there are approximately 511 dams throughout New York State which are utilized for water supplypurposes. More than 70 percent of these dams are greater than 50 years old, with many dams havingbeen constructed more than 100 years ago.
To estimate a rehabilitation cost for New York's water supply dams, the Department relied on aDecember 2002 estimate by the Association of State Dam Safety Officials, which stated thatapproximately $36.2 billion is needed to rehabilitate the approximately 79,000 dams located throughoutthe United States. This estimate equates to approximately $458,000 per dam. Utilizing the $458,000per dam rehabilitation cost and removing New York City's Gilboa Dam (discussed below) from the listof New York's 511 water supply dams yields an estimated water supply dam rehabilitation cost of$233.6 million.
In late 2007, the New York City Department of Environmental Protection completed a $24 millionstabilization project for the Gilboa Dam, which was constructed in 1926 and is part of the City's watersupply system. This project installed a debris broom across the Schoharie Reservoir, removed a largenotch from the top of the dam to lower water levels and decrease pressure on the dam, installed fourlarge siphons over the dam to increase the volume water which can be drained from the reservoir, andinstalled 80 anchoring cables to the top and front of the dam to help hold the dam in place. With thestabilization of the dam now complete, beginning in 2008 the Gilboa Dam will undergo a $300 millionfull-scale reconstruction to bring it up to new dam construction standards.
Using the $233.6 million estimate from above and the $300 million Gilboa Dam reconstruction cost,the Department estimates that approximately $533.6 million is needed to rehabilitate New York State'swater supply dams.
15

20-Year Estimate of Drinking Water Infrastructure Needsin New York
Data Category Estimate of Needs2007 DWINS estimate for non-NYC community water systemsserving more than 3,300 people (raw data)
$1.7 billion
2007 DWINS estimate for non-NYC community water systemsserving more than 3,300 people (estimated and extrapolated)
$6.5 billion
2003 DWINS estimate for community water systems serving lessthan 3,300 people
$2.0 billion
New York City (2007 DWINS estimate plus estimation andextrapolation)
$28.0 billion
Infrastructure Needs for Dams $0.5 billion
Total Preliminary Estimate $38.7 billion
Private Residential Water InfrastructureWhile extensions of public water supply to serve areas with private well contamination are DWSRFeligible projects, private residential well replacement projects are not, and therefore, were not includedin the total need shown above. With an estimated 1.5 million private residential wells in existence inNew York State, the needs of New York State residents served by private wells can not be ignored.With well pumps having a design life of 15 to 20 years before needing full or partial replacement,almost all of the private well pumps in the state will require rehabilitation or replacement over the next20 years. Assuming that 80 percent of the private well pumps will require replacement at an averagecost of $1,500 per pump, the total estimated need is approximately $1.8 billion for private wells.
Drinking Water Funding Sources
With almost $2.4 billion in low interest loans and grants awarded since 1996, the DWSRF is theleading source of drinking water infrastructure improvement funds. Other sources, such as the NewYork State Office of Community Renewal and the U.S. Department of Agriculture Rural Developmentprogram, are also available to provide funding for drinking water system improvements. Watersystems are encouraged to contact all potential funding sources in an attempt to put together the mostattractive funding package they can present to the public. Information on all of these programs can befound on-line at: www.nycofunding.org.
16

ConclusionThe importance of modern, reliable and efficient water treatment systems is self evident. The health ofour communities, the protection of our waterbodies, the prospects for energy savings, and futureeconomic growth and development, are linked to our ability to maintain, and as necessary, upgradethese facilities. As described in this report, however, aged systems are failing, and municipalities do nothave the funds to adequately repair and replace the necessary infrastructure. There is no disputing thatthe cost of ensuring the operation of New York's water systems is larger than what local governmentsand the state can address on their own. Clearly, there is a compelling need for a more comprehensiveand sustainable water infrastructure funding program, yet insufficient mechanisms exist to provide thatfunding. The federal government has provided assistance through the DWSRF program, but significantadditional investment from the federal government to the states and local governments is needed forthis purpose.
This report was intended to provide a general overview of the state’s water infrastructure needs,identify the factors that have led to the current problem, and establish a context for assessing anddetermining the steps needed to address our water infrastructure needs. This report should serve as afoundation for New York’s efforts to attack this issue and as a first step in the critical process ofestablishing a sustainable water infrastructure funding program. In the short term, the Department, inconjunction with EFC, will continue to research and compile information to support those efforts. It isclear, however, that this is not only a massive financial problem, but it is also a complex and difficultengineering, planning and environmental undertaking. The Department looks forward to working withthe Governor and the Legislature to continue to address this important issue.
17
References“Understanding the Safe Drinking Water Act”. EPA 816-F-04-030. June 2004.(http://www.epa.gov/ogwdw/sdwa/30th/factsheets/understand.html)
“Stage 1 Disinfectants and Disinfection Byproducts Rule”. EPA 815-F-98-010. December 1998.(http://www.epa.gov/OGWDW/mdbp/dbp1.html)
“Stage 2 Disinfectants and Disinfection Byproduct Rule (Stage 2 DBP rule)”.(http://www.epa.gov/ogwdw/disinfection/stage2/basicinformation.html)
“President Signs Safe Drinking Water Act Amendments”. EPA press release - June 20, 1986.(http://www.epa.gov/history/topics/sdwa/04.htm)
“Drinking Water Standards for Regulated Contaminants”.(http://www.epa.gov/ogwdw/therule.html)
“Total Coliform Rule: A Quick Reference Guide”. EPA 816-F-01-035. November 2001.(http://www.epa.gov/OGWDW/disinfection/tcr/pdfs/qrg_tcr_v10.pdf)
“Lead and Copper Rule: A Quick Reference Guide”. EPA 816-F-04-009. March 2004.(http://www.epa.gov/OGWDW/lcrmr/pdfs/qrg_lcmr_2004.pdf)
“Interim Enhanced Surface Water Treatment Rule: A Quick Reference Guide”. EPA 816-F-01-011.May 2001.(http://www.epa.gov/OGWDW/mdbp/qrg_ieswtr.pdf)
“Long Term 1 Enhanced Surface Water Treatment Rule: A Quick Reference Guide”. EPA 816-F-02-001. January 2002.(http://www.epa.gov/OGWDW/mdbp/lt1eswtr-quick-ref.pdf)
“Long Term 2 Enhanced Surface Water Treatment Rule”. EPA 815-F-05-009. December 2005.(http://www.epa.gov/ogwdw/disinfection/lt2/pdfs/fs_lt2_finalrule.pdf)
“Filter Backwash Recycling Rule: A Quick Reference Guide”. EPA 816-F-01-019. June 2001.(http://www.epa.gov/OGWDW/mdbp/fbrr_qrg.pdf)
“Ground Water Rule (GWR)”.(http://www.epa.gov/safewater/disinfection/gwr/basicinformation.html)
“Drinking Water Infrastructure Needs Survey and Assessment Third Report to Congress”. EPA 816-R-05-001. June 2003.(http://www.epa.gov/safewater/needssurvey/index.html)
18
“Controlling Disinfection By-Products and Microbial Contaminants in Drinking Water - Chapter 2: AReview of Federal Drinking Water Regulations in the U.S.”. EPA 600-R-01-110. December 2001.(http://www.epa.gov/nrmrl/pubs/600r01110/600r01110chap2.pdf)
“New York City's Water Supply System Map”.(http://www.nyc.gov/html/dep/html/drinking_water/wsmaps_wide.shtml)
“The Cost of Rehabilitating Our Nation’s Dams: A Methodology, Estimate and Proposed FundingMechanisms,” December 2002 [Revised October 2003]”, Association of State Dam Safety Officials,Summary Flyer.(http://www.damsafety.org/media/Documents/Legislative%20Handouts/2007-08/2007%20dam%20safety_rd3.pdf)
“Gilboa Dam Stabilization Project”. DEP summary – October 26, 2007.(http://www.nyc.gov/html/dep/html/dep_projects/gilboa.shtml)
19