Dri less Area Stream Master Plan Project Regional and...
38
DriŌless Area Stream Master Plan Project Regional and Property Analysis Eøçã®ò SçÃÃÙù A ngling in southwestern Wisconsin’s DriŌless Area is unques- Ɵonably one of the state’s premier outdoor experiences. Over the beƩer part of a century, the Department of Natural Re- sources (DNR) has worked with a wide range of partners to help protect, restore, and manage the streams and rivers that flow through this unique landscape. Thanks to the efforts of fish biolo- gists, fishing organizaƟons and clubs and their Ɵreless volunteers, farmers and landowners, businesses, and local governments, few places in the Midwest can rival the diversity and quality of fishing here. The Department owns or holds easements on more than 35,000 acres along trout and smallmouth bass streams in the DriŌless Area and is in the process of updaƟng the management plan for these properƟes. To simplify and speed up the planning process, the De- partment is developing one master plan, called the DriŌless Area Master Plan (DAMP), to cover all these properƟes. The plan will describe the habitat management and land protecƟon goals, objec- Ɵves, and strategies for these properƟes and chart a course for the future. The first step in the planning process is the draŌing of this iniƟal document, the Regional & Property Analysis (RPA). The purpose of the RPA T he RPA presents background informaƟon about the DNR properƟes and the waters that flow through them. It focuses on informaƟon of primary interest to anglers: where the fish are, where the public access is located, and where the fish are likely to be in the future, given changing climate condiƟons. InformaƟon about habitats beyond the immediate stream corridors, recreaƟon demand, the projected thermal resilience of streams, and other factors is also presented. The informaƟon in the RPA is the founda- Ɵon from which the master plan will be developed. The properƟes included in this plan are primarily owned by the Fish- eries Management Program (state fishery areas as well as lands acquired through the “remnant” habitat program and the stream bank protecƟon program). In addiƟon, several properƟes along trout and bass waters that are owned and managed by the wildlife management or the state natural areas programs are also included. The lands included in this master plan include those protected through both fee acquisiƟon and easements. The DAMP will guide and prioriƟze the DNR’s habitat management acƟons (including in- stream restoraƟon) and land acquisiƟon efforts over the next 15 years. How DNR applies science to planning T he Department has limited staff and financial resources and wants to ensure that its investments in stream restoraƟon and maintenance have a high likelihood of supporƟng the desired species over the long term. Similarly, the DNR seeks to invest in public access where there is a high degree of confidence that popu- laƟons of the desired fish species will be sustained over Ɵme. The Fisheries Management Program uses electrofishing as a method to measure adult trout and bass abundance in Wisconsin streams. To evaluate the present-day quality of the sport fisheries found throughout the 94 watersheds in the DriŌless Area, 6,737 electro- fishing surveys were analyzed in the RPA. The RPA also used two of the newest science-based stream models to help evaluate the suitability of current and future habitat condi- Ɵons for brook trout, brown trout, and smallmouth bass. The first model, the Midwest Fish Habitat Partnership’s DriŌless Area Resto- raƟon Effort (DARE) model, evaluates current habitat condiƟons. February 2013 PUBL 071 2013 Acres Currently Owned/Eased PLANNING REGION Fee Easement Total Baraboo 724 171 895 Black 6,959 737 7,696 Chippewa 4,796 1,220 6,016 Kickapoo 6,491 2,018 8,509 Kinnickinnic 1,694 220 1,914 Lower WI 5,459 1,712 7,171 Pecatonica 1,702 967 2,669 PlaƩe 27 1,062 1,089 TOTAL 27,852 8,107 35,960 Total acreage of DNR properƟes included in the © Dennis Franke
-
Upload
vuongkhanh -
Category
Documents
-
view
218 -
download
1
Transcript of Dri less Area Stream Master Plan Project Regional and...

Dri less Area Stream Master Plan Project
Regional and Property Analysis E S
A ngling in southwestern Wisconsin’s Dri less Area is unques-
onably one of the state’s premier outdoor experiences.
Over the be er part of a century, the Department of Natural Re-
sources (DNR) has worked with a wide range of partners to help
protect, restore, and manage the streams and rivers that flow
through this unique landscape. Thanks to the efforts of fish biolo-
gists, fishing organiza ons and clubs and their reless volunteers,
farmers and landowners, businesses, and local governments, few
places in the Midwest can rival the diversity and quality of fishing
here.
The Department owns or holds easements on more than 35,000
acres along trout and smallmouth bass streams in the Dri less Area
and is in the process of upda ng the management plan for these
proper es. To simplify and speed up the planning process, the De-
partment is developing one master plan, called the Dri less Area
Master Plan (DAMP), to cover all these proper es. The plan will
describe the habitat management and land protec on goals, objec-
ves, and strategies for these proper es and chart a course for the
future. The first step in the planning process is the dra ing of this
ini al document, the Regional & Property Analysis (RPA).
The purpose of the RPA
T he RPA presents background informa on about the DNR
proper es and the waters that flow through them. It focuses
on informa on of primary interest to anglers: where the fish are,
where the public access is located, and where the fish are likely to
be in the future, given changing climate condi ons. Informa on
about habitats beyond the immediate stream corridors, recrea on
demand, the projected thermal resilience of streams, and other
factors is also presented. The informa on in the RPA is the founda-
on from which the master plan will be developed.
The proper es included in this plan are primarily owned by the Fish-
eries Management Program (state fishery areas as well as lands
acquired through the “remnant” habitat program and the stream
bank protec on program). In addi on, several proper es along
trout and bass waters that are owned and managed by the wildlife
management or the state natural areas programs are also included.
The lands included in this master plan include those protected
through both fee acquisi on and easements. The DAMP will guide
and priori ze the DNR’s habitat management ac ons (including in-
stream restora on) and land acquisi on efforts over the next 15
years.
How DNR applies science to planning
T he Department has limited staff and financial resources and
wants to ensure that its investments in stream restora on
and maintenance have a high likelihood of suppor ng the desired
species over the long term. Similarly, the DNR seeks to invest in
public access where there is a high degree of confidence that popu-
la ons of the desired fish species will be sustained over me.
The Fisheries Management Program uses electrofishing as a method
to measure adult trout and bass abundance in Wisconsin streams.
To evaluate the present-day quality of the sport fisheries found
throughout the 94 watersheds in the Dri less Area, 6,737 electro-
fishing surveys were analyzed in the RPA.
The RPA also used two of the newest science-based stream models
to help evaluate the suitability of current and future habitat condi-
ons for brook trout, brown trout, and smallmouth bass. The first
model, the Midwest Fish Habitat Partnership’s Dri less Area Resto-
ra on Effort (DARE) model, evaluates current habitat condi ons.
February 2013 PUBL 071 2013
Acres Currently Owned/Eased PLANNING REGION Fee Easement Total Baraboo 724 171 895
Black 6,959 737 7,696
Chippewa 4,796 1,220 6,016
Kickapoo 6,491 2,018 8,509
Kinnickinnic 1,694 220 1,914
Lower WI 5,459 1,712 7,171
Pecatonica 1,702 967 2,669
Pla e 27 1,062 1,089
TOTAL 27,852 8,107 35,960
Total acreage of DNR proper es included in the
© D
en
nis
Fra
nke
Dri less Area Streams │ Page 2
This model assesses the rela ve influence that different factors have
in determining the likelihood that each of the species will be present
or absent in a par cular reach of stream. The computer model evalu-
ated both natural habitat poten al (i.e., things that people cannot
influence), as well as the degree of human-induced land use stressors.
The poten al impacts of long-term changing climate condi ons are
increasingly in the news. In par cular, trout anglers and biologists
have been at the forefront of assessing and projec ng how warming
temperatures and increasingly intensive storm events may impact
trout abundance and distribu on. The second model used in the
RPA, which was developed by USGS and other Midwest scien sts,
evaluates the impact of projected climate changes on future distri-
bu ons of brook and brown trout and smallmouth bass. For each
species, this model projects a future distribu on, based on species-
specific habitat needs, exis ng stream condi ons and their thermal
resilience, current fish distribu on, and a series of predicted future
climate scenarios.
Contemporary data on sport-fisheries performance, combined with
habitat models which depict current and future fish species distribu-
ons, provides resource managers with spa ally powerful tools. The-
se science-based approaches enable managers to make wise invest-
ments of limited staff and financial resources.
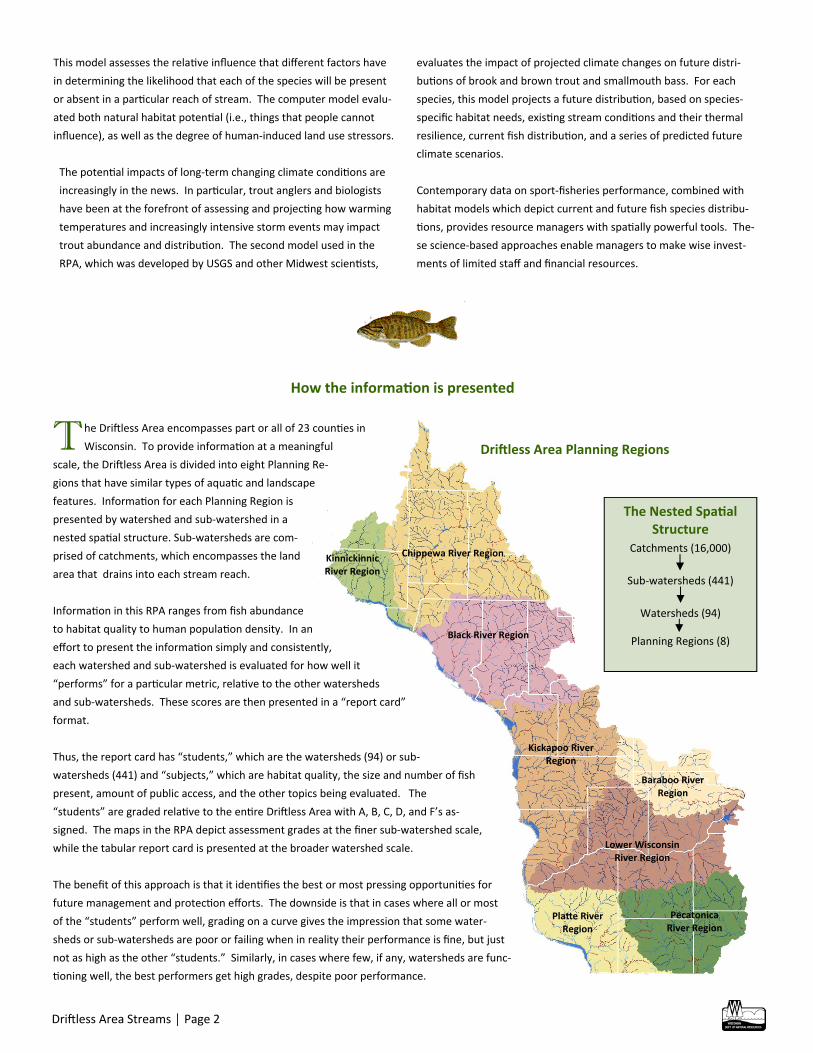
T he Dri less Area encompasses part or all of 23 coun es in
Wisconsin. To provide informa on at a meaningful
scale, the Dri less Area is divided into eight Planning Re-
gions that have similar types of aqua c and landscape
features. Informa on for each Planning Region is
presented by watershed and sub-watershed in a
nested spa al structure. Sub-watersheds are com-
prised of catchments, which encompasses the land
area that drains into each stream reach.
Informa on in this RPA ranges from fish abundance
to habitat quality to human popula on density. In an
effort to present the informa on simply and consistently,
each watershed and sub-watershed is evaluated for how well it
“performs” for a par cular metric, rela ve to the other watersheds
and sub-watersheds. These scores are then presented in a “report card”
format.
Thus, the report card has “students,” which are the watersheds (94) or sub-
watersheds (441) and “subjects,” which are habitat quality, the size and number of fish
present, amount of public access, and the other topics being evaluated. The
“students” are graded rela ve to the en re Dri less Area with A, B, C, D, and F’s as-
signed. The maps in the RPA depict assessment grades at the finer sub-watershed scale,
while the tabular report card is presented at the broader watershed scale.
The benefit of this approach is that it iden fies the best or most pressing opportuni es for
future management and protec on efforts. The downside is that in cases where all or most
of the “students” perform well, grading on a curve gives the impression that some water-
sheds or sub-watersheds are poor or failing when in reality their performance is fine, but just
not as high as the other “students.” Similarly, in cases where few, if any, watersheds are func-
oning well, the best performers get high grades, despite poor performance.
Chippewa River Region Kinnickinnic River Region
Black River Region
Kickapoo River Region
Baraboo River Region
Lower Wisconsin River Region
Pla e River Region
Pecatonica River Region
How the informa on is presented
Dri less Area Planning Regions
The Nested Spa al Structure
Catchments (16,000)
Sub-watersheds (441)
Watersheds (94)
Planning Regions (8)

Wisconsin DNR Execu ve Summary │ Page 3
The Dri less Area is home to the highest concentra on of trout
streams in the Midwest. Over the last several decades, thanks
to significant improvements in land use prac ces and stream
restora on efforts, these streams support more trout than
most anglers have seen in their life mes.
The Department, in close collabora on with Trout Unlimited,
the Smallmouth Bass Alliance, local rod & gun clubs, county
and local governments, NRCS and F&WS, and other organiza-
ons, have restored and maintained more than 300 miles of
streams in the Dri less Area since 1970. This has led to signifi-
cant increases in the number of fish present in these waters.
The most restora on work has been completed in the Kickapoo
River Region.
The Dri less Area is home to several rare natural community
types – including oak savanna and forests, dry prairies, wet
prairies and sedge meadows, and floodplain forests. Several of
the DNR proper es in this master planning project have oppor-
tuni es to manage and restore these and other important hab-
itats.
Trout streams or reaches of streams tend to be dominated by
either brooks or browns – very few waters have similar-sized
popula ons of both species.
Take home messages of the RPA: General
Public shoreline access for trout angling is patch-
ily distributed across the Dri less Area – 6.5% of
the sub-watersheds have over 50% of their trout
stream miles in public ownership while for near-
ly a third of the 325 sub-watersheds with trout
streams, the only public access is from roads and
for anglers to “keep their feet wet.”
The Department acquires both fee tle property
and easements along trout waters in the Dri -
less Area.
The Dri less Area is “bookended” by the Twin
Ci es and Madison. More than 300,000 people
live within a one-hour drive of over half the
Dri less Area. As such, the highest quality
streams – par cularly those with public shore
access – tend to be heavily fished, especially
early in the season. Data on other recrea onal
uses of the DNR proper es are not available.
Two-thirds of trout streams have
some public access along their banks.
The percent of trout stream miles with public shore access, by sub‐watershed.
Take home messages of the RPA: Trout angling access

Dri less Area Streams │ Page 4
Brook Trout
Brook trout is Wisconsin’s na ve trout species.
Although found in every planning region, the
highest popula on densi es occur in the eastern
Kinnickinnic River/western Chippewa River re-
gions, the Black River Region, and in the Bara-
boo Hills.
Brook trout tend to be found in headwater creeks with
clean, cold water.
Take home messages of the RPA: Trout abundance
As can be seen in these two maps, trout streams (or sec ons of streams) tend to be dominated by either
brook or brown trout—not many waters harbor similar-sized popula ons of both species.
Brown Trout
Brown trout were
introduced into
Wisconsin waters over one
hundred years ago. Brown
trout now naturally reproduce in
many streams in the Dri less Area.
Par cularly large popula ons of brown
trout are found in the Kinnickinnic and
Kickapoo River regions and parts of the
Lower Wisconsin and Pecatonica River
regions.
Brown trout tend to be found in larger
streams and are more tolerant of a
broader range of habitat condi ons.
In the RPA, fish sizes were classified as follows: Brook Trout Stock-size = 5” up to 8”
Quality-size = 8” up to 12”
Memorable-size = 12” and above
Brown Trout Stock-size = 6” up to 10”
Quality-size = 10” up to 15”
Memorable-size = 15” and above
For maps of the distribu on and abundance of quality and memorable trout, see pages 2-19 and 2-20 as well as the region chapters.

Wisconsin DNR Execu ve Summary │ Page 5
Smallmouth bass are found in all of the larger river systems in
the Dri less Area (although data on their abundance and
distribu on is not available for many waters). As water
quality has improved in many rivers, bass popula ons
have responded well.
Angling access is generally excellent along large
rivers, especially the Lower Wisconsin River.
Since many bass anglers fish from boats, well-
spaced boat access sites are par cularly im-
portant in providing adequate access.
Smallmouth bass are piscivores (“fish eat-
ers” ) and, as such, naturally occur at lower
densi es than trout which are insec vores
(“insect eaters”).
Take home messages of the RPA: Smallmouth bass abundance and angling access
The probability that smallmouth bass occurs in each sub‐watershed,
as determined by the DARE model.
The percent of smallmouth bass stream and river miles with public shore access, by
sub‐watershed.
DNR data on smallmouth bass distribu on and abundance is
incomplete. Instead of display-ing the exis ng incomplete
data, the above map shows the output of the DARE model,
which takes into account a wide array of variables to determine the probability of smallmouth
bass occurring in each sub-watershed.
Many of the DNR lands that provide public access along smallmouth bass waters are larger
State Wildlife Areas and are not included in this Dri less Area
Master Plan.

Dri less Area Streams │ Page 6
All the streams and rivers of the Dri less Area are projected to
warm by the middle of the century due to climate change, but most
will con nue to support trout.
The thermal resilience of streams and rivers varies across the Dri -
less Area – some waters are projected to have July mean tempera-
tures increase more than 2.5°F by the mid-century while others are
projected to increase less than 1°F. A significant factor in this differ-
ence is the rela ve amounts of stream flow contributed by shallow
and deep groundwater sources.
As a result of climate change, models project a 75 percent reduc on
in the number of stream miles brook trout will occupy in the Dri -
less Area. Some areas are likely to remain as cri cal strongholds for
brook trout, for example the Black River Region, and could be con-
sidered for future reserves.
Brown trout are projected to be more resilient to climate changes
than brook trout. For brown trout, fish distribu on models project
only a small reduc on in their future distribu on.
Different stream and riparian management strategies may dampen
the effects of climate change on trout.
Only some waters that are projected to warm to the extent that
they’ll no longer support trout will become smallmouth bass waters.
This is due, primarily, to the fact that smallmouth bass require larg-
er bodies of water and because they occupy a higher trophic level.
Take home messages of the RPA: Climate change
Climate change models project that brook trout popu‐la ons may be reduced by 75% by mid‐century ...
Projected increases in stream temperature
vary across the Dri less Area, primarily due to
differences in groundwa-ter inputs.
Lost Brook TroutRisk Brook TroutStable Brook Trout
Barab
oo R
iver R
egion
Black R
iver R
egion
Chippe
wa Rive
r Reg
ion
Kickap
oo R
iver R
egion
Kinniki
nnic
River R
egion
Lower
Wis
River R
egion
Pecat
onica
Rive
r Reg
ion
Platte
Rive
r Reg
ion
0
100
200
300
400
500
600
700
800
900
Tot
al S
trea
m L
engt
h (m
iles)
Lost Brown TroutRisk Brown TroutStable Brown Trout
Barab
oo R
iver R
egion
Black
Rive
r Reg
ion
Chippe
wa Rive
r Reg
ion
Kickap
oo R
iver R
egion
Kinniki
nnic
River R
egion
Lower
Wis
River R
egion
Pecat
onica
Rive
r Reg
ion
Platte
Rive
r Reg
ion0
500
1,000
1,500
To
tal S
tre
am
Le
ng
th (
mile
s)
… while brown trout are projected to be only modestly affected.
Smallmouth bass are projected to expand their range in all the planning regions, with par cularly large
increases in the Lower Wisconsin River Region.

Execu ve Summary │ Page 7
Kinnickinnic River Region Highlights
The Kinnickinnic is the smallest of the Dri less Area planning regions and contains only six watersheds, five of which contain trout streams.
Brook trout are most prevalent in the tributaries or headwater streams of the Kinnickinnic, Lake Pepin and
Rush River watersheds. The best natural habitat for brook trout in the region is found in the Kinnickinnic River watershed;
unfortunately, this watershed also contains high levels of land use stress. Fish distribu on models incorpora ng climate change impacts project serious declines for brook trout in
the Kinnickinnic River Region, most notably the Rush River system where over 80% of the occupied stream miles are projected to be lost.
The Kinnickinnic River Region contains a concentra on of sub-watersheds with very high brown trout
densi es. At nearly 550 fish/mile, the Kinnickinnic River watershed has the highest median catch rate for brown trout in the Dri less Area.
Inland waters of the region have limited smallmouth bass habitat; as a result, bass fishing opportuni es
are nearly absent. The primary public property in the Kinnickinnic River Region is the Kinnickinnic River State Fishery area
which encompasses 350 acres in fee and 155 in easement. There are also 853 acres in this watershed that were acquired under the Streambank Protec on program.
The Pine Creek Fishery Area consists of several hundred acres once owned by West Wisconsin Land Trust. The Kinnickinnic River watershed scores well for the amount of in-stream restora on and the amount of
angling access. Much stream restora on work has been completed thanks to the efforts of many partner groups. The other watersheds have generally had li le in-stream work completed.
All the watersheds are within very easy access of the Twin Ci es and provide quick day-trip opportuni es
for those residents, in addi on to local anglers from Pierce and St. Croix coun es. Publicly accessible lands along trout waters in the region are very heavily used. Given the large number of anglers within a one-hour drive of the region, all watersheds have poor public access rela ve to demand.

Dri less Area Streams │ Page 8
Kinnickinnic River Region Report Card
Watersheds
Big R
iver - Mississip
pi R
iver
Hay C
reek - M
ississipp
i River
Kin
nickin
nic R
iver
Lake Pep
in
Ru
sh R
iver
Trimb
elle River
Brook Trout
Stream Health and Habitat Quality
Natural Habitat Poten al B B A B B B
Land Use Stress D D D C C C
Sport Fishery Performance
Stock (5" up to 8") F B A B F
Quality (8" up to 12") F C B A F
Memorable (12" +) F F F F F
Projected resilience to climate change C C B C B
Brown Trout
Stream Health and Habitat Quality
Natural Habitat Poten al B D D B B B
Land Use Stress F D F B C D
Sport Fishery Performance
Stock (6" up to 10") A A D A A
Quality (10" up to 15") B A C A A
Memorable (15" +) D C F A C
Projected resilience to climate change D C D B C
Small‐ mouth
Bass
Stream Health and Habitat Quality
Natural Habitat Poten al F B D
Land Use Stress D A C
Sport Fishery Performance
Stock (8" up to 14") F D
Memorable (14" +) F F
Projected gain from climate change D B D C C
Trout Stream
Thermal stability of trout streams A - C C C A
Total miles of stream restora on F - B F C C
Recrea‐on
Angling opportuni es
Percent of trout stream miles with public access
F A C D D
Percent of smallmouth bass stream miles with public access
A C
Supply rela ve to demand
Miles of publicly-accessible trout and SMB streams per 100K people within a 1-hour drive
F F C D D D
Grades show each watershed’s place in the distribu on of all Dri less Area watersheds. An A means the value is in the upper quar-
le (75%-100%) or upper quin le (80%-100%) of the distribu on
An F means the value is zero or is in the lowest quin le (0-20%) of the distribu on.
Blank cells indicate “not applicable.

Execu ve Summary │ Page 9
Kinnickinnic River Region Brook and Brown Trout Maps

Execu ve Summary │ Page 10
Kinnickinnic River Region Public Access Map

Execu ve Summary │ Page 11
Chippewa River Region Highlights
The Chippewa River Region is large, with 16 watersheds. It is a very accessible region that is bisected by major highways and the interstate. The western por on of the region is within and one-hour drive of the Twin Ci es and includes three of the top ten largest urban areas within Dri less Area: Eau Claire, Menominee, and Chippewa Falls. There is a lot of public land associated with the Chippewa River (state-owned) and the Eau Claire River (county-owned).
Brook trout dominate the Chippewa River Region, par cularly in the western and northern parts where a
no ceable stream gradient exists. Eleven of the 16 watershed in the region support an average or be er abundance of brook trout.
The western por on of the Chippewa River Region contains a number of streams that are projected to retain
much of their current thermal condi on, providing habitat condi ons suitable for brook trout into the future. In general, stream climate models show that trout streams on the eastern side are much more vulnerable to
increasing stream temperatures by mid-century and will experience greater impacts from climate warming. Except for the Beaver Creek sub-watershed, brook trout are projected to be nearly ex rpated in Eau Claire County.
Although brown trout are more spo y in their distribu on, the region holds excellent brown trout fisheries in
Elk Creek, Plum Creek, Arkansaw, Bear, por ons of O er Creek and por ons of Lowes Creek watersheds. Elk and Plum Creek watersheds are home to the most sympatric brook trout-brown trout popula ons in the
Dri less Area. The Chippewa River Region holds the lowest of degree of public access for trout angling in the Dri less Area
(less than 11%), despite having the second highest total miles of trout streams in the area. A geographic mismatch exists between the projected future trout fishery and current public access condi ons. Many of the sub-watersheds that hold good public access are the same sub-watersheds that are most vulnerable to the effects of climate warming on thermal habitat and trout popula ons.
Five of the 16 watersheds have very limited or no trout angling access. Bear Creek , South Fork of the Hay and
Plum Creek watersheds all contain very good brook trout fisheries but with very limited angling access. The Chippewa River Region is among the best for the diversity of larger rivers that support smallmouth bass
fisheries and contains the most miles of smallmouth bass-managed streams. The region includes the Hay, Red Cedar, Chippewa, and Eau Claire rivers.

Dri less Area Streams │ Page 12
Chippewa River Region Report Card
Watersheds
Bear C
reek - C
hip
pew
a Rive
r
Du
ncan
Cree
k
Eau C
laire River
Eau G
alle River
Elk Creek
Fisher R
iver - Ch
ipp
ewa
Hay R
iver
Lake Me
no
min
- Red
Ced
ar R
Low
er P
ine C
reek - R
ed C
edar
Low
es Cre
ek - Ch
ipp
ewa R
iver
Mu
dd
y Cree
k - Ch
ip. R
: Low
er
Mu
dd
y Cree
k - Ch
ip. R
: Up
per
Oe
r Cree
k
Plu
m C
reek
Sou
th Fo
rk of th
e Hay
Trou
t Cree
k - Ch
ipp
ewa R
iver
Brook Trout
Stream Health and Habitat Quality
Natural Habitat Poten al B A A A A A A A A A A
Land Use Stress B D C D B D C B D C C
Sport Fishery Performance
Stock (5" up to 8") D A C B A A B A C F F F F A A F
Quality (8" up to 12") A B F A B A C A C F F F F A A F
Memorable (12" +) B F F F F A F F F F F F F C F F
Projected resilience to climate change A D B A D A A B C C D D B A D
Brown Trout
Stream Health and Habitat Quality
Natural Habitat Poten al B F D D F F F D F B F
Land Use Stress D B C D D B A C C D C
Sport Fishery Performance
Stock (6" up to 10") F F F F A F F F F C F F D A F F
Quality (10" up to 15") F D F F A F F F F D F F C A F F
Memorable (15" +) F F F F C F F F F D F F F A F F
Projected resilience to climate change B D C A D B B B C B D D C A D
Small‐ mouth
Bass
Stream Health and Habitat Quality
Natural Habitat Poten al A A D A A A F A
Land Use Stress B D C F F F F D
Sport Fishery Performance
Stock (8" up to 14") C F F F F D C B F D C F B
Memorable (14" +) C F F F F F F B F F F F B
Projected gain from climate change B D C C C B C C D B D D B B C D
Trout Stream Habitat
Thermal stability of trout streams A D C B B A C C D C D C D C B
Total miles of stream restora on F F F B F F F C F F F F F F F F
Recrea‐on
Angling opportuni es
Percent of trout stream miles with public access
D A D C A A C C C A B C F D D F
Percent of smallmouth bass stream miles with public access
A F B C
A D A D B B
F
F D
Supply rela ve to demand
Miles of publicly-accessible trout and SMB streams per 100K people within a 1-hour drive
A A B C A A B B B A C B F D D D
Grades show each watershed’s place in the distribu on of all Dri less Area watersheds. An A means the value is in the upper quar-
le (75%-100%) or upper quin le (80%-100%) of the distribu on
An F means the value is zero or is in the lowest quin le (0-20%) of the distribu on.
Blank cells indicate “not applicable.

Execu ve Summary │ Page 13
Chippewa River Region Brook Trout and Smallmouth Bass Maps

Execu ve Summary │ Page 14
Chippewa River Region Public Access Maps

Execu ve Summary │ Page 15
Black River Region Highlights
The Black River Region along with its northern neighbors, the Kinnickinnic and Chippewa river regions,
represent the heart of brook trout country in the Dri less Area. This region holds some of the best
natural habitat and lowest land use stress for brook trout popula ons.
Trout streams in the Black River Region are projected to be more resilient to the effects of global
warming on brook trout, compared to all the planning regions in the Dri less Area. In fact, the Black
River Region could act as a core “reserve” area for brook trout in the future.
The Fleming Creek Watershed holds the most stream miles in the en re Dri less Area projected to be
“stable” (40.8 miles) for brook trout. The con guous Fleming Creek, Beaver Creek, and the Upper
Trempealeau River watersheds, will likely be cri cal in future management of brook trout in
Wisconsin.
Streams of Black River Region have experienced li le establishment of brown trout, which is
beneficial to the exis ng brook trout popula on.
Public access for trout fishing is excellent in the northeast (Halls Creek and Harvey/Buffalo
watersheds) and southeast parts of the region (Fleming Creek watershed). Trout angling access is low
-to-poor in most other areas. Public access is among the lowest of all the planning regions.
Habitat condi ons are best for smallmouth bass in the Black River and Lower Trempealeau River
watersheds. These river reaches have greater average width, warmer water temperatures, and a
greater diversity of forage fish species.
Rela vely good access exists in sub-watersheds where the best smallmouth bass popula ons are
present. However, there is a gap in public access in the lower Black River - Fleming Creek sub-
watershed.

Dri less Area Streams │ Page 16
Black River Region Report Card
Watersheds
Beave
r Cree
k
City o
f Win
on
a - Mississip
pi R
Elk Creek
Elk Creek - B
uff
alo R
iver
Flemin
g Cre
ek - Black R
iver
Halls C
reek
Harvey C
reek - Buff
alo R
iver
Low
er Trem
peale
au R
iver
Mid
dle Trem
pealeau
River
Pigeo
n C
reek
Up
pe
r Tremp
ealeau
River
Wau
mau
nd
ee Cre
ek
Brook Trout
Stream Health and Habitat Quality
Natural Habitat Poten al B B B C A A C B A A B
Land Use Stress A B A A B B A C A A A
Sport Fishery Performance
Stock (5" up to 8") B C F B B B F D F A C
Quality (8" up to 12") B A A C F B D C C C B
Memorable (12" +) F F F F F F F F F F F
Projected resilience to climate change A C A A A B A A B A A A
Brown Trout
Stream Health and Habitat Quality
Natural Habitat Poten al D F B F F F D D F F A
Land Use Stress B D F A A C F F A A F
Sport Fishery Performance
Stock (6" up to 10") F F F F F F F D F F F
Quality (10" up to 15") F F F F F F F F F F F
Memorable (15" +) F F F F F F F F F F F
Projected resilience to climate change A D A A A C A A A B A A
Small‐ mouth
Bass
Stream Health and Habitat Quality
Natural Habitat Poten al D C F C A F F A C F D D
Land Use Stress C A D D D F D D D F F A
Sport Fishery Performance
Stock (8" up to 14") F F F F B F D F F F F
Memorable (14" +) F F F F F F D F F F F
Projected gain from climate change C D D D C D C B D B C B
Trout Stream Habitat
Thermal stability of trout streams A B A A C D C D B B
Total miles of stream restora on F D F B D B F F F B F
Recrea on
Angling opportuni es
Percent of trout stream miles with public access
D
D F B A A C F D C D
Percent of smallmouth bass stream miles with public access
F A F D B C B C F F F F
Supply rela ve to demand
Miles of publicly-accessible trout and SMB streams per 100K people within a 1-hour drive
C D C D A A A B F D B D
Grades show each watershed’s place in the distribu on of all Dri less Area watersheds. An A means the value is in the upper quar-
le (75%-100%) or upper quin le (80%-100%) of the distribu on
An F means the value is zero or is in the lowest quin le (0-20%) of the distribu on.
Blank cells indicate “not applicable.

Execu ve Summary │ Page 17
Black River Region Brook and Brown Trout Maps

Execu ve Summary │ Page 18
Black River Region Public Access Maps

Execu ve Summary │ Page 19
Most of the watersheds in the Kickapoo River Region hold a mix of brown and brook trout, but brown trout
are more abundant.
The Kickapoo River Region has the second highest catch rates for brown trout among the eight planning
regions. Of the 15 watersheds in the Kickapoo Region, four hold among the highest densi es of brown trout in the
Dri less Area: the Bad Axe River, Coon Creek, Tainter Creek and the West Fork of the Kickapoo River. Inland waters of the region have limited smallmouth bass habitat and few smallmouth bass fisheries. Fishery Areas and fishing easements provide ample public access for trout angling opportuni es, making
this area of the state a des na on for trout anglers. The brook trout watersheds most resilient to the effects of climate change are found in the northern and
northeastern por ons of the region: Lower La Crosse, Middle La Crosse, Upper La Crosse, Bear Creek, and West Fork of the Kickapoo River.
The highest levels of land use stress on trout habitat are associated with the region’s upland ridge (along
Hwy 27) which runs from Norwalk in La Crosse County, southwest to Eastman in Crawford County. Rush Creek State Natural Area contains a diversity of habitats, is home to numerous rare plants and
animals including “goat prairies,” southern oak forest, floodplain forest and the spring-fed Rush Creek itself.
Fort McCoy offers hun ng, fishing, and trapping opportuni es to the general public, although a permit is
required. Fort McCoy has approximately 70 miles of coldwater streams and tributaries.
Kickapoo River Region Highlights
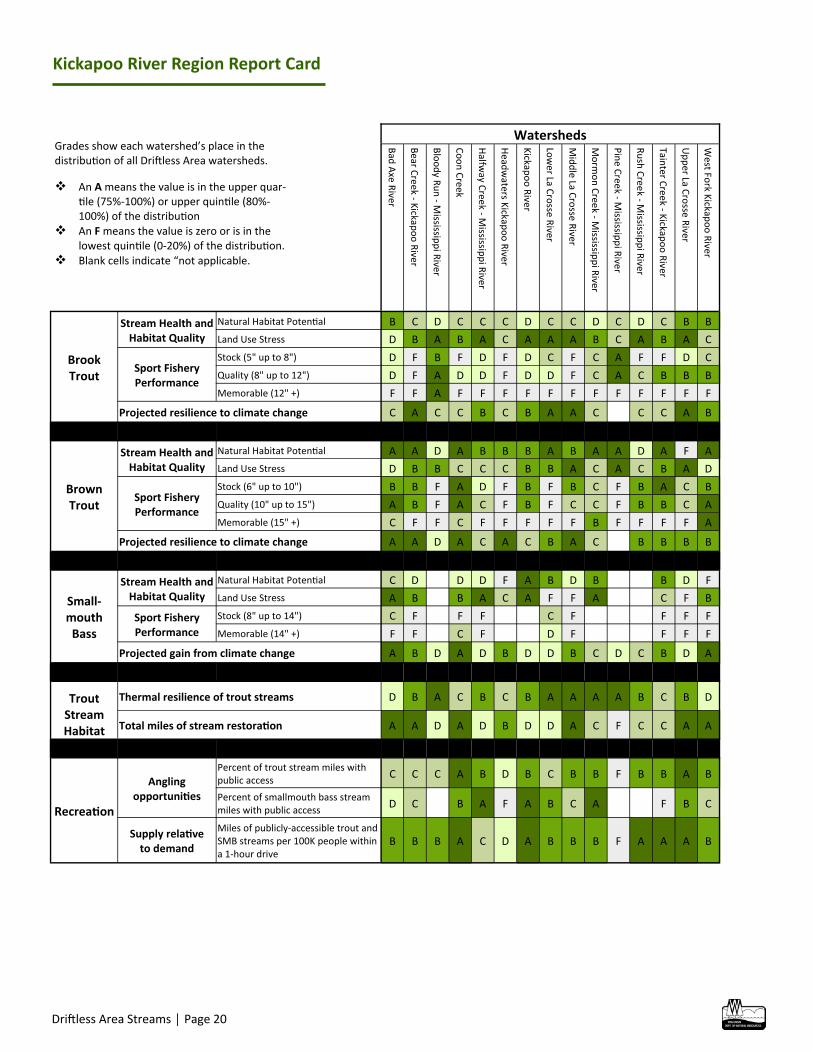
Dri less Area Streams │ Page 20
Kickapoo River Region Report Card
Watersheds
Bad
Axe R
iver
Bear C
reek - K
ickapo
o R
iver
Blo
od
y Ru
n - M
ississipp
i River
Co
on
Cree
k
Halfw
ay Cree
k - Mississip
pi R
iver
Head
waters K
ickapo
o R
iver
Kickap
oo
Rive
r
Low
er La C
rosse R
iver
Mid
dle La C
rosse
River
Mo
rmo
n C
reek - M
ississipp
i River
Pin
e Cree
k - Mississip
pi R
iver
Ru
sh C
reek - M
ississipp
i River
Tainter C
reek - K
ickapo
o R
iver
Up
pe
r La Cro
sse River
West Fo
rk Kickap
oo
Rive
r
Brook Trout
Stream Health and Habitat Quality
Natural Habitat Poten al B C D C C C D C C D C D C B B
Land Use Stress D B A B A C A A A B C A B A C
Sport Fishery Performance
Stock (5" up to 8") D F B F D F D C F C A F F D C
Quality (8" up to 12") D F A D D F D D F C A C B B B
Memorable (12" +) F F A F F F F F F F F F F F F
Projected resilience to climate change C A C C B C B A A C C C A B
Brown Trout
Stream Health and Habitat Quality
Natural Habitat Poten al A A D A B B B A B A A D A F A
Land Use Stress D B B C C C B B A C A C B A D
Sport Fishery Performance
Stock (6" up to 10") B B F A D F B F B C F B A C B
Quality (10" up to 15") A B F A C F B F C C F B B C A
Memorable (15" +) C F F C F F F F F B F F F F A
Projected resilience to climate change A A D A C A C B A C B B B B
Small‐ mouth
Bass
Stream Health and Habitat Quality
Natural Habitat Poten al C D D D F A B D B B D F
Land Use Stress A B B A C A F F A C F B
Sport Fishery Performance
Stock (8" up to 14") C F F F C F F F F
Memorable (14" +) F F C F D F F F F
Projected gain from climate change A B D A D B D D B C D C B D A
Trout Stream Habitat
Thermal resilience of trout streams D B A C B C B A A A A B C B D
Total miles of stream restora on A A D A D B D D A C F C C A A
Recrea on
Angling opportuni es
Percent of trout stream miles with public access
C C C A B D B C B B F B B A B
Percent of smallmouth bass stream miles with public access
D C B A F A B C A F B C
Supply rela ve to demand
Miles of publicly-accessible trout and SMB streams per 100K people within a 1-hour drive
B B B A C D A B B B F A A A B
Grades show each watershed’s place in the distribu on of all Dri less Area watersheds. An A means the value is in the upper quar-
le (75%-100%) or upper quin le (80%-100%) of the distribu on
An F means the value is zero or is in the lowest quin le (0-20%) of the distribu on.
Blank cells indicate “not applicable.

Execu ve Summary │ Page 21
Kickapoo River Region Public Access Map

Execu ve Summary │ Page 22
Kickapoo River Region Brook and Brown Trout Maps

Execu ve Summary │ Page 23
Baraboo River Region Highlights
The Baraboo Region as a whole harbors a rela vely equal mix of brook and brown trout. Individual stream
reaches tend to be dominated by either brook or brown trout.
Natural habitat for brook trout is highest in Devil’s Lake and Dell Creek watersheds. There is good brook
trout habitat in the streams that originate in or very near the Baraboo Hills (Rowley Creek, Boulder Creek,
Leech Creek, and Harrison Creek).
Devil’s Lake and Dell Creek watersheds contain large tracts of public conserva on lands which are subject to
higher degrees of resource protec on than other lands in the region. Over 90% of the DNR (public) and
private conserva on lands in the en re region are contained within these two watersheds allowing cold
base flows, lower levels of land use stress and excellent trout habitat.
Most of the brook trout popula ons are projected to be lost by the mid-century due to climate change.
Remnant distribu ons of brook trout most resilient to the effects of climate warming are projected to be
found in the Devil’s Lake and Dells Creek watersheds.
The majority of the brown trout waters in this region are projected to remain resilient to climate change.
The highest quality natural habitat for smallmouth bass is located in the largest and warmest waters, mainly
the Wisconsin and Baraboo Rivers. The Wisconsin River supports an outstanding smallmouth bass fishery,
with sufficient depth, ample forage and fer le warm waters. The removal of dams along the Baraboo River
has resulted in an excellent smallmouth bass fishery as well.
Except for the Dell Creek watershed, public access to trout streams is lacking. Public access for smallmouth
bass angling is much be er. Unlike trout fishing, smallmouth bass anglers o en fish from boats; numerous
public boat launches are available along most bass waters.
The Baraboo River planning region has the fewest acres of lands included in the DAMP (895 acres) and
includes only one State Fishery Area (Hulburt Creek), one remnant habitat project, several hundred acres of
stream bank protec on (Narrows Creek) and 122 acres of sca ered wildlife property.

Dri less Area Streams │ Page 24
Baraboo River Region Report Card
Watersheds
Dell C
reek - W
iscon
sin R
iver
Devil's Lake - B
arabo
o R
iver
Head
waters o
f the B
arabo
o R
iver
Lile B
arabo
o R
iver - Barab
oo
R
Narro
ws C
reek - B
arabo
o R
iver
Brook Trout
Stream Health and Habitat Quality
Natural Habitat Poten al B A B C C
Land Use Stress B D C D D
Sport Fishery Performance
Stock (5" up to 8") C A D B F
Quality (8" up to 12") B D D B F
Memorable (12" +) F F F C F
Projected resilience to climate change B A B B B
Brown Trout
Stream Health and Habitat Quality
Natural Habitat Poten al D F B A A
Land Use Stress A C F F B
Sport Fishery Performance
Stock (6" up to 10") C C D F A
Quality (10" up to 15") D D D F C
Memorable (15" +) F F F F F
Projected resilience to climate change B C A A B
Small‐ mouth
Bass
Stream Health and Habitat Quality
Natural Habitat Poten al A B D C B
Land Use Stress D B C A C
Sport Fishery Performance
Stock (8" up to 14") A C F C
Memorable (14" +) B F F C
Projected gain from climate change C C C C A
Trout Stream Habitat
Thermal resilience of trout streams D D D C A
Total miles of trout stream restora on D F D D F
Recre‐a on
Angling opportuni es
Percent of trout stream miles with public access
B B D F D
Percent of smallmouth bass stream miles with public access
B C D C C
Supply rela ve to demand
Miles of publicly-accessible trout and SMB streams per 100K people within a 1-hour drive
B C D C C
Grades show each watershed’s place in the distribu on of all Dri less Area watersheds. An A means the value is in the upper quar-
le (75%-100%) or upper quin le (80%-100%) of the distribu on
An F means the value is zero or is in the lowest quin le (0-20%) of the distribu on.
Blank cells indicate “not applicable.

Execu ve Summary │ Page 25
Baraboo River Region Brook and Brown Trout Maps

Execu ve Summary │ Page 26
Baraboo River Region Public Access Maps

Execu ve Summary │ Page 27
Lower Wisconsin River Region Highlights
The Lower Wisconsin River Region contains some of the most produc ve brown trout water in the Dri less Area. There is excellent natural habitat poten al for brown trout throughout much of this region, as well as low land use stresses.
Although heavily fished, abundant brown trout with excellent size-structure occur in Black Earth Creek
and the Green River and Blue River systems. Importantly, these streams are generally expected to maintain much of their thermal regime and are
predicted to support large popula ons of brown trout in the future, despite a warming climate. Although there are pockets of very good to excellent brook trout habitat here, the region generally has
poor to fair brook trout fisheries. The high quality brook trout habitats and popula ons are in and around the Baraboo Hills and in the headwater creeks along the north-western side of the region in Richland County.
Brook trout are projected to be nega vely affected by climate change in the Lower Wisconsin Region,
although several sub-watersheds are projected to retain significant miles of suitable habitat in the future. A substan al amount of stream restora on work has been completed in the region thanks to the efforts
of many partner groups. There is good access sca ered throughout the region; nearly all watersheds have some public access. Although there is substan al amount of public access along Black Earth Creek, it is one of the most heavily fished trout waters in the state and demand far exceeds public access availability here.
Smallmouth bass fishing is excep onal in the Wisconsin River. Most of the river shoreline between Sauk
City and Prairie du Chien is in public ownership and has ample boat access sites sca ered throughout the Lower Wisconsin State Riverway and Lake Wisconsin. This region offers some of the state’s premier smallmouth bass fishing.

Dri less Area Streams │ Page 28
Lower Wisconsin River Region Report Card
Watersheds
Bear C
reek
Big G
reen R
iver
Black Earth
Cre
ek
Blu
e Mo
un
ds C
reek
Blu
e Rive
r
City o
f Bo
scob
el - Wisco
nsin
R
City o
f Sprin
g Gre
en
- Wisco
nsin
R
Ho
ney C
reek
Ho
osier H
ollo
w - M
ill Creek
Kn
app
Cre
ek
Oe
r Cree
k
Oe
r Cree
k - Wisco
nsin
River
Pin
e River
Prairie d
u Sac D
am - W
iscon
sin R
Trou
t Cre
ek - M
ill Cre
ek
Willo
w C
reek
Wisco
nsin
River
Brook Trout
Stream Health and Habitat Quality
Natural Habitat Poten al C F C D D D D C D D D A D A D D D
Land Use Stress B D F D D B B D A A D B B B C B C
Sport Fishery Performance
Stock (5" up to 8") F F F F F D F F D C F B F A F F F
Quality (8" up to 12") F F F F D F F F F C F D F A F F F
Memorable (12" +) F F F F F F F F F F F F F A F F F
Projected resilience to climate change B C C B B B A C C B B B A C A C C
Brown Trout
Stream Health and Habitat Quality
Natural Habitat Poten al A B A A A A A A A A A B A D A A B
Land Use Stress A B C A B A A B C A C A B C A B B
Sport Fishery Performance
Stock (6" up to 10") D A B B B A B B B F D F D F C C C
Quality (10" up to 15") C A B A B B B C C F F F F F D F D
Memorable (15" +) D D B B C F F D F F F F F F F F F
Projected resilience to climate change C D B C A C B A B B A C A D B B C
Small‐ mouth
Bass
Stream Health and Habitat Quality
Natural Habitat Poten al F B F F C A A F D C F A C A F D A
Land Use Stress D B B B C C B C A C A F D B C D B
Sport Fishery Performance
Stock (8" up to 14") F B F F F F F F B F A F
Memorable (14" +) F A F F F F F F F F F F
Projected gain from climate change C B B C A D C A A B B D C D A B D
Trout Stream Habitat
Thermal resilience of trout streams B D A A B A A A B A B A B C B B B
Total miles of stream restora on C A A F A C F D B C B F D C B B C
Recrea on
Angling opportuni es
Percent of trout stream miles with public access
A A A C A B F B C C B A C A A B B
Percent of smallmouth bass stream miles with public access
D F C A D A A D C A C B B F B B F
Supply rela ve to demand
Miles of publicly-accessible trout and SMB streams per 100K people within a one-hour drive
B A C C A A B D A A B C B C C A A
Grades show each watershed’s place in the distribu on of all Dri less Area watersheds. An A means the value is in the upper quar-
le (75%-100%) or upper quin le (80%-100%) of the distribu on
An F means the value is zero or is in the lowest quin le (0-20%) of the distribu on.
Blank cells indicate “not applicable.

Execu ve Summary │ Page 29
Lower Wisconsin River Region Trout Maps

Execu ve Summary │ Page 30
Lower Wisconsin River Region Public Access Maps

Execu ve Summary │ Page 31
Pla e River Region Highlights
There is only a limited brook trout popula on in the Pla e River Region. There is no established breeding popu-la on and as a result, the exis ng popula on is supplemented with stocked fish.
Although the Pla e River Region has the smallest number of trout stream miles of the eight planning regions,
there are some healthy popula ons of brown trout found in headwater creeks. In par cular, some of the streams in the Upper Grant River watershed host impressively large numbers of brown trout.
Climate change is projected to have a devasta ng impact on brook trout in the Pla e River Region and largely
result in their ex rpa on from the region. However, despite not having an abundance of brown trout water, there are several watersheds in the region that are projected to remain thermally resilient for brown trout.
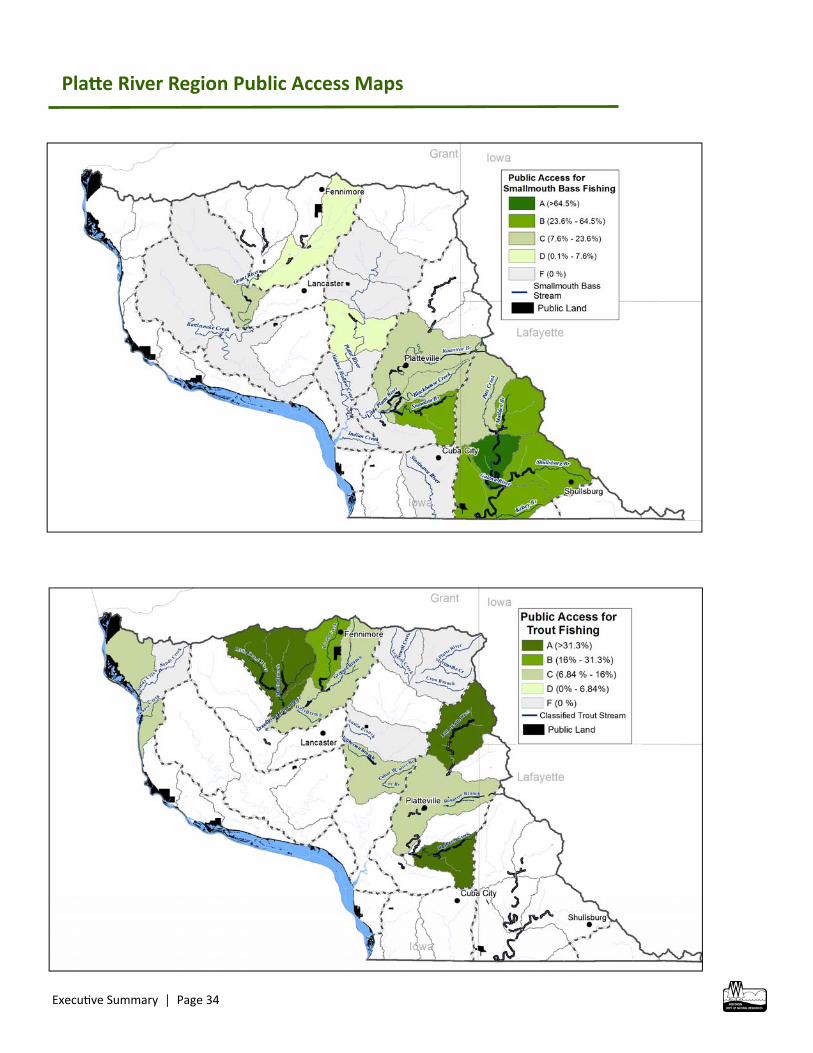
The region has good to very good natural habitat poten al for smallmouth bass and rela vely li le land use
stress. Although there are some problems with polluted runoff from farm opera ons and residual lead and zinc mining waste, significant progress has been made over the last couple of decades addressing these issues in many watersheds. The result is outstanding overall condi ons to support smallmouth bass in large numbers. Indeed, the region has 25% of all smallmouth bass stream habitat in Wisconsin.
Although sizeable smallmouth bass popula ons are found in many of the Dri less Area’s bigger rivers, more than
any other part of the state, the Pla e River Region has wadeable bass streams. The Grant, Pla e, Li le Pla e, and Galena (Fever) rivers are big enough to have large bass popula ons and small enough for anglers to enjoy while wading, paddling a canoe, or walking the publicly-accessible shorelines.
The distribu on of smallmouth bass is projected to expand considerably in the coming decades due to warming
stream temperatures. Although some waters higher in the watershed are projected to warm enough to meet the habitat needs of bass, most of these streams are not large enough to support adult fish and will likely be limited to serving as nursery waters.
A modest amount of stream restora on has occurred in the region with the bulk of it in the Upper Grant River
watershed, which includes Borah Creek and Rogers Branch. The Upper Grant and the Li le Pla e rivers have the most publicly-accessible trout streams in the region. The Galena River system has the most publicly-accessible bass waters with over 500 acres of narrow easements spread over miles of streams and rivers.
Of the eight planning regions, the Pla e has the least amount of Department-owned lands along trout and bass
waters. Although the federal government holds over 12,000 acres along the Mississippi River in the region, there are no State Fishery Areas here and very li le land has been protected through the state streambank protec on program.

Dri less Area Streams │ Page 32
Pla e River Region Report Card
Watersheds
Galen
a River
Lile P
lae R
iver
Low
er G
rant R
iver
Mid
dle G
rant R
iver
Pla
e Rive
r
Sny M
agill Creek - M
ississipp
i R
Sinn
isawa R
iver - M
ississipp
i R
Sou
th Fo
rk Ap
ple R
iver
Up
pe
r Gran
t River
Brook Trout
Stream Health and Habitat Quality
Natural Habitat Poten al F F F F
Land Use Stress F F F F
Sport Fishery Performance
Stock (5" up to 8") F F F F
Quality (8" up to 12") F F F F
Memorable (12" +) F F F F
Projected resilience to climate change D D C D C D
Brown Trout
Stream Health and Habitat Quality
Natural Habitat Poten al F A B A
Land Use Stress F F D F
Sport Fishery Performance
Stock (6" up to 10") F F F B
Quality (10" up to 15") F F D A
Memorable (15" +) F F F A
Projected resilience to climate change D D D D A D C B
Small‐ mouth
Bass
Stream Health and Habitat Quality
Natural Habitat Poten al B B B C B B C
Land Use Stress A A A A A A B
Sport Fishery Performance
Stock (8" up to 14") A F A A A
Memorable (14" +) B F F C A
Projected gain from climate change A A A A A A B C A
Trout Stream Habitat
Thermal resilience of trout streams D D C B
Total miles of stream restora on B C F A
Recrea on
Angling opportuni es
Percent of trout stream miles with public access
A
D D
B
Percent of smallmouth bass stream miles with public access
A B F C D
F
D
Supply rela ve to demand
Miles of publicly-accessible trout and SMB streams per 100K people within a 1-hour drive
A B F D D F D F A
Grades show each watershed’s place in the distribu on of all Dri less Area watersheds. An A means the value is in the upper quar-
le (75%-100%) or upper quin le (80%-100%) of the distribu on
An F means the value is zero or is in the lowest quin le (0-20%) of the distribu on.
Blank cells indicate “not applicable.

Execu ve Summary │ Page 33
Pla e River Region Trout Maps
Execu ve Summary │ Page 34
Pla e River Region Public Access Maps

Execu ve Summary │ Page 35
Pecatonica River Region Highlights
This Pecatonica River Region is in close proximity to Madison and the streams with public access tend to receive heavy fishing pressure and use.
The DNR proper es are generally narrow and small. This, along with their loca ons and soil types, make them ill
suited to accommodate most other recrea onal uses. The Pecatonica River Region lacks good quality natural habitat for brook trout, and coupled with high levels of
land-use stress, provides unfavorable condi ons for the occurrence of many brook trout. Brook trout occurrence is only predicted to occur in the Sugar River watershed.
Models project that by the mid-century climate change will lead to the ex rpa on of brook trout in the Pecatoni-
ca River Region. Brown trout natural habitat poten al is much be er than for brook trout. The northern por on of the region
has high quality natural habitat. Land use stress is more varied but s ll high in most areas. The most produc ve brown trout popula ons are in the northeastern por on of the region. Smallmouth bass natural habitat poten al is high, especially in the lower reaches of the Pecatonica River and the
Sugar River. Land use stress varies across the region, with higher stress occurring in the northern and western por ons of the region.
The highest densi es of smallmouth bass occur in the large, warm rivers and the be er waters also are ed to
large wintering habitat, such as the Pecatonica and Sugar Rivers. The distribu on of smallmouth bass is projected to expand due to climate change.

Dri less Area Streams │ Page 36
Pecatonica River Region Highlights
Watersheds
Am
es Bran
ch - P
ecaton
ica River
Blu
e Mo
un
ds B
ranch
Do
dge B
ranch
East Bran
ch P
ecaton
ica River
Head
waters P
ecaton
ica River
Head
waters Su
gar River
Ho
ney C
reek - P
ecaton
ica River
Lile Su
gar River
Min
eral Po
int B
ranch
Rid
geway B
ranch
- E B P
ecaton
ica
Spaff
ord
Cree
k - Pecato
nica R
iver
Story C
reek-Su
gar River
West B
ranch
Sugar R
iver
Yellow
ston
e Rive
r
Brook Trout
Stream Health and Habitat Quality
Natural Habitat Poten al F F F F F C F F F F F C D F
Land Use Stress F F F F D F F F F D F F F F
Sport Fishery Performance
Stock (5" up to 8") F F F F F F F F C F F C D F
Quality (8" up to 12") F F F F F F F F D F F C C F
Memorable (12" +) F F F F F F F F B F F D F F
Projected resilience to climate change D D D D D D D D D D D D
Brown Trout
Stream Health and Habitat Quality
Natural Habitat Poten al B A A B D A D B A A D D A A
Land Use Stress F B F D F F D D F B F D D D
Sport Fishery Performance
Stock (6" up to 10") F B C D D C D C C D D A A C
Quality (10" up to 15") F B D C C B D D B C F A B D
Memorable (15" +) F B F F F A F F F F F B B F
Projected resilience to climate change D C D B D D C B C C D C C D
Small‐ mouth
Bass
Stream Health and Habitat Quality
Natural Habitat Poten al B D F B C D A C C C B C D C
Land Use Stress B F B D C C F F D F B D D B
Sport Fishery Performance
Stock (8" up to 14") F F F F B F D D A F F A B
Memorable (14" +) F F F F F F F D A F F A F
Projected gain from climate change A B A A A A A B A B A D B A
Trout Stream Habitat
Thermal stability of trout streams B D D C C D A D C D D C D A
Total miles of trout stream restora on F A B F F F F F F F D F A D
Recrea on
Angling opportuni es
Percent of trout stream miles with public access
B C A D D C F C D B D A B A
Percent of smallmouth bass stream miles with public access
C F A F D F D A F D F B F F
Supply rela ve to demand
Miles of publicly-accessible trout and SMB streams per 100K people within a 1-hour drive
C C C D D D D C D C D C B C
Grades show each watershed’s place in the distribu on of all Dri less Area watersheds. An A means the value is in the upper quar-
le (75%-100%) or upper quin le (80%-100%) of the distribu on
An F means the value is zero or is in the lowest quin le (0-20%) of the distribu on.
Blank cells indicate “not applicable.

Execu ve Summary │ Page 37
Pecatonica River Region Trout Maps

Execu ve Summary │ Page 38
Pecatonica River Region Public Access Maps