Dreyfus Variable Investment Fund, Appreciation Portfolio as an indication of trading ... We present...
40
Dreyfus Variable Investment Fund, Appreciation Portfolio ANNUAL REPORT December 31, 2011
-
Upload
trinhtuyen -
Category
Documents
-
view
217 -
download
1
Transcript of Dreyfus Variable Investment Fund, Appreciation Portfolio as an indication of trading ... We present...
Dreyfus VariableInvestment Fund,Appreciation Portfolio
ANNUAL REPORT December 31, 2011

The views expressed in this report reflect those of the portfoliomanager only through the end of the period covered and do notnecessarily represent the views of Dreyfus or any other person inthe Dreyfus organization. Any such views are subject to change atany time based upon market or other conditions and Dreyfus dis-claims any responsibility to update such views. These views may notbe relied on as investment advice and, because investment decisionsfor a Dreyfus fund are based on numerous factors, may not be reliedon as an indication of trading intent on behalf of any Dreyfus fund.
Not FDIC-Insured • Not Bank-Guaranteed • May Lose Value

Contents
T H E F U N D
2 A Letter from the Chairman and CEO
3 Discussion of Fund Performance
6 Fund Performance
8 Understanding Your Fund’s Expenses
8 Comparing Your Fund’s Expenses With Those of Other Funds
9 Statement of Investments
12 Statement of Assets and Liabilities
13 Statement of Operations
14 Statement of Changes in Net Assets
16 Financial Highlights
18 Notes to Financial Statements
29 Report of Independent Registered Public Accounting Firm
30 Important Tax Information
31 Board Members Information
33 Officers of the Fund
F O R M O R E I N F O R M AT I O N
Back Cover
2
A L E T T E R F R O M T H E C H A I R M A N A N D C EO
Dear Shareholder:
We present to you this annual report for Dreyfus Variable InvestmentFund, Appreciation Portfolio, covering the 12-month period fromJanuary 1, 2011, through December 31, 2011. For information abouthow the fund performed during the reporting period, as well as generalmarket perspectives, we provide a Discussion of Fund Performance onthe pages that follow.
The generally mild returns produced by the U.S. stock market in 2011belie the pronounced volatility affecting equities over much of theyear. Day-to-day market movements were often tumultuous, drivenby macroeconomic developments ranging from catastrophic naturaldisasters in Japan to an unprecedented downgrade of long-term U.S.debt securities and the resurgence of a sovereign debt crisis in Europe.Still, U.S. corporations achieved record-setting profits, on average, evenas market valuations dropped below historical norms. A fundamentals-based investment approach proved relatively ineffective in a marketfueled mainly by emotion, causing most active portfolio managers tolag market averages.
We are hopeful that equity investors will adopt a more rational perspec-tive in 2012. Our economic forecast calls for a mild acceleration of theU.S. recovery as the domestic banking system regains strength, creditconditions loosen and housing markets begin a long-awaited convales-cence. Of course, we encourage you to talk with your financial adviserto help ensure that your investment objectives are properly aligned withyour risk tolerance in pursuing potential market opportunities in 2012.
Thank you for your continued confidence and support.
Sincerely,
Jonathan R. BaumChairman and Chief Executive OfficerThe Dreyfus CorporationJanuary 17, 2012
Dreyfus Variable Investment Fund,Appreciation Portfolio The Fund
D I S C U S S I O N O F F U N D P E R F O R M A N C E
For the period of January 1, 2011, through December 31, 2011, as provided byFayez Sarofim, Portfolio Manager of Fayez Sarofim & Co., Sub-Investment Adviser
Fund and Market Performance Overview
For the 12-month period ended December 31, 2011, Dreyfus VariableInvestment Fund, Appreciation Portfolio’s Initial shares produced atotal return of 9.01%, and its Service shares produced a total return of8.74%.1 In comparison, the total return of the fund’s benchmark, theStandard & Poor’s 500 Composite Stock Price Index (“S&P 500Index”), was 2.09% for the same period.2
Macroeconomic disappointments throughout the world weighed onequity markets during much of 2011, but rallies in the first and fourthquarters enabled the S&P 500 Index to end the year in positive territory.The fund produced higher returns than its benchmark as risk-averseinvestors turned to the kinds of large, multinational companies that thefund favors.
The Fund’s Investment Approach
The fund seeks long-term capital growth consistent with the preserva-tion of capital. Its secondary goal is current income. To pursue thesegoals, the fund normally invests at least 80% of its assets in commonstocks. The fund focuses on blue-chip companies with total marketcapitalizations of more than $5 billion at the time of purchase, includingmultinational companies. These are established companies that havedemonstrated sustained patterns of profitability, strong balance sheets, anexpanding global presence and the potential to achieve predictable,above-average earnings growth.
In choosing stocks, the fund first identifies economic sectors it believeswill expand over the next three to five years or longer. Using fundamen-tal analysis, the fund then seeks companies within these sectors that haveproven track records and dominant positions in their industries. Thefund employs a “buy-and-hold” investment strategy, which generally hasresulted in an annual portfolio turnover of below 15%. A low portfolioturnover rate helps reduce the fund’s trading costs and minimizes taxliability by limiting the distribution of capital gains.3
T h e F u n d 3
Global Economic Developments Roiled Equity Markets
Improvements in U.S. economic data supported stock prices at thestart of 2011, but political unrest in the Middle East and catastrophicnatural and nuclear disasters in Japan soon interrupted the rally.Nonetheless, investors continued to look forward to better businessconditions, and stocks rebounded from these unexpected shocks bythe end of the first quarter.
Investors’ hopes for a more robust recovery were dashed in late April,when Greece appeared headed for default on its sovereign debt and thecrisis spread to other European nations. In addition, U.S. economicdata proved more disappointing than expected, and investors reactedcautiously to a contentious political debate regarding U.S. governmentspending and borrowing. Consequently, newly risk-averse investorsmoved away from more speculative investments and toward traditionallydefensive industries and companies. Market declines were particularlysevere in August and September, after a major credit-rating agencydowngraded its assessment of long-term U.S. government debt. Incontrast, the market rebounded from October through December whenU.S. economic data improved and European policymakers made someprogress in addressing the region’s problems.
Multinational Leaders Buoyed Fund Performance
In the turbulent market environment, skittish investors flocked to blue-chip companies with generous dividend yields, a presence in globalmarkets and strong balance sheets. The fund particularly benefited fromunderweighted exposure to the financials sector, which helped it avoidweakness among banks affected by Europe’s debt crisis and a stricterU.S. regulatory environment. In the consumer staples sector, tobaccoproducer Philip Morris International encountered rising global demand,while Altria Group and Coca-Cola benefited from renewed investorinterest in traditionally defensive companies with substantially positivecash flows. Industry giants Apple and International Business Machinesfared well in the information technology sector. Other top performersincluded casual dining chain McDonald’s and large integrated energycompanies Exxon Mobil and Chevron.
The materials sector fared less well during the reporting period, asmetal producers Freeport-McMoRan Copper & Gold and Rio Tinto
4
D I S C U S S I O N O F F U N D P E R F O R M A N C E (continued)

suffered amid falling industrial commodity prices. The fund held noexposure to the utilities and telecommunications services sectors, whichgenerally beat market averages despite growth characteristics that didnot meet our investment criteria. Banking giant JPMorgan Chase &Co. was hurt by industry-wide concerns stemming from Europe’s debtcrisis, and luxury goods purveyor Christian Dior suffered despite strongbusiness fundamentals due to worries over the European financial crisisand potential contagion.
Investors Remain Focused on High-Quality Companies
We expect the global economic rebound to persist fitfully amid sig-nificant headwinds, leading us to conclude that investors are likely tocontinue to favor large, multinational companies with solid businessfundamentals and strong income characteristics. Indeed, corporate earn-ings in 2011 generally remained robust despite the economic downturn,while equity valuations have become more attractive. When adjusting tothe changing market environment, we identified a number of newopportunities among multinational companies with healthy balancesheets, ample cash reserves and a presence in growing markets, and weeliminated some older positions to make room for these opportunities.
January 17, 2012
Equity funds are subject generally to market, market sector, market liquidity, issuer, and investmentstyle risks, among other factors, to varying degrees, all of which are more fully described in thefund’s prospectus.
Fund shares are only available as a funding vehicle under variable life insurance policies or variableannuity contracts issued by insurance companies. Individuals may not purchase shares of the funddirectly. A variable annuity is an insurance contract issued by an insurance company that enablesinvestors to accumulate assets on a tax-deferred basis for retirement or other long-term goals.
1 Total return includes reinvestment of dividends and any capital gains paid. Past performance is noguarantee of future results. Share price and investment return fluctuate such that upon redemptionfund shares may be worth more or less than their original cost. The fund’s performance does notreflect the deduction of additional charges and expenses imposed in connection with investing invariable insurance contracts, which will reduce returns.
2 SOURCE: LIPPER INC. — Reflects monthly reinvestment of dividends and, whereapplicable, capital gain distributions. The Standard & Poor’s 500 Composite Stock Price Index isa widely accepted, unmanaged index of U.S. stock market performance. Investors cannot investdirectly in an index.
3 Achieving tax efficiency is not a part of the fund’s investment objective, and there can be noguarantee that the fund will achieve any particular level of taxable distributions in future years. Inperiods when the manager has to sell significant amounts of securities (e.g., during periods ofsignificant net redemptions or changes in index components) funds can be expected to be less taxefficient than during periods of more stable market conditions and asset flows.
T h e F u n d 5
7,500
9,500
11,500
13,500
15,500
Do
llars
Years Ended 12/31
01 02 03 04 05 06 07 08 09 10 11
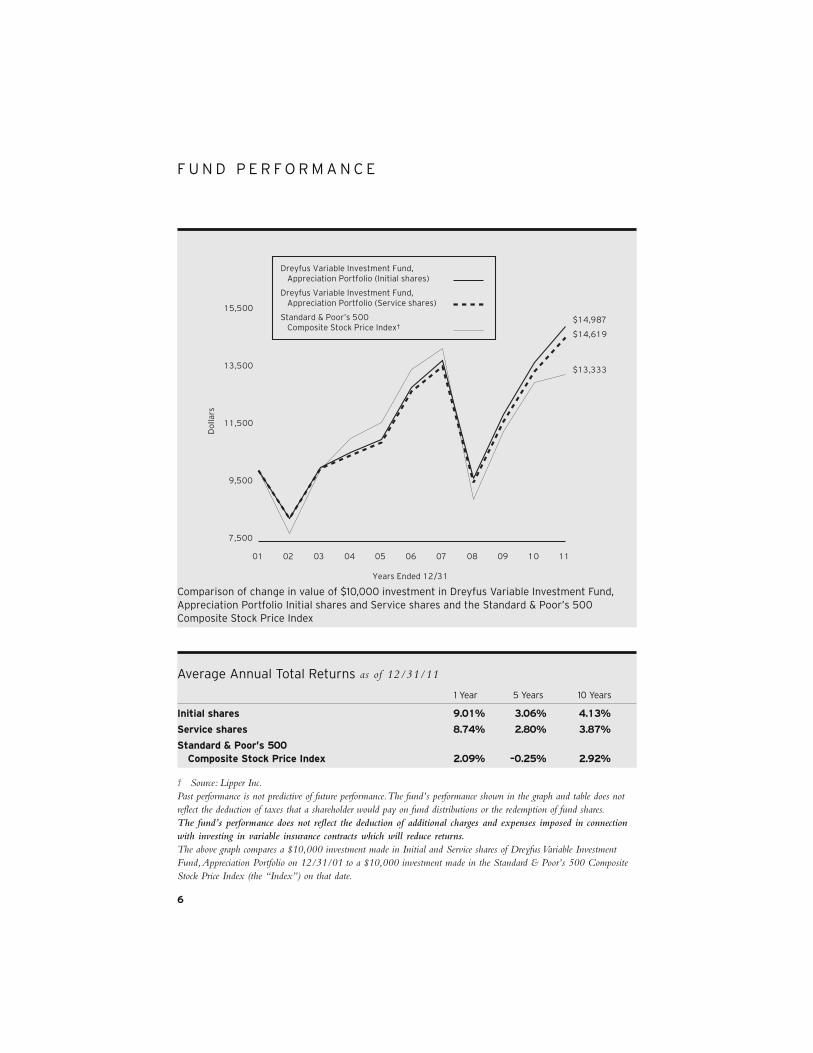
Dreyfus Variable Investment Fund, Appreciation Portfolio (Initial shares)
Dreyfus Variable Investment Fund, Appreciation Portfolio (Service shares)
Standard & Poor’s 500 Composite Stock Price Index†
$14,987
$14,619
$13,333
6
F U N D P E R F O R M A N C E
Comparison of change in value of $10,000 investment in Dreyfus Variable Investment Fund,Appreciation Portfolio Initial shares and Service shares and the Standard & Poor’s 500Composite Stock Price Index
Average Annual Total Returns as of 12/31/11
1 Year 5 Years 10 Years
Initial shares 9.01% 3.06% 4.13%
Service shares 8.74% 2.80% 3.87%
Standard & Poor’s 500 Composite Stock Price Index 2.09% –0.25% 2.92%
† Source: Lipper Inc.Past performance is not predictive of future performance. The fund’s performance shown in the graph and table does notreflect the deduction of taxes that a shareholder would pay on fund distributions or the redemption of fund shares.The fund’s performance does not reflect the deduction of additional charges and expenses imposed in connectionwith investing in variable insurance contracts which will reduce returns.The above graph compares a $10,000 investment made in Initial and Service shares of Dreyfus Variable InvestmentFund, Appreciation Portfolio on 12/31/01 to a $10,000 investment made in the Standard & Poor’s 500 CompositeStock Price Index (the “Index”) on that date.

T h e F u n d 7
The fund’s Initial shares are not subject to a Rule 12b-1 fee. The fund’s Service shares are subject to a 0.25% annualRule 12b-1 fee. All dividends and capital gain distributions are reinvested.The fund’s performance shown in the line graph above takes into account all applicable fund fees and expenses. TheIndex is a widely accepted, unmanaged index of U.S. stock market performance. Unlike a mutual fund, the Index is notsubject to charges, fees and other expenses. Investors cannot invest directly in any index. Further information relating tofund performance, including expense reimbursements, if applicable, is contained in the Financial Highlights section of theprospectus and elsewhere in this report.
8
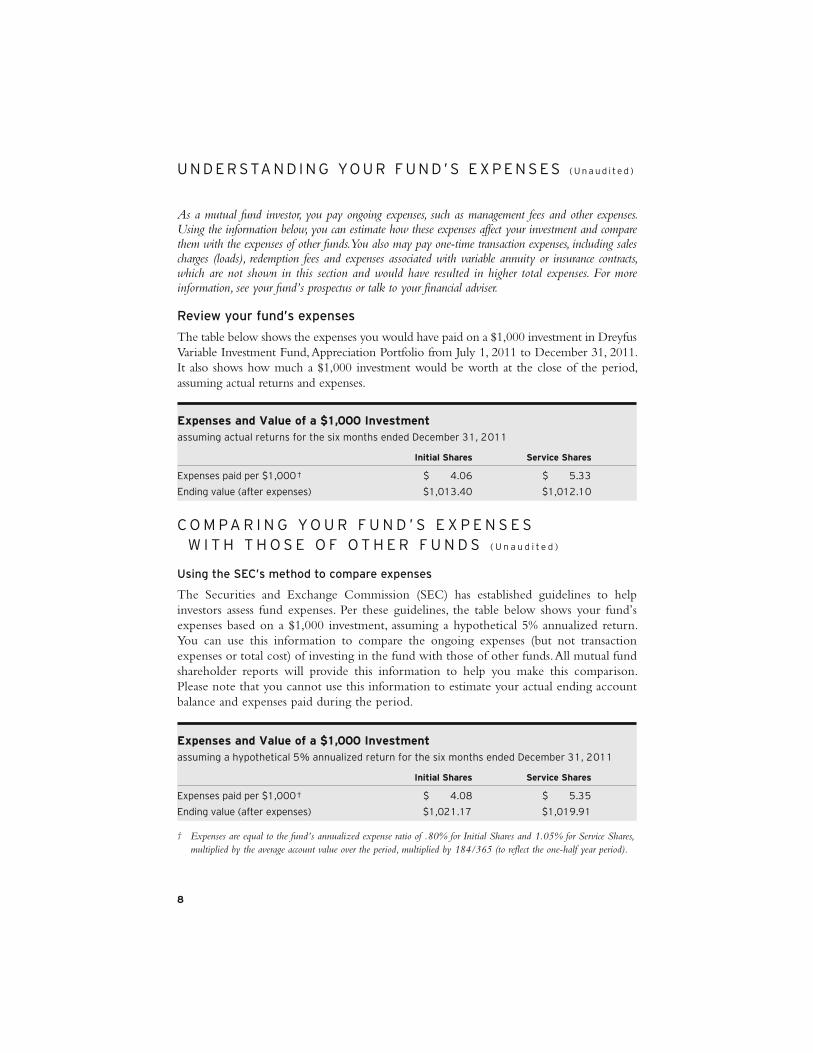
Expenses and Value of a $1,000 Investmentassuming actual returns for the six months ended December 31, 2011
Initial Shares Service Shares
Expenses paid per $1,000† $ 4.06 $ 5.33
Ending value (after expenses) $1,013.40 $1,012.10
U N D E R S TA N D I N G YO U R F U N D ’ S E X P E N S E S ( U n a u d i t e d )
As a mutual fund investor, you pay ongoing expenses, such as management fees and other expenses.Using the information below, you can estimate how these expenses affect your investment and comparethem with the expenses of other funds. You also may pay one-time transaction expenses, including salescharges (loads), redemption fees and expenses associated with variable annuity or insurance contracts,which are not shown in this section and would have resulted in higher total expenses. For moreinformation, see your fund’s prospectus or talk to your financial adviser.
Review your fund’s expenses
The table below shows the expenses you would have paid on a $1,000 investment in DreyfusVariable Investment Fund, Appreciation Portfolio from July 1, 2011 to December 31, 2011.It also shows how much a $1,000 investment would be worth at the close of the period,assuming actual returns and expenses.
Expenses and Value of a $1,000 Investmentassuming a hypothetical 5% annualized return for the six months ended December 31, 2011
Initial Shares Service Shares
Expenses paid per $1,000† $ 4.08 $ 5.35
Ending value (after expenses) $1,021.17 $1,019.91
C O M P A R I N G Y O U R F U N D ’ S E X P E N S E S W I T H T H O S E O F O T H E R F U N D S ( U n a u d i t e d )
Using the SEC’s method to compare expenses
The Securities and Exchange Commission (SEC) has established guidelines to helpinvestors assess fund expenses. Per these guidelines, the table below shows your fund’sexpenses based on a $1,000 investment, assuming a hypothetical 5% annualized return.You can use this information to compare the ongoing expenses (but not transactionexpenses or total cost) of investing in the fund with those of other funds. All mutual fundshareholder reports will provide this information to help you make this comparison.Please note that you cannot use this information to estimate your actual ending accountbalance and expenses paid during the period.
† Expenses are equal to the fund’s annualized expense ratio of .80% for Initial Shares and 1.05% for Service Shares,multiplied by the average account value over the period, multiplied by 184/365 (to reflect the one-half year period).
T h e F u n d 9
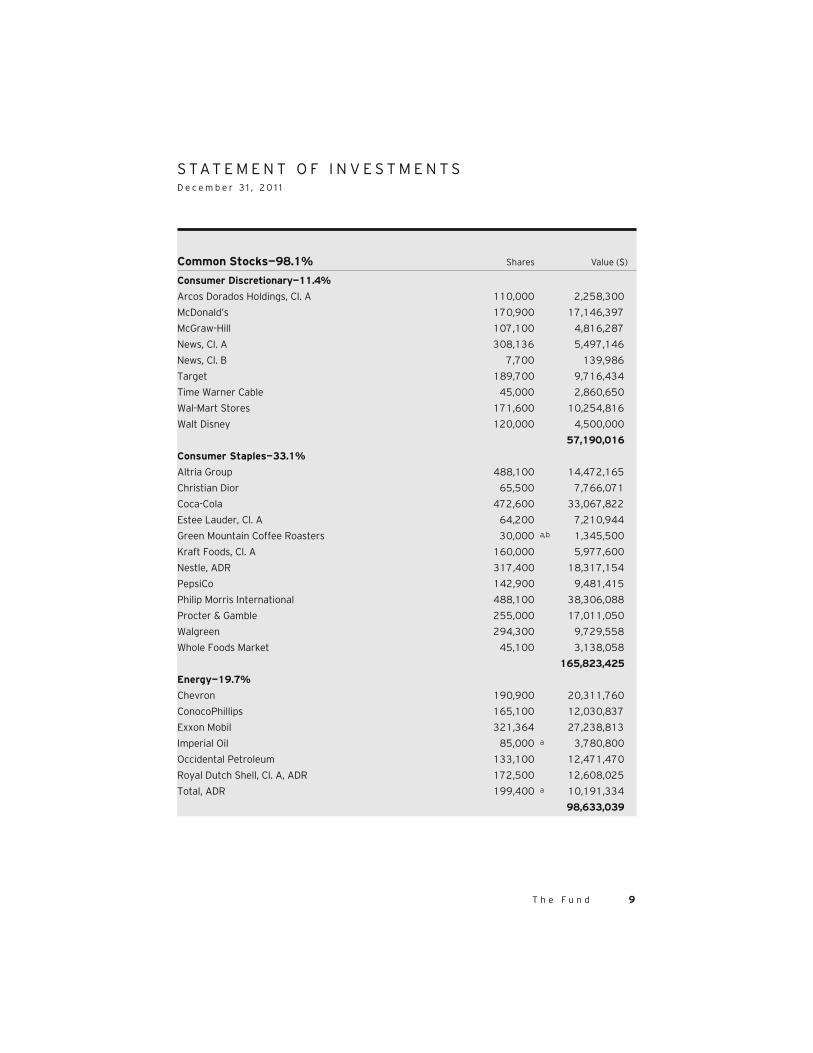
Common Stocks—98.1% Shares Value ($)
Consumer Discretionary—11.4%
Arcos Dorados Holdings, Cl. A 110,000 2,258,300
McDonald’s 170,900 17,146,397
McGraw-Hill 107,100 4,816,287
News, Cl. A 308,136 5,497,146
News, Cl. B 7,700 139,986
Target 189,700 9,716,434
Time Warner Cable 45,000 2,860,650
Wal-Mart Stores 171,600 10,254,816
Walt Disney 120,000 4,500,000
57,190,016
Consumer Staples—33.1%
Altria Group 488,100 14,472,165
Christian Dior 65,500 7,766,071
Coca-Cola 472,600 33,067,822
Estee Lauder, Cl. A 64,200 7,210,944
Green Mountain Coffee Roasters 30,000 a,b 1,345,500
Kraft Foods, Cl. A 160,000 5,977,600
Nestle, ADR 317,400 18,317,154
PepsiCo 142,900 9,481,415
Philip Morris International 488,100 38,306,088
Procter & Gamble 255,000 17,011,050
Walgreen 294,300 9,729,558
Whole Foods Market 45,100 3,138,058
165,823,425
Energy—19.7%
Chevron 190,900 20,311,760
ConocoPhillips 165,100 12,030,837
Exxon Mobil 321,364 27,238,813
Imperial Oil 85,000 a 3,780,800
Occidental Petroleum 133,100 12,471,470
Royal Dutch Shell, Cl. A, ADR 172,500 12,608,025
Total, ADR 199,400 a 10,191,334
98,633,039
S TAT E M E N T O F I N V E S T M E N T SD e c e m b e r 3 1 , 2 0 1 1
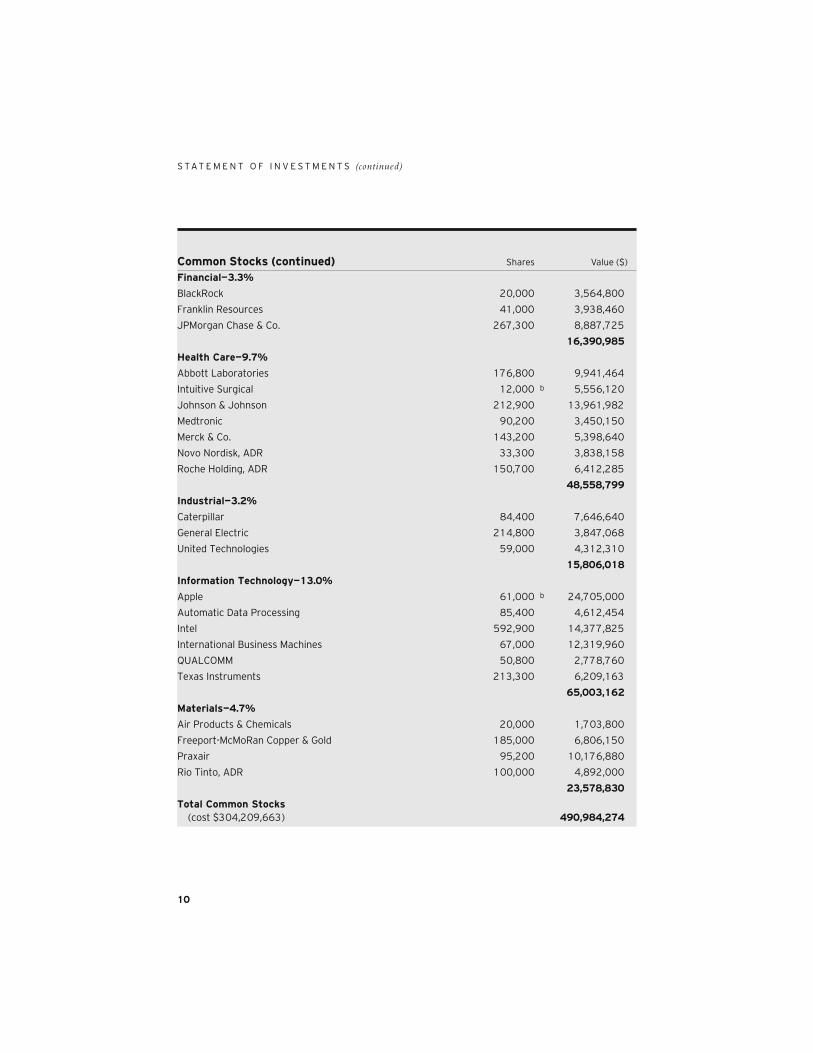
S TAT E M E N T O F I N V E S T M E N T S (continued)
10
Common Stocks (continued) Shares Value ($)
Financial—3.3%
BlackRock 20,000 3,564,800
Franklin Resources 41,000 3,938,460
JPMorgan Chase & Co. 267,300 8,887,725
16,390,985
Health Care—9.7%
Abbott Laboratories 176,800 9,941,464
Intuitive Surgical 12,000 b 5,556,120
Johnson & Johnson 212,900 13,961,982
Medtronic 90,200 3,450,150
Merck & Co. 143,200 5,398,640
Novo Nordisk, ADR 33,300 3,838,158
Roche Holding, ADR 150,700 6,412,285
48,558,799
Industrial—3.2%
Caterpillar 84,400 7,646,640
General Electric 214,800 3,847,068
United Technologies 59,000 4,312,310
15,806,018
Information Technology—13.0%
Apple 61,000 b 24,705,000
Automatic Data Processing 85,400 4,612,454
Intel 592,900 14,377,825
International Business Machines 67,000 12,319,960
QUALCOMM 50,800 2,778,760
Texas Instruments 213,300 6,209,163
65,003,162
Materials—4.7%
Air Products & Chemicals 20,000 1,703,800
Freeport-McMoRan Copper & Gold 185,000 6,806,150
Praxair 95,200 10,176,880
Rio Tinto, ADR 100,000 4,892,000
23,578,830
Total Common Stocks (cost $304,209,663) 490,984,274
T h e F u n d 11
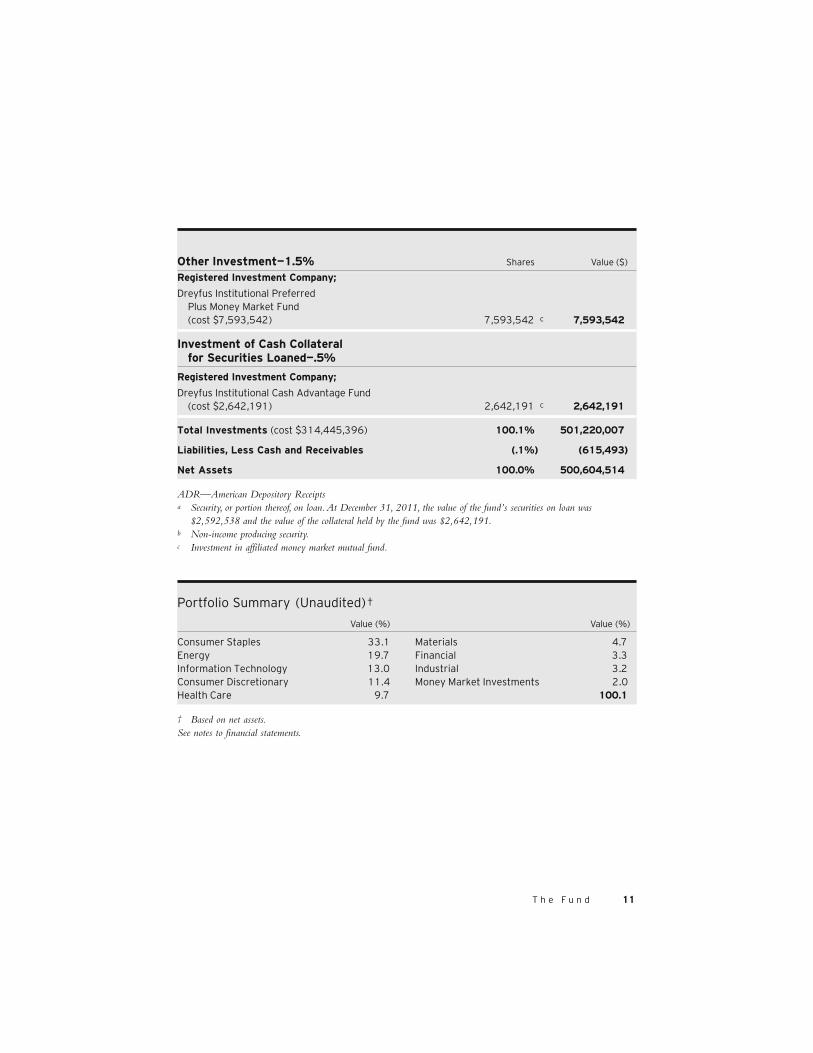
Other Investment—1.5% Shares Value ($)
Registered Investment Company;
Dreyfus Institutional Preferred Plus Money Market Fund (cost $7,593,542) 7,593,542 c 7,593,542
Investment of Cash Collateral for Securities Loaned—.5%
Registered Investment Company;
Dreyfus Institutional Cash Advantage Fund (cost $2,642,191) 2,642,191 c 2,642,191
Total Investments (cost $314,445,396) 100.1% 501,220,007
Liabilities, Less Cash and Receivables (.1%) (615,493)
Net Assets 100.0% 500,604,514
ADR—American Depository Receiptsa Security, or portion thereof, on loan. At December 31, 2011, the value of the fund’s securities on loan was
$2,592,538 and the value of the collateral held by the fund was $2,642,191.b Non-income producing security.c Investment in affiliated money market mutual fund.
Portfolio Summary (Unaudited)†
Value (%) Value (%)
Consumer Staples 33.1Energy 19.7Information Technology 13.0Consumer Discretionary 11.4Health Care 9.7
Materials 4.7Financial 3.3Industrial 3.2Money Market Investments 2.0 100.1
† Based on net assets.See notes to financial statements.
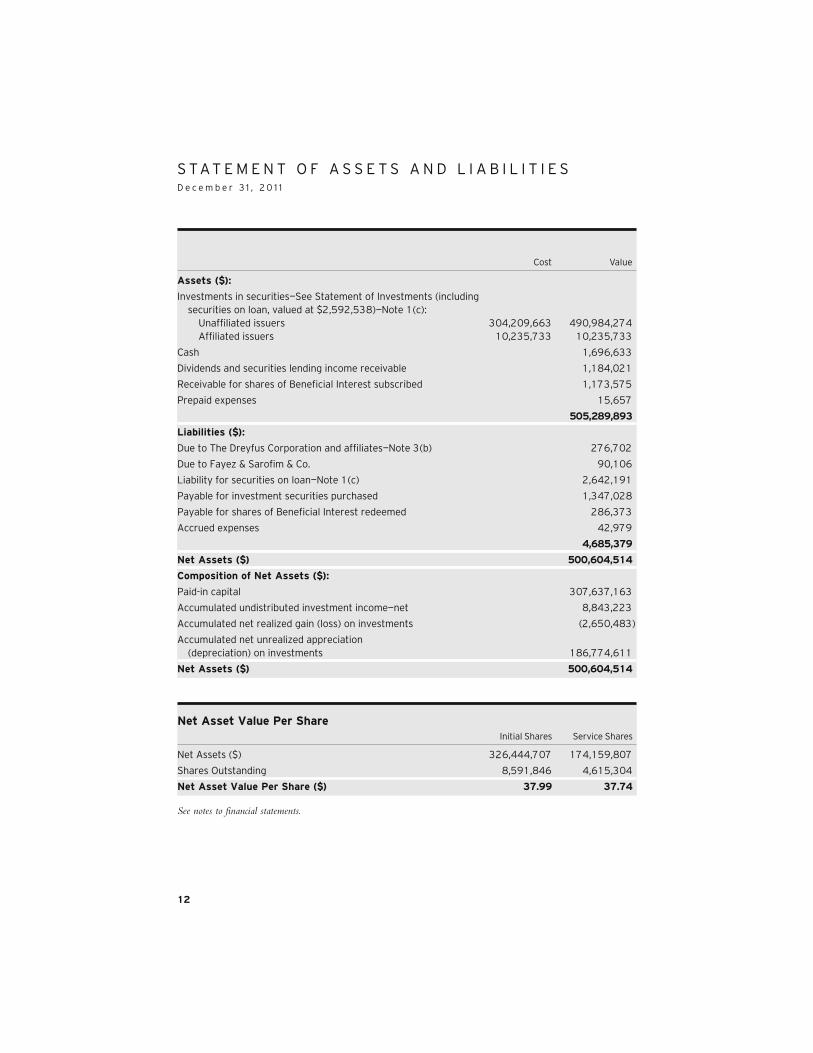
S TAT E M E N T O F A S S E T S A N D L I A B I L I T I E SD e c e m b e r 3 1 , 2 0 1 1
See notes to financial statements.
12
Cost Value
Assets ($):
Investments in securities—See Statement of Investments (including securities on loan, valued at $2,592,538)—Note 1(c): Unaffiliated issuers 304,209,663 490,984,274 Affiliated issuers 10,235,733 10,235,733
Cash 1,696,633
Dividends and securities lending income receivable 1,184,021
Receivable for shares of Beneficial Interest subscribed 1,173,575
Prepaid expenses 15,657
505,289,893
Liabilities ($):
Due to The Dreyfus Corporation and affiliates—Note 3(b) 276,702
Due to Fayez & Sarofim & Co. 90,106
Liability for securities on loan—Note 1(c) 2,642,191
Payable for investment securities purchased 1,347,028
Payable for shares of Beneficial Interest redeemed 286,373
Accrued expenses 42,979
4,685,379
Net Assets ($) 500,604,514
Composition of Net Assets ($):
Paid-in capital 307,637,163
Accumulated undistributed investment income—net 8,843,223
Accumulated net realized gain (loss) on investments (2,650,483)
Accumulated net unrealized appreciation (depreciation) on investments 186,774,611
Net Assets ($) 500,604,514
Net Asset Value Per Share Initial Shares Service Shares
Net Assets ($) 326,444,707 174,159,807
Shares Outstanding 8,591,846 4,615,304
Net Asset Value Per Share ($) 37.99 37.74

Investment Income ($):Income:
Cash dividends (net of $371,041 foreign taxes withheld at source): Unaffiliated issuers 12,846,031 Affiliated issuers 4,870
Income from securities lending—Note 1(c) 76,748
Total Income 12,927,649
Expenses:
Investment advisory fee—Note 3(a) 2,460,928
Sub-investment advisory fee—Note 3(a) 1,005,168
Distribution fees—Note 3(b) 359,542
Professional fees 73,685
Prospectus and shareholders’ reports 64,725
Custodian fees—Note 3(b) 37,863
Trustees’ fees and expenses—Note 3(c) 32,703
Shareholder servicing costs—Note 3(b) 14,644
Loan commitment fees—Note 2 7,494
Miscellaneous 21,679
Total Expenses 4,078,431
Less—reduction in fees due to earnings credits—Note 3(b) (7)
Net Expenses 4,078,424
Investment Income—Net 8,849,225
Realized and Unrealized Gain (Loss) on Investments—Note 4 ($):Net realized gain (loss) on investments (368,068)
Net unrealized appreciation (depreciation) on investments 31,468,680
Net Realized and Unrealized Gain (Loss) on Investments 31,100,612
Net Increase in Net Assets Resulting from Operations 39,949,837
S TAT E M E N T O F O P E R AT I O N SYe a r E n d e d D e c e m b e r 3 1 , 2 0 1 1
T h e F u n d 13
See notes to financial statements.
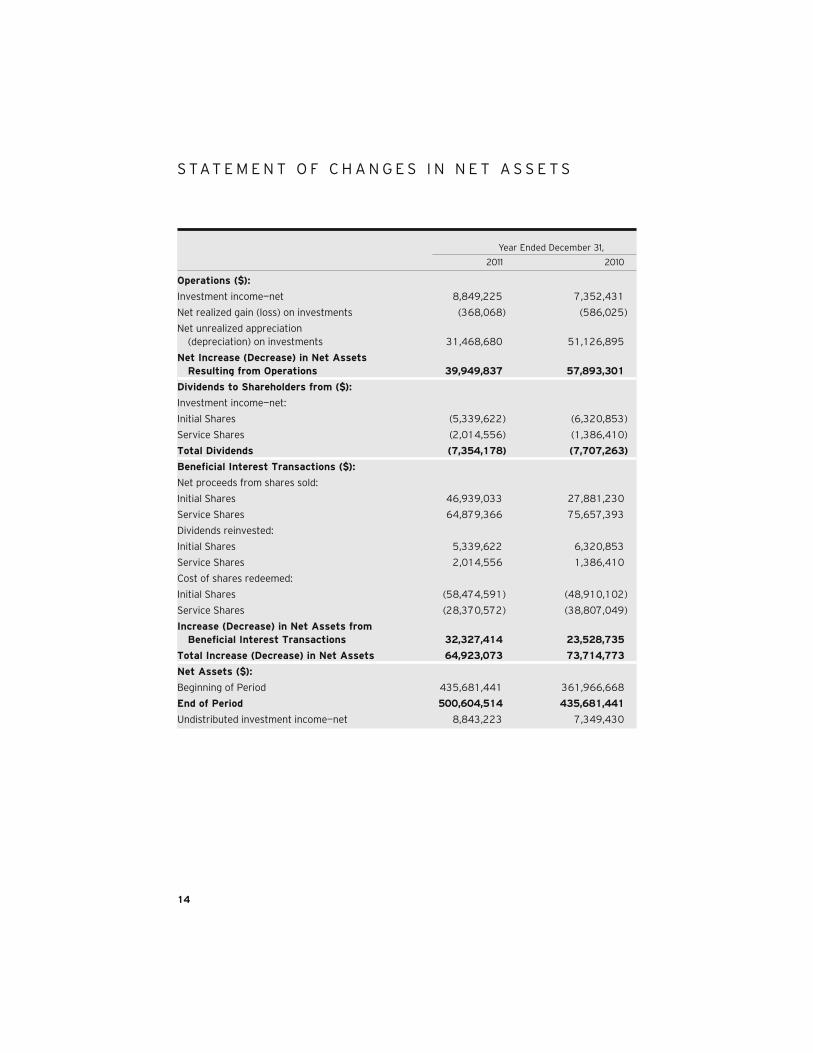
S TAT E M E N T O F C H A N G E S I N N E T A S S E T S
14
Year Ended December 31,
2011 2010
Operations ($):
Investment income—net 8,849,225 7,352,431
Net realized gain (loss) on investments (368,068) (586,025)
Net unrealized appreciation (depreciation) on investments 31,468,680 51,126,895
Net Increase (Decrease) in Net Assets Resulting from Operations 39,949,837 57,893,301
Dividends to Shareholders from ($):
Investment income—net:
Initial Shares (5,339,622) (6,320,853)
Service Shares (2,014,556) (1,386,410)
Total Dividends (7,354,178) (7,707,263)
Beneficial Interest Transactions ($):
Net proceeds from shares sold:
Initial Shares 46,939,033 27,881,230
Service Shares 64,879,366 75,657,393
Dividends reinvested:
Initial Shares 5,339,622 6,320,853
Service Shares 2,014,556 1,386,410
Cost of shares redeemed:
Initial Shares (58,474,591) (48,910,102)
Service Shares (28,370,572) (38,807,049)
Increase (Decrease) in Net Assets from Beneficial Interest Transactions 32,327,414 23,528,735
Total Increase (Decrease) in Net Assets 64,923,073 73,714,773
Net Assets ($):
Beginning of Period 435,681,441 361,966,668
End of Period 500,604,514 435,681,441
Undistributed investment income—net 8,843,223 7,349,430
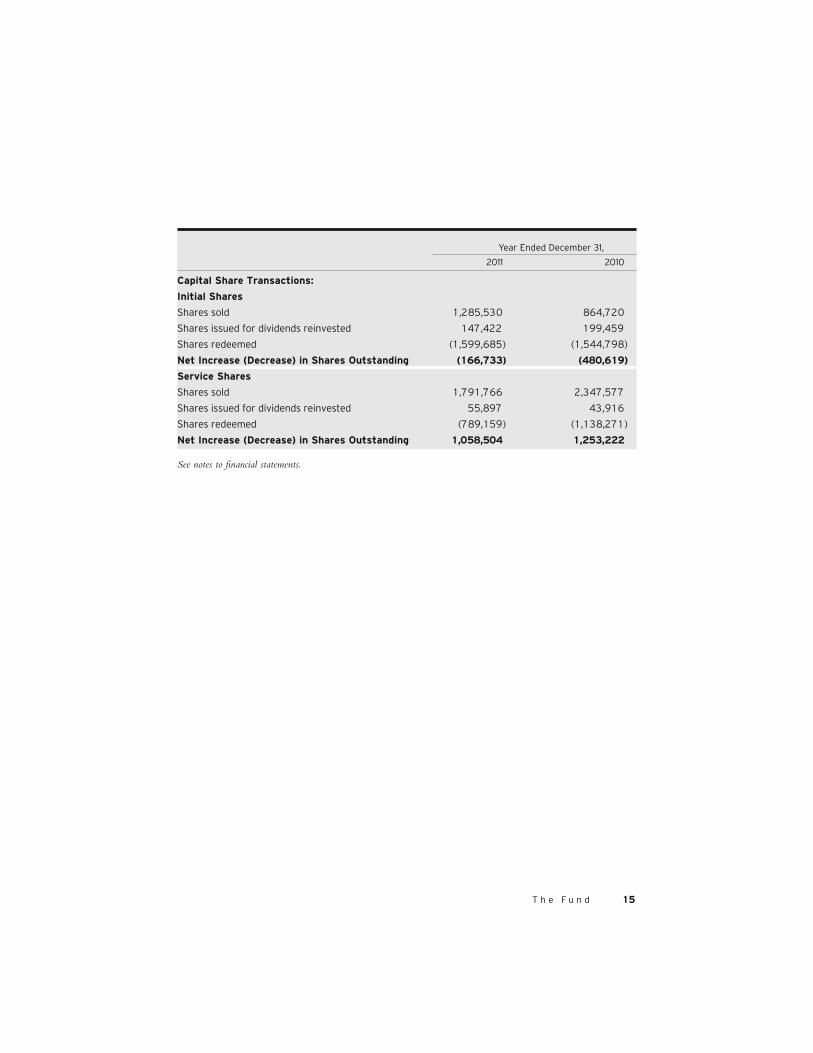
Year Ended December 31,
2011 2010
Capital Share Transactions:
Initial Shares
Shares sold 1,285,530 864,720
Shares issued for dividends reinvested 147,422 199,459
Shares redeemed (1,599,685) (1,544,798)
Net Increase (Decrease) in Shares Outstanding (166,733) (480,619)
Service Shares
Shares sold 1,791,766 2,347,577
Shares issued for dividends reinvested 55,897 43,916
Shares redeemed (789,159) (1,138,271)
Net Increase (Decrease) in Shares Outstanding 1,058,504 1,253,222
See notes to financial statements.
T h e F u n d 15

Year Ended December 31,
Initial Shares 2011 2010 2009 2008 2007
Per Share Data ($):
Net asset value, beginning of period 35.44 31.40 28.88 44.86 42.55
Investment Operations:
Investment income—neta .73 .64 .63 .67 .66
Net realized and unrealized gain (loss) on investments 2.42 4.09 4.95 (13.01) 2.32
Total from Investment Operations 3.15 4.73 5.58 (12.34) 2.98
Distributions:
Dividends from investment income—net (.60) (.69) (.78) (.77) (.67)
Dividends from net realized gain on investments — — (2.28) (2.87) —
Total Distributions (.60) (.69) (3.06) (3.64) (.67)
Net asset value, end of period 37.99 35.44 31.40 28.88 44.86
Total Return (%) 9.01 15.32 22.56 (29.55) 7.14
Ratios/Supplemental Data (%):
Ratio of total expenses to average net assets .80 .81 .80 .81 .80
Ratio of net expenses to average net assets .80 .81 .80 .81 .80
Ratio of net investment income to average net assets 1.99 2.01 2.31 1.82 1.52
Portfolio Turnover Rate 4.24 11.90 1.49 3.41 5.17
Net Assets, end of period ($ x 1,000) 326,445 310,385 290,073 274,782 569,422
16
F I N A N C I A L H I G H L I G H T S
The following tables describe the performance for each share class for the fiscalperiods indicated. All information (except portfolio turnover rate) reflects financialresults for a single fund share. Total return shows how much your investment in thefund would have increased (or decreased) during each period, assuming you hadreinvested all dividends and distributions. The fund’s total returns do not reflectexpenses associated with variable annuity or insurance contracts. These figures havebeen derived from the fund’s financial statements.
a Based on average shares outstanding at each month end.See notes to financial statements.
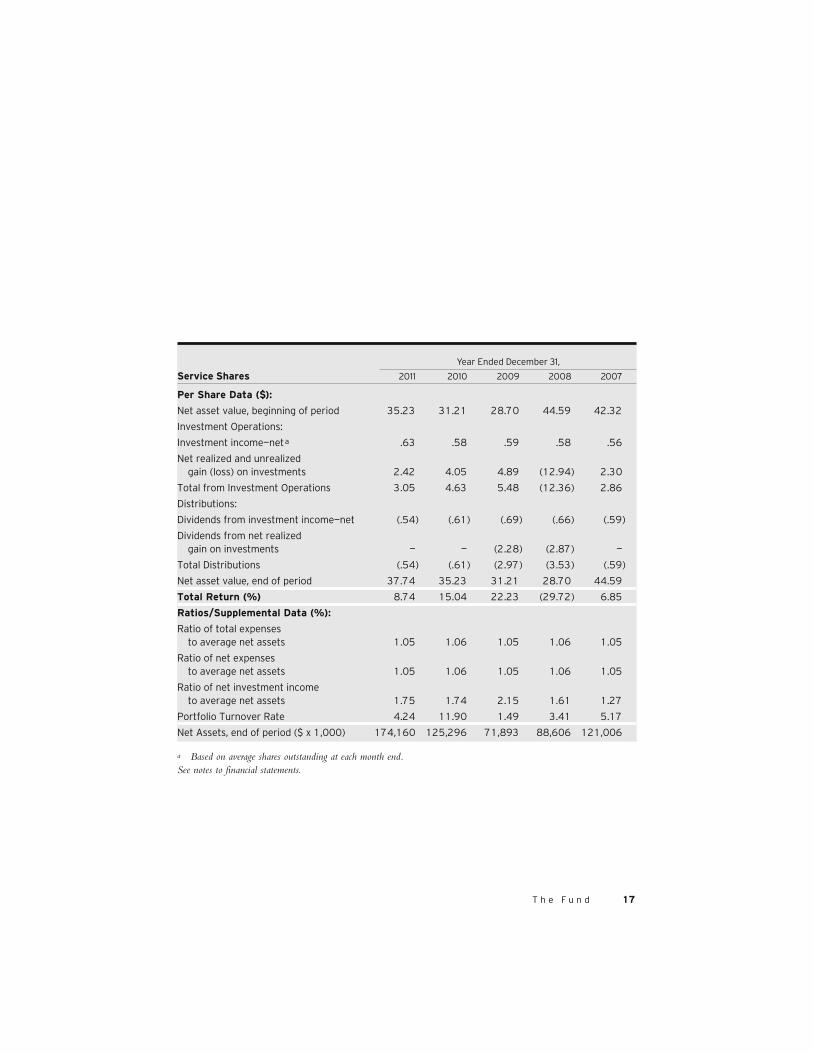
Year Ended December 31,
Service Shares 2011 2010 2009 2008 2007
Per Share Data ($):
Net asset value, beginning of period 35.23 31.21 28.70 44.59 42.32
Investment Operations:
Investment income—neta .63 .58 .59 .58 .56
Net realized and unrealized gain (loss) on investments 2.42 4.05 4.89 (12.94) 2.30
Total from Investment Operations 3.05 4.63 5.48 (12.36) 2.86
Distributions:
Dividends from investment income—net (.54) (.61) (.69) (.66) (.59)
Dividends from net realized gain on investments — — (2.28) (2.87) —
Total Distributions (.54) (.61) (2.97) (3.53) (.59)
Net asset value, end of period 37.74 35.23 31.21 28.70 44.59
Total Return (%) 8.74 15.04 22.23 (29.72) 6.85
Ratios/Supplemental Data (%):
Ratio of total expenses to average net assets 1.05 1.06 1.05 1.06 1.05
Ratio of net expenses to average net assets 1.05 1.06 1.05 1.06 1.05
Ratio of net investment income to average net assets 1.75 1.74 2.15 1.61 1.27
Portfolio Turnover Rate 4.24 11.90 1.49 3.41 5.17
Net Assets, end of period ($ x 1,000) 174,160 125,296 71,893 88,606 121,006
T h e F u n d 17
a Based on average shares outstanding at each month end.See notes to financial statements.
NOTE 1—Significant Accounting Policies:
Dreyfus Variable Investment Fund (the “Company”) is registeredunder the Investment Company Act of 1940, as amended (the “Act”),as an open-end management investment company, operating as a seriescompany currently offering seven series, including the AppreciationPortfolio (the “fund”). The fund is only offered to separate accountsestablished by insurance companies to fund variable annuity contractsand variable life insurance policies. The fund is a diversified series. Thefund’s investment objective is to seek long-term capital growth con-sistent with the preservation of capital. The Dreyfus Corporation (the“Manager” or “Dreyfus”), a wholly-owned subsidiary of The Bank ofNew York Mellon Corporation (“BNY Mellon”), serves as the fund’sinvestment adviser. Fayez Sarofim & Co. (“Sarofim & Co.”) serves asthe fund’s sub-investment adviser.
MBSC Securities Corporation (the “Distributor”), a wholly-ownedsubsidiary of Dreyfus, is the distributor of the fund’s shares, which aresold without a sales charge. The fund is authorized to issue an unlimitednumber of $.001 par value shares of Beneficial Interest in each of thefollowing classes of shares: Initial and Service. Each class of shares hasidentical rights and privileges, except with respect to the distributionplan and the expenses borne by each class, the allocation of certaintransfer agency costs and certain voting rights. Income, expenses (otherthan expenses attributable to a specific class), and realized and unreal-ized gains or losses on investments are allocated to each class of sharesbased on its relative net assets.
The Company accounts separately for the assets, liabilities and opera-tions of each series. Expenses directly attributable to each series arecharged to that series’ operations; expenses which are applicable to allseries are allocated among them on a pro rata basis.
18
N O T E S T O F I N A N C I A L S TAT E M E N T S
The Financial Accounting Standards Board (“FASB”) AccountingStandards Codification (“ASC”) is the exclusive reference of authorita-tive U.S. generally accepted accounting principles (“GAAP”) recognizedby the FASB to be applied by nongovernmental entities. Rules and inter-pretive releases of the Securities and Exchange Commission (“SEC”)under authority of federal laws are also sources of authoritative GAAP forSEC registrants. The fund’s financial statements are prepared in accor-dance with GAAP, which may require the use of management estimatesand assumptions. Actual results could differ from those estimates.
The Company enters into contracts that contain a variety of indem-nifications. The fund’s maximum exposure under these arrangementsis unknown. The fund does not anticipate recognizing any loss relatedto these arrangements.
(a) Portfolio valuation: The fair value of a financial instrument is theamount that would be received to sell an asset or paid to transfer a lia-bility in an orderly transaction between market participants at themeasurement date (i.e. the exit price). GAAP establishes a fair valuehierarchy that prioritizes the inputs of valuation techniques used tomeasure fair value. This hierarchy gives the highest priority to unad-justed quoted prices in active markets for identical assets or liabilities(Level 1 measurements) and the lowest priority to unobservable inputs(Level 3 measurements).
Additionally, GAAP provides guidance on determining whether thevolume and activity in a market has decreased significantly andwhether such a decrease in activity results in transactions that are notorderly. GAAP requires enhanced disclosures around valuation inputsand techniques used during annual and interim periods.
T h e F u n d 19
Various inputs are used in determining the value of the fund’s invest-ments relating to fair value measurements. These inputs are summarizedin the three broad levels listed below:
Level 1—unadjusted quoted prices in active markets for identical investments.
Level 2—other significant observable inputs (including quotedprices for similar investments, interest rates, prepayment speeds,credit risk, etc.).
Level 3—significant unobservable inputs (including the fund’sown assumptions in determining the fair value of investments).
The inputs or methodology used for valuing securities are not necessar-ily an indication of the risk associated with investing in those securities.
Changes in valuation techniques may result in transfers in or out of anassigned level within the disclosure hierarchy. Valuation techniquesused to value the fund’s investments are as follows:
Investments in securities are valued at the last sales price on the securi-ties exchange or national securities market on which such securities areprimarily traded. Securities listed on the National Market System forwhich market quotations are available are valued at the official closingprice or, if there is no official closing price that day, at the last sales price.Securities not listed on an exchange or the national securities market,or securities for which there were no transactions, are valued at theaverage of the most recent bid and asked prices, except for open shortpositions, where the asked price is used for valuation purposes. Bidprice is used when no asked price is available. Registered investmentcompanies that are not traded on an exchange are valued at their netasset value. All preceding securities are categorized within Level 1 of thefair value hierarchy.
Fair valuing of securities may be determined with the assistance of apricing service using calculations based on indices of domestic securi-ties and other appropriate indicators, such as prices of relevant ADRsand futures contracts. Utilizing these techniques may result in transfersbetween Level 1 and Level 2 of the fair value hierarchy.
20
N O T E S T O F I N A N C I A L S TAT E M E N T S (continued)
When market quotations or official closing prices are not readily avail-able, or are determined not to reflect accurately fair value, such as whenthe value of a security has been significantly affected by events after theclose of the exchange or market on which the security is principallytraded (for example, a foreign exchange or market), but before the fundcalculates its net asset value, the fund may value these investments at fairvalue as determined in accordance with the procedures approved by theBoard of Trustees. Certain factors may be considered when fair valu-ing investments such as: fundamental analytical data, the nature andduration of restrictions on disposition, an evaluation of the forces thatinfluence the market in which the securities are purchased and sold,and public trading in similar securities of the issuer or comparableissuers. These securities are either categorized as Level 2 or 3 dependingon the relevant inputs used.
For restricted securities where observable inputs are limited, assump-tions about market activity and risk are used and are categorizedwithin Level 3 of the fair value hierarchy.
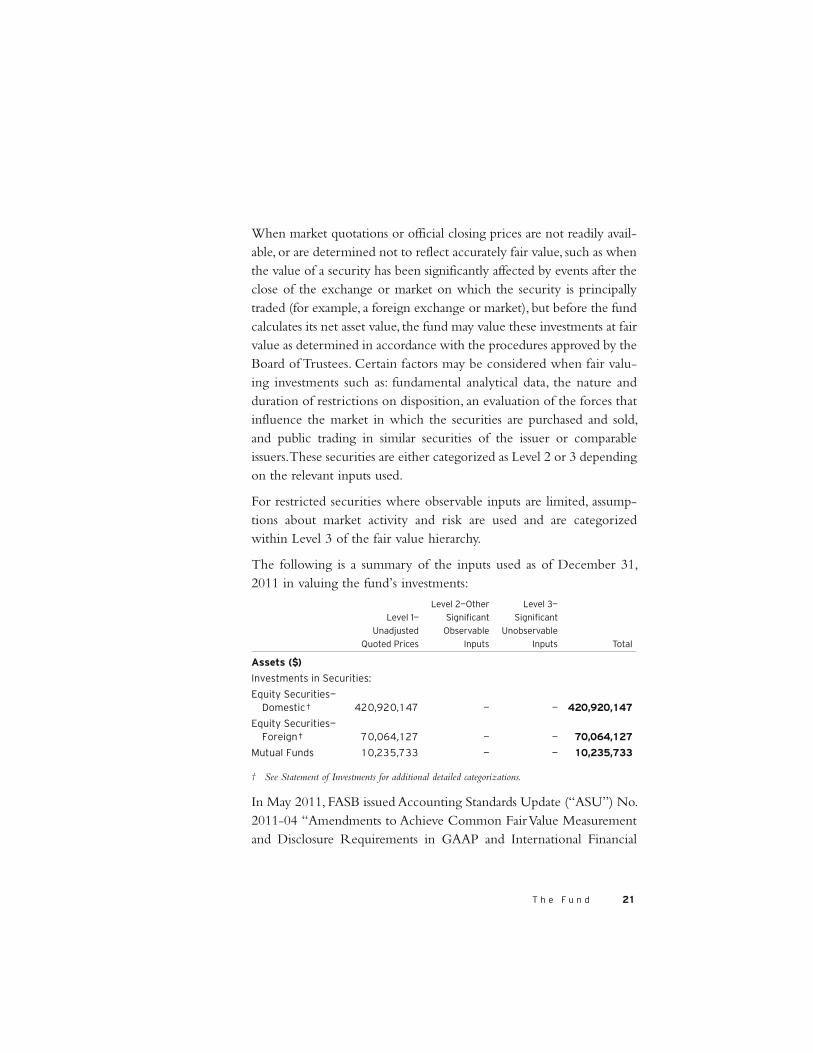
The following is a summary of the inputs used as of December 31,2011 in valuing the fund’s investments:
Level 2—Other Level 3—
Level 1— Significant Significant
Unadjusted Observable Unobservable
Quoted Prices Inputs Inputs Total
Assets ($)
Investments in Securities:
Equity Securities— Domestic† 420,920,147 — — 420,920,147
Equity Securities— Foreign† 70,064,127 — — 70,064,127
Mutual Funds 10,235,733 — — 10,235,733
† See Statement of Investments for additional detailed categorizations.
In May 2011, FASB issued Accounting Standards Update (“ASU”) No.2011-04 “Amendments to Achieve Common Fair Value Measurementand Disclosure Requirements in GAAP and International Financial
T h e F u n d 21

Reporting Standards (“IFRS”)” (“ASU 2011-04”). ASU 2011-04includes common requirements for measurement of and disclosureabout fair value between GAAP and IFRS. ASU 2011-04 will requirereporting entities to disclose the following information for fair valuemeasurements categorized within Level 3 of the fair value hierarchy:quantitative information about the unobservable inputs used in the fairvalue measurement, the valuation processes used by the reporting entityand a narrative description of the sensitivity of the fair value measure-ment to changes in unobservable inputs and the interrelationshipsbetween those unobservable inputs. In addition, ASU 2011-04 willrequire reporting entities to make disclosures about amounts andreasons for all transfers in and out of Level 1 and Level 2 fair valuemeasurements. The new and revised disclosures are effective for interimand annual reporting periods beginning after December 15, 2011. Atthis time, management is evaluating the implications of ASU 2011-04and its impact on the financial statements.
(b) Foreign currency transactions:The fund does not isolate that por-tion of the results of operations resulting from changes in foreignexchange rates on investments from the fluctuations arising from changesin market prices of securities held. Such fluctuations are included withthe net realized and unrealized gain or loss on investments.
Net realized foreign exchange gains or losses arise from sales of foreigncurrencies, currency gains or losses realized on securities transactionsbetween trade and settlement date, and the difference between theamounts of dividends, interest and foreign withholding taxes recordedon the fund’s books and the U.S. dollar equivalent of the amountsactually received or paid. Net unrealized foreign exchange gains andlosses arise from changes in the value of assets and liabilities other thaninvestments resulting from changes in exchange rates. Foreign cur-
22
N O T E S T O F I N A N C I A L S TAT E M E N T S (continued)
rency gains and losses on investments are included with net realizedand unrealized gain or loss on investments.
(c) Securities transactions and investment income: Securities trans-actions are recorded on a trade date basis. Realized gains and lossesfrom securities transactions are recorded on the identified cost basis.Dividend income is recognized on the ex-dividend date and interestincome, including, where applicable, accretion of discount and amor-tization of premium on investments, is recognized on the accrual basis.
Pursuant to a securities lending agreement with The Bank of New YorkMellon, a subsidiary of BNY Mellon and an affiliate of Dreyfus, thefund may lend securities to qualified institutions. It is the fund’s policythat, at origination, all loans are secured by collateral of at least 102% ofthe value of U.S. securities loaned and 105% of the value of foreignsecurities loaned. Collateral equivalent to at least 100% of the marketvalue of securities on loan is maintained at all times. Collateral is eitherin the form of cash, which can be invested in certain money marketmutual funds managed by Dreyfus, U.S. Government and Agency secu-rities or letters of credit. The fund is entitled to receive all income onsecurities loaned, in addition to income earned as a result of the lendingtransaction. Although each security loaned is fully collateralized, thefund bears the risk of delay in recovery of, or loss of rights in, the secu-rities loaned should a borrower fail to return the securities in a timelymanner. During the period ended December 31, 2011, The Bank ofNew York Mellon earned $32,892 from lending portfolio securities,pursuant to the securities lending agreement.
(d) Affiliated issuers: Investments in other investment companiesadvised by Dreyfus are defined as “affiliated” in the Act.
T h e F u n d 23
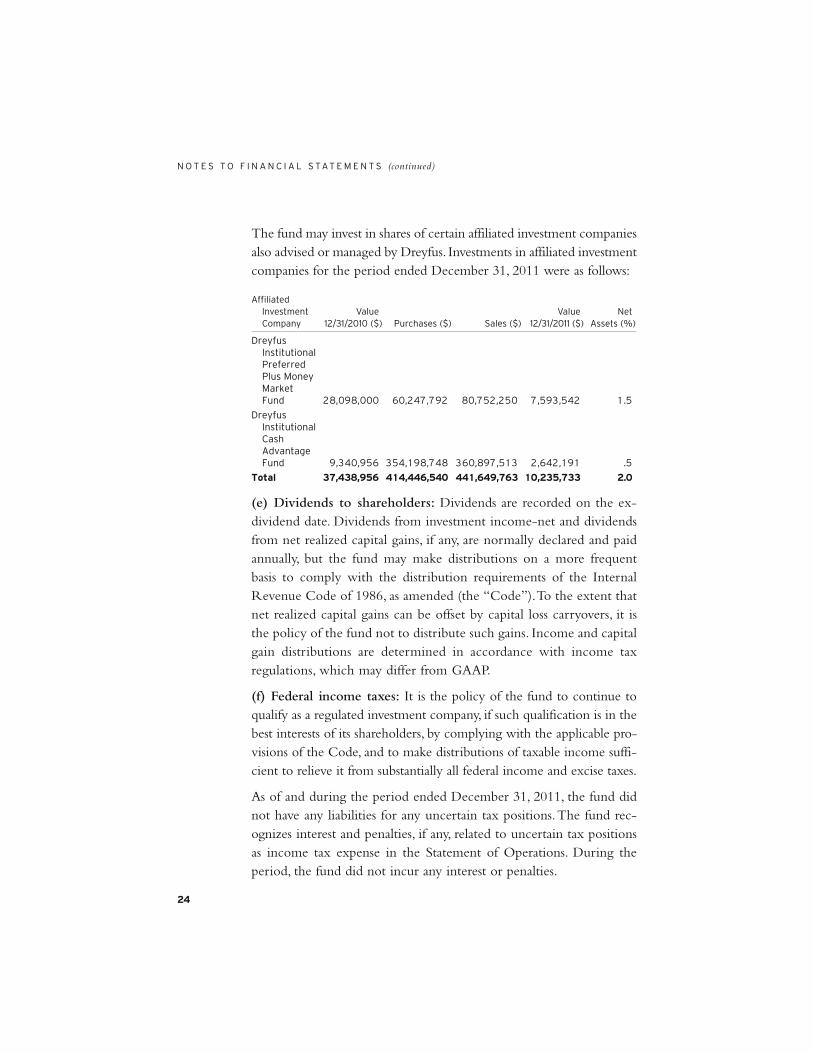
The fund may invest in shares of certain affiliated investment companiesalso advised or managed by Dreyfus. Investments in affiliated investmentcompanies for the period ended December 31, 2011 were as follows:
Affiliated Investment Value Value Net Company 12/31/2010 ($) Purchases ($) Sales ($) 12/31/2011 ($) Assets (%)
Dreyfus Institutional Preferred Plus Money Market Fund 28,098,000 60,247,792 80,752,250 7,593,542 1.5
Dreyfus Institutional Cash Advantage Fund 9,340,956 354,198,748 360,897,513 2,642,191 .5
Total 37,438,956 414,446,540 441,649,763 10,235,733 2.0
(e) Dividends to shareholders: Dividends are recorded on the ex-dividend date. Dividends from investment income-net and dividendsfrom net realized capital gains, if any, are normally declared and paidannually, but the fund may make distributions on a more frequentbasis to comply with the distribution requirements of the InternalRevenue Code of 1986, as amended (the “Code”). To the extent thatnet realized capital gains can be offset by capital loss carryovers, it isthe policy of the fund not to distribute such gains. Income and capitalgain distributions are determined in accordance with income taxregulations, which may differ from GAAP.
(f) Federal income taxes: It is the policy of the fund to continue toqualify as a regulated investment company, if such qualification is in thebest interests of its shareholders, by complying with the applicable pro-visions of the Code, and to make distributions of taxable income suffi-cient to relieve it from substantially all federal income and excise taxes.
As of and during the period ended December 31, 2011, the fund didnot have any liabilities for any uncertain tax positions. The fund rec-ognizes interest and penalties, if any, related to uncertain tax positionsas income tax expense in the Statement of Operations. During theperiod, the fund did not incur any interest or penalties.
24
N O T E S T O F I N A N C I A L S TAT E M E N T S (continued)
Each of the tax years in the four-year period ended December 31,2011 remains subject to examination by the Internal Revenue Serviceand state taxing authorities.
At December 31, 2011, the components of accumulated earnings ona tax basis were as follows: ordinary income $8,843,223, accumulatedcapital losses $1,621,087 and unrealized appreciation $185,882,506.In addition, the fund had $137,291 of capital losses realized afterOctober 31, 2011, which were deferred for tax purposes to the firstday of the following fiscal year.
Under the Regulated Investment Company Modernization Act of2010 (the “2010 Act”), the fund will be permitted to carry forwardcapital losses incurred in taxable years beginning after December 22,2010 (“post-enactment losses”) for an unlimited period. Post-enact-ment capital loss carryovers will retain their character as either short-term or long-term capital losses rather than be considered short-termas they were under previous statute. However, the 2010 Act requirespost-enactment losses to be utilized before the utilization of lossesincurred in taxable years prior to the effective date of the 2010 Act(“pre-enactment losses”). As a result of this ordering rule, pre-enact-ment losses may be more likely to expire unused.
The accumulated capital loss carryover is available for federal incometax purposes to be applied against future net securities profits, if any,realized subsequent to December 31, 2011. If not applied, $658,768 ofthe carryover expires in fiscal 2017, $732,796 expires in fiscal 2018 and$229,523 of post-enactment long-term capital losses can be carriedforward for an unlimited period.
The tax character of distributions paid to shareholders during the fiscalperiods ended December 31, 2011 and December 31, 2010 were asfollows: ordinary income $7,354,178 and $7,707,263, respectively.
During the period ended December 31, 2011, as a result of perma-nent book to tax differences, primarily due to the tax treatment forforeign currency exchange gains and losses, the fund decreased
T h e F u n d 25
accumulated undistributed investment income-net by $1,254 andincreased accumulated net realized gain (loss) on investments by thesame amount. Net assets and net asset value per share were notaffected by this reclassification.
NOTE 2—Bank Lines of Credit:
The fund participates with other Dreyfus-managed funds in a $225million unsecured credit facility led by Citibank, N.A. and a $300 mil-lion unsecured credit facility provided by The Bank of New YorkMellon (each, a “Facility”), each to be utilized primarily for temporaryor emergency purposes, including the financing of redemptions. Inconnection therewith, the fund has agreed to pay its pro rata portion ofcommitment fees for each Facility. Interest is charged to the fund basedon rates determined pursuant to the terms of the respective Facility atthe time of borrowing. During the period ended December 31, 2011,the fund did not borrow under the Facilities.
NOTE 3—Investment Advisory Fee, Sub-Investment AdvisoryFee and Other Transactions With Affiliates:
(a) Pursuant to an investment advisory agreement with Dreyfus, theinvestment advisory fee is computed at the annual rate of .5325% ofthe value of the fund’s average daily net assets. Pursuant to a sub-investment advisory agreement with Sarofim & Co., the fund paysSarofim & Co. a monthly sub-investment advisory fee at the annualrate of .2175% of the value of the fund’s average daily net assets. Bothfees are payable monthly.
(b) Under the Distribution Plan (the “Plan”) adopted pursuant to Rule12b-1 under the Act, Service shares pay the Distributor for distributingits shares, for servicing and/or maintaining Service shares’ shareholderaccounts and for advertising and marketing for Service shares. The Planprovides for payments to be made at an annual rate of .25% of the valueof the Service shares’ average daily net assets. The Distributor may make
26
N O T E S T O F I N A N C I A L S TAT E M E N T S (continued)

payments to Participating Insurance Companies and to brokers anddealers acting as principal underwriter for their variable insuranceproducts. The fees payable under the Plan are payable without regard toactual expenses incurred. During the period ended December 31,2011, Service shares were charged $359,542 pursuant to the Plan.
The fund compensates Dreyfus Transfer, Inc., a wholly-owned sub-sidiary of Dreyfus, under a transfer agency agreement for providingpersonnel and facilities to perform transfer agency services for the fund.During the period ended December 31, 2011, the fund was charged$1,506 pursuant to the transfer agency agreement, which is included inShareholder servicing costs in the Statement of Operations.
The fund has arrangements with the custodian and cash managementbank whereby the fund may receive earnings credits when positive cashbalances are maintained, which are used to offset custody and cash man-agement fees. For financial reporting purposes, the fund includes netearnings credits as an expense offset in the Statement of Operations.
The fund compensates The Bank of New York Mellon under cashmanagement agreements for performing cash management servicesrelated to fund subscriptions and redemptions. During the periodended December 31, 2011, the fund was charged $227 pursuant to thecash management agreements, which is included in Shareholder ser-vicing costs in the Statement of Operations. These fees were partiallyoffset by earnings credits of $7.
The fund also compensates The Bank of New York Mellon under acustody agreement for providing custodial services for the fund.During the period ended December 31, 2011, the fund was charged$37,863 pursuant to the custody agreement.
During the period ended December 31, 2011, the fund was charged$6,402 for services performed by the Chief Compliance Officer.
T h e F u n d 27
The components of “Due to The Dreyfus Corporation and affiliates”in the Statement of Assets and Liabilities consist of: investment advisoryfees $220,603, Rule 12b-1 distribution plan fees $35,578, custodian fees$15,003, chief compliance officer fees $5,295 and transfer agency peraccount fees $223.
(c) Each Board member also serves as a Board member of other fundswithin the Dreyfus complex. Annual retainer fees and attendance feesare allocated to each fund based on net assets.
NOTE 4—Securities Transactions:
The aggregate amount of purchases and sales of investment securities,excluding short-term securities, during the period ended December 31,2011, amounted to $48,582,853 and $19,558,921, respectively.
At December 31, 2011, the cost of investments for federal incometax purposes was $315,337,501; accordingly, accumulated net unre-alized appreciation on investments was $185,882,506, consisting of$199,694,157 gross unrealized appreciation and $13,811,651 grossunrealized depreciation.
28
N O T E S T O F I N A N C I A L S TAT E M E N T S (continued)
Shareholders and Board of TrusteesDreyfus Variable Investment Fund, Appreciation Portfolio
We have audited the accompanying statement of assets and liabilities,including the statement of investments, of Dreyfus Variable InvestmentFund, Appreciation Portfolio (one of the series comprising DreyfusVariable Investment Fund) as of December 31, 2011, and the relatedstatement of operations for the year then ended, the statement ofchanges in net assets for each of the two years in the period then ended,and financial highlights for each of the years indicated therein. Thesefinancial statements and financial highlights are the responsibility of theFund’s management. Our responsibility is to express an opinion onthese financial statements and financial highlights based on our audits.We conducted our audits in accordance with the standards of the PublicCompany Accounting Oversight Board (United States). Those standardsrequire that we plan and perform the audit to obtain reasonable assur-ance about whether the financial statements and financial highlights arefree of material misstatement. We were not engaged to perform an auditof the Fund’s internal control over financial reporting. Our auditsincluded consideration of internal control over financial reporting as abasis for designing audit procedures that are appropriate in the cir-cumstances, but not for the purpose of expressing an opinion on theeffectiveness of the Fund’s internal control over financial reporting.Accordingly, we express no such opinion. An audit also includesexamining, on a test basis, evidence supporting the amounts and disclo-sures in the financial statements and financial highlights, assessing theaccounting principles used and significant estimates made by manage-ment, and evaluating the overall financial statement presentation. Ourprocedures included confirmation of securities owned as of December31, 2011 by correspondence with the custodian and others. We believethat our audits provide a reasonable basis for our opinion.In our opinion, the financial statements and financial highlights referredto above present fairly, in all material respects, the financial position ofDreyfus Variable Investment Fund, Appreciation Portfolio at December31, 2011, the results of its operations for the year then ended, the changesin its net assets for each of the two years in the period then ended, andthe financial highlights for each of the indicated years, in conformitywith U.S. generally accepted accounting principles.
New York, New YorkFebruary 10, 2012
T h e F u n d 29
R E P O R T O F I N D E P E N D E N T R E G I S T E R E D P U B L I C A C C O U N T I N G F I R M

For federal tax purposes, the fund hereby designates 100% of theordinary dividends paid during the fiscal year ended December 31,2011 as qualifying for the corporate dividends received deduction.Shareholders will receive notification in early 2012 of the percentageapplicable to the preparation of their 2011 income tax returns.
30
I M P O R TA N T TA X I N F O R M AT I O N ( U n a u d i t e d )

Joseph S. DiMartino (68)Chairman of the Board (1995)
Principal Occupation During Past 5 Years:• Corporate Director and Trustee
Other Public Company Board Memberships During Past 5 Years:• CBIZ (formerly, Century Business Services, Inc.), a provider of outsourcing functions for small
and medium size companies, Director (1997-present)• Sunair Services Corporation, a provider of certain outdoor-related services to homes and
businesses, Director (2005-2009) • The Newark Group, a provider of a national market of paper recovery facilities, paperboard
mills and paperboard converting plants, Director (2000-2010)
No. of Portfolios for which Board Member Serves: 164
———————Peggy C. Davis (68)Board Member (2006)
Principal Occupation During Past 5 Years:• Shad Professor of Law, New York University School of Law • Writer and teacher in the fields of evidence, constitutional theory, family law, social sciences
and the law, legal process and professional methodology and training
No. of Portfolios for which Board Member Serves: 53
———————David P. Feldman (72)Board Member (1994)
Principal Occupation During Past 5 Years:• Corporate Director and Trustee
Other Public Company Board Memberships During Past 5 Years:• BBH Mutual Funds Group (4 registered mutual funds), Director (1992-present)• QMed, Inc. a healthcare company, Director (1999-2007)
No. of Portfolios for which Board Member Serves: 49
T h e F u n d 31
B O A R D M E M B E R S I N F O R M AT I O N ( U n a u d i t e d )
Ehud Houminer (71)Board Member (2006)
Principal Occupation During Past 5 Years:• Executive-in-Residence at the Columbia Business School, Columbia University (1992-present)
Other Public Company Board Memberships During Past 5 Years:• Avnet Inc., an electronics distributor, Director (1993-present)
No. of Portfolios for which Board Member Serves: 63
———————Dr. Martin Peretz (72)Board Member (1990)
Principal Occupation During Past 5 Years:• Editor-in-Chief Emeritus of The New Republic Magazine (2010-present) (previously, Editor-
in-Chief, 1974-2010)• Director of TheStreet.com, a financial information service on the web (1996-present)
No. of Portfolios for which Board Member Serves: 35
———————Once elected all Board Members serve for an indefinite term, but achieve Emeritus status upon reaching age 80. Theaddress of the Board Members and Officers is in c/o The Dreyfus Corporation, 200 Park Avenue, New York, New York10166. Additional information about the Board Members is available in the fund’s Statement of Additional Informationwhich can be obtained from Dreyfus free of charge by calling this toll free number: 1-800-DREYFUS.
James F. Henry, Emeritus Board MemberRosalind G. Jacobs, Emeritus Board MemberDr. Paul A. Marks, Emeritus Board MemberGloria Messinger, Emeritus Board Member
32
B O A R D M E M B E R S I N F O R M AT I O N ( U n a u d i t e d ) (continued)
BRADLEY J. SKAPYAK, President sinceJanuary 2010.
Chief Operating Officer and a director of theManager since June 2009. From April 2003 toJune 2009, Mr. Skapyak was the head of theInvestment Accounting and SupportDepartment of the Manager. He is an officerof 75 investment companies (comprised of 163portfolios) managed by the Manager. He is 53years old and has been an employee of theManager since February 1988.
JANETTE E. FARRAGHER, Vice Presidentand Secretary since December 2011.
Assistant General Counsel of BNY Mellon,and an officer of 76 investment companies(comprised of 189 portfolios) managed by theManager. She is 49 years old and has been anemployee of the Manager since February 1984.
KIESHA ASTWOOD, Vice President andAssistant Secretary since January 2010.
Counsel of BNY Mellon, and an officer of 76investment companies (comprised of 189portfolios) managed by the Manager. She is 38years old and has been an employee of theManager since July 1995.
JAMES BITETTO, Vice President andAssistant Secretary since August 2005.
Senior Counsel of BNY Mellon and Secretaryof the Manager, and an officer of 76investment companies (comprised of 189portfolios) managed by the Manager. He is 45years old and has been an employee of theManager since December 1996.
JONI LACKS CHARATAN, Vice Presidentand Assistant Secretary since August 2005.
Senior Counsel of BNY Mellon, and an officerof 76 investment companies (comprised of 189portfolios) managed by the Manager. She is 56years old and has been an employee of theManager since October 1988.
JOSEPH M. CHIOFFI, Vice President andAssistant Secretary since August 2005.
Senior Counsel of BNY Mellon, and an officerof 76 investment companies (comprised of 189portfolios) managed by the Manager. He is 50years old and has been an employee of theManager since June 2000.
KATHLEEN DENICHOLAS, Vice Presidentand Assistant Secretary since January 2010.
Managing Counsel of BNY Mellon, and anofficer of 76 investment companies (comprisedof 189 portfolios) managed by the Manager.She is 37 years old and has been an employeeof the Manager since February 2001.
JOHN B. HAMMALIAN, Vice President andAssistant Secretary since August 2005.
Senior Managing Counsel of BNY Mellon,and an officer of 76 investment companies(comprised of 189 portfolios) managed by theManager. He is 48 years old and has been anemployee of the Manager since February 1991.
M. CRISTINA MEISER, Vice President andAssistant Secretary since January 2010.
Senior Counsel of BNY Mellon, and an officerof 76 investment companies (comprised of 189portfolios) managed by the Manager. She is 41years old and has been an employee of theManager since August 2001.
ROBERT R. MULLERY, Vice President andAssistant Secretary since August 2005.
Managing Counsel of BNY Mellon, and anofficer of 76 investment companies (comprisedof 189 portfolios) managed by the Manager.He is 59 years old and has been an employeeof the Manager since May 1986.
T h e F u n d 33
O F F I C E R S O F T H E F U N D ( U n a u d i t e d )

JEFF PRUSNOFSKY, Vice President andAssistant Secretary since August 2005.
Senior Managing Counsel of BNY Mellon,and an officer of 76 investment companies(comprised of 189 portfolios) managed by theManager. He is 46 years old and has been anemployee of the Manager since October 1990.
JAMES WINDELS, Treasurer sinceNovember 2001.
Director – Mutual Fund Accounting of theManager, and an officer of 76 investmentcompanies (comprised of 189 portfolios)managed by the Manager. He is 53 years oldand has been an employee of the Managersince April 1985.
RICHARD CASSARO, Assistant Treasurersince January 2008.
Senior Accounting Manager – Money Marketand Municipal Bond Funds of the Manager,and an officer of 76 investment companies(comprised of 189 portfolios) managed by the Manager. He is 52 years old and has been an employee of the Manager sinceSeptember 1982.
GAVIN C. REILLY, Assistant Treasurersince December 2005.
Tax Manager of the Investment Accountingand Support Department of the Manager, andan officer of 76 investment companies(comprised of 189 portfolios) managed by theManager. He is 43 years old and has been anemployee of the Manager since April 1991.
ROBERT S. ROBOL, Assistant Treasurersince August 2003.
Senior Accounting Manager – Fixed IncomeFunds of the Manager, and an officer of 76investment companies (comprised of 189portfolios) managed by the Manager. He is 47years old and has been an employee of theManager since October 1988.
ROBERT SALVIOLO, Assistant Treasurersince July 2007.
Senior Accounting Manager – Equity Funds ofthe Manager, and an officer of 76 investmentcompanies (comprised of 189 portfolios)managed by the Manager. He is 44 years oldand has been an employee of the Managersince June 1989.
ROBERT SVAGNA, Assistant Treasurersince December 2002.
Senior Accounting Manager – Equity Funds ofthe Manager, and an officer of 76 investmentcompanies (comprised of 189 portfolios)managed by the Manager. He is 44 years oldand has been an employee of the Managersince November 1990.
JOSEPH W. CONNOLLY, Chief ComplianceOfficer since October 2004.
Chief Compliance Officer of the Manager andThe Dreyfus Family of Funds (76 investmentcompanies, comprised of 189 portfolios). FromNovember 2001 through March 2004, Mr.Connolly was first Vice-President, MutualFund Servicing for Mellon Global SecuritiesServices. In that capacity, Mr. Connolly wasresponsible for managing Mellon’s Custody,Fund Accounting and Fund Administrationservices to third-party mutual fund clients. Heis 54 years old and has served in variouscapacities with the Manager since 1980,including manager of the firm’s FundAccounting Department from 1997 throughOctober 2001.
STEPHEN J. STOREN, Anti-MoneyLaundering Compliance Officer since May 2011.
Chief Compliance Officer of the Distributor,and the Anti-Money Laundering ComplianceOfficer of 72 investment companies (comprisedof 185 portfolios) managed by the Manager. Heis 57 years old and has been an employee of theDistributor since October 1999.
34
O F F I C E R S O F T H E F U N D ( U n a u d i t e d ) (continued)


N O T E S

Dreyfus VariableInvestment Fund,Appreciation Portfolio
200 Park AvenueNew York, NY 10166
Investment Adviser
The Dreyfus Corporation200 Park AvenueNew York, NY 10166
Sub-Investment Adviser
Fayez Sarofim & Co.Two Houston CenterSuite 2907Houston, TX 77010
Custodian
The Bank of New York MellonOne Wall StreetNew York, NY 10286
Transfer Agent &Dividend Disbursing Agent
Dreyfus Transfer, Inc.200 Park AvenueNew York, NY 10166
Distributor
MBSC Securities Corporation200 Park AvenueNew York, NY 10166
For More Information
© 2012 MBSC Securities Corporation 0112AR1211
Telephone 1-800-554-4611 or 1-516-338-3300
Mail The Dreyfus Family of Funds, 144 Glenn Curtiss Boulevard, Uniondale, NY 11556-0144Attn: Investments Division
The fund files its complete schedule of portfolio holdings with the Securities and Exchange
Commission (“SEC”) for the first and third quarters of each fiscal year on Form N-Q. The fund’s
Forms N-Q are available on the SEC’s website at http://www.sec.gov and may be reviewed and
copied at the SEC’s Public Reference Room in Washington, DC. Information on the operation of
the Public Reference Room may be obtained by calling 1-800-SEC-0330.
A description of the policies and procedures that the fund uses to determine how to vote
proxies relating to portfolio securities, and information regarding how the fund voted
these proxies for the most recent 12-month period ended June 30 is available at
http://www.dreyfus.com and on the SEC’s website at http://www.sec.gov. The
description of the policies and procedures is also available without charge,
upon request, by calling 1-800-DREYFUS.
®