Draining characteristics of hemispherically bottomed ... · TECH LIBRARY KAFB,NM NASA Technical...
32
- NASA I 'pp '297 ~ c.1 , NASA Technical Paper 1297 Draining Characteristics of Hemispherically Bottomed Cylinders in a Low-Gravity Environment Eugene P. Symons AUGUST 1978 I I LI I . I NASA https://ntrs.nasa.gov/search.jsp?R=19780023441 2018-06-12T21:36:47+00:00Z
Transcript of Draining characteristics of hemispherically bottomed ... · TECH LIBRARY KAFB,NM NASA Technical...
-NASA I 'pp
'297 ~
c.1 ,
NASA Technical Paper 1297
Draining Characteristics of Hemispherically Bottomed Cylinders in a Low-Gravity Environment
Eugene P. Symons
AUGUST 1978
I
ILI
I
. I
NASA
https://ntrs.nasa.gov/search.jsp?R=19780023441 2018-06-12T21:36:47+00:00Z
TECH LIBRARY KAFB,NM
NASA Technical Paper 1297
Draining Characteristics of Hemispherically Bottomed Cylinders in a Low-Gravity Environment
Eugene P. Symons Lewis Research Center Cleveland, Ohio
NASA National Aeronautics and Space Administration
Scientific and Technical InformationOffice
1978
I
i
1
I
I
DRAINING CHARACTER lST lCS OF HEMlS PHER I CALLY BOTTOMED
CYLINDERS IN A LOW-GRAVITY ENVIRONMENT
by Eugene P. Symons
Lewis Research Center
SUMMARY
The phenomenon of vapor ingestion during the draining of a scale-model, hemispherically bottomed cylindrical tank in a low -gravity environment was studied experimentally, and the experimental results are compared with previously obtained numerical results. It was observed that certain combinations of Weber and Bond number resulted in a draining-induced, axisymmetric slosh motion. The periods of the resulting slosh waves were correlated in te rms of a draining parameter formed by the ratio (Weber number)/(Bond number plus one). Additionally, liquid residuals, defined as the quantity of liquid remaining in the tank at the time of vapor ingestion, were correlated with the draining parameter.
INTRODUCTION
As a part of a continuing study of the behavior of liquids in containers in a low-gravity environment, the NASA Lewis Research Center has been conducting experimental investigations of the vapor ingestion phenomenon that occurs during draining. The pr i mary objective of these studies is to provide a basic understanding of the entire draining process, including both free-surface motion and vapor ingestion, and to use that understanding to establish cri teria for effective and efficient draining of liquids in the low-gravity environment of space.
To date, the majority of the studies have concentrated on outflow in weightlessness from tanks of cylindrical cross section with either flat or hemispherical bottoms. The initial study (ref. 1) showed that the liquid-vapor interface was severely distorted during liquid oufflow in zero gravity and that the magnitude of the distortion depended on oufflow rate. The severe distortion manifested itself in correspondingly large liquid residuals at vapor ingestion. The same study demonstrated that pressurant-gas inlet baffles, as
sell as outlet baffles in the liquid, were effective in reducing distortion during draining. Later, more detailed studies have examined the vapor ingestion phenomenon in zero Zravity and in normal gravity for cylindrical tanks with either flat (ref. 2) or hemispherical (ref. 3) bottoms. In general, it was found thai liquid residuals were a function of Froude number (ratio of inertia forces to gravity forces) in normal gravity and a function of Weber number (ratio of inertia forces to surface tension forces) in weightlessness. The results of normal-gravity simulations of low-gravity outflow in flat-bottomed tanks, including correlations of vapor ingestion height with Froude number, are presented in references 4 and 5. Reference 6 extends an analysis developed in reference 5 for vapor ingestion to include the effects of surface tension and concludes that vapor ingestion in weightlessness depends on the Weber number. In references 7 and 8, the problem of low-gravity draining from hemispherically bottomed tanks was studied numerically.
The results of an experimental study of the vapor ingestion phenomenon in hemispherically bottomed cylindrical tanks during outflow in a low-gravity environment a re presented in this report. The quantity of liquid in the tank when vapor pullthrough occurred was correlated in t e r m s of a draining parameter formed by a grouping of the Weber and Bond numbers (ratio of gravity forces to surface tension of the system). Experimental results are compared with the numerical results obtained in reference 8, and the phenomenon of draining-induced axisymmetric slosh is discussed. All tests were conducted in the Lewis Research Center's zero-gravity facility.
SYMBOLS
a radius of tank, cm
B Bond number, pga2/a 2 2 5Fr Froude number, Q /ITga
!2 acceleration due to gravity, cm/sec
critical height, cm
hvi vapor ingestion height, cm
Q volumetric flow rate, cm 3/sec
rO outlet o r drain radius, cm
t nondimensional draining time, @;/ra -t draining time, sec
V actual residual volume, cm 3
2
3
3 'r residual volume in terms of hemispherical-tank-bottom volume, V/: 2 ra
2
W Weber number, p$/v 2 3cra
Z nondimensional interface height, z/a -Z interface height, cm
P specific surface tension, cm3/sec 2 -x period of slosh wave, sec
‘d nondimensional period of slosh wave, rQ/ra 3
x* nondimensional period of slosh wave, Xd [(l + B)/W)] 1/2
viscosity, g/cm -sec
P liquid density, g/cm 3
U surface tension, g/sec 2
APPARATUS AND PROCEDURE
The zero -gravity facility and the experiment apparatus and procedure a re described in detail in the appendix.
Experiment Tank
The experiment tank used in this study was a 2-centimeter-radius cylinder with a hemispherical bottom and a n outlet line circular in cross section and located along the tank longitudinal axis at the bottom of the tank. Ratios of the outlet-line radius to the tank radius ro/a were either 1/5 or 1/10. The tank was machined from cast acrylic plastic and polished to improve photographic quality. It was equipped with a pressurant
1 gas inlet baffle 1tank radius in diameter and centered along the tank longitudinal axis 1/2 tank radius below the presswant-gas inlet. The baffle was formed from a thin piece of stainless steel and was held in position by three small bolts. The purpose of the baffle was to prevent direct impingement of the pressurant gas onto the liquid-vapor interface during the draining process. The tank assembly is shown in figure 1.
Test Liquid
The liquid used in this investigation was trichlorotrifluoroethane. Properties of the test liquid pertinent to this study are given in table I. To improve the quality of the
3
photographic data, a trace amount of dye was added to the liquid. Previous tests have determined that the addition of the dye has no measurable effect on the fluid properties.
DESCRIPTION OF VAPOR INGESTION PHENOMENON
As liquid is withdrawn from a container, a critical depth is reached at which the nonuniform velocities generated across the tank cross section by flow through the outlet line cause a depression to form in the liquid-vapor interface immediately above the outlet. The surface distortion grows very rapidly with time until vapor is drawn into the outlet line. The phenomenon is commonly called vapor ingestion o r suction dip. Typically, the body forces of gravity o r system acceleration tend to retard the effect somewhat by keeping the interface level. It is thus expected that vapor ingestion, although occurring in normal gravity, will be more of a problem in a low- or zero-gravity environment, where these retarding forces a r e either absent or small.
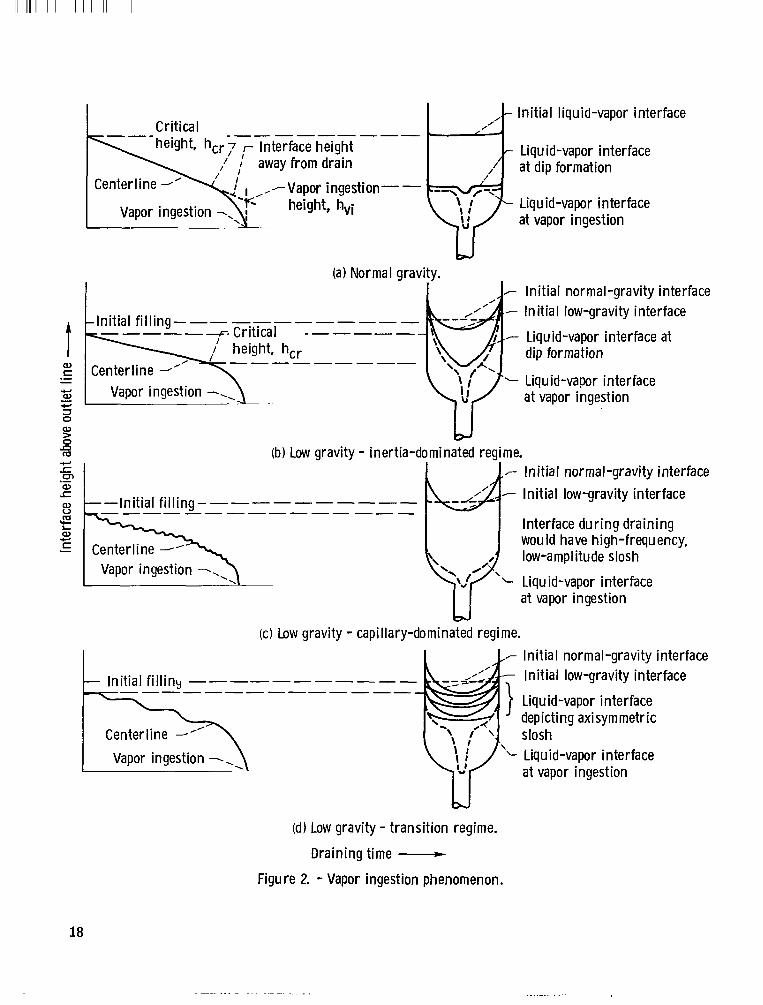
Previous studies conducted in the Lewis Research Center's drop-tower facility investigated vapor ingestion in hemispherically bottomed tanks in normal gravity and in weightlessness. In those studies, it was observed that, in the cylindrical section during normal-gravity draining (or draining in a high-Bond-number environment), the liquid-vapor interface moved with a constant velocity until the incipience of vapor ingestion. The interface shape f a r from the drain remained essentially flat, as shown in figure 2(a). The displacement-time graph shows the position of the liquid-vapor interface during draining and the rapid acceleration of the vapor into the outlet line at vapor ingestion. The height of the interface at the time the dip formed was defined as the critical height hcr, and the height of the free surface away from the drain when vapor was ingested into the outlet was defined as the vapor ingestion height %i. Previous investigators have generally used the vapor ingestion height to correlate experiment data for normal-gravity (or high Bond number) draining. Since the liquid-vapor interface would be nearly flat in a high-Bond-number environment, the vapor ingestion height does permit a good estimate to be made of the liquid residuals, that is, the liquid left in the tank when vapor was ingested into the tank outlet.
In a low- or zero-Bond-number environment, the draining behavior, although it retained some elements of similarity to normal-gravity draining, had some differences as well. Before the initiation of draining, the interface assumed a curved shape consistent with the low Bond number and the liquid-to-solid contact angle.
If the oufflow Weber number was high, the draining process simply withdrew liquid from the center of the tank and the centerline interface velocity remained nearly constant until the incipience of vapor ingestion, at which t ime the interface centerline accelerated rapidly toward the outlet. Thus, the interface centerline behaved as it does in normal-gravity draining in that it moved at constant velocity. Thus we can define the critical
4
height as it was defined for normal-gravity draining. This type of behavior was experimentally observed in all earlier studies conducted in the Lewis Research Center's drop-tower facility and is illustrated in figure 2(b). This type of behavior was also predicted to occur from the numerical computations carried out in reference 8, where it was called the draining or inertia regime.
On the other hand, if the outflow Weber number was very low, the interface initially distorted somewhat from its equilibrium configuration at the onset of draining. However, surface tension and gravitational forces (if present) were sufficient to cause the liquid-vapor interface contact point at the tank wall to release intermittently. This gave rise to a draining-induced &symmetric slosh with relatively high-frequency, low-amplitude waves superimposed on the normal draining behavior. This regime is called the capillary regime in reference 8. In this regime the centerline interface velocity varied as shown in the displacement-time plot in figure 2(c). If the outflow Weber number was some moderate value, intermediate between the two extremes, the interface distorted significantly from its equilibrium configuration before release of the contact point at the tank wall. This distortion gave r i se to low-frequency, high-amplitude waves superim -posed on the draining behavior. This regime is called the transition regime in reference 8. In this regime the centerline interface velocity varied as shown in figure 2(d).
In a normal -gravity or high-Bond-number environment and in the inertia-dominated regime in a low-Bond-number environment, it is relatively simple to define a critical height as the height at which the centerline of the liquid-vapor interface deviates from constant-velocity draining. However, for the capillary-dominated and transition regimes, which exist during draining in a low-Bond-number environment, the cyclic excursions of the interface make it nearly impossible to apply this same definition of cr i t ical height accurately (figs. 2(c) and (d)).
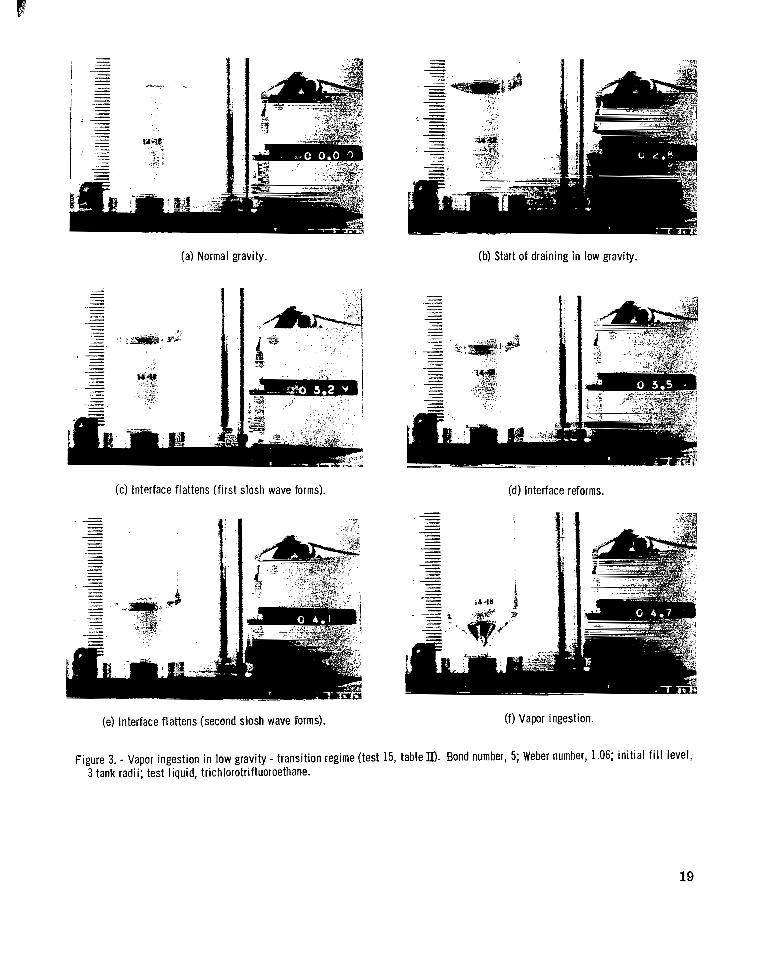
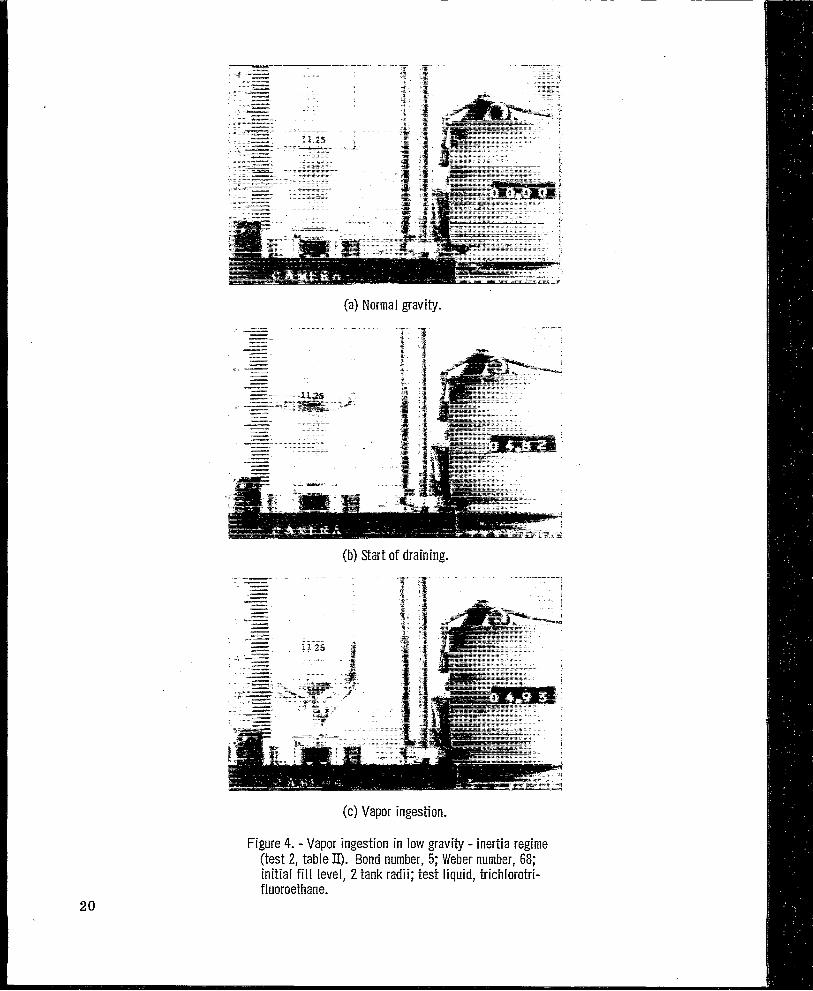
The free-surface behavior during low-gravity draining is illustrated in figures 3 and 4. Figure 3 shows selected frames taken from a motion picture of the draining of trichlorotrifluoroethane with a Bond number B of 5 and a Weber number W of 1.06. In this example, the initial filling level as measured in normal gravity was sufficiently high (3 tank radii) that, at the Weber and Bond numbers indicated, two draining-induced surface waves formed. These are clearly shown by the marked flattening of the free surface. This particular test was an example of draining in the transition regime. Figure 4 shows selected frames for the draining of trichlorotrifluoroethane with a Bond num ber of 5 and a Weber number of 68. Here the Weber number was high enough that the draining was inertia dominated, no surface waves formed, and the interface merely distorted. For the tests conducted in this study, draining was inertia dominated when W/(B + 1) exceeded approximately 1, and draining was transition dominated for 0.11 < W/(B + 1) < 1. Since 0.11 was the lowest value of the draining parameter that could be obtained, no capillary-dominated draining was observed.
5
5
DISCUSSION OF RESULTS
One of the primary objectives in conducting this experiment was to obtain data for comparison with the numerical results obtained by Bizzell and Crane and presented in reference 8. In reference 8, the numerical results are compared with limited, unpublished preliminary data from the Lewis zero-gravity facility. In this report, that comparison is expanded to include a broad range of f inal experimental results. Should the numerical and experimental results compare favorably, the correlations obtained in reference 8 could be confidently used to predict such effects as draining-induced, free-surface slosh and the magnitude of liquid residuals at vapor ingestion for large tanks and low drain rates, where experimental verification is impossible. To this end, low-gravity data were obtained experimentally, primarily a t a Bond number of 5 at two f i l l levels (2 and 3 tank radii as measured in normal gravity) through two sizes of outlet line (ro/a of 1/5 and 1/10) over a range of outflow rates (i.e. , -0.7 < W < 68). The experiment data presented in this report are summarized in table II.
Comparison of Experimental Free-Surface Motion with Numerical Data
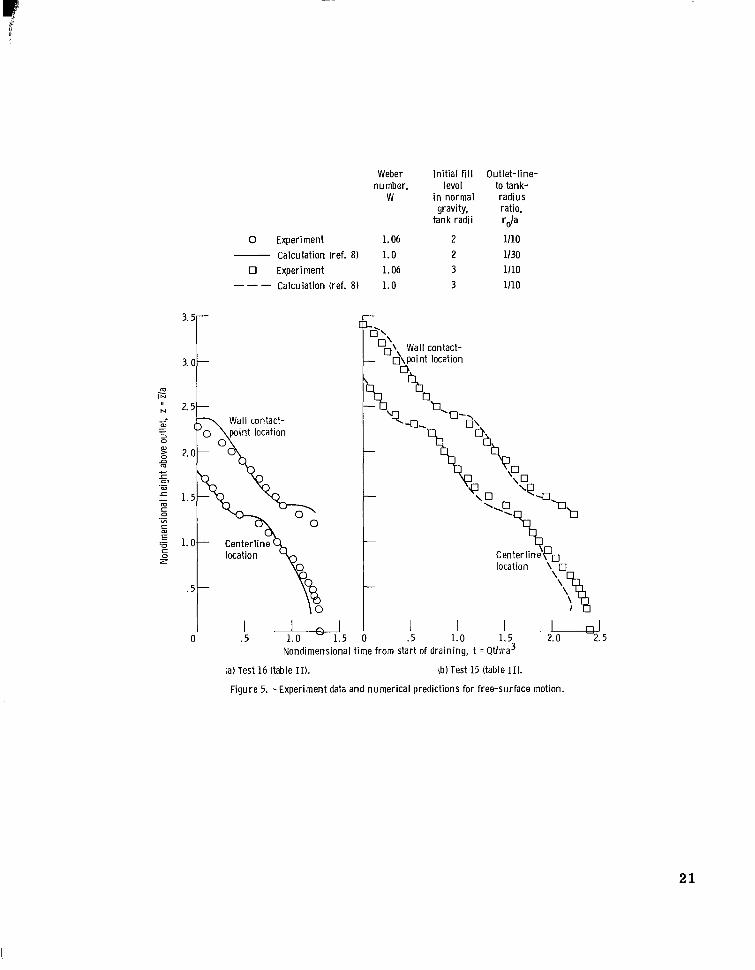
Experiment data for the movement of both the centerline of the liquid-vapor interface and the contact point of the liquid-vapor interface at the tank wall are compared with the numerical results of reference 8 in figure 5.
Similar plots are presented in reference 8, but the experiment data plotted were obtained from 6reliminary tests conducted at the Lewis zero-gravity facility. In the comparison presented herein, the interface location at the wall and the centerline positions during the experiment were very carefully corrected for optical refraction, and the experimental Weber number (1.06) was very close to the value actually used in the numerical computations (1.0) (however, the experimental value used in ref. 8 was 0.905). Furthermore, in the comparisons of experiment data with numerical results presented in reference 8, the experiment data were obtained by initiating outflow when the center-line of the free surface reached its low point in its first pass through its low-gravity equilibrium shape (for details, see ref. 3). For the comparisons made herein, the interface was permitted to undergo several oscillations about its low-gravity equilibrium shape before draining was begun. This procedure permitted much of the oscillatory motion of the liquid-vapor interface to be damped out, and a "more nearly" quiescent liquid-vapor interface was achieved.
In figure 5(a) (initial f i l l level, as measured in normal gravity, of 2 tank radii), the nondimensional interface heights g/a of both the centerline and the wall contact point are plotted as a function of the nondimensional draining time. The numerical-case parameters were W = l, B = 5, ro/a = 1/30, and an initial f i l l level of 2 tank radii; the
6
.. . .... ..... ~~ . - .,
test conditions were W = 1.06, B = 5, ro/a = 1/10, and an initial f i l l level of 2 tank radii. Thus, the major difference between the experimental and numerical parameters was the ratio of outlet-line radius to tank radius which, from previous results (ref. 81, should not affect the free-surface behavior.
The position of the centerline as measured in the experiment agrees very well with the numerically computed position, even to predicting the occurrence of the start of free-surface slosh and its amplitude. As vapor ingestion becomes imminent, some slight divergence occurs between experiment and numerical data, with the numerical points predicting a more rapid motion of the free-surface centerline toward the outlet. Overall, however, the agreement of experiment and numerical computation was excellent in
, this case. The position of the liquid-vapor interface contact point at the tank wall as measured
in the experiment did not agree as well with the numerical computations. The initial location of the wall contact point was lower in the experiment than in the numerical results. The experiment wall contact point had a lower rate of descent throughout much of the draining period. However, the rate of descent for the experiment data was greater as vapor ingestion was approached.
In figure 5@) (initial f i l l level of 3 tank radii), the nondimensional heights of both the centerline and the wall contact point a r e again plotted as a function of the nondimensional draining time. In this test, the agreement between the numerical predictions and observed experimental location of the centerline as a function of time was excellent. Both the start and the amplitude of each slosh wave were close to predicted values. However, as for the lower -initial-fill-level case, some divergence occurred between the computed points and the experiment data as the point of vapor ingestion approached.
Comparing the agreement between numerical and experimental results for the position of the wall contact point shows that agreement was better at the higher initial f i l l level. The rate of descent of the wall contact point throughout much of the draining period was lower in the experiment than in the numerical results. However, the change in the rate at which the wall contact point moved downward was evident experimentally, both after a slosh wave occurred and as vapor ingestion was approached.
, From these comparisons, it was concluded that the numerical results of reference 8
accurately represent the dynamics of the low-gravity draining problem and can be used with confidence to predict free-surface motion during draining.
Free-Surface Slosh
For those tests in which the draining parameter W/(B + 1)was in the range 0.11 to 1, the f ree surface exhibited a draining-induced axisymmetric slosh in the transition region (table II). As draining began, the interface distorted and the vertical distance
7
between the centerline and the wall contact point increased. This was followed by a rapid descent of the wall contact point and a slowing of the centerline motion or rate of descent. This type of behavior is clearly shown in figure 5 (and in fig. 3).
It is suggested in reference 8 that the dimensionless periods of the draining-induced, free-surface oscillations in both the capillary-dominated and transition regimes were constant and that their value depended on the Bond number, provided the Weber number was less than or equal to 1. It was anticipated that if the Weber number was much greater than 1, the waves would be present but would not be discernible except for very high initial f i l l levels, since the draining times would be shorter than the period of the waves. .-.
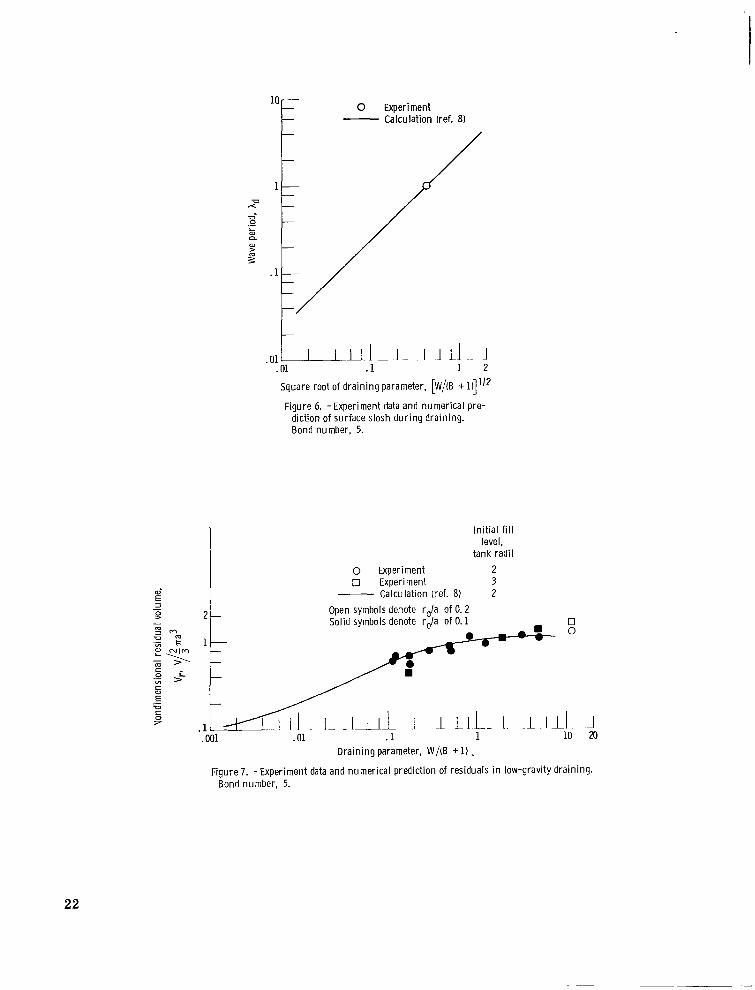
III reference 8, a predicted wave period (Ad = AQ/n-a') was plotted as a function of the square root of the draining parameter W/(B + 1). The resulting plots suggest that, if the period were replotted in terms of a sloshing time unit X* = Ad[(l+ B)/W 11/2, A* would be constant for any Bond number. At a Bond number of 5, A* was 2.4.
In attempting to determine the periods of the slosh waves experimentally, it was necessary to have both a relatively low value of the draining parameter (i.e., W/(B + 1) < 1)and a fairly high initial f i l l level (i.e., greater than 3 tank radii). This could only be achieved with rather long draining times, and thus it was only possible to obtain a single data point within these experiment constraints (test 15, table E). The single point was compared with the numerical predictions in figure 6, where Ad is plotted as a function of the square root of the draining parameter. The excellent agreement tended to support the conclusions posed in reference 8, with A* again being 2.4. In all other tests where draining-induced axisymmetric slosh was obtained in the transition regime, the number of slosh cycles observed was insufficient to determine the period.
Determination of Liquid Residuals
For purposes of this study, the liquid residual is defined as the quantity of liquid r e maining in the tank when vapor is initially ingested into the outlet line. Since the average outflow rate and the total draining time were known for each test, the quantity of liquid drained during a test could be calculated. Subtracting this quantity from the known initial volume contained in the tank determined the liquid residual.
The results of these calculations for each test a r e shown in figure 7 in nondimensional form as residual fractions Vr versus the draining parameter W/(B + 1). (The draining parameter was chosen primarily because previous experiment data (ref. 3) indicated that the liquid residuals tended to correlate with Weber number in weightlessness and with Froude number in normal gravity. ) The draining parameter does reduce to Weber number in weightlessness (since B = 0) and to Froude number in normal gravity (since B 2 1 and W/B = Fr). The solid line in figure 7 was determined by fair ing a
8
6
,
line through the numerical points from reference 8. The experiment points shown agree very well with the numerical results of reference 8. Further, it was anticipated that the outlet-line radius would not have any significant effect on the magnitude of liquid residuals except perhaps at very low Weber numbers, certainly much lower than those considered in this study. The data tend to support this contention since the experiment data (obtained for ro/a of 0.1 and 0.2) are scattered about the line drawn through the computed points (obtained for ro/a of 0.03 and 0.1).
On the other hand, initial f i l l level was expected to have a significant effect on liquid residuals in the draining- or inertia-dominated flow regime (i. e., for W >> 1). In general, at any constant Weber number, residuals might be expected to increase with increasing initial fill level in the inertia-dominated regime since liquid is simply withdrawn from the centermost portion of the tank and the initial contact point of the liquid-vapor interface at the tank wall remains essentially fixed. Hence, higher initial fill levels would give rise to longer and thicker wall sheets and, thus, greater residuals. In reference 8, only a single numerically computed data point was presented for the conditions previously noted (B = 5; W >> 1; initial value of z/a, 3.0). This data point could be compared with similar data for a lower initial f i l l level. That single data point, as well as two of the three experimental data points obtained for the same conditions (fig. 7), supported the contention that higher initial f i l l levels would result in greater liquid residuals in the inertia-dominated regime.
SUMMARY OF RESULTS
An experimental investigation of the vapor ingestion phenomenon in hemispherically bottomed cylindrical tanks was conducted in a low-gravity environment. Data were obtained for a 2 -centimeter -radius tank with either a 0.2 - or 0.4 -centimeter -radius outlet at a gravity level of 0.015 g using trichlorotrifluoroethane and for two initial fill levels (2 and 3 tank radii as measured in normal gravity). The experiment data were compared with the numerical results of Bizzell and Crane. The following conclusions were drawn:
1. The numerical methods of Bizzell and Crane accurately predict the movement of the liquid-vapor interface at both the tank centerline and the wall contact point during draining.
2. Two of three draining regimes predicted by Bizzell and Crane were observed: (a) An inertia-dominated draining regime, which is characterized by high
Weber numbers (or by W/(B + 1) > l), where B denotes Bond number and W denotes Weber number, and nearly constant -velocity draining as measured at the tank centerline
9
(b) A transition regime between inertia-dominated draining and capillary-dominated draining characterized by a few slosh waves of relatively large amplitude on the free surface during draining: (For the range of initial liquid volumes considered in this study, one or two waves were observed. ) Weber numbers in this regime were moderate. The regime exists for values of the draining parameter W/(B + 1) between 0. 11 (the smallest value obtained in this study) and 1.
(c) A capillary -dominated draining regime characterized by many slosh waves of small amplitude was predicted from the numerical results of Bizzell and
4
Crane, but limitations in the available test time precluded its experimental observation in the present study.
3. The periods of the draining-induced slosh waves were predicted by Bizzell and Crane to be constant for a given Bond number when normalized to the sloshing time scale. The value of the constant at a Bond number of 5 was determined to be 2.4 from the experiment data. This was precisely the value predicted in the numerical study.
4. Liquid residuals were correlated in terms of the draining parameter W/(B + 1). Residuals generally increased with Weber number in the transition regime and became nearly constant in the inertia-dominated draining regime.
5. Drain radius had no apparent effect on liquid residuals over the range of parameters included in this study.
6. Limited available data indicated that, at a constant value of the draining parameter, liquid residuals tended to increase with initial f i l l level in the inertia-dominated regim e.
7. In general, the numerical predictions and correlations of Bizzell and Crane agreed very well with the experiment data obtained in this study and can thus be used to predict low-gravity draining behavior.
Lewis Research Center, National Aeronautics and Space Administration,
Cleveland, Ohio, May 4, 1978, 506-21.
10
I
APPENDIX - APPARATUS AND PROCEDURE
Test Facility
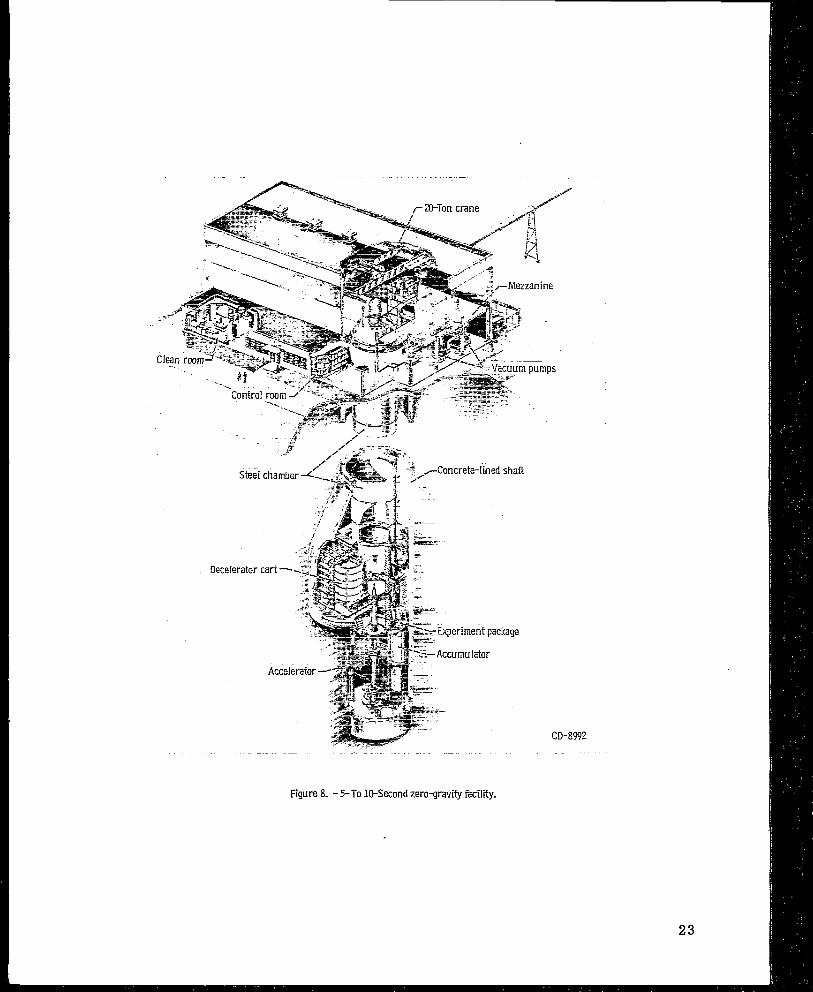
The experiment data for this study were obtained in the 5- to 10-second zero-gravity facility at the Lewis Research Center. A schematic diagram of this facility is shown in figure 8: A concrete-lined 8.5-meter-diameter (28-ft-diam) shaft extends 155 meters
1
(510 ft) below ground level. A steel vacuum chamber 6.1 meters (20 f t ) in diameter and 143 meters (470 ft) high is contained within the concrete shaft. The pressure in this
t atm) by using the Center's wind tun-vacuum chamber is reduced to 13.3 N/m 2 (1.3 ~ 1 0 - ~ nel exhaust system and an exhauster system in the facility.
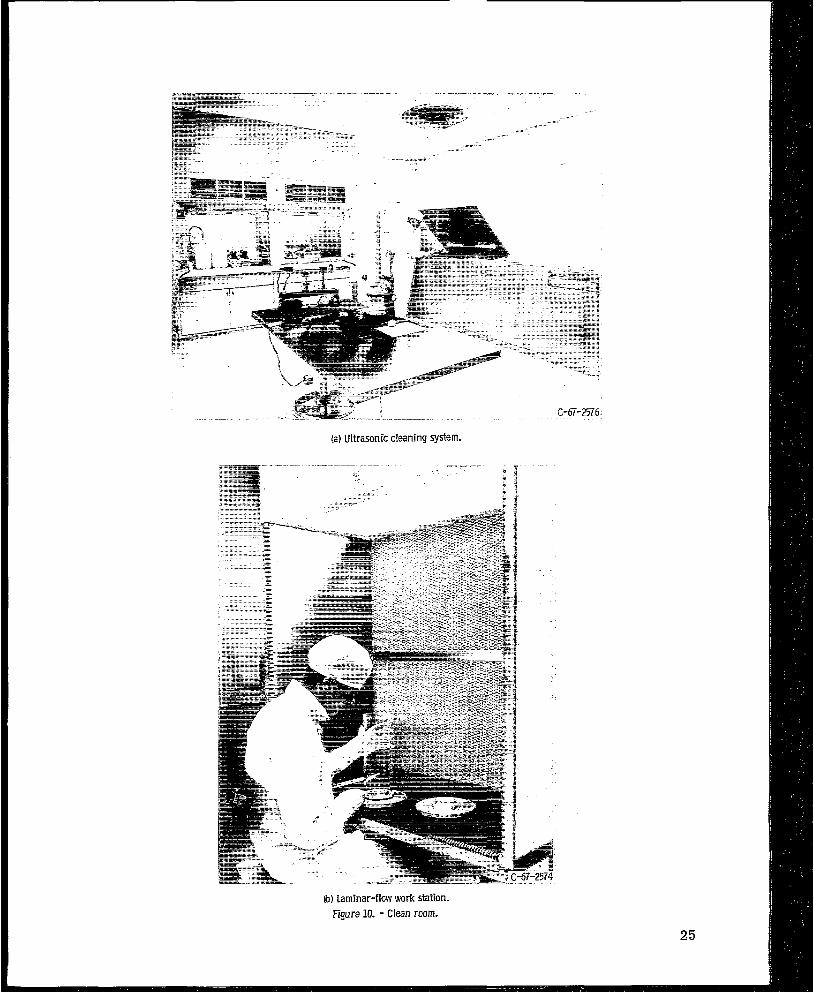
The ground-level service building has, as its major elements, a shop area, a control room, and a clean room. The experiment vehicle is assembled, serviced, and balanced in the shop area. Tests are conducted from the control room (fig. 9), which contains the exhauster control system, the experiment-vehicle predrop checkout and control system, and the data retrieval system. Those components of the experiment that are in contact with the test fluid are cleaned and assembled in the facility's class-10 000 clean room. The major elements of the clean room are an ultrasonic cleaning system (fig. 10) and a class -100 laminar -flow work station for preparing those experiments requiring more than normal cleanliness.
Mode of operation. - The zero-gravity facility can operate in two modes: One mode allows the experiment vehicle to free-fall from the top of the vacuum chamber and results in nominally 5 seconds of free-fall time. The second mode propels the experiment vehicle upward from the bottom of the vacuum chamber by means of a high-pressure pneumatic accelerator located on the vertical axis of the chamber. The total up-anddown trajectory of the experiment vehicle in the second mode results in nominally 10 seconds of free-fall time. The 5-second mode of operation was used for this experimental study.
In either mode of operation, the experiment vehicle falls freely; that is, no guide wires, electrical lines, etc. , are connected to the vehicle. Therefore, the only force (aside from gravity) acting on the freely falling experiment vehicle is residual air drag. Since the shaft is evacuated to minimize the effect of air drag, the resultant equivalent
-5gravitational environment acting on the experiment is estimated to be about 10 g maximum.
Recovery system. - After the experiment vehicle has traversed the total length of the vacuum chamber, it is decelerated in a 3, 6-meter- (12-ft-) diameter, 6. l-meter(20-ft-) deep container that is located on the vertical axis of the chamber and filled with small pellets of expanded polystyrene. The deceleration rate (averaging 32 g's) is controlled by the flow of pellets through the area between the experiment vehicle and the wall
11
of the deceleration container. The deceleration container is mounted on a car t that can be retracted so that the 10-second mode of operation can be used. In that mode, the cart is deployed after the experiment vehicle is propelled upward by the pneumatic accelerator. The deceleration container mounted on the car t is shown in figure 11.
Experiment Vehicle
The experiment vehicle used to obtain the data for this study is shown in figure 12. The overall vehicle height (exclusive of the support shaft) is 3.0 meters (9. 85 ft) and the largest diameter is 1.06 meters (3. 5 ft). The vehicle consists of a telemetry system in the aft fairing, an experiment package in the cylindrical midsection, and a thrust system in the conical base.
Telemetry system. - The on-board telemetry system that is used to record pressure..
data is a standard Inter -Range Instrumentation Group (RIG) FM/FM 2200-megahertz telemeter. It is used during a test drop to record as many as 18 channels of continuous data. The system has a maximum frequency of 2100 hertz. The telemetered data a re recorded on two high-response recording oscillographs located in the control room.
Experiment package. - The experiment package, shown in figure 13, is a self-contained unit consisting of an experiment tank, a pressurizing and liquid flow system, a photographic and lighting system, a digital clock, and an electrical system to operate the various components. A pressurant-gas reservoir, the experiment tank, an orifice, a solenoid valve, a drag-body flowmeter, and a fluid collection tank a r e connected to form the liquid flow system. Indirect illumination of the experiment tank provides enough light that the behavior of the liquid -vapor interface during draining can be r e -corded with a high-speed, 16-millimeter motion-picture camera. A clock with a calibrated accuracy of 0.01 second is positioned within the camera's f i e ld of view to show
the elapsed time during the drop. The electrical components in the experiment package a re operated through a control box and receive their power from rechargeable nickel-cadmium cells. Differential pressure across a flow orifice is maintained by a pressure regulator during the outflow process and is continuously recorded by telemetry.
Thrust system. - The conical base of the experiment vehicle contains the cold-gas (nitrogen) system, which can produce thrusts of 13 to 130 newtons (2.92 to 29.2 Ibf) for 5 seconds o r longer. The acceleration was calculated from the calibrated thrust and the known package weight. For the package used in this study a maximum gravitational environment of 0 . 0 1 5 g could be obtained. Before the experiment vehicle was installed, the thrust system was calibrated on a static thrust calibration stand in the facility vacuum chamber. This calibration was conducted at pressure levels corresponding to test drop conditions. A null-balance, load-cell system was used to record the thrust-time history
.,
12
I
as a function of thrust-nozzle inlet pressure and nozzle size during each drop of the experim ent package.
Test Procedure
The test container was cleaned ultrasonically before each test in the facility's clean * room (fig. 10). The cleaning procedure consisted of ultrasonic immersion in a solution
of detergent and water, rinsing with a solution of distilled water and methanol, and dry-* ing in a warm -air dryer.
The containers were then mounted in the experiment package, and liquid was added to f i l l the tank to the desired level. (Liquid f i l l levels of 2 o r 3 tank radii, as measured in normal gravity, were used in this study. ) The air reservoirs were pressurized, and a normal-gravity draining test was conducted to establish the desired flow rate. This normal -gravity test was recorded on film so that the liquid-vapor interface displacement as a function of time at the set accumulator pressure could be determined. From this test, the velocity of the interface (and hence the liquid outflow rate) was determined. It was assumed that, for a particular air reservoir pressure, the liquid flow rate in low gravity would be the same as that in normal gravity. Since the liquid head was negligible in comparison to the accumulator pressure, the assumption was justified. Additionally, the liquid flow rate was measured with a drag-body flowmeter both in normal and low gravity.
After all predrop functions were properly set, the experiment vehicle was positioned at the top of the vacuum chamber as shown in figure 14. It was suspended by the support shaft on a hinged-plate release mechanism. During vacuum chamber pumpdown and before vehicle release, the experiment -vehicle system was monitored through an umbilical cable that was remotely disconnected from the support shaft 0. 5 second before vehicle release. The thrust system was activated 0.2 second before release to allow the thrust to reach steady-state conditions. The vehicle was released by pneumatically shearing a bolt that holds the hinged plate in the closed position. No measurable disturbances were imparted to the experiment by this release system.
During a drop, as much time as possible (determined by the flow rate and the initial fluid volume in the tank) was allowed before draining was begun so that the interface was as nearly quiescent as possible within the test constraints. At this t ime, draining was begun by opening a solenoid valve and was continued until vapor was ingested into the tank outlet. Electrical t imers on the experiment vehicle were adjusted to control the start as well as the duration of draining. The experiment vehicle was balanced about its vertical axis to insure an accurate drop trajectory and to aline the thrust with the vertical axis of the experiment tank. Accurate thrust alinement was essential for an axisymmetric, equilibrium liquid -vapor interface.
13
The total free-fall test t ime obtained in this mode is 5.16 seconds. Approximately 0.1 second before the experiment package enters the deceleration cart, the thrust system is shut down to avoid dispersing the deceleration material and the solenoid valve is closed to avoid excess pumping of pressurant gas into the collector tank. Throughout the test, the vehicles trajectory and deceleration a re monitored on closed-circuit television. Following the test drop, the vacuum chamber is vented to the atmosphere and the experiment vehicle is returned to ground level (fig. 15).
14
REFERENCES
1. Derdul, Joseph D. ; Grubb, Lynn S. ; and Petrash, Donald A. : Experimental Investigation of Liquid Outflow from Cylindrical Tanks During Weightlessness. NASA TN D-3746, 1966.
2. Abdalla, Kaleel L. ; and Berenyi, Steven G. : Vapor Ingestion Phenomena in Weightlessness. NASA TN D-5210, 1969.
3. Berenyi, Steven G. ; and Abdalla, Kaleel L.: Vapor Ingestion Phenomenon in Hemispherically Bottomed Tanks in Normal Gravity and in Weightlessness. NASA T N D-5704, 1970.
4. Gluck, D. F. ; et al. : Distortion of the Liquid Surface During Tank Discharge Under Low GConditions. Chem. Eng. Progr. Symp. Ser . , vol. 62, no. 61, 1966, pp. 150-157.
5. Lubin, Barry T. ; and Hurwitz, Mathew: Vapor Pull-Through at a Tank Drain With and Without Dielectrophoretic Baffling. Proceedings of the Conference on Long Term Cryo-Propellant Storage in Space, NASA Marshall Space Flight Center, Huntsville, Ala. , Oct. 1966, pp. 173-180.
6. Orbital Refueling and Checkout Study. Vo1.3: Evaluation of Fluid Transfer Modes, Part 2. (TI-51-67-21, vol. 3, pt. 2, Lockheed Missiles and Space Co. ; NASA Contract NAS10-4606. ) NASA CR-93237, 1968.
7. Bizzell, G. D. ; et al. : Low Gravity Draining from Hemispherically Bottomed Cylindrical Tanks. (LMSC-A903128, Lockheed Missiles and Space Co. ; NASA Contract NAS3-11526. ) NASA CR-72718, 1970.
8. Bizzell, G. D. ; and Crane, G. E. : Numerical Simulation of Low Gravity Draining. (LMSC-D521581, Lockheed Missiles and Space Co. ;NASA Contract NAS3-17798. ) NASA CR-135004, 1976.
15
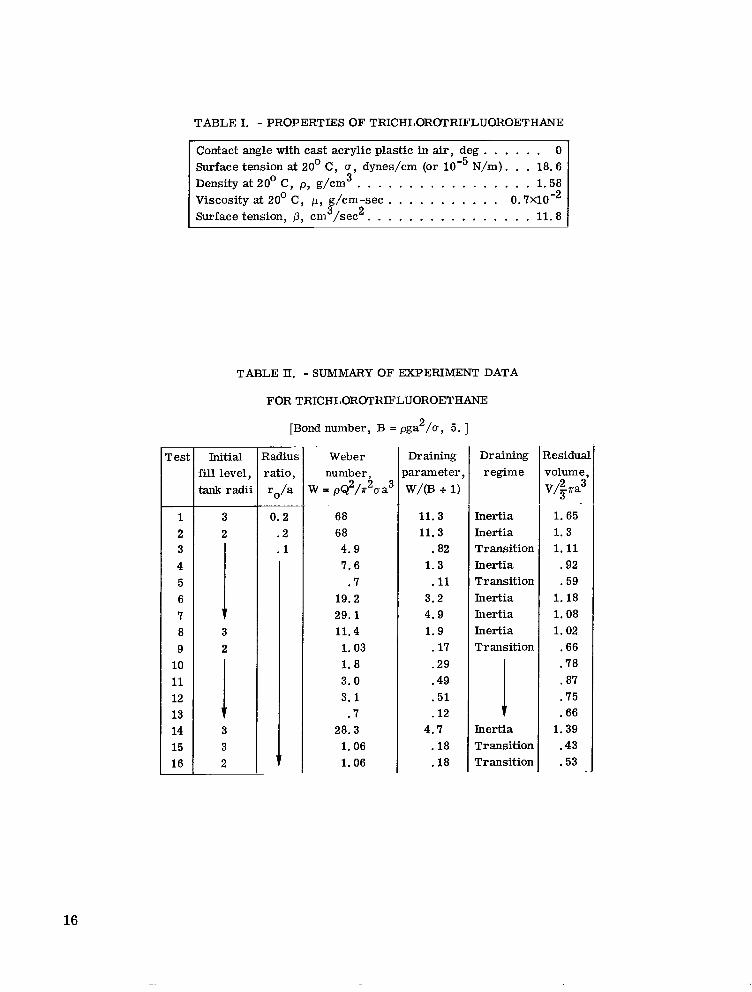
TABLE I. - PROPERTIES OF TRICHLOROTRIFLUOROETHANE
Contact angle with cast acrylic plastic in air, deg . . . . . . 0 Surface tension at 20' C, u, dynes/cm (or N/m). . . 18.6 Density at 20' C, p, g/cm 3 . . . . . . . . . . . . . . . . . 1.58 Viscosity at 20' C, p, g/cm-sec . . . . . . . . . . . 0. 7X10⁻² Surface tension, 0 , cm3/sec 2 . . . . . . . . . . . . . . . . 11.8
TABLE II. - SUMMARY OF EXPERIMENT DATA
FOR TRICHLOROTRIFLUOROETHANE
[Bond number, B = pga2/u, 5. ]
-rest Initial Radius Weber Draining Draining Residua
�illlevel, ratio, number, ?mameter: regime volume, 2tank radii ro/a W = pQ2/r2aa' w/(B + 1) V / p a 3
-1 68 11.3 Inertia 1.65 2 68 11.3 Inertia 1.3 3 4.9 .a2 Transition 1.11 4 7.6 1.3 Inertia .92 5 .7 .11 Transition .59 6 19.2 3.2 Inertia 1.18 7 29.1 4.9 Inertia 1.08 a 11.4 1.9 Inertia 1.02 9 1.03 .17 Transition .66
10 1.8 .29 .78 11 3.0 .49 .87 12 3.1 .51 .75 13 .7 .12 1 .66 14 28.3 4.7 Inertia 1.39 15 1.06 .18 Transition .43 16 1.06 .18 Transition .53 -
16
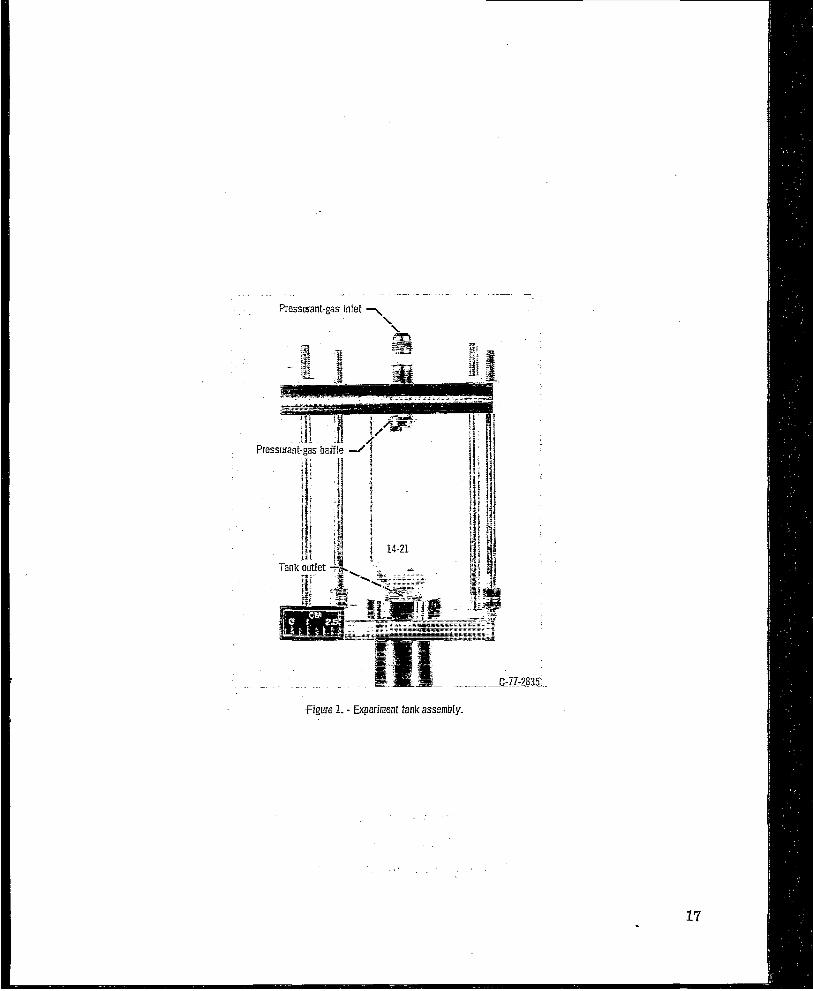
Pres
Figure 1. - Experiment tank assembly.
J= 07
lllllllllllIIl I 1 I I I I I 1 I 1
Critical _--------height, h c r 7 ,--Interface height
/ I,' awayfrom drain center1ine -../\,, .-Vapor i ngesti on-
Vapor ingestion -, height, hvi I . -
(a) Normal gravity.
- In i t ia l f i l l ing--- ___ -_-__
----_----Centerline -'
Vapor ingestion -..
Init ia l liquid-vapor interface
Liqu id-vapor interface at dip formation
Liquid-vapor interface at vapor ingestion
----
In i t ia l normal-gravity interface Ini t ia l low-gravity interface
Liquid-vapor interface at dip formation
Liquid-vapor interface at vapor ingestion
In i t ia l normal-gravity interface! + . -
(c) Low gravity - capillary-dominated regime.-I -
Centerline Vapor ingestion
1J (d) Low gravity - transi t ion regime.
Draining time -Figure 2. - Vapor ingestion phenomenon.
18
(b) Low qravity - inertia-dominated regime." -Ini t ia l low-gravity interface
Interface dur ing draining would have high-frequency, low-amp1itude slosh
Liqu id-vapor interface at vapor ingestion
In i t ia l normal-gravity interface Ini t ia l low-gravity interface
Liquid-vapor interface depicting axisymmetric slosh Liquid-vapor interface at vapor ingestion
, .-
c
(a) Normal gravity. (b) Start of draining in low gravity.
. . ' , f $
(c) Interface flattens (first slosh wave forms). (d) Interface reforms.
(e) Interface flattens (second slosh wave forms). (f) Vapor ingestion.
Figure 3. - Vapor ingestion in low gravity - transition regime (test 15, tableII). Bond number, 5; Weber number, 1.06; initial f i l l level, 3 tank radii; test I iquid, trichlorotrifluoroethane.
19
(a) Normal gravity.
(6) Start of draining.
(c) Vapor ingestion.
Figure 4. - Vapor ingestion in low gravity - inertia regime (test 2, tabIe Q. Bond number, 5; Weber number, 68; initial f i l I level, 2 tank radii; test liquid, trichlorotrifluoroethane.
20
---
0 Experiment Calculation (ref. 8)
0 Experiment Calculation (ref. 8)
I
Weber In i t ia l fill number, level
W in normal gravity,
tank radii
1.06 2 1.0 2 1.06 3 1.0 3
-
I I .5 1.0
Outlet-l ineto tank-radius ratio, ro/a
1/10 1/30 1/10 1/10
I -u1.5 2.0 2.5
Nondimensional t ime from start of draining, t = QUna3
ra) Test 16 (table 11). ib) Test 15 (table 11).
Figure 5. -Experiment data and numerical predictions for free-surface motion.
21
3.0
0 Experiment Calculation (ref. 8)
c Square root of draining parameter, [W/(B i.,)I1" Figure 6. -Experiment data and numerical pre
diction of surface slosh dur ing draining. Bond number, 5.
In i t ia l f i l l level,
tank radi i o Experiment 2 0 Experiment 3
E Calculation (ref. 8) 2 3-9 2 - Open symbols denote ro/a of 0.2
22
~
Figure 8. -!+To LO-Secondzeroqravi�yfacility
23
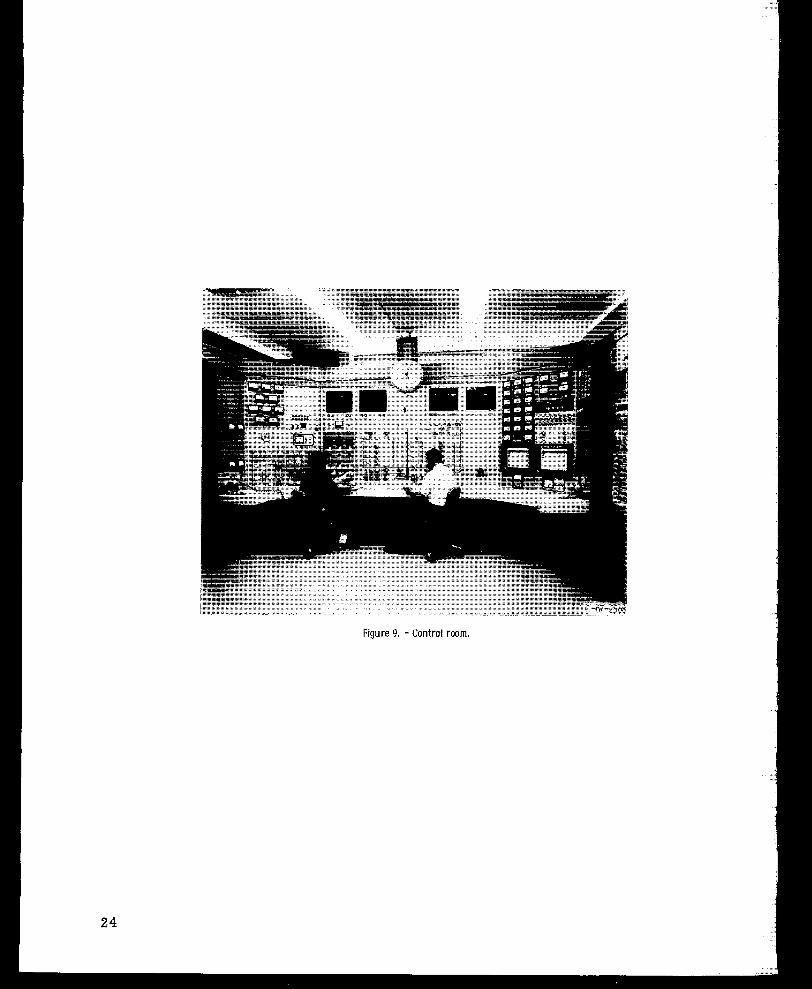
Figure 9. - Control room.
-" . .. . ?_ -_.. - . ,.
.~,
..... .....- ..
(a) Ultrasonic cIeaning system.
(6) laminar-flow work station. Figure 10. - Clean room.
25
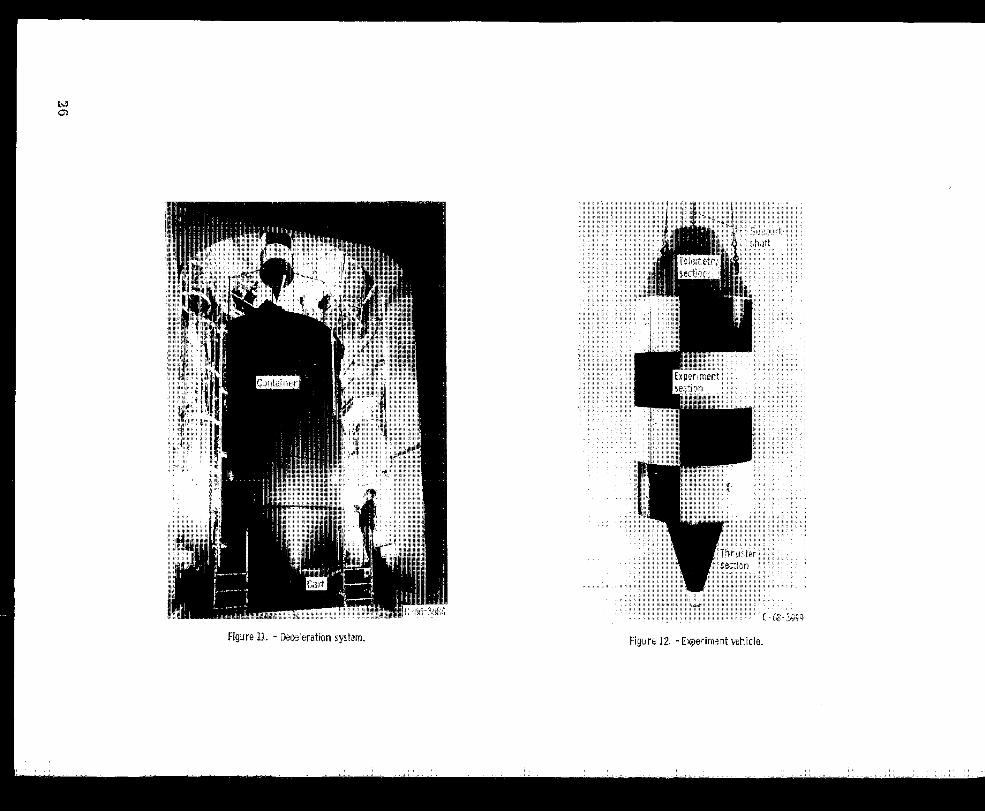
Figure 11, - kceleration system. FiqLire 12, -Experiment vehicle.
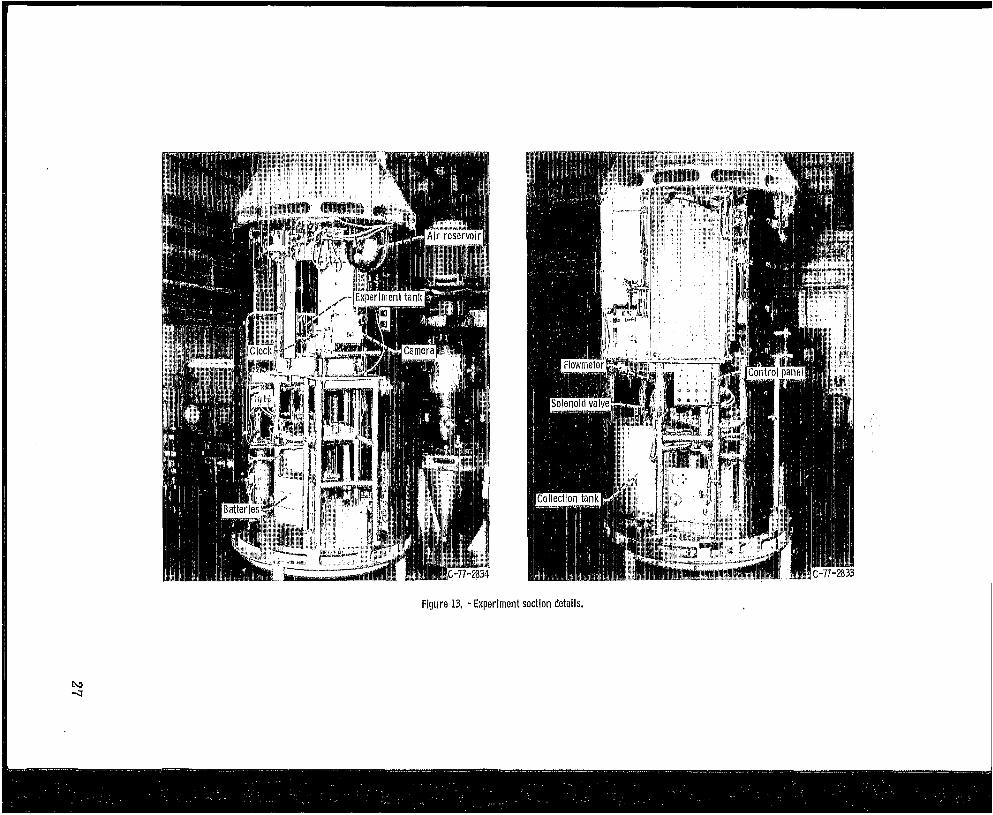
Figure 13, -Experiment section details,
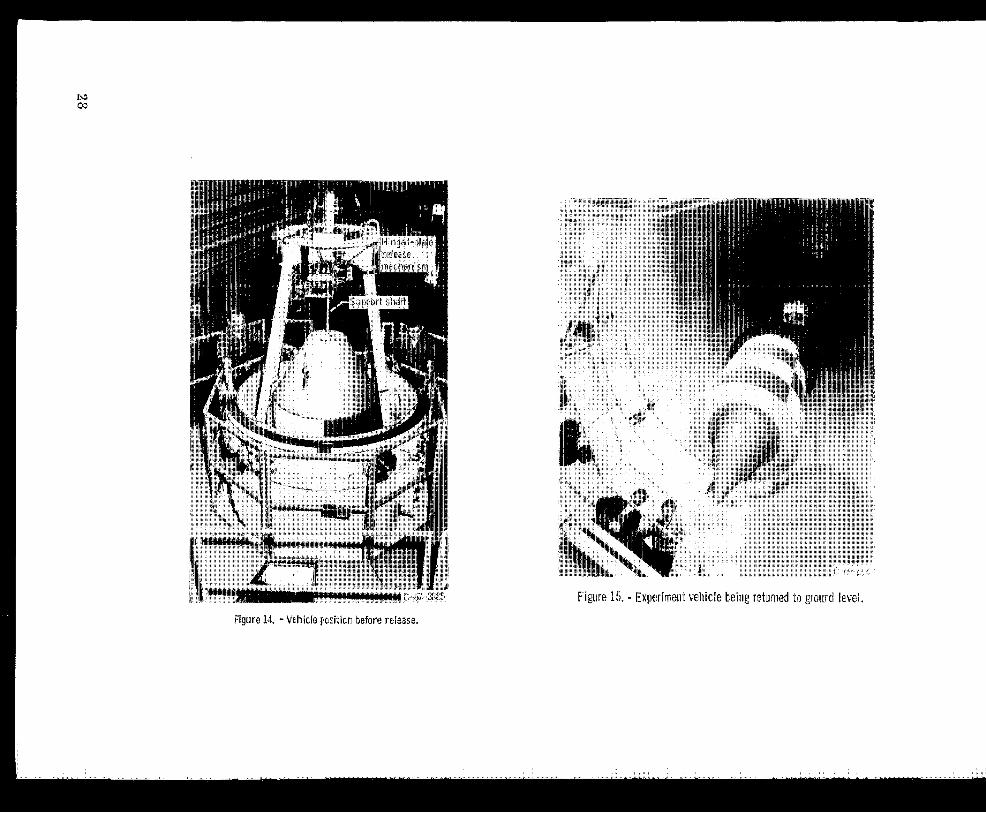
Figure 15, - Experiment vehicle being returned %ograiecud level.
Figure 14, - Vfihicle position Refore release.
--
~- __ 1 Report No I 2 Government Accession No
NASA T P -1297 I 4 Title and Subtitle
DRAINING CHARACTERISTICS OF HEMISPHERICALLY BOTTOMED CYLINDERS IN A LOW-GRAVITY ENVIRONMENT
7 Author(s)
Eugene P. Symons
9 Performing Organization Name and Address
National Aeronautics and Space Administration Lewis Research Center Cleveland, Ohio 44135
12 Sponsoring Agency Name and Address
National Aeronautics and Space Administration Washington, D. C. 20546
15. Supplementary Notesr _ _ 16 Abstract
3. Recipient's Catalog No
5. Report Date August 1978
6. Performing Organization Code
8. Performing Organization Report No. E -9582
-IO. Work Unit No.
506-21
11. Contract or Grant No
13. Type of Report and Period Covered
Technical Paper - .
14. Sponsoring Agency Code
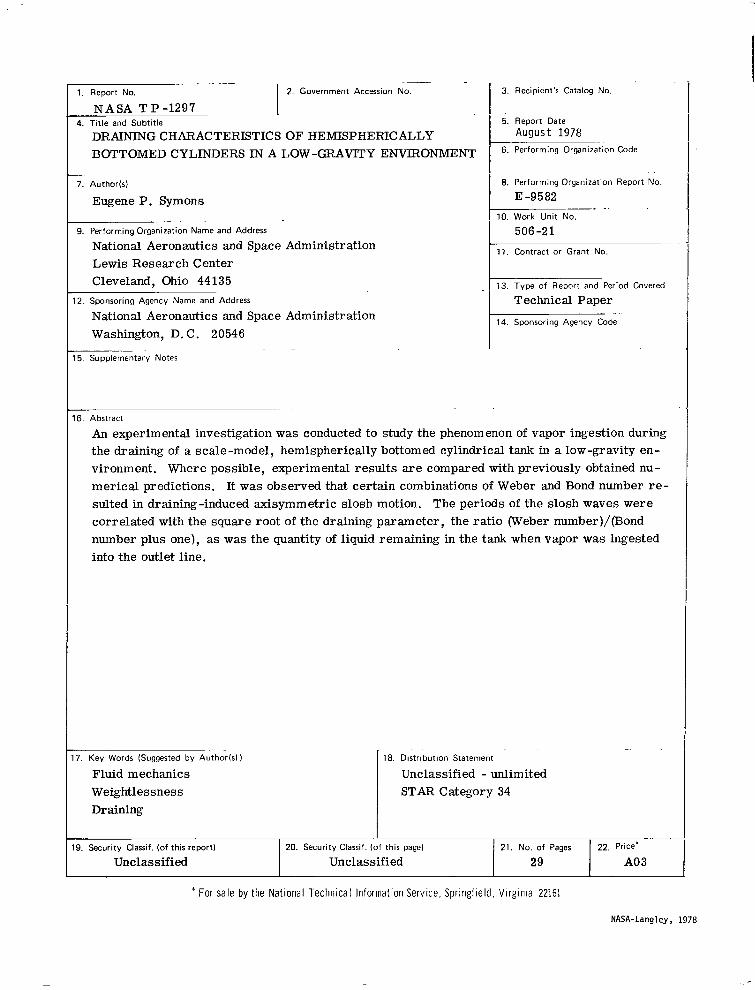
An experimental investigation was conducted to study the phenomenon of vapor ingestion during the draining of a scale-model, hemispherically bottomed cylindrical tank in a low-gravity environment. Where possible, experimental results a r e compared with previously obtained numerical predictions. It was observed that certain combinations of Weber and Bond number r e sulted in draining-induced axisymmetric slosh motion. The periods of the slosh waves were correlated with the square root of the draining parameter, the ratio (Weber number)/(Bond number plus one), as was the quantity of liquid remaining in the tank when vapor was ingested
17. Key Words (Suggested by Author(s1) 18. Distribution Statement
Fluid mechanics Unclassified - unlimited Weightlessness STAR Category 34 Draining
19. Security Classif. (of this report) 20. Security Classif. (of this page) 21. NO. of Pages 22. Price'
Unclassified Unclassified 29 A0 3
* For sale by the National Technical information Service, Springfield. Virginia 22161
NASA-Langley, 1978
National Aeronautics and THIRD-CLASS BULK RATE Space Administration
Washington, D.C. 20546 Official Business
Penalty for Private Use, $300
3 1 7 U , D , o m 4 7 a
DEFT OF THE A I R FORCE BF UEkPONS LABORATORY ATTN: TECHNICAL LTBRABY K I R T L A N D APB NP! 87117Nns
Postage and Fees Paid National Aeronautics and Space Administration NASA451
i I'I
I,If Undeliverable (Section 158 Postal Manual) Do Not Return