Drainage Basin. Mississippi River Basin Drainage Basin.
22
Drainage Basin
-
Upload
alan-newton -
Category
Documents
-
view
311 -
download
0
Transcript of Drainage Basin. Mississippi River Basin Drainage Basin.
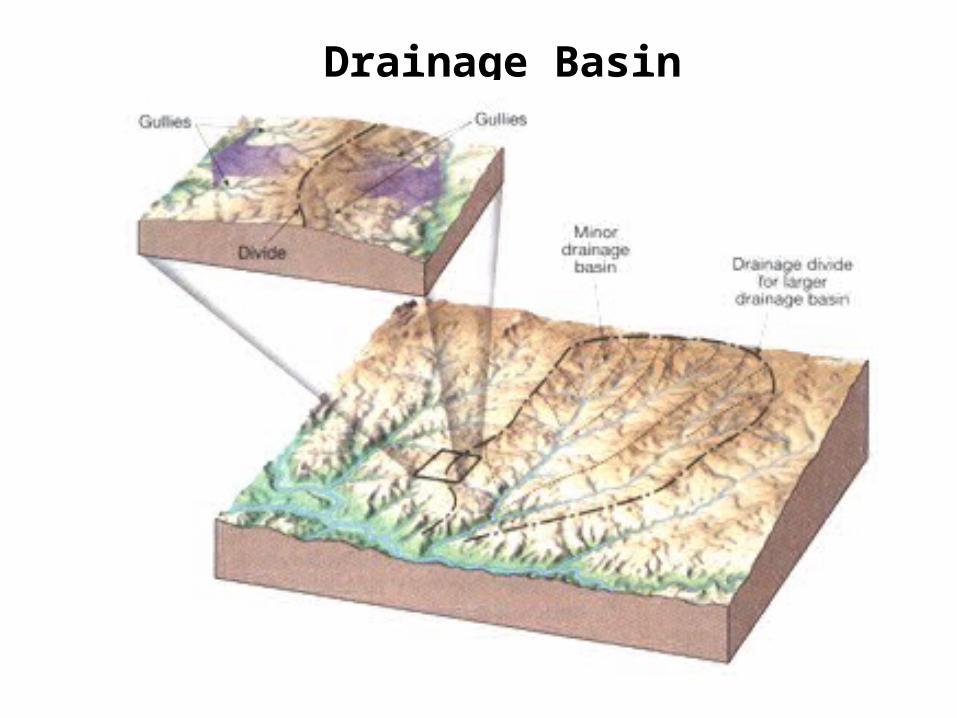
Drainage Basin
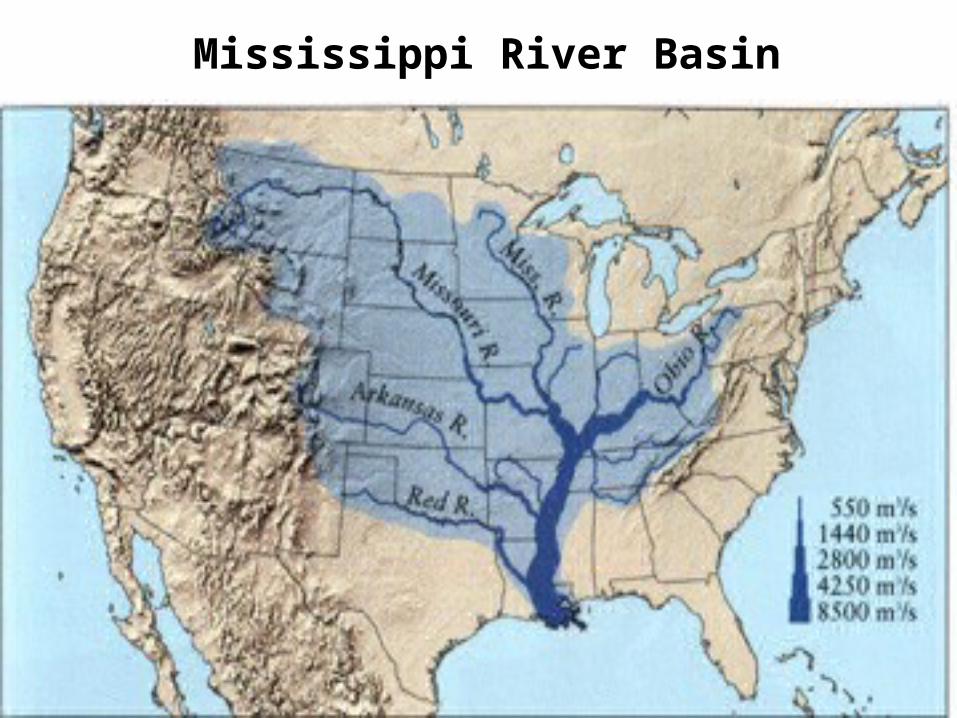
Mississippi River Basin
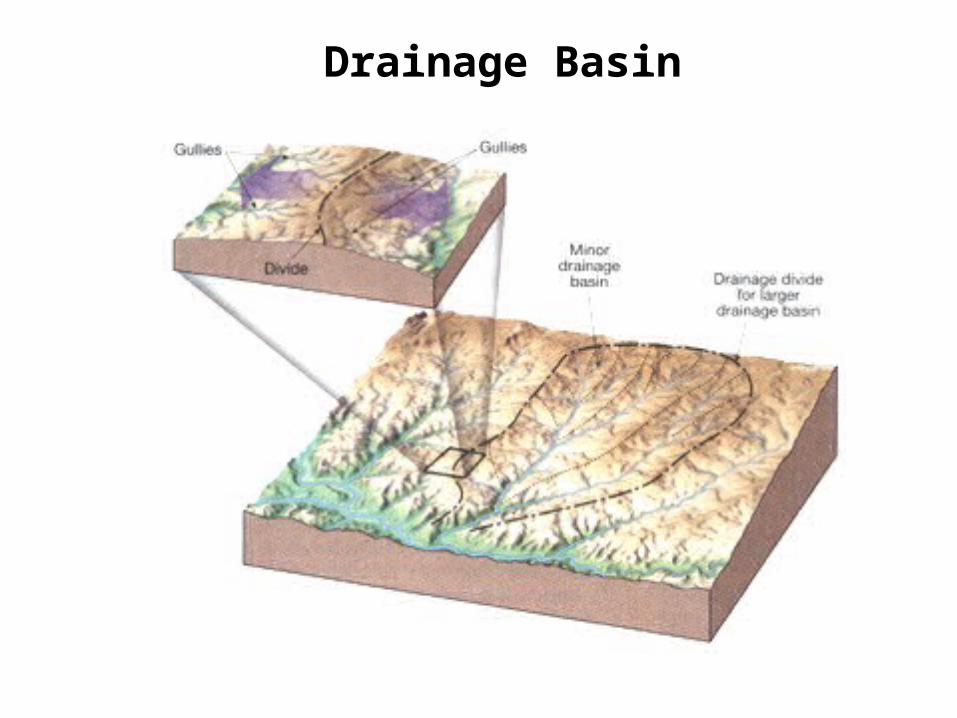
Drainage Basin
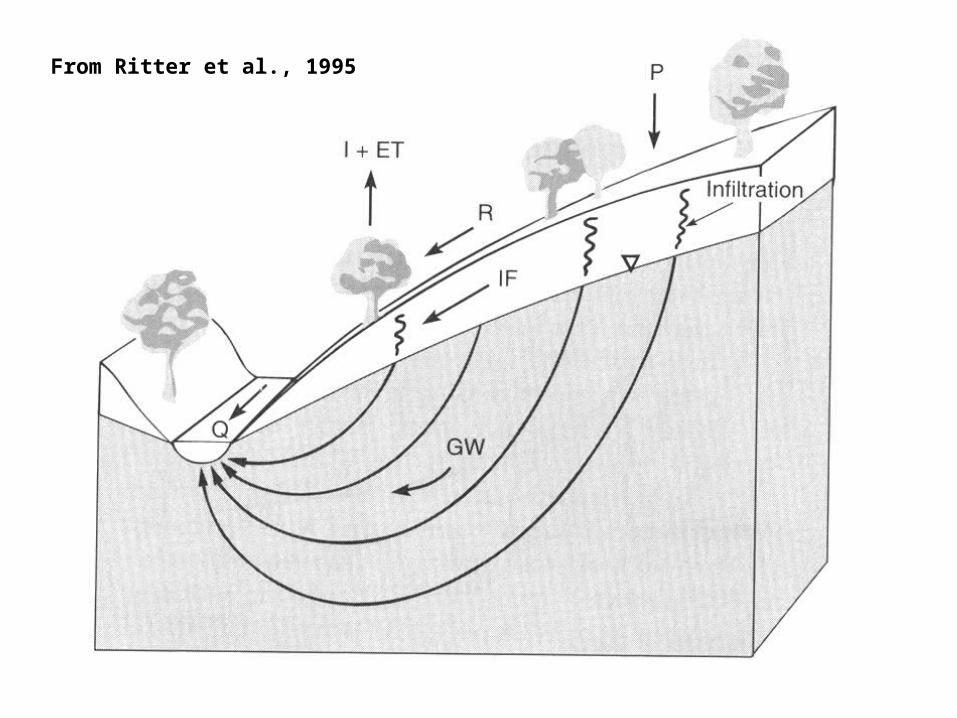
From Ritter et al., 1995
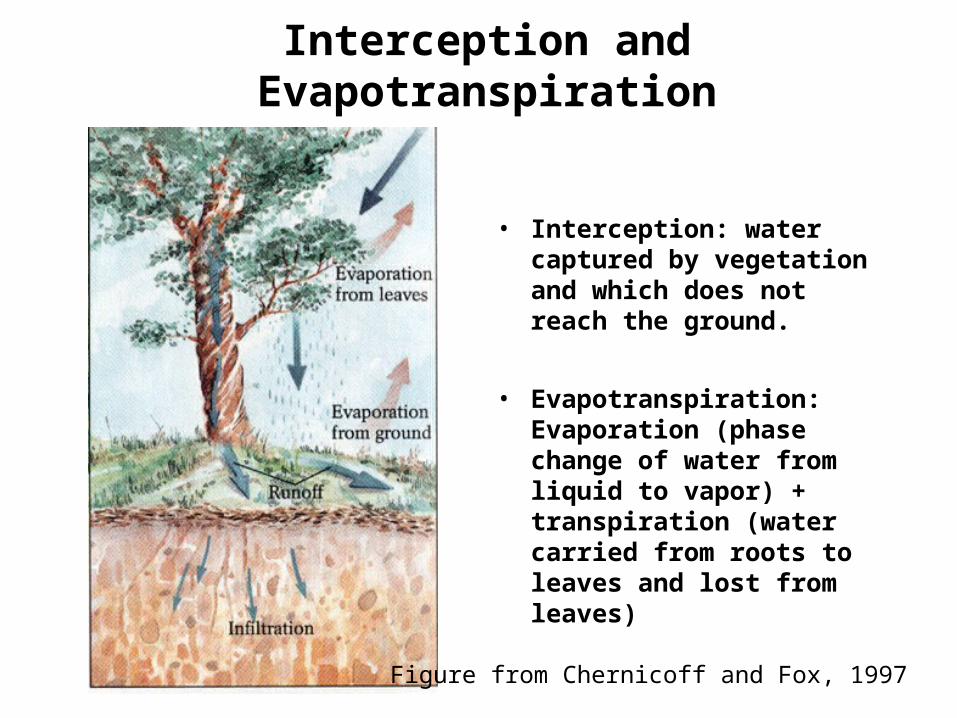
Interception and Evapotranspiration
• Interception: water captured by vegetation and which does not reach the ground.
• Evapotranspiration: Evaporation (phase change of water from liquid to vapor) + transpiration (water carried from roots to leaves and lost from leaves)
Figure from Chernicoff and Fox, 1997
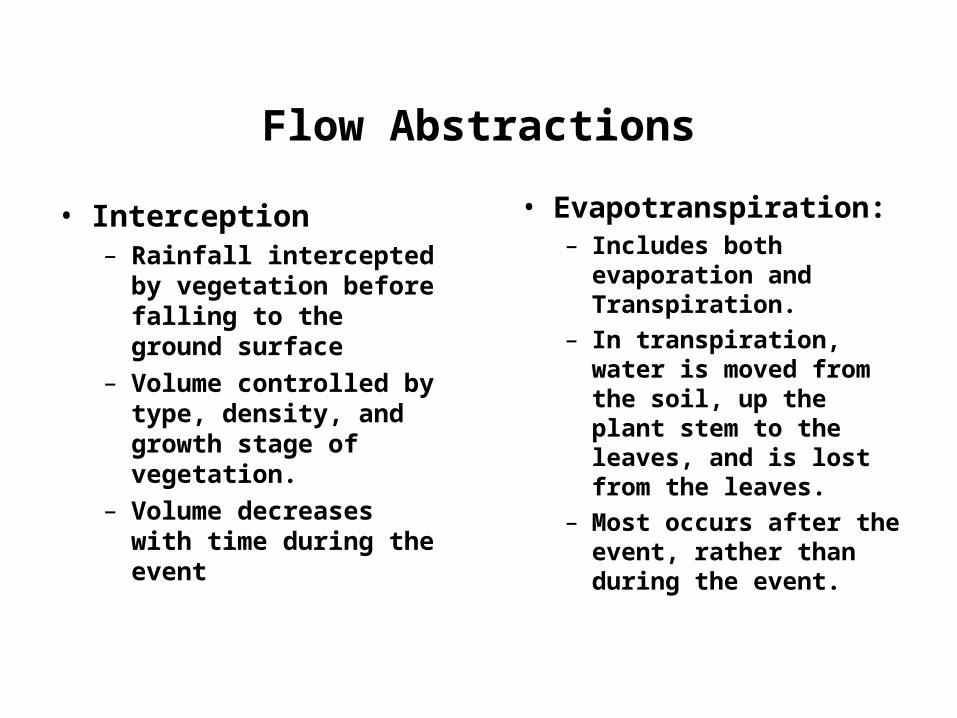
Flow Abstractions
• Interception– Rainfall intercepted by
vegetation before falling to the ground surface
– Volume controlled by type, density, and growth stage of vegetation.
– Volume decreases with time during the event
• Evapotranspiration:– Includes both
evaporation and Transpiration.
– In transpiration, water is moved from the soil, up the plant stem to the leaves, and is lost from the leaves.
– Most occurs after the event, rather than during the event.
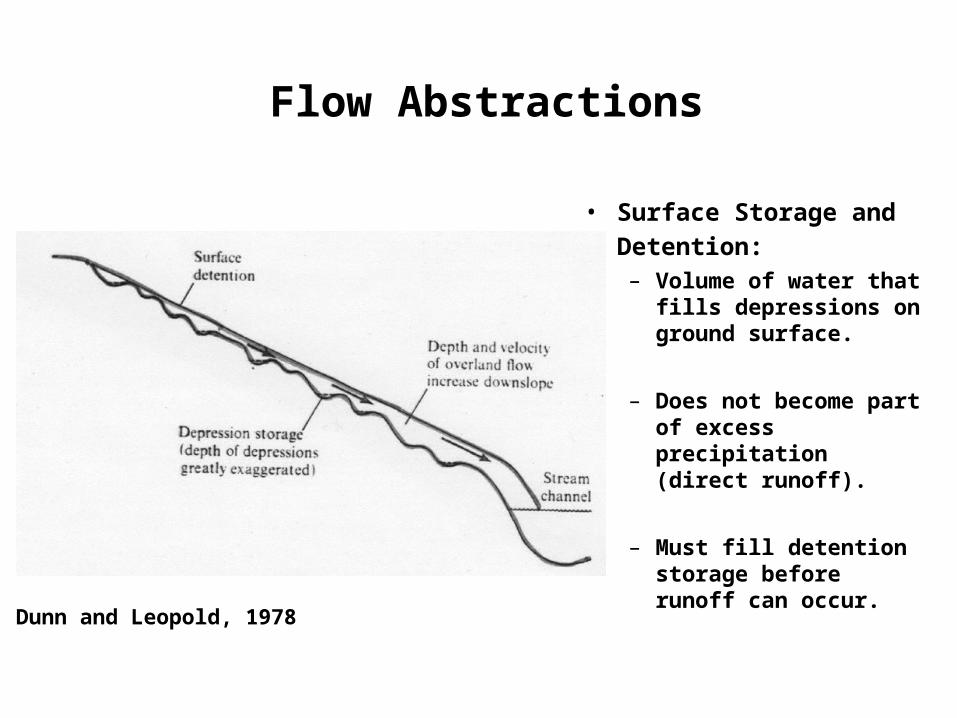
Flow Abstractions
• Surface Storage and
Detention: – Volume of water that
fills depressions on ground surface.
– Does not become part of excess precipitation (direct runoff).
– Must fill detention storage before runoff can occur.
Dunn and Leopold, 1978
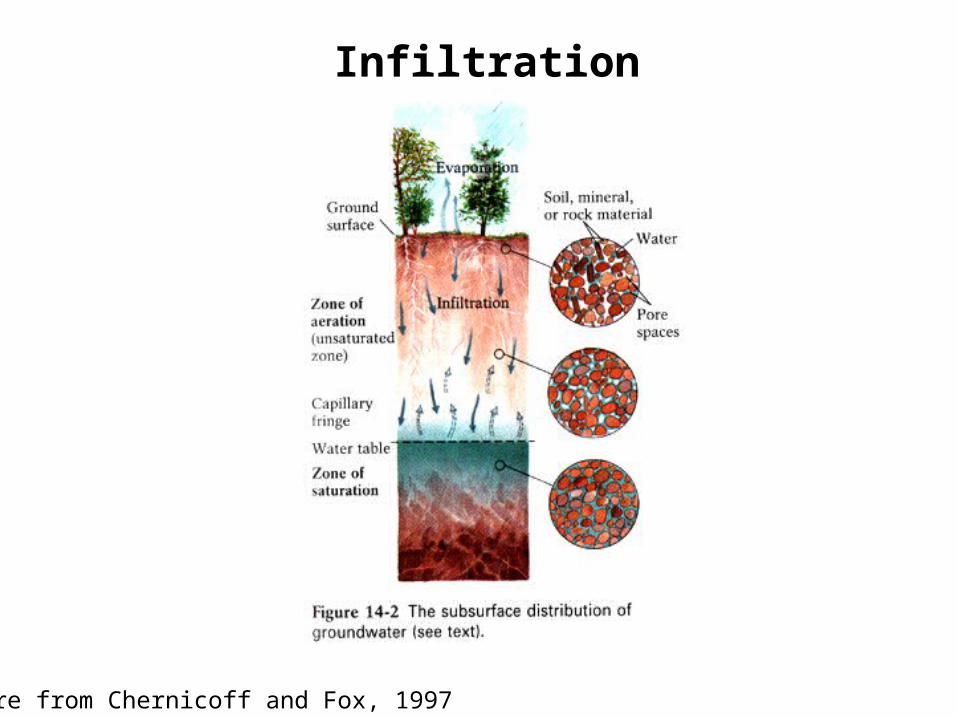
Infiltration
Figure from Chernicoff and Fox, 1997
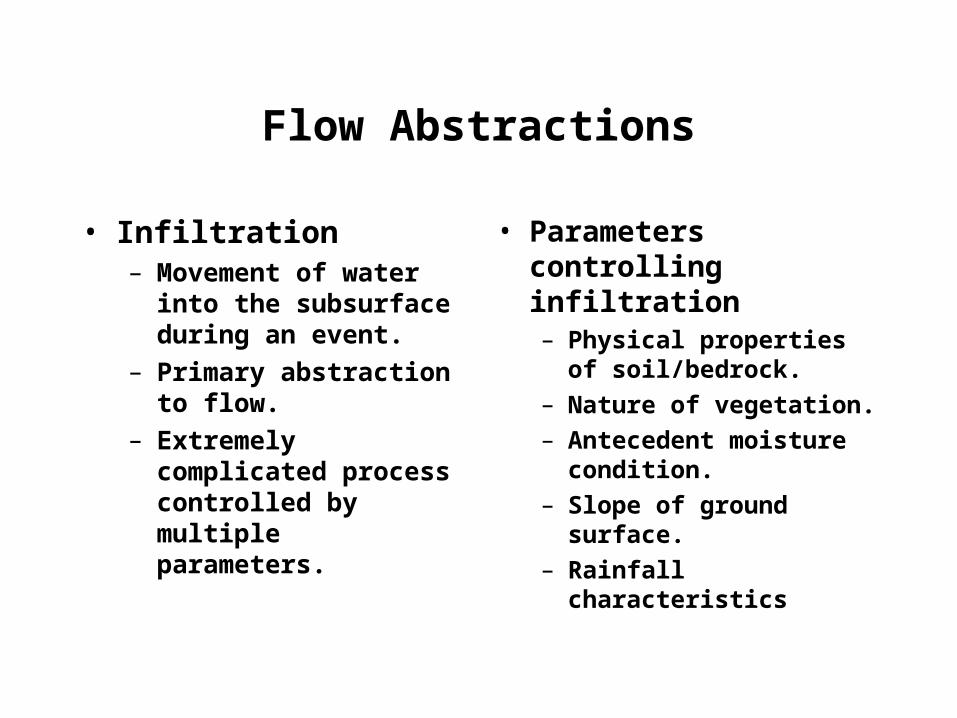
Flow Abstractions
• Infiltration– Movement of water into
the subsurface during an event.
– Primary abstraction to flow.
– Extremely complicated process controlled by multiple parameters.
• Parameters controlling infiltration– Physical properties of
soil/bedrock.– Nature of vegetation.– Antecedent moisture
condition.– Slope of ground
surface.– Rainfall characteristics
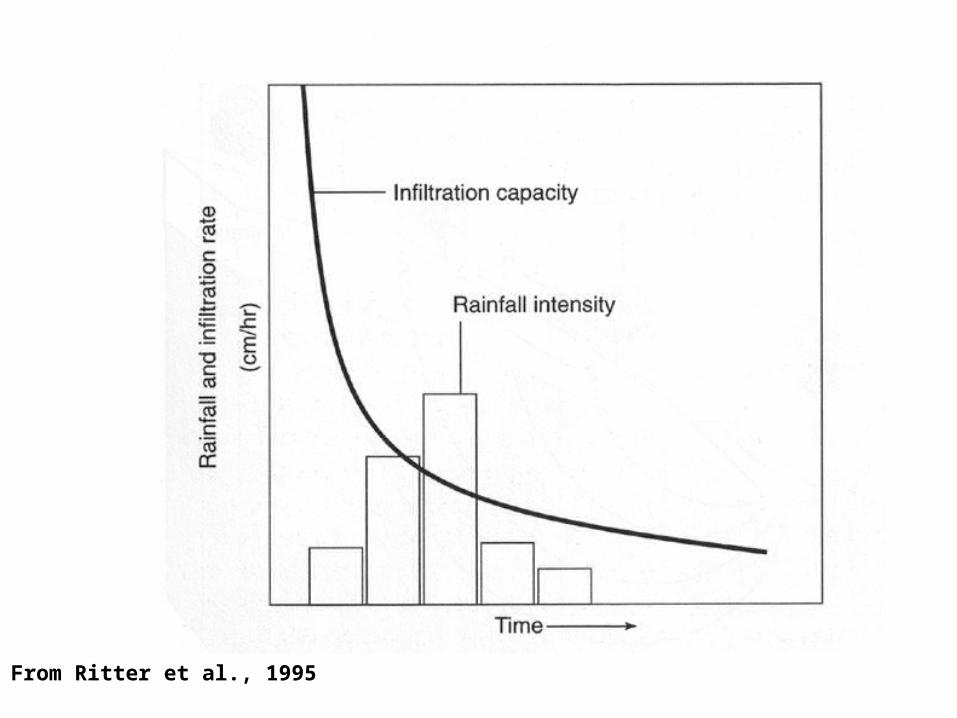
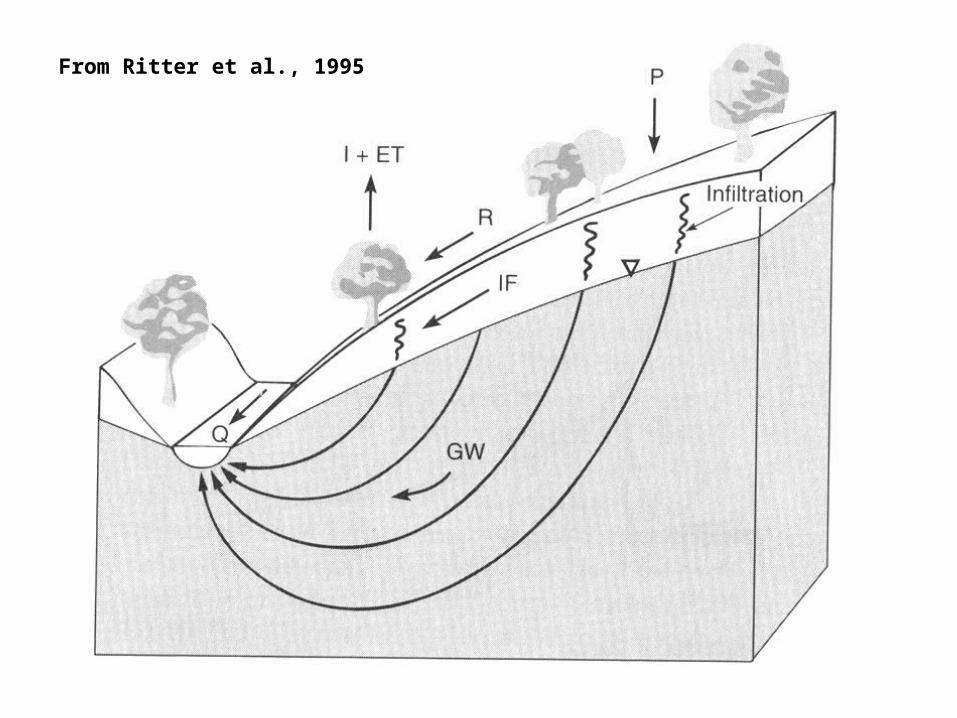
From Ritter et al., 1995
From Ritter et al., 1995
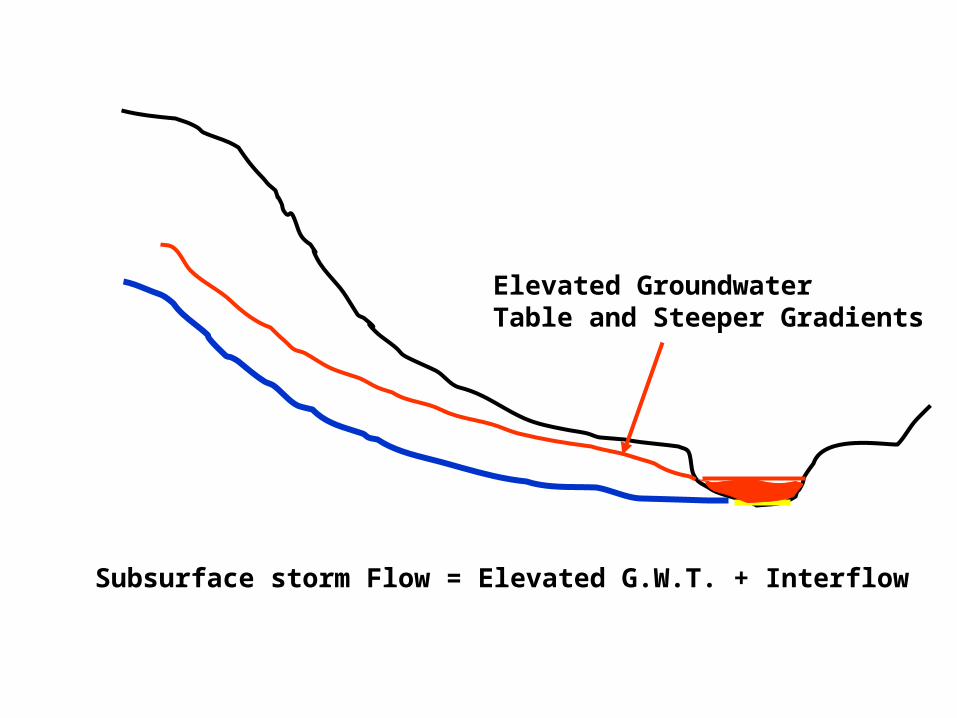
Subsurface storm Flow = Elevated G.W.T. + Interflow
Elevated GroundwaterTable and Steeper Gradients
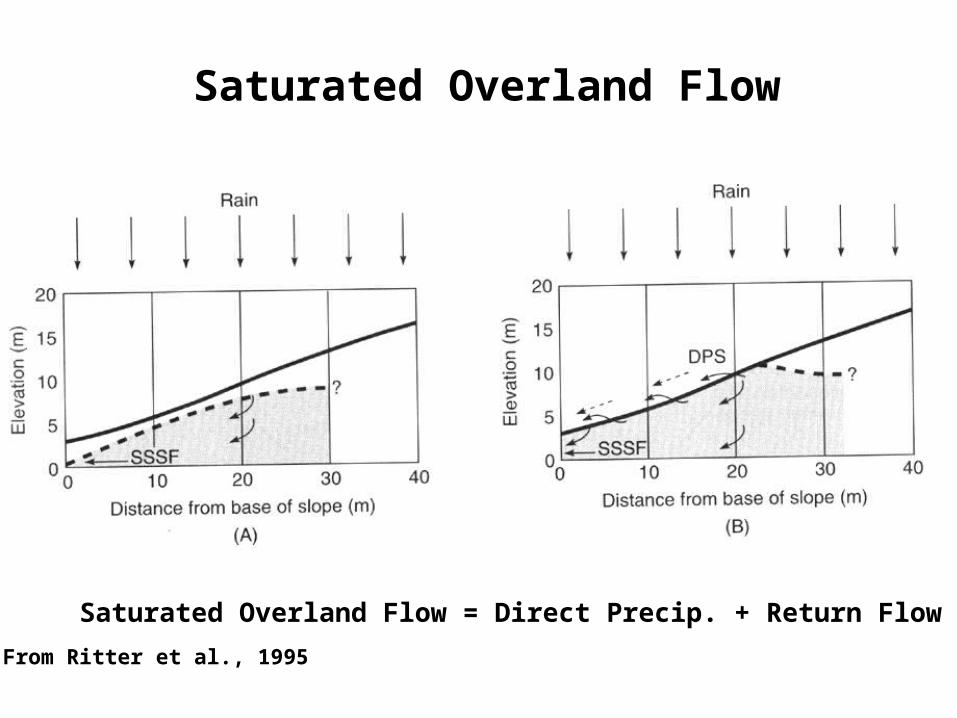
Saturated Overland Flow
Saturated Overland Flow = Direct Precip. + Return Flow
From Ritter et al., 1995
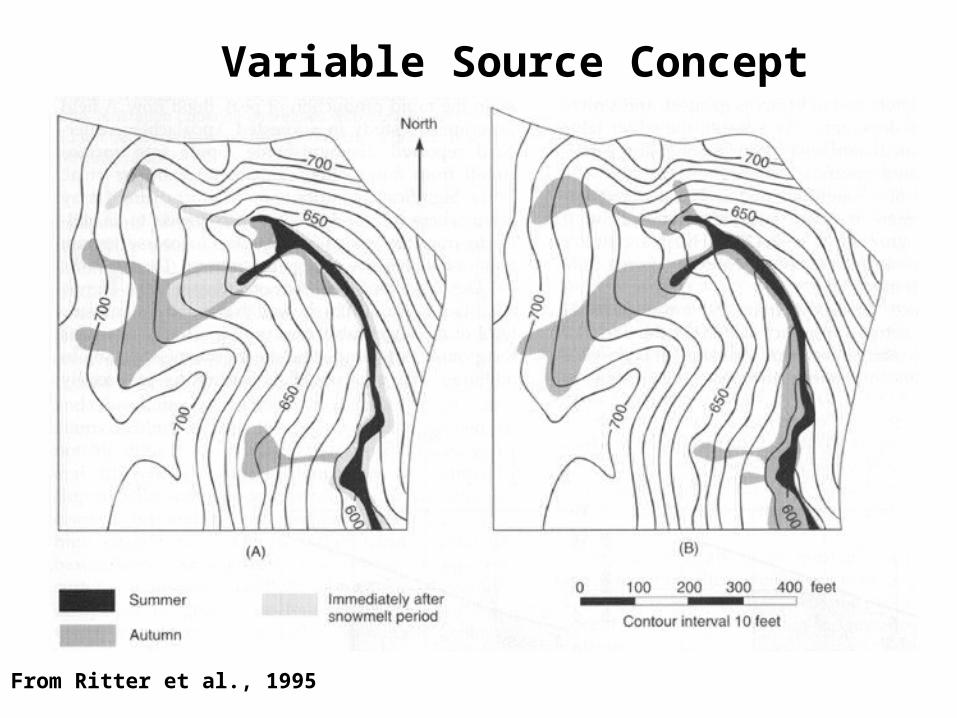
Variable Source Concept
From Ritter et al., 1995
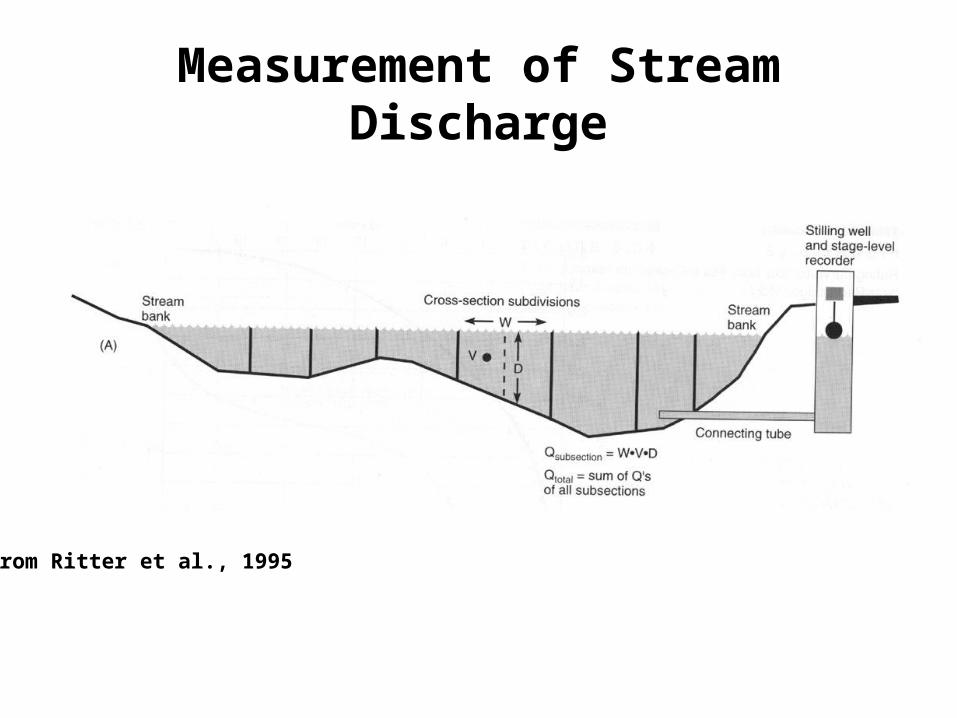
Measurement of Stream Discharge
From Ritter et al., 1995
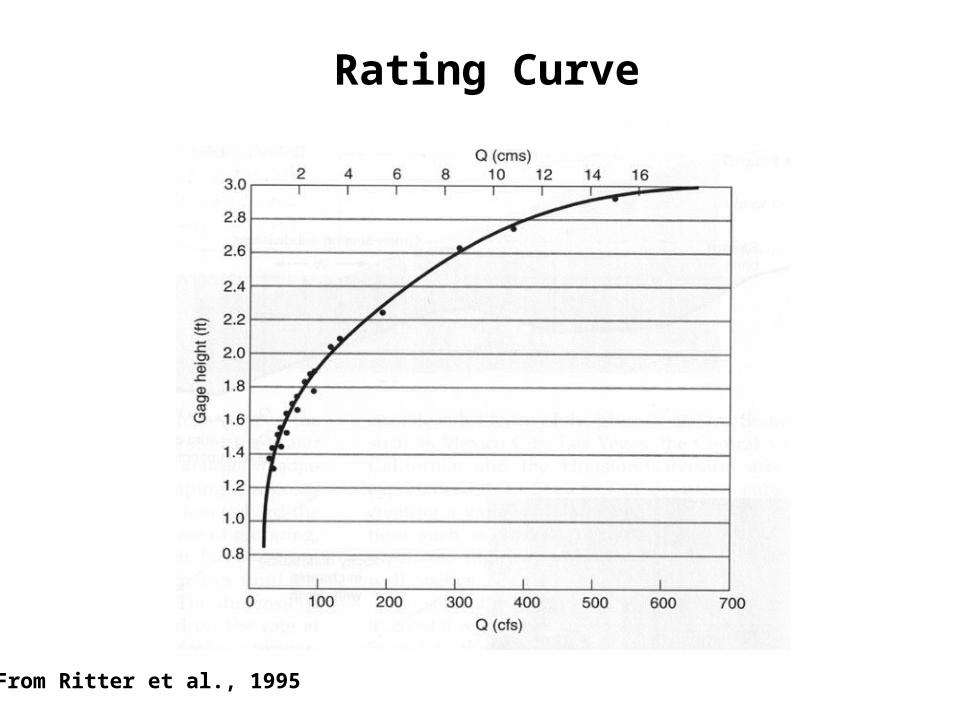
Rating Curve
From Ritter et al., 1995
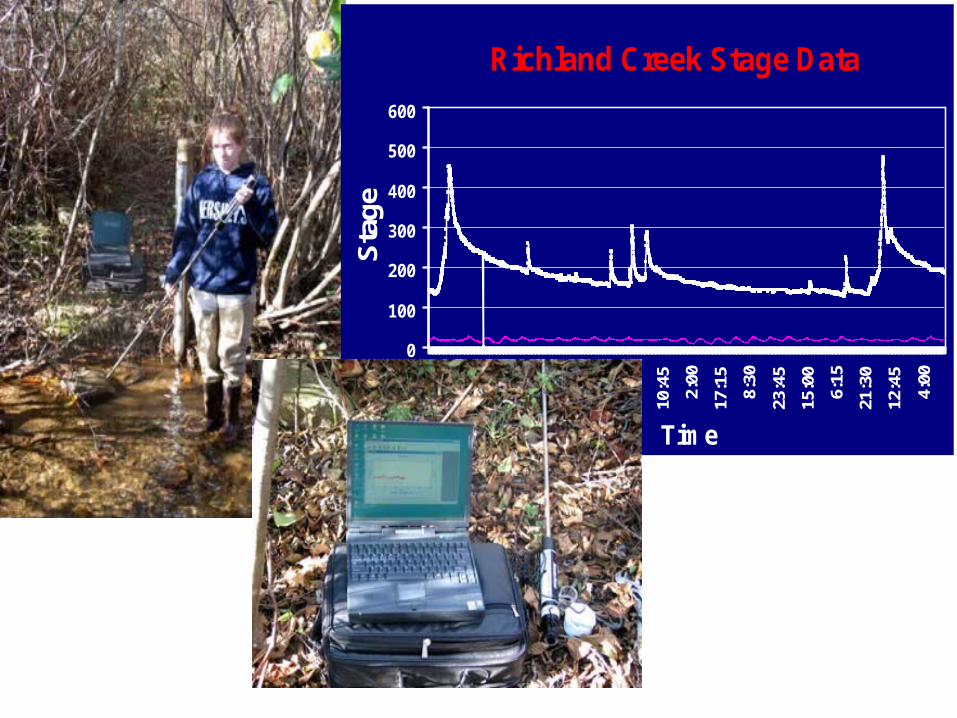
Richland Creek Stage Data
0
100
200
300
400
500
600
9:00
0:15
15:1
5
6:30
21:4
5
13:0
0
4:15
19:3
0
10:4
5
2:00
17:1
5
8:30
23:4
5
15:0
0
6:15
21:3
0
12:4
5
4:00
Time
Sta
ge
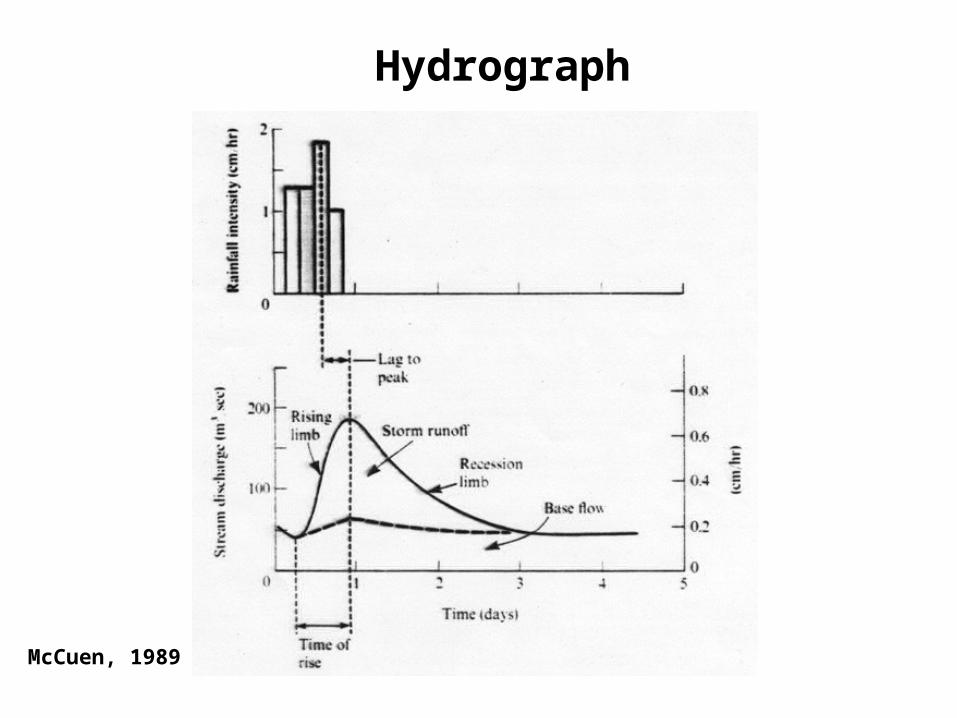
Hydrograph
McCuen, 1989
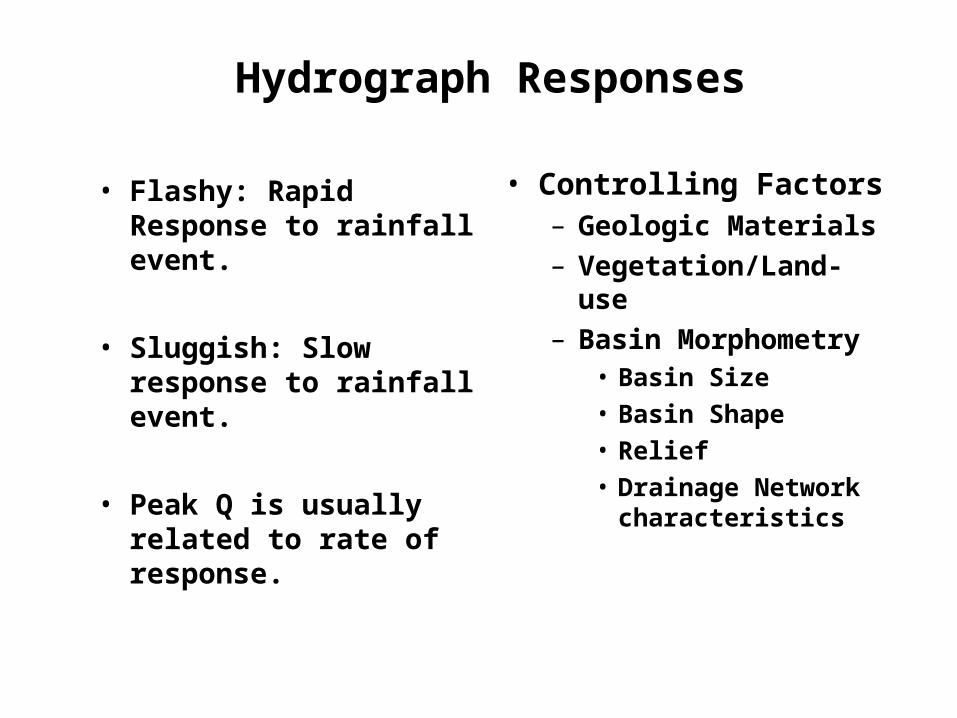
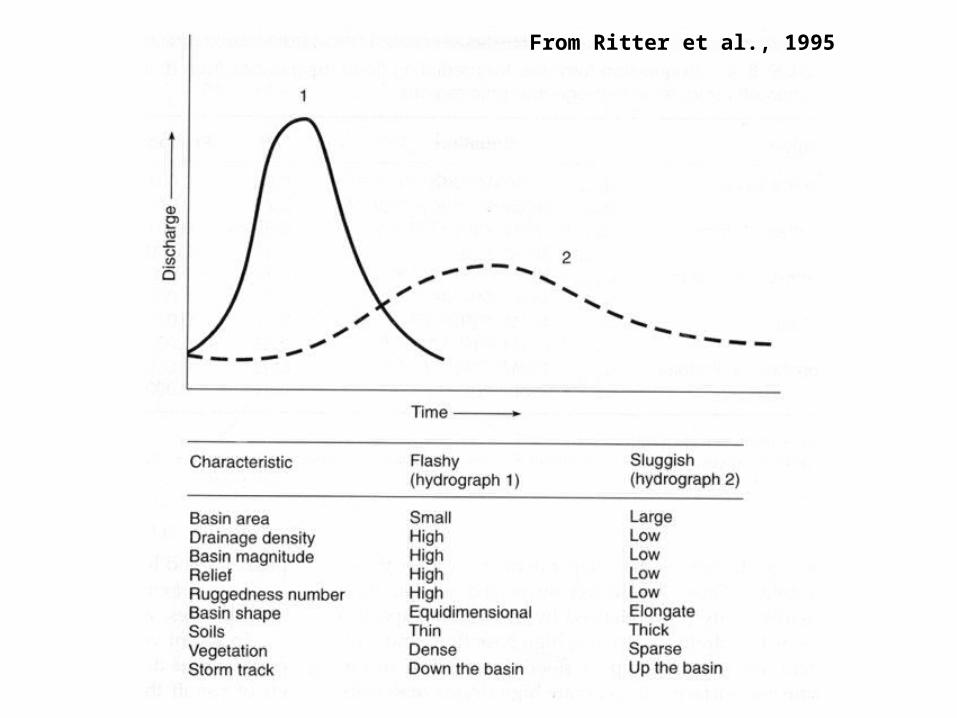
Hydrograph Responses
• Flashy: Rapid Response to rainfall event.
• Sluggish: Slow response to rainfall event.
• Peak Q is usually related to rate of response.
• Controlling Factors– Geologic Materials
– Vegetation/Land-use
– Basin Morphometry• Basin Size• Basin Shape• Relief • Drainage Network
characteristics
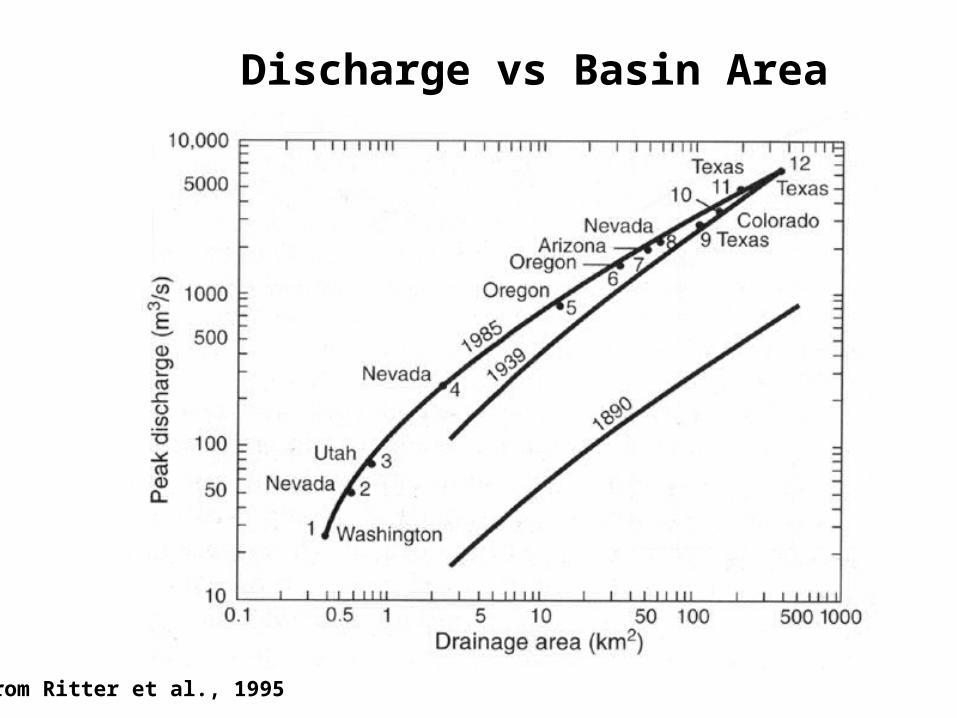
Discharge vs Basin Area
From Ritter et al., 1995
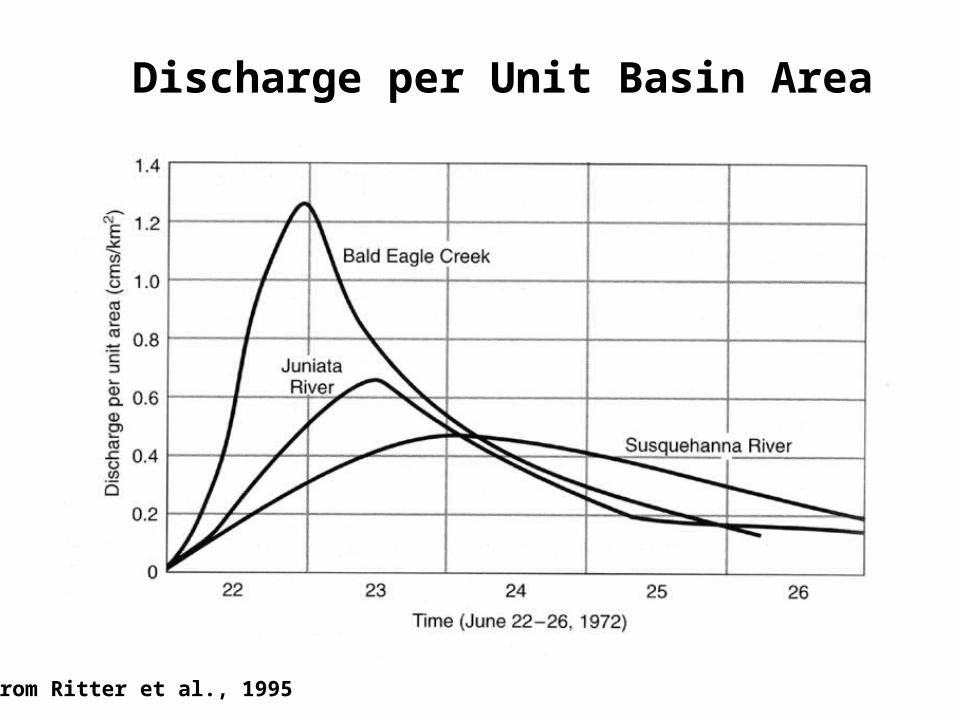
Discharge per Unit Basin Area
From Ritter et al., 1995
From Ritter et al., 1995