
How Akamai Handles Large Events Bruce Maggs Carnegie Mellon Duke Akamai Technologies.
Drafting Behind Akamai ∗
(Travelocity-Based Detouring)
Ao-Jan [email protected]
David R. [email protected]
Aleksandar [email protected]
Fabian E. [email protected]
Department of Electrical Engineering and Computer ScienceNorthwestern University
Evanston, IL 60208, USA
ABSTRACTTo enhance web browsing experiences, content distribution net-works (CDNs) move web content “closer” to clients by cachingcopies of web objects on thousands of servers worldwide. Addi-tionally, to minimize client download times, such systems performextensive network and server measurements, and use them to redi-rect clients to different servers over short time scales. In this paper,we explore techniques for inferring and exploiting network mea-surements performed by the largest CDN, Akamai; our objectiveis to locate and utilize quality Internet pathswithout performingextensive path probing or monitoring.
Our contributions are threefold. First, we conduct a broad mea-surement study of Akamai’s CDN. We probe Akamai’s networkfrom 140 PlanetLab vantage points for two months. We find thatAkamai redirection times, while slightly higher than advertised, aresufficiently low to be useful for network control. Second, we em-pirically show that Akamai redirections overwhelmingly correlatewith networklatencies on the paths between clients and the Akamaiservers. Finally, we illustrate how large-scale overlay networks canexploit Akamai redirections to identify the best detouring nodesfor one-hop source routing. Our research shows that in more than50% of investigated scenarios, it is better to route through the nodes“recommended” by Akamai, than to use the direct paths. Becausethis is not the case for the rest of the scenarios, we develop low-overhead pruning algorithms that avoid Akamai-driven paths whenthey are not beneficial.
∗Drafting is a technique commonly used by bikers and long-distance runners to reduce wind resistance by moving into the airpocket created behind the leader.
Permission to make digital or hard copies of all or part of this work forpersonal or classroom use is granted without fee provided that copies arenot made or distributed for profit or commercial advantage and that copiesbear this notice and the full citation on the first page. To copy otherwise, torepublish, to post on servers or to redistribute to lists, requires prior specificpermission and/or a fee.SIGCOMM’06,September 11–15, 2006, Pisa, Italy.Copyright 2006 ACM 1-59593-308-5/06/0009 ...$5.00.
Categories and Subject DescriptorsC.2.2 [Computer-Communication Networks]: InternetC.4 [Performance of Systems]:Measurement techniques
General TermsMeasurement, Performance, Experimentation
KeywordsAkamai, CDN, edge server, DNS, measurement reuse, one-hopsource routing
1. INTRODUCTIONContent delivery networks (CDNs) attempt to improve web per-
formance by delivering content to end users from multiple, geo-graphically dispersed servers located at the edge of the network [4,23, 27, 34]. Content providers contract with CDNs to host and dis-tribute their content. Since most CDNs have servers in ISP points ofpresence, clients’ requests can be dynamically forwarded to topo-logically proximate replicas. DNS redirection and URL rewritingare two of the commonly used techniques for directing client re-quests to a particular server [18,35].
Beyond static information such as geographic location and net-work connectivity, most CDNs rely on network measurement sub-systems to incorporate dynamic network information on replicaselection and determine high-speed Internet paths over which totransfer content within the network [7]. In this paper,we exploretechniques for inferring and exploiting the network measurementsperformed by CDNs for the purpose of locating and utilizing qual-ity Internet paths without performing extensive path probing ormonitoring.
We focus our efforts on the Akamai CDN, which is perhaps themost extensive distribution network in the world – claiming over15,000 servers operating in 69 countries and 1,000 networks [4].Without Akamai’s CDN, highly popular web enterprises such asYahoo, Amazon, or The New York Times would be unable to servethe gigabytes of data per second required by the images, Flash ani-mations, and videos embedded in their web sites. Given the globalnature of the Akamai network, it is clear that any viable informa-tion about network conditions collected by Akamai can be benefi-

cial to other applications; in this paper, we demonstrate how it canimprove performance for routing in large-scale overlay networks.
1.1 Our ContributionsThis paper explores (i) whether frequent client redirections gen-
erated by Akamai revealnetworkconditions over the paths betweenend-users and Akamai edge-servers, and (ii) how such informationcan be utilized by the broader Internet community. We expect thefirst hypothesis to hold true because Akamai utilizes extensive net-work and server measurements to minimize the latency perceivedby end users [12]. Thus, if the load on Akamai edge servers wereeither low or uniform over long time scales (one of the main goalsof CDNs in general), then Akamai client redirections would indeedimply viable network path-quality information.
For the second hypothesis, we consider the application of over-lay routing. As long as an overlay network can map a subset of itsnodes to Akamai edge servers, the clients of such an overlay coulduse Akamai redirections as viable indications regarding how toroute their own traffic. Because the number of nodes in large-scaleoverlay networks is typically several orders of magnitude largerthan the total number of Akamai servers, finding hosts that sharenetworks with Akamai edge servers should not be difficult. More-over, Akamai deploys its edge servers within ISPs’ networks at nocharge [1]. This greatly reduces ISPs’ bandwidth expenses whileincreasing the number of potential overlay nodes that can map theirpositions to Akamai servers.
The incentive for a network to latch onto Akamai in the aboveway is to improve performance by using quality Internet pathswith-outextensively monitoring, probing, or measuring the paths amongthe overlay nodes. In this work, we donot implement such anoverlay network. Instead, we demonstrate the feasibility of thisapproach by performing a large-scale measurement study.
We conduct our study over a period of approximately two months,using a testbed consisting of 140 PlanetLab (PL) nodes. We ini-tially measure the number of Akamai servers seen by each PL nodeover long time scales for a given Akamai customer (e.g., Yahoo ).The surprising result is that nodes that are further away, in a net-working sense, from the Akamai network are regularly served byhundredsof different servers on a daily basis. On the other hand, amoderate number of servers seen by a client (e.g., 2) reveals closeproximity between the two. However, because different Akamaiservers often host content for different customers, we show that thevast majority of investigated PL nodes see a large number of servers(and paths),e.g., over 50, for at least one of the Akamai customers.
We then measure the redirection dynamics for the Akamai CDN.While the updates are indeed frequent for the majority of the nodes,the inter-redirection times are much longer in certain parts of theworld, e.g., as large as 6 minutes in South America. Our subse-quent experiments indicate that such large time scales are not use-ful for network control; we show that even random or round-robinredirections over shorter time-scales would work better. Regard-less, we discover that the redirection times for the vast majority ofnodes are sufficient to reveal network conditions.
To show that network conditions are the primary determinant ofAkamai’s redirection behavior, we concurrently measure the per-formance of the ten best Akamai nodes seen by each of the PLnodes. By pinging, instead of fetching web objects from servers,we effectively decouple the network from the server latency. Ourresults show that Akamai redirections strongly correlate to networkconditions. For example, more than 70% of paths chosen by Aka-mai are among approximately the best 10% of measured paths.
To explore the potential benefits of Akamai-driven one-hop sourcerouting, we measure the best single-hop and direct path between
pairs of PL nodes. For a pair of PL nodes, we concurrently mea-sure the ten best single-hop paths between the source and the desti-nation, where the middle hop is a frequently updated Akamai edgeserver. Our results indicate that by following Akamai’s updates, itis possible to avoid hot spots close to the source, thus significantlyimproving end-to-end performance. For example, in 25% of all in-vestigated scenarios, Akamai-driven paths outperformed the directpaths. Moreover, 50% of the middle pointsdiscoveredby Akamaishow better performance than the direct path.
Not all Akamai paths will lead to lower latency than the di-rect alternative. For example, a direct path between two nodesin Brazil will always outperform single-hop Akamai paths, sim-ply because the detouring point is in the US. Thus, we developlow-overhead pruning algorithms that consistently choose the bestpath from available Akamai-driven and direct paths. The ques-tion then becomes, how often does a client need to “double-check”to ensure that Akamai-driven paths are indeed faster than directpaths. We show that these techniques always lead to better per-formance than using the direct path, regardless of frequency, andthat the frequency can be as low as once every two hours before aclient’s performance significantly declines. Thus, we show that thisAkamai-driven routing has the potential to offer significant perfor-mance gains with a very small amount of network measurement.
1.2 RoadmapThis paper is structured as follows. Section 2 discusses the de-
tails of the Akamai CDN relevant to this study. In Section 3, wedescribe our experimental setup and present summary results fromour large-scale measurement-based study. Section 4 further ana-lyzes the measured results to determine whether Akamai revealsnetwork conditions through its edge-server selection. After show-ing that this is the case, we present and analyze a second measurement-based experiment designed to determine the effectiveness of Akamai-driven, one-hop source routing in Section 5. We discuss our resultsand describe related work in Section 6. Section 7 presents our con-clusions.
2. HOW DOES AKAMAI WORK?In this section, we provide the necessary background to under-
stand the context for the ensuing experiments. In general, for a webclient to retrieve content for a web page, the first step is to use DNSto resolve the server-name portion of the content’s URL into theaddress of a machine hosting it. If the web site uses a CDN, thecontent will be replicated at several hosts across the Internet. Apopular way to direct clients to those replicas dynamically is DNSredirection. With DNS redirection, a client’s DNS request is redi-rected to an authoritative DNS name server that is controlled bythe CDN, which then resolves the CDN server name to the IP ad-dress of one or more content servers [21]. DNS redirection can beused to deliver full or partial site content. With the former, all DNSrequests for the origin server are redirected to the CDN. With par-tial site content delivery, the origin site modifies certain embeddedURLs so that requests for only those URLs are redirected to theCDN. The Akamai CDN uses DNS redirection to deliver partialcontent.
Although Akamai’s network measurement, path selection andcache distribution algorithms are proprietary and private, the mech-anisms that enable Akamai to redirect clients’ requests are pub-lic knowledge. Below, we provide a detailed explanation of thesemechanisms, which is based on both publicly available sources[8,9,22,24] and our own measurements.
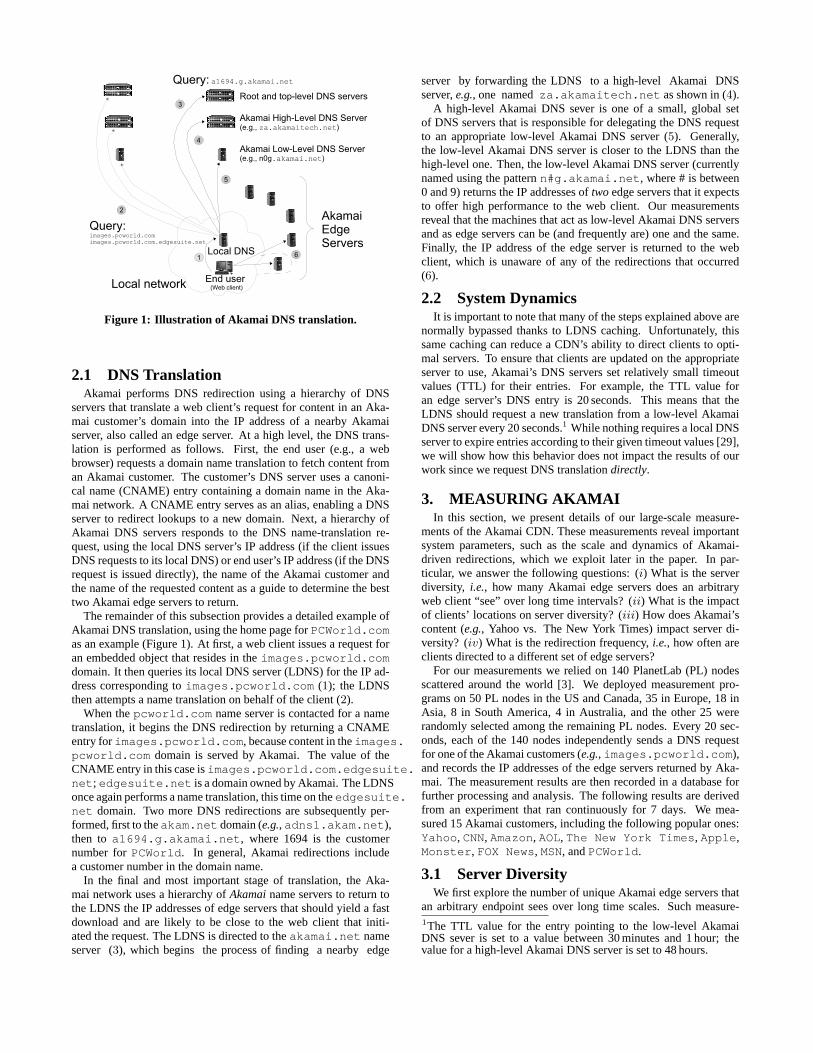
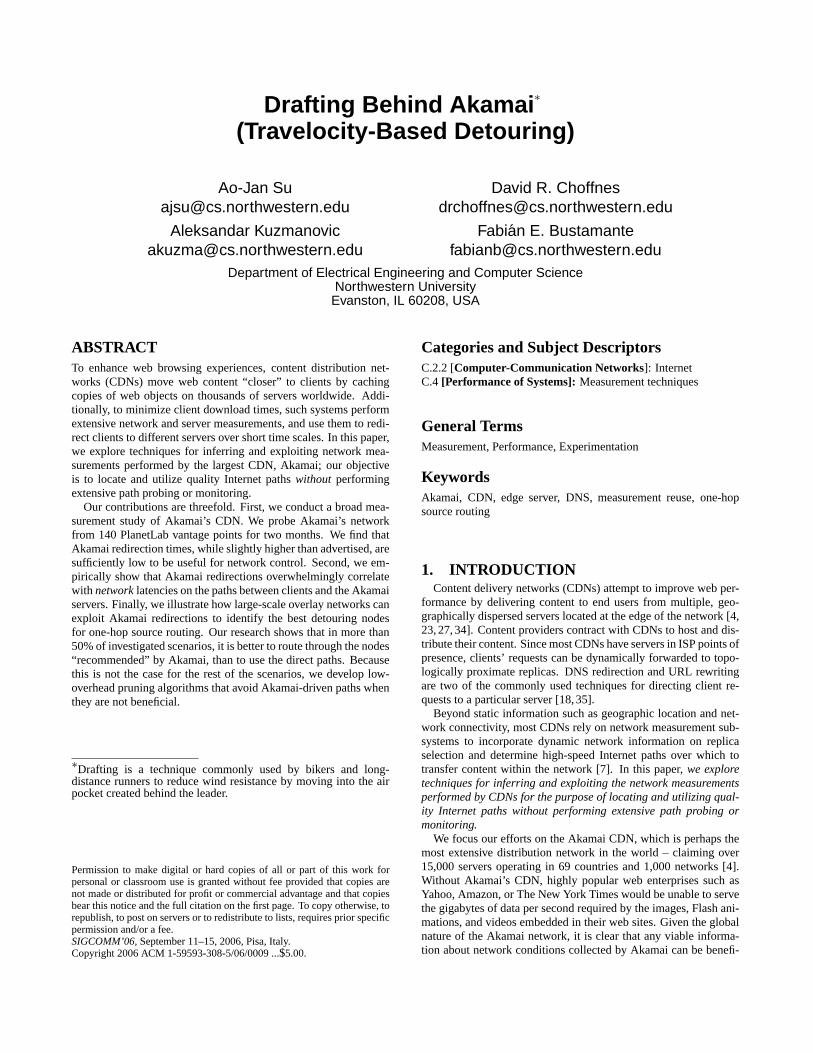
Figure 1: Illustration of Akamai DNS translation.
2.1 DNS TranslationAkamai performs DNS redirection using a hierarchy of DNS
servers that translate a web client’s request for content in an Aka-mai customer’s domain into the IP address of a nearby Akamaiserver, also called an edge server. At a high level, the DNS trans-lation is performed as follows. First, the end user (e.g., a webbrowser) requests a domain name translation to fetch content froman Akamai customer. The customer’s DNS server uses a canoni-cal name (CNAME) entry containing a domain name in the Aka-mai network. A CNAME entry serves as an alias, enabling a DNSserver to redirect lookups to a new domain. Next, a hierarchy ofAkamai DNS servers responds to the DNS name-translation re-quest, using the local DNS server’s IP address (if the client issuesDNS requests to its local DNS) or end user’s IP address (if the DNSrequest is issued directly), the name of the Akamai customer andthe name of the requested content as a guide to determine the besttwo Akamai edge servers to return.
The remainder of this subsection provides a detailed example ofAkamai DNS translation, using the home page forPCWorld.comas an example (Figure 1). At first, a web client issues a request foran embedded object that resides in theimages.pcworld.comdomain. It then queries its local DNS server (LDNS) for the IP ad-dress corresponding toimages.pcworld.com (1); the LDNSthen attempts a name translation on behalf of the client (2).
When thepcworld.com name server is contacted for a nametranslation, it begins the DNS redirection by returning a CNAMEentry forimages.pcworld.com , because content in theimages.pcworld.com domain is served by Akamai. The value of theCNAME entry in this case isimages.pcworld.com.edgesuite.net ; edgesuite.net is a domain owned by Akamai. The LDNSonce again performs a name translation, this time on theedgesuite.net domain. Two more DNS redirections are subsequently per-formed, first to theakam.net domain (e.g., adns1.akam.net ),then to a1694.g.akamai.net , where 1694 is the customernumber forPCWorld . In general, Akamai redirections includea customer number in the domain name.
In the final and most important stage of translation, the Aka-mai network uses a hierarchy ofAkamainame servers to return tothe LDNS the IP addresses of edge servers that should yield a fastdownload and are likely to be close to the web client that initi-ated the request. The LDNS is directed to theakamai.net nameserver (3), which begins the process of finding a nearby edge
server by forwarding the LDNS to a high-level Akamai DNSserver,e.g., one namedza.akamaitech.net as shown in (4).
A high-level Akamai DNS sever is one of a small, global setof DNS servers that is responsible for delegating the DNS requestto an appropriate low-level Akamai DNS server (5). Generally,the low-level Akamai DNS server is closer to the LDNS than thehigh-level one. Then, the low-level Akamai DNS server (currentlynamed using the patternn#g.akamai.net , where # is between0 and 9) returns the IP addresses oftwoedge servers that it expectsto offer high performance to the web client. Our measurementsreveal that the machines that act as low-level Akamai DNS serversand as edge servers can be (and frequently are) one and the same.Finally, the IP address of the edge server is returned to the webclient, which is unaware of any of the redirections that occurred(6).
2.2 System DynamicsIt is important to note that many of the steps explained above are
normally bypassed thanks to LDNS caching. Unfortunately, thissame caching can reduce a CDN’s ability to direct clients to opti-mal servers. To ensure that clients are updated on the appropriateserver to use, Akamai’s DNS servers set relatively small timeoutvalues (TTL) for their entries. For example, the TTL value foran edge server’s DNS entry is 20 seconds. This means that theLDNS should request a new translation from a low-level AkamaiDNS server every 20 seconds.1 While nothing requires a local DNSserver to expire entries according to their given timeout values [29],we will show how this behavior does not impact the results of ourwork since we request DNS translationdirectly.
3. MEASURING AKAMAIIn this section, we present details of our large-scale measure-
ments of the Akamai CDN. These measurements reveal importantsystem parameters, such as the scale and dynamics of Akamai-driven redirections, which we exploit later in the paper. In par-ticular, we answer the following questions: (i) What is the serverdiversity, i.e., how many Akamai edge servers does an arbitraryweb client “see” over long time intervals? (ii) What is the impactof clients’ locations on server diversity? (iii) How does Akamai’scontent (e.g., Yahoo vs. The New York Times) impact server di-versity? (iv) What is the redirection frequency,i.e., how often areclients directed to a different set of edge servers?
For our measurements we relied on 140 PlanetLab (PL) nodesscattered around the world [3]. We deployed measurement pro-grams on 50 PL nodes in the US and Canada, 35 in Europe, 18 inAsia, 8 in South America, 4 in Australia, and the other 25 wererandomly selected among the remaining PL nodes. Every 20 sec-onds, each of the 140 nodes independently sends a DNS requestfor one of the Akamai customers (e.g., images.pcworld.com ),and records the IP addresses of the edge servers returned by Aka-mai. The measurement results are then recorded in a database forfurther processing and analysis. The following results are derivedfrom an experiment that ran continuously for 7 days. We mea-sured 15 Akamai customers, including the following popular ones:Yahoo , CNN, Amazon, AOL, The New York Times , Apple ,Monster , FOX News, MSN, andPCWorld .
3.1 Server DiversityWe first explore the number of unique Akamai edge servers that
an arbitrary endpoint sees over long time scales. Such measure-1The TTL value for the entry pointing to the low-level AkamaiDNS sever is set to a value between 30 minutes and 1 hour; thevalue for a high-level Akamai DNS server is set to 48 hours.
0
5
10
15
20
25
06/1/6 20:4606/1/6 6:3006/1/5 16:1406/1/5 1:58
Edg
e se
rver
IP ID
s
Timestamp
DNS mapping
(a) From Berkeley
0
50
100
150
200
250
06/1/6 20:4706/1/6 6:3206/1/05 16:1606/1/5 2:01
Edg
e se
rver
IP ID
s
Timestamp
DNS mapping
(b) From Purdue
Figure 2: Server diversity from two characteristic PL nodes.
ments reveal important relationships between clients and servers: Amoderate number of servers seen by a client (e.g., 2) reveals closeproximity between the client and servers. On the other hand, clientsthat are farther away from the Akamai network can see a large num-ber (e.g., hundreds) of distinct Akamai servers over longer timescales. In either case, by pointing to the best servers over shortertime scales, the Akamai CDN reveals valuable path-quality infor-mation, as we demonstrate in Section 4.
Figure 2 plots theuniqueAkamai edge-server IP identificationnumbers (IDs) seen by two clients requestinga943.x.a.yimg.com , which is a CNAME forYahoo . The clients are hosted ontheberkeley.intel-research.net andcs.purdue.edunetworks, and the result is shown over a period of two days. Weplot the Akamai server IDs on the y-axis in the order of appear-ance,i.e., those showing up sooner have lower IDs. As indicatedin the figure, low-level Akamai DNS servers always return the IPaddresses oftwo edge servers for redundancy, as explained in theprevious section. Thus, there are always two points in Figure 2corresponding to each timestamp on the x-axis.
In addition to revealing the targeted number of unique Akamaiserver IDs, Figure 2 extracts valuable dynamic information. In-deed, both figures show strong time-of-day effects. During theevening, both clients are directed to the same set of edge servers;during the day, the redirections are much more pronounced. In thenext section, we demonstrate that these redirections are driven bynetwork conditions on the paths between clients and edge servers,which change more dramatically during the day. In general, thetime-of-day effects are stronger in scenarios where both a clientand its associated Akamai edge servers reside in the same timezone (e.g., the Berkeley case); as the edge servers become scat-tered across a larger number of time zones (e.g., the Purdue case),the effect becomes less pronounced.
The key insight from Figure 2 is the large discrepancy betweenthe number of unique Akamai edge servers seen by the two hosts.The Berkeley node is served by fewer than 20 unique edge serversduring the day, indicating that this node and its Akamai servers arenearby. On the other hand, the lack of Akamai caching servers nearthe Purdue PL node significantly impacts the number of serversseen by that node — more than 200 in under two days. The majorityof the servers are from the Midwest or the East Coast (e.g., Boston,Cambridge, Columbus, or Dover); however, when the paths fromPurdue to these servers become congested, downloads from theWest Coast (e.g., San Francisco or Seattle) are not unusual.
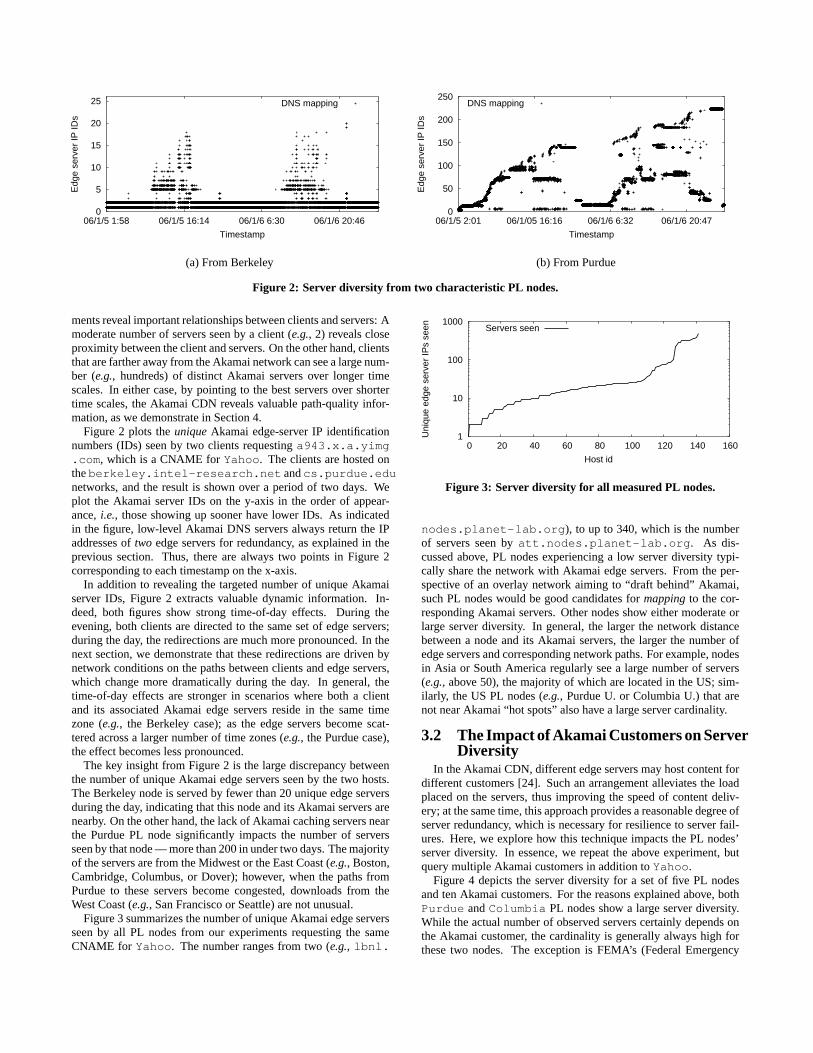
Figure 3 summarizes the number of unique Akamai edge serversseen by all PL nodes from our experiments requesting the sameCNAME for Yahoo . The number ranges from two (e.g., lbnl.
1
10
100
1000
0 20 40 60 80 100 120 140 160
Uni
que
edge
ser
ver
IPs
seen
Host id
Servers seen
Figure 3: Server diversity for all measured PL nodes.
nodes.planet-lab.org ), to up to 340, which is the numberof servers seen byatt.nodes.planet-lab.org . As dis-cussed above, PL nodes experiencing a low server diversity typi-cally share the network with Akamai edge servers. From the per-spective of an overlay network aiming to “draft behind” Akamai,such PL nodes would be good candidates formappingto the cor-responding Akamai servers. Other nodes show either moderate orlarge server diversity. In general, the larger the network distancebetween a node and its Akamai servers, the larger the number ofedge servers and corresponding network paths. For example, nodesin Asia or South America regularly see a large number of servers(e.g., above 50), the majority of which are located in the US; sim-ilarly, the US PL nodes (e.g., Purdue U. or Columbia U.) that arenot near Akamai “hot spots” also have a large server cardinality.
3.2 The Impact of Akamai Customers on ServerDiversity
In the Akamai CDN, different edge servers may host content fordifferent customers [24]. Such an arrangement alleviates the loadplaced on the servers, thus improving the speed of content deliv-ery; at the same time, this approach provides a reasonable degree ofserver redundancy, which is necessary for resilience to server fail-ures. Here, we explore how this technique impacts the PL nodes’server diversity. In essence, we repeat the above experiment, butquery multiple Akamai customers in addition toYahoo .
Figure 4 depicts the server diversity for a set of five PL nodesand ten Akamai customers. For the reasons explained above, bothPurdue andColumbia PL nodes show a large server diversity.While the actual number of observed servers certainly depends onthe Akamai customer, the cardinality is generally always high forthese two nodes. The exception is FEMA’s (Federal Emergency
0
50
100
150
200
250
300
350
400
lbnl.nodes.planet-lab.orgcs.umass.educs.uoregon.educomet.columbia.educs.purdue.edu
Num
ber
of A
kam
ai E
dge
Ser
vers
Planet Lab Nodes
Yahoo!Amazon
AOLNYTimes
AppleMonster
FOX NewsMSN
PCWorldFEMA
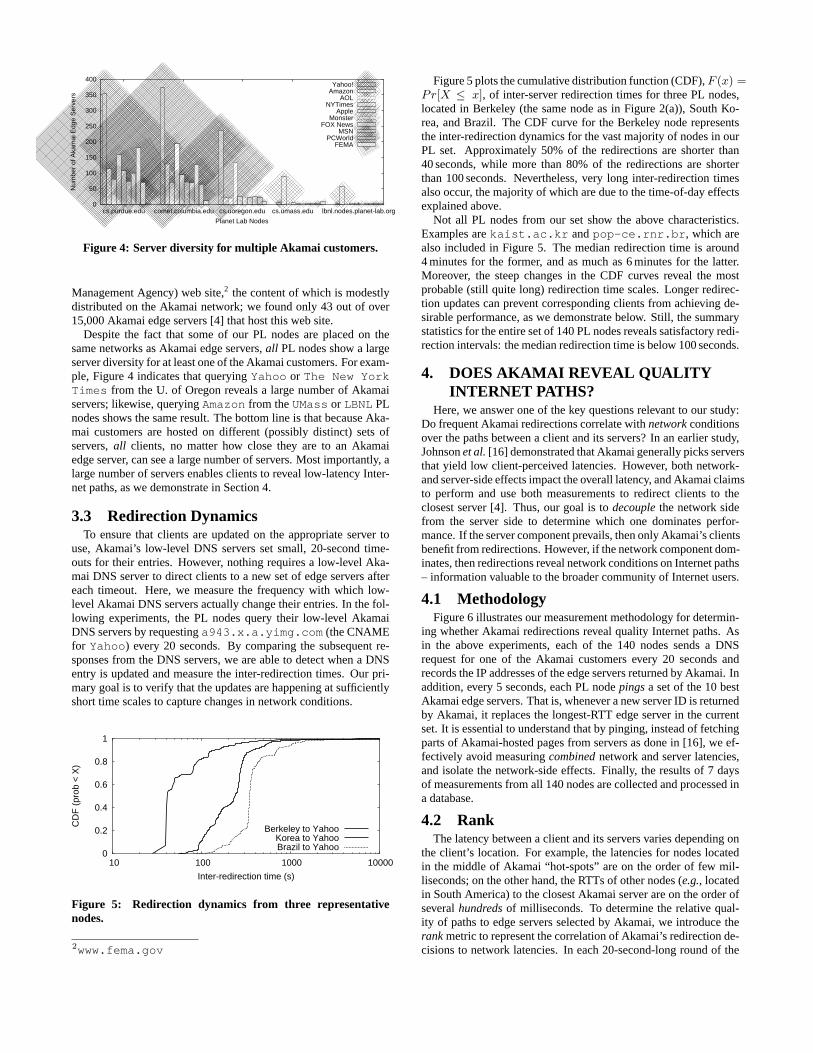
Figure 4: Server diversity for multiple Akamai customers.
Management Agency) web site,2 the content of which is modestlydistributed on the Akamai network; we found only 43 out of over15,000 Akamai edge servers [4] that host this web site.
Despite the fact that some of our PL nodes are placed on thesame networks as Akamai edge servers,all PL nodes show a largeserver diversity for at least one of the Akamai customers. For exam-ple, Figure 4 indicates that queryingYahoo or The New YorkTimes from the U. of Oregon reveals a large number of Akamaiservers; likewise, queryingAmazon from theUMass or LBNL PLnodes shows the same result. The bottom line is that because Aka-mai customers are hosted on different (possibly distinct) sets ofservers,all clients, no matter how close they are to an Akamaiedge server, can see a large number of servers. Most importantly, alarge number of servers enables clients to reveal low-latency Inter-net paths, as we demonstrate in Section 4.
3.3 Redirection DynamicsTo ensure that clients are updated on the appropriate server to
use, Akamai’s low-level DNS servers set small, 20-second time-outs for their entries. However, nothing requires a low-level Aka-mai DNS server to direct clients to a new set of edge servers aftereach timeout. Here, we measure the frequency with which low-level Akamai DNS servers actually change their entries. In the fol-lowing experiments, the PL nodes query their low-level AkamaiDNS servers by requestinga943.x.a.yimg.com (the CNAMEfor Yahoo ) every 20 seconds. By comparing the subsequent re-sponses from the DNS servers, we are able to detect when a DNSentry is updated and measure the inter-redirection times. Our pri-mary goal is to verify that the updates are happening at sufficientlyshort time scales to capture changes in network conditions.
0
0.2
0.4
0.6
0.8
1
10 100 1000 10000
CD
F (
prob
< X
)
Inter-redirection time (s)
Berkeley to YahooKorea to YahooBrazil to Yahoo
Figure 5: Redirection dynamics from three representativenodes.
2www.fema.gov
Figure 5 plots the cumulative distribution function (CDF),F (x) =Pr[X ≤ x], of inter-server redirection times for three PL nodes,located in Berkeley (the same node as in Figure 2(a)), South Ko-rea, and Brazil. The CDF curve for the Berkeley node representsthe inter-redirection dynamics for the vast majority of nodes in ourPL set. Approximately 50% of the redirections are shorter than40 seconds, while more than 80% of the redirections are shorterthan 100 seconds. Nevertheless, very long inter-redirection timesalso occur, the majority of which are due to the time-of-day effectsexplained above.
Not all PL nodes from our set show the above characteristics.Examples arekaist.ac.kr andpop-ce.rnr.br , which arealso included in Figure 5. The median redirection time is around4 minutes for the former, and as much as 6 minutes for the latter.Moreover, the steep changes in the CDF curves reveal the mostprobable (still quite long) redirection time scales. Longer redirec-tion updates can prevent corresponding clients from achieving de-sirable performance, as we demonstrate below. Still, the summarystatistics for the entire set of 140 PL nodes reveals satisfactory redi-rection intervals: the median redirection time is below 100 seconds.
4. DOES AKAMAI REVEAL QUALITYINTERNET PATHS?
Here, we answer one of the key questions relevant to our study:Do frequent Akamai redirections correlate withnetworkconditionsover the paths between a client and its servers? In an earlier study,Johnsonet al.[16] demonstrated that Akamai generally picks serversthat yield low client-perceived latencies. However, both network-and server-side effects impact the overall latency, and Akamai claimsto perform and use both measurements to redirect clients to theclosest server [4]. Thus, our goal is todecouplethe network sidefrom the server side to determine which one dominates perfor-mance. If the server component prevails, then only Akamai’s clientsbenefit from redirections. However, if the network component dom-inates, then redirections reveal network conditions on Internet paths– information valuable to the broader community of Internet users.
4.1 MethodologyFigure 6 illustrates our measurement methodology for determin-
ing whether Akamai redirections reveal quality Internet paths. Asin the above experiments, each of the 140 nodes sends a DNSrequest for one of the Akamai customers every 20 seconds andrecords the IP addresses of the edge servers returned by Akamai. Inaddition, every 5 seconds, each PL nodepingsa set of the 10 bestAkamai edge servers. That is, whenever a new server ID is returnedby Akamai, it replaces the longest-RTT edge server in the currentset. It is essential to understand that by pinging, instead of fetchingparts of Akamai-hosted pages from servers as done in [16], we ef-fectively avoid measuringcombinednetwork and server latencies,and isolate the network-side effects. Finally, the results of 7 daysof measurements from all 140 nodes are collected and processed ina database.
4.2 RankThe latency between a client and its servers varies depending on
the client’s location. For example, the latencies for nodes locatedin the middle of Akamai “hot-spots” are on the order of few mil-liseconds; on the other hand, the RTTs of other nodes (e.g., locatedin South America) to the closest Akamai server are on the order ofseveralhundredsof milliseconds. To determine the relative qual-ity of paths to edge servers selected by Akamai, we introduce therankmetric to represent the correlation of Akamai’s redirection de-cisions to network latencies. In each 20-second-long round of the
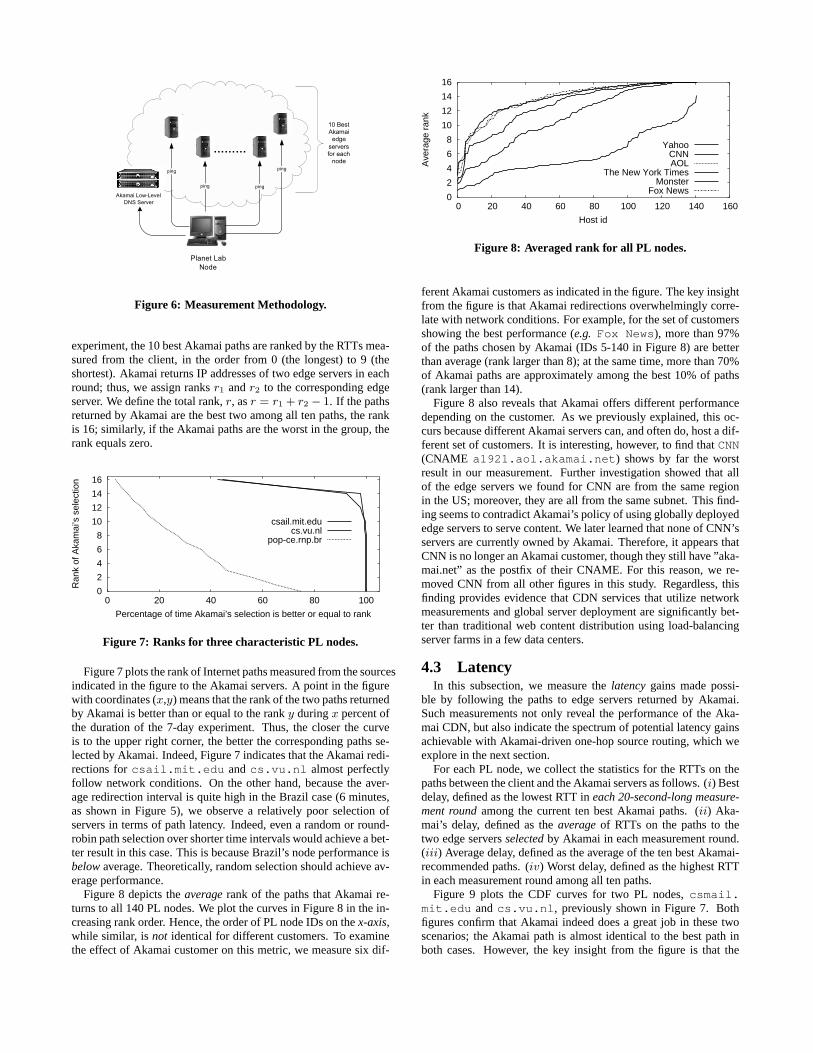
Figure 6: Measurement Methodology.
experiment, the 10 best Akamai paths are ranked by the RTTs mea-sured from the client, in the order from 0 (the longest) to 9 (theshortest). Akamai returns IP addresses of two edge servers in eachround; thus, we assign ranksr1 andr2 to the corresponding edgeserver. We define the total rank,r, asr = r1 + r2 − 1. If the pathsreturned by Akamai are the best two among all ten paths, the rankis 16; similarly, if the Akamai paths are the worst in the group, therank equals zero.
0
2
4
6
8
10
12
14
16
100806040200
Ran
k of
Aka
mai
’s s
elec
tion
Percentage of time Akamai’s selection is better or equal to rank
csail.mit.educs.vu.nl
pop-ce.rnp.br
Figure 7: Ranks for three characteristic PL nodes.
Figure 7 plots the rank of Internet paths measured from the sourcesindicated in the figure to the Akamai servers. A point in the figurewith coordinates (x,y) means that the rank of the two paths returnedby Akamai is better than or equal to the ranky duringx percent ofthe duration of the 7-day experiment. Thus, the closer the curveis to the upper right corner, the better the corresponding paths se-lected by Akamai. Indeed, Figure 7 indicates that the Akamai redi-rections forcsail.mit.edu andcs.vu.nl almost perfectlyfollow network conditions. On the other hand, because the aver-age redirection interval is quite high in the Brazil case (6 minutes,as shown in Figure 5), we observe a relatively poor selection ofservers in terms of path latency. Indeed, even a random or round-robin path selection over shorter time intervals would achieve a bet-ter result in this case. This is because Brazil’s node performance isbelowaverage. Theoretically, random selection should achieve av-erage performance.
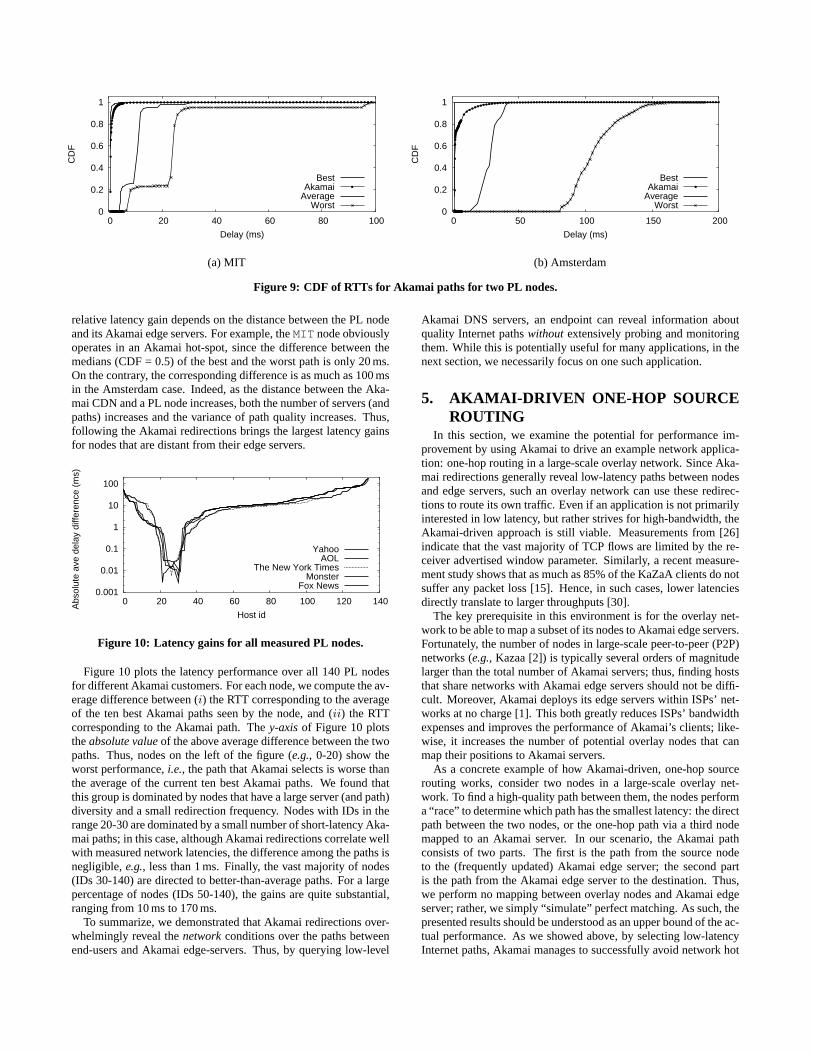
Figure 8 depicts theaveragerank of the paths that Akamai re-turns to all 140 PL nodes. We plot the curves in Figure 8 in the in-creasing rank order. Hence, the order of PL node IDs on thex-axis,while similar, isnot identical for different customers. To examinethe effect of Akamai customer on this metric, we measure six dif-
0
2
4
6
8
10
12
14
16
0 20 40 60 80 100 120 140 160
Ave
rage
ran
k
Host id
YahooCNNAOL
The New York TimesMonster
Fox News
Figure 8: Averaged rank for all PL nodes.
ferent Akamai customers as indicated in the figure. The key insightfrom the figure is that Akamai redirections overwhelmingly corre-late with network conditions. For example, for the set of customersshowing the best performance (e.g. Fox News), more than 97%of the paths chosen by Akamai (IDs 5-140 in Figure 8) are betterthan average (rank larger than 8); at the same time, more than 70%of Akamai paths are approximately among the best 10% of paths(rank larger than 14).
Figure 8 also reveals that Akamai offers different performancedepending on the customer. As we previously explained, this oc-curs because different Akamai servers can, and often do, host a dif-ferent set of customers. It is interesting, however, to find thatCNN(CNAME a1921.aol.akamai.net ) shows by far the worstresult in our measurement. Further investigation showed that allof the edge servers we found for CNN are from the same regionin the US; moreover, they are all from the same subnet. This find-ing seems to contradict Akamai’s policy of using globally deployededge servers to serve content. We later learned that none of CNN’sservers are currently owned by Akamai. Therefore, it appears thatCNN is no longer an Akamai customer, though they still have ”aka-mai.net” as the postfix of their CNAME. For this reason, we re-moved CNN from all other figures in this study. Regardless, thisfinding provides evidence that CDN services that utilize networkmeasurements and global server deployment are significantly bet-ter than traditional web content distribution using load-balancingserver farms in a few data centers.
4.3 LatencyIn this subsection, we measure thelatencygains made possi-
ble by following the paths to edge servers returned by Akamai.Such measurements not only reveal the performance of the Aka-mai CDN, but also indicate the spectrum of potential latency gainsachievable with Akamai-driven one-hop source routing, which weexplore in the next section.
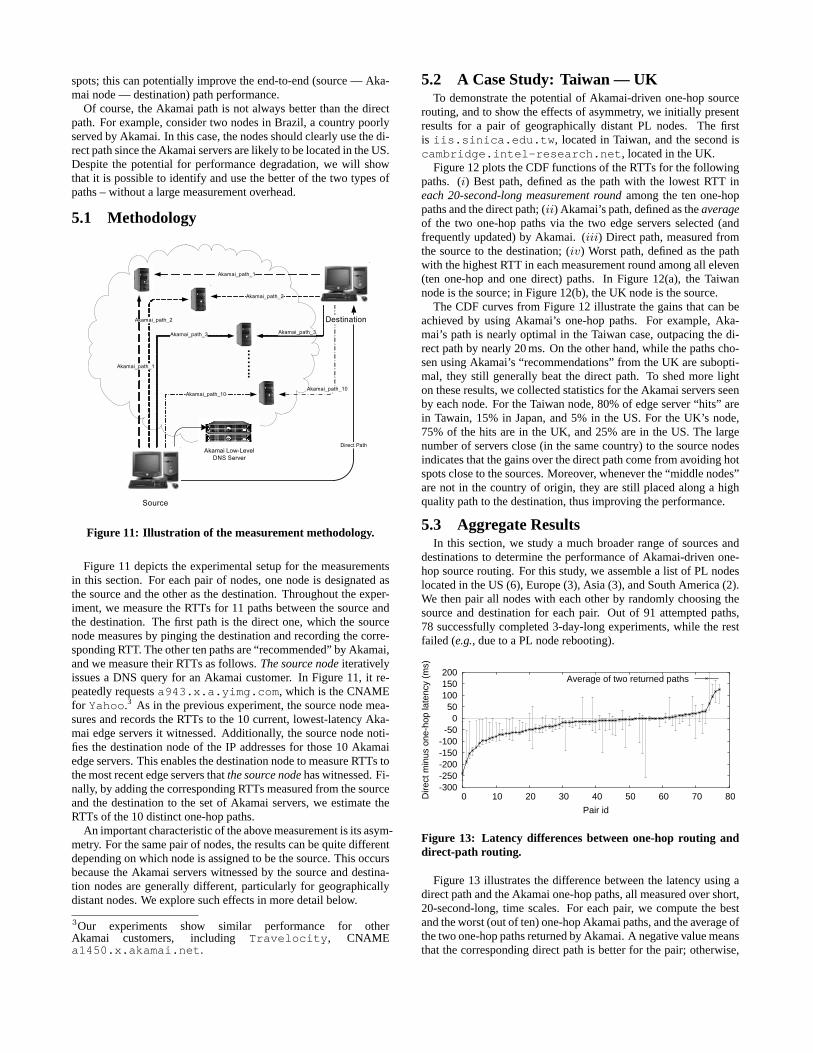
For each PL node, we collect the statistics for the RTTs on thepaths between the client and the Akamai servers as follows. (i) Bestdelay, defined as the lowest RTT ineach 20-second-long measure-ment roundamong the current ten best Akamai paths. (ii) Aka-mai’s delay, defined as theaverageof RTTs on the paths to thetwo edge serversselectedby Akamai in each measurement round.(iii) Average delay, defined as the average of the ten best Akamai-recommended paths. (iv) Worst delay, defined as the highest RTTin each measurement round among all ten paths.
Figure 9 plots the CDF curves for two PL nodes,csmail.mit.edu andcs.vu.nl , previously shown in Figure 7. Bothfigures confirm that Akamai indeed does a great job in these twoscenarios; the Akamai path is almost identical to the best path inboth cases. However, the key insight from the figure is that the
0
0.2
0.4
0.6
0.8
1
0 20 40 60 80 100
CD
F
Delay (ms)
BestAkamai
AverageWorst
(a) MIT
0
0.2
0.4
0.6
0.8
1
0 50 100 150 200
CD
F
Delay (ms)
BestAkamai
AverageWorst
(b) Amsterdam
Figure 9: CDF of RTTs for Akamai paths for two PL nodes.
relative latency gain depends on the distance between the PL nodeand its Akamai edge servers. For example, theMIT node obviouslyoperates in an Akamai hot-spot, since the difference between themedians (CDF = 0.5) of the best and the worst path is only 20 ms.On the contrary, the corresponding difference is as much as 100 msin the Amsterdam case. Indeed, as the distance between the Aka-mai CDN and a PL node increases, both the number of servers (andpaths) increases and the variance of path quality increases. Thus,following the Akamai redirections brings the largest latency gainsfor nodes that are distant from their edge servers.
0.001
0.01
0.1
1
10
100
0 20 40 60 80 100 120 140Abs
olut
e av
e de
lay
diff
eren
ce (
ms)
Host id
YahooAOL
The New York TimesMonster
Fox News
Figure 10: Latency gains for all measured PL nodes.
Figure 10 plots the latency performance over all 140 PL nodesfor different Akamai customers. For each node, we compute the av-erage difference between (i) the RTT corresponding to the averageof the ten best Akamai paths seen by the node, and (ii) the RTTcorresponding to the Akamai path. They-axisof Figure 10 plotstheabsolute valueof the above average difference between the twopaths. Thus, nodes on the left of the figure (e.g., 0-20) show theworst performance,i.e., the path that Akamai selects is worse thanthe average of the current ten best Akamai paths. We found thatthis group is dominated by nodes that have a large server (and path)diversity and a small redirection frequency. Nodes with IDs in therange 20-30 are dominated by a small number of short-latency Aka-mai paths; in this case, although Akamai redirections correlate wellwith measured network latencies, the difference among the paths isnegligible,e.g., less than 1 ms. Finally, the vast majority of nodes(IDs 30-140) are directed to better-than-average paths. For a largepercentage of nodes (IDs 50-140), the gains are quite substantial,ranging from 10 ms to 170 ms.
To summarize, we demonstrated that Akamai redirections over-whelmingly reveal thenetworkconditions over the paths betweenend-users and Akamai edge-servers. Thus, by querying low-level
Akamai DNS servers, an endpoint can reveal information aboutquality Internet pathswithout extensively probing and monitoringthem. While this is potentially useful for many applications, in thenext section, we necessarily focus on one such application.
5. AKAMAI-DRIVEN ONE-HOP SOURCEROUTING
In this section, we examine the potential for performance im-provement by using Akamai to drive an example network applica-tion: one-hop routing in a large-scale overlay network. Since Aka-mai redirections generally reveal low-latency paths between nodesand edge servers, such an overlay network can use these redirec-tions to route its own traffic. Even if an application is not primarilyinterested in low latency, but rather strives for high-bandwidth, theAkamai-driven approach is still viable. Measurements from [26]indicate that the vast majority of TCP flows are limited by the re-ceiver advertised window parameter. Similarly, a recent measure-ment study shows that as much as 85% of the KaZaA clients do notsuffer any packet loss [15]. Hence, in such cases, lower latenciesdirectly translate to larger throughputs [30].
The key prerequisite in this environment is for the overlay net-work to be able to map a subset of its nodes to Akamai edge servers.Fortunately, the number of nodes in large-scale peer-to-peer (P2P)networks (e.g., Kazaa [2]) is typically several orders of magnitudelarger than the total number of Akamai servers; thus, finding hoststhat share networks with Akamai edge servers should not be diffi-cult. Moreover, Akamai deploys its edge servers within ISPs’ net-works at no charge [1]. This both greatly reduces ISPs’ bandwidthexpenses and improves the performance of Akamai’s clients; like-wise, it increases the number of potential overlay nodes that canmap their positions to Akamai servers.
As a concrete example of how Akamai-driven, one-hop sourcerouting works, consider two nodes in a large-scale overlay net-work. To find a high-quality path between them, the nodes performa “race” to determine which path has the smallest latency: the directpath between the two nodes, or the one-hop path via a third nodemapped to an Akamai server. In our scenario, the Akamai pathconsists of two parts. The first is the path from the source nodeto the (frequently updated) Akamai edge server; the second partis the path from the Akamai edge server to the destination. Thus,we perform no mapping between overlay nodes and Akamai edgeserver; rather, we simply “simulate” perfect matching. As such, thepresented results should be understood as an upper bound of the ac-tual performance. As we showed above, by selecting low-latencyInternet paths, Akamai manages to successfully avoid network hot
spots; this can potentially improve the end-to-end (source — Aka-mai node — destination) path performance.
Of course, the Akamai path is not always better than the directpath. For example, consider two nodes in Brazil, a country poorlyserved by Akamai. In this case, the nodes should clearly use the di-rect path since the Akamai servers are likely to be located in the US.Despite the potential for performance degradation, we will showthat it is possible to identify and use the better of the two types ofpaths – without a large measurement overhead.
5.1 Methodology
Figure 11: Illustration of the measurement methodology.
Figure 11 depicts the experimental setup for the measurementsin this section. For each pair of nodes, one node is designated asthe source and the other as the destination. Throughout the exper-iment, we measure the RTTs for 11 paths between the source andthe destination. The first path is the direct one, which the sourcenode measures by pinging the destination and recording the corre-sponding RTT. The other ten paths are “recommended” by Akamai,and we measure their RTTs as follows.The source nodeiterativelyissues a DNS query for an Akamai customer. In Figure 11, it re-peatedly requestsa943.x.a.yimg.com , which is the CNAMEfor Yahoo .3 As in the previous experiment, the source node mea-sures and records the RTTs to the 10 current, lowest-latency Aka-mai edge servers it witnessed. Additionally, the source node noti-fies the destination node of the IP addresses for those 10 Akamaiedge servers. This enables the destination node to measure RTTs tothe most recent edge servers thatthe source nodehas witnessed. Fi-nally, by adding the corresponding RTTs measured from the sourceand the destination to the set of Akamai servers, we estimate theRTTs of the 10 distinct one-hop paths.
An important characteristic of the above measurement is its asym-metry. For the same pair of nodes, the results can be quite differentdepending on which node is assigned to be the source. This occursbecause the Akamai servers witnessed by the source and destina-tion nodes are generally different, particularly for geographicallydistant nodes. We explore such effects in more detail below.
3Our experiments show similar performance for otherAkamai customers, including Travelocity , CNAMEa1450.x.akamai.net .
5.2 A Case Study: Taiwan — UKTo demonstrate the potential of Akamai-driven one-hop source
routing, and to show the effects of asymmetry, we initially presentresults for a pair of geographically distant PL nodes. The firstis iis.sinica.edu.tw , located in Taiwan, and the second iscambridge.intel-research.net , located in the UK.
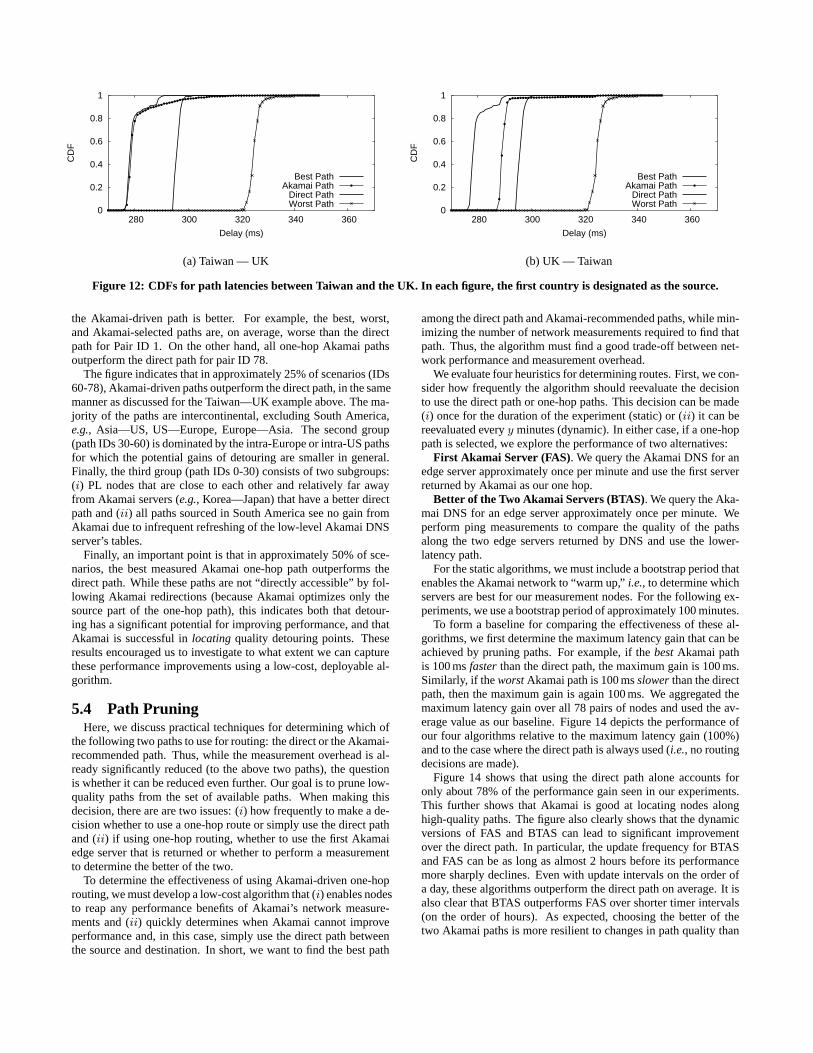
Figure 12 plots the CDF functions of the RTTs for the followingpaths. (i) Best path, defined as the path with the lowest RTT ineach 20-second-long measurement roundamong the ten one-hoppaths and the direct path; (ii) Akamai’s path, defined as theaverageof the two one-hop paths via the two edge servers selected (andfrequently updated) by Akamai. (iii) Direct path, measured fromthe source to the destination; (iv) Worst path, defined as the pathwith the highest RTT in each measurement round among all eleven(ten one-hop and one direct) paths. In Figure 12(a), the Taiwannode is the source; in Figure 12(b), the UK node is the source.
The CDF curves from Figure 12 illustrate the gains that can beachieved by using Akamai’s one-hop paths. For example, Aka-mai’s path is nearly optimal in the Taiwan case, outpacing the di-rect path by nearly 20 ms. On the other hand, while the paths cho-sen using Akamai’s “recommendations” from the UK are subopti-mal, they still generally beat the direct path. To shed more lighton these results, we collected statistics for the Akamai servers seenby each node. For the Taiwan node, 80% of edge server “hits” arein Tawain, 15% in Japan, and 5% in the US. For the UK’s node,75% of the hits are in the UK, and 25% are in the US. The largenumber of servers close (in the same country) to the source nodesindicates that the gains over the direct path come from avoiding hotspots close to the sources. Moreover, whenever the “middle nodes”are not in the country of origin, they are still placed along a highquality path to the destination, thus improving the performance.
5.3 Aggregate ResultsIn this section, we study a much broader range of sources and
destinations to determine the performance of Akamai-driven one-hop source routing. For this study, we assemble a list of PL nodeslocated in the US (6), Europe (3), Asia (3), and South America (2).We then pair all nodes with each other by randomly choosing thesource and destination for each pair. Out of 91 attempted paths,78 successfully completed 3-day-long experiments, while the restfailed (e.g., due to a PL node rebooting).
-300-250-200-150-100-50
0 50
100 150 200
0 10 20 30 40 50 60 70 80Dire
ct m
inus
one
-hop
late
ncy
(ms)
Pair id
Average of two returned paths
Figure 13: Latency differences between one-hop routing anddirect-path routing.
Figure 13 illustrates the difference between the latency using adirect path and the Akamai one-hop paths, all measured over short,20-second-long, time scales. For each pair, we compute the bestand the worst (out of ten) one-hop Akamai paths, and the average ofthe two one-hop paths returned by Akamai. A negative value meansthat the corresponding direct path is better for the pair; otherwise,
0
0.2
0.4
0.6
0.8
1
280 300 320 340 360
CD
F
Delay (ms)
Best PathAkamai Path
Direct PathWorst Path
(a) Taiwan — UK
0
0.2
0.4
0.6
0.8
1
280 300 320 340 360
CD
F
Delay (ms)
Best PathAkamai Path
Direct PathWorst Path
(b) UK — Taiwan
Figure 12: CDFs for path latencies between Taiwan and the UK. In each figure, the first country is designated as the source.
the Akamai-driven path is better. For example, the best, worst,and Akamai-selected paths are, on average, worse than the directpath for Pair ID 1. On the other hand, all one-hop Akamai pathsoutperform the direct path for pair ID 78.
The figure indicates that in approximately 25% of scenarios (IDs60-78), Akamai-driven paths outperform the direct path, in the samemanner as discussed for the Taiwan—UK example above. The ma-jority of the paths are intercontinental, excluding South America,e.g., Asia—US, US—Europe, Europe—Asia. The second group(path IDs 30-60) is dominated by the intra-Europe or intra-US pathsfor which the potential gains of detouring are smaller in general.Finally, the third group (path IDs 0-30) consists of two subgroups:(i) PL nodes that are close to each other and relatively far awayfrom Akamai servers (e.g., Korea—Japan) that have a better directpath and (ii) all paths sourced in South America see no gain fromAkamai due to infrequent refreshing of the low-level Akamai DNSserver’s tables.
Finally, an important point is that in approximately 50% of sce-narios, the best measured Akamai one-hop path outperforms thedirect path. While these paths are not “directly accessible” by fol-lowing Akamai redirections (because Akamai optimizes only thesource part of the one-hop path), this indicates both that detour-ing has a significant potential for improving performance, and thatAkamai is successful inlocating quality detouring points. Theseresults encouraged us to investigate to what extent we can capturethese performance improvements using a low-cost, deployable al-gorithm.
5.4 Path PruningHere, we discuss practical techniques for determining which of
the following two paths to use for routing: the direct or the Akamai-recommended path. Thus, while the measurement overhead is al-ready significantly reduced (to the above two paths), the questionis whether it can be reduced even further. Our goal is to prune low-quality paths from the set of available paths. When making thisdecision, there are are two issues: (i) how frequently to make a de-cision whether to use a one-hop route or simply use the direct pathand (ii) if using one-hop routing, whether to use the first Akamaiedge server that is returned or whether to perform a measurementto determine the better of the two.
To determine the effectiveness of using Akamai-driven one-hoprouting, we must develop a low-cost algorithm that (i) enables nodesto reap any performance benefits of Akamai’s network measure-ments and (ii) quickly determines when Akamai cannot improveperformance and, in this case, simply use the direct path betweenthe source and destination. In short, we want to find the best path
among the direct path and Akamai-recommended paths, while min-imizing the number of network measurements required to find thatpath. Thus, the algorithm must find a good trade-off between net-work performance and measurement overhead.
We evaluate four heuristics for determining routes. First, we con-sider how frequently the algorithm should reevaluate the decisionto use the direct path or one-hop paths. This decision can be made(i) once for the duration of the experiment (static) or (ii) it can bereevaluated everyy minutes (dynamic). In either case, if a one-hoppath is selected, we explore the performance of two alternatives:
First Akamai Server (FAS). We query the Akamai DNS for anedge server approximately once per minute and use the first serverreturned by Akamai as our one hop.
Better of the Two Akamai Servers (BTAS). We query the Aka-mai DNS for an edge server approximately once per minute. Weperform ping measurements to compare the quality of the pathsalong the two edge servers returned by DNS and use the lower-latency path.
For the static algorithms, we must include a bootstrap period thatenables the Akamai network to “warm up,”i.e., to determine whichservers are best for our measurement nodes. For the following ex-periments, we use a bootstrap period of approximately 100 minutes.
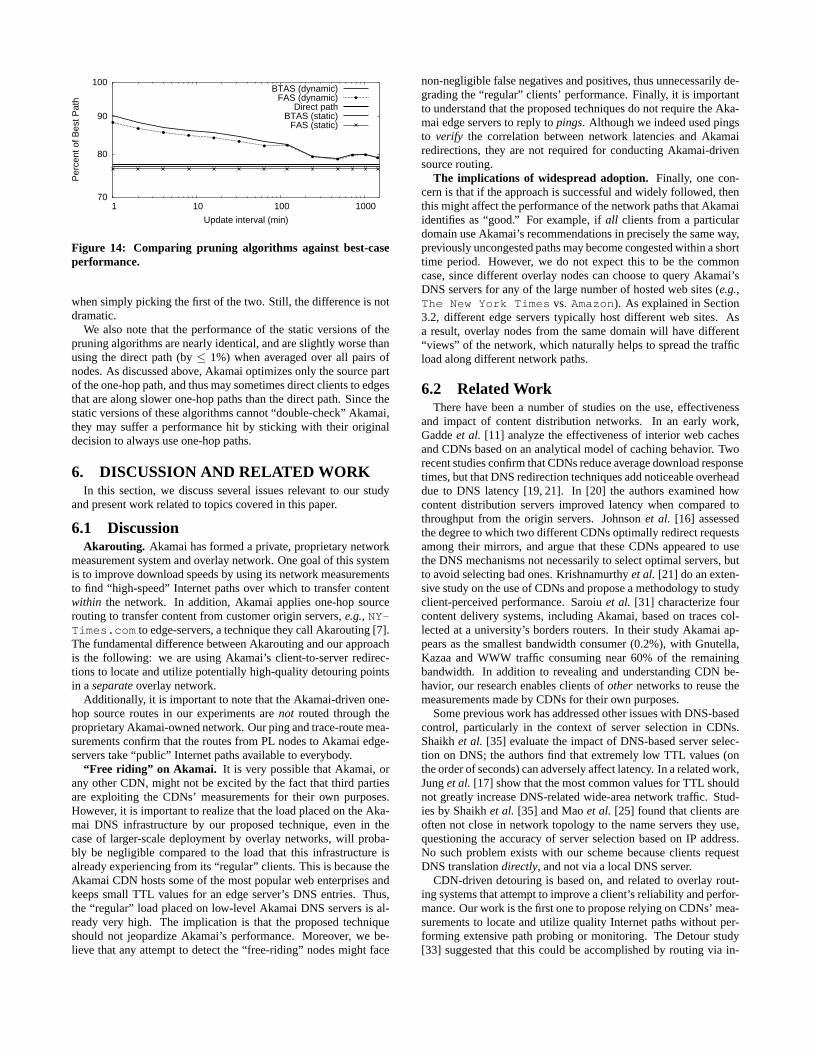
To form a baseline for comparing the effectiveness of these al-gorithms, we first determine the maximum latency gain that can beachieved by pruning paths. For example, if thebestAkamai pathis 100 msfasterthan the direct path, the maximum gain is 100 ms.Similarly, if theworstAkamai path is 100 msslowerthan the directpath, then the maximum gain is again 100 ms. We aggregated themaximum latency gain over all 78 pairs of nodes and used the av-erage value as our baseline. Figure 14 depicts the performance ofour four algorithms relative to the maximum latency gain (100%)and to the case where the direct path is always used (i.e., no routingdecisions are made).
Figure 14 shows that using the direct path alone accounts foronly about 78% of the performance gain seen in our experiments.This further shows that Akamai is good at locating nodes alonghigh-quality paths. The figure also clearly shows that the dynamicversions of FAS and BTAS can lead to significant improvementover the direct path. In particular, the update frequency for BTASand FAS can be as long as almost 2 hours before its performancemore sharply declines. Even with update intervals on the order ofa day, these algorithms outperform the direct path on average. It isalso clear that BTAS outperforms FAS over shorter timer intervals(on the order of hours). As expected, choosing the better of thetwo Akamai paths is more resilient to changes in path quality than
100
90
80
70 1 10 100 1000
Per
cent
of B
est P
ath
Update interval (min)
BTAS (dynamic)FAS (dynamic)
Direct pathBTAS (static)
FAS (static)
Figure 14: Comparing pruning algorithms against best-caseperformance.
when simply picking the first of the two. Still, the difference is notdramatic.
We also note that the performance of the static versions of thepruning algorithms are nearly identical, and are slightly worse thanusing the direct path (by≤ 1%) when averaged over all pairs ofnodes. As discussed above, Akamai optimizes only the source partof the one-hop path, and thus may sometimes direct clients to edgesthat are along slower one-hop paths than the direct path. Since thestatic versions of these algorithms cannot “double-check” Akamai,they may suffer a performance hit by sticking with their originaldecision to always use one-hop paths.
6. DISCUSSION AND RELATED WORKIn this section, we discuss several issues relevant to our study
and present work related to topics covered in this paper.
6.1 DiscussionAkarouting. Akamai has formed a private, proprietary network
measurement system and overlay network. One goal of this systemis to improve download speeds by using its network measurementsto find “high-speed” Internet paths over which to transfer contentwithin the network. In addition, Akamai applies one-hop sourcerouting to transfer content from customer origin servers,e.g., NY-Times.com to edge-servers, a technique they call Akarouting [7].The fundamental difference between Akarouting and our approachis the following: we are using Akamai’s client-to-server redirec-tions to locate and utilize potentially high-quality detouring pointsin aseparateoverlay network.
Additionally, it is important to note that the Akamai-driven one-hop source routes in our experiments arenot routed through theproprietary Akamai-owned network. Our ping and trace-route mea-surements confirm that the routes from PL nodes to Akamai edge-servers take “public” Internet paths available to everybody.
“Free riding” on Akamai. It is very possible that Akamai, orany other CDN, might not be excited by the fact that third partiesare exploiting the CDNs’ measurements for their own purposes.However, it is important to realize that the load placed on the Aka-mai DNS infrastructure by our proposed technique, even in thecase of larger-scale deployment by overlay networks, will proba-bly be negligible compared to the load that this infrastructure isalready experiencing from its “regular” clients. This is because theAkamai CDN hosts some of the most popular web enterprises andkeeps small TTL values for an edge server’s DNS entries. Thus,the “regular” load placed on low-level Akamai DNS servers is al-ready very high. The implication is that the proposed techniqueshould not jeopardize Akamai’s performance. Moreover, we be-lieve that any attempt to detect the “free-riding” nodes might face
non-negligible false negatives and positives, thus unnecessarily de-grading the “regular” clients’ performance. Finally, it is importantto understand that the proposed techniques do not require the Aka-mai edge servers to reply topings. Although we indeed used pingsto verify the correlation between network latencies and Akamairedirections, they are not required for conducting Akamai-drivensource routing.
The implications of widespread adoption. Finally, one con-cern is that if the approach is successful and widely followed, thenthis might affect the performance of the network paths that Akamaiidentifies as “good.” For example, ifall clients from a particulardomain use Akamai’s recommendations in precisely the same way,previously uncongested paths may become congested within a shorttime period. However, we do not expect this to be the commoncase, since different overlay nodes can choose to query Akamai’sDNS servers for any of the large number of hosted web sites (e.g.,The New York Times vs. Amazon). As explained in Section3.2, different edge servers typically host different web sites. Asa result, overlay nodes from the same domain will have different“views” of the network, which naturally helps to spread the trafficload along different network paths.
6.2 Related WorkThere have been a number of studies on the use, effectiveness
and impact of content distribution networks. In an early work,Gaddeet al. [11] analyze the effectiveness of interior web cachesand CDNs based on an analytical model of caching behavior. Tworecent studies confirm that CDNs reduce average download responsetimes, but that DNS redirection techniques add noticeable overheaddue to DNS latency [19, 21]. In [20] the authors examined howcontent distribution servers improved latency when compared tothroughput from the origin servers. Johnsonet al. [16] assessedthe degree to which two different CDNs optimally redirect requestsamong their mirrors, and argue that these CDNs appeared to usethe DNS mechanisms not necessarily to select optimal servers, butto avoid selecting bad ones. Krishnamurthyet al. [21] do an exten-sive study on the use of CDNs and propose a methodology to studyclient-perceived performance. Saroiuet al. [31] characterize fourcontent delivery systems, including Akamai, based on traces col-lected at a university’s borders routers. In their study Akamai ap-pears as the smallest bandwidth consumer (0.2%), with Gnutella,Kazaa and WWW traffic consuming near 60% of the remainingbandwidth. In addition to revealing and understanding CDN be-havior, our research enables clients ofother networks to reuse themeasurements made by CDNs for their own purposes.
Some previous work has addressed other issues with DNS-basedcontrol, particularly in the context of server selection in CDNs.Shaikhet al. [35] evaluate the impact of DNS-based server selec-tion on DNS; the authors find that extremely low TTL values (onthe order of seconds) can adversely affect latency. In a related work,Junget al. [17] show that the most common values for TTL shouldnot greatly increase DNS-related wide-area network traffic. Stud-ies by Shaikhet al. [35] and Maoet al. [25] found that clients areoften not close in network topology to the name servers they use,questioning the accuracy of server selection based on IP address.No such problem exists with our scheme because clients requestDNS translationdirectly, and not via a local DNS server.
CDN-driven detouring is based on, and related to overlay rout-ing systems that attempt to improve a client’s reliability and perfor-mance. Our work is the first one to propose relying on CDNs’ mea-surements to locate and utilize quality Internet paths without per-forming extensive path probing or monitoring. The Detour study[33] suggested that this could be accomplished by routing via in-
termediate end systems. The Resilient Overlay Network (RON)project demonstrated this to be the case in a small-scale overlay [5].This, however, required background monitoring that is not scalableand therefore limits the approach to communication among a rel-atively small set of nodes. The solution proposed in [36] relieson end-to-end probing of the overlay paths and the inference of theloss probabilities on the underlying physical path segments, whichsuffers from similar scalability limitations.
In order to limit the resource requirement for overlays, more re-cent studies have focused on reducing the end-to-end measurementneeded to select overlay paths. In [28], the authors propose a rout-ing underlay dedicated to topology probing. With the help of thisunderlay, one can use inferred AS path information to constructdisjoint paths between communicating nodes. The potential prob-lem of this method is the accuracy of AS path inference. For in-stance, [25] showed that AS path inference can often be much lessaccurate than expected. Gummadiet al. [13] select relay nodes byrandomly choosingk overlay nodes (random-k) and selecting theone with the best performance. With a smallk, there is clearly therisk that random selection, while avoiding outages, will discard agood relay node. Indeed, the key difference between the random-kand Akamai-driven one-hop source routing is the former is intendedto improve system’sreliability by avoiding network outages, whilethe goal of our scheme is to improve clients’performanceby select-ing and hopping over quality (low-latency) paths as recommendedby Akamai.
MONET looks to increase web site availability by taking advan-tage of redundant client-to-web-server paths whose failure modesare expected to be largely independent. Clients contact web sitesvia a local MONET proxy that is multi-home with multiple lo-cal interfaces. MONET increases the number of alternative pathsthrough an overlay network of peer proxies that can probe a givenorigin server using a TCP SYN by request [6]. Undoubtedly, CDN-driven detouring has the potential to improve the performance ofthe above systems; not only by more efficiently avoiding networkoutages and hot spots, but by eliminating the need to probe a num-ber of Internet paths, thus reducing the TCP SYN stress placed onweb servers.
In another closely related work, Feiet al. [10] use AS-level pathinformation inferred fromtraceroute to reduce the size of thecandidate set for one-hop routing. The goal is to limit the overheadin selecting middle hops by examining only nodes along paths be-tween the origin and destination that diverge in the AS-level pathas early as possible. While able to avoid performance degradationover direct paths, it is unclear how the proposed technique couldbe extended toonline, dynamicselection of middle nodes. In addi-tion, the proposed heuristic normally yields a large number of po-tential middle nodes (up to 50) which, due to the coarse resolutionof AS-level path disjointness, may not include good candidates.CDN-driven detouring typically results in a very small number ofcandidates selected based on measurements performed by the CDNas part of its normal operation.
Finally, our work is inspired by tools like Sting [32], T-BIT [26],and King [14], which use existing protocols “in unanticipated waysto obtain results that were previously intractable [14].”
7. CONCLUSIONSIn this paper, we performed an extensive measurement study
of the Akamai CDN; the goal was to determine how one canin-fer andutilize quality, short time-scale information regarding net-work conditions without the cost of extensive network measure-ment. By concurrently measuring network paths and monitoringthe frequently refreshed low-level Akamai DNS server tables, we
showed that: (i) Akamai-server redirections strongly correlate withnetwork conditions on the paths between clients and servers; morethan 70% of paths chosen by Akamai are among the best 10% ofthe measured network paths. (ii) For a given client, the correla-tion level predominantly depends on the inter-redirection frequencyof the corresponding low-level Akamai DNS server. (iii) Due tolow redirection frequencies, clients from South America experi-ence correlation levels that arebelowthat achievable by a randomor round-robin path selection. (iv) Because Akamai customers areheterogeneously hosted on the edge servers, all investigated clientssee a large number of servers (paths) for at least one of the cus-tomers. (v) CDN services that utilize network measurements andglobal server deployment can significantly outperform traditionalweb content distribution that use load-balancing server farms in afew data centers.
To provide a sample application, we studied the potential for uti-lizing Akamai redirections to drive one-hop source routes (i.e., de-tours) in a large-scale overlay network. By concurrently measuringand comparing Akamai-driven one-hop with direct paths betweennodes scattered around the globe, we show that (i) in more than50% of investigated scenarios, it is better to route through the nodes“discovered” by Akamai than to use direct paths. (ii) in 25% ofinvestigated scenarios, a better-than-direct path can be utilized byalways following Akamai redirections at the source. (iii) The vastmajority of Akamai-driven paths between Asia and Europe belongto the above category; in addition to avoiding local hot spots, theyexploit rich Akamai “proxy” infrastructure placed in between thetwo — e.g., in the US. (iv) Other nodes can apply simple, low-overhead techniques to decide whether to stick with the direct path,or to draft behind Akamai. We conclude by noting that Akamai isonly one of many CDNs; such networks are a great resource thatcan be exploited to obtain “a global Internet weather-report ser-vice” for little to no cost.
8. REFERENCES
[1] Akamai and loral cyberstar alliance.http://www.akamai.com/en/html/about/press/press123.html .
[2] Kazaa.http://www.kazaa.com/ .[3] Planetlab.http://www.planet-lab.org/ .[4] Akamai. Akamai CDN.http://www.akamai.com .[5] D. Andersen, H. Balakrishnan, F. Kaashoek, and R. Morris.
Resilient overlay networks. InACM SOSP, Alberta, Canada,October 2001.
[6] D. Andersen, H. Balakrishnan, F. Kaashoek, and R. Rao.Improving web availability for clients with MONET. InNSDI, Boston, MA, May 2005.
[7] C. Bornstein, T. Canfield, and G. Miller. Overlay routingnetworks (Akarouting), 2002.http://www-math.mit.edu/steng/18.996/lecture9.ps .
[8] C. Bornstein, T. Canfield, G. Miller, and S. Rao. Optimalroute selection in a content delivery network. US PatentApplication 20020163882.
[9] J. Dilley, B. Maggs, J. Parikh, H. Prokop, and R. Sitaraman.Globally distributed content delivery.IEEE InternetComputing, 6(5):50–58, September 2002.
[10] T. Fei, S. Tao, L. Gao, and R. Guerin. How to select a goodalternate path in large peer-to-peer systems? InIEEEINFOCOM, Barcelona, Spain, April 2006.
[11] S. Gadde, J. Chase, and M. Rabinovich. Web caching andcontent distribution: a view from the interior. InWCW,Boston, MA, June 2000.
[12] P. Gilmore. OARtech, 2001.http://www.osc.edu/oarnet/oartech/presents/oarnet/11apr2001.ppt .
[13] K. Gummadi, H. Madhyastha, S. Gribble, H. Levy, andD. Wetherall. Improving the reliability of Internet paths withone-hop source routing. InUSENIX OSDI, San Francisco,CA, December 2004.
[14] K. Gummadi, S. Saroiu, and S. Gribble. King: Estimatinglatency between arbitrary Internet end hosts. InACM IMW,Marseille, France, November 2002.
[15] A. Habib and J. Chuang. A measurement-based analysis ofresidential multihoming. InIEEE INFOCOM, poster session,Miami, FL, March 2005.
[16] K. Johnson, J. Carr, M. Day, and M. Kaashoek. Themeasured performance of content distribution networks. InWCW, Lisbon, Portugal, May 2000.
[17] J. Jung, E. Sit, H. Balakrishnan, and R. Morris. DNSperformance and the effectiveness of caching.IEEE/ACMTransactions on Networking, 10(5):589–603, October 2002.
[18] J. Kangasharju, K. Ross, and J. Roberts. Performanceevaluation of redirection schemes in content distributionnetworks.Computer Communications, 24(2):207–214,February 2001.
[19] M. Koletsou and G. Voelker. The Medusa proxy: A tool forexploring user-perceived web performance. InWCW,Boston, MA, June 2001.
[20] B. Krishnamurthy and C. Wills. Analyzing factors thatinfluence end-to-end web performance. InWCW,Amsterdam, Netherlands, April 2000.
[21] B. Krishnamurthy, C. Wills, and Y. Zhang. On the use andperformance of content distribution networks. InACM IMW,San Francisco, CA, November 2001.
[22] F. Leighton and D. Lewin. Global hosting system. US PatentNo. 6,108,703.
[23] LimeLight Networks. Limelight networks CDN.http://www.limelightnetworks.com .
[24] R. Mahajan. How Akamai works?http://www.cs.washington.edu/homes/ratul/akamai.html .
[25] Z. Mao, C. Cranor, F. Douglis, M. Rabinovich,O. Spatscheck, and J. Wang. A precise and efficientevaluation of the proximity between web clients and theirlocal DNS servers. InUSENIX Annual TechnicalConference, Monterrey, CA, June 2002.
[26] A. Medina, M. Allman, and S. Floyd. Measuring theevolution of transport protocols in the Internet.ACMSIGCOMM Computer Communication Review, 35(2):37–52,April 2005.
[27] Mirror Image. Mirror image CDN.http://www.mirror-image.net .
[28] A. Nakao, L. Peterson, and A. Bavier. A routing underlay foroverlay networks. InACM SIGCOMM, Karlsruhe, Germany,August 2003.
[29] North American Network Operators’ Group. NANOGmailing list.http://www.nanog.org/mailinglist.html ,1999,2000.
[30] J. Padhye, V. Firoiu, D. Towsley, and J. Kurose. ModelingTCP Reno performance: A simple model and its empiricalvalidation.IEEE/ACM Transactions on Networking,8(2):133–145, April 2000.
[31] S. Saroiu, K. Gummadi, R. Dunn, S. Gribble, and H. Levy.An analysis of Internet content delivery systems. InUSENIXOSDI, Boston, MA, December 2002.
[32] S. Savage. Sting: a TCP-based measurement tool. InUSENIXAnnual Technical Conference, Boulder, CO, October 1999.
[33] S. Savage, A. Collins, E. Hoffman, J. Snell, and T. Anderson.The end-to-end effects of Internet path selection. InACMSIGCOMM, Vancouver, British Columbia, September 1999.
[34] SAVVIS. Digital island CDN.http://www.savvis.net .
[35] A. Shaikh, R. Tewari, and M. Agrawal. On the effectivenessof DNS-based server selection. InIEEE INFOCOM,Anchorage, AK, April 2001.
[36] C. Tang and P. K. McKinley. A distributed multipathcomputation framework for overlay network applications.Technical Report MSU-CSE-04-18, Michigan StateUniversity, May 2004.