
Draft UEGCL Energy Mix Diversification Strategy
97
July 2008 1 ENERGY MIX DIVERSIFICATION STRATEGY FOR THE UGANDA ELECTRICITY GENERATION COMPANY LTD (“UEGCL”) March 3, 2021 Submission Date: March 3, 2021 Contract Number: USEA/LEI-2020-765-75-01 Activity Start Date and End Date: May 15, 2020 – March 3, 2021 Activity Location: Kampala, Uganda [Remote Consultation] Submitted by: London Economics International 717 Atlantic Avenue, Suite 1A Boston, MA 02111 Prepared for: United States Energy Association 1300 Pennsylvania Avenue NW Suite 550, Mailbox 142 Washington, DC 20004
Transcript of Draft UEGCL Energy Mix Diversification Strategy

July 2008 1
ENERGY MIX DIVERSIFICATION STRATEGY
FOR THE UGANDA ELECTRICITY
GENERATION COMPANY LTD (“UEGCL”)
March 3, 2021
Submission Date: March 3, 2021
Contract Number: USEA/LEI-2020-765-75-01
Activity Start Date and End Date: May 15, 2020 – March 3, 2021
Activity Location: Kampala, Uganda [Remote Consultation]
Submitted by: London Economics International
717 Atlantic Avenue, Suite 1A
Boston, MA 02111
Prepared for: United States Energy Association
1300 Pennsylvania Avenue NW
Suite 550, Mailbox 142
Washington, DC 20004

2
ENERGY MIX DIVERSIFICATION STRATEGY
FOR THE UGANDA ELECTRICITY
GENERATION COMPANY LTD (“UEGCL”)
DISCLAIMER
This publication was made possible by the support of the American people through the United States Agency
for International Development (“USAID”). The contents are the responsibility of the Consultants and the
United States Energy Association, and do not necessarily reflect the views of USAID or the United States
Government.

3
TABLE OF CONTENTS
TABLE OF CONTENTS....................................................................................................................................3
TABLE OF FIGURES...........................................................................................................................................5
ACRONYMS AND ABBREVIATIONS ..........................................................................................................7
EXECUTIVE SUMMARY ..........................................................................................................................9
1.1 UEGCL Strategy highlights ...................................................................................................... 12
1.2 Recommendations for the sector ......................................................................................... 14
PLANNING FOR AN ENERGY MIX DIVERSIFICATION ........................................................... 15
2.1 Diversification for a more resilient utility ........................................................................... 15
2.2 Institutional structure to support efficient planning strategy ......................................... 17
2.3 Review of best practices planning in international jurisdictions ..................................... 17
2.4 Key takeaways from case studies and recommendations for the UEGCL and Uganda
25
ASSESSING PROSPECTIVE TECHNOLOGIES FOR THE ENERGY MIX
DIVERSIFICATION ......................................................................................................................................... 27
3.1 Technical and operational considerations for prospective technologies ..................... 27
3.2 The case for solar development in Uganda ......................................................................... 27
3.3 The case for wind development in Uganda ......................................................................... 30
3.4 The case for geothermal development in Uganda ............................................................. 32
3.5 Key takeaways for UEGCL ..................................................................................................... 36
ANALYZING AND QUANTIFYING THE NEEDS TO BE ADDRESSED BY THE ENERGY
MIX DIVERSIFICATION ................................................................................................................................ 38
4.1 Developing a load forecast (demand) ................................................................................... 40
4.2 Developing an energy production forecast (supply) ......................................................... 44
4.3 Summary of results from supply-demand balance analysis .............................................. 53
4.4 Opportunities for the incorporation of new renewable generation ............................ 54
4.5 Hedging against uncertainties ................................................................................................. 55
4.6 Known restrictions imposed by the transmission system ............................................... 57
4.7 Potential feasible locations to connect generation resources to the Ugandan
transmission system .................................................................................................................................... 59
4.8 System Connection Costs ....................................................................................................... 61
PROPOSED STRATEGY (IN THE SHORT TO LONG TERM) TO ACHIEVE ENERGY MIX
DIVERSIFICATION ......................................................................................................................................... 63
5.1 Action items for the Short-term (2020-2024) ................................................................... 63
5.2 Action items for the Mid-term (2025-2030) ....................................................................... 64
5.3 Action items for the Long-term (2031-2040) .................................................................... 64

4
FINANCING THE ENERGY MIX DIVERSIFICATION STRATEGY .......................................... 66
6.1 Financing activities in the short term: capacity building and planning ........................... 66
6.2 Financing activities in the mid-term: renewables development ...................................... 66
6.3 Financing activities in the long-term ..................................................................................... 74
ADDITIONAL THOUGHTS AND INDUSTRY WIDE RECOMMENDATTIONS ............... 75
7.1 Recommendations for the sector ......................................................................................... 75
7.2 Recommendations relative to project development ........................................................ 76
APPENDIX A – DETAILED SUPPLY-DEMAND BALANCE ANALYSIS .................................. 78
8.1 Illustration of Supply-demand balance (capacity) over the 2020-2040 horizon ......... 79
8.2 Illustration of supply-demand balance (energy) over the 2020-2040 horizon ............ 80
APPENDIX B – FRAMEWORK FOR DEVELOPING A POWER SYSTEM EXPANSION
PLAN ................................................................................................................................................................... 84
APPENDIX C – ATTACHMENT - LCOE MODEL DEVELOPED FOR UEGCL ...... 89
APPENDIX D– SUMMARY OF COST ANALYSIS: IMPACT OF VARIOUS
FINANCING STRUCTURES ON PROJECT ($/KW-YEAR) AND ENERGY COST ($/MWH) .. 90
11.1 Impact of the choice of financing structure on development ($/kW) and energy
costs ($/MWh) ............................................................................................................................................. 90
11.2 Sensitivity analysis ...................................................................................................................... 93
APPENDIX E – WORKS CITED ........................................................................................... 96

5
TABLE OF FIGURES
Figure 1. Key lessons for Uganda from case studies ................................................................................ 10 Figure 2. Illustration of the 5-step methodology ...................................................................................... 11 Figure 3. UEGCL strategy highlights and key recommendations for Uganda .................................... 12 Figure 4. Uganda installed capacity and generation .................................................................................. 15 Figure 5. Case studies key characteristics .................................................................................................. 18 Figure 6. Kenya economy and electricity sector snapshot ..................................................................... 19 Figure 7. Kenya institutional framework ..................................................................................................... 20 Figure 8. Panama economy and electricity sector snapshot .................................................................. 21 Figure 9. Panama institutional framework .................................................................................................. 22 Figure 10. Ghana economy and electricity sector snapshot .................................................................. 23 Figure 11. Ghana institutional framework .................................................................................................. 24 Figure 12. Solar irradiation in Uganda ......................................................................................................... 28 Figure 13. Wind resource maps of Uganda ............................................................................................... 31 Figure 14. Risk profile of geothermal development ................................................................................. 34 Figure 15. Illustration of the 5-step methodology .................................................................................... 39 Figure 16. 2020-2029 Base and high load forecasts adopted in this study ......................................... 41 Figure 17. Base and High Load Demand Forecasts, 2020-2040 ............................................................ 42 Figure 18. Energy Demand Forecasts (GWh) (Base and High), 2020-2040 ....................................... 43 Figure 19. Capacity (MW) Forecasts (Base and High), 2020-2040 ...................................................... 43 Figure 20. Power Plants in Uganda (Q2 2020) .......................................................................................... 45 Figure 21. Generation Projects Currently Licensed ................................................................................ 46 Figure 22. Capacity available in year 2024 to meet load demand from existing and future licensed
power plants (by technology) ........................................................................................................................ 48 Figure 23. Annual average energy output from existing power plants ................................................ 50 Figure 24. Annual average energy output from future licensed power plants .................................. 51 Figure 25. Base Case electricity supply and demand in the Ugandan power system (2020-2024)
.............................................................................................................................................................................. 51 Figure 26. Actual energy production from the Nalubaale and Kiira power plants (2004-2011) .. 52 Figure 27. Electricity supply and demand in the Ugandan power system under drought
conditions (2020-2024) ................................................................................................................................... 53 Figure 28. Summary of Results from Supply-Demand Balance Analysis ............................................ 53 Figure 29. Summary of deficit (capacity and energy) (no drought) ...................................................... 54 Figure 30. Energy Hedging with a 300 MW VRE Plant ............................................................................ 57 Figure 31. Main 220 kV and 132 kV Actual Transmission System in Uganda .................................... 60 Figure 32. Unit costs ........................................................................................................................................ 62 Figure 33. Sample of tools available to UEGCL in a government-sponsored financing model ...... 68 Figure 34. Summary of pros and cons of public financing tools ............................................................ 69 Figure 35. Sample of key players per type .................................................................................................. 69 Figure 36. Sample of tools available to UEGCL in a private financing model .................................... 70 Figure 37. Summary of pros and cons of private financing tools .......................................................... 71 Figure 38. Sample of key players per type .................................................................................................. 72 Figure 39. Sample of tools available to UEGCL in a hybrid financing model ..................................... 73 Figure 40. Summary of pros and cons of hybrid approach financing tools ......................................... 73 Figure 41. Annual supply-demand balance in Uganda (2020-204) with existing and licensed (but
not yet operational) generation .................................................................................................................... 78 Figure 42. Supply-Demand capacity balance 2020-2040 (Base Load Case) ........................................ 79 Figure 43. Supply-Demand capacity balance 2020-2040 (High Load Case) ........................................ 80 Figure 44. Supply-Demand energy balance 2020-2040 (Base Load Case) .......................................... 81

6
Figure 45. Supply-Demand energy balance 2020-2040 (Base Load Case, Drought Conditions) .. 82 Figure 46. Supply-Demand energy balance 2020-2040 (High Load Case) .......................................... 83 Figure 47. Supply-Demand energy balance 2020-2040 (High Load Case, Drought Conditions) .. 83 Figure 48. Power Systems Planning Approach .......................................................................................... 85 Figure 49. Solar baseline LCOE estimates across various financing structures ................................ 91 Figure 50. Wind baseline LCOE estimates across various financing structures ............................... 92 Figure 51. Geothermal baseline LCOE estimates across various financing structures ................... 93 Figure 52. Solar: illustration of LCOE sensitivity to key underlying variables ................................... 94 Figure 53. Wind: illustration of LCOE sensitivity to key underlying variables .................................. 94 Figure 54. Geothermal: illustration of LCOE sensitivity to key underlying variables ...................... 95

7
ACRONYMS AND ABBREVIATIONS
AFD Agence Francaise de Developpment
ASEP Autoridad Nacional de los Servicios Públicos
ATB Annual Technology Baseline
BEIS UK Department of Business, Energy and Industrial Strategy
BESS battery energy storage system
CSP Concentrated Solar Power
EAIF Emerging Africa Infrastructure Fund
ECG Electricity Company of Ghana
EGESA Electricity Generation Company
EIB European Investment Bank
ENS Energy-Not-Served
EPP emergency power producers
EPRA Energy and Petroleum Regulatory Authority
ERA Electricity Regulatory Authority
ERERA ECOWAS Regional Electricity Regulatory Authority
ESMAP Energy Sector Management Assistance Program
ETESA Empresa de Transmisión Eléctrica S.A.
EXIM Bank Export-Import Bank of the United States
FIT Feed-In Tariff
GA Grid Advisors
GDC Geothermal Development Company
GDevP UETCL Grid Development Plan
GoU Government of Uganda
GRIDCo Ghana Grid Company
GRMF Geothermal Risk Mitigation Facility
HFO Heavy Fuel Oil
IDB Islamic Development Bank
IFC International Finance Corporation
IPP Independent Power Producers
IPS Industrial Promotion Services
IRENA International Renewable Energy Agency
IRP Integrated Resource Plan
ISO Independent System Operator
KENGEN Kenya Generation Company
KIF Danish Climate Investment Fund
KPLC Kenya Power and Lighting Company

8
LCEEP Least Cost Electricity Expansion Plan
LCOE levelized cost of energy
LEI London Economics International LLC
MEMD Ministry of Energy and Mineral Development
MoEP Ministry of Energy and Petroleum
NDPII National Development Plan II
NEDCo Northern Electricity Distribution Company
NGS National Geothermal Strategy
PAUESA Power Africa Uganda Electricity Supply Accelerator
PURC Public Utilities Regulatory Commission
PV Photovoltaic
RPO Renewable Energy Purchase Obligation
SAEMS South Asia Energy Management Systems
SGPU Strategic Geothermal Planning Unit
SMR Small Modular Reactor
SNE Secretaria Nacional de Energia (National Energy Secretariat)
SPCC System Planning Coordination Committee
SPV special purpose vehicle
UDB Uganda Development Bank
UEGCL Uganda Electricity Generation Company Limited
UETCL Uganda Electricity Transmission Company Limited
UIA Uganda Investment Authority
USEA United States Energy Association
USTDA United States Trade and Development Agency
VRE variable renewable energy sources
WAPP West African Power Pool

9
EXECUTIVE SUMMARY
London Economics International LLC (“LEI”) and Grid Advisors LLC (“Grid Advisors” or “GA”), together
the “LEI team,” were retained by the United States Energy Association (“USEA”) to support the Uganda
Electricity Generation Company Limited (“UEGCL”) in developing an Energy Mix Diversification Strategy
in order to meet UEGCL´s 5-Year Strategic Plan 2018-2023, as well as its longer-term development plans.
Ahead of this report, the LEI team completed two deliverables – an inception report and a technical
report. The inception report documented the project kickoff with USEA and UEGCL, and summarized
the team’s preliminary findings from the review of existing information and data received from UEGCL.
The technical report detailed the team’s collection and review of technical data including existing studies
on network infrastructure, project development, renewables integration, generation planning, and grid
development.
Throughout the engagement, the LEI team regularly met and engaged with government agencies active in
the Ugandan Electricity Supply Industry (“ESI”), including the Electricity Regulatory Authority (“ERA”), the
Ministry of Energy and Mineral Development (“MEMD”), the Uganda Electricity Transmission Company
Limited (“UETCL”), and the Uganda Investment Authority (“UIA”). The LEI team also interviewed other
stakeholders in the power sector such as Power Africa Uganda Electricity Supply Accelerator (“PAUESA”),
and the Uganda Development Bank (“UDB”), as well as two renewable energy developers, Tryba Energy,
and Industrial Promotion Services (“IPS”).
As a first step in the development of a diversification strategy, the LEI team reviewed the drivers
underpinning the requirement for a more diversified energy mix in Uganda. Rigorous, orderly, and
organized planning being a prerequisite to achieving any diversification goal, the team then explored best
practices in institutional design and planning through the review of a sample of emerging economies with
hydro-dominated power systems. A summary of findings and recommendations is presented in Figure 1
below.

10
Figure 1. Key lessons for Uganda from case studies
Next, under the technical review, a five-step deterministic supply-demand balance analysis was performed
to quantify the needs a diversified energy mix would address. Consistent with the LEI team’s mandate to
solely rely on existing documentation and resources, the team refined available supply/demand projections
to derive credible load and generation forecasts that would inform the determination of system needs
UEGCL would consider while implementing its diversification strategy. The five-step methodology relied
upon in the technical review is depicted in Figure 2.
Following this analysis, and while taking into account total capacity already controlled by UEGCL, it was
determined that in order to address growing demand and reach goals of energy mix diversification, UEGCL
should consider installing up to 300 MW of available capacity1 by year 2030, and between 894 MW and
1,938 MW of additional available capacity by the year 2040. Given the lead time, and the nature of activities
associated with project development in general i.e., scouting and securing land, data gathering,
interconnection process, financing planning and else, UEGCL should strive to plan for these additions as
early as possible.
1 Available capacity means nameplate capacity times the expected availability of the specific technology.
Key lesson Country observed in Details
Integrated resource
planning at a country
level
▪ Kenya
▪ Panama
▪ Ghana
▪ It is important to establish harmonization of sector
planning into a single long-term plan with a common set of
inputs and assumptions
▪ For Uganda, the benefits of developing an IRP process may
outweigh the costs, for instance streamlining the various
planning processes taking place across multiple entities
Generation planning
at a company level
▪ Kenya
▪ Ghana
▪ The LEI team observed various generators acquiring
internal capabilities and skillset that allow them to
develop their own generation plan
▪ The LEI team would recommend UEGCL to develop its
own independent generation plan which findings would
then be inputted into an industry wide planning
▪ Similar to Ghana, one might envision the Sector Planning and
Coordination Committee (“SPCC”) to also carry out short
term planning at the country level to track opportunities
and threats to the system; this could further enhance
UEGCL’s generation planning

11
Figure 2. Illustration of the 5-step methodology
The LEI Team determined that capacity additions for UEGCL (in the mid-term in particular) should be
primarily made up of solar (with or without battery energy storage system –“BESS”), wind and/or
geothermal technologies, based on a number of criteria ranging from the availability of the primary energy
resources in Uganda (solar irradiation, wind regime or geothermal potential), the consideration of these
resources in both UEGCL’s strategic plan and the country’s overall development plan, along with the
potential ripple effects deploying such technologies could generate throughout Uganda’s economy. Uganda
is naturally endowed with generous solar irradiation, there is extensive accumulated knowledge regarding
greenfield development of solar farms (more than 50 MW currently operating in the country), technology
costs have been on a steady decline and the trend is expected to continue. Solar is proven to be technically
feasible and financeable in Uganda. Although wind and geothermal technologies were reviewed in detail,
we recommend that UEGCL consider these technologies when the quality of resources is proven and/or
when lessons learned from actual development of these resources in Uganda are available.
Once the system needs and the energy mix composition were identified, we next conducted a high-level
assessment of the state of the grid by reviewing available studies that discuss the existing electricity
network, grid planning, and the grid’s ability to evacuate power under existing constraints. From the team’s
review, we established that the grid could integrate over 100 MW (on aggregate) of wind and solar at
specific locations without any upgrades to the transmission network. However, to accommodate the full
suggested 300 MW of renewable technologies by 2030 plus as much as 1,938 MW of a mix of renewable
and conventional generation by 2040, a series of improvements will need to occur, and additional
transmission system investments may be warranted.
Based on the LEI team’s findings and the assumed composition of the energy mix, an implementation
strategy was developed to guide UEGCL toward its goals. This strategy was supplemented with feedback
gathered from stakeholders and comments received from UEGCL. As a result, we propose in this report
Step 2: Refining existing generation expansion plans
Step 3: Develop deterministic supply-demand balance
Step 4: Identify opportunities for renewable development
Step 5: Assess feasibility of integration of renewables into system
Step 1: Refining existing demand forecast

12
a combination of guidelines applicable not only to UEGCL but also to the rest of the industry. In fact, we
conclude that some targeted regulatory changes and planning reforms at the system level might be key in
enabling a successful implementation of any energy mix diversification (for UEGCL). In the following
paragraphs, we highlight key aspects of the strategy developed for UEGCL and point out key
recommendations for the sector.
Figure 3. UEGCL strategy highlights and key recommendations for Uganda
1.1 UEGCL Strategy highlights
Short term (2020-204)
• Solicit the support from MEMD and ERA to lead generation planning activities in cooperation and
collaboration with the other key stakeholders.
• Hire and retain staff to nurture and preserve institutional knowledge on matters related to
regulatory, planning, engineering, construction and project development; cultivating such internal
knowledge will empower UEGCL to execute its mandate with limited reliance on external
technical support while developing expertise that could be in turn leveraged and potentially
monetized. Concurrently, we recommend that ERA and the MEMD consider setting up a process
for knowledge sharing / skill transfer to improve UEGCL’s competitiveness. In the case of wind
technology for instance, we would hope IPPs developing the first few wind projects in Uganda to
share critical data (such as data on wind regime) and lessons learned with UEGCL in a systematic
fashion.
For UEGCL For Uganda’s Power Sector
• Acquire the capability to independently develop a long
term generation plan (for UEGCL and Uganda)
• Hire, retain and train staff on regulatory, planning,
engineering, construction, and project development
matters
• Scout, acquire and secure land for project development
• Preserve institutional knowledge of renewables and
storage technologies via skills-transfer mechanisms with
IPPs
• Maintain and improve operations of existing fleet
• Continue working on ongoing initiatives (such as co-
location of solar on hydro sites; geothermal wellhead)
• Developing an Integrated Resource Plan (“IRP”) at
the country level. The IRP could be sponsored by
MEMD which in turn would delegate the technical
work to a dedicated entity independent of the
regulatory authority
• Legislative review of all key institutions and agencies
to better define roles and responsibilities in
generation planning; MEMD and ERA to provide
support to UEGCL for executing its mandate to lead
generation planning activities while collaborating
narrowly with all relevant stakeholders
• Synching up licensing and other generation expansion
activities under a centralized generation planning
process, to enable new development to primarily be
based on system needs
• Regulatory framework guiding the formalization of an
ancillary service market under which services
providers will be compensated
Sh
ort
term
Med
ium
term
Lo
ng t
erm
• Continue updating generation plan on an annual basis
• Develop new renewable resources preferably in modular
plants of 50 MW
• Engineer, procure and construct renewable resources
based on system needs and UEGCL’s plan
• Carry out conceptual engineering studies for the
renewable power plants
• Continue updating the least cost generation expansion
on an annual basis
• Continue development of new installation based on
system needs
• Leverage opportunity to develop up to 1.9 GW of
generation by 2040

13
• Acquire the capability (i.e., hire personnel, acquire tools, and training) to independently develop
long term least-cost generation plans and to update them on an annual basis; and actively
participate in the joint planning committee.
• Improve operations of ongoing fleet; UEGCL should take all the necessary steps to ensure it
maximizes the life duration of the assets under its control to avoid extended forced outages or
early retirement, which then could trigger additional needs of capacity additions.
• Start the development process of new renewable resources by scouting, acquiring and securing
sites where these plants could be located, and perhaps establishing measurement equipment to
ascertain the quality of the renewable resource (e.g., wind or solar).
• Continue ongoing initiatives such as the co-location of solar installation on hydropower sites and
consider implementing geothermal wellhead plants.
By 2024, once the foundational work has occurred UEGCL would be in a position to carry out the
required capacity addition that it will rely upon to diversify its supply mix.
Action items for the Mid-term (2025-2030)
The LEI team makes the following recommendations for the mid-term:
• UEGCL to continue updating its least cost generation expansion plan on an annual basis.
• Carry out conceptual engineering studies for the renewable power plants, including the
infrastructure required to connect the plant to the grid and the need for additional reinforcements
in the transmission system.
• Findings of studies carried out until then, would be leveraged to derive an estimate of
development, operation and maintenance costs, which will be used to further refine estimate of
the economic feasibility of the projects.
• We recommend that UEGCL continue the development process of new renewable resources
preferably in modular plants of 50 MW by completing the licensing process with ERA, and by
performing all necessary feasibility and environmental studies.
• Engineer, procure and construct renewable resources as determined by the latest version of the
generation expansion plans that UEGCL would be updating on a continuous basis.
Action items for the Long term (2031-2040)
The LEI team makes the following recommendations for the long-term:
• UEGCL to continue updating the least cost generation expansion plan on an annual basis.
• UEGCL can participate in the provision of the system needs with a mix of renewable, BESS and
conventional technologies.
• With the demand forecast presented, for the 2031-2040 period, the new generation requirements
are such that VREs alone might not be sufficient to address the system needs – rather it would
need to be complemented with other technologies. Findings from the LEI team’s technical review
suggest the opportunity to add between 894 MW and 1,938 MW by 2040 depending on the actual

14
load demand that materializes in the future. For this purpose, the possibility of exploiting hydro
and geothermal sources, and adding efficient thermal sources of diverse nature should be
explored.
1.2 Recommendations for the sector
• Develop an Integrated Resource Plan (“IRP”) at the country level. The development of an
Integrated Resource Plan based on assumptions agreed upon by key stakeholders will enable
better consistency across planning activities, reduce inefficiency and will be conducive to orderly
transmission and generation expansion in Uganda. We envision the IRP to be sponsored (issued)
by an entity such as MEMD which could, if necessary, delegate the technical work to a dedicated
entity independent of the regulatory authority.
• Existing planning activities from ERA (including licensing), MEMD or UEGCL are not coordinated
and are rooted in different assumptions and long-term outlook. As a result, the Uganda system
has increasingly become over-supplied, giving way to new challenges such as generation
curtailment or the limited ability of the grid to continuously absorb large influx of generation. We
recommend that licensing and generation development activities in Uganda become driven by
system needs and remain tied to a common generation expansion plan. A way to formalize this
process would be to develop an annual procurement whereby total capacity injection required in
the system is allocated to developers in a competitive process. This would result in a generation
addition process that is orderly (quantity, location and timing of needs will be identified in the
system planning) and cost effective (i.e., based on a competitive process).
• We recommend a legislative review of all key institutions and agencies to better define roles and
responsibilities in generation planning and procurement. We recommend that UEGCL benefits
from the support of MEMD and ERA to lead planning activities on the generation side (similar to
UETCL on the transmission side) while collaborating closely with all relevant stakeholders.
• As of now, it is our understanding that none of the resources providing spinning reserves for the
entire system are compensated for this grid-wide reliability service. In other words, there are
limited incentives to provide such ancillary services, whose need is increasing with the large influx
of renewables. We recommend that ERA with the support of MEMD lays out the regulatory
framework guiding the formalization of an ancillary services regime under which ancillary service
providers are compensated when providing these services. Compensating ancillary services
providers will not only remunerate existing providers for services already delivered to the grid,
but it will also stimulate participation in the provision of these services, thus further enhancing
reliability across the overall system.
• Finally, we would encourage not only UEGCL but also the other key stakeholders to solicit
technical and financial support from USAID, Power Africa and USEA, while navigating through the
suggested reforms and acting on the various recommendations. It is reasonable to assume that
key stakeholders could benefit from some level of support and assistance in planning, capacity
building, software acquisition, training and else.

15
PLANNING FOR AN ENERGY MIX
DIVERSIFICATION
Energy system planning best practice suggests that an energy mix consisting of resources complementary
to each other is more resilient and reliable in the face of ever changing operating conditions.2 Specifically,
system planners should ensure both resource and location diversity in their energy mix in order to achieve
their goals of a secured, sustainable and reliable system.3 Implementing a long-term energy plan requires
not only actively coordinating with various relevant stakeholders across the industry, but also a strong
and coherent institutional framework to ensure that the plan is carried out effectively. This section first
provides a discussion on the drivers underpinning the need for a more diversified energy mix in Uganda.
Formal, orderly, and organized planning is a prerequisite to achieving any goal of energy mix diversification.
Once we highlighted the need for energy mix diversification in Uganda, we explored best practices in
institutional design and planning through the review of a sample of case studies to provide guidance to
UEGCL’s in its generation planning and provide recommendations to improve planning at the country
level.
2.1 Diversification for a more resilient utility
Uganda has about 1.3 GW of installed capacity, with hydro comprising ~1 GW (80% of total installed
capacity).4 Recent data on annual generation shows that in 2018, large hydro and small hydro combined
for nearly 90% of total generation in Uganda. A summary of these operating statistics is illustrated in Figure
4 below.
Figure 4. Uganda installed capacity and generation
Source: ERA, UEGCL
2 IESO website. Managing A Diverse Supply of Energy. 2020.
3 Li, Xianguo. "Diversification and localization of energy systems for sustainable development and energy security."
Energy policy 33.17 (2005): 2237-2243.
4 Data received from UEGCL on June 15, 2020.
Installed capacity (2020)
Total = 1,293 MW Total = 3.9 TWh
Generation (2018)
Cogeneration
8%
Hydro
80%
Solar PV
4%
Thermal (HFO)
8%
Bagasse
4%
Large
Hydro
82%
Small
Hydro
7%
Solar
1%
Thermal
6%
16
Looking at the fuel and generation mix, it is apparent that Uganda is heavily reliant on hydro generation
and therefore susceptible to hydrological fluctuations and changing weather patterns. This vulnerability
was observed in 2005 and 2006, as well as between 2011 and 2012, whereby Uganda endured periods of
drought which resulted in load-shedding and procurement of power from costly emergency power
producers (“EPPs”).5 These events had a negative impact on the economy through productivity loss
originating from poor electricity access during load shedding events, lost revenues through energy not
served, and higher electricity costs due to costly EPPs.
As a result of this vulnerability, it is prudent for Uganda to seek a more diverse supply mix that includes
a variety of fuel sources, that are reliable, secure and affordable. For UEGCL, the case to diversify its
supply mix is derived from its own strategic plan. Specifically, UEGCL has indicated it seeks to be a leading
power producer in the Great Lakes region, and to achieve this goal, it is sound business strategy to have
a diverse portfolio to ensure it has a fleet available to meet a variety of needs, under variable market
conditions. In addition, as a state-owned entity, UEGCL can position itself as a champion of Government
policy to diversify the power supply in Uganda, while supporting the goals of the National Development
Plan and the national energy policy.
While UEGCL may decide to pursue diversification through a mix of renewable and non-renewable or
thermal technologies, it is likely that renewables offer the most optimal pathway for diversification. The
case for renewables as a tool to diversify the UEGCL supply mix is made by considering the various
national planning objectives, the availability of favorable resources within Uganda, the opportunity to
accelerate human capacity development (with training and other transfer of knowledge), and the chance
to create jobs and stimulate economic growth. Specifically, Uganda’s National Development Plan (“NDP”)
III target for 2025 is 3,500 MW of installed capacity, and the country has an ambitious target of 41,738
MW by 2040.6 The relatively short development times for renewables such as solar and the availability of
abundant natural resources (solar irradiation in particular) in Uganda can support these goals. In addition,
Uganda has expressed a desire to remain committed to its emissions reduction and sustainability goals as
part of NDP III; renewable technologies would be pivotal in meeting its goals.7
A review of multiple documents made available to the team (including, among others
“2016_ERALeastCostGenerationPlan2016”, “2015_REP_ERAGridAnalysisReport” and “SPCC Report on Load
Growth”) revealed a general consensus among stakeholders that the existing planning and implementation
paradigm is fragmented. This is seen particularly in the nature of plans and strategies within the sector,
such as the UEGCL Strategic Plan (2018 – 2023),8 UETCL’s Grid Development Plan (2018 – 2040), and
other policy papers such as the Rural Electrification Strategy Paper 2030 and Electricity Connection Policy
2017. While all these plans and strategies have a common direction, they do not appear to be directly
complementary or specifically coordinated. The creation of the System Planning Coordination Committee
(“SPCC”), a working committee regrouping key stakeholders of the power sector, remains nonetheless a
key step in the right direction toward increased collaboration and organized planning. The LEI team
reviewed planning practices and institutional design in a sample of jurisdictions sharing commonalities with
5 Eberhard, A. & Godinho, C. Lessons from Power Sector Reform: The Case of Uganda. World Bank Group. April 2019.
P. 16.
6. National Planning Authority. Third National Development Plan (NDPIII) 2020/21 – 2024/25. June 2020.
7 National Planning Authority. Third National Development Plan (NDPIII) 2020/21 – 2024/25. June 2020.
8 UEGCL. Five-Year Strategic Plan (2018-2023). 2018.

17
Uganda with the goal of extracting key takeaways that could be leveraged to provide guidance on
improving planning at both the UEGCL and the country levels.
2.2 Institutional structure to support efficient planning strategy
A generation planning exercise is one that allows the utility, region, or state to meet growing demand
safely and reliably in the future. The key principle of reliability is also supported by the other planning
principles of least cost supply, and in a manner that maximizes resources and mitigates environmental
impact. A summary of best practices in utility resource planning is discussed in the following textbox.
In several jurisdictions around the world, this planning function is undertaken by a single planning entity,
usually the utility, but with support from other organizations. Where the utility is unbundled, the planning
would often reside with the system operator, which is responsible for forecasting demand, and who may
even be responsible for identifying, proposing, or procuring least cost solutions to meet demand. The LEI
team understands that UETCL would be the entity mandated to develop such planning at the country
level.
2.3 Review of best practices planning in international jurisdictions
The purpose of the case studies exercise is to extract useful and practical recommendations to improve
planning process in Uganda. We have considered three case studies: Kenya, Panama, and Ghana. Figure 5
summarizes key characteristics of the jurisdictions of study.
Best Practices in Utility Resource Planning
For electric utilities, an integrated resource plan (“IRP”) represents a utility plan for meeting
forecasted annual peak and energy demand, as well as a pre-determined established reserve margin
for reliability purposes. To do this, a utility can seek to use a combination of supply-side and demand-
side resources for a specified period of time. This planning process is resource-intensive, and typically
mandated by the regulator, but its benefits typically outweigh the costs because it could be designed
for the entire system (country). The key principles established from best practice in the US indicate
the following traits of a good IRP process:
• stakeholder engagement: involvement of a varied group of stakeholders, including
consumers and developers, is a key input into the planning process;
• regulatory oversight: an independent third party, typically a regulator, is an important entity
in ensuring fairness in the process, and setting and enforcing rules; and
• establishing a process: a regular time period with clear processes should be set. Other
processes should include fuel prices, environmental costs and constraints, evaluation of
existing resources, selection plans and action plans.
Source: Wilson, Rachel and Bruce Biewald. "Best Practices in Electric Utility Integrated Resource Planning." Regulatory
Assistance Project and Synapse Energy Economics. 2013.

18
Figure 5. Case studies key characteristics
*Includes 5.9 MW of off grid supply
†Includes 181.6 MW of embedded generation.
Sources: ERA; Energy and Petroleum Regulatory Authority (Kenya); National Authority of Public Services (Panama); Public Utilities
Regulatory Commission (Ghana).
In each case study, we answer the following questions:
• What is the existing institutional framework in the power sector as it pertains to planning and
diversification?
• To what extent does the current framework support energy mix diversification?
• What is the key function of a state-owned generation company in energy mix diversification?
Across the jurisdictions reviewed, we observed a distinct planning paradigm for the electricity sector that
we highlighted. For instance, in Kenya, while the long-term sector plan is managed and issued by the
Ministry of Energy and Petroleum (“MoEP”), there are elements of planning performed internally by
entities such as the Geothermal Development Company (“GDC”) and the transmission company,
KETRACO. In Ghana, long-term planning is driven by the Energy Commission, while short-term planning
is carried out in a collaborative process by a committee of industry stakeholders (a committee akin to the
SPCC in Uganda). In Panama, both short and long-term planning activities are concentrated within one
Uganda Kenya Panama Ghana
Population (2019) 44.3 million 52.6 million 4.2 million 30.4 million
GDP/Capita
(US$, 2019)$777 $1,817 $15,731 $2,202
Installed
Capacity
(MW)
1,252* 2,712 3,854 5,172†
Peak Demand
(MW)629 1,859 1,969 2,613
Share of
hydroelectric
capacity (%)
80% 30% 46% 31%
Electricity
Market
Structure
Unbundled Partially-unbundled Unbundled Unbundled

19
entity, the Secretaria Nacional de Energia (“SNE”). We explore each of these elements in greater detail
in the following sub-sections.
Kenya: centralized planning and private market participation
Neighboring Uganda to the east, and a member of the East African Community (“EAC”), Kenya is Uganda’s
major economic trading partner in the region. The two East African nations share a border and access to
Lake Victoria, along with Tanzania. With regards to resource endowment, Kenya has historically relied on
hydroelectric generation, but over the last decade has increasingly relied on geothermal capacity to
provide a significant proportion of baseload generation.9 Kenya’s power sector is characterized by a blend
of state and private sector participation in the generation sector, and a state-owned monopoly in
transmission and distribution. A snapshot of the sector is shown in Figure 6 below.
Figure 6. Kenya economy and electricity sector snapshot
Sources: Energy and Petroleum Regulatory Authority.
Kenya began sector reforms in the 1990s, but its unbundling was limited to the generation sector, through
the unbundling and eventual partial listing of Kenya Generation Company (or “KenGen”). In the wires
segment, transmission and distribution remained under the purview of the Kenya Power and Lighting
Company (“KPLC” or “Kenya Power”). In 2008, the Kenya Transmission Company (“KETRACO”) was
established to build new transmission lines – existing high voltage lines would remain under the ownership
and maintenance of KPLC. Also, in 2008, the Geothermal Development Company (“GDC”) was formed
to undertake geothermal exploration, and support sector de-risking – a detailed discussion on the
geothermal sector in Kenya is found in Section 3.4 later in this report. Sector policy is set by the Ministry
of Energy and Petroleum, and the regulator is the Energy and Petroleum Regulatory Authority (“EPRA”),
formerly the Energy Regulatory Commission. A summary of the institutional framework in Kenya is shown
in Figure 7 below.
9 Eberhard, A. & Godinho, C. Learning from Power Sector Reform: The Case of Kenya. World Bank Group. April 2019.
Installed capacity by fuel
Hydro
31%
Thermal
Oil
30%
Geothermal
24%
Wind
12%
Co-generation
1%
Solar
2%
Key Facts
Population 52.6 Million
GDP/Capita (US$) 1,817
Transmission lines (KM) 7,420
Distribution lines (KM) 226,279
Peak demand (MW) 1,859
Installed capacity (MW) 2,712

20
Figure 7. Kenya institutional framework
Sources: Energy and Petroleum Regulatory Authority
One of the key events in Kenya’s power sector development was the prolonged drought of 1999 to 2000.
Similar to Uganda, the drought conditions and poor hydroelectric output resulted in frequent load
shedding events that had damaging consequences for both the utilities and the economy. Some estimates
suggest that because of the reduced industrial activity, Kenya’s GDP declined 0.6% and Kenya Power
revenues declined by nearly $20 million.10
As of this writing, Kenya has seen investments in a variety of technologies, including a large scale and
successful geothermal program of over 650 MW, over 400 MW of wind generation, and over 50 MW of
utility-scale solar. This mix of baseload and intermittent renewable technologies has allowed Kenya to
diversify its fuel mix such that it is no longer reliant on its legacy hydroelectric assets. Most recently, the
system operator has indicated that geothermal now provides the bulk of the baseload generation, and
Kenya operates the world’s ninth largest geothermal fleet. The MoEP is the entity responsible for planning,
and the textbox below highlights its function.
10 Parry, Jo-Ellen, et al. "Climate risks, vulnerability and governance in Kenya: A review." Commissioned by: climate
risk management technical assistance support project (CRM TASP), joint initiative of bureau for crisis prevention and
recovery and bureau for development policy of UNDP (2012).
Policy and Regulation
Ministry of Energy and
Petroleum (“MoEP”)
Energy Tribunal (“ET”)
Transmission & Distribution
(Kenya Power, REA, KETRACO)
Energy & Petroleum
Regulatory Authority
(“EPRA”)
Market Participants
Generation
(e.g. GDC, KenGen, IPPs)
National Land
Commission
(“NLC”)
Pla
nn
ing
MoEP as a planner
With respect to long-term planning, the responsibility for development of a sector strategy and
plan resides within the Ministry of Energy and Petroleum (“MoEP’). MoEP develops a medium- and
long-term strategy for both generation capacity development and transmission expansion. The
most recent plan covers a 5-year and 20-year planning horizon, from 2015 to 2020 for the medium
term, and 2015 to 2030 for the long term.
Sources: Ministry of Energy and Petroleum. Development of a Power Generation and Transmission Master Plan.
October 2016

21
A combination of state policy direction,11 robust public, donor and private market investment, and an
independent regulatory regime has allowed for a diverse energy mix in Kenya. Although several marquee
independent power producers are renewable generators (e.g., Lake Turkana Wind Project), a significant
proportion of IPPs are thermal plants. The experience in the geothermal sector is instructive, as it
illustrates the role for capacity building within state-owned entities, and the potential for the state to
reduce risk in a specific sector.
Panama: capitalizing on renewables
Like Uganda, the country of Panama began reforming the electricity sector in the mid-1990s. In 1995,
Panama initiated the reform of its electricity sector with the passage of legislation allowing private
participation in power projects. This was followed in 1996 by the Public Services Regulatory Agency Law,
which established the new institutional arrangements for regulation of public services, including electricity.
Panama is a smaller country than Uganda, located in Central America, but has historically been mostly
supplied by hydroelectric power (close to 50%), with several legacy hydro assets in its system. A summary
of the economy and power sector is illustrated in Figure 8 below.
Figure 8. Panama economy and electricity sector snapshot
Sources: ETESA; World Bank data
Reforms in the sector were driven by the “Electricity Law,” enacted in February 1997. 12 This law
delineates the design of the reformed sector and transitional arrangements to achieve these reforms. At
this time, the state-owned vertically integrated utility, the Hydraulic Resources and Electrification Institute,
was unbundled into separate entities.
The Autoridad Nacional de los Servicios Públicos (National Authority for Public Services – ASEP) is the
industry oversight and regulatory body. Independent System Operator (“ISO”) functions are performed
11 The Energy Act of 2006 established the Energy Regulatory Commission and provided the framework for fuel
pass-throughs and tariff setting. The policy also established the GDC and KETRACO, as well as setting the course
for the partial listing of KenGen on the Nairobi Securities Exchange. In addition, in 2008, a Feed-In Tariff (“FIT”) of
US¢12/kWh was implemented for renewables, and combined with a public procurement legislation established in
2007, allowed for a framework for private sector participation.
12 “Ley No.6 de Febrero de 1997 por la cual se dicta el Marco Regulatorio e Institucional para la Prestación del
Servicio Público de Electricidad.”
Installed capacity by fuel
Hydro
46%
Natural
Gas
10%
Bunker &
Diesel
32%
Wind
7%
Solar
5%
Key Facts
Population 4.2 Million
GDP/Capita (US$) 15,731
Transmission lines (KM) 3,018
Distribution lines (KM) 40,739
Peak demand (MW) 1,969
Installed capacity (MW) 3,854

22
by Empresa de Transmisión Eléctrica S.A. (“ETESA”). ETESA is responsible for transmission system
expansion and operation, indicative generation system expansion planning, and system dispatch. The
Secretaria Nacional de Energia (National Secretariat of Energy – SNE) develops national policies, strategic
plans, and proposes laws in relation to the energy sector. Figure 8 illustrates Panama’s institutional
structure and organization.
Similar to Uganda, Panama has historically relied on hydroelectric power which made it susceptible to
changes in hydrology. Specifically, in 2014, extended drought conditions significantly reduced the output
of the country’s nearly 1.8 GW of hydro capacity. 13 In 2006, the Electricity Generation Company
(“EGESA”), a state-owned generation company was created to develop projects and compete in the
generation market.
Figure 9. Panama institutional framework
Sources: International Renewable Energy Agency. Renewables Readiness Assessment - Panama. 2018; Secretaría Nacional de Energía.
Generación Eléctrica (CEE 1970-2019). August 8, 2020.
Since 1997, Panama has evolved to full competition in the wholesale electricity market, including the
creation of an hourly energy market. It also has a contract market for long-term PPAs between generators
and off-takers. Because Panama uses auctions to determine prices for capacity within the contract market,
the regulator is responsible for setting auctions for certain technologies such as wind and solar. These
auctions have resulted in the increase in the solar and wind capacity from little to no capacity in 2010, to
143 MW and 270 MW respectively.14 As a way of diversifying its electric supply and taking advantage of
favorable resource, wind and solar PV plants first came online in 2013. We discuss the role of SNE in this
planning process in the textbox below.
13 IRENA. Renewables Readiness Assessment: Panama. 2018. International Renewable Energy Agency, Abu Dhabi.
14 Fábrega, José, Denise Delvalle, and Alexis Baúles. "Electricity sector overview." World Small Hydropower
Development Report 2019 4 (2019): 90.
Policy and Regulation
Ministry of
Environment
National Energy Secretariat
(”SNE”)
Transmission
(Electricity Transmission Company, “ETESA”)
Generation
(EGESA, AES Panama, etc.;
Self-/Co-generators)
Market Participants
Distribution
(EDEMET, EDECHI, ENSA)
Operations & Operational Planning
(National Dispatch Centre, “CND”)
National Authority
of Public Services
(“ASEP”)
National Science and Technology
Secretariat
Pla
nn
ing

23
Ghana: balancing role of hydrocarbons and renewables
Historically, Ghana has relied heavily on hydroelectric power and in particular the 900 MW Akosombo
Hydroelectric power station provided sufficient supply for the country’s industries and allowed for export
to neighboring Togo, Burkina Faso, and Benin.15 Similar to Uganda, Ghana’s economy is largely driven by
agricultural output, and its key products of gold, cocoa and wood comprise a significant portion of exports.
Ghana has also greatly expanded its hydrocarbon extraction through offshore drilling of oil and gas
reserves at the Jubilee and TEN Fields.16
Figure 10. Ghana economy and electricity sector snapshot
* Includes 181.6 MW of embedded generation.
† Thermal sources of generation include natural gas, oil, heavy fuel oil, coal and diesel.
Sources: GRIDCo; Energy Commission of Ghana.
The Ministry of Energy is responsible for policy development and implementation, while generation is
supplied by state-owned Volta River Authority, Bui Power Authority and other Independent Power
Producers (“IPPs”). Transmission is the purview of the Ghana Grid Company (“GRIDCo”), and
15 Kumi, Ebenezer. The Electricity Situation in Ghana: Challenges and Opportunities. 2017. CGD Policy Paper.
Washington, DC: Center for Global Development
16 Tullow Oil website. Tullow in Ghana.
Installed capacity by fuel
Hydro, 30%
Thermal†,
69%
Solar,
1%
Key Facts
Population 30.4 Million
GDP/Capita (US$) 2,202
Transmission lines (KM) 6,472
Distribution lines (KM) >72,000
Peak demand (MW) 2,613
Installed capacity (MW)* 5,172
SNE as the planning entity
The mission of the National Energy Secretariat (“SNE”) is to establish and advance the country’s
energy policy, with the aim to guarantee security of supply.
The SNE was the entity responsible for developing the latest National Energy Plan 2015-2050 (PEN
2015-2050), which was established as a long-term roadmap for diversifying the energy sector, and to
allow it to achieve a goal of 70% renewable energy supply by 2050. Under this strategy, solar, wind,
hydro and biomass comprise 77% of total installed capacity, and solar and wind combined will
comprise nearly 8 GW. Under this plan, it is anticipated that renewable development will continue
to be a priority for auction development.
Sources: Secretaría Nacional de Energía. Acerca De. <http://www.energia.gob.pa/acerca-de/>

24
distribution is provided by two utilities, Electricity Company of Ghana (“ECG”) and the Northern
Electricity Distribution Company (“NEDCo”).
The Public Utilities Regulatory Commission (“PURC”) is responsible for economic regulation of the
entities in the sector, while the Energy Commission (“EC”) oversees the entire energy sector, including
technical operation and licensing of operators. Because of the relative importance of regional energy trade,
it is worth noting the roles of the ECOWAS Regional Electricity Regulatory Authority (“ERERA”) which
regulates international electricity trading, which occurs in the West African Power Pool (“WAPP”). Figure
11 illustrates Ghana’s institutional design.
Figure 11. Ghana institutional framework
Sources: Energy Commission; World Bank.
An increase in installed capacity over the last decade has not alleviated supply issues due to constraints
on fuel sourcing, and therefore Ghana’s reliance on hydroelectric power remains. The unreliability of
natural gas supply through the West African Gas Pipeline (“WAGP”) means that thermal capacity in Ghana
is not always available.17 This has left Ghana vulnerable to hydrological changes and declines in water levels
at its two large hydro plants – Akosombo and Bui.
Much of Ghana’s renewable potential remains untapped – as of this writing, there was only 43 MW of
utility-scale solar PV connected to the grid. Researchers have noted that Ghana has excellent resource
for solar PV, wind and biomass, and, to a lesser extent, small hydro. A Feed-In Tariff (“FIT”) and Renewable
Energy Purchase Obligation (“RPO”) was established as part of the Renewable Energy Law of 2011 (Act
882) but has seen limited success as investment focuses on reliability of existing assets and reduction of
distribution losses.
In Ghana, the long-term planning is undertaken by the Energy Commission; this planning is supplemented
by a semi-annual supply and demand analysis (and report) carried out by a working committee made of
key industry players.
17 IRENA. Renewable Readiness Assessment: Ghana. November 2015.
Policy and Regulation
Ministry of Energy
Public Utilities Regulatory
Commission (“PURC”)
Transmission
(Ghana Grid Company, “GRIDCo”)
Generation
(Volta River Authority, Bui Power Authority, IPPs)
Energy
Commission
Market Participants
Distribution
(Electricity Company of Ghana, “ECG” & Northern
Electricity Distribution Company, “NEDCo")
Regional Bodies
(e.g. West African Power Pool, “WAPP”)
ECOWAS Regional
Electricity
Regulatory
Authority
Pla
nn
ing

25
2.4 Key takeaways from case studies and recommendations for the UEGCL and
Uganda
Integrated resource planning at the country level: an important lesson learned for UEGCL that
cuts across all case studies is the harmonization of sector planning into a single long-term plan with a
common set of inputs and assumptions. For Uganda, such an undertaking could take the form of a country-
wide integrated resource plan (“IRP”) that would recognize the diversity of entities in the power sector.
Recognizing that an IRP is a resource-intensive and tedious process, the benefits may nonetheless outweigh
the costs as such plan would streamline the various planning processes taking place across multiple entities
in Uganda. In addition, several structural elements of an IRP process promote efficiencies: for instance,
rules that require that all technologies and solutions are evaluated fairly and on a leveled playing field, and
a public and transparent stakeholder process may promote optimal solutions.18 In a deregulated market
like Uganda, we recommend that UETCL, the system operator, be the entity that leads the IRP
development, in collaboration with the System Planning Coordination Committee.
Generation planning: in addition, we would also encourage UECGL, as an owner and operator, to
acquire and nurture internally the capabilities and skillsets that will allow it to develop its own generation
plan. Such a plan would allow UEGCL to proactively identify needs and efficient remedies to address
evolving energy needs, to ensure a reliable and secure service. Doing so, UEGCL should consider
harmonizing its assumptions and inputs for projects and implementation timeframes with other entities in
the sector. As an added benefit, developing an internal process will allow UECGL to remain current “in
real time” on developing issues and changing market conditions that require adaptability. IRPs are typically
by design multi-year plans that may not necessarily be updated annually (rather every 3 to 5 years), so it
is imperative that UEGCL relies on its own internal process to continue to operate with changing market
conditions. We could also envision Uganda adopting a scheme similar to that of Ghana whereby a joint
committee of stakeholders (such as SPCC) would track, on a semi-annual or annual basis, key parameters
such as supply and demand balance, weather patterns, reservoir levels, hydrology, forced outages, and
18 Wilson, Rachel, and Bruce Biewald. "Best Practices in Electric Utility Integrated Resource Planning." Regulatory
Assistance Project and Synapse Energy Economics (2013).
The Energy Commission is the long-term planning entity
In Ghana, the strategic national energy plan is developed by the Energy Commission with the
collaboration of key stakeholders. So far two long terms planning have been issued the latest one
being for 2020 to 2030. The first one was issue in 2006 and covered the 2006 – 2020 period.
In addition, each year a working group (the Supply Plan Committee) comprising key market players
(GRIDCo, VRA, EC, Bui Power, NEDCo, and Ghana National Petroleum Corp) develops semi-annual
electricity supply plans. The electricity supply plan presents an outlook of electricity demand and
supply for the year of study. It assesses available hydro generation capacities, taking into consideration
reservoir elevations at the beginning of the season, it presents fuel requirements and associated cost
for thermal generation needed to meet electricity demand in the year of study, and evaluates the
associated evacuation requirements to ensure reliable power supply. It highlights the potential
challenges to electricity service delivery in Ghana in the given year, makes recommendations for
actions to be taken to mitigate the potential challenges and ensure reliable power supply. Finally, it
provides a medium-term outlook of electricity demand and supply for the subsequent five-year
period.
Sources: Energy Commission website.

26
other inputs, to make recommendations for actions needed to mitigate potential shortcomings and
proactively address unexpected situations that could threaten the stability of the system and/or raise costs
for ratepayers.
As a concluding note, in light of the system’s vulnerability to volatile weather patterns and variable
hydrology, the LEI team believes that the diversification of UEGCL’s energy mix is warranted and would
be a key medium to achieve reliability and sustainability in the mid- to long-term. It is also worth noting
that improved planning coordination among market players, and the development of a UEGCL’s
generation plan (and concurrently the design of an integrated resource plan at the country level), should
be considered as foundational pillars of UEGCL’s strategy to achieve a diversified energy mix that is
affordable, financeable, reliant on available natural resources, and transformative of the country’s
economy.
UEGCL and Uganda could diversify away from hydropower resources by leveraging the availability of
natural renewables resources. The following section reviews three key renewable technologies (solar,
wind, and geothermal) as prospective candidate resources for UEGCL’s energy mix diversification. The
LEI team considered these key technologies not only because all three are considered in UEGCL’s strategic
plan, but also because they are considered as priority technologies in the National Development Plan.19
Furthermore, developing these technologies could generate the kind of positive ripple effects in the
economy that will meaningfully impact the country’s ability to reach its overall objectives of development.
19 Third National Development Plan, 2020/2021 – 2024/2025.

27
ASSESSING PROSPECTIVE TECHNOLOGIES FOR
THE ENERGY MIX DIVERSIFICATION
In this section the LEI team examines each of the technologies considered (solar, wind, and geothermal)
through multiple angles. We survey resources potential in Uganda and assess the potential for successfully
developing and operating these technologies.
3.1 Technical and operational considerations for prospective technologies
Incorporating any type of generation resource into an electrical power system presents challenges that
may depend on the generation technology, the conditions of the network to which it will be integrated
into, and the potential impact on the environment. Conventional thermal generation has a number of
advantages; for one, there are various fuel types available and established technologies to convert them
into electrical energy. In addition, many thermal technologies are mature and understood, meaning units
achieve high efficiency values in energy conversion, as well as high availability. However, conventional
thermal generation has two fundamental disadvantages. The first is its impact on the environment, through
the emission of greenhouse gases and other hazardous pollutants. The second is the need for the provision
of fossil fuels, which in the case of countries that do not have hydrocarbons means additional imports,
price variability in the world oil market, and dependence on external geopolitical situations. Uganda's on-
grid thermal plants (100 MW in total) use Heavy Fuel Oil (“HFO”) as a fuel. Most of petroleum products
in Uganda are imported from overseas, with about 90% of imports transiting through Kenya and 10%
coming through Tanzania.
In order to hedge against the volatility of petroleum products, jurisdictions around the world have strived
to increasingly incorporate renewable energies in their systems. This trend has been further accentuated
in recent times owed to a combination of greater environmental considerations, technological
development and rapidly collapsing equipment costs. It is also worth noting that the Government of
Uganda’s (“GoU”) Renewable Energy Policy of 2007 states that the Government’s policy vision for
renewable energy is “To make modern renewable energy a substantial part of the national energy
consumption.” Solar, wind and geothermal are not the only renewable technologies with potential in
Uganda. Nevertheless, because the likes of biogas and biomass mostly applies to commercial and industrial
load (most of the existing biomass generation in Uganda is cogeneration; it represents about 96 MW of
capacity), we did not consider it in the discussion.
In its 5 Year Plan, UEGCL is looking to diversify its supply mix by leveraging energy resources that are
readily available, sustainable, and native to Uganda. Solar, wind and geothermal resources presumably
match these criteria. In the subsequent sections, we explore the fit of solar, wind, and geothermal
technologies as candidate technologies for the energy mix diversification, by evaluating the natural
availability of the prime energy sources, discussing the quality of the resources, and assessing general siting,
environmental challenges, along with potential system operation issues.
3.2 The case for solar development in Uganda
There are two basic types of solar generation technology. The first type is Concentrated Solar Power
(“CSP”), which is achieved through the placement of mirrors that reflect sunlight to a single point, through
which a liquid capable of absorbing large amounts of energy passes through. This liquid transfers the energy
to water, producing steam that is used in a turbine.
Although CSP plants have been installed in several places around the world, their initial investment costs
have, of late, made them uncompetitive relative to generation using photovoltaic (“PV”) cells, the second

28
basic type of solar generation technology. The PV option has had the most development in recent years,
so that the levels of efficiency in the use of primary energy have increased while costs have decreased.
Figure 12. Solar irradiation in Uganda
Note: Both DNI and GNI are estimates levels of irradiation. The DNI is an indication of the direct irradiation received in an
element that is perfectly perpendicular to the sun. The GNI considers the zenith angle of the sun and adds the diffuse radiation
(the dispersed in the atmosphere) that can also be received by an element on earth
Source: World Bank
In planning a solar photovoltaic generation installation, the first element to consider is the insolation level
in the area. These levels can be measured directly, but there are public access sources that allow us to
know the levels of insolation. Reference is made to information provided by the World Bank Group, its
SOLARGIS data base and applications, and the facilities provided by the Energy Sector Management
Assistance Program (“ESMAP”). Although there is solar irradiation in any part of the world, it is in tropical
areas where higher irradiation levels and a more homogeneous distribution are achieved throughout the
year. In the case of Uganda, the levels of Direct Normal Irradiation and Global Horizontal Irradiation can
be seen in Figure 12.
As observed in Figure 12, Uganda enjoys good potential for the use of solar energy, with excellent levels
of irradiation in the northern part of the country, and intermediate levels in the southern part of the
country. Taking into consideration both the rapid decrease in the capital costs of PV and the great
irradiation covering most of the territory, it can be concluded that, based on resource quality and
availability alone, solar-based technologies should be considered for integration in the more diversified
generation matrix.

29
Siting and environmental challenges
Regarding siting and environmental, some of the challenges associated with the incorporation of PV
technology are the following:
a) The identification of sites with sufficient size is necessary. With current technologies, it is
estimated that for a project with a 10 MW of installed capacity, a plot of 100,000 m2 (10 hectares)
will be necessary.
b) The land to be located should preferably be flat, without encumbrances or alternative use, such
as agriculture or livestock, close to the population with the expected demand to serve and close
to the transmission/distribution system.
c) Solar farms have low environmental impact. No significant negative effects on the fauna are
expected, nor on the soil water levels. In locations close to airports, care should be taken with
the possibility of glare to the airplanes, which should be evaluated and could lead to the
reorientation of the panels to avoid it.
d) Apart from that, the only identifiable "negative" environmental effect is derived from the visual
impact of the facilities.
The experience of developers in Uganda, and the availability of large tracts of undeveloped land suggests
that large scale solar installations are possible in Uganda. As noted by ERA in the most recent Least Cost
Development Plan, solar PV has the “possibility of harvesting [it] in almost any part of the country.” This unique
feature of solar resource in Uganda provides much flexibility to developers in their ability to site solar
projects close to enabling infrastructures (transmission lines, substations, etc.). It can be concluded that
Uganda is well equipped to host a large deployment of solar farms across the country. Nevertheless, it is
worth noting that land acquisition has increasingly become a source of contention due to the large number
of interests competing for the same resource. Solar development is slated to compete with other
industries requiring large swath of lands such as commercial/industrial real estate, agriculture, processing
plants (for sugar and tea plants for instance) and so on.
System operation challenges
The greatest challenges for incorporating solar energy into a system are of an operational nature. First,
there is the intermittency of the power that can be generated every day and generally throughout the
year. The same happens throughout the day. During the day, in a random and unpredictable way, the solar
radiation that reaches the panels can be interrupted by the passage of clouds, consequently causing a
decrease in production. During these periods, the system must have generation capacity from other
sources to compensate for the decreased solar generation.
Logically when it gets dark, a solar plant is unable to produce energy which then needs to be replaced by
generation from other sources. In other words, an electrical system with the presence of solar generation
must have alternative generation installed (or sufficient storage) to compensate for the expected deficiency
of solar projects when it operates at night. The complementary generation, thermal, or battery energy
30
storage system (“BESS”)20, must always remain synchronized and ready to maintain the generation-load
balance when solar generation decreases; this could result in additional costs.
The sudden variation in solar generation owed to the passage of clouds could also present challenges to
the control of reactive power in the system and the voltage profile. In some areas of the system, reversals
of power flows may occur. To mitigate these effects, several measures must be taken in the system. In the
first place, the inverters of the solar plants should be equipped with the capacity to regulate the injection
of reactive power into the grid in real time. Additionally, it will be necessary to equip the transformers in
the area with on-load tap-changers, implement automatically switchable reactive compensation systems
and, in extreme cases, install regulation systems based on power electronic systems (Statcom).
As of this writing, a total of 50 MW of solar capacity has been installed in Uganda: Soroti Solar (10 MW),
Tororo Solar (10 MW), Xsabo Solar (20 MW), and Mayuge Solar (10 MW). All the projects are solar
photovoltaic systems (some mounted with tracker), and do not include battery energy storage systems.
LEI understands that the current grid system (with the inclusion of both Isimba and Karuma) could, without
operational stress (voltage and frequency issues), accommodate an additional 105 MW.21 This suggests
that UEGCL may have an opportunity to develop a solar plant without major upgrades on the network.
3.3 The case for wind development in Uganda
Similar to solar, the first element to take into consideration for wind development is the availability and
the quality of the primary resource. The International Renewable Energy Agency (“IRENA”) and the
World Bank Group have also developed information on wind resources that could be relied upon to
assess wind resources in Uganda. The absence of rigorous wind measurements in Uganda limits the
availability of good data on wind resources in Uganda, nevertheless prior studies22 indicate that wind
resources in Uganda are poor (see Figure 13 below).
The quality of wind resources is primarily measured by wind speed (average and maximum) taken at 80
to 100 meters of altitude. Wind speed measurements are instrumental in determining the size and nature
of the equipment to be installed. Furthermore, frequency and duration measurements are used to estimate
the energy that can be generated per unit area. A wind regime is deemed average for speed starting at a
measurement around 5 meters/second (“m/s”); a good wind regime will be associated with speed
measurements ranging from 7 to 11 m/s. Wind regime in most of the territory in Uganda is measured at
less than 4 m/s; nevertheless measurements of 7-8 m/s were recorded in a small location of the
Northeastern part of the country.23 The potential for wind development in Uganda is currently estimated
at 815 TWh/year,24 while ERA estimates that around 200 MW can be developed by 2027.25
20 BESS are also increasingly relied upon to mitigate negative effects stemming from the intermittency of solar output.
21 ERA, Grid Analysis For Integration Of Wind/Solar Generation Plants, November 2015.
22 ERA. Least Cost Electricity Expansion Plan 2020-2029. March 2020.
23 IRENA. Estimating the Renewable Energy Potential in Africa: A GIS based approach. August 2014.
24 Ibid.
25 ERA. Least Cost Electricity Expansion Plan 2020-2029. March 2020.
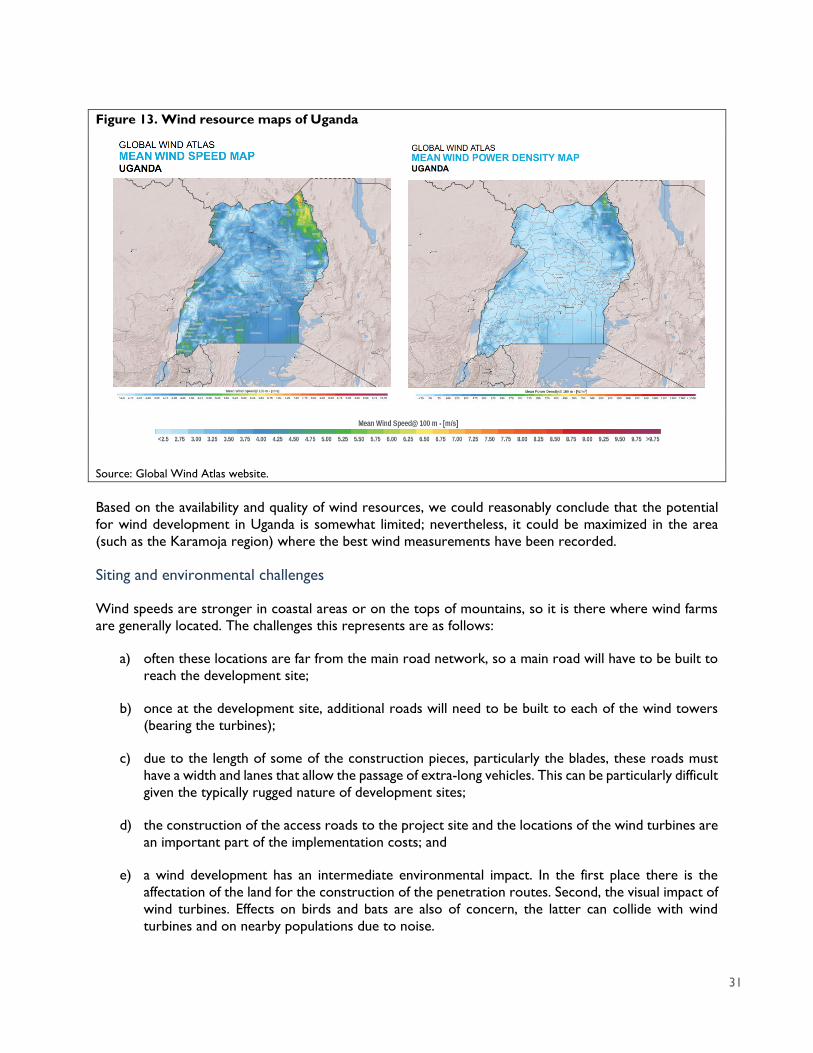
31
Figure 13. Wind resource maps of Uganda
Source: Global Wind Atlas website.
Based on the availability and quality of wind resources, we could reasonably conclude that the potential
for wind development in Uganda is somewhat limited; nevertheless, it could be maximized in the area
(such as the Karamoja region) where the best wind measurements have been recorded.
Siting and environmental challenges
Wind speeds are stronger in coastal areas or on the tops of mountains, so it is there where wind farms
are generally located. The challenges this represents are as follows:
a) often these locations are far from the main road network, so a main road will have to be built to
reach the development site;
b) once at the development site, additional roads will need to be built to each of the wind towers
(bearing the turbines);
c) due to the length of some of the construction pieces, particularly the blades, these roads must
have a width and lanes that allow the passage of extra-long vehicles. This can be particularly difficult
given the typically rugged nature of development sites;
d) the construction of the access roads to the project site and the locations of the wind turbines are
an important part of the implementation costs; and
e) a wind development has an intermediate environmental impact. In the first place there is the
affectation of the land for the construction of the penetration routes. Second, the visual impact of
wind turbines. Effects on birds and bats are also of concern, the latter can collide with wind
turbines and on nearby populations due to noise.
32
From the team’s discussion with stakeholders, and review of publicly available documents, LEI understands
that a 120 MW wind farm is being developed in Karamoja (northeast of the country) which is within the
area where the best wind resources have been currently identified. The project is, at the time of writing
this report, in the development phase.26 We recommend that UEGCL monitor the development of such
projects to gather lessons learned for future utilization.
System operation challenges
Wind generation integration challenges are similar to solar generation. The speed and recurrence of the
winds varies throughout the year, with a tendency to be higher in milder weather and lower in summer.
Compared to solar energy, wind resources are available both in day and night times. On the other hand,
the variations in the intensity of the wind throughout the day are greater than in the solar case, so the
wind power production is more intermittent.
As in the solar case, the system must have generation from other sources to compensate for the power
that the wind farm stops producing when the intensity of the winds decreases. Apart from supporting
generation resources, the system will also require improving its voltage regulation capabilities through on-
load tap changers, automatic commutation compensation equipment and eventually Statcom systems.
The ongoing development of the first wind project could be a critical case study for the rest of Uganda
and provides further insight into the feasibility and viability of deploying wind technologies in Uganda.
Limited reliable information on the quality and the availability of wind resources in Uganda, combined with
the absence of case studies (pilot projects) in Uganda, make the immediate development of such
technology both challenging and risky for UEGCL. Based on these preliminary findings we would
recommend that UEGCL consider the development of wind resources in the mid- to long-term. Lessons
learned from “early movers” would be invaluable resources that UEGCL could rely upon to further
educates itself on risks and challenges associated with wind development.
3.4 The case for geothermal development in Uganda
Technical analysis of geothermal
Geothermal energy takes advantage of the heat emanating from the center of the Earth; it is inexhaustible
and is always available, which is why it is considered renewable energy. Geothermal energy can be used
to generate electricity, with the addition of a steam turbine and generator. However, geothermal energy
can also be used for other processes such as supplying hot water or steam for heating, or for water
desalination processes.
In the case of geothermal generation, the energy conversion process is similar to that of a thermal steam
generation plant, except for the fact that steam is not produced in a boiler powered by fossil fuels but
rather it is obtained directly from the natural source.
The challenge of geothermal generation is to locate an appropriate source of the primary resource.
Geothermal reservoirs can be of hot water or dry (less fluids). In the first case, the internal heat of the
earth directly heats some underground water course or reservoir. In the second case, the heat source
affects the rocky mantle. In some reservoirs the water is at a sufficient temperature to leave naturally in
a gaseous state, which facilitates the extraction of energy from the well to the heat exchangers with the
process water. Once processed, the water must be reinjected to preserve the source. If the temperature
26 Ford, Neil. The rise of grid-scale renewables in Africa. African Business. September 2020.

33
of the well is not sufficient to emit steam, or if it is a dry well, water should be injected. Thus, in general
geothermal developments must have an external water source.
For the planning of a geothermal generation project, it is necessary to locate sites where the heat source
is at reasonable depths and with sufficient energy capacity to make the project economical. In general, the
supply of energy from a geothermal well is constant, so the electricity generation can be what the system
needs. It is a highly manageable project from the point of view of the operation of the system.
From an environmental perspective, this type of technology has low impact due to the lack of hazardous
emissions. Occasionally the extracted steam may contain toxic gases, which must be properly separated
and re-injected. Care must also be taken with the amount of energy to be extracted, as a sudden cooling
of the sources can lead to micro earthquakes and cracks. Likewise, care must be taken with the reinjection
of the water masses that are extracted to maintain the mass balance in the well. Given that appropriate
deposits are often in random areas of the territory, these projects are usually far from the transmission /
distribution system, so it will be necessary to build or strengthen it.
Geothermal potential in Uganda
Uganda has geothermal potential, particularly in Eastern Uganda around Lake Albert, but the resource has
not been developed so far. ERA’s most recent least cost development plan indicates that the country has
a potential of 450 MW.27 As of this writing, feasibility studies have been ongoing in the Kibiro and Panyimur
areas, under a contract Royal Techno Industries.28 The current government policy is to have the private
sector take ownership of most of the technology. The LEI team understands that private developers are
expected to conduct all prerequisite exploration development (including drilling and steam testing),
however this may prove challenging and counter-productive due to high risk/high upfront costs associated
with geothermal exploration.
The first phase of geothermal resource development is the exploration to locate a suitable site for drilling.
Geothermal exploration is characterized by high capital costs for drilling, with no guarantee of successful
results. For this reason, together with the pre-feasibility phase, the exploration phase is the riskiest portion
of the development process. Figure 14 below exhibits the risk profile of key stages in geothermal
development – exploration and pre-feasibility stages are considered to have high risk of sunk costs with
negative returns. However, the risk profile quickly collapses once these stages are successfully completed.
27 ERA. Least Cost Electricity Expansion Plan 2020-2029. 7th Edition. March 2020.
28 We note that in April 2020, following an industrial incident in Kibiro, the Ministry of Energy and Mineral
Development has since halted the feasibility surveys pending a comprehensive Environmental and Social Impact
Assessment on the site. (Source: MEMD. Press Release: Clarification on Oil Spill incident at Kibiro Kigorobya Sub-county,
Hoima district. April 15, 2020.)

34
Figure 14. Risk profile of geothermal development
Source: O’Brien, R. Steamy Investments in British Columbia. Ivey Business Review. March 2015.
In addition, any associated costs with development will be reflected in tariffs, which may be at odds with
the Uganda government priorities to lower tariffs.
Ultimately, although geothermal is a very stable, clean, predictable, and inexpensive source of energy (the
levelized cost of energy could be as low as US$0.04/kWh29 in the very best-case scenarios), it remains a
very difficult resource to develop.
In Uganda, high-risk capital-intensive activities are left to private investors. It is worth noting that costs of
drilling could range from US$1 Million to US$30 Million depending on drilling depth;30 such investment
could be entirely sunk with the risk of yielding zero or a negative return in the event the steam is deemed
of poor quality. This creates a chicken and egg conundrum which challenges the ability of the technology
to be financed and the need for a government intervention. In fact, lenders would often want developers
to get to the feasibility study stage before financing a geothermal project; however, in order to get to the
feasibility study stage, these developers would need some start-up financing to clear all the steps leading
to the feasibility study stage, hence the “catch 22.” Recognizing the inherent risk in the exploration phase
for geothermal, the African Union Commission, in partnership with the German Federal Ministry for
Economic Cooperation and Development (“BMZ”) and the EU-Africa Infrastructure Trust Fund (“EU
ITF”) via KfW established the Geothermal Risk Mitigation Facility (“GRMF”). The program co-finances
surface studies and drilling programs aimed at developing geothermal energy resources in the Eastern
Africa region. Specifically, the facility targets early-stage exploration risk associated with geothermal
projects with a goal of “improving project bankability and to secure external financing.” The program was
launched in 2012 and has ~US$120 million in available funding - it has completed six rounds of funding
since inception, with the most recent held in May 2020.31
29 IRENA. Renewable Power Generation Costs in 2019,International Renewable Energy Agency, Abu Dhabi. 2020
30 Lukawski, Maciej Z., et al. "Cost analysis of oil, gas, and geothermal well drilling." Journal of Petroleum Science and
Engineering 118 (2014): 1-14.

35
The experience in Kenya suggests that, absent a firm commitment from the government and donor
agencies, the industry would not have solved the conundrum and developed the industry to its current
level. As discussed in the textbox below, Kenya’s geothermal industry has benefited from a government
decision to attempt to de-risk the technology for developers by shouldering the most expensive high-risk
stages of development, i.e., appraisal, surface exploration, and scientific testing.
To fully consider geothermal, Uganda should also assess the environmental attributes, creation of a new
industry, and the development of jobs and technical expertise associated with geothermal exploitation.
For instance, in Kenya, KenGen has developed a Centre of Excellence (“CoE”) that provides consultancy
to local and regional clients leveraging its expertise in the sector. The multi-usage, multi-purpose feature
of geothermal technology could be additional benefits that could be considered to make the case for a
government-sponsored geothermal resources exploration campaign. In the meantime, we would
recommend that the volume and quality of geothermal resources should be proven first (at a given site)
before UEGCL considers developing a geothermal facility (including a wellhead plant).

36
3.5 Key takeaways for UEGCL
The analysis in this section suggests that, after considering the various physical, operational, and
technological constraints of each of the three technologies, solar PV appears the most mature technology
to be considered by UEGCL for immediate development. Uganda is endowed with good solar irradiation
throughout its territory, and several solar projects of variable sizes have already been successfully
developed in Uganda. Solar could be considered as “market tested” technology in Uganda. Wind
technology presents a few risks as a prospect mainly due to the lack of reliable data on the resource
quality. Furthermore, the absence of development thus far in Uganda implies that it remains unproven at
a large scale. Nevertheless, the ongoing construction of a wind farm in the Karamoja region indicates that
it might be a matter of time before such resource is deployed at scale. Wind could be considered in
UEGCL’s energy mix once additional reliable information rooted in actual development experience in
Uganda is available. This could happen in the mid-term, within the next 5 to 10 years.
Geothermal development in Kenya
Kenya produced around 45% of its electricity from geothermal sources in 2018, with ~660 MW of
installed capacity, and is the 9th largest geothermal developer in the world. Driven by government,
donor, and private investment in the sector, the case of Kenya shows an industry that has developed
such that both publicly-owned (KenGen) and private developers have commercially operating
geothermal plants.
Geothermal development can be an expensive undertaking due to high upfront capital costs related
to drilling and exploration. A number of key steps have been taken in Kenya to promote geothermal
development, since the first generating plant at Olkaria was commissioned in 1981. With both
taxpayer and donor finance support, the government assumes high upfront risks associated with
initial development phases, which largely entail surface exploration to confirm the resource through
appraisal drilling. Successful exploration and confirmation of resource then leads to increased
participation from other development agencies, private capital and commercial banks, which are then
willing to invest in the sector.
In 2009, the government of Kenya formed the Geothermal Development Company (“GDC”) as a
special purpose vehicle (“SPV”) for resource development. GDC is responsible for surface
exploration through exploration, appraisal, and production drilling aiming to lower the risks for
development ahead of private sector investment.
The government of Kenya has created a National Geothermal Strategy (“NGS”) which aims to attract
private sector investment through three key steps: (i) portfolio exploration of multiple fields; (ii)
stepwise expansion by cautiously increased development; and (iii) parallel development of fields
selected from the portfolio. The NGS is coordinated by the Strategic Geothermal Planning Unit
(“SGPU”) housed in the Ministry of Energy
Finally, it is KenGen, the majority government owned utility, that has seen the most success with
implementation of the geothermal strategy, with over 530 MW of commercially operating plants, and
a strong in-house technical capacity for project development. KenGen has established a Geothermal
Centre of Excellence completing a number of consultancy projects locally and regionally.
Sources: Energy and Petroleum Regulatory Agency. Energy & Petroleum Statistics Report 2019. 2019; KenGen. Integrated
Annual Report & Financial Statements. 2018. Mangi, P. Geothermal Development in Kenya – Country Updates. November 2018.

37
Similarly, geothermal appears to be risky, not only due to limited experience in Uganda, but also due to
the high risk and capital costs associated with drilling and exploration activities. It may not be prudent for
UEGCL to absorb the high capital costs upfront; as a matter of fact, currently UEGCL might not be in a
position to shoulder such high risk. In the long run, the versatility of geothermal resources with application
beyond power generation activity (including agriculture, wellness, and other) could generate support from
the government, which involvement could make the technology attractive for development.
Once the candidate technologies to the energy mix were identified (solar, wind and geothermal), the next
step in developing a strategy for the energy mix diversification consisted of determining the power
infrastructure needs to be filled by the diversified energy mix. For so doing, the LEI team performed a
supply/demand balance analysis relying upon existing studies and available industry data. In section 4, we
describe the methodology relied upon to conduct the need assessment and detail the team’s findings in
the form of the estimated energy mix composition. Section 5 presents the strategy we recommend
UEGCL to implement (in the short, mid and long term) in order to achieve the goals of the energy mix
diversification. Finally, section 6 we provide recommendations on how to finance the strategy in the short,
mid- and long-term, by discussing sources of funding, strategic partnerships and financial tools.

38
ANALYZING AND QUANTIFYING THE NEEDS TO
BE ADDRESSED BY THE ENERGY MIX
DIVERSIFICATION
In accordance with the LEI team’s mandate, section 4 determines the needs an energy mix diversification
would strive to address, on the basis of a deterministic supply-demand balance analysis using available
information. The LEI team is cognizant of the fact that formally, such generation mix diversification strategy
for UEGCL should be determined as a result of a full probabilistic system expansion planning exercise for
the entire Ugandan power system.
The diversified generation resources should typically be modeled as potential expansion options along
with the more traditional alternatives (such as hydro and thermal power plants). Conceptually, if the
planning process explicitly models these renewable energy options and their advantages, the strategy
should logically be a part of the recommended countrywide least-cost expansion program. Further,
besides balancing supply and demand, the full planning exercise would consider trade-offs among numerous
and often conflicting technical, financial, environmental objectives and constraints, throughout the entire
planning period (often 20-30 years into the future). Last, but not least, such analysis must employ
appropriate software simulation tools to also model the uncertain nature of i) the demand with its
variability throughout the day and in different seasons, and ii) generation, due to both the availability of
the generating units and the corresponding primary energy sources.
Other important uncertainties, such as the price of fossil fuels, should also be modeled. Modeling the
uncertainties is particularly important in systems with a high component of hydroelectric generation (such
as the Ugandan power system) and when incorporating variable renewable energy sources (“VRE”), such
as solar or wind. As further discussed elsewhere in this report, we recommend that UEGCL, UETCL and
other relevant players work in a collaborative fashion to conduct such country-wide modeling exercise.
While carrying out a full country-wide planning exercise is beyond the LEI team’s current mandate, for
this exercise, we primarily relied on available systemwide planning studies (and corresponding load
forecasts) for Uganda. We then modified the generation plans from these studies by adding generation in
years where additional supply is needed, in order to achieve a more diversified generation mix for UEGCL,
in line with the Company’s strategic plans. To be more specific, the recommendations for a diversified
supply mix are based on the available forecasts of firm supply from existing generation plans, further
augmented to meet the forecasted load demand when needed.
The methodology relied upon aims to identify windows of opportunity (and timing) for UEGCL to
incorporate feasible alternative generation projects to complement its traditional hydroelectric plants;
while the use of scenario analysis enabled us to assess the robustness of the proposed generation
diversification strategy. This methodology is summarized below (and illustrated in Figure 15):
1. On the basis of available system planning studies for Uganda, we modeled two forecasts of load
demand, a base load demand forecast, and a high load demand forecast for the period from 2020 to
2040.
2. Also, on the basis of available system planning studies we leveraged several generation expansion
plans to meet the projected demand of the base and high load forecasts.
3. We then developed deterministic supply-demand balances for a combination of scenarios formed
by specific combinations of the load demand forecasts and generation expansion plans above.

39
4. Next, based on this supply-demand balance analysis we identified opportunities for the
introduction of alternative and diversified energy resources (other than hydro) that could be
implemented by UEGCL.
5. Finally, based on existing transmission planning studies, we attempted to assess the feasibility of
integrating the renewable resources identified above into the Ugandan power system.
Figure 15. Illustration of the 5-step methodology
The following subsections provide a detailed description of the team’s methodology focusing on the
analysis performed on the load side, the supply side, the demand and supply balance, consideration of the
transmission system and system connection costs, and how all of these inputs were processed to shape
up the proposed strategy for the diversified supply mix.
Step 2: Refining existing generation expansion plans
Step 3: Develop deterministic supply-demand balance
Step 4: Identify opportunities for renewable development
Step 5: Assess feasibility of integration of renewables into system
Step 1: Refining existing demand forecast

40
4.1 Developing a load forecast (demand)
Background
The LEI team examined several available sources of information to derive a base load demand forecast
and a high load demand forecast for Uganda from 2020 up to 2040. These sources of information
included the following32:
1. Least Cost Electricity Expansion Plan, 2020-2029, Electricity Regulatory Authority (“ERA”), March
2020. This is the seventh update of the Least Cost Electricity Expansion Plan for Uganda developed
by ERA and covers the period from 2020 to 2029. Hereafter this document is referred to as
LCEEP-7.
2. Grid Development Plan, 2018-2040, Uganda Electricity Transmission Company Limited
(“UETCL”).
3. Demand-Supply Balance and Prognosis, 2017-2040, Uganda Electricity Transmission Company
Limited (“UETCL”).
Based on a review of these sources, for the period from 2020 to 2029 the LEI team decided to adopt the
load demand forecasts presented in the LCEEP-7 report from ERA, for reasons summarized in the
following text box:
The LCEEP-7 load demand forecasts (base and high) for the period from 2020 to 2029 are shown in Figure
16 below.
32 As indicated in the LCEEP-7 report, several other studies have been conducted in Uganda with respect to
electricity demand forecasting. The major studies include the following: (i) Power Sector Investment Plan (“PSIP”)
2011, (ii) Performance of the Uganda Power Sector 2011 to 2018, by Gulam Dhalla, 2011, (iii) the Master Plan
Study for Hydro Plant Development by JICA, March 2011, (iv) the Energy Demand Outlook 2005-2020, by Mark
Davis, (v) Nuclear Power Investment Plan 2015 by MEMD, (vi) the Least Cost Generation Plan (2016-2025), by
ERA, and (vii) Updating the Power Sector Investment Plan: Q1- 2019 PSIP, by Energy and Security Group. Besides
being dated, ERA reports that these studies did not produce forecasts with less variance with respect to the
actual load that materialized in the 2016-2019 period that its own forecast in the 2015 Least Cost Generation
Plan report.
• The report adopts an econometric method of demand forecasting which in the past has been
proven to yield small (about 1%) variances between the historical forecasts and the energy load
demand that has actually materialized. Econometric models for load forecasting are widely used in
the industry.
• The econometric approach models the standard explanatory variables of historical demand, gross
domestic product (“GDP”) and price elasticity.
• Separate econometric models are developed for the various consumer classes, including residential
(or domestic), commercial, and medium and large industry.
• Finally, the LCEEP-7 report presents: (i) two load demand forecasts, Base Case and High Case, and
(ii) a forecast for the period 2020-2040, both in line with the adopted approach as described above.

41
Figure 16. 2020-2029 Base and high load forecasts adopted in this study
Source: ERA LCEEP-7 Report
The load demand forecasts are stated in terms of the annual energy requirements (i.e., GWh) at the
generation level; in other words, the capacity and energy forecasts include the anticipated final consumer
demand and the losses in the distribution and transmission systems, and therefore represent the amount
of total capacity and energy that generation plants must produce to meet the total system load demand
requirements.
In other words, the load forecast at the generation level was derived from the customer level load
forecasts resulting from the econometric model discussed above augmented by the estimated technical
and non-technical losses in the commercial, distribution and transmission systems. This is standard
practice. The loss ratios assumed for transmission and distribution are based on those established in the
multi-year tariff review parameters for UETCL and the concession documents for UMEME, respectively.
It is important to mention that both capacity and energy forecasts in Figure 16 are derived from LCEEP-
7. These values result in an average load factor of approximately 67%. In the opinion of the LEI team, this
is a reasonable value for a system with the characteristics of the Ugandan power system.
Load forecast 2020-2029
• The base load demand forecast (“Base Case”) from 2020 to 2029 assumes that demand is
expected to increase at historical rates for all customer classes (i.e., business-as-usual). In this
case, the GDP is assumed to grow at 6.5% annually over the planning horizon. This is in line with
the NDPIII (2020-2025). This Base Load Case also assumes that energy exports are projected to
be maintained at 7 MW in the first 3 years and then increase 10% year-on-year moving forward.
• The high load demand forecast (“High Case”) from 2020 to 2029 was developed by ERA under
the assumption that the demand for electricity in Uganda will increase considerably as a result of:
(i) an accelerated economic growth, (ii) a ramp-up of industrial activity, (iii) a significant increase
in the national electrification ratio, and (iv) the government policies on increasing access to clean
energy. As such, electricity use in all the sectors including industry, transport, household and
services, will increase compared to the base forecast. This high forecast assumes that the demand
in the new industrial parks will increase by at least an additional 100 MW per year. In addition,
Base Case High Case
YearEnergy
Demand
(GWh)
% Year-
on-Year
Increase
Capacity
Demand
(MW)
% Year-
on-Year
Increase
Energy
Demand
(GWh)
% Year-
on-Year
Increase
Peak
Demand
(MW)
% Year-
on-Year
Increase
2020 4,569 767 4,804 807
2021 4,855 6.3% 827 7.8% 5,217 8.6% 889 10.2%
2022 5,213 7.4% 888 7.4% 5,732 9.9% 977 9.9%
2023 5,594 7.3% 953 7.3% 6,317 10.2% 1,076 10.1%
2024 6,013 7.5% 1,025 7.6% 6,983 10.5% 1,190 10.6%
2025 6,505 8.2% 1,108 8.1% 7,771 11.3% 1,324 11.3%
2026 7,076 8.8% 1,206 8.8% 8,697 11.9% 1,482 11.9%
2027 7,678 8.5% 1,308 8.5% 9,723 11.8% 1,657 11.8%
2028 8,303 8.1% 1,415 8.2% 10,855 11.6% 1,849 11.6%
2029 8,947 7.8% 1,524 7.7% 12,143 11.9% 2,069 11.9%

42
the GDP is assumed to increase 8% per year for the first 4 years of the period, and by 10% per
year after that.
As a result, for the Base Case and for the period from 2020 to 2029, the load demand is forecast to
increase at an annual average rate of approximately 7.8% in terms of energy and 7.9% in terms of
capacity (i.e., MW). For the High Case, the average annual increases are 10.9% and 11.0%, respectively.
Load forecast 2030-2040
The load forecasts from 2030 to 2040 were developed under the following assumptions:
• For the Base Case, and in line with the processed forecast in the report “Grid Development Plan,
2018-2040, Uganda Electricity Transmission Company Limited (“UETCL”), we assumed that the
annual average growth for the 2030-2040 time period was equivalent to 5.1% for energy and 5.0%
for capacity).
• For the High Case, we calculated the implied annual average growth rates that resulted in energy
and demand values as those for year 2040 in the report “Grid Development Plan, 2018-2040,
Uganda Electricity Transmission Company Limited (“UETCL”)”. Accordingly, these rates were
calculated to be 6.3% and 5.0%, respectively for the 2030-2040 time period.
Accordingly, the base and high load forecasts from 2020 to 2040 are shown in the figures below.
Figure 17. Base and High Load Demand Forecasts, 2020-2040
Note: Both the energy and capacity load demand forecasts are stated in terms of the requirements at the generation level (i.e.,
customer load plus losses).
Source: ERA LCEEP-7 Report and Analysis by LEI Team.
Base Case High Case
YearEnergy
Demand
(GWh)
% Year-
on-Year
Increase
Capacity
Demand
(MW)
% Year-
on-Year
Increase
Energy
Demand
(GWh)
% Year-
on-Year
Increase
Peak
Demand
(MW)
% Year-
on-Year
Increase
2020 4,569 767 4,804 807
2021 4,855 6.3% 827 7.8% 5,217 8.6% 889 10.2%
2022 5,213 7.4% 888 7.4% 5,732 9.9% 977 9.9%
2023 5,594 7.3% 953 7.3% 6,317 10.2% 1,076 10.1%
2024 6,013 7.5% 1,025 7.6% 6,983 10.5% 1,190 10.6%
2025 6,505 8.2% 1,108 8.1% 7,771 11.3% 1,324 11.3%
2026 7,076 8.8% 1,206 8.8% 8,697 11.9% 1,482 11.9%
2027 7,678 8.5% 1,308 8.5% 9,723 11.8% 1,657 11.8%
2028 8,303 8.1% 1,415 8.2% 10,855 11.6% 1,849 11.6%
2029 8,947 7.8% 1,524 7.7% 12,143 11.9% 2,069 11.9%
2030 9,403 5.1% 1,600 5.0% 12,908 6.3% 2,172 5.0%
2031 9,883 5.1% 1,680 5.0% 13,721 6.3% 2,281 5.0%
2032 10,387 5.1% 1,764 5.0% 14,586 6.3% 2,395 5.0%
2033 10,917 5.1% 1,852 5.0% 15,505 6.3% 2,515 5.0%
2034 11,473 5.1% 1,945 5.0% 16,481 6.3% 2,641 5.0%
2035 12,059 5.1% 2,042 5.0% 17,520 6.3% 2,773 5.0%
2036 12,673 5.1% 2,144 5.0% 18,623 6.3% 2,911 5.0%
2037 13,320 5.1% 2,252 5.0% 19,797 6.3% 3,057 5.0%
2038 13,999 5.1% 2,364 5.0% 21,044 6.3% 3,210 5.0%
2039 14,713 5.1% 2,482 5.0% 22,370 6.3% 3,370 5.0%
2040 15,463 5.1% 2,607 5.0% 23,779 6.3% 3,539 5.0%
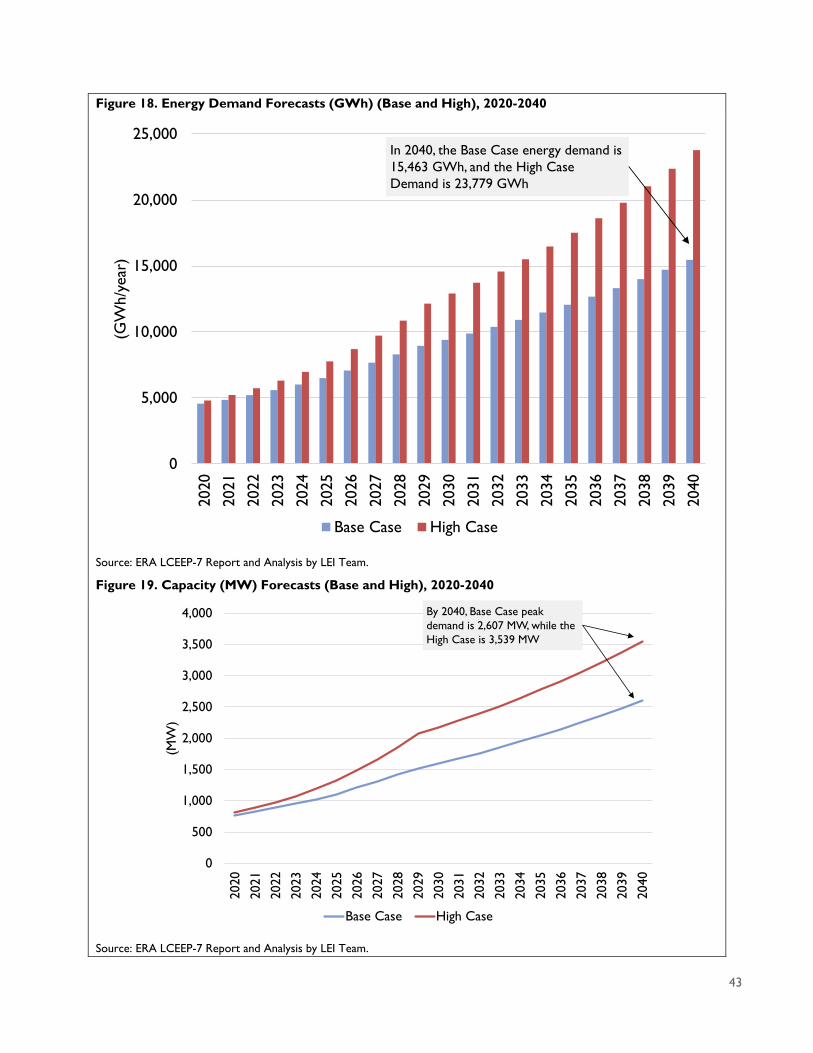
43
Figure 18. Energy Demand Forecasts (GWh) (Base and High), 2020-2040
Source: ERA LCEEP-7 Report and Analysis by LEI Team.
Figure 19. Capacity (MW) Forecasts (Base and High), 2020-2040
Source: ERA LCEEP-7 Report and Analysis by LEI Team.
0
5,000
10,000
15,000
20,000
25,000
2020
2021
2022
2023
2024
2025
2026
2027
2028
2029
2030
2031
2032
2033
2034
2035
2036
2037
2038
2039
2040
(GW
h/y
ear
)
Base Case High Case
In 2040, the Base Case energy demand is
15,463 GWh, and the High Case
Demand is 23,779 GWh
0
500
1,000
1,500
2,000
2,500
3,000
3,500
4,000
2020
2021
2022
2023
2024
2025
2026
2027
2028
2029
2030
2031
2032
2033
2034
2035
2036
2037
2038
2039
2040
(MW
)
Base Case High Case
By 2040, Base Case peak
demand is 2,607 MW, while the
High Case is 3,539 MW

44
Note that for both load forecast cases, the average growth rates in the second half of the period are lower
than those in the first half. One of the reasons for such an assumption is that based on the analysis of the
LEI team (which includes the results of interviews with several of the relevant stakeholders), it is the LEI
team’s opinion that sustaining an average growth of about 8% (in the Base Case) and 11% (in the High
Case) year-on-year over a 20-year period is unprecedented and quite difficult to achieve.
Instead, the energy forecast in Figure 18 models an average growth rate for the 20-year period of 6.3%
for the Base Case, and 8.3% for the High Case. As such, the Base Case forecast is more in line with the
historical growth of the system load. The High Case forecast models among other things, the expected
large increase in additional industrial loads.
Finally, in terms of annual energy requirements at the generation level, in 2040 the system is projected to
require 15,463 GWh/year in the Base Case and 23,779 GWh/year in the High Case. In terms of MW
demand, the system is forecasted to peak at 2,607 MW in the year 2040 in the Base Case and 3,539 MW
in the High Case.
The following section discusses the current and future generation resources in Uganda that are expected
to be available to meet this load growth.
4.2 Developing an energy production forecast (supply)
Background
In order to build forecasts of energy production, the LEI team first carried out an inventory of supply
resources as of Q2 2020; we then layered on top of that all generating resources that have secured a
license with ERA and are expected to come online by 2024. Next, we derated total installed capacity
every year to determine capacity available to meet load any given year. Then, the LEI team converted
available capacity (MW) into projected energy production (GWh) by applying to the available capacity the
estimated capacity factor per technology type. For the purpose of this analysis, we developed forecasts of
energy production under an Average Generation Case and a Drought Case.
Inventory of existing capacity
We summarize in Figure 20 the available grid-connected generation fleet in Uganda at the end of Q2 2020.
At a high level, there is a total of 1,293 MW of installed capacity, of which approximately 1,197 MW is
available to meet load demand connected to the grid.

45
Figure 20. Power Plants in Uganda (Q2 2020)
Notes: (1) Self-generation. (2) Heavy Fuel Oil
Source: ERA.
In addition, Figure 21 below shows the new generation plants that already have a license and that are
scheduled to be placed in service up to year 2024, together with their MW capacity and expected
Power Plant TechnologyInstalled
Capacity (MW)
Installed
Capacity
Available to the
Grid (MW)
Year of
Commissioning
Bujagali Large Hydro 255.0 250.0 2012
Kiira Large Hydro 200.0 200.0 2000
Isimba Large Hydro 183.0 183.0 2019
Nalubaale Large Hydro 180.0 180.0 1954
Achwa II Large Hydro 42.0 42.0 2020
Mpanga Small Hydro 18.0 18.0 2011
Siti II Small Hydro 16.5 16.5 2019
Bugoye (Mubuku II) Small Hydro 13.0 13.0 2009
Kasese Cobalt (Mubuku III) Small Hydro 9.9 9.9 1998
Nkusi Small Hydro 9.6 9.6 2018
Nyamwamba Small Hydro 9.2 9.2 2018
Kabalega (Buseruka) Small Hydro 9.0 9.0 2013
Ziba Small Hydro 7.6 7.6 2019
Muvumbe Small Hydro 6.5 6.5 2017
Waki Small Hydro 6.5 6.5 2020
Ishasha (Kanungu) Small Hydro 6.4 6.4 2011
Siti I Small Hydro 6.1 6.1 2017
Ndugutu Small Hydro 5.9 5.9 2019
Rwimi Small Hydro 5.5 5.5 2017
Lubilia Small Hydro 5.4 5.4 2018
Sindila Small Hydro 5.3 5.3 2019
Mubuku I (Kilembe Mines) Small Hydro 5.0 5.0 1956
Mahoma Small Hydro 2.7 2.7 2018
Kakira Sugar Cogeneration 51.1 32.0 2007
Kinyara Sugar Cogeneration 14.5 5.0 2009
Kaliro Sugar Cogeneration 11.9 6.9 2014
Lugazi Sugar(1) Cogeneration 9.5 0.0 1998
Mayuge Sugar(1) Cogeneration 9.2 0.0 2005
Tororo Thermal (HFO(2)) 89.0 50.0 2009
Namanve Thermal (HFO(2)) 50.0 50.0 2008
Xsabo Solar Solar 20.0 20.0 2018
Soroti Solar Solar 10.1 10.0 2016
Tororo Solar Solar 10.0 10.0 2017
Mayuge Solar Solar 10.0 10.0 2019
Total 1,293.4 1,197.0

46
commissioning year. Projects that are currently in the feasibility study process are not considered here
since it is assumed that they will compete with new projects that UEGCL could develop.
Figure 21. Generation Projects Currently Licensed
Source: ERA LCEEP-7 Report and Analysis by LEI Team.
Accordingly, an additional 824 MW of new capacity is already licensed to be added to the system by year
2024.
Determining capacity available to meet the peak load by 2024
Consistent with accepted industry practice, we determined the generation capacity available to meet the
peak load demand by first derating the installed capacity of each generation unit according to its expected
availability factor. That is, for each generation unit, the capacity it contributes to meet the peak load
Power Plant Technology
Installed
Capacity
Available to the
Grid (MW)
Year of
Commissioning
(Anticipated)
Karuma Large Hydro 600.0 2020
Achwa 1 Small Hydro 41.0 2020
Nyamaghasani 1 Small Hydro 15.0 2020
Kikagati Small Hydro 14.0 2020
Nyamabuye Small Hydro 7.0 2020
Bukinda Small Hydro 6.5 2020
Nyamaghasani 2 Small Hydro 6.0 2020
Kakaka Small Hydro 4.6 2020
Nyabuhuka Small Hydro 3.2 2020
Mayuge Solar 10.0 2020
Tororo Solar 10.0 2020
Nyamwamba II Small Hydro 7.8 2021
Muyembe Small Hydro 6.9 2021
Nyagak III Small Hydro 6.6 2022
Albatross Thermal 50.0 2022
Kabeywa 1 Small Hydro 6.5 2023
Atari 1 Small Hydro 3.3 2023
Kabeywa 2 Small Hydro 2.0 2023
Simu Small Hydro 9.5 2024
Sironko Small Hydro 7.1 2024
Sisi Small Hydro 7.0 2024
Bukurungo Small Hydro 0.1 2024
Total 824.0

47
demand is calculated as the product of its installed capacity times its nominal availability factor. This is a
conservative proxy of the capacity that is contributed by each generation unit at all times.33
The LEI team did not have reliable information on the actual availability performance of the generation
units in Uganda. Therefore, we used generic values for each of the generation technologies. The assumed
values were as follows per technology:
• Large Hydro units: 90%;
• Small Hydro units: 70%;
• Thermal units (burning HFO): 80%;
• Solar PV: 70%; and
• Thermal cogeneration units (burning bagasse): 80%.
In the case of the solar PV plants, and recognizing that the load demand in Uganda peaks at night (between
7:00 pm and 8:00 pm), the assumed availability value of 70% supposes that in the future the output from
the solar plants will be firmed up by the installation of energy storage systems, such as BESS.
With the above assumptions, Figure 22 shows the available capacity from the existing and future (i.e., 2020
to 2024) generation units to meet system peak load demand.
33 The availability metric of a generation unit is a measure of the percentage of time the unit is available to
produce power. When not available, the unit is either on a planned (due to scheduled maintenance) or
unplanned outage due to a failure.
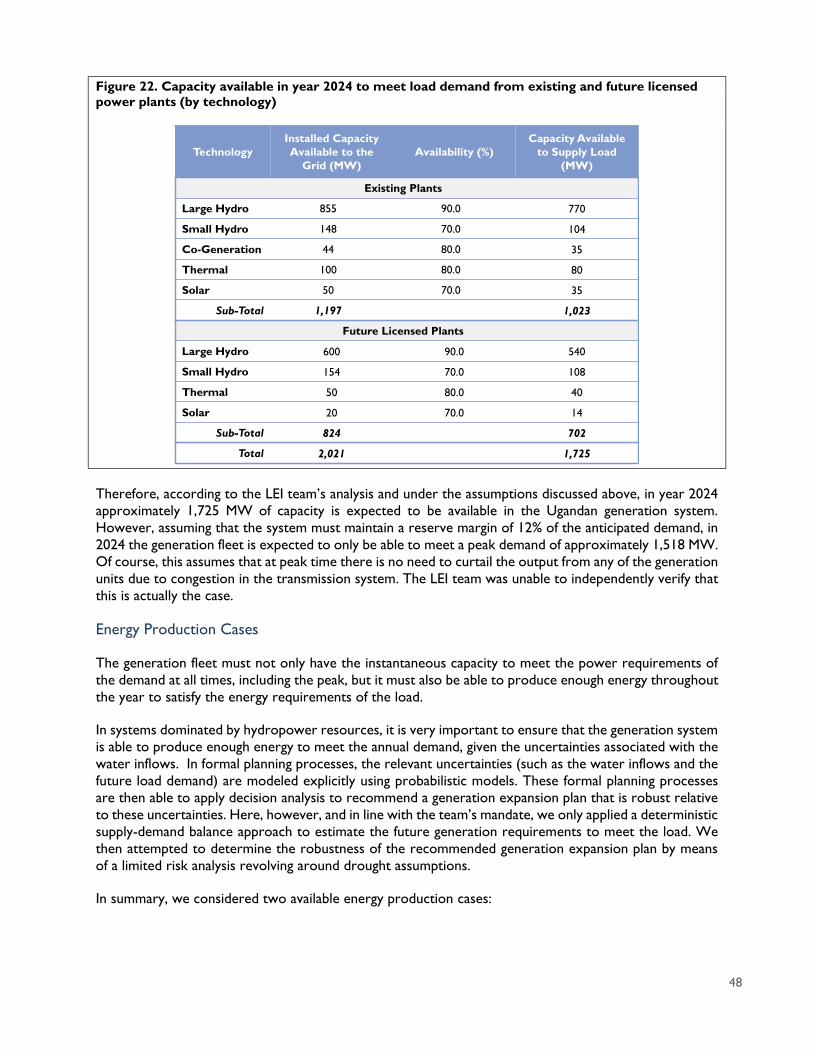
48
Figure 22. Capacity available in year 2024 to meet load demand from existing and future licensed
power plants (by technology)
Therefore, according to the LEI team’s analysis and under the assumptions discussed above, in year 2024
approximately 1,725 MW of capacity is expected to be available in the Ugandan generation system.
However, assuming that the system must maintain a reserve margin of 12% of the anticipated demand, in
2024 the generation fleet is expected to only be able to meet a peak demand of approximately 1,518 MW.
Of course, this assumes that at peak time there is no need to curtail the output from any of the generation
units due to congestion in the transmission system. The LEI team was unable to independently verify that
this is actually the case.
Energy Production Cases
The generation fleet must not only have the instantaneous capacity to meet the power requirements of
the demand at all times, including the peak, but it must also be able to produce enough energy throughout
the year to satisfy the energy requirements of the load.
In systems dominated by hydropower resources, it is very important to ensure that the generation system
is able to produce enough energy to meet the annual demand, given the uncertainties associated with the
water inflows. In formal planning processes, the relevant uncertainties (such as the water inflows and the
future load demand) are modeled explicitly using probabilistic models. These formal planning processes
are then able to apply decision analysis to recommend a generation expansion plan that is robust relative
to these uncertainties. Here, however, and in line with the team’s mandate, we only applied a deterministic
supply-demand balance approach to estimate the future generation requirements to meet the load. We
then attempted to determine the robustness of the recommended generation expansion plan by means
of a limited risk analysis revolving around drought assumptions.
In summary, we considered two available energy production cases:
Technology
Installed Capacity
Available to the
Grid (MW)
Availability (%)
Capacity Available
to Supply Load
(MW)
Existing Plants
Large Hydro 855 90.0 770
Small Hydro 148 70.0 104
Co-Generation 44 80.0 35
Thermal 100 80.0 80
Solar 50 70.0 35
Sub-Total 1,197 1,023
Future Licensed Plants
Large Hydro 600 90.0 540
Small Hydro 154 70.0 108
Thermal 50 80.0 40
Solar 20 70.0 14
Sub-Total 824 702
Total 2,021 1,725

49
(1) Average Generation Case, where we assumed that each of the power plants generates an
average amount of energy every year, based on its historical (or assumed) average capacity
factor.34
(2) Drought Case, which estimates for every year of the period the available energy from the
hydropower plants as if each were a drought year. The energy production from the non-hydro
plants is calculated using averages as in the Base Case. Note that this case will assess the
robustness of the generation plan recommended for the Base Case relative to the possibility of
any given year being a drought, rather than average, year.
These two available energy production cases are further discussed below.
Average Generation Case
On the basis of Figure 21 and Figure 22 above, and the assumptions about the capacity factors per power
plant discussed below, Figure 23 and Figure 24 show, respectively, the expected annual average energy
output from the existing and future licensed power plants in Uganda.
Note from these tables that the following assumptions have been made relative to the plant capacity
factors:
• For plants with sufficient operational history, their historical capacity factors have been assumed.
• For the Karuma and Isimba large hydro power plants, a capacity factor of 68%, consistent with
that of Bujagali and the projections in several available sources of information, has been assumed.35
• For small hydro plants with limited operational history and for those that will be placed in service
in the future, a typical conservative capacity factor of 50% has been assumed.
• For existing and future thermal HFO plants, a capacity factor of 80% has been assumed.
• Finally, a 20% capacity factor for the existing as well as future solar generation plants has been
assumed.
34 The capacity factor is the ratio of the average to the maximum output from a given generation unit. The maximum
output is the product of the installed capacity times 8,760. 35 Including: (i) Project for Master Plan Study on Hydropower Development in the Republic of Uganda. Final Report,
prepared by Japan International Cooperation Agency, Electric Power Development Co., Ltd. and Nippon Koei
Co., Ltd. March 2011, and (ii) Demand-Supply Balance, prepared by UETCL, 2020.

50
Figure 23. Annual average energy output from existing power plants
Source: ERA and Analysis by LEI Team.
Power Plant Technology
Installed
Capacity
Available to the
Grid (MW)
Capacity factor
(%)
Average
Available
Energy Output
(GWh/yr)
Bujagali Large Hydro 250.0 68 1,489.2
Kiira Large Hydro 200.0 40 700.8
Isimba Large Hydro 183.0 68 1,090.1
Nalubaale Large Hydro 180.0 40 630.7
Achwa II Large Hydro 42.0 50 184.0
Mpanga Small Hydro 18.0 48 75.7
Siti II Small Hydro 16.5 50 72.3
Bugoye (Mubuku II) Small Hydro 13.0 60 68.3
Kasese Cobalt (Mubuku III) Small Hydro 9.9 68 59.0
Nkusi Small Hydro 9.6 50 42.0
Nyamwamba Small Hydro 9.2 50 40.3
Kabalega (Buseruka) Small Hydro 9.0 46 36.3
Ziba Small Hydro 7.6 50 33.3
Muvumbe Small Hydro 6.5 50 28.5
Waki Small Hydro 6.5 50 28.5
Ishasha (Kanungu) Small Hydro 6.4 43 24.1
Siti I Small Hydro 6.1 50 26.7
Ndugutu Small Hydro 5.9 50 25.8
Rwimi Small Hydro 5.5 50 24.1
Lubilia Small Hydro 5.4 50 23.7
Sindila Small Hydro 5.3 50 23.2
Mubuku I (Kilembe Mines) Small Hydro 5.0 65 28.5
Mahoma Small Hydro 2.7 50 11.8
Kakira Sugar Cogeneration 32.0 44 123.3
Kinyara Sugar Cogeneration 5.0 18 7.9
Kaliro Sugar Cogeneration 6.9 30 18.1
Lugazi Sugar(1) Cogeneration 0.0 0 0.0
Mayuge Sugar(1) Cogeneration 0.0 0 0.0
Tororo Thermal (HFO(2)) 50.0 80 350.4
Namanve Thermal (HFO(2)) 50.0 80 350.4
Xsabo Solar Solar 20.0 20 35.0
Soroti Solar Solar 10.0 20 17.5
Tororo Solar Solar 10.0 20 17.5
Mayuge Solar Solar 10.0 20 17.5
Total 1,197.0 5,704.6

51
Figure 24. Annual average energy output from future licensed power plants
Source: ERA and Analysis by LEI Team.
Further, Figure 25 below shows a summary of the evolution of the base case electricity supply and demand
in the Ugandan power system for the 2020-2024 period.
Figure 25. Base Case electricity supply and demand in the Ugandan power system (2020-2024)
Source: ERA and Analysis by LEI Team.
Power Plant Technology
Installed
Capacity
Available to the
Grid (MW)
Capacity factor
(%)
Average
Available Energy
Output
(GWh/yr)
Karuma Large Hydro 600.0 68 3,574.1
Achwa 1 Small Hydro 41.0 50 179.6
Nyamaghasani 1 Small Hydro 15.0 50 65.7
Kikagati Small Hydro 14.0 50 61.3
Nyamabuye Small Hydro 7.0 50 30.7
Bukinda Small Hydro 6.5 50 28.5
Nyamaghasani 2 Small Hydro 6.0 50 26.3
Kakaka Small Hydro 4.6 50 20.1
Nyabuhuka Small Hydro 3.2 50 14.0
Mayuge Solar 10.0 20 17.5
Tororo Solar 10.0 20 17.5
Nyamwamba II Small Hydro 7.8 50 34.2
Muyembe Small Hydro 6.9 50 30.2
Nyagak III Small Hydro 6.6 50 28.9
Albatross Thermal 50.0 80 350.4
Kabeywa 1 Small Hydro 6.5 50 28.5
Atari 1 Small Hydro 3.3 50 14.2
Kabeywa 2 Small Hydro 2.0 50 8.8
Simu Small Hydro 9.5 50 41.6
Sironko Small Hydro 7.1 50 31.1
Sisi Small Hydro 7.0 50 30.7
Bukurungo Small Hydro 0.1 50 0.2
Total 824.0 4,634.0
Year
Installed
Capacity
available to the
grid (MW)
Capacity
available to
supply load
(MW)
Base case peak
demand
(MW)
Average
Available
Energy Output
(GWh/yr)
Energy
Demand
(GWh)
2020 1,914 1,645 767 9,740 4,569
2021 1,929 1,656 827 9,804 4,855
2022 1,986 1,700 888 10,184 5,213
2023 1,997 1,709 953 10,235 5,594
2024 2,021 1,725 1,025 10,339 6,013

52
Therefore, the expectation is that for each year from 2020 to 2024 the base case supply will exceed the
demand by a significant margin. This is mostly due to the incorporation of the Karuma hydroelectric
project into the generation mix. This is further discussed below.
Drought Case
As we noted in prior sections, the Ugandan generation system is dominated by hydroelectric resources.
As a result, the generation supply is extremely sensitive to weather conditions. Below, we developed a
simplified estimate of the annual energy output that would be available from the existing and future hydro
power plants in Uganda in case the water system experiences drought conditions similar to those
experienced in 2006.
To assess the extent of the most recent historical drought condition, we examined the actual energy
production from the combined Nalubaale and Kiira hydro power plants for the 14-year period from 2004
to 2017. This is shown in Figure 26 below. From this table we observed that 2006 was a year with reduced
hydro production which was due to low inflows in the Victoria Nile river (i.e., a drought). That year, the
production from the combined Nalubaale and Kiira plants was approximately 17% below the average for
the 14-year period.
Figure 26. Actual energy production from the Nalubaale and Kiira power plants (2004-2011)
Source: ERA and Analysis by LEI Team.
Finally, Figure 27 below summarizes estimates of the average available energy output from the generation
system for the 2020-2024 period assuming that each year experiences a drought condition.
Year
Energy
Production
(GWh/yr)
% of Average
2004 1,899.9 137.7%
2005 1,690.4 122.5%
2006 1,149.7 83.3%
2007 1,252.2 90.7%
2008 1,394.8 101.1%
2009 1,268.7 91.9%
2010 1,266.6 91.8%
2011 1,361.8 98.7%
2012 1,293.1 93.7%
2013 1,264.5 91.6%
2014 1,229.9 89.1%
2015 1,303.4 94.5%
2016 1,437.7 104.2%
2017 1,505.9 109.1%
Average 1,379.9 100.0%

53
Figure 27. Electricity supply and demand in the Ugandan power system under drought conditions
(2020-2024)
Source: ERA and Analysis by LEI Team.
Data from the table above was leveraged in the LEI team’s analysis to assess the robustness (i.e., risk
analysis) of the recommended generation diversification plan for the base case relative to the possibility
of any given year being a drought, rather than average, year.
4.3 Summary of results from supply-demand balance analysis
Figure 28 summarizes the high-level findings from the supply-demand balance analysis carried out. Detailed
results of this analysis for each year of the 2020-2040 period for both load growth cases (Base and High)
and for the existing and licensed (but not yet operational) generation are documented in Figure 41 of
Appendix A. The appendix also considers the case where the hydro system would experience drought
conditions.
Figure 28. Summary of Results from Supply-Demand Balance Analysis
Note: The baseline (Average generation and base load case with no drought) is highlighted in green in the table
Please refer to Appendix A for a summary of supply-demand balance over the 2020-2040 horizon, across
the various cases studied. Briefly, from a capacity perspective, the system is forecasted to start
experiencing MW deficits in 2027 (under high load conditions) or 2030 (under base load conditions). From
an energy perspective, deficits may occur as early as 2026 (assuming the load demand materializes at a
Year
Installed
Capacity
available to the
grid (MW)
Capacity
available to
supply load
(MW)
Base case peak
demand
(MW)
Average
Available
Energy Output
(GWh/yr)
Energy
Demand
(GWh)
2020 1,914 1,645 767 8,276 4,569
2021 1,929 1,656 827 8,329 4,855
2022 1,986 1,700 888 8,704 5,213
2023 1,997 1,709 953 8,747 5,594
2024 2,021 1,725 1,025 8,833 6,013
Demand
Case
Generation
Case
Capacity (MW) Energy (GWh)
First Year
Deficit Occurs
Amount of
Deficit (MW)
First Year
Deficit Occurs
Amount of
Deficit (GWh)
Base
Average
Generation2030 67 2032 48
Drought 2030 67 2029 114
High
Average
Generation2027 131 2028 516
Drought 2027 131 2027 890

54
high level and the system experiences a drought that year) or as late as 2033 (assuming that the load
grows at the base rate and there is average output from the generation fleet.
As shown in Figure 28 above, UEGCL will have the opportunity to install new generation as early as year
2026 or as late as year 2030, assuming that the uncertainties (i.e., load and hydrology) materialize a certain
way. This is further discussed below.
4.4 Opportunities for the incorporation of new renewable generation
In this section of the report, we recommend a strategy for the incorporation of new renewable resources
for UEGCL on the basis of findings from the team’s supply-demand analysis. The approach taken was to
develop a baseline plan assuming that there will be no droughts during the 2020-2040 horizon followed
by proposed hedging solutions that could enhance the baseline plan and make it more resilient.
The Ugandan system is projected to cope with the capacity and energy deficits in the 2020-2040 period
(assuming no drought) shown in Figure 29 below.
Figure 29. Summary of deficit (capacity and energy) (no drought)
The following are the LEI team’s key takeaways:
Base load High load
YearCapacity
Deficit (MW)
Energy
Deficit
(GWh)
Capacity
Deficit (MW)
Energy
Deficit
(GWh)
2020 0 0 0 0
2021 0 0 0 0
2022 0 0 0 0
2023 0 0 0 0
2024 0 0 0 0
2025 0 0 0 0
2026 0 0 0 0
2027 0 0 131 0
2028 0 0 346 516
2029 0 0 592 1,804
2030 67 0 708 2,569
2031 157 0 830 3,383
2032 251 0 957 4,247
2033 350 578 1,092 5,166
2034 453 1,135 1,232 6,143
2035 562 1,720 1,380 7,181
2036 677 2,335 1,536 8,285
2037 797 2,981 1,699 9,458
2038 923 3,661 1,870 10,705
2039 1,055 4,375 2,050 12,031
2040 1,194 5,125 2,238 13,440

55
However, it should be noted that in 2027 the need is only for capacity resources. As of today, Variable
Energy Resources (VREs, which include solar and wind) are principally energy resources, as their firm
capacity cannot be guaranteed due to the volatility (or intermittency) of their primary natural resource
(i.e., the sun or the wind). Therefore, if UEGCL envisions developing the 131 MW of renewable generation
in 2027, the solution would probably be either geothermal or solar or wind coupled with a BESS in order
to firm up the capacity of the VRE generation resource.
It is worth noting however that the 12% reserve margin assumed in the team’s analysis is a conservative
assumption; a system with a lower reserve margin requirement might be able to absorb that amount of
VREs without an associated BESS system. However, in order to ensure that this is actually the case, further
studies would need to be conducted to formally assess whether a specific amount of renewables can be
feasibly integrated into the network. Current studies available to the LEI team are not adequate to make
this assessment.
The generation to be installed does not necessarily have to be in a single location but may be divided into
several locations. Power plants with standardized characteristics can be designed and those schemes
applied to different assets across multiple locations. Furthermore, it might be prudent to develop
generating units in partial stages to reduce the uncertainty associated with demand.
Further, if the materialization of the uncertainties (i.e., load and hydrology) is different than the
assumptions made in the team’s analysis and documented in this report, then UEGCL would have even
better opportunities to install renewable resources earlier than 2030. For example, if the High Load Case
(rather than the Base Load Case) materializes, then there is the opportunity to install between 131 MW
and 708 MW in the 2027 to 2030 time period. Because of the significant capacity and energy requirements
in this High Load Case, the new capacity will most likely be a combination of standard technologies (such
as hydro and thermal) combined with renewables. The energy requirements are even larger in case of
drought conditions.
Finally, the location of the plants should facilitate access to demand. The most desirable locations are the
main consumption centers in Kampala, Entebbe, Jinja, Tororo and Masaka. Interesting load hubs are also
seen in the Mbarara, Kasese, Fort Portal and Hoima areas. It is recommended that UEGCL prioritize these
areas for the development and siting of its projects.
4.5 Hedging against uncertainties
Uncertainty is inherent to every planning process. No matter how sophisticated the tools used to predict
future outlook, it is impossible to know in advance the reality that the system will face.
1. There is little need or opportunity for UEGCL to install renewable resources (or any other
technology for that matter) in the short term (2020-2024).
2. In the medium term (2025-2030) there is opportunity to install between 67 MW and 708
MW of generation. Given the uncertainties associated with the actual materialization of the
future load, in this report we analyze the conservative case where UEGCL would consider
developing up to 300 MW by 2030. The exact amount that actually gets developed should
be the result of formal system planning studies, as discussed elsewhere in this report.
3. There is ample opportunity to install generation in the long term (2031-2040). In fact, our
analysis shows that it may be possible to develop between 894 MW (i.e., 1,194 MW minus
300 MW for the Base Load case) and 1,938 MW (i.e., 2,238 MW minus 300 MW for the
High Load case) of additional capacity by the year 2040.

56
Demand and hydrology are some of the key variables inducing uncertainty; human’s behavior itself both
within the country and globally, carries in some extent some risk of uncertainty. For instance, since
2020the world has faced an unprecedented economic and social crisis caused by the Covid-19 pandemic.
By their very extreme nature, such events are rarely predicted or integrated in planning activities; despite
the extraordinary disruption they could engender. The Covid-19 related health crisis has exacerbated
infrastructure shortcomings across the globe with disruption at all levels including utilities’ operations,
sales, recovery rate, or equipment supply chains.
In this project, making use of simplified deterministic tools, we established that by 2030 the need to
incorporate new generation capacity would likely, depending on the demand scenario (base or high), range
between 67 MW and 708 MW. As a conservative measure, it is suggested that UEGCL considers installing
up to 300 MW of variable renewable sources (with BESS) by the year 2030.
If 300 MW were to be installed by 2030 and the Base Case demand scenario was to materialize, on that
year, the country would be in an over-supply situation. On the other hand, if the high demand scenario
were to instead unfold, the system would present a deficit of 408 MW (that the 300 MW would help
mitigate).
In other words, the decision to install up to 300 MW represents a potential financial risk for UEGCL -
building (at cost) generation in excess of system needs. Nonetheless, it is worth noting that having extra
capacity could also be valuable to the system as it would allow some resiliency in the face of greater load.
In that regards, as discussed in section 7.1, UEGCL would need to be remunerated for the value provided
to the system.
A similar analysis can be carried out in energy terms, as can be seen in Figure 32. If the base case energy
demand occurs in a year of average hydrology, the installation of 300 MW of solar (and BESS) generation
will make it possible to cover all demand requirements and allow for some reserves. If however the base
case load was to occur in a dry year similar to 2006, the available energy output will cover about 92% of
the energy requirements. In other words, installing 300 MW would be akin to setting up a hedge against
poor hydrology.
When the high case demand is combined with average hydrology, and drought, incremental generation
would allow the system to cover only 20% and 13% of required energy respectively.

57
Figure 30. Energy Hedging with a 300 MW VRE Plant
However, as discussed in section 7.1, the current regulatory scheme in Uganda does not reward those
who provide hedging or other ancillary benefits to the system. In fact, the Ugandan regulatory system
rewards only the provision of energy by generators. Other services of these sector participants (and
notably UEGCL) are not remunerated. As a result, the current regulatory regime does not encourage
sector participants to make this kind of necessary investments. We recommend that this situation be
discussed and addressed in future regulatory improvements.
Among the generation services that should be considered within a revised remuneration scheme are
available installed capacity, operating reserve (spinning and non-spinning), load-frequency control, reactive
control (voltage regulation), and black start capabilities.
4.6 Known restrictions imposed by the transmission system
In this section, we review the available studies that were performed in the recent past in Uganda to assess
the capacity of the current and future transmission system to accommodate the additional generation
resources that might be developed by UEGCL as a part of its energy mix diversification plan.
Several studies and reports were reviewed by the LEI team for this purpose. The three most relevant
ones for the analysis were the following:
1. The UETCL Grid Development Plan (“GDevP”), 2018-2040.
2. Least Cost Electricity Expansion Plan (“LCEEP-7”), 2020-2029, prepared by ERA.
3. “Grid Analysis for Integration of Wind/Solar Generation Plants,” prepared by ERA, November
2015.
-2,000
-1,000
0
1,000
2,000
3,000
4,000
5,000
Base load case
Average
generation
Base load case
Drought
High load case
Average
generation
High load case
Drought
(G
Wh/year)
300 MW @ 20%
plant factor
Surplus generation available in 2030
92% 20% 13%
Average hydro conditions
Drought conditions

58
The GDevP report details the present as well as future transmission grid infrastructure necessary to
support the domestic demand requirements, to evacuate the output from current and future generation
resources, and to meet regional power trade obligations.
Important to this review, the GDevP details the new generation development projects over the planning
horizon and their associated evacuation infrastructure. As such, it gives information as to locations along
the existing and future transmission system that can accommodate VREs of certain sizes.
A scenario-based approach was adopted for the determination of the GDevP. Scenarios were assembled
from a combination of a specific load demand forecast and generation plans. Load demand forecasts were
derived from econometric models. The generation planning options were derived from the current power
plants under construction as well as those that are planned (i.e., licensed and with or without executed
Power Purchase Agreements, PPAs). The demand-supply balance analysis for each respective scenario
recommends the timing of additional required generation capacities. As such, the approach followed in
the GDevP report is consistent with the approach applied by the LEI team.
Rigorous power system studies were conducted for each scenario to make sure that it results in a feasible
transmission system configuration. Feasibility is measured in terms of a set of transmission planning
criteria. In the opinion of the Consultants, UETCL adopts industry-accepted methods, criteria, and tools
(such as PSS®E) for the determination of feasible transmission plans.
The following three scenarios were studied in the report:
i. A base case scenario which looks at a business-as-usual case.
ii. The National Development Plan II (NDPII 2015-2020) scenario. The main assumptions of this
scenario are: (i) average annual electricity per capita consumption in the country is raised from
80 kWh (2012) to 578 kWh by 2020; (ii) rural electrification rates increased from the current
14% to 30% by 2020; (iii) installed generation capacity increased to 2,500 MW by 2020; and (iv)
export potential is assumed to be between 240 MW and 390 MW by 2040.
iii. The Vision 2040 scenario. This is a very ambitious scenario which assumes the following: (i)
average annual electricity per capita consumption in the country is raised to 3,668 kWh by 2040;
(ii) electrification rate is increased to 80% by 2040; (iii) installed generation capacity increased to
41,738 MW by 2040; and (iv) load demand of 20,439 MW by 2040.
The base case scenario assumes a total of 3,536 MW of peak demand and 27,920 GWh of purchases
by UETCL in the horizon year (2040). Relative to the incorporation of VREs, the scenario appears to
determine the system upgrades required to:
• Add 10 MW of wind (Senok Wind) in 2020.
• Undisclosed amounts of solar plants in 2020 and thereafter, although the generation expansion
plan shown in the report includes up to 2,000 MW of solar generation (i.e., Jinke Solar, 500 MW,
CP-EM Solar, 1000 MW, and Sky Power Solar, 500 MW). The locations of these power plants are
also undisclosed.
The NDII scenario, on the other hand, appears to consider the installation of 20 MW of solar generation
at an undisclosed location.
Finally, the Vision 2040 scenario assumes the installation of up to 5,000 MW of new solar plants at a
few undisclosed locations.

59
In summary, with the information presently available it is not possible to determine conclusively the
maximum value of renewable energy that can be safely and successfully incorporated into the current
Ugandan power delivery grid. However, considering the existing capacities of the transmission/distribution
system and the existing solar installations (a total capacity of 50 MW), it can be reasonably expected that
105 MW of solar and wind can be added to the existing grid network. Additional information on UETCL’s
planning assumptions is needed to determine the grid locations that could accommodate the potential
additions. It is also worth noting that as of the writing of this report, there are no known plans to expand
the transmission system to allow the incorporation of renewable sources. This could be done anytime,
provided it is properly funded.
On the other hand, the LCEEP-7 report presents the transmission infrastructure investment needs
required to transmit all of the generation capacity expected to come online from 2020 to 2030. These
transmission investments total about $3.2 billion and include the construction of grid evacuation lines,
network reliability projects, works to support network growth as well as international interconnection
lines. According to ERA, about 80% of the amounts required by the expansion of the transmission system
up to 2030 are already committed.
Generation evacuation projects (i.e., those projects necessary to connect future generation plants to the
transmission system) and those for interconnecting with neighboring countries have the highest
percentage of committed funds. This is logical as generation projects frequently include in their financing
the necessary resources for connecting to the grid.
However, the LCEEP-7 report also indicates that less than 40% of the required financing to acquire the
necessary way leave corridors to build the transmission projects has been committed by the Government
of Uganda. The delay in financing of the way leaves can translate into delayed project
implementation/incompletion. Thus, there is uncertainty that these projects will actually be implemented
by 2030.
The challenge with the above two studies relative to the team’s mandate is that they do not provide a
definite assessment of the capacity of the transmission system to accommodate power plants of a certain
size and/or the location where the interconnection is feasible. Going forward, to determine the system's
capacity to accommodate additional renewable projects, the LEI team recommends that additional power
system studies be undertaken, or existing ones updated.
The above notwithstanding, below we present the team’s high-level assessment of the likely locations
within the Ugandan power were integrating a power plant (renewable or otherwise) has a significant
likelihood of being feasible and of reasonable cost.
4.7 Potential feasible locations to connect generation resources to the Ugandan
transmission system
The geographical location of Uganda's current main transmission lines and substations at 220 kV and
132 kV is shown in Figure 31.

60
Figure 31. Main 220 kV and 132 kV Actual Transmission System in Uganda
Source: Energy Access Explorer. Accessed at: <https://www.energyaccessexplorer.org/>
The 220 kV Masaka-Kawanda-Bujagali and the Hoima-Fort Portal-Nkenda portions of the network are
particularly robust in terms of available transmission capacity. The 132 kV system has some reach within
the country and can also be considered for interconnecting new generation resources.
Apart from this system, the Karuma-Kawanda 400 kV system is currently being developed, complemented
by the 132 kV Karuma-Olwiyo (insulated at 400 kV) and Karuma-Lira systems, running north-south from
the Karuma plant to the surrounding areas of Kampala.
Locating power plants near this existing transmission system will reduce the cost of building the necessary
evacuation facilities. Assuming that the transmission system can be expanded for the connection of any
plant, one way to facilitate the incorporation of new projects will be to locate them relatively close to the
strong transmission sub-systems mentioned. These transmission facilities also reach the main demand
centers.
In summary, findings from the LEI team’s analysis indicates that with the available information it is not
possible to determine conclusively the maximum amount of renewable energy that can be incorporated
into the current or the planned network system.
The “Grid Analysis for Integration of Wind/Solar Generation Plants,” prepared by ERA in 2015 shows that
in the 2015-2024 period, a total of at least 155 MW (of solar and wind) could be reliably integrated and
successfully evacuated. Out of these 155 MW, 50 MW of solar is already in operation. As such, it is the
LEI team’s understanding that the system would not allow the connection of projects greater than 50 MW
in Tororo, 40 MW in Kabulasoke, 20 MW in Mayuge, and 20 MW in Soroti.

61
4.8 System Connection Costs
Apart from the costs of developing a generation plant, the decision-making process must consider the
costs of connecting it to the electrical system. In the case of those plants that can be installed in locations
close to the existing transmission system, the connection costs will be low, and will grow as they move
away.
Given the environmental and social particularities of Uganda, the best solar resources are found in the
central and southern region, coinciding with the most populated areas and therefore with the existing
transmission and distribution system. Wind resources are more feasibly exploited in the northeast region
of the country, where there are relatively few populated centers, and the transmission system is practically
non-existent.
Below we provide a rough estimate of the connection costs of the renewable generation projects to be
developed by UEGCL within its diversification strategy. This estimate is developed under the following
premises:
• All the projects have 50 MW of installed capacity.
• Those of a solar nature are 5 km from the existing transmission system and the wind projects
100 km away.
• The layout will consist of double circuit lines, where each circuit can transmit the entire nominal
capacity of the plant. In this way, the availability of the installed generation for the system is
guaranteed even with one of the circuits going out of service due to failure or preventive
maintenance (this is known in the industry as the n-1 planning criteria).
• Solar plants are assumed to be interconnected to the transmission system at 66 kV. For wind
power plants (assumed to be farther away from the transmission system) the interconnection
voltage is assumed to be 132 kV. These voltages are chosen considering the limitations imposed
by the voltage drop, the reactive power regulation, and the stability considerations of the system.
Conductors are sized to carry the necessary current to support the power transfer.
• The plant's own development costs are assumed to include those associated with raising the
generation voltage to the transmission level (66 kV in the case of solar and 132 kV in the case of
wind). Likewise, it is assumed that the connection system is of a voltage like that of arrival from
the generation plant. Thus, in connection costs, investments associated with the transformation
of voltage levels will not be considered.
• Substations layouts are assumed to be one bay per line output, comprised of a breaker,
disconnector, protections, and civil works.
• With the above considerations, every connection scheme will be composed of 4 bays, two for
the line out and two for the line in, plus the double circuit line of the lengths previously indicated.
• The unit costs used are from similar projects in Africa. Figure 32 summarizes these unit costs.
•

62
Figure 32. Unit costs
Source: Database of capital costs
Therefore, a typical solar project will have connection costs of $1.95 million, distributed as:
• 4 bays at 66 kV = 4 bays × $300,000/bay = $1,200,000
• 5 km of double-circuit 66 kV line = 5 km × $150,000/km = $750,000
Wind projects will have connection costs of $22 million:
• 4 bays at 132 kV = 4 bays × $500,000/bay = $2,000,000
• 100 km of double-circuit 132 kV line = 100 km × $200,000/km = $20,000,000.
Item Cost ($ per unit)
66 kV bay $ 300,000/bay
132 kV bay $ 500,000/bay
Double-circuit 66 kV line $ 150,000/km
Double-circuit 132 kV line $ 200,000/km

63
PROPOSED STRATEGY TO ACHIEVE ENERGY MIX
DIVERSIFICATION
In order to successfully achieve its goals of energy mix diversification, UEGCL as an organization must
prepare itself to ensure that it is ready (and continues to be ready for the next 20 years) to face the
significant challenges that come with this aspiration. These challenges are of a technical, operational,
organizational, and financial nature. The strategy suggested for UEGCL consists of a series of short-,
medium- and long-term measures that UEGCL may consider taking in order to successfully carry out the
recommended energy mix diversification strategy. These measures are discussed next.
5.1 Action items for the Short-term (2020-2024)
In the short term (between 2020-2024) results of the LEI team’s technical review indicate that the Ugandan
power system does not require new generation additions. However, it is in this period that UEGCL must
lay the groundwork for its diversification strategy by implementing a series of measures associated with
the expansion of its generation system, among which the following are recommended:
• Solicit the support from MEMD and ERA to lead generation planning activities in cooperation and
in collaboration with the other key stakeholders.
• Hire and retain staff to nurture and preserve institutional knowledge on matters related to
regulatory, planning, engineering, construction and project development; cultivating such internal
knowledge will empower UEGCL to execute its mandate with limited reliance on external
technical support while developing expertise that could be in turn leveraged and potentially
monetized. Concurrently, we recommend that ERA and the MEMD considers setting up a process
for knowledge/ skill transfer to improve UEGCL’s competitiveness. In the case of wind technology
for instance, we would expect IPPs developing the first few wind projects in Uganda to share
critical data (such as data on wind regime for instance) and lessons learned with UEGCL in a
formal and systematic fashion.
• Acquire the capability (i.e., hire personnel, acquire tools, and training) to i) independently develop
long term least-cost generation plans, and ii) update them on an annual basis; this will enable the
company to continuously have an up-to-date vision of the optimal energy mix in Uganda that can
inform its strategy for many years to come. Acquiring this capability may require engaging
consultants at the beginning to develop the initial least-cost generation plan(s), and then gradually
assuming these responsibilities in house. It is also worth mentioning that such an exercise
(developing a long term least cost expansion plan) should be carried out internally by UEGCL
irrespective of the development of an Integrated Resource Plan at the country level.
• Actively participate in the joint planning committee.
• Improve operations of ongoing fleet; UEGCL should take all the necessary steps to ensure it
maximizes the life duration of the assets under its control to avoid extended forced outages or
early retirement, which then could trigger additional needs of capacity additions.
• Start the development process of new renewable resources by scouting, acquiring and securing
sites where these plants could be located, and perhaps establishing measurement equipment to
ascertain the quality of the renewable resource (e.g., wind or solar).

64
• Continue ongoing initiatives such as the co-location of solar installation on hydropower sites or
consider installing geothermal wellhead plants.
By 2024, once the foundational work has occurred UEGCL would be in a position to carry out the
required capacity addition that it will rely upon to diversify its supply mix.
5.2 Action items for the Mid-term (2025-2030)
The LEI team makes the following recommendations to UEGCL for the mid-term:
• Continue updating the least cost generation expansion plan on an annual basis.
• Findings from the technical review suggest that UEGCL might develop up to 300 MW of
renewables by 2030. We recommend that UEGCL continue the development process of new
renewable resources preferably in modular plants of 50 MW or else, by securing the land where
the projects will be installed, by completing the licensing process with ERA, and by performing all
necessary feasibility and environmental studies.
• Carry out conceptual engineering studies for the renewable power plants, including the
infrastructure required to connect the plant to the grid and the need for additional reinforcements
in the transmission system.
• Findings of studies carried out until then, would be leveraged to derive an estimate of
development, operation and maintenance costs, which will be used to further refine estimate of
the economic feasibility of the projects.
• The locations of the new additions should be the most economical ones from the perspective of
the cost of energy, which includes the cost of the associated transmission upgrades. For solar
plants, it is likely that these locations will be either on the northern fringe of Lake Victoria, or in
the vicinity of either the Tororo-Jinja-Kampala-Entebbe-Masaka or the Hoima-Fort Portal-Nkenda
transmission system. For wind, the plants will most likely be located in the northern region of the
country, requiring more expensive transmission upgrades.
• Engineer, procure and construct a defined volume of renewable resources as determined by the
latest version of the generation expansion plans that UEGCL would be updating on a continuous
basis.
5.3 Action items for the Long-term (2031-2040)
The LEI team makes the following recommendations to UEGCL for the long-term:
• Continue updating the least cost generation expansion plan on an annual basis.
• UEGCL can participate in the provision of the system needs with a mix of renewable and
conventional technologies.
• With the demand forecast presented, for the 2031-2040 period the new generation requirements
are such that VREs alone might not be sufficient to address the system needs – rather it would
need to be complemented with other technologies. Findings from the LEI team’s technical review
suggest the opportunity to add more than 1,900 MW by 2040. For this purpose, the possibility of
exploiting hydro and geothermal sources, and adding efficient thermal sources of diverse nature
should be explored.

65
• To ensure that fossil-fueled power generation has a minimum impact on the environment, UEGCL
and Ugandan stakeholders should consider the possibility of importing gas from a nearby port
and/or through gas pipelines. Furthermore, while planning as far as 2040, UEGCL and Uganda in
general might also consider understanding the opportunities offered by cutting-edge new
technologies such as (full or partial) hydrogen power gas turbines technologies or advanced small
modular reactors (“SMRs”) for nuclear energy. The significant enabling infrastructure required to
accommodate these technologies of the “future” would warrant that early research and
brainstorming occur earlier rather than later.
• Although the decision-making underpinning capacity addition in the long term might not be taken
in the short term, the basic research, discussion, and feasibility studies of quantification and
availability of primary resources should be started in the short to midterm.
In section 4 we argued that in order to meet its energy mix diversification goals, UEGCL might develop
up to 300 MW of renewable energy resources in the medium-term, by 2030, and would have an
opportunity to develop more than 1,938 MW to address energy and capacity needs by 2040. Achieving
these objectives will require some immediate and future foundational work as described in section 5. In
fact, carrying out activities such as human capacity development (via workshop training and seminars) and
planning might have the greatest impact on reducing project costs in the medium and long term. In section
6, we propose a roadmap for financing the diversification strategy described in section 5, by highlighting
in detail tools, opportunities and resources available to finance UEGCL’s activities in the short, the mid
and the long term.

66
FINANCING THE ENERGY MIX DIVERSIFICATION
STRATEGY
In section 6, we propose a set of recommendations that UEGCL could follow to partially or fully fund the
series of action items it should implement in the short term, the midterm and the long term to achieve
its goals of energy mix diversification.
6.1 Financing activities in the short term: capacity building and planning
As established in Section 5, the LEI team recommends that in the short-term, UEGCL’s focus remains on
hiring and retaining staff who are experts on regulatory and technical matters. In addition to capacity
building, UEGCL should focus on development of internal planning capabilities such that they are able to
undertake their own generation planning – this plan would be updated annually and be ready and available
to respond to needs identified by the Least Cost Development Plan.
UEGCL might not have to shoulder entirely the cost associated with the recommended next steps; rather
it could rely on the assortment of options available to it. For instance, the LEI team recommends that
UEGCL continue its partnership with USEA, USAID, and Power Africa to boost its human capacity
development, with the organization of seminars, exchanges with peers, and workshops training over the
next 3 to 5 years. UEGCL could further work with its partners on enhancing operational technical
knowledge to strengthen maintenance and operational capabilities for current and future assets.
Moreover, the team recommends that UEGCL considers seeking grants from multilateral agencies active
in Uganda such as the Agence Francaise de Developpment (“AFD”), the KfW Development Bank, and
United States Trade and Development Agency (“USTDA”) to carry out feasibility studies for new project
development. USTDA for instance, has funded multiple of these feasibility studies in Africa for renewable
resources – this option could be explored to fund research on wind regime for example.
Regarding the generation planning, the LEI team recommends that UEGCL seeks technical support from
a qualified, experience consulting firm to lay the grounds of the analysis and carry out the first-generation
plan. It would be imperative that the technical support be accompanied by a transfer of knowledge (and
tools) to facilitate the development and nurturing of the knowledge and skillset required for UEGCL to
carry on with generation planning on its own.
Finally, the team suggests that over the next few years, UEGCL strives to shore up its balance sheet,
improve its revenues, build internal capacity in project finance, and ensure the GoU maintains a policy
priority for investment in generation infrastructure.
6.2 Financing activities in the mid-term: renewables development
In the medium-term, UEGCL is expected to develop up to 300 MW of new capacity. The total cost of
developing this capacity would vary depending on the choice of technologies. Uganda is endowed with
remarkable solar potential, and solar technology is scalable, market tested, and costs are steadily
decreasing. Under current market conditions and the nature of renewables development in Uganda, it
could be reasonable to assume that solar technology would be one of the key technologies of choice to
fill the 300 MW of capacity. In that case, the all-in fixed cost of developing 300 MW of solar could be

67
estimated at about US$42.3 million/year.36 This cost nevertheless would vary based on multiple technical,
operational and financial parameters – see Appendix C for an illustration of the sensitivity of estimates of
project development costs to key driving parameters – cost for a typical 300 MW solar installation could
range between US$30 million/year to USD $50million/year. It is also worth noting that estimates of project
development costs could further increase if UEGCL decide to build wind, battery storage or geothermal
capacity in the place of solar. The cost of developing geothermal and battery storage installations being
relatively higher than that of solar37 or wind, it will likely raise the overall cost of installing 300 MW of
renewable technologies.
This section of the report describes the options available to finance project development in Uganda, while
subsequent sections provide recommendations on the way forward for financing projects development in
the mid-term and long-term.
Review of financing structure options available for project development
This section explores the various financing options, funding sources, and financial tools available to UEGCL
for financing a new project development in Uganda. For this exercise, the LEI team gathered financing data
from multiple sources (both international and local) and consulted with stakeholders with direct
infrastructure financing experience in Uganda such as Power Africa Uganda Electricity Supply Accelerator
(“PAUESA”) and the Uganda Development Bank, to form an opinion on financing market conditions in
Uganda, and on the realistic opportunities available to UEGCL.
It is worth noting that UEGCL has not been in a position to self-fund its projects, but rather has relied
traditionally on multiple sources of funding. For instance, 85% of Karuma Hydropower Project’s US$ 1.7
billion contract price was financed by a loan from the Export Import Bank of China (“China Exim Bank”),
while the remaining 15% was supplied by the Government of Uganda in a form of a grant. Isimba HPP,
with a total investment of US$ 568 million, was similarly financed by a combination of export credit (85%)
and Government grant (15%). The loans for Karuma and Isimba are disbursed by China Exim Bank to the
Government of Uganda, which then on-lends the loans to UEGCL.38 Looking forward, UEGCL
management has indicated its goal to “effectively finance or co-fund future generation assets” using UEGCL’s
net profit position.39
As part of its target to secure 100% funding for all identified capital projects,40 the company has stated its
plan to “use a mix of financing options to cover its operation and maintenance costs and capital investment costs.”
Major capital investment funds are expected to come from market finance, Public Private Partnership
arrangements, concessionary loans, and grants from development partners and the Ugandan Government.
The following subsections build upon the goals of the UEGCL’s management, and discuss pros and cons
associated with the choice of traditional funding sources and financing options. The LEI team understands
that UEGCL might also considering being listed on the securities market with the objective to raise private
36 Assuming the project is financed by a mix of concessional loans, grant and private capital.
37 Development cost for geothermal for instance is almost four times that of solar (see 11.1 and 11.2 for
illustration in Appendix D).
38 UEGCL. Annual Report for the 18 Months Ended June 2017. 2017.
39 UEGCL. Annual report for the 12 months period ended June 2019. 2019.
40 Strategic Plan 2018-2023.

68
capital;41 however for the purposes of this report, the focus remains on existing and proven funding
sources.
1. Public option: government and grant financing
The literature on infrastructure finance, particularly in developing economies, suggests that governments
and utilities are typically the largest funders of power generation, either through national treasuries, bond
issues or commercial loans, as well as utility-retained earnings.42 Such arrangements might involve the
government issuing debt, typically a concession loan, from local and foreign markets and then using the
proceeds to lend onwards to the entity (UEGCL for instance) for project development. The government
could also provide funding directly from the taxpayers as part of a fiscal program via the Ministry of Finance
(or entity in charge of the Treasury).
Alternatively, grants may be provided directly to the entity through an arrangement between a donor
government (or its agencies) as part of a broader partnership or agreement with the country. As discussed
in the preceding section, UEGCL has made use of all three of these tools, which the LEI team will designate
as “public” tools and are illustrated in Figure 33. The relative pros and cons of each of these are further
discussed in the following paragraphs.
Figure 33. Sample of tools available to UEGCL in a government-sponsored financing model
Source: LEI analysis.
Government funding in the form of fiscal expansion (i.e., directly from treasury) or in the form of loans
provides the lowest cost form of financing for power generation projects. Under this arrangement, the
Government of Uganda (“GoU”) provides direct funding to UEGCL for the purpose of development of a
project. GoU would seek the financing from a variety of sources available to it, including concessionary
loans, commercial loans or issuing bonds. The advantages of this tool include the availability of sovereign
guarantee, – and the relatively fast and straightforward nature of the arrangement for UEGCL, which is
not involved in managing relationships with lenders. In addition, governments can typically take on greater
debt burdens than corporations, particularly entities with weaker balance sheets.
41 UEGCL. Strategic Plan 2018-2023.
42 Eberhard, Anton, et al. Independent power projects in Sub-Saharan Africa: Lessons from five key countries. The World
Bank. 2016.
Taxpayers
Grants
Concession loans

69
The drawbacks of this tool include the prevalence of policy risk in the form of shifts in government’s
priorities and policy. In addition, the increase in debt-to-GDP ratio driven by fiscal expansion can put
pressure on government finances in the future – currently Uganda’s general government gross debt is just
under 40% of total GDP.43 However, this is projected to increase to just under 58% by 2024 by the IMF,
suggesting there may be limited room for large amounts of additional government spending.
Figure 34. Summary of pros and cons of public financing tools
The key players that would be involved in this set of tools are easily apparent to UEGCL. For instance,
the Government of Uganda and relevant state agencies including the Ministry of Finance would be the key
actors for direct government funding. For bilateral and multilateral financing, all development institutions
with a history of working in Uganda should be considered. Figure 35 provides a sample of entities
participating directly or indirectly in government support funding.
Figure 35. Sample of key players per type
43 International Monetary Fund. Fiscal Monitor: Policies for the Recovery. October 2020.
Advantages Drawbacks
Government provides sovereign guarantee
Can be deployed quickly
Government can take on greater debt burden
than corporate entity
Policy risk and changing government priorities
Increased pressure on government finances
Potential for conditions placed on grants by
bilateral and multilateral institutions
Key players
Government agency
Key players
Bilateral agency Multilateral agency
▪ Uganda Ministry of Finance
▪ Uganda Development Bank
▪ Agence francaise de developpement (AfD)
▪ Kreditanstalt fuer Wiederaufbau (KFW)
▪ Japan Bank for International Cooperation (JBIC)
▪ Swedish International Development
Cooperation Agency (SIDA)
▪ Department for International Development
(DFID)
▪ United States Agency for International
Development (USAID)
▪ African Development Bank (AfDB)
▪ World Bank

70
UEGCL has extensive experience working with the public sector and financing project development.
Project finance with grant and concessionary loans is largely cost effective and preferred as long as the
company continues to improve its financials and the development of power infrastructure remain a priority
for the government. However, by only relying on this financing option, UEGCL might become exposed to
greater policy risks. The LEI team would recommend that UEGCL continue to look for concessionary
loans and grants as much as it is available to achieve its goals, while concurrently working towards its
targets of self-sufficiency. This would allow the company to be prepared to transition toward a more
diverse (albeit relatively more expensive) sources of funding when there is a shift in Government’s
priorities.
The next section considers private funding options available for UEGCL.
2. Private option: funding from private entities and foreign lenders
The past decade has seen a growing appetite for regional infrastructure project development from private
lenders and finance institutions – a recent survey by researchers suggests that global investors may have
close to $550 billion in infrastructure assets under management in Africa.44 These global investors consist
of a large variety of investment structures including special purpose government agencies that invest
directly in companies, pension funds, sovereign wealth funds, corporate investors, family offices, private
equity and other investment vehicles in the private sector. Funding through these entities might be
channeled via dedicated funding structure, specially created to fund a specific project. Figure 36 presents
a sample of available private financing tools.
Figure 36. Sample of tools available to UEGCL in a private financing model
Source: LEI analysis.
There are two main advantages to private funding: first, financing a project with a dedicated funding
structure, a Special Purpose Vehicle (“SPV”), that pools all investors into a single entity, essentially shifts
the financial risks associated with the project away from the company sponsoring the project (UEGCL for
instance), to the project itself. Second, the SPV may provide more corporate and regulatory flexibility to
the project – some private entities and lenders may be more comfortable working with an SPV rather
than directly with a government-owned agency.
44 Based on target allocation to infrastructure of funds available to invest in infrastructure in Africa. (Source:
Lakmeeharan, K. et al. Solving Africa’s infrastructure paradox. McKinsey Research. March 2020).
Commercial loans
Equity investment
Export creditConstruction
loan
Bonds
Public-private partnership

71
The disadvantages of this approach revolve around the costs of financing. UEGCL would be subject to
relatively higher cost of borrowing as private lenders typically seek higher rates of return commensurate
with perceived risk. In the absence of sovereign guarantee or a strong balance sheet the risk premium
would be higher. There are also higher transaction costs for UEGCL as the lending entity may require
additional collateral, compliance, and due diligence that exceeds existing capacity at UEGCL. This may
necessitate the need to hire costly transaction advisors to cover the legal, tax, finance and administration
aspects of the transaction.
The pros and cons of this financing models are summarized in Figure 37.
Figure 37. Summary of pros and cons of private financing tools
The key players involved in these tools fall into a few categories. Most of the entities presented below
have been involved financing power infrastructure in Uganda and or Eastern Africa:
• International development banks: these include the International Finance Corporation
(“IFC”), which has been historically active in the Uganda power sector, the European Investment
Bank (“EIB”), and the Islamic Development Bank (“IDB”);
• Private equity and infrastructure funds: examples include TrønderEnergi, Norfund, and the
Emerging Africa Infrastructure Fund (“EAIF”), which owns the Bugoye small hydro plant;
• Export credit agencies: these include China ExIm Bank, Export-Import Bank of the United
States (“EXIM Bank”), and Japan Bank for International Cooperation;
• Government funded renewables investment vehicles: examples include The Renewable
Energy Performance Platform (“REPP”), funded by the UK Department of Business, Energy and
Industrial Strategy (“BEIS”), and the Danish Climate Investment Fund (“KIF”); and
• Regionally active PPP developers: examples include the US-based South Asia Energy
Management Systems (“SAEMS”), Sri Lanka-based Eco Power Limited, and Uganda-based
Hydromax Limited.
Advantages Drawbacks
Risks are shifted to the project itself, rather than
to the balance sheet
More corporate and regulatory flexibility
Higher costs of borrowing
Potential for higher transaction costs
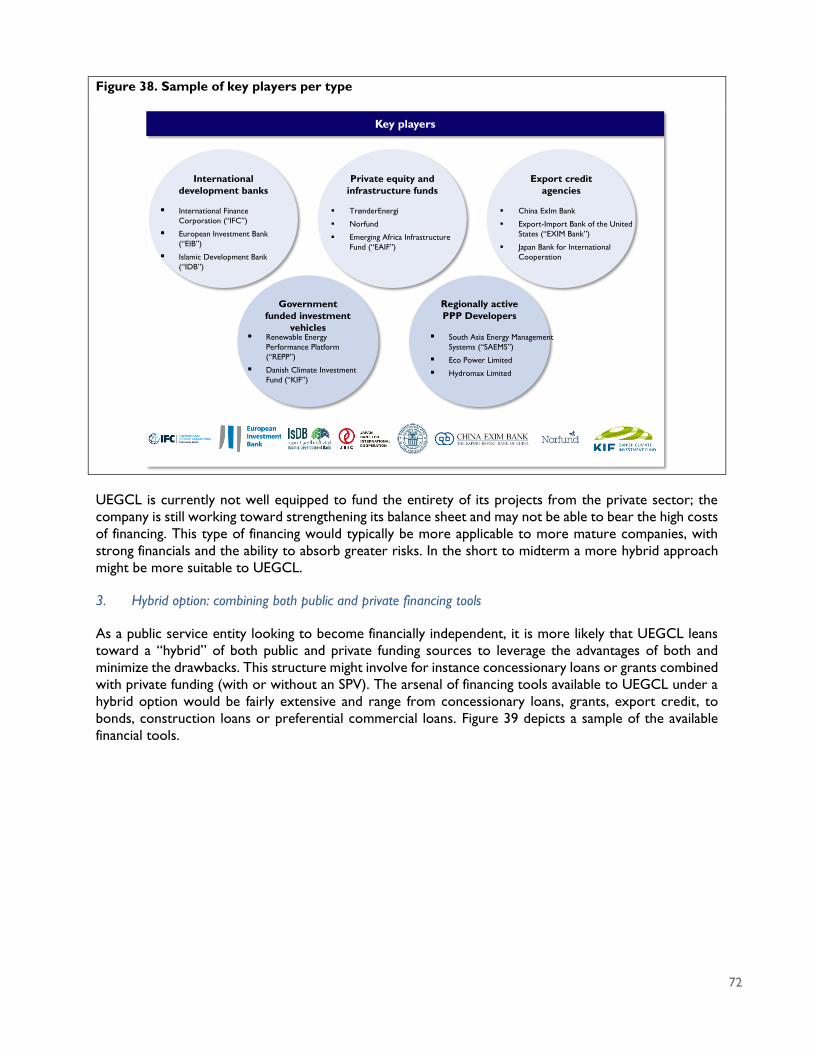
72
Figure 38. Sample of key players per type
UEGCL is currently not well equipped to fund the entirety of its projects from the private sector; the
company is still working toward strengthening its balance sheet and may not be able to bear the high costs
of financing. This type of financing would typically be more applicable to more mature companies, with
strong financials and the ability to absorb greater risks. In the short to midterm a more hybrid approach
might be more suitable to UEGCL.
3. Hybrid option: combining both public and private financing tools
As a public service entity looking to become financially independent, it is more likely that UEGCL leans
toward a “hybrid” of both public and private funding sources to leverage the advantages of both and
minimize the drawbacks. This structure might involve for instance concessionary loans or grants combined
with private funding (with or without an SPV). The arsenal of financing tools available to UEGCL under a
hybrid option would be fairly extensive and range from concessionary loans, grants, export credit, to
bonds, construction loans or preferential commercial loans. Figure 39 depicts a sample of the available
financial tools.
Key players
International
development banks
Key players
▪ International Finance
Corporation (“IFC”)
▪ European Investment Bank
(“EIB”)
▪ Islamic Development Bank
(“IDB”)
Private equity and
infrastructure funds
▪ TrønderEnergi
▪ Norfund
▪ Emerging Africa Infrastructure
Fund (“EAIF”)
Export credit
agencies
▪ China ExIm Bank
▪ Export-Import Bank of the United
States (“EXIM Bank”)
▪ Japan Bank for International
Cooperation
Government
funded investment
vehicles▪ Renewable Energy
Performance Platform
(“REPP”)
▪ Danish Climate Investment
Fund (“KIF”)
Regionally active
PPP Developers
▪ South Asia Energy Management
Systems (“SAEMS”)
▪ Eco Power Limited
▪ Hydromax Limited

73
Figure 39. Sample of tools available to UEGCL in a hybrid financing model
Source: LEI analysis.
The advantages of the hybrid model entail additional government support that lowers risk due to
government equity in the project but offers additional flexibility due to project financing at the project
level i.e., outside the balance sheet of UEGCL. This means the project could potentially earn a higher rate
of return than allowed for typical government-owned agencies, which in turn might attract high quality
lenders. The drawbacks of such a structure include an increased regulatory and structural complexity
before reaching financial close, issues over governance and oversight, and the potential to crowd out
financing for private sector participants.
Figure 40. Summary of pros and cons of hybrid approach financing tools
As described previously, the LEI team estimated that UEGCL might need to develop 300 MW of renewable
technologies by the year 2030. The rapidly decrease in costs of solar, wind and storage technologies might
render such development relatively affordable. For as long as the Government of Uganda is amenable to
providing financing to UEGCL projects, the LEI team would recommend that UEGCL first seek concession
loans and grants to finance it project development. A hybrid model should be considered if the project
cannot be fully funded via concession loans or grants. The choice of UEGCL funding sources and financial
Commercial loan
Equity investment
Export creditConstruction
loan
Bond
Public-private partnership
Taxpayers GrantsConcession
loans
GRMF facility
Advantages Drawbacks
Lower risks compared to 100% private financing
due to government support
Greater regulatory flexibility
Increased project complexity
Potential oversight and management issues
Potential crowding out of private investorsProvides a hedge against heavy reliance on
government support

74
options may not only impact its ability to successfully finance and develop a project, but it also has a real
impact on the energy costs to be borne by ratepayers. We illustrated the impact of the choice of financial
options on both project cost and energy cost in Appendix D. The LEI team has employed a levelized cost
analysis to provide illustrative values of the extent to which the choice of the source of funding and/or a
project financial structure, could impact project development cost.
Key takeaways for UEGCL
In the medium and long-term, the funding resources and financial tools employed, whether public, hybrid
or private, can have a meaningful impact on costs, and UEGCL should seek financing options with lower
return requirements if it is concerned about cost management. Given its public service mandate and the
need to offer an energy that is as reliable as affordable, we would recommend that UEGCL relies on the
most affordable financing option as much as it is able to do so (via concessionary loans and grants from
the government of Uganda, or/and both bilateral and multilateral agencies). In any of these cases, given the
inverse relationship between strong financial standing and cost of borrowing (the stronger the financial
standing, the lower the cost of borrowing), the LEI team recommend that UEGCL strive to improve its
balance sheet and achieve its goal of self-sufficiency. This would empower the company with some
bargaining power ahead of its negotiation with lenders and other potential investors.
6.3 Financing activities in the long-term
In the long run (by 2040) we should be reasonably optimistic and assume that UEGCL would fully or
partially achieve its financial goals and as such would enjoy a stronger balance sheet and a greater financial
independence. As a mature company, UEGCL would be expected to enjoy a wide assortment of financial
resources and tools that will allow it to cost effectively finance new capacity addition. We could also
envision UEGCL’s ability to raise capital be boosted by the realization of a stock exchange listing.
75
ADDITIONAL THOUGHTS AND INDUSTRY WIDE
RECOMMENDATTIONS
Comments, observations and feedback received from the various stakeholders throughout the project
and during the workshop discussion held on February 4, 2021 were compiled, organized and formally
translated into a series of recommendations, which should be considered for continuously reforming the
energy sector in Uganda. The successful execution of UEGCL’s mandate and its planning objectives is
somewhat contingent to addressing some existing solvable industry shortcomings in the short term. The
nature of these shortcomings is multiple as it touches upon the policy and regulatory aspect of the sector,
the role of key players, sector-wide system planning and other. This section was designed to summarize
key recommendations which could be converted in immediate action items for the various stakeholders.
7.1 Recommendations for the sector
Integrated Resource plan at the country level
It is recommended that Uganda develops an integrated resource plan that will provide guidelines on how
Uganda will be able to meet its growing demand relying on supply and demand-side resources, while
achieving its goals of resource development, sustainability, reliability and affordability. The process for
developing the IRP is expected to be collaborative and to include at its heart key stakeholders of the
power sector (generation, transmission, distribution utilities, the regulator, and MEMD among others).
Although the team does not make express recommendations on which entity should lead this effort, we
suggest however that the IRP should be sponsored and issued by a single entity (in some jurisdictions as
discussed in section 2.3, it could be the regulatory agency or the ministry of energy), with the technical
support possibly delegated to a dedicated planning entity (perhaps spun off from the SPCC) independent
from the regulator and the system operator. Enough time should be allocated to develop the IRP
(especially the initial IRP) as it will require fundamental work on data gathering and development of key
parameters and drivers such as the load forecasts that should be agreed upon by all key stakeholders. In
Appendix B we describe a high-level framework for developing a power system expansion plan.
Better coordinated planning
The LEI team understands that there is no formal coordinated generation planning at the country level.
ERA grants licenses to qualified developers based on their ability to comply with the rigorous requirements
put in place by the regulator; this process occurs independently from MEMD or UEGCL’s planning.
Concurrently, MEMD leads extensive generation development and planning initiatives for large
hydropower for example or other technologies such as nuclear and wind. UEGCL would strive to develop
a generation planning based on its own independent studies. All of these planning initiatives are rooted in
different assumptions and states of the world; it is also worth noting that, most of it might not be in tune
with the transmission planning (managed by UETCL). As a result, the Uganda system has increasingly
become over-supplied, which resulted in new challenges such as generation curtailment. Large amount of
generation is added to the system without the accompanying network (transmission and distribution)
infrastructure required to dispatch that energy. Some of these issues could be remedied with better
coordination between network infrastructure and the opportunities and needs to develop new generation.
We recommend that generation expansion in Uganda becomes centralized and driven by system needs
and that the generation-transmission planning process be coordinated (or better yet, integrated). A way
to formalize this process would be to develop an annual procurement whereby total capacity requirement
(MW) in the system is allocated to developers in a competitive process. This would result in a generation
addition process that is orderly (with a system planning designed to identify location, timing of entry, and

76
quantity of generation needed), and cost effective (generation development based on competitive
process).
Supporting UEGCL in executing its mandate
We recommend a legislative review of all key institutions and agencies to better define roles and
responsibilities in generation planning and procurement. As previously discussed, a centralized generation
planning would be recommended to facilitate a generation expansion that is rooted in system needs and
determined based on assumptions widely agreed upon. We recommend that UEGCL benefits from the
support of MEMD and ERA to lead planning activities on the generation side (similar to UETCL on the
transmission side), while collaborating closely with all relevant stakeholders.
Enhancing ancillary services compensation
Bujagali Falls and UEGCL’s Isimba hydropower projects are among the only assets operating in Uganda
with the capability of providing spinning reserves. Spinning reserves are generating resources available
within a short interval of time to inject incremental power and compensate for generation/demand
unbalances in the case of equipment outages. As of now, it is our understanding that none of these
resources are compensated for this reliability service provided to the entire system. The continuous influx
of renewables to the grid is likely to further exacerbate the needs for these ancillary services; it is worth
noting that these services could also extend to drought protection offered by market participants with
standby capacity (especially valuable in hydro dominated systems). We recommend that ERA with support
from MEMD, lays out the regulatory framework guiding the formalization of an ancillary services regime
under which service providers will be compensated. Compensating ancillary services providers will not
only remunerate existing providers for services already provided to the grid, but it will also stimulate a
larger participation in the provision of these services by other generators, thus further enhancing the
reliability of service across the overall system.
7.2 Recommendations relative to project development
There are currently a series of factors that render project development appealing in Uganda. These include
the existence of cost reflective tariffs, a clear and transparent project development process, the disclosure
of tariff caps, and the regulatory role played by a strong independent regulator (ERA). In addition, UETCL,
the prime off-taker in Uganda, is largely perceived as capable, reliable, and credit-worthy. We could
reasonably expect that these enabling market conditions will carry on and remain conducive to UEGCL’s
own future project development. Nevertheless, through the team’s consultations with developers and
stakeholders with experience or involvement in project development in Uganda, we have noted a few
elements of concerns that could warrant further improvement.
Technology-specific PPA
• From discussion with developers, the LEI team gathered that existing PPA templates underlying energy
contracts might not fully capture the specificities of renewable intermittent technologies such as solar
based technologies and remain general in some respect. The LEI team was not able to independently
verify such a claim.45 However, it is worth noting that based on conversations with ERA, it appears
that separate PPAs have been developed for hydro, bagasse, and solar technologies. The LEI team
45 The PPAs reviewed so far are dated (2014) and might not be applicable to new project development (the LEI
team has reviewed PPA templates for the GET-FIT program).
77
encourages further development of technology specific PPAs to ensure that each technology is treated
according to its natural attributes. At a minimum, PPAs for wind and geothermal technologies should
be developed.
Interconnection process
• Based on the team’s discussion with solar project developers,46 it appears that the lack of clear
guidance on scheduling and action items during the last stage of the interconnection process can be a
source of confusion, which could lead to project delay. According to the project developer
interviewed by the LEI team, due to the lack of fully defined written rules, it was challenging and
confusing to grasp key action items and ascertain the role and responsibilities of all key stakeholders
involved in the final stage of the interconnection process, which led to delays in bringing the project
online. We recommend that ERA set clear generation interconnection guidelines that must be abided
by UETCL or Umeme, as the case may be.
Deemed energy clause
• The LEI team also understands that as of 2018 ERA has removed the deemed energy clause from
future PPA contracts (most likely as a direct consequence of the system being oversupplied). The
deemed energy clause allows power producers to be paid for any energy curtailed beyond a threshold
of 60 hours. Interaction with the regulator indicated that the clause was initially inserted to reduce
investment risk and therefore boost investment in the sector. The clause was then removed following
the spike in project development leading to generation oversupply.
• Although the decision of the regulator might be rooted in its mandate to limit consumers’ exposure
to price hikes, this decision could also adversely impact infrastructure development. The removal of
the deemed clause might create additional uncertainty which could translate into higher financing
costs, or project delay over difficulties to secure financing. Uganda is nonetheless hardly the only
jurisdiction wrestling with that matter. A similar paradigm exists in Kenya, where the regulator is in
the process of reviewing a switch from a “take-or-pay” clause to a “take-and-pay” for new PPAs.
Under a “take-or-pay” structure, off-takers pay generators for power that can be supplied, regardless
of whether the system operator is able to dispatch the power or not. This structure provides financial
certainty for generators, which could then focus on meeting their generation obligations. Under a
“take-and-pay” structure, off-takers would only pay generators for power that is actually dispatched
into the grid, which may better align power supplied to demand.
46 Developers of projects outside of the GET FIT program.

78
APPENDIX A – DETAILED SUPPLY-DEMAND BALANCE ANALYSIS
Figure 41. Annual supply-demand balance in Uganda (2020-204) with existing and licensed (but not yet operational) generation
In sections 8.1 and 8.2 we illustrated in charts supply-demand balance cases (for both capacity and energy) that resulted from the team’s analysis of
energy, capacity and load forecasts over the 2020-2040 horizon.
Base Load High Load Average Generation Drought
Year
Peak
Demand
MW
Reserve
MW
Energy
Demand
GWh
Peak
Demand
MW
Reserve
MW
Energy
Demand
GWh
Avail. Gen.
Capacity
MW
Deficit
Base MW
Deficit
High MW
Annual
Average
Energy
Output
Deficit
Base
GWh
Deficit
High
GWh
Annual
Average
Energy
Output
GWh
Deficit
Base
GWh
Deficit
High
GWh
2020 767 92 4,569 807 97 4,804 1,645 -786 -742 9,740 -5,171 -4,936 8,276 -3,707 -3,472
2021 827 99 4,855 889 107 5,217 1,656 -729 -660 9,804 -4,949 -4,587 8,329 -3,474 -3,112
2022 888 107 5,213 977 117 5,732 1,700 -706 -606 10,184 -4,971 -4,452 8,704 -3,491 -2,972
2023 953 114 5,594 1,076 129 6,317 1,709 -641 -503 10,235 -4,641 -3,918 8,747 -3,153 -2,430
2024 1,025 123 6,013 1,190 143 6,983 1,725 -577 -392 10,339 -4,326 -3,356 8,833 -2,820 -1,850
2025 1,108 133 6,505 1,324 159 7,771 1,725 -484 -242 10,339 -3,834 -2,568 8,833 -2,328 -1,062
2026 1,206 145 7,076 1,482 178 8,697 1,725 -374 -65 10,339 -3,263 -1,642 8,833 -1,757 -136
2027 1,308 157 7,678 1,657 199 9,723 1,725 -260 131 10,339 -2,661 -616 8,833 -1,155 890
2028 1,415 170 8,303 1,849 222 10,855 1,725 -140 346 10,339 -2,036 516 8,833 -530 2,022
2029 1,524 183 8,947 2,069 248 12,143 1,725 -18 592 10,339 -1,392 1,804 8,833 114 3,310
2030 1,600 192 9,403 2,172 261 12,908 1,725 67 708 10,339 -935 2,569 8,833 570 4,075
2031 1,680 202 9,883 2,281 274 13,721 1,725 157 830 10,339 -456 3,383 8,833 1,050 4,888
2032 1,764 212 10,387 2,395 287 14,586 1,725 251 957 10,339 48 4,247 8,833 1,554 5,753
2033 1,852 222 10,917 2,515 302 15,505 1,725 350 1,092 10,339 578 5,166 8,833 2,084 6,672
2034 1,945 233 11,473 2,641 317 16,481 1,725 453 1,232 10,339 1,135 6,143 8,833 2,640 7,648
2035 2,042 245 12,059 2,773 333 17,520 1,725 562 1,380 10,339 1,720 7,181 8,833 3,225 8,687
2036 2,144 257 12,673 2,911 349 18,623 1,725 677 1,536 10,339 2,335 8,285 8,833 3,840 9,790
2037 2,252 270 13,320 3,057 367 19,797 1,725 797 1,699 10,339 2,981 9,458 8,833 4,487 10,964
2038 2,364 284 13,999 3,210 385 21,044 1,725 923 1,870 10,339 3,661 10,705 8,833 5,166 12,211
2039 2,482 298 14,713 3,370 404 22,370 1,725 1,055 2,050 10,339 4,375 12,031 8,833 5,880 13,537
2040 2,607 313 15,463 3,539 425 23,779 1,725 1,194 2,238 10,339 5,125 13,440 8,833 6,630 14,946

79
8.1 Illustration of Supply-demand balance (capacity) over the 2020-2040
horizon
Figure 42 illustrates the supply demand balance resulting from the analysis conducted (for the Base
Load case).
Figure 42. Supply-Demand capacity balance 2020-2040 (Base Load Case)
Source: ERA and Analysis by LEI Team
Note that we applied a 12% reserve margin (as previously discussed) to the peak demand. As can
be seen, for the Base Load Case, additional available capacity (in the amount of approximately 67
MW) will be needed in Year 2030. This capacity deficit is expected to widen every year thereafter.
Figure 43 below depicts the supply-demand capacity balance for the High Load Case forecast. In
this High Load Case, additional available capacity (in the amount of approximately 131 MW) will
be needed in the system as early as in Year 2027 (three years earlier than in the Base Load Case).
This capacity deficit is also expected to widen every year thereafter.
0
500
1,000
1,500
2,000
2,500
3,000
3,500
2020
2021
2022
2023
2024
2025
2026
2027
2028
2029
2030
2031
2032
2033
2034
2035
2036
2037
2038
2039
2040
(MW
)
Peak Demand Reserve Available Generation Capacity
For the base load forecast,
additional capacity will be
needed in 2030

80
Figure 43. Supply-Demand capacity balance 2020-2040 (High Load Case)
Source: ERA and Analysis by LEI Team
8.2 Illustration of supply-demand balance (energy) over the 2020-2040
horizon
The results of the energy supply-demand balance analysis are illustrated in Figure 44 (Base Load
Case). Under the Base Load Case, additional energy, in the amount of approximately 48 GWh,
would be needed in the system by the year 2032. This energy deficit is also projected to increase
every single year thereafter.
0
500
1,000
1,500
2,000
2,500
3,000
3,500
4,000
4,500
2020
2021
2022
2023
2024
2025
2026
2027
2028
2029
2030
2031
2032
2033
2034
2035
2036
2037
2038
2039
2040
(MW
)
Peak Demand Reserve Available Generation Capacity
For the High Load forecast,
additional capacity will be
needed in 2027

81
Figure 44. Supply-Demand energy balance 2020-2040 (Base Load Case)
Source: ERA and Analysis by LEI Team
Source: ERA and Analysis by LEI Team
0
2,000
4,000
6,000
8,000
10,000
12,000
14,000
16,000
18,000
2020
2021
2022
2023
2024
2025
2026
2027
2028
2029
2030
2031
2032
2033
2034
2035
2036
2037
2038
2039
2040
(GW
h)
Energy Demand Annual Average Energy Output
For the Base Load
Forecast, additional
energy will be needed
in 2033
0
2,000
4,000
6,000
8,000
10,000
12,000
14,000
16,000
18,000
2020
2021
2022
2023
2024
2025
2026
2027
2028
2029
2030
2031
2032
2033
2034
2035
2036
2037
2038
2039
2040
(GW
h)
Energy Demand Annual Average Energy Output
For the Base Load
Forecast, additional
energy will be needed
in 2032

82
Under drought conditions, as shown in Figure 45, the energy deficit in the power system is
expected to occur much earlier for the Base Load case. That is, by 2029, about 114 GWh of
additional energy would be needed in the system.
Figure 45. Supply-Demand energy balance 2020-2040 (Base Load Case, Drought Conditions)
Further, Figure 46 below shows the supply-demand energy balance for the High Load Case
forecast. In this High Load Case, additional energy (in the amount of approximately 516 GWh)
will be needed in the system in Year 2028. This energy deficit will increase (as shown in the figure)
every year thereafter. However, as shown in Figure 47, under drought conditions, this deficit
would occur much earlier in the horizon, as in year 2027 about 890 GWh of additional energy
would be needed in the system.
0
2,000
4,000
6,000
8,000
10,000
12,000
14,000
16,000
18,0002020
2021
2022
2023
2024
2025
2026
2027
2028
2029
2030
2031
2032
2033
2034
2035
2036
2037
2038
2039
2040
(GW
h)
Energy Demand Annual Average Energy Output (Drought)
For the Base Load Forecast,
under drought conditions,
additional energy will be needed
in 2029

83
Figure 46. Supply-Demand energy balance 2020-2040 (High Load Case)
Source: ERA and Analysis by LEI Team
Figure 47. Supply-Demand energy balance 2020-2040 (High Load Case, Drought Conditions)
Source: ERA and Analysis by LEI Team
0
5,000
10,000
15,000
20,000
25,000
2020
2021
2022
2023
2024
2025
2026
2027
2028
2029
2030
2031
2032
2033
2034
2035
2036
2037
2038
2039
2040
(GW
h)
Energy Demand Annual Average Energy Output
For the High Load Forecast
additional energy will be
needed in 2028
0
5,000
10,000
15,000
20,000
25,000
2020
2021
2022
2023
2024
2025
2026
2027
2028
2029
2030
2031
2032
2033
2034
2035
2036
2037
2038
2039
2040
(GW
h)
Energy Demand Annual Average Energy Output (Drought)
For the High Load Forecast,
under drought conditions,
additional energy will be needed
in 2027

84
APPENDIX B – FRAMEWORK FOR
DEVELOPING A POWER SYSTEM EXPANSION
PLAN
As discussed in the body of the report, the LEI team recommends that UEGCL become proficient
in the independent development of least-cost expansion plans which include VREs as expansion
options. The purpose of this section is to provide an overview on standard and accepted
frameworks that could be adopted by UEGCL for the development of such least-cost expansion
plans. While several software programs are available in the market to support the implementation
of the framework presented below, the team makes no recommendations as to what specific
programs UEGCL should adopt, as such a selection would depend on many factors not discussed
here.
As a starting point, it is worth noting that least-cost power system expansion planning can be
quite challenging, in part because of the following features:
• multiple, and often conflicting, objectives;
• significant uncertainties;
• multiple stakeholders (ratepayers, owners, investors, employees, suppliers, society at
large) and the various stakeholders place different values on different outcomes; and
• inability to monetize some of the objectives.
With multiple conflicting objectives, the traditional concept of optimization is of limited use since
there is usually no plan which is "best" in terms of all the objectives or attributes of concern. The
expansion plans selected may not minimize all the costs perceived by the stakeholder groups, or
by any one of them.
The planning process should thus have the following attributes:
• recognition of multiple stakeholders, and explicitly address the fact that each stakeholder
may measure the cost or quality of a plan differently;
• evaluation of options on a level playing field, using criteria and methods that do not unfairly
bias the selection of alternatives nor unfairly represent the interests of a single
stakeholder;
• explicit treatment of uncertainties; and
• planners should not introduce their own biases in the planning process. These biases, if
existent, must be introduced by the decision makers themselves.
The approach shown in Figure 48 below implements one such planning process, seeking a
compromise of plans that may be acceptable to all stakeholders. The plans determined using this
process exhibit flexibility to respond to changes in the economic, regulatory, technical, and social
environment. The elements of the planning approach are briefly discussed in Figure 48 below.

85
Figure 48. Power Systems Planning Approach
Options Analysis
Options are choices or possible decisions available to the planner. In Uganda, specific options
would most likely include the following:
• Build hydro power plants.
• Build solar PV power plants.
• Build wind power plants.
• Build geothermal power plants.
• Upgrade existing power plants.
• Build new transmission lines and/or substations.
• Expand substations.
Option Sets
Option sets (the result of the option analysis process) are specific combinations of the modeled
options. For example, in Uganda, if building new renewable power plants, do not build additional
hydro units, and consider international interconnections. Clearly, there are many possible option
sets that can be formulated.

86
Uncertainties
Uncertainties are quantities or events which are beyond the decision makers’ foreknowledge or
control. For example, in Uganda, uncertainties would include the following:
• water inflows;
• load demand; and
• fuel prices.
Futures
Futures (the result of the uncertainty analysis process) are sets of specific materializations of the
modeled uncertainties. For example, a future can be: (i) load grows at six percent per year and
(ii) average water inflow levels, etc.
Scenario Evaluation
Scenarios are postulated by combining a single option set with a single future. Depending on the
number of option sets and uncertainties, the number of potential scenarios can grow very rapidly.
As such, scenarios are generally narrowed down to produce a solution that captures the
important issues (and produces useful results), represents a wide range of possibilities, and aids in
the decision-making process in a reasonable time frame.
For each scenario, alternative expansion plans must be determined which, for the uncertainties
modeled as well as in the long run, are least-cost and meet the standing planning criteria as well
as the rest of the constraints imposed on the expansion plans (such as, for example, the value of
the Energy-Not-Served (“ENS”), and any renewable energy and/or rural electrification targets).
Several computational tools (for example, hydrothermal coordination programs, and load flow
and short circuit programs) may be used to develop the alternative expansion plans for each year
of the planning horizon.
Attributes
Attributes are measures of the goodness of an expansion plan. Typical attributes are the present
value of the total investment costs, and the present value of the unserved energy. Attributes
measure the relative goodness of each expansion plan and are ultimately used to compare the
advantages and disadvantages of the various expansion plans in the decision analysis process. In
general, it is desirable to measure each attribute in its own natural units rather than attempt to
convert it to a single artificial unit of measure (such as a monetary measure). Such conversions
are inevitably linked to subjective considerations which may bias the results and are used to
compare expansion plans.
In Uganda, the attributes may be the following:
• investment cost (CapEx);
• levelized Cost of Energy (“LCOE”);
• unserved Energy;

87
• atmospheric Emissions; and
• renewables Penetration.
Decision Analysis
There is generally no scalar criterion (which would define an optimum plan) that is acceptable to
all parties. Since it is not often possible to “optimize a plan” in terms of each attribute
simultaneously, decision-making involves assessing conflicting factors to find the best trade-off
between desirable and undesirable effects.
As a result of the Scenario Evaluation phase of the process, there will be at least one expansion
plan for each scenario. Ideally, a single expansion plan will be robust for all futures. This means
that it will be the plan that one would choose no matter what uncertainties were to materialize.
It is seldom the case in practical applications that such a robust plan exists.
There is no universally accepted way to decide which expansion plan to choose if none are found
to be the robust plan. One approach is the minimax regret approach, although other approaches
are sometimes used. The minimax regret approach minimizes the worst-case regret, also called
opportunity loss, when deciding. That is, it encourages the avoidance of regret by minimizing the
highest regret when one decision has been made instead of another. One benefit of minimax is
that it is independent of the probabilities of the various outcomes. Often, these probabilities are
difficult to estimate.
Therefore, in most cases, it is necessary to use hedging strategies with the goal of mitigating the
possible impact caused by the modelled uncertainties. It may be possible to create a hedge by
adopting a combination of expansion plans. These expansion plans would contain options that
could be cancelled or activated in the future, if possible, if the uncertainties materialized in an
adverse way. The text box below considers how specific system planning tools can be
implemented to estimate the impact of the projects.
The other studies needed are those relating to the determination of the connection scheme of
the plant to the grid and the eventual need to strengthen the transmission system to incorporate
it.
The power system studies that are typically carried out in this group are those relative to the
analysis of the steady-state operation of the network through load flow (both for normal and
contingency conditions) as well as short circuit and transient stability studies. The two software
platforms most used internationally for this type of analysis are the PSS®E from Siemens and the
PowerFactory from DIgSILENT.
With all these studies it will be possible to determine the need for reinforcements in the network
or additions of reactive compensation equipment.
Finally, the economic evaluation will require an estimate of the project implementation and
operation costs, a preliminary capital and debt contribution scheme, and the expected financing
conditions.
With all these inputs, the convenience of the project can be evaluated through indicators such as
the Net Present Value of the expected Cash Flow, the Internal Rate of Return, and the
Benefit/Cost Ratio.

88
To carry out these studies, UEGCL should have personnel with technical expertise in: (i)
knowledge of the hydrological cycle of usable rivers, characteristics of the reservoirs, and
future predictions based on statistical criteria; and (ii) knowledge of hydrothermal system
optimization and power system analysis. The studies require execution times that are usually not
less than six months in duration.

89
APPENDIX C – ATTACHMENT - LCOE
MODEL DEVELOPED FOR UEGCL
Intentionally left blank

90
APPENDIX D– SUMMARY OF COST
ANALYSIS: IMPACT OF VARIOUS FINANCING
STRUCTURES ON PROJECT ($/KW-YEAR)
AND ENERGY COST ($/MWH)
This section demonstrates the impact of various financing structures on the levelized cost of
energy and on project development cost. This analysis is intended to be for illustrative
purposes only. The LEI team assumed three options that are broadly consistent with the tools
described in section 6.2. Specifically: a baseline scenario which involves 100% of funding via
government support (concessionary loans and grants), a hybrid option, whereby government
funding is supplemented by private capital, and a 100% private option. In general, it can be observed
that increasing the level of private participation increases the levelized cost of energy, driven by
the required return on investment and interest rate on debt.
11.1 Impact of the choice of financing structure on development ($/kW)
and energy costs ($/MWh)
The levelized cost of energy (“LCOE”) is a metric that calculates the present value of the total
cost of building and operating a power plant over an assumed lifetime. LCOE is a widely accepted
metric in the industry because it allows cross comparison of technologies featuring various
operating and technical parameters. LEI developed a detailed LCOE model to estimate the cost
of building and operating wind, solar and geothermal technologies in Uganda over their respective
lifetime. The model was developed in Microsoft Excel format; it was designed to be illustrative
and user-friendly, and structured to enable UEGCL to leverage it for further update or future
analysis. As part of this engagement, LEI submitted the model (along with core assumptions and
sources) to UEGCL as a separate attachment to this deliverable.
For this exercise, the LEI team considered the three renewable technologies that are expected to
be deployed in the medium to long term in Uganda: solar, wind and geothermal. For each
technology, we considered the following three scenarios:
i. a baseline scenario that assumes that the project is exclusively financed via government
support (85% financed via concession loan and 15% via grant);
ii. a hybrid scenario (85% financed via concession loan and 15% via private capital); and,
iii. a private scenario (75% project financed by debt and 25% by equity).
Across the three scenarios, for purposes of comparison, most operational and financial
parameters have been kept constant. The purpose of this exercise was to demonstrate that the
choice of financial structure impacts both the project’s overall development cost ($/kW-year) and
the resulting levelized energy cost ($/MWh) (and consequently consumers tariffs).
Illustration of cost variability with solar technology
Solar PV is the most promising renewable technology in terms of resource availability and
deployment. The LEI team has used publicly available information for existing projects where
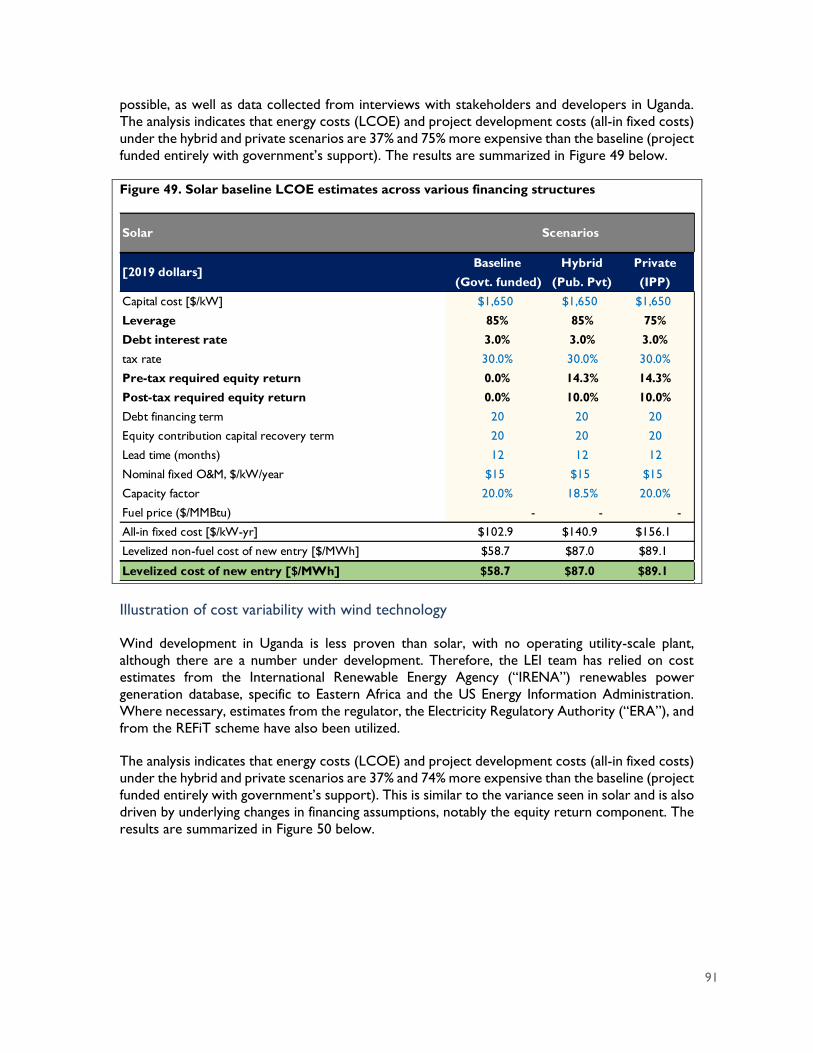
91
possible, as well as data collected from interviews with stakeholders and developers in Uganda.
The analysis indicates that energy costs (LCOE) and project development costs (all-in fixed costs)
under the hybrid and private scenarios are 37% and 75% more expensive than the baseline (project
funded entirely with government’s support). The results are summarized in Figure 49 below.
Figure 49. Solar baseline LCOE estimates across various financing structures
Illustration of cost variability with wind technology
Wind development in Uganda is less proven than solar, with no operating utility-scale plant,
although there are a number under development. Therefore, the LEI team has relied on cost
estimates from the International Renewable Energy Agency (“IRENA”) renewables power
generation database, specific to Eastern Africa and the US Energy Information Administration.
Where necessary, estimates from the regulator, the Electricity Regulatory Authority (“ERA”), and
from the REFiT scheme have also been utilized.
The analysis indicates that energy costs (LCOE) and project development costs (all-in fixed costs)
under the hybrid and private scenarios are 37% and 74% more expensive than the baseline (project
funded entirely with government’s support). This is similar to the variance seen in solar and is also
driven by underlying changes in financing assumptions, notably the equity return component. The
results are summarized in Figure 50 below.
Solar
[2019 dollars]Baseline
(Govt. funded)
Hybrid
(Pub. Pvt)
Private
(IPP)
Capital cost [$/kW] $1,650 $1,650 $1,650
Leverage 85% 85% 75%
Debt interest rate 3.0% 3.0% 3.0%
tax rate 30.0% 30.0% 30.0%
Pre-tax required equity return 0.0% 14.3% 14.3%
Post-tax required equity return 0.0% 10.0% 10.0%
Debt financing term 20 20 20
Equity contribution capital recovery term 20 20 20
Lead time (months) 12 12 12
Nominal fixed O&M, $/kW/year $15 $15 $15
Capacity factor 20.0% 18.5% 20.0%
Fuel price ($/MMBtu) - - -
All-in fixed cost [$/kW-yr] $102.9 $140.9 $156.1
Levelized non-fuel cost of new entry [$/MWh] $58.7 $87.0 $89.1
Levelized cost of new entry [$/MWh] $58.7 $87.0 $89.1
Scenarios

92
Figure 50. Wind baseline LCOE estimates across various financing structures
Illustration of cost variability with geothermal technology
With rock formations around the western segment of the Great Rift Valley, some geothermal
potential exists in Uganda, but to date has remained unexploited. We have relied on various
sources including the US National Renewable Energy Lab’s 2020 Annual Technology Baseline
(“ATB”), IRENA data and estimates from GeoVision for the LCOE. This case assumes a greenfield
development of a direct dry steam installation or single flash (these are the most common
installations). In the case of geothermal, extra care should be taken while reviewing the LCOE
because the LCOE does not capture the difficulties associated with the high risk and high-cost
nature of the exploration activities which are necessary to deploying steam infrastructure and
developing geothermal plants. Nonetheless, the results for both the all-in fixed costs and LCOE
show that the hybrid and private scenarios are 35% and 85% more expensive than a project
financed via a combination of concessionary loans and grants. These outcomes, which translate to
higher costs for consumers and developers compared to both solar and wind reflect the higher
equity return expectations for geothermal development.
The results of the analysis are summarized in Figure 51.
Wind
[2019 dollars]
Baseline
(Govt.
funded)
Hybrid
(Pub. Pvt)
Private
(IPP)
Capital cost [$/kW] $1,335 $1,335 $1,335
Leverage 85% 85% 75%
Debt interest rate 3.0% 3.0% 7.0%
tax rate 30% 30% 30%
Pre-tax required equity return 0.0% 19.3% 19.3%
Post-tax required equity return 0.0% 13.5% 13.5%
Debt financing term 20 20 20
Equity contribution capital recovery term 20 20 20
Lead time (months) 24 24 24
Nominal fixed O&M, $/kW/year $35.1 $35.1 $35.1
Capacity factor 25% 25% 25%
Fuel price ($/MMBtu) - - -
All-in fixed cost [$/kW-yr] $106.9 $146.7 $186.3
Levelized non-fuel cost of new entry [$/MWh] $48.8 $67.0 $85.1
Levelized cost of new entry [$/MWh] $48.8 $67.0 $85.1
Scenarios

93
Figure 51. Geothermal baseline LCOE estimates across various financing structures
11.2 Sensitivity analysis
In this section, we summarize the results of a sensitivity analysis carried out to illustrate the
sensitivity of cost estimates (development costs and LCOE) to technical, operational and financial
inputs. The purpose of this analysis is purely illustrative; it serves as a reminder that any estimates
of development cost or LCOE should be handled with care. We encourage UEGCL to be
empowered to refine and continuously keep current with changes in market conditions. The
analysis was conducted using the LCOE demonstration model submitted to UEGCL as an
attachment to the present report.
In general, the assumptions for solar were obtained from publicly available data on existing
projects and primary data collected by the LEI team from project proponents and financiers of
projects. The sensitivity analysis was conducted on five key drivers: equity return, cost of debt,
technology capacity factor, project leverage (share of debt and equity) and project capital cost.
The data relied upon and assumptions underpinning the LCOE model and the sensitivity analysis
are documented in the LCOE model provided to UEGCL. The results are Illustrated in the
following charts.
Geothermal
[2019 dollars]
Baseline
(Govt.
funded)
Hybrid (Pub. Pvt)Private
(IPP)
Capital cost [$/kW] $4,522 $4,522 $4,522
Leverage 85% 85% 70%
Debt interest rate 3.0% 3.0% 7.0%
tax rate 30% 30% 30%
Pre-tax required equity return 0.0% 20.0% 20.0%
Post-tax required equity return 0.0% 14.0% 14.0%
Debt financing term 20 20 20
Equity contribution capital recovery term 20 20 20
Lead time (months) 84 84 84
Nominal fixed O&M, $/kW/year $137.0 $137.0 $137.0
Capacity factor 85% 85% 85%
Fuel price ($/MMBtu) - - -
All-in fixed cost [$/kW-yr] $394.8 $534.1 $729.1
Levelized non-fuel cost of new entry [$/MWh] $53.0 $71.7 $97.9
Levelized cost of new entry [$/MWh] $53.0 $71.7 $97.9
Scenarios

94
Figure 52. Solar: illustration of LCOE sensitivity to key underlying variables
For wind, due to limited actual data, better measurements of wind data in Uganda will be pivotal
in refining LCOE estimates. As shown on the chart, the LCOE value is very sensitive to capacity
factor. Capacity factors are driven by the wind regime; hence a 28% capacity factor results in a
levelized cost of $58/MWh whereas a 25% yield a $65/MWh value, or a difference of 12%. The
results are shown below.
Figure 53. Wind: illustration of LCOE sensitivity to key underlying variables
69
82
80
80
63
91
105
100
104
87
0 50 100 150 200 250
Capital cost
Leverage
Capacity factor
Cost of debt
Equity return
LCOE ($/kWh)
LCOE variability
62
62
58
61
49
88
80
82
76
67
0 20 40 60 80 100 120 140 160 180 200
Capital cost
Leverage
Capacity factor
Cost of debt
Equity return
LCOE ($/kWh)
LCOE variability

95
Similar to wind, there is limited data on geothermal technology, and hence the analysis relies on
ERA data were available, and where it is not, we rely on best available data for Eastern Africa from
IRENA. The results of the sensitivity analysis are shown below.
Figure 54. Geothermal: illustration of LCOE sensitivity to key underlying variables
71
67
68
66
53
89
89
87
87
86
0 20 40 60 80 100 120 140 160 180 200
Capital cost
Leverage
Capacity factor
Cost of debt
Equity return
LCOE ($/kWh)
LCOE variability

96
APPENDIX E – WORKS CITED
Eberhard A. & Godinho, C. Lessons from Power Sector Reform: The Case of Uganda. World Bank
Group. April 2019
Eberhard, A. & Godinho, C. Learning from Power Sector Reform: The Case of Kenya. World Bank
Group. April 2019
Eberhard, Anton, et al. Independent power projects in Sub-Saharan Africa: Lessons from five key
countries. The World Bank, 2016
Energy and Petroleum Regulatory Agency. Energy & Petroleum Statistics Report 2019. 2019
ERA. Least Cost Electricity Expansion Plan 2020-2029. March 2020
Fábrega, José, Denise Delvalle, and Alexis Baúles. "Electricity sector overview." World Small
Hydropower Development Report 2019 4 (2019): 90
Gulrajani, Nilima. "Bilateral versus multilateral aid channels." Strategic choices for donors. London:
Overseas Development Institute (2016)
IESO website. Managing A Diverse Supply of Energy. 2020
International Monetary Fund. Fiscal Monitor: Policies for the Recovery. October 2020
IRENA. Estimating the Renewable Energy Potential in Africa: A GIS based approach. August 2014
IRENA. Renewable Readiness Assessment: Ghana. November 2015
IRENA. Renewables Readiness Assessment: Panama. 2018. International Renewable Energy Agency,
Abu Dhabi
KenGen. Integrated Annual Report & Financial Statements. 2018.
Kumi, Ebenezer. The Electricity Situation in Ghana: Challenges and Opportunities. 2017. CGD Policy
Paper. Washington, DC: Center for Global Development
Lakmeeharan, K. et al. Solving Africa’s infrastructure paradox. McKinsey Research. March 2020
Li, Xianguo. "Diversification and localization of energy systems for sustainable development and
energy security." Energy policy 33.17 (2005): 2237-2243
Lukawski, Maciej Z., et al. "Cost analysis of oil, gas, and geothermal well drilling." Journal of
Petroleum Science and Engineering 118 (2014): 1-14
Mangi, P. Geothermal Development in Kenya – Country Updates. November 2018
MEMD. Press Release: Clarification on Oil Spill incident at Kibiro Kigorobya Sub-county, Hoima district.
April 15, 2020

97
Ministry of Energy and Petroleum. Development of a Power Generation and Transmission Master Plan.
October 2016
National Planning Authority. Third National Development Plan (NDPIII) 2020/21 – 2024/25. June
2020
O’Brien, R. Steamy Investments in British Columbia. Ivey Business Review. March 2015
Parry, Jo-Ellen, et al. "Climate risks, vulnerability and governance in Kenya: A
review." Commissioned by: climate risk management technical assistance support project (CRM
TASP), joint initiative of bureau for crisis prevention and recovery and bureau for development policy
of UNDP (2012)
Sanya, Samuel. “Afeximbank entry makes Nyagak III financially viable.” New Vision. November 19,
2020. < https://www.newvision.co.ug/news/1532762/afreximbank-entry-makes-nyagak-iii-
financially-viable >
UEGCL. Annual report for the 12 months period ended June 2019. 2019.
UEGCL. Annual Report for the 18 Months Ended June 2017. 2017
UEGCL. Five-Year Strategic Plan (2018-2023). 2018
Uganda Ministry of Planning. Third National Development Plan, 2020/2021 – 2024/2025
Wilson, Rachel, and Bruce Biewald. "Best Practices in Electric Utility Integrated Resource
Planning." Regulatory Assistance Project and Synapse Energy Economics (2013)


