DRAFT SAICA ILLUSTRATIVE TRUST (Masters … SAICA ILLUSTRATIVE TRUST (Masters reference T11/90)...
25
DRAFT SAICA ILLUSTRATIVE TRUST (Masters reference T11/90) ANNUAL FINANCIAL STATEMENTS FOR THE YEAR ENDED 29 FEBRUARY 2016 Nkosi and Kessel Chartered Accountants Issued 31 May 2016
Transcript of DRAFT SAICA ILLUSTRATIVE TRUST (Masters … SAICA ILLUSTRATIVE TRUST (Masters reference T11/90)...
DRAFT SAICA ILLUSTRATIVE TRUST(Masters reference T11/90)ANNUAL FINANCIAL STATEMENTSFOR THE YEAR ENDED 29 FEBRUARY 2016
Nkosi and Kessel Chartered AccountantsIssued 31 May 2016
Mmoola
Typewritten Text
Attachment 6
Mmoola
Typewritten Text
Mmoola
Typewritten Text
Draft SAICA Illustrative TrustAnnual Financial Statements for the year ended 29 February 2016
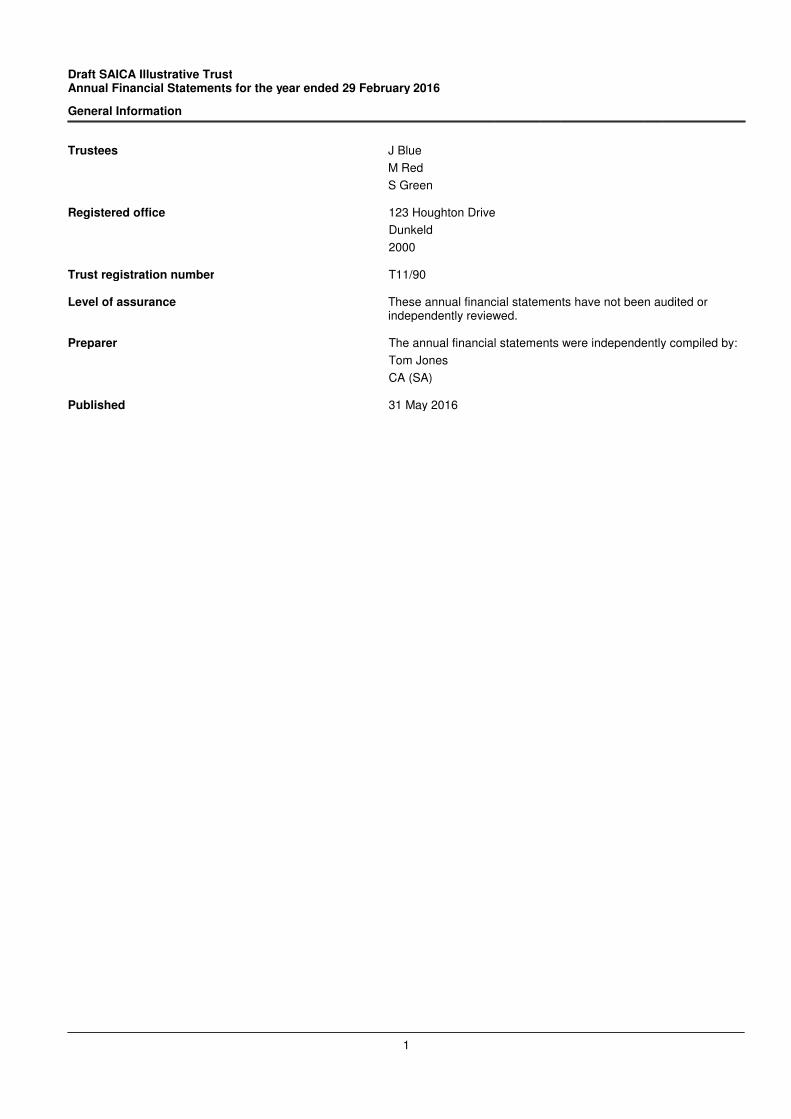
General Information
Trustees J Blue
M Red
S Green
Registered office 123 Houghton Drive
Dunkeld
2000
Trust registration number T11/90
Level of assurance These annual financial statements have not been audited orindependently reviewed.
Preparer The annual financial statements were independently compiled by:
Tom Jones
CA (SA)
Published 31 May 2016
1
Draft SAICA Illustrative TrustAnnual Financial Statements for the year ended 29 February 2016
Index
The reports and statements set out below comprise the annual financial statements presented to the beneficiaries:
Index Page
Trustees' Responsibilities and Approval 3
Practitioners' Compilation Report 4
Trustees' Report 5 - 6
Statement of Financial Position 7
Statement of Comprehensive Income 8
Statement of Changes in Equity 9
Statement of Cash Flows 10
Accounting Policies 11 - 13
Notes to the Annual Financial Statements 14 - 22
The following supplementary information does not form part of the annual financial statements:
Distribution schedule 23
2
Draft SAICA Illustrative TrustAnnual Financial Statements for the year ended 29 February 2016
Trustees' Responsibilities and Approval
The trustees are required to maintain adequate accounting records and are responsible for the content and integrity of theannual financial statements and related financial information included in this report. It is their responsibility to ensure that theannual financial statements fairly present the state of affairs of the trust as at the end of the financial year and the results of itsoperations and cash flows for the period then ended, in conformity with the International Financial Reporting Standard for Smalland Medium-sized Entities.
The annual financial statements are prepared in accordance with the International Financial Reporting Standard for Small andMedium-sized Entities and are based upon appropriate accounting policies consistently applied and supported by reasonableand prudent judgments and estimates.
The trustees acknowledge that they are ultimately responsible for the system of internal financial control established by thetrust and place considerable importance on maintaining a strong control environment. To enable the trustees to meet theseresponsibilities, the board of trustees sets standards for internal control aimed at reducing the risk of error or loss in a costeffective manner. The standards include effective accounting procedures and adequate segregation of duties to ensure anacceptable level of risk. These controls are monitored throughout the trust and the trustees are required to maintain the highestethical standards in ensuring the trust’s business is conducted in a manner that in all reasonable circumstances is abovereproach. The focus of risk management in the trust is on identifying, assessing, managing and monitoring all known forms ofrisk across the trust. While operating risk cannot be fully eliminated, the trust endeavours to minimise it by ensuring thatappropriate infrastructure, controls, systems and ethical behaviour are applied and managed within predetermined proceduresand constraints.
The trustees are of the opinion that the system of internal control provides reasonable assurance that the financial records maybe relied on for the preparation of the annual financial statements. However, any system of internal financial control canprovide only reasonable, and not absolute, assurance against material misstatement or loss.
The trustees have reviewed the trust’s cash flow forecast for the year to 28 February 2017 and, in the light of this review andthe current financial position, they are satisfied that the trust has, or has access to, adequate resources to continue inoperational existence for the foreseeable future.
The annual financial statements set out on pages 5 to 22, which have been prepared on the going concern basis, wereapproved by the board of trustees on 31 May 2016:
Trustee Trustee
Trustee
3
Practitioners' Compilation Report
To the beneficiaries of SAICA Illustrative Trust
We have compiled the annual financial statements of Draft SAICA Illustrative Trust, as set out on pages 7 - 22, based on theinformation you have provided. These annual financial statements comprise the statement of financial position of Draft SAICAIllustrative Trust as at 29 February 2016, the statement of comprehensive income, statement of changes in equity andstatement of cash flows for the year then ended, and a summary of significant accounting policies and other explanatoryinformation.
We performed this compilation engagement in accordance with the International Standard on Related Services 4410 (Revised),Compilation Engagements.
We have applied our expertise in accounting and financial reporting to assist you in the preparation and presentation of theseannual financial statements in accordance with the International Financial Reporting Standard for Small and Medium-sizedEntities. We have complied with relevant ethical requirements, including principles of integrity, objectivity, professionalcompetence and due care.
These annual financial statements and the accuracy and completeness of the information used to compile them are yourresponsibility.
Since a compilation engagement is not an assurance engagement, we are not required to verify the accuracy or completenessof the information you provided to us to compile these annual financial statements. Accordingly, we do not express an auditopinion or a review conclusion on whether these annual financial statements are prepared in accordance with the InternationalFinancial Reporting Standard for Small and Medium-sized Entities.
__________________________________Tom JonesPartner
31 May 2016
4
Draft SAICA Illustrative TrustAnnual Financial Statements for the year ended 29 February 2016
Trustees' Report
The trustees have pleasure in submitting their report on the annual financial statements of Draft SAICA Illustrative Trust forthe year ended 29 February 2016.
1. The trust
The trust was registered in terms of a trust deed dated 1 March 2002, under jurisdiction of the Johannesburg Master's Office. The trust is an inter vivos trust, and the trustees have discretionary powers with regards to trust capital and income.
2. Nature of business
Draft SAICA Illustrative Trust was registered in, and operates in, South Africa.
The core business of the trust is investing in equities, unit trusts, and properties.
There have been no material changes to the nature of the trust's business from the prior year.
3. Review of financial results and activities
The annual financial statements have been prepared in accordance with the International Financial Reporting Standard forSmall and Medium-sized Entities. The accounting policies have been consistently applied.
Full details of the financial position, results of operations and cash flows of the trust are set out in these annual financialstatements.
4. Beneficiaries
The beneficiaries of the trust during the accounting year and up to the date of this report are as follows:
Name Income tax reference numberG S Ready 1234/567/89/1B V Steady 9876/543/21/2
5. Distributions to beneficiaries
Distributions to beneficiaries during the year are made on a discretionary basis. Local dividends are not distributed but retainedwithin the trust in order to build up trust capital, and are transferred from accumulated surplus to trust capital in the statement ofchanges in equity. The distributions to beneficiaries during the year are as set out in the statement of changes in equity.
6. Trustees' benefits
No remuneration was paid to the trustees during the year under review.
7. Trustees
The trustees in office at the date of this report are as follows:
TrusteesJ BlueM RedS Green
All trustees are South African, and reside within the country.There have been no changes to the trustees for the period underreview. The Master has issued the trustees a Letter of Authority to administer the trust.
8. Land and buildings
The trust owns land and buildings situated in Durban, with a cost of R1,000,000 and a carrying amount of R940,000 at thereporting date (2013: R945,000), which it has classified as property, plant and equipment. The land is not depreciated, whilebuildings are carried at cost less accumulated depreciation as the trust is not able to measure its fair value reliably withoutundue cost or effort on an ongoing basis.
Land and buildings situated in Johannesburg with a cost of R2,713,234 (including additions) and a fair value of R3,258,440 atthe reporting date (2013: 3,074,000) is classified as investment property and is fair valued annually.
5

Draft SAICA Illustrative TrustAnnual Financial Statements for the year ended 29 February 2016
Trustees' Report
9. Borrowing powers
In terms of the Trust Deed, the borrowing powers of the trust are unlimited and at the sole and absolute discretion of thetrustees.
10. Going concern
The trustees believe that the trust has adequate financial resources to continue in operation for the foreseeable future andaccordingly the annual financial statements have been prepared on a going concern basis. The trustees have satisfiedthemselves that the trust is in a sound financial position and that it has access to sufficient borrowing facilities to meet itsforeseeable cash requirements. The trustees are not aware of any new material changes that may adversely impact the trust.The trustees are also not aware of any material non-compliance with statutory or regulatory requirements or of any pendingchanges to legislation which may affect the trust.
6
Draft SAICA Illustrative TrustAnnual Financial Statements for the year ended 29 February 2016
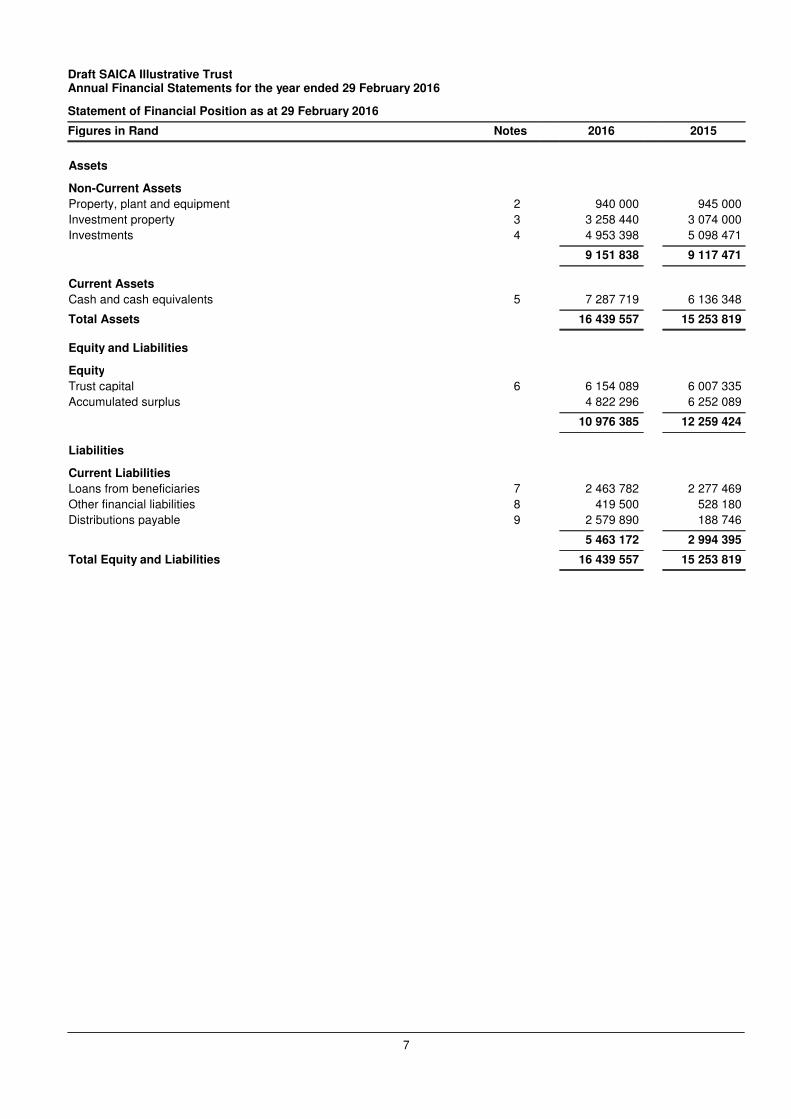
Statement of Financial Position as at 29 February 2016
Figures in Rand Notes 2016 2015
Assets
Non-Current Assets
Property, plant and equipment 2 940 000 945 000
Investment property 3 3 258 440 3 074 000
Investments 4 4 953 398 5 098 471
9 151 838 9 117 471
Current Assets
Cash and cash equivalents 5 7 287 719 6 136 348
Total Assets 16 439 557 15 253 819
Equity and Liabilities
Equity
Trust capital 6 6 154 089 6 007 335
Accumulated surplus 4 822 296 6 252 089
10 976 385 12 259 424
Liabilities
Current Liabilities
Loans from beneficiaries 7 2 463 782 2 277 469
Other financial liabilities 8 419 500 528 180
Distributions payable 9 2 579 890 188 746
5 463 172 2 994 395
Total Equity and Liabilities 16 439 557 15 253 819
7
Draft SAICA Illustrative TrustAnnual Financial Statements for the year ended 29 February 2016
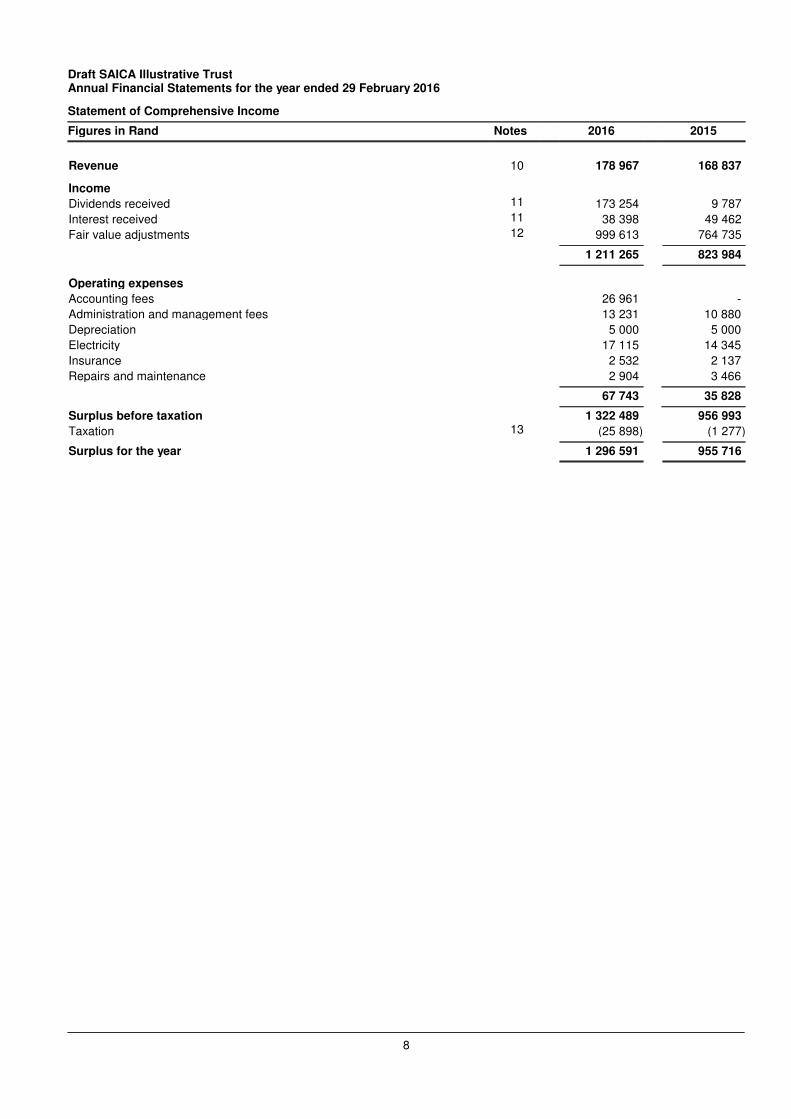
Statement of Comprehensive Income
Figures in Rand Notes 2016 2015
Revenue 10 178 967 168 837
Income
Dividends received 11 173 254 9 787
Interest received 11 38 398 49 462
Fair value adjustments 12 999 613 764 735
1 211 265 823 984
Operating expenses
Accounting fees 26 961 -
Administration and management fees 13 231 10 880
Depreciation 5 000 5 000
Electricity 17 115 14 345
Insurance 2 532 2 137
Repairs and maintenance 2 904 3 466
67 743 35 828
Surplus before taxation 1 322 489 956 993
Taxation 13 (25 898) (1 277)
Surplus for the year 1 296 591 955 716
8
Draft SAICA Illustrative TrustAnnual Financial Statements for the year ended 29 February 2016
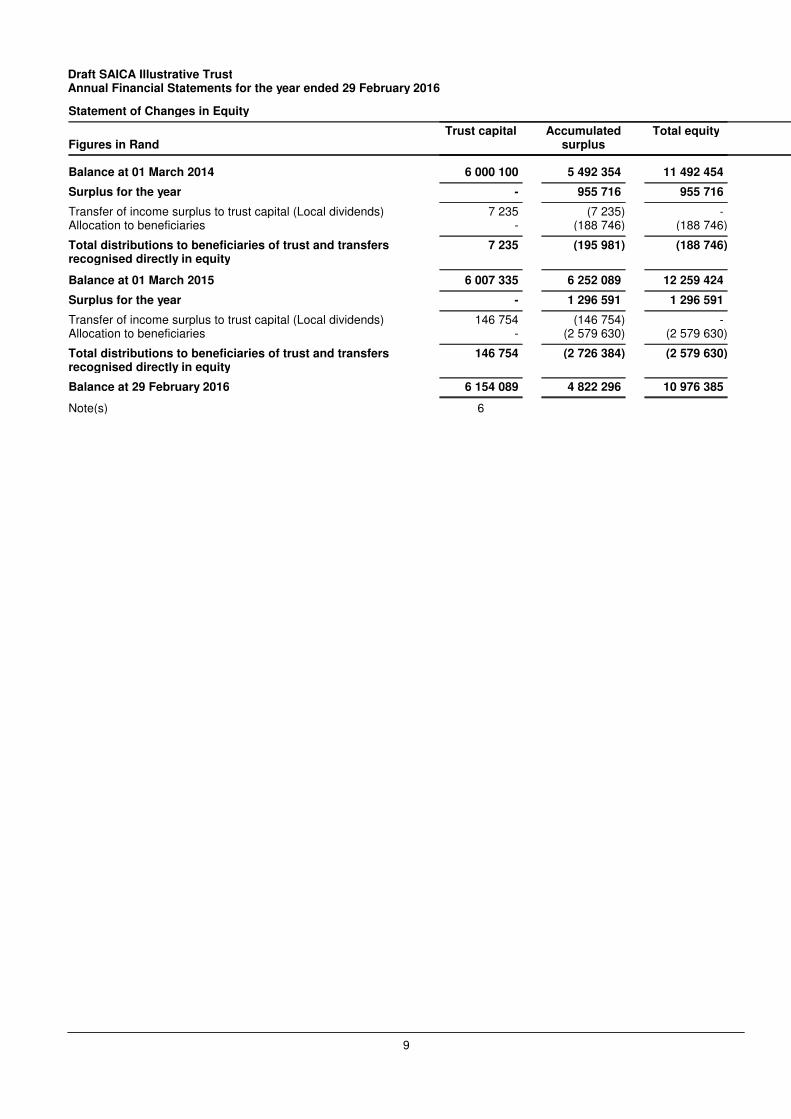
Statement of Changes in Equity
Figures in RandTrust capital Accumulated
surplusTotal equity
Balance at 01 March 2014 6 000 100 5 492 354 11 492 454
Surplus for the year - 955 716 955 716
Transfer of income surplus to trust capital (Local dividends) 7 235 (7 235) -Allocation to beneficiaries - (188 746) (188 746)
Total distributions to beneficiaries of trust and transfersrecognised directly in equity
7 235 (195 981) (188 746)
Balance at 01 March 2015 6 007 335 6 252 089 12 259 424
Surplus for the year - 1 296 591 1 296 591
Transfer of income surplus to trust capital (Local dividends) 146 754 (146 754) -Allocation to beneficiaries - (2 579 630) (2 579 630)
Total distributions to beneficiaries of trust and transfersrecognised directly in equity
146 754 (2 726 384) (2 579 630)
Balance at 29 February 2016 6 154 089 4 822 296 10 976 385
Note(s) 6
9
Draft SAICA Illustrative TrustAnnual Financial Statements for the year ended 29 February 2016
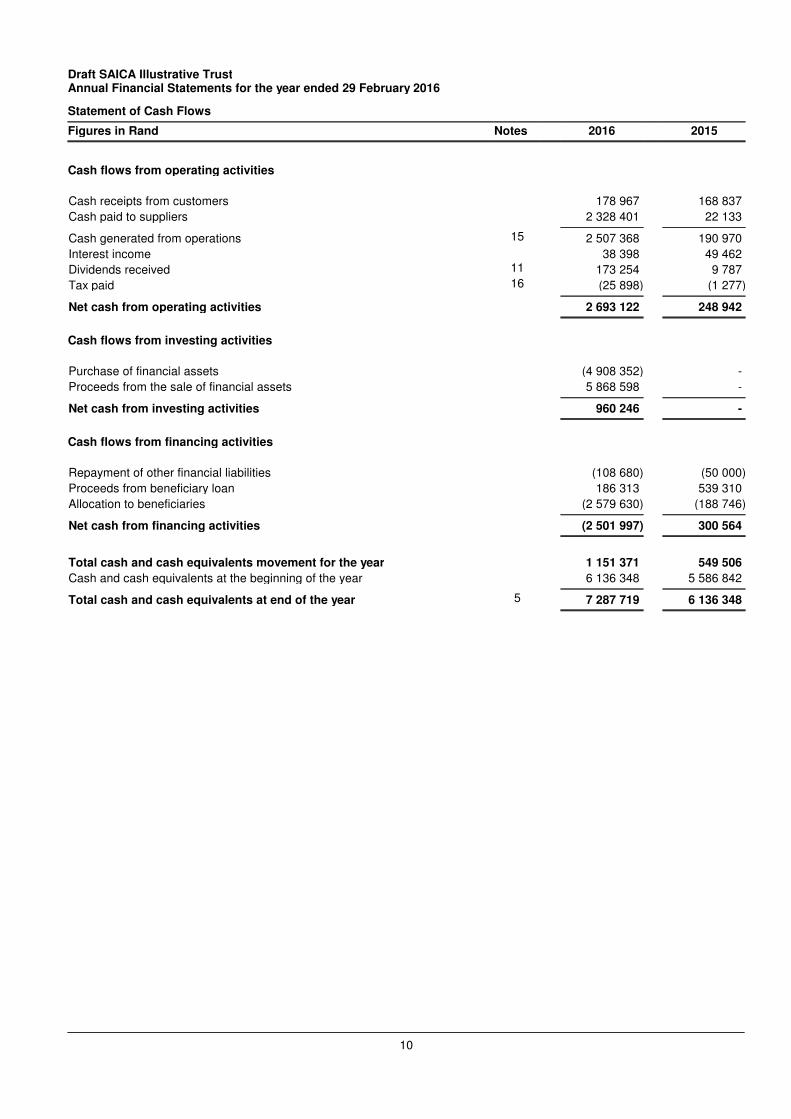
Statement of Cash Flows
Figures in Rand Notes 2016 2015
Cash flows from operating activities
Cash receipts from customers 178 967 168 837
Cash paid to suppliers 2 328 401 22 133
Cash generated from operations 15 2 507 368 190 970
Interest income 38 398 49 462
Dividends received 11 173 254 9 787
Tax paid 16 (25 898) (1 277)
Net cash from operating activities 2 693 122 248 942
Cash flows from investing activities
Purchase of financial assets (4 908 352) -
Proceeds from the sale of financial assets 5 868 598 -
Net cash from investing activities 960 246 -
Cash flows from financing activities
Repayment of other financial liabilities (108 680) (50 000)
Proceeds from beneficiary loan 186 313 539 310
Allocation to beneficiaries (2 579 630) (188 746)
Net cash from financing activities (2 501 997) 300 564
Total cash and cash equivalents movement for the year 1 151 371 549 506
Cash and cash equivalents at the beginning of the year 6 136 348 5 586 842
Total cash and cash equivalents at end of the year 5 7 287 719 6 136 348
10
Draft SAICA Illustrative TrustAnnual Financial Statements for the year ended 29 February 2016
Accounting Policies
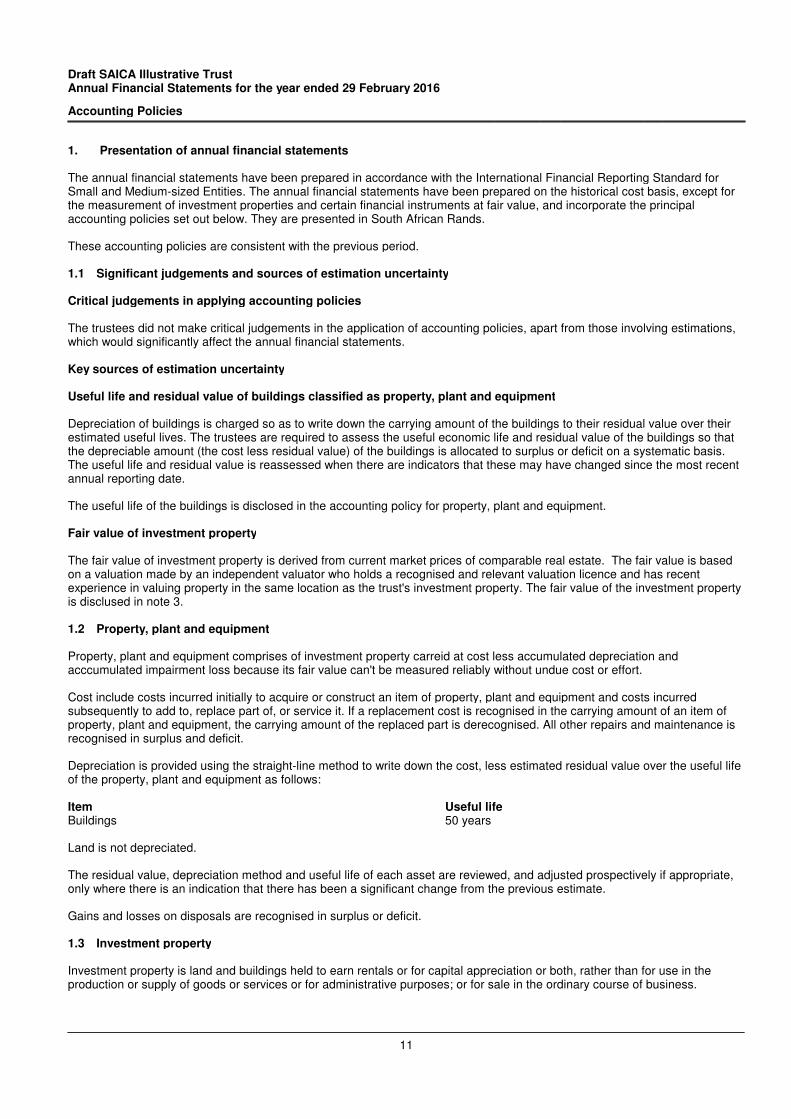
1. Presentation of annual financial statements
The annual financial statements have been prepared in accordance with the International Financial Reporting Standard forSmall and Medium-sized Entities. The annual financial statements have been prepared on the historical cost basis, except forthe measurement of investment properties and certain financial instruments at fair value, and incorporate the principalaccounting policies set out below. They are presented in South African Rands.
These accounting policies are consistent with the previous period.
1.1 Significant judgements and sources of estimation uncertainty
Critical judgements in applying accounting policies
The trustees did not make critical judgements in the application of accounting policies, apart from those involving estimations,which would significantly affect the annual financial statements.
Key sources of estimation uncertainty
Useful life and residual value of buildings classified as property, plant and equipment
Depreciation of buildings is charged so as to write down the carrying amount of the buildings to their residual value over theirestimated useful lives. The trustees are required to assess the useful economic life and residual value of the buildings so thatthe depreciable amount (the cost less residual value) of the buildings is allocated to surplus or deficit on a systematic basis.The useful life and residual value is reassessed when there are indicators that these may have changed since the most recentannual reporting date.
The useful life of the buildings is disclosed in the accounting policy for property, plant and equipment.
Fair value of investment property
The fair value of investment property is derived from current market prices of comparable real estate. The fair value is basedon a valuation made by an independent valuator who holds a recognised and relevant valuation licence and has recentexperience in valuing property in the same location as the trust's investment property. The fair value of the investment propertyis disclused in note 3.
1.2 Property, plant and equipment
Property, plant and equipment comprises of investment property carreid at cost less accumulated depreciation andacccumulated impairment loss because its fair value can't be measured reliably without undue cost or effort.
Cost include costs incurred initially to acquire or construct an item of property, plant and equipment and costs incurredsubsequently to add to, replace part of, or service it. If a replacement cost is recognised in the carrying amount of an item ofproperty, plant and equipment, the carrying amount of the replaced part is derecognised. All other repairs and maintenance isrecognised in surplus and deficit.
Depreciation is provided using the straight-line method to write down the cost, less estimated residual value over the useful lifeof the property, plant and equipment as follows:
Item Useful lifeBuildings 50 years
Land is not depreciated.
The residual value, depreciation method and useful life of each asset are reviewed, and adjusted prospectively if appropriate,only where there is an indication that there has been a significant change from the previous estimate.
Gains and losses on disposals are recognised in surplus or deficit.
1.3 Investment property
Investment property is land and buildings held to earn rentals or for capital appreciation or both, rather than for use in theproduction or supply of goods or services or for administrative purposes; or for sale in the ordinary course of business.
11
Draft SAICA Illustrative TrustAnnual Financial Statements for the year ended 29 February 2016
Accounting Policies
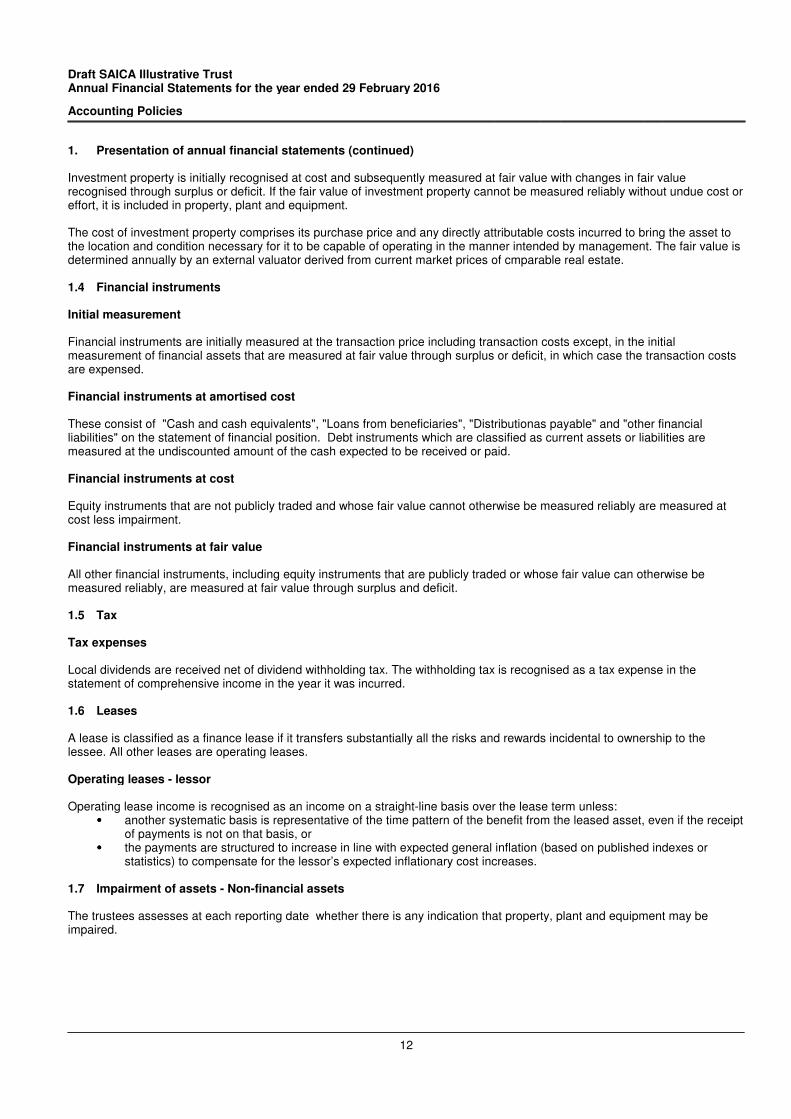
1. Presentation of annual financial statements (continued)
Investment property is initially recognised at cost and subsequently measured at fair value with changes in fair valuerecognised through surplus or deficit. If the fair value of investment property cannot be measured reliably without undue cost oreffort, it is included in property, plant and equipment.
The cost of investment property comprises its purchase price and any directly attributable costs incurred to bring the asset tothe location and condition necessary for it to be capable of operating in the manner intended by management. The fair value isdetermined annually by an external valuator derived from current market prices of cmparable real estate.
1.4 Financial instruments
Initial measurement
Financial instruments are initially measured at the transaction price including transaction costs except, in the initialmeasurement of financial assets that are measured at fair value through surplus or deficit, in which case the transaction costsare expensed.
Financial instruments at amortised cost
These consist of "Cash and cash equivalents", "Loans from beneficiaries", "Distributionas payable" and "other financialliabilities" on the statement of financial position. Debt instruments which are classified as current assets or liabilities aremeasured at the undiscounted amount of the cash expected to be received or paid.
Financial instruments at cost
Equity instruments that are not publicly traded and whose fair value cannot otherwise be measured reliably are measured atcost less impairment.
Financial instruments at fair value
All other financial instruments, including equity instruments that are publicly traded or whose fair value can otherwise bemeasured reliably, are measured at fair value through surplus and deficit.
1.5 Tax
Tax expenses
Local dividends are received net of dividend withholding tax. The withholding tax is recognised as a tax expense in thestatement of comprehensive income in the year it was incurred.
1.6 Leases
A lease is classified as a finance lease if it transfers substantially all the risks and rewards incidental to ownership to thelessee. All other leases are operating leases.
Operating leases - lessor
Operating lease income is recognised as an income on a straight-line basis over the lease term unless:���� another systematic basis is representative of the time pattern of the benefit from the leased asset, even if the receipt
of payments is not on that basis, or���� the payments are structured to increase in line with expected general inflation (based on published indexes or
statistics) to compensate for the lessor’s expected inflationary cost increases.
1.7 Impairment of assets - Non-financial assets
The trustees assesses at each reporting date whether there is any indication that property, plant and equipment may beimpaired.
12
Draft SAICA Illustrative TrustAnnual Financial Statements for the year ended 29 February 2016
Accounting Policies
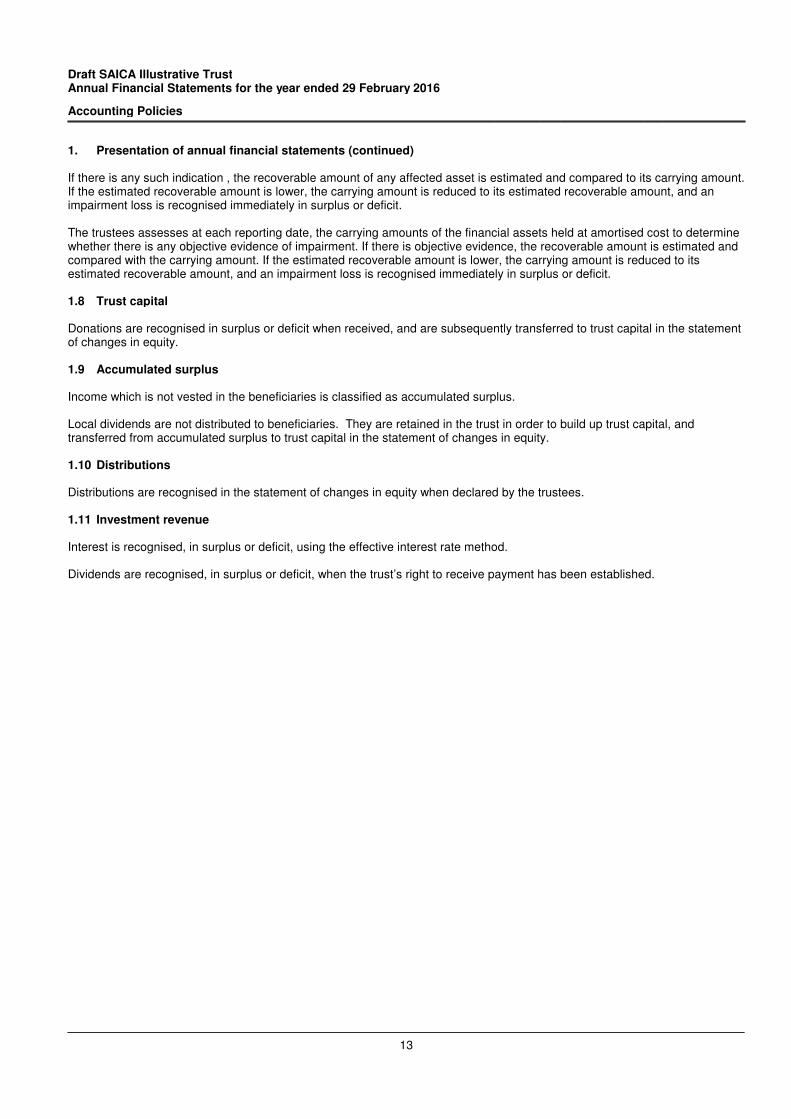
1. Presentation of annual financial statements (continued)
If there is any such indication , the recoverable amount of any affected asset is estimated and compared to its carrying amount.If the estimated recoverable amount is lower, the carrying amount is reduced to its estimated recoverable amount, and animpairment loss is recognised immediately in surplus or deficit.
The trustees assesses at each reporting date, the carrying amounts of the financial assets held at amortised cost to determinewhether there is any objective evidence of impairment. If there is objective evidence, the recoverable amount is estimated andcompared with the carrying amount. If the estimated recoverable amount is lower, the carrying amount is reduced to itsestimated recoverable amount, and an impairment loss is recognised immediately in surplus or deficit.
1.8 Trust capital
Donations are recognised in surplus or deficit when received, and are subsequently transferred to trust capital in the statementof changes in equity.
1.9 Accumulated surplus
Income which is not vested in the beneficiaries is classified as accumulated surplus.
Local dividends are not distributed to beneficiaries. They are retained in the trust in order to build up trust capital, andtransferred from accumulated surplus to trust capital in the statement of changes in equity.
1.10 Distributions
Distributions are recognised in the statement of changes in equity when declared by the trustees.
1.11 Investment revenue
Interest is recognised, in surplus or deficit, using the effective interest rate method.
Dividends are recognised, in surplus or deficit, when the trust’s right to receive payment has been established.
13
Draft SAICA Illustrative TrustAnnual Financial Statements for the year ended 29 February 2016
Notes to the Annual Financial Statements
Figures in Rand 2016 2015
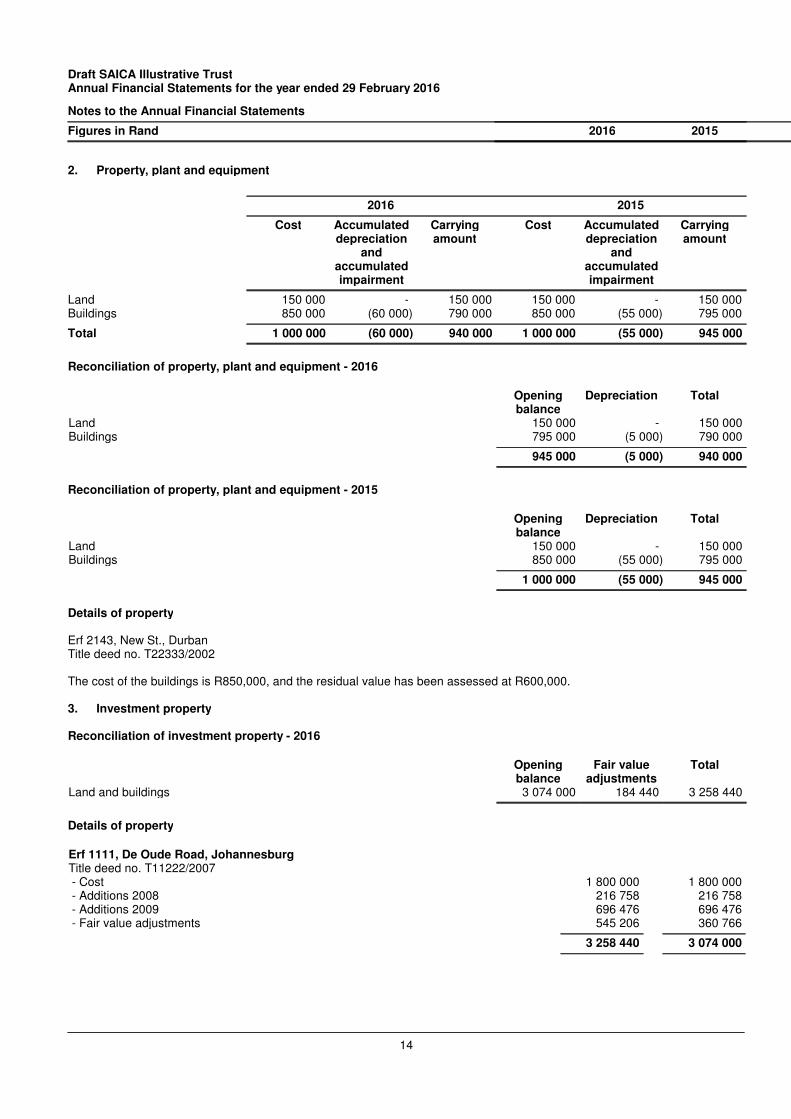
2. Property, plant and equipment
2016 2015
Cost Accumulateddepreciation
andaccumulatedimpairment
Carryingamount
Cost Accumulateddepreciation
andaccumulatedimpairment
Carryingamount
Land 150 000 - 150 000 150 000 - 150 000Buildings 850 000 (60 000) 790 000 850 000 (55 000) 795 000
Total 1 000 000 (60 000) 940 000 1 000 000 (55 000) 945 000
Reconciliation of property, plant and equipment - 2016
Openingbalance
Depreciation Total
Land 150 000 - 150 000Buildings 795 000 (5 000) 790 000
945 000 (5 000) 940 000
Reconciliation of property, plant and equipment - 2015
Openingbalance
Depreciation Total
Land 150 000 - 150 000Buildings 850 000 (55 000) 795 000
1 000 000 (55 000) 945 000
Details of property
Erf 2143, New St., DurbanTitle deed no. T22333/2002
The cost of the buildings is R850,000, and the residual value has been assessed at R600,000.
3. Investment property
Reconciliation of investment property - 2016
Openingbalance
Fair valueadjustments
Total
Land and buildings 3 074 000 184 440 3 258 440
Details of property
Erf 1111, De Oude Road, JohannesburgTitle deed no. T11222/2007 - Cost 1 800 000 1 800 000 - Additions 2008 216 758 216 758 - Additions 2009 696 476 696 476 - Fair value adjustments 545 206 360 766
3 258 440 3 074 000
14
Draft SAICA Illustrative TrustAnnual Financial Statements for the year ended 29 February 2016
Notes to the Annual Financial Statements
Figures in Rand 2016 2015
3. Investment property (continued)
Details of valuation
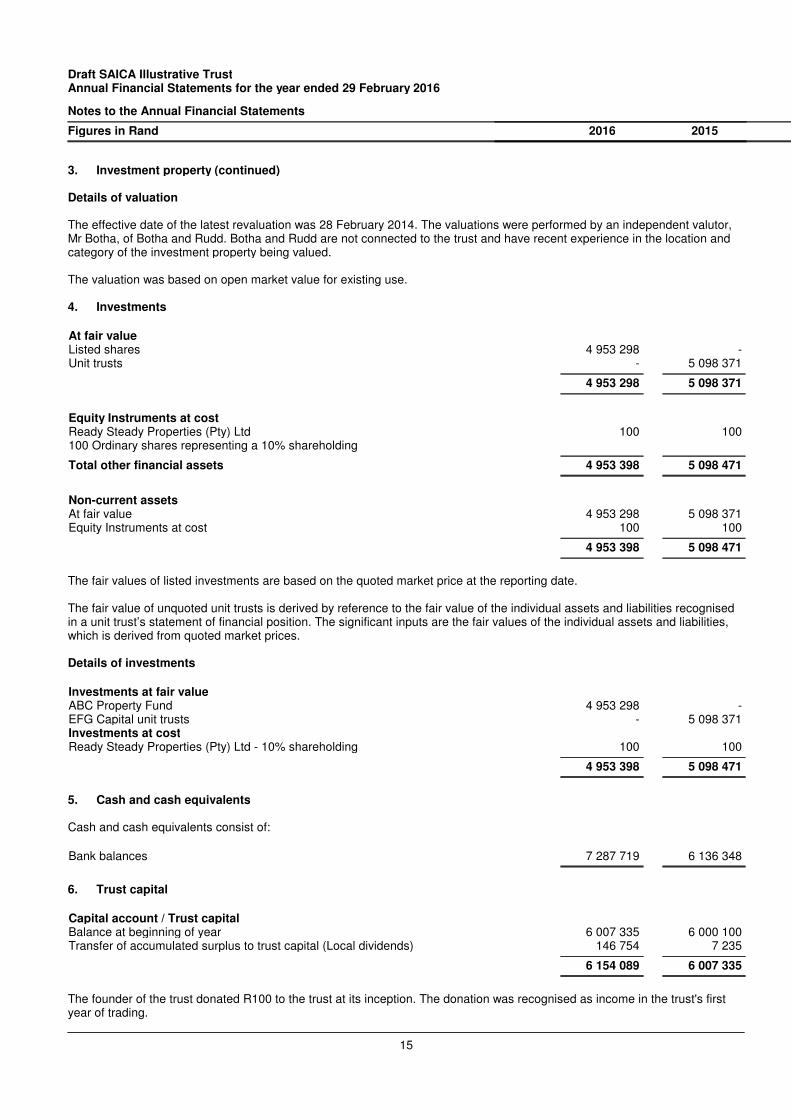
The effective date of the latest revaluation was 28 February 2014. The valuations were performed by an independent valutor,Mr Botha, of Botha and Rudd. Botha and Rudd are not connected to the trust and have recent experience in the location andcategory of the investment property being valued.
The valuation was based on open market value for existing use.
4. Investments
At fair valueListed shares 4 953 298 -Unit trusts - 5 098 371
4 953 298 5 098 371
Equity Instruments at costReady Steady Properties (Pty) Ltd100 Ordinary shares representing a 10% shareholding
100 100
Total other financial assets 4 953 398 5 098 471
Non-current assetsAt fair value 4 953 298 5 098 371Equity Instruments at cost 100 100
4 953 398 5 098 471
The fair values of listed investments are based on the quoted market price at the reporting date.
The fair value of unquoted unit trusts is derived by reference to the fair value of the individual assets and liabilities recognisedin a unit trust’s statement of financial position. The significant inputs are the fair values of the individual assets and liabilities,which is derived from quoted market prices.
Details of investments
Investments at fair valueABC Property Fund 4 953 298 -EFG Capital unit trusts - 5 098 371Investments at costReady Steady Properties (Pty) Ltd - 10% shareholding 100 100
4 953 398 5 098 471
5. Cash and cash equivalents
Cash and cash equivalents consist of:
Bank balances 7 287 719 6 136 348
6. Trust capital
Capital account / Trust capitalBalance at beginning of year 6 007 335 6 000 100Transfer of accumulated surplus to trust capital (Local dividends) 146 754 7 235
6 154 089 6 007 335
The founder of the trust donated R100 to the trust at its inception. The donation was recognised as income in the trust's firstyear of trading.
15

Draft SAICA Illustrative TrustAnnual Financial Statements for the year ended 29 February 2016
Notes to the Annual Financial Statements
Figures in Rand 2016 2015
6. Trust capital (continued)
The founder subsequently made a R6,000,000 cash injection in 2012, to build up trust capital and ensure liquidity of the trust.
Local dividends, net of withholding tax, are not distributed to the beneficiaries. They are retained in the trust in order to build uptrust capital, and are transferred from accumulated surplus to trust capital in the statement of changes in equity.
7. Loans from beneficiaries
GS Ready 892 020 800 080BV Steady 1 571 762 1 477 389
2 463 782 2 277 469
The above loans are interest free, and have no fixed repayment terms.
8. Other financial liabilities
Ready Steady Properties (Pty) LtdThe loan is interest free and has no fixed repayment terms.
419 500 528 180
Current liabilitiesAt amortised cost 419 500 528 180
9. Distributions payable
Distributions to beneficiaries 2 579 890 188 746
The above amounts were distributed at the discretion of the trustees to the beneficiaries at year end. The amounts will besettled within 6 months.
10. Revenue
Rental income 178 967 168 837
11. Investment revenue
Dividend revenueLocal 172 652 8 512Foreign 602 1 275
173 254 9 787
Interest revenueForeign 1 702 442Local 36 696 49 020
38 398 49 462
211 652 59 249
12. Fair value adjustments
Investment property (Fair value model) 184 440 174 000Investments 815 173 590 735
999 613 764 735
16
Draft SAICA Illustrative TrustAnnual Financial Statements for the year ended 29 February 2016
Notes to the Annual Financial Statements
Figures in Rand 2016 2015
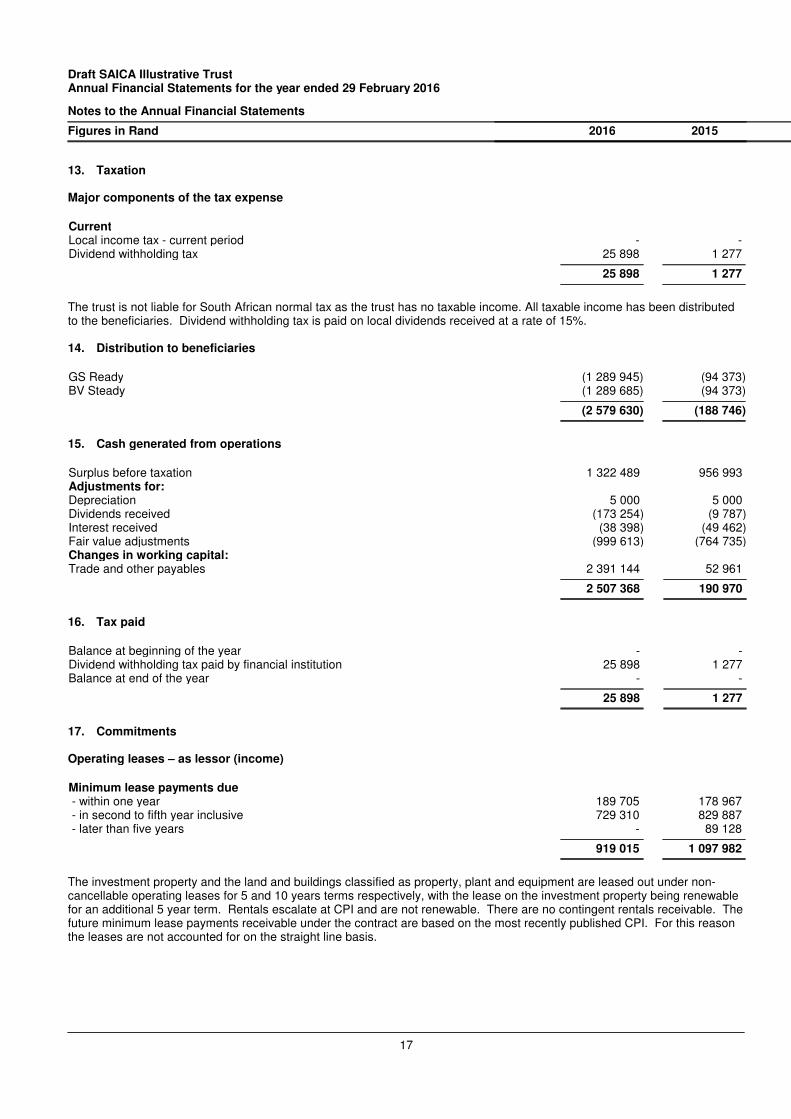
13. Taxation
Major components of the tax expense
CurrentLocal income tax - current period - -Dividend withholding tax 25 898 1 277
25 898 1 277
The trust is not liable for South African normal tax as the trust has no taxable income. All taxable income has been distributedto the beneficiaries. Dividend withholding tax is paid on local dividends received at a rate of 15%.
14. Distribution to beneficiaries
GS Ready (1 289 945) (94 373)BV Steady (1 289 685) (94 373)
(2 579 630) (188 746)
15. Cash generated from operations
Surplus before taxation 1 322 489 956 993Adjustments for:Depreciation 5 000 5 000Dividends received (173 254) (9 787)Interest received (38 398) (49 462)Fair value adjustments (999 613) (764 735)Changes in working capital:Trade and other payables 2 391 144 52 961
2 507 368 190 970
16. Tax paid
Balance at beginning of the year - -Dividend withholding tax paid by financial institution 25 898 1 277Balance at end of the year - -
25 898 1 277
17. Commitments
Operating leases – as lessor (income)
Minimum lease payments due - within one year 189 705 178 967 - in second to fifth year inclusive 729 310 829 887 - later than five years - 89 128
919 015 1 097 982
The investment property and the land and buildings classified as property, plant and equipment are leased out under non-cancellable operating leases for 5 and 10 years terms respectively, with the lease on the investment property being renewablefor an additional 5 year term. Rentals escalate at CPI and are not renewable. There are no contingent rentals receivable. Thefuture minimum lease payments receivable under the contract are based on the most recently published CPI. For this reasonthe leases are not accounted for on the straight line basis.
17
Draft SAICA Illustrative TrustAnnual Financial Statements for the year ended 29 February 2016
Notes to the Annual Financial Statements
Figures in Rand 2016 2015
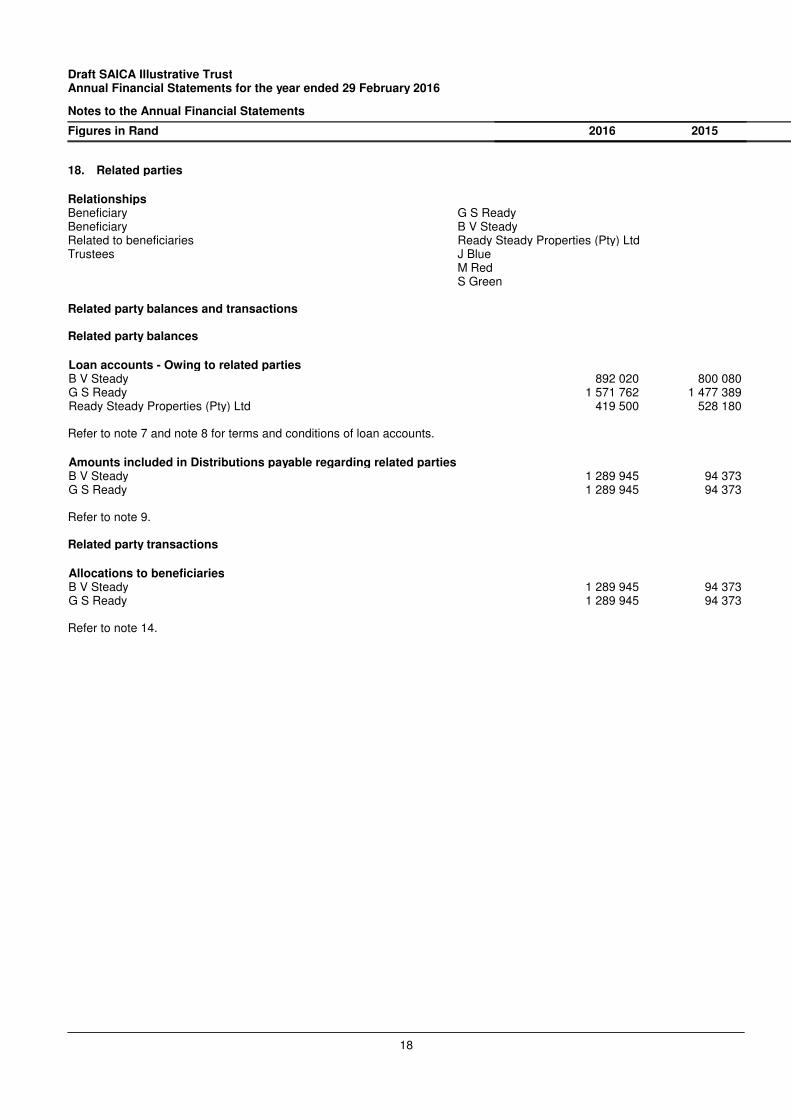
18. Related parties
`
RelationshipsBeneficiary G S ReadyBeneficiary B V SteadyRelated to beneficiaries Ready Steady Properties (Pty) LtdTrustees J Blue
M RedS Green
Related party balances and transactions
Related party balances
Loan accounts - Owing to related partiesB V Steady 892 020 800 080G S Ready 1 571 762 1 477 389Ready Steady Properties (Pty) Ltd 419 500 528 180
Refer to note 7 and note 8 for terms and conditions of loan accounts.
Amounts included in Distributions payable regarding related partiesB V Steady 1 289 945 94 373G S Ready 1 289 945 94 373
Refer to note 9.
Related party transactions
Allocations to beneficiariesB V Steady 1 289 945 94 373G S Ready 1 289 945 94 373
Refer to note 14.
18
Draft SAICA Illustrative TrustAnnual Financial Statements for the year ended 29 February 2016
Notes to the Annual Financial Statements
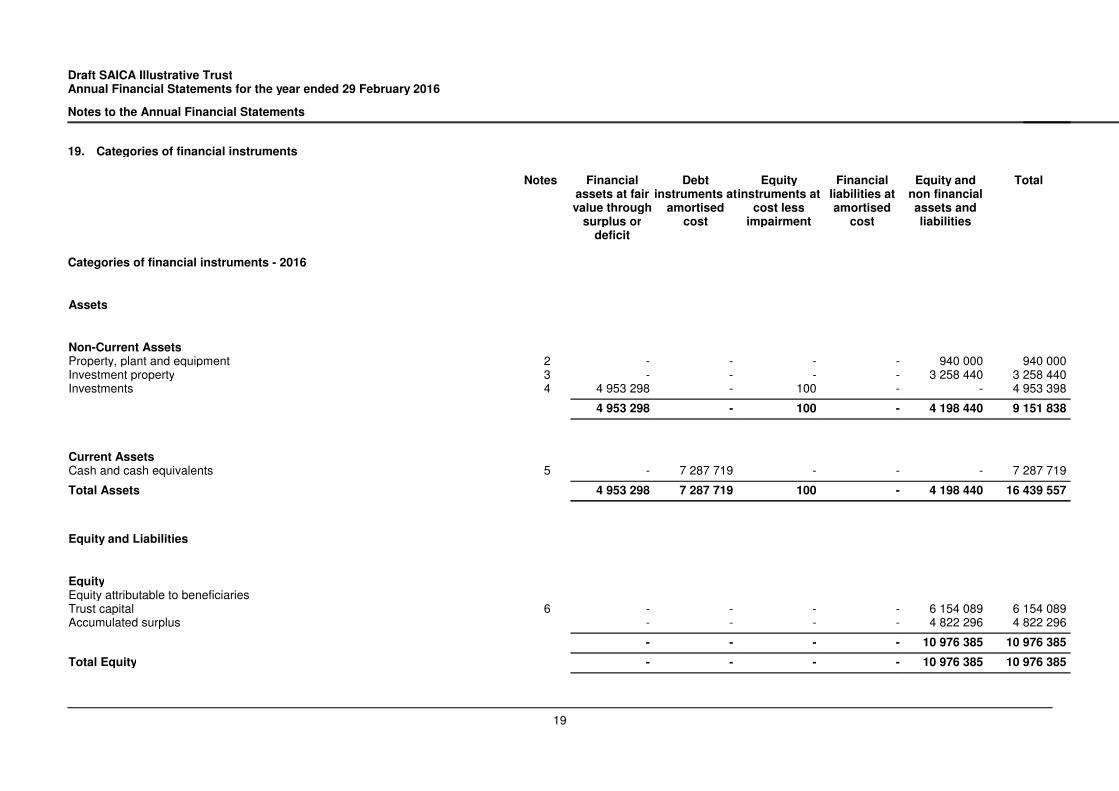
19. Categories of financial instruments
Notes Financialassets at fairvalue through
surplus ordeficit
Debtinstruments at
amortisedcost
Equityinstruments at
cost lessimpairment
Financialliabilities atamortised
cost
Equity andnon financialassets andliabilities
Total
Categories of financial instruments - 2016
Assets
Non-Current AssetsProperty, plant and equipment 2 - - - - 940 000 940 000Investment property 3 - - - - 3 258 440 3 258 440Investments 4 4 953 298 - 100 - - 4 953 398
4 953 298 - 100 - 4 198 440 9 151 838
Current AssetsCash and cash equivalents 5 - 7 287 719 - - - 7 287 719
Total Assets 4 953 298 7 287 719 100 - 4 198 440 16 439 557
Equity and Liabilities
EquityEquity attributable to beneficiariesTrust capital 6 - - - - 6 154 089 6 154 089Accumulated surplus - - - - 4 822 296 4 822 296
- - - - 10 976 385 10 976 385
Total Equity - - - - 10 976 385 10 976 385
19
Draft SAICA Illustrative TrustAnnual Financial Statements for the year ended 29 February 2016
Notes to the Annual Financial Statements
Note(s) Financialassets at fairvalue through
surplus ordeficit
Debtinstruments at
amortisedcost
Equityinstruments at
cost lessimpairment
Financialliabilities atamortised
cost
Equity andnon financialassets andliabilities
Total
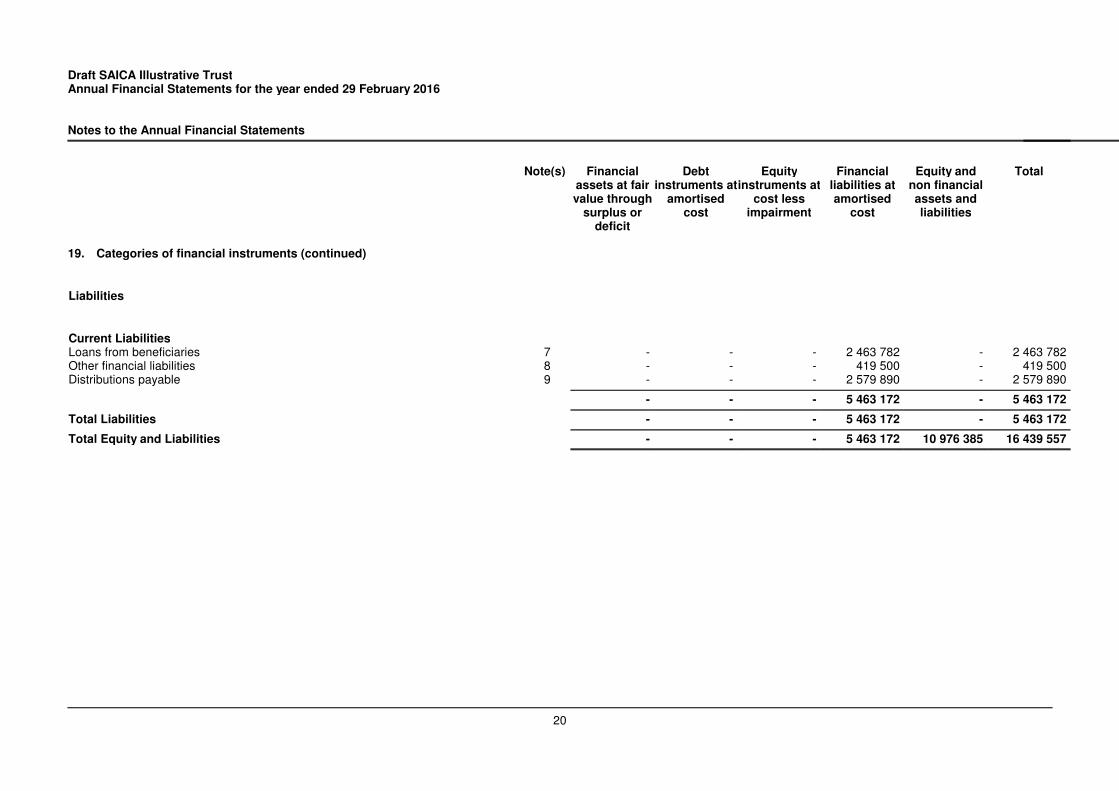
19. Categories of financial instruments (continued)
Liabilities
Current LiabilitiesLoans from beneficiaries 7 - - - 2 463 782 - 2 463 782Other financial liabilities 8 - - - 419 500 - 419 500Distributions payable 9 - - - 2 579 890 - 2 579 890
- - - 5 463 172 - 5 463 172
Total Liabilities - - - 5 463 172 - 5 463 172
Total Equity and Liabilities - - - 5 463 172 10 976 385 16 439 557
20
Draft SAICA Illustrative TrustAnnual Financial Statements for the year ended 29 February 2016
Notes to the Annual Financial Statements
Note(s) Financialassets at fairvalue through
surplus ordeficit
Debtinstruments at
amortisedcost
Equityinstruments at
cost lessimpairment
Financialliabilities atamortised
cost
Equity andnon financialassets andliabilities
Total
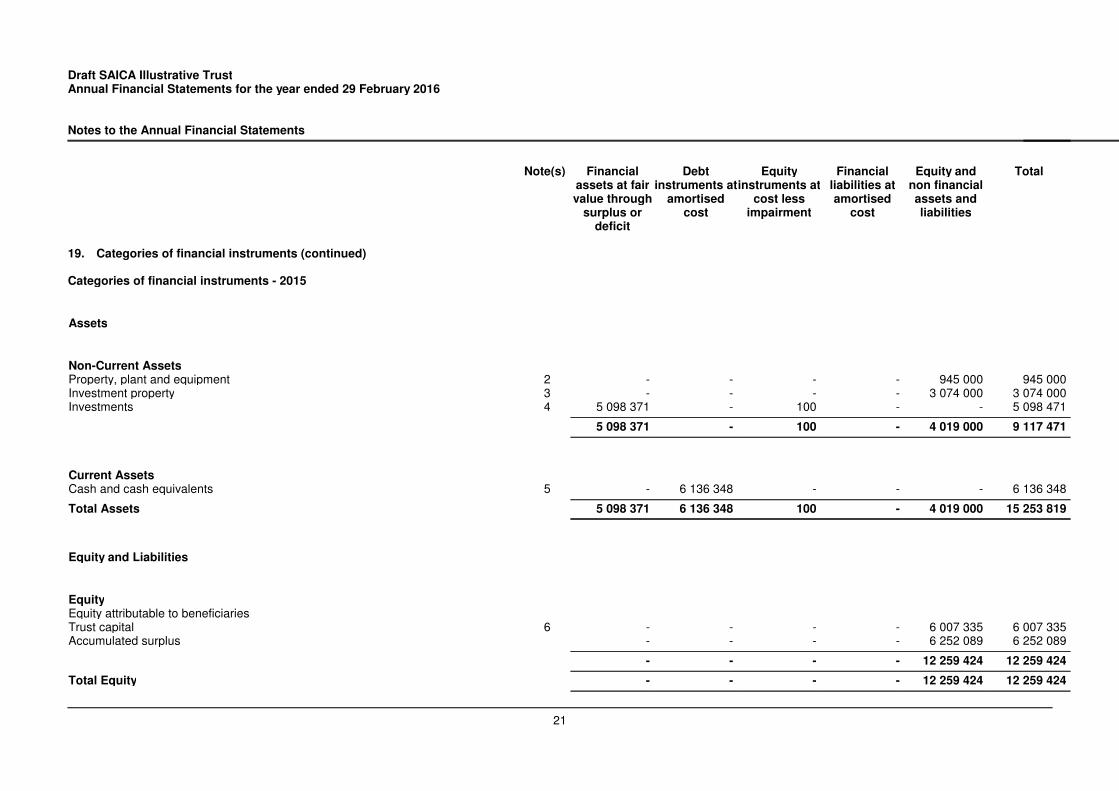
19. Categories of financial instruments (continued)
Categories of financial instruments - 2015
Assets
Non-Current AssetsProperty, plant and equipment 2 - - - - 945 000 945 000Investment property 3 - - - - 3 074 000 3 074 000Investments 4 5 098 371 - 100 - - 5 098 471
5 098 371 - 100 - 4 019 000 9 117 471
Current AssetsCash and cash equivalents 5 - 6 136 348 - - - 6 136 348
Total Assets 5 098 371 6 136 348 100 - 4 019 000 15 253 819
Equity and Liabilities
EquityEquity attributable to beneficiariesTrust capital 6 - - - - 6 007 335 6 007 335Accumulated surplus - - - - 6 252 089 6 252 089
- - - - 12 259 424 12 259 424
Total Equity - - - - 12 259 424 12 259 424
21

Draft SAICA Illustrative TrustAnnual Financial Statements for the year ended 29 February 2016
Notes to the Annual Financial Statements
Note(s) Financialassets at fairvalue through
surplus ordeficit
Debtinstruments at
amortisedcost
Equityinstruments at
cost lessimpairment
Financialliabilities atamortised
cost
Equity andnon financialassets andliabilities
Total
19. Categories of financial instruments (continued)
Liabilities
Current LiabilitiesLoans from beneficiaries 7 - - - 2 277 469 - 2 277 469Other financial liabilities 8 - - - 528 180 - 528 180Distributions payable 9 - - - 188 746 - 188 746
- - - 2 994 395 - 2 994 395
Total Liabilities - - - 2 994 395 - 2 994 395
Total Equity and Liabilities - - - 2 994 395 12 259 424 15 253 819
22

Draft SAICA Illustrative TrustAnnual Financial Statements for the year ended 29 February 2016
Appendix A
Distribution Schedule
Rental Investment Total
2014 Rentalincome
Dividends -local
Foreigninterest
Foreigndividends
Interestincome
Fair valueadjustments
anddepreciation
Profit on saleof
investments
Totalinvestment
income
Total income
Income per income statement 178 967 172 652 1 702 602 36 696 994 613 - 1 206 265 1 385 232Less: Amounts retained within the trust - (172 652) - - - - - (172 652) [3] (172 652)Less: Fair value adjustments - - - - - (999 613) - (999 613) (999 613)Add: Depreciation - - - - - 5 000 - 5 000 5 000Add: Profit on sale of investments - - - - - - 2 424 666 2 424 666 2 424 666
Adjusted income 178 967 - 1 702 602 36 696 - 2 424 666 2 463 666 2 642 633
Accounting fees 1 826 - 17 7 375 - 24 735 25 134 [1] 26 960Administration and management fees - - 9 3 197 - 13 021 13 230 [2] 13 230Electricity 17 115 - - - - - - - [4] 17 115Insurance 2 532 - - - - - - - [4] 2 532Repairs and maintenance 2 904 - - - - - - - [4] 2 904
Direct expenses 24 377 - 26 10 572 - 37 756 38 364 62 741
154 590 - 1 676 592 36 124 - 2 386 910 2 425 302 2 579 892
Distribution to Beneficiary:B V Steady 77 295 - 838 296 18 062 - 1 193 455 1 212 651 1 289 946G S Ready 77 295 - 838 296 18 062 - 1 193 455 1 212 651 1 289 946
Income distributed to beneficiaries 154 590 - 1 676 592 36 124 - 2 386 910 2 425 302 2 579 892
Dividend withholding tax in the statement of comprehensive income amounts to local dividends received x 15%. Dividends of R(172 652) x 15% = taxation of R(25 898).Notes:[1] Accounting fees are allocated to all types of income on a proportionate basis.[2] Administration and management fees are allocated to investment income only, as they are paid to the administrator of the investments.[3] Local dividends are not distributed to the beneficiaries. Dividend withholding tax is paid on local dividends received at a rate of 15%. There are no further tax consequences on eitherretaining these dividends in the trust or on declaring them as distributions to the beneficiaries, and, in order to build capital up in the trust, they are retained in the trust.[4] Property expenses are allocated to rental inome only.
23
Draft SAICA Illustrative TrustAnnual Financial Statements for the year ended 29 February 2016
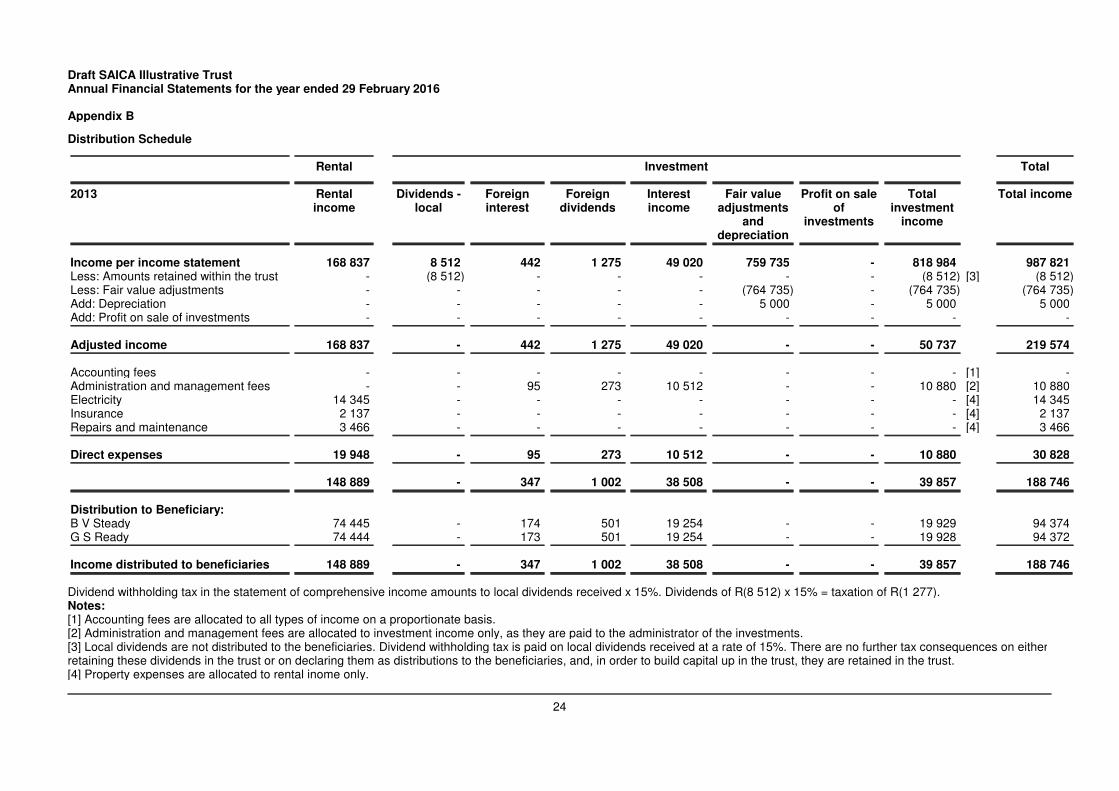
Appendix B
Distribution Schedule
Rental Investment Total
2013 Rentalincome
Dividends -local
Foreigninterest
Foreigndividends
Interestincome
Fair valueadjustments
anddepreciation
Profit on saleof
investments
Totalinvestment
income
Total income
Income per income statement 168 837 8 512 442 1 275 49 020 759 735 - 818 984 987 821Less: Amounts retained within the trust - (8 512) - - - - - (8 512) [3] (8 512)Less: Fair value adjustments - - - - - (764 735) - (764 735) (764 735)Add: Depreciation - - - - - 5 000 - 5 000 5 000Add: Profit on sale of investments - - - - - - - - -
Adjusted income 168 837 - 442 1 275 49 020 - - 50 737 219 574
Accounting fees - - - - - - - - [1] -Administration and management fees - - 95 273 10 512 - - 10 880 [2] 10 880Electricity 14 345 - - - - - - - [4] 14 345Insurance 2 137 - - - - - - - [4] 2 137Repairs and maintenance 3 466 - - - - - - - [4] 3 466
Direct expenses 19 948 - 95 273 10 512 - - 10 880 30 828
148 889 - 347 1 002 38 508 - - 39 857 188 746
Distribution to Beneficiary:B V Steady 74 445 - 174 501 19 254 - - 19 929 94 374G S Ready 74 444 - 173 501 19 254 - - 19 928 94 372
Income distributed to beneficiaries 148 889 - 347 1 002 38 508 - - 39 857 188 746
Dividend withholding tax in the statement of comprehensive income amounts to local dividends received x 15%. Dividends of R(8 512) x 15% = taxation of R(1 277).Notes:[1] Accounting fees are allocated to all types of income on a proportionate basis.[2] Administration and management fees are allocated to investment income only, as they are paid to the administrator of the investments.[3] Local dividends are not distributed to the beneficiaries. Dividend withholding tax is paid on local dividends received at a rate of 15%. There are no further tax consequences on eitherretaining these dividends in the trust or on declaring them as distributions to the beneficiaries, and, in order to build capital up in the trust, they are retained in the trust.[4] Property expenses are allocated to rental inome only.
24