Terminology Framework preliminary draft (presentation to be revised)

Draft – Subject to revision
1
Statistical Commission Background document Forty-third session Available in English only 28 February – 2 March 2012 Item 3 (f) of the provisional agenda Environment Statistics
DRAFT Revised Framework for the
Development of Environment Statistics (FDES)
Prepared by the United Nations Statistics Division
Draft as of 10 February 2012 – Subject to Revision
Draft – Subject to revision
2
Table of Contents Table of Contents ................................................................................................................... 2 List of Figures......................................................................................................................... 5 Acronyms ................................................................................................................................ 6 References ............................................................................................................................... 7 Introduction............................................................................................................................ 8 Chapter 1: Overview of Environment Statistics ....................................................10
1.1 Objectives of environment statistics ...................................................................... 10 1.2 The scope of environment statistics....................................................................... 10 1.3 Main uses and user groups of environment statistics............................................. 10 1.4 Types of information and statistics about the environment ................................... 11 1.5 Sources of environment statistics........................................................................... 12 1.6 Spatial and temporal considerations ...................................................................... 13 1.7 Classifications, categories and other groupings relevant to environment
statistics............................................................................................................... 15 1.8 Institutional dimension of environment statistics .................................................. 16 1.9 Relation of environment statistics to social and economic statistics ..................... 17
Chapter 2: Framework for the Development of Environment Statistics.............18 2.1 Purposes and main characteristics of the FDES .................................................... 18 2.2 Conceptual foundation of the FDES...................................................................... 19 2.3 From the conceptual foundation to the FDES structure......................................... 21 2.4 The FDES and its Approach to Ecosystems and Natural Capital.......................... 22 2.5 Relationship of the FDES to other systems and frameworks ................................ 24
Chapter 3: The Structure and Components of the FDES .....................................29 3.1 Levels of aggregations and organization of contents............................................. 30 3.2 Components and sub-components of the FDES .................................................... 31 3.3 Main attributes of the components of the FDES.................................................... 32 3.4 Component 1: Environmental Conditions and Processes ............................... 34
Sub-component 1.1: Physical Conditions ........................................................... 35 Topic 1.1.1: Atmosphere, climate and weather ......................................... 35 Topic 1.1.2: Hydrological systems............................................................. 36 Topic 1.1.3: Geological and geographic information ............................... 36 Topic 1.1.4: Land cover ............................................................................. 36
Sub-component 1.2: Biodiversity and Ecosystems............................................. 37 Topic 1.2.1: Biodiversity............................................................................ 38 Topic 1.2.2: Ecosystems............................................................................. 39
Sub-component 1.3: Environmental Quality ...................................................... 40 Topic 1.3.1: Air quality.............................................................................. 41 Topic 1.3.2: Freshwater quality................................................................. 42 Topic 1.3.3: Marine water quality ............................................................. 43 Topic 1.3.4: Soil quality............................................................................. 44 Topic 1.3.5: Noise ...................................................................................... 45
3.5 Component 2: Environmental Assets and their Use......................................... 46 Sub-component 2.1: Mineral and Energy Resources.......................................... 47
Topic 2.1.1: Stocks of mineral and energy resources................................ 47 Topic 2.1.2: Extraction and use of mineral and energy resources............ 47

Draft – Subject to revision
3
Sub-component 2.2: Land and Land Use............................................................ 48 Topic 2.2.1: Land area, land use and land cover ...................................... 48 Topic 2.2.2: Changes in land use and land cover...................................... 49 Topic 2.2.3: A particular type of land: Forest and other wooded land..... 49
Sub-component 2.3: Soil Resources ................................................................... 50 Topic 2.3.1: Area and change of area of soil resources............................ 51 Topic 2.3.2: Volume and change of volume of soil resources ................... 51 Topic 2.3.2: Soil resources as biological systems ..................................... 51
Sub-component 2.4: Biological Resources ......................................................... 51 Topic 2.4.1: Timber resources and their use ............................................. 52 Topic 2.4.2: Aquatic resources and their use ............................................ 52 Topic 2.4.3: Other biological resources and their use .............................. 53
Sub-component 2.5: Water Resources and their Use.......................................... 53 Topic 2.5.1: Water resources..................................................................... 53 Topic 2.5.2: Abstraction and use of waters ............................................... 54 Topic 2.5.3: Returns of water .................................................................... 54
3.6 Component 3: Emissions, Residuals and Waste................................................ 54 Sub-component 3.1: Emissions to Air ................................................................ 55
Topic 3.1.1: Emissions to air ..................................................................... 55 Sub-component 3.2: Generation, Management and Discharge of
Wastewater, and Emissions to Water.............................. 56 Topic 3.2.1: Generation of wastewater...................................................... 56 Topic 3.2.2: Collection and treatment of wastewater................................ 56 Topic 3.2.3: Discharge of wastewater to the environment ........................ 57 Topic 3.2.4: Emissions to water................................................................. 57
Sub-component 3.3: Generation, Management and Disposal of Solid Waste ... 57 Topic 3.3.1: Generation of solid waste...................................................... 57 Topic 3.3.2: Management of solid waste ................................................... 58
3.7 Component 4: Environmental Impact ............................................................... 58 Sub-component 4.1: Natural Disasters and Extreme Events .............................. 58
Topic 4.1.1: Occurrence of natural disasters and extreme events ............ 60 Topic 4.1.2: Impact of natural disasters and extreme events .................... 61
Sub-component 4.2 Impacts on Human Health and Well-being ........................ 61 Topic 4.2.1: Airborne diseases and conditions.......................................... 62 Topic 4.2.2: Water related diseases........................................................... 62 Topic 4.2.3: Vector borne diseases............................................................ 63 Topic 4.2.4: Health problems associated with excessive ultraviolet
(UV) radiation exposure .................................................... 63 Topic 4.2.5: Toxic substance related diseases and conditions .................. 63
3.8 Component 5: Environment Protection and Management.............................. 64 Sub-component 5.1 : Environment Protection and Management Expenditure... 65
Topic 5.1.1: Government environment protection and management expenditure......................................................................... 66
Topic 5.1.2: Corporate, non-profit institution and household environment protection and management expenditure...... 66
Sub-component 5.2: Environmental Governance, Regulation and Engagement..................................................................... 66
Topic 5.2.1: Institutional strength ............................................................. 67

Draft – Subject to revision
4
Topic 5.2.2: Environmental regulation and instruments ........................... 67 Topic 5.2.3: Participation in MEAs and environmental conventions........ 68
Sub-component 5.3: Environmental Information, Education and Perception .... 68 Topic 5.3.1: Environmental information ................................................... 68 Topic 5.3.2: Environmental education and awareness.............................. 69 Topic 5.3.2: Environmental perception ..................................................... 69
Chapter 4: The Core Set of Environment Statistics ..............................................71 4.1 What is the Core Set of Environment Statistics..................................................... 71 4.2 The need for the Core Set of Environment Statistics............................................. 72 4.3 Objective of the Core Set of Environment Statistics ............................................. 72 4.4 The process of development of the Core Set ......................................................... 74 4.5 Key conceptual considerations .............................................................................. 76 4.6 Further work towards the implementation of the Core Set.................................... 77 4.7 The Core Set of Environment Statistics............................................................. 77
Component 1: Environmental Conditions and Processes ...........................78-83 Sub-component 1.1: Physical Conditions ......................................................78-80 Sub-component 1.2: Biodiversity and Ecosystems............................................. 81 Sub-component 1.3: Environmental Quality .................................................82-83
Component 2: Environmental Assets and their Use....................................84-88 Sub-component 2.1: Mineral and Energy Resources.......................................... 84 Sub-component 2.2: Land and Land Use............................................................ 85 Sub-component 2.3: Soil Resources ................................................................... 86 Sub-component 2.4: Biological Resources ......................................................... 87 Sub-component 2.5: Water Resources and their Use.......................................... 88
Component 3: Emissions, Residuals and Waste...........................................89-91 Sub-component 3.1: Emissions to Air ................................................................ 89 Sub-component 3.2: Generation, Management and Discharge of
Wastewater, and Emissions to Water.............................. 90 Sub-component 3.3: Generation, Management and Disposal of Solid Waste.... 91
Component 4: Environmental Impact ..........................................................92-93 Sub-component 4.1: Natural Disasters and Extreme Events .............................. 92 Sub-component 4.2: Impacts on Human Health and Well-being ....................... 93
Component 5: Environment Protection and Management.........................94-96 Sub-component 5.1: Environment Protection and Management Expenditure.... 94 Sub-component 5.2: Environmental Governance, Regulation and
Engagement..................................................................... 95 Sub-component 5.3: Environmental Information, Education and Perception .... 96
Draft – Subject to revision
5
Figures Figure 2.1: The environment, the human sub-system, and interactions between them....................... 19 Figure 2.2: Environmental conditions and their changes.................................................................... 20 Figure 2.3: The five components of the FDES .................................................................................... 22 Figure 2.4: Relationship of the FDES to other frameworks, systems and selected indicator sets....... 24 Figure 2.5: The FDES and the SEEA .................................................................................................. 26 Figure 2.6: DPSIR model..................................................................................................................... 28 Figure 3.1: The five components of the FDES .................................................................................... 29
Tables
Table 3.1: Aggregation levels of the FDES......................................................................................... 30 Table 3.2: Main attributes of the FDES components........................................................................... 33

Draft – Subject to revision
6
Acronyms CEA: Classification of Environmental Activities CEPA: Classification of Environmental Protection Activities CES: Conference of European Statisticians CPC: Central Product Classification CRED EM-DAT: Centre for Research on the Epidemiology of Disasters Emergency
Disasters Database CReMA: Classification of Resource Management Activities DDT: Dichlorodiphenyltrichloroethane DPSIR: Driving forces-Pressure-State-Impact-Response Model ECE: Statistical Division of the Economic Commission for Europe EEA: European Environment Agency EEZ: Exclusive Economic Zone EGM: Expert Group Meeting FAO: Food and Agriculture Organization of the United Nations FDES: Framework for the Development of Environment Statistics GHG: Greenhouse Gases IISD: International Institute for Sustainable Development IPCC: Inter-governmental Panel on Climate Change IRWS: International Recommendations for Water Statistics ISIC: International Standard Industrial Classification of all Economic
Activities IUCN: International Union for Conservation of Nature MDG: Millennium Development Goal MEA: Multilateral Environmental Agreement NSO: National Statistical Office ODS: Ozone Depleting Substances OECD: Organization for Economic Co-operation and Development PCB: Polychlorinated Biphenyl PM: Particulate Matter SDI: UN Commission for Sustainable Development’s Sustainable
Development Indicators SEEA: System of Environmental-Economic Accounting SIDS: Small Island Developing States SNA: System of National Accounts SPM: Suspended Particulate Matter UNEP-WCMC: United Nations Environment Programme – World Conservation
Monitoring Centre UNSD: United Nations Statistics Division UV: Ultraviolet WHO: World Health Organization

Draft – Subject to revision
7
References CRED EM-DAT, 2009. Emergency Events Database. http://www.emdat.be/ FAO, 2005. Land Cover Classification System. http://www.fao.org/docrep/008/y7220e/y7220e00.htm FAO, 2011. FAOSTAT Glossary. http://faostat.fao.org/site/375/default.aspx Heinz Center, 2008. The State of the Nation’s Ecosystems. http://www.heinzctr.org/ecosystems/ IISD, 2008. The Natural Capital Approach: A Concept Paper. www.iisd.org/pdf/2008/natural_capital_approach.pdf Millennium Ecosystem Assessment, 2003. Ecosystems and Human Well-being: A Framework for Assessment. http://www.maweb.org/documents/document.769.aspx.pdf Millennium Ecosystem Assessment, 2005. Ecosystems and Human Well-being: Synthesis. http://www.maweb.org/documents/document.356.aspx.pdf
National Council for Science and the Environment, Environmental Information Coalition, 2007. National Capital (Costanza, R) in Encyclopedia of Earth, Eds. Cutler J. Cleveland, Washington, DC. United Nations, 1984. Framework for the Development of Environment Statistics. http://unstats.un.org/unsd/publication/SeriesM/SeriesM_78e.pdf United Nations, 2010. International Recommendations for Water Statistics. http://unstats.un.org/unsd/envaccounting/irws/irwswebversion.pdf United Nations, 2012. Revision of the System of Environmental-Economic Accounting. http://unstats.un.org/unsd/statcom/doc12/SEEA%20Central%20Framework_Ch1-6.pdf WHO, 2004. Water Sanitation and Health, Burden of Disease and Cost-Effectiveness Estimates. http://www.who.int/water_sanitation_health/diseases/burden/en/index.html WHO, 2009. 10 facts on climate change and health. http://www.who.int/features/factfiles/climate_change/en/index.html WHO, 2009. Ultraviolet radiation and human health. http://www.who.int/mediacentre/factsheets/fs305/en/ WHO, 2010. 10 facts on preventing disease through healthy environments. http://www.who.int/features/factfiles/environmental_health/en/

Draft – Subject to revision
8
Introduction 1.1. Though still relatively new, the demand for environment statistics is increasing in
step with the challenges of managing the environment. Climate change, biodiversity loss and the demand for natural resources are among a growing list of environmental issues about which decisions must be taken. Given the need for governments, businesses and households to deal effectively with these issues, the national statistics informing them must be of the highest quality possible.
1.2. While many factors contribute to the quality of national statistics, one stands out as
particularly important in the context of environment statistics. This is the availability of a clear framework to guide their collection. A clear framework should: (i) suitably simplify the complexity of the environment so as to render its measurement tractable; (ii) help identify the range of statistics relevant to societal decision making regarding the environment; (iii) be coherent to the fullest extent possible with frameworks for national statistics already used in other domains; and (iv) be conceptually based.
1.3. The Framework for the Development of Environment Statistics (FDES) was first
published in 1984 by the United Nations Statistics Division (UNSD) and has been a useful framework for guiding countries in the development and evaluation of the environment statistics programmes in their countries. During the time since its publication there have been a number of political, technological, statistical and experience-based developments which have suggested that the FDES was ready for revision.
1.4. As a consequence, the United Nations Statistical Commission, at its 41st Session (23-
26 February 2010), endorsed a work programme and the establishment of an Expert Group for the revision of the FDES.
1.5. The following, sometimes divergent, criteria were developed in consultation with the
Expert Group to help in the revision process. The revised FDES needs to: i. Be adaptable, applicable, easy to understand and follow, and flexible enough to
accommodate the priorities and capacities of countries in different stages of statistical development and environmental endowment;
ii. Clearly align with the objective of environment statistics – which is to provide quality statistical information for policy and decision making about the state of the environment and changes to this state, and its links with human wellbeing, and economic and social development;

Draft – Subject to revision
9
iii. Help organize the main components of environment statistics; iv. Clearly identify the scope and dimensions of environment statistics by describing
the components, sub-components and statistical topics; v. Provide a basis for definitions and classifications through a well defined structure;
vi. Be coherent with other internationally agreed frameworks and accounting systems as appropriate;
vii. Help identify data gaps and a core set of environment statistics; viii. Facilitate the identification of roles and responsibilities of various actors and
institutions related to the regular production of environment statistics; ix. Be scientifically based, up-to-date and reflecting the current state of the art with
regard to the policy and statistical developments over the past three decades; and x. Guide countries at an early stage of development of environment statistics.
1.6. The result of the revision is presented in the following chapters. First, an overview of
environment statistics is provided in Chapter 1. In Chapter 2, the main description of the FDES including a discussion of the conceptual foundation for the framework and its five components is presented. Chapter 3 provides an expanded discussion of the components of the FDES and Chapter 4 describes the Core Set of Environment Statistics.

Draft – Subject to revision
10
Chapter 1: Overview of Environment Statistics <To include intro paragraph on purpose and structure of chapter> 1.1 Objectives of environment statistics
1.7. The objective of environment statistics is to provide information about the
environment and its most important changes over time and space. Environment statistics are indispensable for evidence-based policy and decision making and for providing information for the general public, as well as for specific user groups. Ultimately, environment statistics aim at providing high quality statistical information to improve knowledge of the world and to support policy and decision making
1.2 The scope of environment statistics 1.8. The scope of environment statistics covers biophysical aspects of the environment
and those aspects of the human sub-system that directly influence the state and quality of the environment. Environment statistics quantitatively and qualitatively describe the state of the environment and the interactions among the environment, human activities, and natural events.
1.9. Environment statistics capture the state and quality of the environment in terms of
natural conditions, the existence of and use of environmental resources, the emissions, residuals and waste returned by humans to the environment, as well as impacts of the changing conditions on the human sub-system, and the human activities of environment protection and management, and environmental engagement.
1.3 Main uses and user groups of environment statistics 1.10. The most common uses of environment statistics include the following; each of these
products require environment statistics data sets that are further processed, described and ultimately published and disseminated:
i. Databases, compendia and yearbooks ii. Indicators
iii. State of the Environment reports iv. Reports to Multilateral Environmental Agreements (MEAs) and conventions v. The System of Environmental-Economic Accounting (SEEA)
1.11. Environment statistics serve a variety of users, including but not restricted to:
i. The general public, including media and civil society

Draft – Subject to revision
11
ii. Decision and policy makers iii. Analysts, experts and advisors iv. Academia v. Government officials and international agencies
1.12. Different users need environment statistics series with different levels of aggregation
and disaggregation, and with specific depths of information and description. Users may also be in need of cross-cutting environment statistics datasets, and in other cases they may only be interested in particular topics and themes pertaining to environment statistics for specific sectoral analysis and policy making.
1.13. For example, decision makers and the general public would tend to use environmental
indicators, whereas researchers, analysts, experts and advisors could be inclined to look at more extensive and detailed basic environment statistics.
1.4 Types of information and statistics about the environment <Further clarification of concepts in this section to be provided> 1.14. Environmental information is a very general term that can include both quantitative
and qualitative information as well as resulting products. 1.15. Qualitative environmental information is usually included as part of environmental
information systems. Qualitative environmental information is inherently more descriptive in characterizing environment phenomena and leads to the development of products such as reports which would contain both a descriptive narrative and also limited numeric information that forms part of the description. For example, when describing the health of an ecosystem, a report will typically use broad qualitative characterizations of overall health complemented by specific statistics. Qualitative environmental information can be found in assessment reports, monitoring reports and ad hoc research papers, articles and briefs.
1.16. Quantitative environmental information includes basic environmental data and
statistics, environmental indicators, and environmental accounting. 1.17. Environment statistics, also referred to as basic environment statistics, are usually
voluminous sets of data describing the state and trends of the environment and their main components. This typically includes the human sub-system as it interrelates to ecosystems as a whole. Usually environment statistics series are produced for countries, regions and the world, and disseminated through compendia and databases. Because of
Draft – Subject to revision
12
their sheer size, the general public as well as decision makers often require further processing of environment statistics to satisfy their analytical and decision-making needs.
1.18. Environmental indicators are a particular type of statistics, requiring a careful
selection of statistical inputs in order to calculate ratios, composite or more complex measures which depict key aspects or processes of the environment. Indicator sets are typically produced regularly to monitor policy goals and targets and to enable continued oversight of progress towards sought objectives.
1.19. Environmental accounting refers to the production of integrated statistics that are
assembled according to certain accounting principles and within particular system boundaries. The SEEA is an accounting system that is based on the System of National Accounts (SNA). The SEEA Central Framework largely focuses on the interface between the economy and the environment.
1.20. These three types of quantitative environmental information: statistics, indicators and
accounts, are all important and are interdependent. They all feed back into each other to produce diverse and complementary products that can be used for different purposes and that fit specific user needs and resources of countries or agencies. Ideally, the three types of quantitative environmental information can be produced and used as a whole, integrated system for increased synergy and consistency, as well as better use of limited resources.
1.5 Sources of environment statistics 1.21. Environment statistics are compiled, stored and disseminated by national statistical
offices (NSOs), government departments, research institutes, local authorities, as well as regional and international organizations. They are collected from sources which include censuses, surveys, and administrative records. Data sources specific to the field of environment statistics include remote sensing, monitoring stations, modelling and estimation, and scientific research. Such data are typically dispersed over numerous agencies, departments or institutes, requiring considerable effort to attain compatibility and accuracy. The collection and compilation process from sources specific to environment statistics differs considerably from the survey techniques employed in social and economic statistics.
1.22. The development of sources in the environment statistics domain has progressed
substantially in the last several decades, although the field is still at a somewhat early stage of statistical development. Environment statistics are now accounting for very

Draft – Subject to revision
13
complex, multi-source characteristics which require new technologies and procedures that are not traditional to national statistical systems or institutes.
1.23. The following are the principal sources of environment statistics: <Details on
sources to be provided> i. Administrative records (of government agencies in charge of natural resources
and other ministries); ii. Statistical censuses (of population, housing, agriculture, livestock, businesses);
iii. Statistical surveys (of households, employment, and different aspects of environment management);
iv. Projects and special studies undertaken to fulfil domestic or international demand; v. Monitoring systems (of water quality, air pollution, climate, soils, and so on);
vi. Remote sensing (e.g., satellite imaging of land use, water bodies and forest cover);
vii. Estimates and modelling (e.g., creating different models for estimation, and using methods such as regression, extrapolation and interpolation); and
viii. Scientific research (e.g., glacier retraction, global CO2 concentration).
1.6 Spatial and temporal considerations 1.24. Environment statistics require the simultaneous consideration of a number of spatial
and temporal issues.
1.6.1 Spatial considerations 1.25. The occurrence and impacts of environmental phenomena are distributed through
space without regard for political-administrative boundaries. For example, some aquifers, rivers, ecosystems, and most certainly oceans, are shared by different regions and countries.
1.26. National statistical systems are usually organized using administrative boundaries.
This difference can complicate the collection and analysis of environment statistics especially when there is a need to combine them with social and economic statistics. There is a trend towards producing more geo-referenced data within the fields of economic and social statistics but the concern about data confidentiality is often a substantial stumbling block. Methods are being developed that allow for more geospatial information to be published which may enable better integration of information in the future.

Draft – Subject to revision
14
1.27. Some environment statistics fluctuate considerably depending on their geographic location. Different geographic locations can be associated with different climatic and ecosystem conditions and anthropogenic pressures. Consequently location-specific information can often times be more useful than national aggregates or averages. To cite an example of such a case, the maximum level of a pollutant at a specific geographic location may exceed maximum authorized values even when the national average pollution indicators remain at low levels. The combination of statistics referring to natural and administrative boundaries is powerful for identifying those responsible for environmental pressures. These types of considerations are important in the development of the statistics to be compiled and presented.
<Description of geographic information systems and their use in environment statistics will be developed>
1.6.2 Temporal considerations 1.28. Time is another important determinant factor in environment statistics. A uniform
calendar or fiscal year does not fit the diversity of natural phenomena – longer or shorter time periods can be much more appropriate.
1.29. With respect to periodicity, certain features of natural growth of biomass – for
example, in a natural, slow growing forest that is not subject to logging – do not justify or require assiduous monitoring of their status, since the most relevant changes can be observed on an annual or even less frequent basis. Other environmental processes, however, change so quickly that measurements are needed hourly or even more frequently. One example of frequent monitoring is air quality in urban settings. Air quality is measured by the concentrations of particulate matter (PM10, PM2.5), ground level ozone (O3) or other pollutants depending on the specific city. Determining the appropriate frequency for updating environmental data and statistics often involves different considerations.
1.30. For example, in fluid environment phenomena, careful consideration of the temporal
dimension is needed since there can be ebbs and flows, droughts and floods, snow and runoffs which all influence measurements. Sometimes there may be daily variations and at other times variations may be seasonal depending on what is being measured. Seasonal variations can be seen in the fluctuations in certain types of fish biomass, surface water levels, ice cap surface or the incidence of fires. In such cases, monitoring needs to be focused more during some months than others, and therefore statistics should be carefully produced in the most relevant time periods. Given these temporal

Draft – Subject to revision
15
considerations, statistics should also point out the maximum, the minimum and/or other ways of describing the data, and not be restricted to a sum or an average for a period.
1.7 Classifications, categories and other groupings relevant to environment statistics 1.31. Standard economic and social statistical classifications are relevant and used in
environment statistics, such as the International Standard Industrial Classification of all Economic Activities (ISIC) and the Central Product Classification (CPC). The use of these classifications facilitates the integration of environment statistics with economic and social statistics.
1.32. The field of environment statistics has no overarching, internationally agreed
classification of the environment for statistical purposes. Instead, there are a number of co-existing and emerging classifications and categorizations for selected subject areas in environment statistics.
1.33. In recent decades, the area of the environment has seen significant growth in the
development of systems to categorize environmental information. These systems include standardized statistical classifications as well as less formalized groupings or categories. Some of the classifications and categories that have been used in the environmental field have not been developed specifically for statistical purposes, and therefore have to be linked to statistical classifications.
1.34. The pioneering environment statistics classifications developed and adopted by the
Conference of European Statisticians (CES) between 1989 and 1996 have been used extensively for international data collection. These ECE environment statistics classifications are heterogeneous and are not pure classifications in the traditional sense; most of them include more than one single hierarchical classification. They also include recommendations for definitions, measurement methods and tabulations. The ECE classifications for environment statistics include classifications of Water Use (1989), Land Use (1989), Wastes (1989), Ambient Air Quality (1990), Freshwater Quality for the Maintenance of Aquatic Life (1992), Marine Water Quality (1992), Environment Protection Activities and Facilities (1994) and Flora, Fauna and Biotopes (1996).
1.35. More recent statistical classifications as well as less-formalized categorizations which
pertain to specific sub-domains of environment statistics do exist and are in use. These include classifications developed by different international organizations and specialized agencies, intergovernmental organizations or non-governmental organizations. (e.g., classifications developed by FAO for land use and land cover, forests, fishery statistics
Draft – Subject to revision
16
etc; United Nations Environment Programme – World Conservation Monitoring Centre [UNEP-WCMC] and International Union for the Conservation of Nature [IUCN] on protected areas and endangered species.)
1.36. Within the frame of the revision of the SEEA several classifications or lists of
categories have been further developed or adapted for statistical/accounting purposes. 1.37. There are classifications and lists of categories which do not originate in the statistical
community but are used in environment statistics, such as the Centre for Research on the Epidemiology of Disasters Emergency Disasters Database (CRED – EM-DAT) for natural disaster types, the ecosystem reporting categories used by the Millennium Ecosystem Assessment and the Inter-governmental Panel on Climate Change (IPCC) categories for greenhouse gas emissions (GHGs).
1.38. At the most detailed levels, all of the aforementioned classifications and
categorizations provide lists of variables which are informative for data collection activities in the sphere of environment statistics. These classifications have been widely used by the UN ECE, the Organization for Economic Co-operation and Development (OECD), Eurostat, UNSD, and various regional and national bodies for international data collection.
1.8 Institutional dimension of environment statistics 1.39. The institutional dimension of environment statistics is as important as technical
capacity when establishing or strengthening an environment statistics programme at the national level. Given that environment statistics are multi-disciplinary, cross-cutting, and involve numerous stakeholders, actors and producers, problems of insufficient institutional development, overlapping mandates and functions, inadequate interagency coordination and other institutional issues are very common in most countries. The problems of coordination and heterogeneous development can also escalate to the regional and global levels, where a multiplicity of partner agencies operate with different mandates, work programmes, and production time tables.
1.40. The following are four key elements pertaining to the institutional dimension of
environment statistics that need to be considered. 1.41. The legal framework. Countries need to review their statistical and environmental
legislation to provide clarity regarding the authorities responsible for producing official environment statistics along with guidelines for statistical governance and coordination.

Draft – Subject to revision
17
1.42. Institutional development. Environment statistics are often developed using a project
based approach. This results in certain products and publications but the challenge is how to transform project-based efforts into a progressive institutionalized programme. Successful organization of a national environment statistics unit, with a well defined programme, is critical within the institutions officially responsible for the production of statistics. It is important for the environment statistics units to have a capacity building programme for their staff along with appropriate levels of financial resources to support their work and development.
1.43. Inter-institutional collaboration. Environment statistics typically require that
numerous actors collaborate for the production of official statistics. The collaboration of national and sub-national institutions can take the form of data sharing agreements between key institutions and often requires the establishment of a multi-stakeholder platform tasked with coordinating the production of environment statistics including the use of common statistical standards, definitions, classifications and methodologies.
1.44. Institutional cooperation of national, regional and global bodies. The institutional
challenges common in countries are also faced by the international statistical organizations and other international agencies that are involved with environmental information. Reporting requirements for certain international agreements and treaties are an important dimension of environment statistics and as such need to be seen as part of the system of environment statistics in a country.
1.9 Relation of environment statistics to social and economic statistics 1.45. The subject of environment statistics is closely related to social and economic
statistics. When properly integrated, data and other inputs from both these domains can enrich the analyses of environmental data. For example, basic environment statistics can be combined with both economic and social statistics to produce environmental and sustainable development indicators. Environmental-economic accounts can also be developed using the guidelines developed in the SEEA Central Framework.
1.46. Economic and social statistics describing activities that have a direct impact on the
environment are considered part of environment statistics. Other relevant economic and social statistics are also required to put environmental issues in context but those are not considered environment statistics. The use of consistent classifications among these fields helps their integration.
Draft – Subject to revision
18
Chapter 2: Framework for the Development of Environment Statistics <To include intro paragraph on purpose and structure of chapter as well as sub-section describing what a framework is> 2.1 Purposes and main characteristics of the FDES
2.1. The FDES is a statistical tool that offers a foundation and a structure for organizing
information about the environment through a logical arrangement of environment and environment-related statistics. The main purpose of the revised FDES is to serve as a reference and guide for the development of environment statistics at the national, regional and international levels.
2.2. The FDES is a comprehensive, integrative and organizing framework to guide the
collection and compilation of environment statistics and synthesize data from various subject areas and sources. It encompasses all aspects of the environment.
2.3. The uses of the FDES include the following:
i. Identify the main quantifiable aspects of the environment; ii. Identify the components, sub-components and topics that are relevant and
statistically feasible according to defined needs and priorities; iii. Facilitate the development of a national programme of environment statistics; iv. Contribute to the assessment of data requirements, sources, availability and gaps; v. Guide the development of databases that can be used for multiple purposes; and
vi. Assist in the co-ordination and organization of environment statistics given the inter-institutional nature of the domain.
2.4. The focus of the FDES is the environment. The FDES starts from a holistic view of
the environment from which an anthropocentric, or human-centred, dimension can also be identified. The FDES is structured in a way that allows links to economic and social domains. It is compatible with other frameworks and systems, both statistical and analytical. As such, the FDES facilitates data integration within environment statistics and with economic and social statistics.
2.5. The FDES provides general guidance and a logical structure for organizing and
producing environment statistics. More specific guidance on the development of environment statistics from a methodology perspective (i.e., data collection, validation, dissemination) will be available in the forthcoming handbooks and compilation guidelines that will supplement the FDES.
Draft – Subject to revision
19
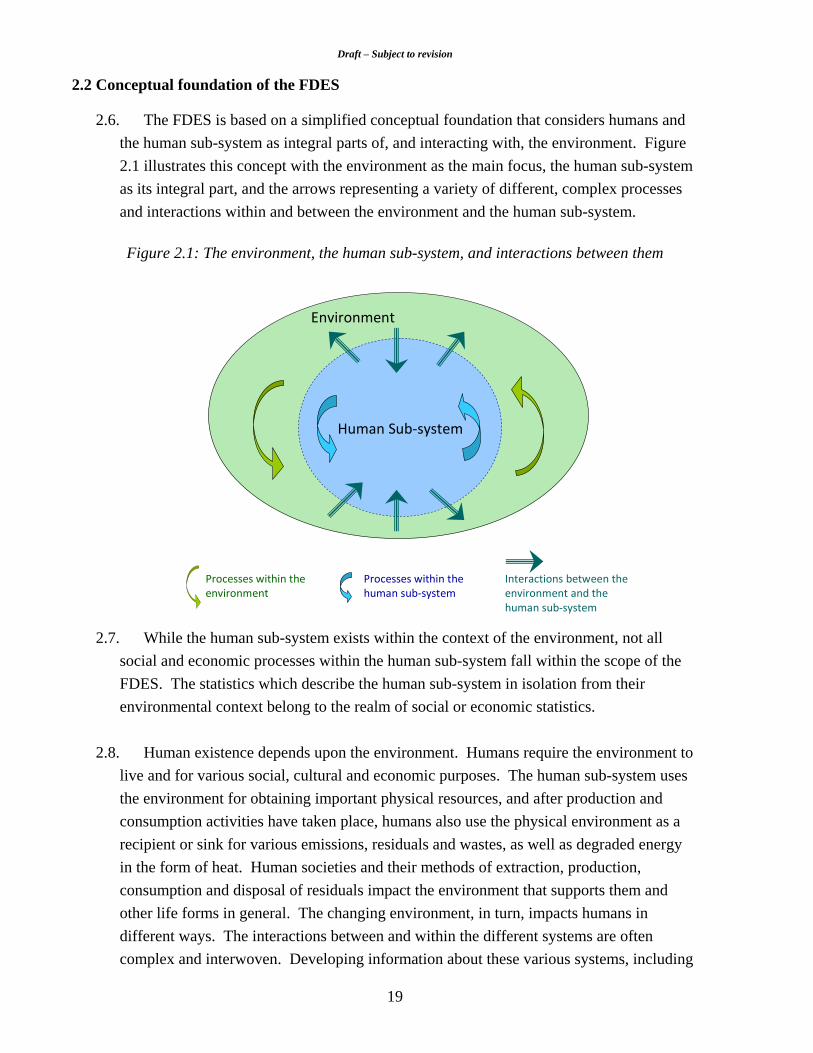
2.2 Conceptual foundation of the FDES 2.6. The FDES is based on a simplified conceptual foundation that considers humans and
the human sub-system as integral parts of, and interacting with, the environment. Figure 2.1 illustrates this concept with the environment as the main focus, the human sub-system as its integral part, and the arrows representing a variety of different, complex processes and interactions within and between the environment and the human sub-system.
Figure 2.1: The environment, the human sub-system, and interactions between them
Human Sub‐system
Interactions between the environment and the human sub‐system
Processes within the environment
Processes within the human sub‐system
Environment
2.7. While the human sub-system exists within the context of the environment, not all social and economic processes within the human sub-system fall within the scope of the FDES. The statistics which describe the human sub-system in isolation from their environmental context belong to the realm of social or economic statistics.
2.8. Human existence depends upon the environment. Humans require the environment to
live and for various social, cultural and economic purposes. The human sub-system uses the environment for obtaining important physical resources, and after production and consumption activities have taken place, humans also use the physical environment as a recipient or sink for various emissions, residuals and wastes, as well as degraded energy in the form of heat. Human societies and their methods of extraction, production, consumption and disposal of residuals impact the environment that supports them and other life forms in general. The changing environment, in turn, impacts humans in different ways. The interactions between and within the different systems are often complex and interwoven. Developing information about these various systems, including
Draft – Subject to revision
20
such tasks as developing monitoring systems and compiling diverse data into reliable statistics, is challenging.
2.9. Evidence in recent decades of escalating human impacts on ecological systems
worldwide raises concerns about the consequences of ecosystem changes for the sustainability of human societies and also for human well-being. Environment statistics are needed to provide structured data to inform on these important dynamics and their main trends over time and through different spatial scales.
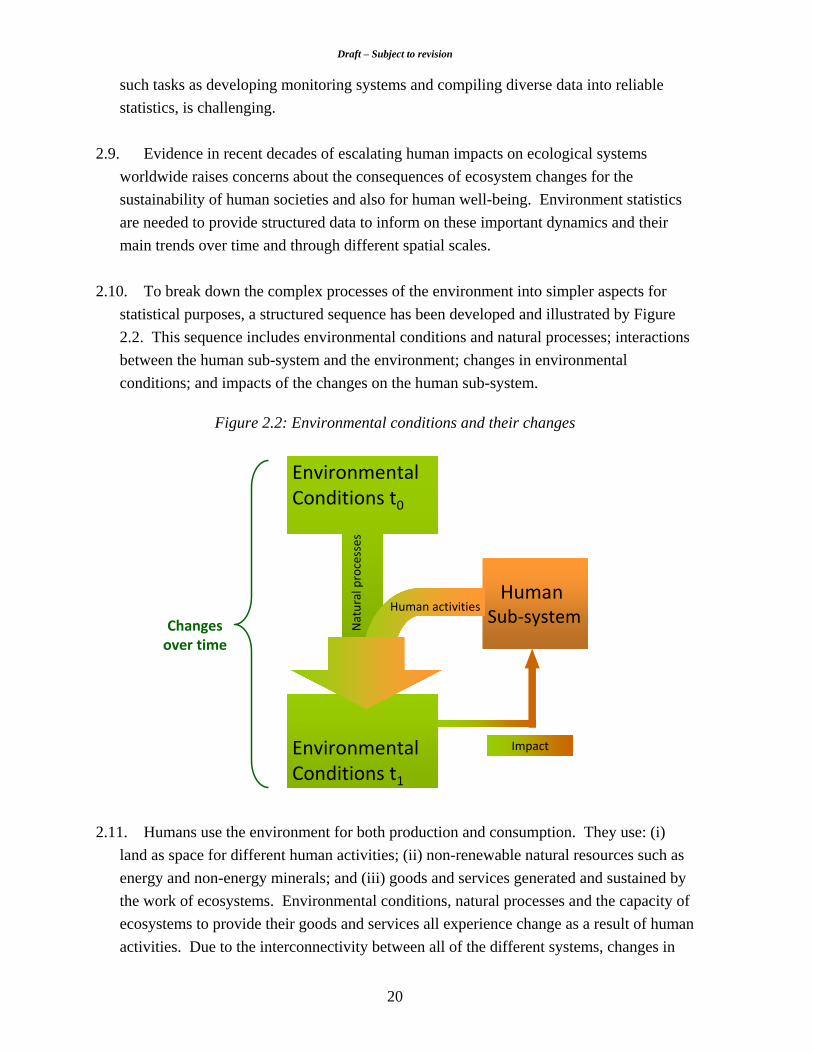
2.10. To break down the complex processes of the environment into simpler aspects for
statistical purposes, a structured sequence has been developed and illustrated by Figure 2.2. This sequence includes environmental conditions and natural processes; interactions between the human sub-system and the environment; changes in environmental conditions; and impacts of the changes on the human sub-system.
Figure 2.2: Environmental conditions and their changes
Impact
Changes over time
Environmental Conditions t0
Human Sub‐system
Human activities
Natural processes
Environmental Conditions t1
2.11. Humans use the environment for both production and consumption. They use: (i)
land as space for different human activities; (ii) non-renewable natural resources such as energy and non-energy minerals; and (iii) goods and services generated and sustained by the work of ecosystems. Environmental conditions, natural processes and the capacity of ecosystems to provide their goods and services all experience change as a result of human activities. Due to the interconnectivity between all of the different systems, changes in
Draft – Subject to revision
21
one part can influence a variety of different parts of the system typically through feed-back type mechanisms.
2.3 From the conceptual foundation to the FDES structure
2.12. The FDES organizes environment statistics into components, sub-components and
statistical topics using a multi-layered approach. The first layer of the structure shows how the statistical topics describing the state of the environment, its changes, and interactions with human activities, are grouped into five fundamental components. In subsequent layers, each of the five components is described and their respective sub-components and statistical topics are presented in detail.
2.13. At the centre of FDES is the need to inform about environmental conditions and how
they are modified by human and natural processes. The first and central component of environment statistics encompasses environmental conditions and processes and their changes over time (see Figure 2.3).
2.14. Component 2 directly focuses on the human sub-system and the requirements from
social and economic activities for using various environmental assets. Not only non-renewable but also renewable resources can be depleted if their use is not sustainable. Therefore Component 2 organizes statistical topics about environmental assets and the human use of these assets.
2.15. The environment is used by humans as a sink to receive the human sub-system’s
returns to the environment. Thus, Component 3 encompasses the emissions, residuals and waste that are generated, managed and finally emitted from the human sub-system into the different parts of the environment and which in turn affect the conditions and processes occurring in the environment.
2.16. As changing environmental conditions and processes also impact human beings, a
fourth component has been created to incorporate these changes. Component 4 incorporates the statistical topics that inform about environmental impacts on the human sub-system.
2.17. Finally, Component 5 organizes information about the responses from the human sub-
system to the changing conditions of the environment including different aspects of environment protection and management, governance as well as public engagement.
2.18. Figure 2.3 shows the five different components of the FDES. The dotted lines
separating the components are an indication of the continuous interactions among them.

Draft – Subject to revision
22
It should be noted that a two dimensional diagram can only provide a limited visualisation of the complex and interrelated nature of the relationships between humans and the environment. However, this diagram can be a useful visual tool to keep in mind when discussing the different components of the FDES in more detail.
Figure 2.3: The five components of the FDES
5. Environment Protection and Management
3. Emissions,
Residuals and Waste
4. Environmental
Impact
2. Environmental Assets and their
Use
1.Environmental Conditions and
Processes
2.19. The types and sources of data needed to provide statistics on the Components, and the methods for obtaining these data, are many and varied. The FDES defines the scope and boundaries of environment statistics. It provides an organizing structure for synthesizing and presenting the information in a comprehensive, consistent and coherent manner. It does not exhaustively detail the types, sources and content of data needed – this will be done in future methodological guidance.
2.4 The FDES and its Approach to Ecosystems and Natural Capital
2.20. Assessing, understanding and managing complex dynamics of the environment has
led to increased demand for, and capacity to use, a holistic ecosystems approach. This approach has been considered as a potential conceptual foundation for the FDES, since it enables the environment to be captured and described as a system, composed of sub-systems (ecosystems) that are functional units of biological organisms interacting with
Draft – Subject to revision
23
inert entities. An ecosystem is a dynamic complex of plant, animal and microorganism communities and the non-living environment interacting as a functional unit. Ecosystems provide provisional, regulating, cultural and supporting services used by humans.
2.21. People are integral parts of ecosystems and a dynamic interaction exists between
them and other parts of the ecosystems, with the changing human conditions driving, both directly and indirectly, changes in ecosystems and thereby causing change in human wellbeing (Millennium Ecosystem Assessment, 2005).1 The systemic view underpinning the ecosystem approach allows an understanding that the ecosystem as a whole is greater and more complex than the sum of its parts, and the interrelations among components are dynamic and are as important as the functioning of each individual part. This view is perhaps closer to the reality in which we live than partial and static ways of conceptualizing the environment.
2.22. When considering conditions of work at most NSOs, the resources available, the
observational units which are in general use and the format of the statistical series that are currently available, the ecosystems approach requires implementing firstly adequate institutional arrangements with those environmental and scientific agencies and other bodies currently involved in relevant data collection. They relate firstly to environmental monitoring data and their delivery in a geographical format allowing conversion of ecosystem categories into environmental components of the FDES. In addition to environmental data, statistical offices will need to get external support from their regular partners to get auxiliary statistics that are of interest to the environmental field in a spatial format.
2.23. The ecosystem approach can be used to develop the contents of the FDES and its
interrelations. The ecosystem approach has therefore been kept in mind throughout the revision of the FDES and in the design of its main components and statistical topics.
2.24. Natural capital is the extension of the economic notion of capital (manufactured
means of production) to environmental goods and services. A functional definition of capital in general is: “a stock that yields a flow of valuable goods or services into the future” (Constanza, 2007).2
2.25. Natural capital refers to the earth’s natural resources, land and the ecosystems that
provide goods and services necessary for the economy, society and all living things. The
1 Millennium Ecosystem Assessment, 2005. Ecosystems and Human Wellbeing. Synthesis. http://www.maweb.org/documents/document.356.aspx.pdf 2 Natural Capital (Costanza, R) in Encyclopedia of Earth, Eds. Cutler J. Cleveland, Washington, DC: Environmental Information Coalition, National Council for Science and the Environment, 2007

Draft – Subject to revision
24
natural capital approach incorporates the stock concept of natural capital as well as a flow concept of provision of services. Between the three asset categories of natural capital, all flows that yield benefits to humans are accounted for. The natural capital approach links human well-being with the flows of specific and identifiable goods and services originating in the environment that are themselves linked with specific and identifiable natural assets. It defines the concept of environmental quality in terms of the quality of the specific natural assets that provide the goods and services that are the source of much human well-being.
2.26. The capital approach can cover the whole scope of environment statistics if and only
if methods allow in practice to go beyond the economic assets which are generally given the priority and capture the sustainable delivery by Nature of the free goods and services which make life on Earth possible. It is, however, an important approach for treating certain types and aspects of environment statistics. The case can therefore be made to apply such concepts when providing information on the stocks and flows of the environmental resources.
2.5 Relationship of the FDES to other systems and frameworks 2.27. This section aims to describe the relationships among the FDES and other structuring
and synthesizing frameworks and systems. The FDES, as a statistical framework, provides structure and direction for the production of basic environment statistics.
Figure 2.4: Relation of the FDES to other frameworks, systems and selected indicator sets
<Figure 2.4 is undergoing revision and will be included later> 2.28. Environment statistics form a multipurpose data system serving a wide variety of user
needs. When properly produced, environment statistics series can be further aggregated and synthesized using other frameworks and models, like the SEEA and the DPSIR model, as well as indicator sets such as the environmental dimension of SDIs and the MDGs.
2.29. Relevant indicator sets are also being produced regionally, for groups of countries
(for example Eurostat’s and OECD’s indicator sets), and nationally. These indicator frameworks and sets structure and guide the production of different indicators, tailored for specific users and monitoring needs.
Draft – Subject to revision
25
2.30. Conceptual soundness and statistical feasibility have been key factors in the revision of the FDES. There are many different approaches that attempt to explain and describe the environment. Some conceptual constructions can be narrow while others can be very complex and comprehensive. They are all important and applicable, under different circumstances or with distinctive purposes. The FDES revision considered a range of perspectives including both the ecosystem approach and the natural capital approach.
2.5.1 The FDES and the SEEA 2.31. The System of Environmental-Economic Accounting (SEEA) is a tool for the
analysis of the interactions between the environment and the economy both in physical and monetary terms. It consists of the SEEA Central Framework that is expected to become an international standard, and will be accompanied by two related parts: SEEA Experimental Ecosystem Accounts, and SEEA Extensions and Applications.
2.32. At the heart of the SEEA Central Framework is a systems approach to the
organisation of environmental and economic information that covers, as completely as possible, the stocks and flows that are relevant to the analysis of environmental and economic issues. In applying this approach, the SEEA Central Framework applies the accounting concepts, structures, rules and principles of the SNA. In practice, environmental-economic accounting includes the compilation of physical supply and use tables, functional accounts (such as environment protection expenditure accounts), and asset accounts for natural resources.
2.33. The SEEA Experimental Ecosystem Accounts will describe both the measurement of
ecosystems in physical terms and the valuation of ecosystems in so far as it is consistent with market valuation principles, noting that only those issues for which broad consensus has emerged will be included. In accounting terms, many of the structures for ecosystem accounting will be drawn from the structures in the SEEA Central Framework and, in this regard, the accounting conventions of the SEEA Central Framework will be applied consistently. The SEEA Extensions and Applications will identify ways in which SEEA could be used to inform policy analysis.
2.34. The FDES and the SEEA are complementary statistical frameworks/systems where
the common intersection is statistical content dealing with the environment (see Figure 2.5). The FDES structures information about the environment as a whole and how it relates to humans, whereas the SEEA Central Framework describes the interactions between the economy and the environment, and the stocks and changes in stocks of environmental assets.

Draft – Subject to revision
26
Figure 2.5: The FDES and the SEEA
Environmental‐economic accounting (SEEA)
Environment statistics (FDES)
Economic statistics (SNA)
2.35. The FDES is not bounded by any pre-existing system of accounting as it is aimed at
remaining a flexible framework that enables and facilitates the production and further development of environment statistics. The FDES is also not bounded by an overarching conceptual foundation that describes the environment, for this foundation has not been universally produced and agreed upon. The SEEA Central Framework, on the other hand, applies the accounting concepts, structures, rules and principles of the SNA to environmental information, and thus is, in general, consistent with the SNA.
2.36. In terms of contents, the SEEA does not directly include various key environment
statistics topics that the FDES considers as constituents. The FDES includes all the different attributes of the environment including environmental quality (of air, water, etc), impact of the environment on human health, as well as the occurrence and direct impact of natural disasters and extreme weather and natural events, etc. The SEEA Central Framework includes these aspects only as part of the valuation of environmental assets. In further developments, the SEEA ecosystem accounts will make use of the information about these aspects, as developed in the FDES in order to reflect the ecosystem’s health and capacity to deliver services.
2.37. Environmental accounts use environment statistics as their foundation. At the same
time, when developing environment statistics, it can be advantageous to develop them to also meet the requirements of environmental-economic accounting. In this way, a multi-purpose data system can be developed which can lead to specific policy appropriate environment statistics as well as a system of environmental-economic accounting. Typically, accounting systems, whether business accounting or environmental-economic accounting, require that certain dimensions and categories are used. Identifying these

Draft – Subject to revision
27
information needs when developing an information system can be an important step in determining the various user needs that may be met.
2.38. The SEEA helps to organize certain types of environment statistics in a way that can
be coherent with economic statistics. By providing a clearly defined approach, the SEEA enables a connection to be made between these two statistical domains. With coherent data sets, important analytical methodologies based on the SNA can be extended to include an environmental dimension. Examples include environmentally extended input-output analysis and economic equilibrium models including environmental dimensions/variables. The results from these types of environmental-economic analyses and models can help environmental policy and management strategies.
2.39. The FDES is designed to provide guidance to countries in the early stages of
developing environment statistics, but it can also guide the evaluation of the coverage and focus of more advanced countries. Evaluating which institutions have the responsibility for the production and dissemination of certain types of environmental information can be a useful exercise. It can also help identify certain data gaps or limitations if a country is engaged in or considering the implementation of the SEEA Central Framework.
2.5.2 The FDES and its Approach to the Driving forces – Pressure – State – Impact – Response (DPSIR) Model 2.40. The FDES is perhaps closest to the DPSIR model conceptualization in its
construction. One difference is that the DPSIR model includes directional arrows which imply causality and portray simplistic relationships between the different parts. Depending on the version, sometimes this model is shown in a circle with arrows leading sequentially from one area to the next, as in Figure 2.6 below, while at other times it is shown with a variety of arrows added to the picture pointing in a number of different directions. This representational variety does not make entirely clear how the different parts of the DPSIR model can be related to each other. The FDES does not assume any directional causality and leaves that to be determined through data analysis.

Draft – Subject to revision
28
Figure 2.6: DPSIR model
2.41. Importantly, the contents, structure and conceptual underpinning of the DPSIR
model, as well as the experiences of practitioners working with it in real life, have been analyzed and considered partially as well as integrally in the revision of the FDES, and have contributed particularly to the shape of its new structure and the scope of its contents.
Driving forces Basic sectoral trends,
e.g. in energy generation, transport, industry, agriculture,
tourism
Pressure Human activities directly
affecting the environment e.g. carbon
dioxide or methane emissions
State Observable changes of the environment, e.g.
rising global temperatures
Response … of society to solve the problem, e.g. research on
solar energy, energy taxes
Impact Effects of a changed
environment, e.g. decrease in agricultural production, hurricanes,
floods

Draft – Subject to revision
29
Chapter 3: The Structure and Components of the FDES <To include intro paragraph on purpose and structure of chapter> 3.1. The FDES organizes the content of environment statistics within a system of five
components. Altogether, the five components of the FDES cover the scope of environment statistics, and contain and organize the most relevant, specific sets of information (sub-components and statistical topics) in a useful way. The FDES uses a multi layered approach. The first layer of the structure defines the five fundamental components. Each individual FDES component is further disaggregated into its respective sub-components and statistical topics.
3.2. The FDES structure is organized into the following five components: (1)
environmental conditions and processes, (2) environmental assets and their use, (3) emissions, residuals and waste, (4) environmental impact and (5) environment protection and management. These components are closely interrelated because of their content, as depicted in Figure 3.1 below.
Figure 3.1: The five components of the FDES
5. Environment Protection and Management
3. Emissions,
Residuals and Waste
4. Environmental
Impact
2. Environmental Assets and their
Use
1.Environmental Conditions and
Processes
Draft – Subject to revision
30
3.3. The contents of each individual component of the FDES are organized considering three main factors. Firstly, the contents are organized in accordance with the conceptual foundation already described (see Chapter 2, Section 2.2), in which both environmental and human processes and activities modify the environmental conditions, which in turn impact on the human sub-system, triggering human responses. Secondly, as a statistical tool to be applied by the environmental statistician, the content of the components of the FDES also take into consideration specific practical concerns, such as the methods of calculation and the types and sources of data. Thirdly, as the environmental statistician is producing outputs to be used by the final user of environment statistics, the analytical coherence of the system is also a key characteristic of the content of each component. For example, the stocks and changes of the stocks of each environmental resource are grouped together in the same sub-component.
3.4. Management infrastructure and designations of use that can be traced to specific
aspects of environmental concern (e.g., protected areas, water treatment facilities, etc.) and for which specific statistics are produced, will be allocated within the relevant topic and not under Environment Protection and Management (Component 5), which is aimed at more general management actions and regulation of resources (for the whole environment in general).
3.1 Levels of aggregation and organization of contents 3.5. There are three levels of aggregation in the structure of the FDES. “Component” is
used for Level 1. Components are then subdivided into “Sub-components” which are then further subdivided into “Statistical Topics.” Each level of aggregation uses numbering conventions as shown below in Table 3.1.
Table 3.1: Aggregation levels of the FDES
1 digit 2 digits 3 digits 1. Component 1.1 Sub-component 1.1.1 Statistical Topic
3.6. Sub-components have been selected using a holistic view of constituent parts of the
component, meaning the sub-components attempt to organize all potential themes that fall under the component. Statistical topics have been selected in order to further categorize and group the different aspects underlying each sub-component. The statistical topics have been disaggregated into individual environment statistics in Chapter 4. Individual environment statistics have been selected and organized based on statistical availability, feasibility of collection and importance to countries.
Draft – Subject to revision
31
3.7. Because of the characteristics of environment statistics, it is evident that the placement of different sub-components and statistical topics could also have been logical in other arrangements within other components. In this regard, their final location within the structure corresponds to both their most substantial content and nature and to the sources and methods of production, so that both conceptual and statistical soundness are optimized.
3.8. While at the component level the FDES has been designed to be conceptually distinct,
the contents of each component may overlap in some cases. Hence, sometimes the same statistic can be used to describe different components.
3.9. Note that the disaggregation of components into their sub-components and topics is
not intended to be fixed, mutually exclusive or exhaustive. In line with the need to maintain a flexible and applicable FDES3 for environmental statisticians (FDES, 1984), the disaggregation can be adapted and enriched according to each country’s requirements, priorities and circumstances. Some countries may need more or less disaggregation; other countries may wish to exclude some topics completely.
3.2 Components and sub-components of the FDES
Component 1: Environmental Conditions and Processes Sub-component 1.1: Physical Conditions Sub-component 1.2: Biodiversity and Ecosystems Sub-component 1.3: Environmental Quality
Component 2: Environmental Assets and their Use Sub-component 2.1: Mineral and Energy Resources Sub-component 2.2: Land and Land Use Sub-component 2.3: Soil Resources Sub-component 2.4: Biological Resources Sub-component 2.5: Water Resources and their Use
Component 3: Emissions, Residuals and Waste Sub-component 3.1: Emissions to Air Sub-component 3.2: Generation, Management and Discharge of Wastewater and Emissions to Water Sub-component 3.3: Generation, Management and Disposal of Solid Waste
Component 4: Environmental Impact Sub-component 4.1: Natural Disasters and Extreme Events Sub-component 4.2: Impacts on Human Health and Well-being
Component 5: Environment Protection and Management Sub-component 5.1: Environment Protection and Management Expenditure Sub-component 5.2: Environmental Governance, Regulation and Engagement Sub-component 5.3: Environmental Information, Education and Perception
See the Table of Contents for a listing of statistical topics within each sub-component.
3 “To remain flexible, the components of the environment are presented in a highly aggregated manner in the framework. The intention is to not pre-empt choices of disaggregation. Framework users may opt for a more detailed or selective breakdown of the environment in accordance with their specific needs and conditions.” FDES, 1984, p.10.

Draft – Subject to revision
32
3.10. In the following pages, each of the five components is described. The description of each component will include its coverage, content and exclusions; type of data typically used or obtained in measurement; most common sources of data; and the main institutional stakeholders required for the production of the environment statistics included in the component. The component’s relation to other frameworks and areas of statistics is also described, if appropriate.
3.3 Main attributes of the components of the FDES <More emphasis on the relevance and importance of the Components, Sub-components and Topics will be included in the text; and the technical details will be reduced> 3.11. Table 3.2 below summarizes key attributes of the five components of the FDES
including a general description, the types of data which are included in each component, main sources and partners, as well as conceptual relationships between each component and other systems and frameworks.
3.12. Regarding data types, geographic data refer to spatial information, such as location.
Physical data refer to a variety of information on the physical state, such as temperature, salinity, tons or hectares. Qualitative data refer to information on the environment which relies on qualitative descriptions, though often including some quantitative aspects. Monetary data refer to information described in terms of money, such as government expenditure on environment protection.

Draft – Subject to revision
33
Table 3.2: Main attributes of the FDES components
Description Types of Statistics
Main Sources and Partners
Relation to DPSIR and the SEEA
Component 1: Environmental Conditions and Processes
Information on the main geological, meteorological, geographic, biological, hydrological, physical and chemical characteristics; includes environmental quality
• Geographic • Physical
• Environmental, meteorological, hydrological, geological and geographical authorities or institutions
• Monitoring and remote sensing data
• State element in DPSIR model
• Future experimental ecosystem accounts in SEEA
Component 2: Environmental Assets and their Use
Stocks and changes of stocks of environmental resources; as well as their use and management
• Physical
• Statistics databases of respective authorities such as national mining, energy, agricultural, water and forest authorities or institutions
• Statistical surveys, administrative records, field surveys, land registers
• Sector statistics on use and management
• Remote sensing data
• State and Pressure elements in DPSIR model
• Asset and physical flow accounts in SEEA
Component 3: Emissions, Residuals and Waste
Generation, management and discharge of residuals and waste to air, water and soil
• Physical
• Administrative records • Estimates based on activity
statistics and technical coefficients
• Sector statistics • Monitoring data
• Pressure and response elements in DPSIR model
• Physical flow accounts in SEEA
Component 4: Environmental Impact
Occurrences and impacts of natural disasters and extreme events; also impacts of the changing environment on human health
• Physical • Monetary
• Administrative records • Social and economic statistics
about impacts of natural disasters and extreme events on the human sub-system
• For natural disasters, the national emergency authority
• For human health, the health authority
• Impact element in DPSIR model
Component 5: Environment Protection and Management
Environment protection and resource management expenditure; environment regulation both direct and via market instruments; also environmental information and engagement of the society
• Monetary • Qualitative
• Administrative records • Surveys • Entity producing government
expenditure statistics • The statistical entity in charge
of national or sub-national surveys
• The environmental authority and other sector authorities
• Response element in DPSIR model
• Environmental activity accounts of the SEEA
Draft – Subject to revision
34
3.4 Component 1: Environmental Conditions and Processes 3.13. This first component of the FDES is central, as it organizes information on the
background environmental conditions and processes and describes many of the foundations of ecosystems. Given the current limitations in the collection and availability of spatial and physical data, an overall measure of ecosystem health may not be readily available. This component includes information about the geological, geographic, biological, physical and chemical conditions and characteristics of the environment. Information about the quality of air, freshwater, marine water and soil, as well as information on noise pollution are also included in this component.
3.14. Despite the well-recognized relevance of this component, due to the complexity of
the type of phenomena encompassed here and to the fact that most primary data sets are scattered among specialized institutions in each country, the statistics are still scarce and emerging. Primary sources include, but are not restricted to, meteorological, geological and geographical institutions, as well as environmental research and management institutions. Primary data sets commonly available in most countries require aggregation and processing to be transformed into environment statistics.
3.15. The most recurrent types of data to be produced within this component include
physical statistics, such as concentrations of pollutants and extent of wooded lands; spatial statistics, such as land cover and land use; and qualitative descriptions with quantitative aspects, such as biological conditions and ecosystem health. The statistical topics and data series organized in this component can be developed at the national level or described spatially. In the absence of an internationally agreed ecosystem classification, ideally these categories can be related to existing ecosystems or biomes, according to each country’s classifications.
3.16. The information contained in this component is related to the State element in the
DPSIR model and is also likely to be captured within the future experimental Ecosystem Accounts in the SEEA framework.
3.17. A further disaggregation is made into three sub-components:
i. 1.1 Physical Conditions; ii. 1.2 Biodiversity and Ecosystems; and
iii. 1.3 Environmental Quality.

Draft – Subject to revision
35
Sub-component 1.1: Physical Conditions
3.18. This sub-component includes basic information that describes and quantifies the physical conditions of a given country such as geological, geographic, atmospheric, meteorological and hydrological characteristics of the environment.
3.19. The types of data sources are based on cartographic systems (maps, Geographic
Information Systems, etc.), remote sensing systems and networks of monitoring stations. These types of data are then processed to obtain environment statistics that depict a more aggregated picture of an area. With consistent time series main trends can potentially be described. The relevant institutional partners are usually the authorities producing primary data, such as the national authorities or official agencies in charge of the country’s geology, geography, hydrology, meteorology, ecosystems and biota health and protection, and environmental pollution control. Specific sources will be mentioned within each topic.
3.20. The statistical topics under this sub-component are as follows:
Topic 1.1.1: Atmosphere, climate and weather 3.21. This topic covers data on atmospheric and climatic conditions across territories and
over time. The longer perspective on general climate and its variability over time and territory is also included here. Information on weather and climate describes the way that the atmosphere is behaving over a given territory and is recorded by countries over different time spans and through a network of monitoring stations.4 Climate refers to long time periods, while weather provides a more immediate description of the same phenomena. The weather data sets that are usually measured over time and space in monitoring stations include the following aspects: temperature, humidity, pressure, precipitation, wind, solar radiation, and ultraviolet (UV) radiation.
3.22. The main sources are meteorological and atmospheric monitoring networks that are
run by national meteorological and atmospheric institutions and authorities. Although the statistics produced are primarily measured at specific stations, the data presented can be statistically treated to provide information at the national and sub-national levels.
4 In most countries, atmospheric, weather and climate authorities monitor and record these types of environmental variables over long periods of time using a network of monitoring stations scattered throughout the country. Usually, they produce data and micro data sets covering potentially centuries of climate and atmospheric information with a very high level of detail. The data set that is available in most countries is too dense and detailed for the purposes of environment statistics, so it must be treated - synthesized, aggregated, with central tendencies and variances established, both with respect to space and time, to produce environmental data sets on climate and the atmosphere. Time and seasonal variability is crucial when recording and organizing these types of statistics. The territorial reference of the measurements is vital, as although the entire territory of a country cannot be monitored, the spatial configuration of the monitoring stations is usually pertinent to local and regional (i.e., sub-national) conditions and concerns.
Draft – Subject to revision
36
Topic 1.1.2: Hydrological systems 3.23. This topic covers information on the hydrological system of a country. It covers
information on the amount of water in the main water bodies, the flows where available, and a description of major watersheds, their flows, and river morphology. It also includes information on the extent (i.e., length, area) of rivers and major water bodies.
3.24. The main primary sources are hydrological information systems that are usually
managed by national hydrological institutions and water authorities. The information and data sets are usually produced for individual river basins, for use at national and sub-national levels.
3.25. Important exclusions from this component include water quality data (the data are
contained in sub-component 1.3). This exclusion has been made for reasons of similarity of types of data sources, methods of calculation and institutional partners involved.
Topic 1.1.3: Geological and geographic information 3.26. This topic includes general geological and topographic information, presenting
statistics that inform on the extent and characteristics of the country’s territory. These information sets contain statistics that typically vary slowly over time, and can usually be separated into terrestrial, marine and island characterizations. They can also sometimes be disaggregated to a country’s sub-national regions and zones. Because of their nature, these information sets are usually presented as geographic (e.g., territorial borders, length of coastline) or geologic (e.g., fault lines, volcanoes). More specific geological information, such as different types of mineral deposits, including their mining and extraction, are included in Component 2: Environment Assets and their Use.
3.27. The main data sources are geological and geographical information systems that are
run by national geographical and geological institutions and authorities. The data sets are usually produced for the national and sub-national levels.
Topic 1.1.4: Land cover <This topic will be further clarified> 3.28. Land cover is defined by the FAO as, “the observed (bio)physical cover on the earth's
surface.” (FAO, 2005) The FAO describes some of these land use/land cover challenges as follows, “When considering land cover in a very pure and strict sense, it should be confined to the description of vegetation and man-made [sic] features. Consequently, areas where the surface consists of bare rock or bare soil are land itself rather than

Draft – Subject to revision
37
land cover. Also, it is disputable whether water surfaces are real land cover. In practice though, the scientific community usually includes these features within the term land cover.” (FAO, 2005)
3.29. Land cover statistics are important from the environmental perspective due to the
interrelated nature of what covers the land and its physical and ecosystemic characteristics. In the absence of more complex ecosystem statistics, land cover information can provide at least a basic characterization of what exists on the land.
3.30. Countries frequently use the FAO land cover classification or their own national
classification of land cover categories. Not all categories are relevant to every country. Further disaggregations are frequent, depending on the characteristics of the country. The level of aggregation is also affected by access to primary data sources. SEEA’s land cover categories,5 based on FAO, are:7
i. Artificial surfaces (including urban and associated areas); ii. Herbaceous crops;
iii. Woody crops; iv. Multiple or layered crops; v. Grassland;
vi. Tree covered areas; vii. Mangroves;
viii. Shrub covered areas; ix. Shrubs and/or herbaceous vegetation, aquatic or regularly flooded; x. Sparsely natural vegetated areas;
xi. Terrestrial barren land; xii. Permanent snow and glaciers;
xiii. Inland water bodies; and xiv. Coastal water bodies and inter-tidal areas.
3.31. The main source for these statistics is remote sensing data, usually satellite images that are interpreted and transformed into geospatial information, mapping the different categories that cover the land.
Sub-component 1.2: Biodiversity and Ecosystems 3.32. This sub-component organizes information and statistics on ecosystems, flora, fauna
and biodiversity, as well as their recordable changes over time and space. Protected areas
5 SEEA land cover categories, based on FAO Land Cover Classification System http://unstats.un.org/unsd/envaccounting/seearev/Chapters/cAnnex.pdf
Draft – Subject to revision
38
and species are also included. Protected areas and species are included here because of their inherent relation to biodiversity. The main purpose of the designation of protected areas and species is to allocate resources in order to sustain the biodiversity and survival of threatened or key species that exist in certain zones. This type of quantitative information on biodiversity, via data on protected areas and species, is critical given the increasing evidence of biodiversity loss across the planet and in particular biomes around the world and in each country.
Topic 1.2.1: Biodiversity 3.33. This topic includes information on biota (flora and fauna), including more macro-
level information on existing flora, fauna and biodiversity. Statistics describing the existence and size of dedicated territorial areas for protecting biodiversity, as well as the existence of protected individual species of flora and fauna (e.g., regulation of their exploitation) are also included in this topic.
3.34. Although there are quantitative data available on area and specific species, much of
the information regarding biodiversity contained in this topic includes qualitative aspects. When available and appropriate, portraying information through geographic or spatial tools can be particularly useful.
3.35. Statistical information on biota and biodiversity is not highly developed. The data
originate primarily from expert studies and scientific research which typically results in scattered and non-systematised data. The main source of information on protected areas is administrative records. These data sets can also be found in secondary databases and reports on the state of ecosystems or the state of the environment. These can usually be found under the charge of environmental authorities and are frequently produced for the national and sub-national levels.
3.36. This topic is further subdivided into two parts, according to the sources and types of
information, firstly flora and fauna, and secondly protected areas and species. 3.37. Flora and fauna: this category contains descriptive information on biota and the
existence and trends of flora and fauna in various populations and communities. Quantitative and complementary information on biodiversity in both terrestrial and marine environments, as well as their localization, are structured here. The usual themes included here are: population of species of flora and fauna (terrestrial, freshwater and marine), endemic species, threatened species (categories), invasive species and extinction of species.

Draft – Subject to revision
39
3.38. Protected areas and species: this category includes physical and descriptive information and statistics on protected areas and protected species within the country, often disaggregated into terrestrial and marine groupings. This topic is directly related to Component 5 (Environment Protection and Management), as it records the existence and extent of protected habitats and protected species.
Topic 1.2.2: Ecosystems 3.39. This topic covers physical and descriptive information and statistics about a country’s
main ecosystems, including their extent, localization, health, main patterns, trends and vulnerabilities. It also includes a description of each ecosystem´s physical, chemical and biological conditions and other relevant characteristics, quantifying, to the extent possible, the most important changes and impacts in both terrestrial and aquatic ecosystems over time.
3.40. For the purposes of characterizing the biomes or ecosystems of a country, in the
absence of an internationally agreed ecosystem classification, national classifications could be used and fully described for statistical purposes. Alternatively, the country could follow and adapt other internationally used ecosystem categories, such as the Millennium Ecosystem Assessment reporting categories.62 The categories used in the Millennium Ecosystem Assessment are Forest, Mountain, Cultivated, Dryland, Polar, Inland Water, Marine, Coastal, Island, Urban and Other (Millennium Ecosystem Assessment, 2003). As recognized by the Millennium Ecosystem Assessment, these ecosystem reporting categories can and do overlap, so countries may want to decide as to the exact composition, inclusions and exclusions of the main ecosystems and biomes in accordance with national or existing international definitions.
3.41. Ecosystem categories are complicated to describe because of scale considerations.
Starting from MA2003 Millennium Ecosystem Assessment categories, ecosystems can be grouped into biomes or biogeographical regions and by river basins/sub-basins. They can be subdivided into small homogenous units (in practice, land cover units which are homogenous considering provisioning ecosystem services) and broader statistical units reflecting socio-ecological systems.
3.42. For each ecosystem category, different sets of statistics can be produced. The
following list73organizes ecosystems information and statistics, to the extent possible, into four parts (Heinz Center, 2008):
6 http://www.maweb.org/documents/document.769.aspx.pdf 7 Heinz Center’s The State of the Nation’s Ecosystems 2008, USA. Key Ecosystem Characteristics.

Draft – Subject to revision
40
i. Extent (location and size) and pattern information describe the spatial area or length of ecosystems and how they are intermingled across the landscape (e.g., area of wetlands, rivers and streams, the proximity of croplands to residences, and habitat fragmentation).
ii. Chemical and physical characteristic statistics report on nutrients, carbon, oxygen, contaminants and key physical trends. (e.g., the amount of nitrogen delivered by major rivers to the nation’s coastal waters, soil nutrient depletion, and erosion of croplands.
iii. Biological component statistics provide information on the conditions of plants, animals and living habitats. (e.g., species at risk of extinction and the percentage of species in a region that is not native).
iv. Goods and services information describe the flows that humanity derives from the natural world, or the ecosystem services. (e.g., amount of timber harvested and participation in outdoor recreation).
3.43. For many countries, according to general expert consensus, available data on
ecosystems are rather scarce and non-systematic, and originates with expert studies and scientific research as primary sources. These data sets can be also found in secondary databases and reports on the state of ecosystems or the state of the environment, usually produced by environmental authorities. These reports are usually distributed at the national level and, less frequently, at the sub-national level.
Sub-component 1.3: Environmental Quality 3.44. Statistics of pollutant concentration provide indirect information on the quality of the
environment. This sub-component of environment statistics organizes information on the existing concentration of pollutants in the air, water, coastal zones, islands and marine waters, and on land. In addition information on noise pollution is included. When national or local maximum levels or limits (norms, standards of concentration or levels) of pollutants exist in countries, it can be important to include this information together with the physical data.
3.45. The concentrations of different chemicals and solid compounds in a specific area are
presented in this sub-component. The level of noise that is significant for ecosystem quality and human health is also recorded. The recipient areas will be influenced differently depending on a number of factors such as the type of pollutant, the concentration being added, and previous levels of these or related pollutants already existing in the area, among other factors. The importance of the different pollutants can

Draft – Subject to revision
41
vary when the quality of the ecosystem and the health and wellbeing of humans is being considered.
3.46. It should be noted that the emissions of these pollutants are not included here, but in
Component 3: Emissions, Residuals and Waste. 3.47. The spatial implications of these statistics are important particularly because of the
fluidity of ecosystems and media (freshwater, air, oceans), and because air and water serve as transporters of pollutants from one media to the other and from one geographic area to another. Transforming the primary data of different pollutants into statistics can be laborious because of spatial and temporal considerations. This relates to the collaboration between statistical offices and environmental agencies regarding the design (sampling pattern) of monitoring networks and possible expertise offered by statisticians.
3.48. Providing information on environmental quality is highly relevant but capturing
quality of the environment directly is complex. Most experts say that acceptable environmental quality is present when the ecosystems and the humans within them are healthy. But health is a complex and multi-variable phenomenon, both in humans and with regard to the environment.
3.49. Most countries utilize the environmental media framework approach to pollutant
concentration statistics, where data sets can be produced and organized to provide information on concentrations of the most relevant pollutants in air, waters, soil and so on. Depending on the specific situation, at least concentrations of some pollutants are monitored in countries, and as long as they are systematic and reliable, statistical series can be produced from these primary sources.84
3.50. In the case of noise pollution, statistics are produced through monitoring, usually at
specific points of cities, airports, train stations, manufacturing facilities and highways.
Topic 1.3.1: Air quality 3.51. This topic includes statistics on the concentration of the most important air pollutants,
mostly in cities, including both gases and suspended solid particles that can have a negative effect on human and ecosystem health.
8 Transforming raw data from specific types of sources such as air and water quality monitoring stations, in order to produce environment statistics series, requires bringing together statistical and thematic expertise in order to adequately aggregate, weight, and process the usually high volume of microdata that are frequently measured and spatially scattered in the primary monitoring networks and institutions. The practices and methods of production of such data sets can be diverse among different countries. As environment statistics progress around the world, this is one of the areas of environment statistics whose production is expected to develop considerably over the next two decades.

Draft – Subject to revision
42
3.52. The locally relevant ambient air pollutants (i.e., in cities) include, but are not restricted to (i) breathable particles (SPM10, SPM2.5); (ii) breathable harmful gases (tropospheric ozone, CO); and (iii) other pollutants (SO2, lead, NOx, NMVOCs, furans and dioxins). When national or local maximum levels or limits (norms, standards of concentration or levels) of pollutants in air exist in countries, it can be important to include this information together with the physical data.
3.53. It should be noted that these statistics refer to concentrations, while data on national
emissions of GHGs and ozone depleting substances (ODS) are excluded from this component, as they are treated as emissions in Component 3.
3.54. The most common data sources are monitoring stations, for the locally relevant
pollutants. Data availability varies according to the country’s circumstances. When monitoring programmes and stations exist, the primary microdata sets produced require further processing for transformation into environment statistics. The resulting environment statistics datasets will be produced for and be relevant to specific localities or cities, where the most problematic conditions of air pollution exist, and will not necessarily be representative of the entire country.
Topic 1.3.2: Freshwater quality 3.55. This topic focuses on freshwater, because most monitoring stations and regular
monitoring programmes are aimed at measuring specific pollutants found in surface fresh water, at specific zones or areas where important pollution problems exist.
3.56. The quality of freshwater can be described by biological, hydromorphological and
physico-chemical parameters. When national or local maximum levels or limits (norms, standards of concentration or levels) of pollutants in water exist in the given country, it can be important to include this information together with the physical data.
3.57. Pollutants found in groundwater are important but systematic measurements are
difficult. Although aquifers and groundwaters are being polluted from percolates and infusion from above ground activities, it is difficult to develop representative or comprehensive information.
3.58. Particularly in freshwater, it is important to keep in mind that the fluidity of this
media presents a challenge with regard to selecting the most important spatial locations and the relevant frequency for monitoring stations and programmes. This can cause statistical complications with regard to spatial and temporal aggregation when producing statistical series. For example, the significance of pollutant concentrations can vary

Draft – Subject to revision
43
widely at different points in a water body depending on multiple factors including where the highest concentrations of pollutants are discharged into the body. Additionally, seasonal variations in the volume of freshwater can also affect the concentrations of pollutants.
3.59. Because the water cycle, including precipitation, rivers, aquifers, groundwater, lakes,
coasts and oceans are all interconnected, the choice of where to measure or monitor the pollutants and which pollutants to monitor will depend on local and national priorities, ecosystem characteristics and resources available. The identification of the pollutants that are most relevant for monitoring depends on a number of factors. These include the immediate and subsequent water uses that are important to humans, and the nature of the pollutants found in water bodies and watersheds that are affecting the bio-capacities and local ecological equilibriums in the country.
3.60. Data for water quality statistics are primarily produced by monitoring stations.
Monitoring programmes are usually constructed when a policy or quality norm is set up for specific locations that show the most problematic signs of pollution. The primary microdata from these monitoring stations require further processing to produce environment statistics on the water quality of specific locations. Typically the resulting environment statistics will be produced and relevant for specific local areas and are not representative at the national level.
Topic 1.3.3: Marine water quality 3.61. The most commonly monitored marine pollutants and associated phenomena can be
organized into two categories that distinguish among local, national and supranational levels, in terms of the type of pollution and associated phenomena depending on what is most relevant.
3.62. Locally relevant information about marine water and coastline water quality and
pollutant concentrations can include, but are not restricted to, surface and urban runoff, sedimentation, coral bleaching, eutrophication, plastic waste and bacterial pollutants in marine fishing areas and recreational beaches. When national or local maximum levels or limits (norms, standards of concentration or levels) of pollutants exist in countries, this information can be important to include together with the physical data.
3.63. Nationally and supranationally relevant information about marine water quality and
pollutants can include, but are not restricted to, acidification of marine water, plastic waste, oil spills, coral bleaching, heavy metals that bioaccummulate (i.e., mercury, lead, nickel, arsenic, cadmium) and persistent toxins (i.e., polychlorinated biphenyls [PCBs],

Draft – Subject to revision
44
dichlorodiphenyltrichloroethane [DDT], pesticides, furans, dioxins, phenols and radioactive waste). When national or local maximum levels or limits (norms, standards of concentration or levels) of pollutants exist in countries, this information can be important to include together with the physical data in this topic. The resulting environment statistics datasets will be produced for and be relevant to areas belonging to national and supranational marine and ocean environments.
3.64. Data sources for marine water quality statistics are typically either national or
international monitoring stations, associated with scientific research. Monitoring programmes are usually constructed when the scientific interest for research is present, and/or when policy or quality norms are set up for specific areas that show the most problematic signs of marine pollution. The primary microdata from these monitoring stations require further processing to produce environment statistics on the water quality of specific locations.
3.65. Spatial and temporal considerations are very important when constructing statistics on
this topic. For instance, with regard to oceanic and marine water pollutant concentrations, most monitoring stations and regular quality monitoring programmes are aimed at surface marine water and at coastline zones. There is a noted lack of monitoring aimed at deep oceans. The fluidity of the oceans’ waters, their waves, tides and continued movement make it a complex task to locate monitoring spots (location and depth) and appropriate measurement time periods that are applicable for each relevant pollutant.
3.66. There are a number of other important marine environment and marine water quality
statistics which a country may track, but at present many of these are not collected regularly. These include: volumes of solid and plastic waste in the water; concentrations of bio-pollutants, heavy metals, persistent toxins and radioactive substances; and coral bleaching. Producing statistics on the concentrations and effects of pollutants and waste in marine water bodies is of the greatest importance to the health of ecosystems as well as to humans.
Topic 1.3.4: Soil quality 3.67. Soil contamination is typically caused by chemicals and other residuals disposed of
by humans. The most common sources of land contamination include leakage from underground storage tanks and pipelines, the use of pesticides in agriculture, the percolation of polluted waters, oil and fuel dumping, and direct discharges of wastewater and industrial residuals to the soil.
Draft – Subject to revision
45
3.68. Some of the most commonly measured land pollutants include petroleum hydrocarbons (i.e., oil residuals and solvents), pesticides and heavy metals. When national or local maximum levels or limits (norms, standards of concentration or levels) of soil contamination exist in countries, this information can be important to include together with the physical data.
3.69. Where available, information on nutrient content in the soil should also be included in
this topic. The nutrient content of soil is typically assessed using data on levels of Calcium (Ca), Magnesium (Mg), Nitrogen (N), Phosphorus (P), Potassium (K), and Zinc (Zn). Other elements may also be measured in soil quality assessments, including, but not limited to, Aluminum (Al), Boron (B), Iron (Fe), and Manganese (Mn). While typically not available for most areas, monitoring soil quality is important in order to sustain land productivity.
3.70. Data sources for soil quality are primarily produced by monitoring stations and will
be related to those specific locations. The primary microdata from these monitoring stations requires further processing to produce environment statistics on the soil quality of specific locations. The resulting environment statistics datasets will be produced and relevant for the specific local areas where the most problematic conditions of land pollution exist. Due to local variations in soil it will be very difficult to develop figures that are representative at national levels.
3.71. Soil quality directly affects human and environmental health, and also the
productivity of land, depending on the depth of contact with biota and humans in polluted areas, its concentration and other factors. However, land contamination is rarely monitored. Its documentation and measurement usually follows important pollution events that require clean-up or intervention. Thus, the primary data sets available for statistical purposes are usually limited and not systematic.
Topic 1.3.5: Noise 3.72. Noise pollution does not only exist in the most populated or busiest cities, but also in
many other ecosystems and places where humans live, such as adjacent to highways, near airports and marine ports and around manufacturing, metal processing and mining exploitation establishments and construction sites. When national or local maximum levels or limits (norms, standards of concentration or levels) of noise pollution exist in countries, this information can be important to include together with the physical data.
3.73. All available statistics on noise pollution are included in this topic. Noise pollution is
typically measured using calibrated instruments in specific spatially located stations.

Draft – Subject to revision
46
This is usually the approach used when there are policies and/or programmes of noise abatement and control in place. These monitoring stations, run by the pertinent environmental authority (national or local), typically produce primary microdata that need to be further processed to be converted into environment statistics. The resulting environment statistics datasets are produced for and are relevant to the specific local areas where the most problematic conditions of noise pollution exist. They are not representative of the national territory.
3.74. Noise pollution negatively affects the welfare and health of humans and also affects
and changes biota, particularly fauna.
3.5 Component 2: Environmental Assets and their Use <The structure in Component 2 and the description of the sub-components and topics largely follow, and are sourced from, the SEEA asset accounts. Additional content is being developed and will be added on those aspects that are important parts of environment statistics but do not belong to the scope of the SEEA asset accounts. This will also be reflected in Chapter 4 on the Core Set of Environment Statistics.> 3.75. Environmental assets are the naturally occurring living and non-living components of
the earth together comprising the biophysical environment that may provide benefits to humanity (SEEA, 2012). They include both non-cultivated and cultivated biological resources. Environmental assets can be renewable and non-renewable resources. Statistics on environmental assets aim at measuring the changes in the stocks of resources. Changes in the stocks of environmental resources include additions and reductions, from both anthropogenic and natural activities. In the case of non-renewable resources, extraction usually means the depletion of the resource. In the case of renewable resources, if extraction (abstraction, removal, harvesting) exceeds natural regeneration and man-made replenishment, the resource is depleted.
3.76. The main categories of environmental assets are mineral and energy resources; land;
soil resources; biological resources such as timber resources, aquatic resources and other biological resources; and water resources. Component 2 covers the stocks and changes of stocks of these resources as well as their use in production and consumption processes. The aforementioned groups of environmental assets correspond to the sub-components of Component 2. Under each sub-component, statistical topics cover the stocks and the use of the resource.
Draft – Subject to revision
47
3.77. Component 2 is closely linked to the physical asset accounts and to some extent to the physical flow accounts and supply and use tables of the SEEA. As far as relevant and possible, SEEA definitions and categories are used throughout the discussion of this component.
3.78. The main primary sources of these types of physical information are statistical
surveys, administrative records, field surveys and remote sensing, and the main institutional partners are the sectoral authorities in charge of providing information or regulating or managing the economic activity or resource. These may be mining, water,9 energy, agriculture or silviculture authorities. The availability of primary data sets varies from resource to resource and country by country.
11 3.79. A further disaggregation is made into five sub-components:
i. 2.1 Mineral and Energy Resources ii. 2.2 Land and Land Use
iii. 2.3 Soil Resources iv. 2.4 Biological Resources v. 2.5 Water Resources and their Use
Sub-component 2.1: Mineral and Energy Resources 3.80. Mineral and (non-renewable) energy resources are environmental assets that cannot
be renewed on any human timescale, therefore their extraction and use in the economy result in the depletion of the resources, limiting their availability for future generations.
11 Topic 2.1.1: Stocks of mineral and energy resources 3.81. Stocks of mineral and (non-renewable) energy resources are defined as the amount of
known deposits of oil resources, natural gas resources, coal and peat10 resources, non – metallic minerals and metallic minerals. Classes of known deposits include: commercially recoverable deposits; potential commercially recoverable deposits; and non-commercial and other known deposits. Main sources of statistics are geological surveys and inventories. The stocks of renewable energy resources are not measured in the FDES.
9 Refer to International Recommendations for Water Statistics (IRWS): http://unstats.un.org/unsd/envaccounting/irws/irwswebversion.pdf 10 Peat may be considered a slowly renewing biological resource and not a mineral resource, further clarification of this topic will be included in subsequent drafts
Draft – Subject to revision
48
Topic 2.1.2: Extraction and use of mineral and energy resources 3.82. Extraction of mineral and energy resources reflect the quantity of the resource
physically removed from the deposit. Main sources of statistics under this topic are statistics on mining, quarrying and energy.
3.83. Extraction of non-renewable energy resources and the use of energy in production
and consumption processes can be recorded from statistics that include: (i) Volume of non-renewable energy resources extracted; (ii) Amount of energy produced from non-renewable sources; (iii) Amount of energy produced from renewable sources; and (iv) Amount of energy used by economic activities. Energy is returned to the environment in a degraded form (dissipated heat), but measures of this process are not available for statistical purposes. Physical energy statistics and energy balances are available from national energy authorities or statistical offices on a regular basis.
3.84. The difference between the opening and closing stocks of mineral and non-renewable
energy resources are mostly the result of extraction. New discoveries, reappraisals and reclassifications of stocks as well as catastrophic losses can also influence the difference between opening and closing stocks.
Sub-component 2.2: Land and Land Use
3.85. Land is a unique environmental asset that delineates the space in which economic
activities and environmental processes take place and within which environmental assets and economic assets are located (SEEA, 2012). The total area of land of a country includes terrestrial areas as well as the land area under inland waters (rivers, lakes etc). Statistics on land use and land cover are usually obtained by the combination of field surveys and remote sensing, mostly satellite images. Land use data may also be obtained from land registers where available.
Topic 2.2.1: Land area, land use and land cover 3.86. Generally, the total area of land of a country will remain unchanged from one period
to the next. Hence, changes in the stocks of land will comprise changes within and between different classes of land (SEEA, 2012). Land can be classified according to land cover and land use. (Land cover is also discussed under Component 1)
3.87. Land use reflects both the activities undertaken and the institutional arrangements put
in place; for a given area for the purposes of economic production, or the maintenance and restoration of environmental functions. Land use categories (based on FAO classifications) are grouped under Land and Inland waters in seven and four classes,

Draft – Subject to revision
49
respectively. For land, the classification consists of the following categories: Agriculture; Forestry; Land used for Aquaculture; Built up and related land; Land used for maintenance and restoration of environmental functions; Other uses of land n.e.c.; and Land not in use. For inland water, the main categories are: Inland water used for aquaculture and holding facilities; Inland water used for the maintenance and restoration of environmental functions; Other uses of inland waters n.e.c.; and Inland waters not in use (SEEA, 2012).
3.88. Land cover refers to the observed physical and biological cover of the Earth’s surface
and includes natural vegetation and abiotic (non-living) surfaces. Land cover categories include both terrestrial land and areas of inland waters. The main categories of land cover are the following: Artificial surfaces; Herbaceous crops; Woody crops; Multiple or layered crops; Grassland; Tree covered areas; Mangroves; Shrub covered areas; Shrubs and/or herbaceous vegetation, aquatic or regularly flooded; Sparsely natural vegetated areas; Terrestrial barren land; Permanent snow and glaciers; Inland water bodies; and Coastal water bodies and inter-tidal areas (SEEA, 2012).
Topic 2.2.2: Changes in land use and land cover 3.89. Changes in land use can be reflected by statistics on changes within and between the
different land use classes. Changes in land use will redistribute the area of the country among the land use categories. If presented in a matrix form, the information will show how increase or decrease in one category contributes to the decrease or increase of other land use categories. Land cover statistics can also be presented in a similar fashion. Cross-combination of land use and land cover categories show what kind of economic activities are carried out on the different land cover areas. Changes in land use frequently result in changes of land cover; however, land under different land cover categories will also increase or decrease due to managed or natural expansion or regression. Statistics on land cover and its changes also give information about the extent of different ecosystems (see also Component 1).
Topic 2.2.3: A particular type of land: Forest and other wooded land 3.90. Changes (increase or decrease) of areas under particular land use or land cover types
can also be described, depending on the importance of certain land use or land cover categories to the countries. An example is the land under forest cover and forestry use. While changes in the area of forests are included in this sub-component, stocks and removals of timber resources are discussed under Topic 2.4.1: Timber resources and their use.

Draft – Subject to revision
50
3.91. Statistics on forest area and its changes are based on categories of the different forest types (primary forest; other naturally generated forest; planted forest; other wooded land). Forest area can also be disaggregated according to dominant tree species, age distribution, productivity, primary use of forest, areas under sustainable forest management, protected forests etc. Changes of forest area in the different categories are the result of economic activities (afforestation, deforestation), reclassifications or natural processes (expansion or regression).
3.92. Data on the biophysical characteristics of forests, forest harvesting, silviculture,
management etc., may be obtained from remote sensing, forest inventories and forestry statistics at forest management agencies or departments.
Sub-component 2.3: Soil Resources
3.93. Soil is a fundamental part of the environment. It provides the physical base to
support the production and cycling of biological resources, provides the foundation for buildings and infrastructure, is the source of nutrients and water for agriculture and forestry systems, provides a habitat for diverse organisms, plays an essential role in carbon sequestration, and fulfils a complex buffering role against environmental variability (ranging from dampening diurnal and seasonal change in temperature and water supply to the storage and binding of a range of chemical and biological agents).
3.94. Soil is more than a resource or an asset; it is an ecosystem and a buffer for a large
range of environmental flows. It is a stock of carbon. It contains most of the biodiversity of decomposers, which make life possible. Its fertility is at the same time a private good (for the farmer) and a public good (of which future generations should not be excluded).
3.95. Statistics on soil resources therefore have many dimensions. Soil resources can
provide information on the area and volume of soil resources and what is lost due to soil erosion, or made unavailable by changes in land cover (e.g., soil covered by buildings or roads) and other causes (e.g., changes in soil structure due to compaction, acidity or salinity). Soil resources can also be described in terms of their types, nutrient content, carbon content and other characteristics is relevant for more detailed examination of the health of soil systems, and the connections between soil resources and production in agriculture and forestry.
3.96. Various soil types can be defined using information on different combinations of soil
components and properties. The Harmonised World Soil Database describes 28 major soil groupings that can be used to categorise and map soils at a broad global scale.

Draft – Subject to revision
51
Various national and regional groupings of soil types may be appropriate for national and sub-national measurement.
3.97. Soil resources are measured through a series of inventory processes – known
collectively as a soil survey. Typically, a soil survey produces maps of soil types, soil suitability for various purposes, hazard and degradation potential and, in some cases, maps of specific soil properties. Other important and complementary information include site or area based measures of soil loss or erosion processes, and simulation modelling of the way in which soil types relate to various climate and land use settings.
Topic 2.3.1: Area and change of area of soil resources 3.98. Soil resources and their changes can be described in terms of the area occupied by
different soil types. Changes in the area of soil types can be attributed to changes in land cover and land use, changes in soil quality and other changes in the soil environment, reflecting whether the primary reasons of the changes are environmental, economic or social in nature.
Topic 2.3.2: Volume and change of volume of soil resources 3.99. Statistics on changing volumes (cubic metres) of soil may enable assessment of the
extent of erosion and the impact of major disasters such as flooding or drought, as well as providing information relevant to the assessment of soil depletion, i.e., the loss of soil resources due to economic activity. Different types of soil resources may increase through soil formation and decrease by erosion, extraction (excavation) and catastrophic losses.
Topic 2.3.3: Soil resources as biological systems 3.100. Another aspect describing soil resources considers the individual elements in the soil,
for instance carbon or soil nutrients (Nitrogen, Phosphorus and Potassium). Nutrient balances look at the stocks of individual components in the soil, their uptake by vegetation and replenishment by natural processes and human activities, indicating the sustainability of biological capacities of the soil. It should be noted that these physical statistics are rather scarce in most countries.
Sub-component 2.4: Biological Resources
3.101. Biological resources include timber resources, aquatic resources and other biological
resources provided by natural or cultivated flora and fauna. Biological resources form an important part of biodiversity and ecosystems. Biological resources are renewable resources that are capable of regeneration through natural (non-managed or managed)

Draft – Subject to revision
52
processes. If harvesting and other losses surpass natural or managed regeneration or replenishment, biological resources are depleted.
Topic 2.4.1: Timber resources and their use 3.102. Timber resources are important environmental assets in many countries. They
provide inputs for construction and the production of paper and other products, they are a source of fuel and they are an important sink for carbon. Timber resources are defined by the volume of trees, living or dead, and include all trees regardless of diameter, tops of stems, large branches and dead trees lying on the ground that can still be used for timber or fuel. Timber resources include both natural and cultivated resources. The general principle that should be considered in determining the volume of timber resources is the volume that is commercially usable.
3.103. Stocks of timber resources increase due to natural growth, measured as the gross
annual increment and decrease due to removals of timber, natural losses and catastrophic losses. Timber resources may also change due to the increase of forest land, or changes in management practices (reclassification). The volume of removals of timber can be also disaggregated according to the type of forestry product (e.g., industrial roundwood, fuelwood), by tree species etc.
Topic 2.4.2: Aquatic resources and their use 3.104. Aquatic resources include fish, crustaceans, molluscs, shellfish and other aquatic
organisms such as sponges and seaweed, as well as aquatic mammals such as whales. Aquatic resources are subject to harvest for commercial reasons as well as part of recreational and subsistence fishing activities. The abundance and health of natural aquatic resources in inland and marine waters are also increasingly affected by water pollution and by the degradation of habitats. The dual impacts of excessive exploitation levels and habitat degradation result in the loss, or reduction, of the goods and services provided by the aquatic ecosystems and a loss of biodiversity and genetic resources.
3.105. The aquatic resources for a given country comprise those resources that are
considered to live within the Exclusive Economic Zone (EEZ) of a country throughout their lifecycles, both coastal and inland fisheries. Migrating and straddling fish stocks are considered to belong to a given country during the period when those stocks inhabit its EEZ.
3.106. Aquatic resources may be either cultivated or natural biological resources. Aquatic
resources produced within aquaculture facilities (for breeding or for harvest) are

Draft – Subject to revision
53
considered cultivated biological resources. All other aquatic resources harvested as part of capture production processes are considered natural biological resources.
3.107. Changes in the stocks of aquatic resources are the result of growth in stocks, gross
catch/harvest, natural and catastrophic losses. Stock changes should be estimated separately for: natural and cultivated resources; the most important aquatic groups/species; and marine and freshwater groups/species.
3.108. There are a set of other terms established by FAO for the different stages of the catch,
depending on the inclusion of exclusion of pre-catch losses and discarded catch. The measurement of discarded catch is an important component in fully understanding the linkages between economic activity and the impact on aquatic resources.
Topic 2.4.3: Other biological resources and their use 3.109. This topic is one of the most critically important, as the biological resources
contained in this topic form the basis of food production in all countries. The term “other biological resources” refers to cultivated animals and plants including livestock, annual crops such as wheat and rice, and perennial crops such as rubber plantations, orchards and vineyards.
3.110. While the vast majority of other biological resources are cultivated, there is a range of
natural biological resources that provide inputs to the economy and also form an important part of local biodiversity. These resources may include wild berries, fungi, bacteria, fruits and other plant resources that are harvested, as well as wild animals that are killed for sale or consumption.
3.111. Physical statistics relating to the production and accumulation of other cultivated
biological resources are part of agricultural statistics. Information on other natural biological resources is scarce, usually coming from scientific sources, field surveys and statistics on hunting and gathering.
Sub-component 2.5: Water Resources and their Use
Topic 2.5.1: Water resources 3.112. Water resources consist of fresh and brackish water in inland water bodies including
surface water, groundwater and soil water, regardless of their quality. Surface water includes water in artificial reservoirs, lakes, rivers and streams, snow, ice and glaciers. Renewable water resources of a country are generated by precipitation and inflows of

Draft – Subject to revision
54
water from other countries and reduced by evaporation, evapotranspiration and outflows to other countries or to the sea.
3.113. Statistics on water resources are sourced from hydrological and hydrometeorological
measurements and models. Statistics on the quality of water in water bodies are discussed under Component 1.
Topic 2.5.2: Abstraction and use of water 3.114. Water is abstracted from surface and groundwater resources by economic activities
and households. Water can be abstracted for own use or for distribution to other users. Statistics on water abstraction should be disaggregated according to the source of the water (surface or groundwater) and the economic activity of the abstractor. Statistics on water abstraction are usually available from administrative records (monitoring of actual water abstractions as well as abstraction permits).
3.115. After abstraction (and distribution) water is used in the economy in production and
consumption activities. There might be significant amounts of water losses during distribution. Water can be recycled and reused several times before returning it to the environment. Water use should be disaggregated according to economic activity and household use. The most significant water uses (irrigation in agriculture, hydro power generation and cooling) should be specified. Statistics on water use can be obtained from statistical surveys of the economic units, household surveys and administrative records of the water supply industry.
Topic 2.5.3: Returns of water 3.116. A large part of the water used in economic activities is returned to the environment
after or without treatment. The volume of returned water should be disaggregated according to the recipient (surface water, groundwater, soil, sea). Statistics on the treatment and pollutant content of wastewater are discussed under Component 3: Emissions, Residuals and Waste.
3.6 Component 3: Emissions, Residuals and Waste 3.117. This component contains statistical information on the volume and characteristics of
residuals generated by human production and consumption processes, on their management, and on their final release to the environment.
3.118. Emissions of pollutants, residuals and waste can have different impacts and effects on
human and ecosystem health. They will be absorbed, or will persist and concentrate
Draft – Subject to revision
55
differently, depending on their own nature and a combination of local environmental dynamics (wind, currents, as well as characteristics of land, air and water masses, etc.). Sometimes the substances are released or disposed of with little or no treatment, but increasingly, emissions are treated to decrease pollution before they are released into the environment. These treatment and management processes and their infrastructure are also contained in this component.
3.119. The subsequent concentrations of these residuals and pollutants in the different media
are covered in Component 1, Sub-component 1.3: Environmental Quality. 3.120. This component provides statistical information consistent with the “Pressure” and
“Response” categories of the DPSIR model. It also provides information for physical flow (emission and waste) accounts of the SEEA.
3.121. A further disaggregation is made into three sub-components:
i. 3.1 Emissions to Air ii. 3.2 Generation, Management and Discharge of Wastewater and Emissions to
Water iii. 3.3 Generation, Management and Disposal of Solid Waste
Sub-component 3.1: Emissions to Air
3.122. Air pollution can be caused by natural as well as anthropogenic sources. In the FDES
the focus is on the emission of pollutants from socio-economic processes. Emissions to air are gaseous and particulate substances released to the atmosphere by establishments and households as a result of production, consumption and accumulation activities (SEEA, 2012). The statistical description of such emissions covers their sources and the quantities emitted.
Topic 3.1.1: Emissions to air 3.123. Air emissions can be measured directly, or can be estimated on the basis of fuel and
other material input data and process-specific emission factors. This information is usually produced in the form of emission inventories, available primarily from environmental ministries or environment protection authorities. Emissions to air can be distinguished by the type of source (stationary or mobile, point or diffuse), by process, by economic activity and the availability of cleaning.
3.124. The groups of different chemicals relevant to statistics on emissions to air include:
sulphur compounds; oxidized nitrogen compounds and oxidants; reduced nitrogen compounds; inorganic carbon compounds; halogen and inorganic halogen compounds;
Draft – Subject to revision
56
volatile organic compounds; heavy metals; and different fractions of suspended particulate matter (SPM).
3.125. A special category of air emissions is the emissions of GHGs. Emission inventories
of GHGs are compiled according to the guidelines developed by the Intergovernmental Panel for Climate Change, under the auspices of the United Nations Framework Convention on Climate Change. The source categories of GHG emissions are based on processes and the categories of sinks for GHG emissions are also included.
3.126. Another important category is ODSs, controlled by the Montreal Protocol. However,
as emissions of these substances are difficult to measure or estimate, countries report on the apparent consumption of ODS.
Sub-component 3.2: Generation, Management and Discharge of Wastewater and Emissions to Water
3.127. The type of statistical source used is administrative registers and in some cases
estimation outputs. Countries usually report their wastewater and emissions to water based on primary statistics from the final treatment or collecting institution(s), or when no treatment of wastewater is in place, by estimating from the water used by different sectors (i.e., household, industries) using technical coefficients. Data availability in this field varies from country to country. The main institutional partner will be the water authorities or institutions in charge of water provision, collection, treatment and or final discharge to the environment (water regulating bodies, water authorities, municipalities, water utilities, etc).
Topic 3.2.1: Generation of wastewater 3.128. This includes statistics describing the volume of wastewater generated after the use of
water by economic activities and households, before any collection or treatment is applied. Generation of wastewater is usually estimated on the basis of the volume of water used. The wastewater generated can be discharged directly to the environment by the generator or it can be collected in sewerage systems and treated in wastewater treatment plants. Wastewater generation can be disaggregated by economic activity and households where statistics permit.
Topic 3.2.2: Collection and treatment of wastewater 3.129. This topic includes statistics describing: (i) the volumes of collected and transported
wastewater to their final place of discharge or to treatment facilities; (ii) the volume of wastewater treated by type of treatment (primary, secondary and tertiary; (iii) the

Draft – Subject to revision
57
physical infrastructure related to wastewater collection and treatment (number of plants, length of sewer lines, capacities of plants and sewer lines, etc); and (iv) other relevant information.
Topic 3.2.3: Discharge of wastewater to the environment 3.130. This topic captures information at the stage of final discharge of wastewater to the
environment. It includes: (i) volume of wastewater discharged to the environment without treatment; and (ii) volume of wastewater discharged to the environment, by type of treatment (primary, secondary, tertiary) and type of the facility (public, private, municipal, industrial). Statistics on the volume of wastewater discharged after treatment can be obtained from the administrative records of the treatment plants. Statistics on the volume of wastewater released without treatment can be obtained from economic units and records of sewerage companies, or estimated on the basis of water use. The volume of discharged wastewater should also be disaggregated according to the recipient water body.
Topic 3.2.4: Emissions to water 3.131. In addition to the volume of wastewater returned to the environment, it is also
important to measure or estimate the volumes of different pollutants that are emitted with the wastewater (the quality of wastewater) or otherwise released to water bodies (diffuse sources). Emissions to water are the substances released to water resources by establishments and households as a result of production, consumption and accumulation processes (SEEA, 2012). Emissions to water should be disaggregated according to the releasing economic activities and should cover the most important substances.
Sub-component 3.3: Generation, Management and Disposal of Solid Waste
3.132. Solid waste covers discarded materials that are no longer required by the owner or
user. Statistics on solid waste include the amount of waste generated by waste type and by source, as well as the amount of waste collected, treated, and disposed.
Topic 3.3.1: Generation of solid waste 3.133. This topic includes statistics describing the volume of solid waste generated, by waste
type, economic activity and households, if available, before any collection or treatment is applied. The waste lists used by countries and international organizations are usually based on the material content of the waste, or on the combination of material content and the generating process. Hazardous waste is a special group of waste that due to its toxic or other hazardous character needs special management (collection, transportation, treatment and disposal).
Draft – Subject to revision
58
Topic 3.3.2: Management of solid waste 3.134. This topic includes statistics describing: (i) the amount of solid waste collected and
transported to treatment facilities or to their final disposal; (ii) the amount of solid waste recycled or reused, by selected waste types/streams; (iii) the amount of solid waste treated, by type of treatment (e.g., recycling, incineration, composting, etc); (iv) the amount of solid waste disposed; (v) the physical infrastructure for waste treatment, including the number and capacity of treatment plants; and (vi) other relevant information.
3.7 Component 4: Environmental Impact <An explanation is to be developed for why only impacts on humans are considered under this component> <Additional sub-components and topics are being developed for Component 4> 3.135. This component organizes information regarding the main impacts of the changing
environment on human society’s wellbeing, infrastructure and health. The structure includes two main sub-components. The first sub-component organizes statistics on the frequency and intensity of disasters and extreme events deriving from natural phenomena, their impact on human lives and settlements as well as their impact on the environment as a whole. The second sub-component groups information on environmentally related health problems.
3.136. The contents of this component are closely related to the “Impact” category in the
DPSIR model, and they are not covered by the SEEA framework. 3.137. Two sub-components have been identified for this component:
i. 4.1 Natural Disasters and Extreme Events; and ii. 4.2 Impacts on Human Health and Well-being.
Sub-component 4.1: Natural Disasters and Extreme Events 3.138. This sub-component structures information on the frequency and intensity of disasters
deriving from natural phenomena, as well as their impact on human lives and settlements and the environment as a whole.
Draft – Subject to revision
59
3.139. In general, a disaster can be described as an “unforeseen and often sudden event that causes great damage, destruction and human suffering” (CRED EM-DAT, 2009).11 It is often an event that surpasses local capacities to respond to it and requires national or international, external assistance. 5
3.140. Extreme events and natural disasters impact human lives, settlements and ecosystems
in different ways, depending on the intensity of the natural disaster, but also on the vulnerability conditions prevailing in the territories, particularly those where humans live. Thus, the effects and impacts of natural disasters can be worsened or mitigated by the general social, living and infrastructural conditions of a given human settlement.
3.141. There is now sufficient evidence to show that climate change has been associated
with the increasing frequency and severity of extreme weather events. Climate change has resulted in increased global temperatures, rising sea levels, increased storms and precipitation, droughts, tropical cyclones, hurricanes, tornadoes and other climatic disruptions in many places around the world.
3.142. In recent decades, because of an increase in extreme weather events, natural disasters
have become more frequent, more intensive, and also more destructive and more deadly. As the occurrence and intensity of extreme events and natural disasters have increased globally, countries have faced increasing social and economic impacts. While all nations are vulnerable to disasters, developing countries and Small Island Developing States (SIDS) are viewed to be especially vulnerable. This is in part due to the pervasiveness of poor quality housing and to the fact that rapid, deregulated urbanization has resulted in the increased use of inappropriate terrain where humans have been forced to build vulnerable human settlements. Other environmental drivers have included the rapid loss of vegetation cover and the degradation of an ecosystem’s integrity near to these settlements or in upstream river basins.
3.143. As a result, the provision of statistical information on the frequency and impact of
extreme events and disasters can be important for guiding policy-making and programmatic action.
3.144. The information structured in this component will take account of the occurrence of
the different types of events, information on their impact, including people affected (that is people killed, injured, homeless and affected), calls for international assistance and the
11 Definition of EM-DAT. The WHO Collaborating Centre for Research on the Epidemiology of Disasters (CRED) has been maintaining an international Emergency Events Database EM-DAT. EM-DAT was created in 1988 and it contains world data on natural disasters from 1900.
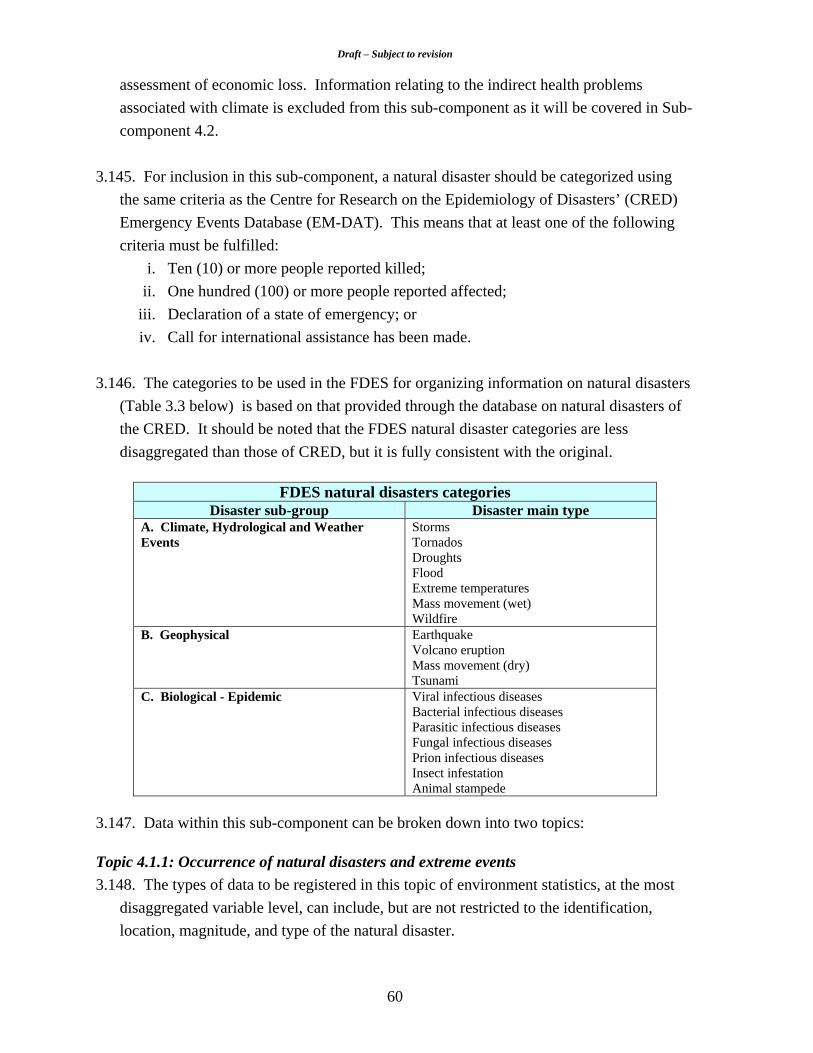
Draft – Subject to revision
60
assessment of economic loss. Information relating to the indirect health problems associated with climate is excluded from this sub-component as it will be covered in Sub-component 4.2.
3.145. For inclusion in this sub-component, a natural disaster should be categorized using
the same criteria as the Centre for Research on the Epidemiology of Disasters’ (CRED) Emergency Events Database (EM-DAT). This means that at least one of the following criteria must be fulfilled:
i. Ten (10) or more people reported killed; ii. One hundred (100) or more people reported affected;
iii. Declaration of a state of emergency; or iv. Call for international assistance has been made.
3.146. The categories to be used in the FDES for organizing information on natural disasters
(Table 3.3 below) is based on that provided through the database on natural disasters of the CRED. It should be noted that the FDES natural disaster categories are less disaggregated than those of CRED, but it is fully consistent with the original.
FDES natural disasters categories
Disaster sub-group Disaster main type A. Climate, Hydrological and Weather Events
Storms Tornados Droughts Flood Extreme temperatures Mass movement (wet) Wildfire
B. Geophysical
Earthquake Volcano eruption Mass movement (dry) Tsunami
C. Biological - Epidemic Viral infectious diseases Bacterial infectious diseases Parasitic infectious diseases Fungal infectious diseases Prion infectious diseases Insect infestation Animal stampede
3.147. Data within this sub-component can be broken down into two topics:
Topic 4.1.1: Occurrence of natural disasters and extreme events 3.148. The types of data to be registered in this topic of environment statistics, at the most
disaggregated variable level, can include, but are not restricted to the identification, location, magnitude, and type of the natural disaster.

Draft – Subject to revision
61
Topic 4.1.2: Impact of natural disasters and extreme events 3.149. This topic should also include information on the impact of a natural disaster or
extreme event. Impact can be measured in a number of ways. Common dimensions include the number of people killed, injured, homeless and affected, as well as economic loss.
Sub-component 4.2: Impacts on Human Health and Well-being 3.150. The impacts of changes in environmental conditions on human health are many and
vary from country to country. The World Health Organization (WHO) is the leading global institution documenting the relationship between health and the environment. Notably, critical global statistics are set out through WHO’s presentation, “10 facts on preventing disease through healthy environments”.126
3.151. The main partner and source of primary data sets on incidence, morbidity and
mortality of these diseases and conditions is usually the sanitary or health authority in the country. Epidemiological data has a long-standing tradition of producing official statistics on the health of the population and the newer field of environmental health is rapidly developing in most countries. The primary data sets can therefore be selected and further processed for transformation into the environmental health statistics that constitute this sub-component. The resulting health statistics related to environmental conditions will usually be produced for the national and sub-national levels and will necessarily include descriptive epidemiological data sets that can usually be updated on a yearly basis.
3.152. On the other hand, there are other statistics, which consist of estimations of the
impact of such public health diseases and conditions on the social and economic spheres, which are not usually produced so systematically and have the characteristic of being studies. Caution must be exercised when producing these types of environmental health statistics because health and environmental problems are multi-faceted and it may be difficult to establish causality between one health problem and specific environmental conditions. Certain epidemiological studies do establish relationships among the environmental and health variables through the use of statistical techniques.
3.153. This sub-component can be disaggregated to the following four topics:
12 http://www.who.int/features/factfiles/environmental_health/en/

Draft – Subject to revision
62
Topic 4.2.1: Airborne diseases and conditions 3.154. This topic includes all airborne diseases and conditions that are caused or worsened
by exposure to unhealthy levels of pollutants (such as respirable PM, SO2 or O3), usually found in urban settlements. Airborne diseases and conditions include, but are not limited to, upper and lower respiratory disease, obstructive pulmonary disease, asthma and allergic rhinitis. Data will be produced as descriptive statistics, including incidence, morbidity and mortality. Also, when available, estimations of the loss of work days and estimation of the economic cost in monetary terms (for example, loss of wages or costs of treatment) can be organized here. 7
3.155. According to the WHO,13 “worldwide it is estimated that 1.3 million people -- more
than half of them in developing countries -- die every year from urban outdoor air pollution”. WHO further elaborates that “air pollution can affect our health in many ways with both long and short term effects. Urban outdoor air pollution increases the risk of acute (e.g., pneumonia) and chronic (e.g., lung cancer) respiratory disease as well as cardiovascular disease. Different groups of individuals are affected by air pollution in different ways. More severe health impacts are seen among those people who are already ill. In addition, more vulnerable populations like children, the elderly and those households with lower incomes and limited access to health care are more susceptible to the adverse effects from exposure to air pollution” (WHO, 2010).
Topic 4.2.2: Water-related diseases 3.156. This topic includes all water-related diseases and conditions that result from micro-
organisms in the water humans drink as defined by the WHO. Water-related diseases and conditions include, but are not limited to, diarrhoeal disease, gastroenteritis and water borne parasite infections. Data including on incidence, morbidity and mortality rates, will be produced as descriptive statistics for this topic. Also, when available, estimations of the loss of work days and of the economic cost in monetary terms (for example, loss of wages or costs of treatment) can be organized here.
8 3.157. As stated by the WHO,14 “poor water quality continues to pose a major threat to
human health. Diarrhoeal disease alone amounts to an estimated 4.1 percent of the total DAILY global burden of disease and is responsible for the deaths of 1.8 million people every year (WHO, 2004). It was estimated that 88 percent of that burden is attributable to unsafe water supply, sanitation and hygiene and is mostly concentrated in children in developing countries. A significant amount of disease could be prevented, especially in
13 WHO, 2010: http://www.who.int/topics/environmental_health/en/ 14 WHO, 2004. http://www.who.int/water_sanitation_health/diseases/burden/en/index.html
Draft – Subject to revision
63
developing countries, through better access to safe water supply, adequate sanitation facilities and better hygiene practices.” (WHO, 2004)
Topic 4.2.3: Vector borne diseases 3.158. This topic includes vector borne diseases that are transmitted by vectors (insects and
arachnids) that carry viruses, bacteria, protozoa and other pathogens, as defined by the WHO. Vector borne diseases and conditions include, but are not limited to, malaria, dengue fever, yellow fever and Lyme disease.
3.159. The incidence of some environmentally-related vector borne diseases is on the rise
(WHO, 2009). This has been associated with climate change15 and natural disasters which can create or amplify the environmental conditions that cause the rapid spread of these vectors. 9
Topic 4.2.4: Health problems associated with excessive UV radiation exposure 3.160. This topic includes statistics on morbidity and mortality from skin cancer and also the
incidence and treatment of cataracts, if possible associated with excessive UV radiation exposure, either from the sun or from artificial sources such as tanning booths. It is very relevant, particularly in countries and zones where the atmospheric ozone layer is thinner or severely reduced, or where the practice of artificial tanning is very popular. Unfortunately, the availability of primary data for these statistics is very limited in most countries.
3.161. Global evidence presented by WHO16 describes the health problems derived from
excessive UV radiation exposure. Skin cancer is caused primarily by exposure to UV radiation – either from the sun or from artificial sources such as sunbeds. Globally in 2000, over 200,000 cases of melanoma were diagnosed and there were 65,000 melanoma-associated deaths. Excessive sun exposure in children and adolescents is likely to contribute to skin cancer in later life. Worldwide, approximately 18 million people are blind as a result of cataracts, of these 5 percent of all cataract related disease burden is directly attributable to UV radiation exposure. (WHO, 2009) 10
Topic 4.2.5: Toxic substance related diseases and conditions 3.162. This topic includes diseases and conditions associated with exposure to toxic
substances, residuals and/or waste that result from localized emissions. The toxic
15 “Climate and weather already exert strong influences on health: increased deaths in heat waves and in natural disasters such as floods, as well as changing patterns of life-threatening vector-borne diseases such as malaria and other existing and emerging infectious diseases are observed. Continuing climate change will affect, in profoundly adverse ways, some of the most fundamental determinants of health: food, air and water, according to WHO Director-General Dr Margaret Chan. Areas with weak health infrastructure – mostly in developing countries - will be the least able to cope without assistance to prepare and respond.” WHO, http://www.who.int/features/factfiles/climate_change/en/index.html. 16 WHO, http://www.who.int/mediacentre/factsheets/fs305/en/.

Draft – Subject to revision
64
substances in question include toxic pesticides (i.e., pesticides that have teratogenic, carcinogenic and/or mutagenic effects), and toxic industrial chemicals (e.g., lead, arsenic, mercury and nickel, among others). Toxic substance related diseases and health problems include, but are not limited to, chronic illnesses of the respiratory system (such as pneumonia, upper respiratory diseases, asthma and chronic obstructive pulmonary diseases), infertility, and congenital anomalies or malformations.
3.163. The exposure to toxic substances is usually the result of poor environmental
management in production practices and waste management, and lack of information by stakeholders. The resulting diseases and conditions organized under this topic can be caused by exposure to the toxins through different or undetermined media such as air, water, food, soil or a combination of these elements. In this respect, the resulting health problems in this topic cannot be categorized as primarily or solely attributable to air or water borne diseases. Unfortunately, the availability of primary data for these statistics is very limited in most countries.
3.8 Component 5: Environment Protection and Management 3.164. This component organizes information on the human activities to protect, regulate
and manage various environmental issues and concerns, with the aim of improving the environment and maintaining the health of ecosystems.
3.165. A country’s engagement in the protection and management of the environment, and
therefore the amount of resources it dedicates to the task, is related to public demand and also to the country’s ability to finance environment protection activities and international efforts directed at these activities. International stewardship, national political will, civil society participation and effective policies and programmes each have a role to play in mutually reinforcing each other.
3.166. Protection and management of the environment covers a wide variety of actions that
are affected by culture, information and policies. These include expenditure on environment protection and management, governance, enforcement of regulations, environmental education as well as individual and community activities aimed at diminishing environmental impacts and improving the quality of local environments.
3.167. This component provides information to the “Response” category of the DPSIR
model, but the heterogeneity described above poses considerable challenges when quantifying information on the responses of humans in protecting and managing their environment more responsibly.
Draft – Subject to revision
65
3.168. Three sub-components have been identified for this component:
i. 5.1 Environment Protection and Management Expenditure; ii. 5.2 Environmental Governance, Regulation and Engagement; and
iii. 5.3 Environmental Information, Education and Perception.
Sub-component 5.1: Environment Protection and Management Expenditure 3.169. The economic activities whose primary purpose is to reduce or eliminate pressures on
the environment (environment protection activities) or to make more efficient use of natural resources (resource management activities) are called Environmental Activities.
3.170. Environment protection activities are those activities whose primary purpose is the
prevention, reduction and elimination of pollution and other forms of degradation of the environment. These activities include, but are not limited to, the prevention, reduction or treatment of waste and wastewater; the prevention, reduction or elimination of air emissions; the treatment and disposal of contaminated soil and groundwater; the prevention or reduction of noise and vibration levels; the protection of biodiversity and landscapes, including their ecological functions; monitoring of the quality of the natural environment (air, water, soil, groundwater); research and development on environment protection; and the general administration, training and teaching activities oriented towards environment protection.
3.171. Resource management activities are those activities whose primary purpose is
preserving and maintaining the stock of natural resources and hence safeguarding against depletion. These activities include, but are not limited to, reducing the withdrawals of natural resources (including through the recovery, reuse, recycling, and substitution of natural resources); restoring natural resource stocks (increases or recharges of natural resource stocks); the general management of natural resources (including monitoring, control, surveillance and data collection); and the production of goods and services used to manage or conserve natural resources.
3.172. In addition to classifying environment protection and management expenditures
according to their purpose, an important distinction that needs to be made is between the bearers of the expenditures. The bearer can be the general government (public expenditure); corporations (both those engaging in the production of environmental goods and services and others); non-profit institutions and households.

Draft – Subject to revision
66
Topic 5.1.1: Government environment protection and management expenditure 3.173. Government (local, regional and central) expenditure to protect the environment is
usually calculated by identifying and aggregating the expenditures considered to be primarily for environment protection purposes. These expenditures can be found by examining official government finance statistics found in government budgets and/or administrative reports on actual government expenditure incurred. .
3.174. The main institutional partners are the official institutions in charge of reporting
government expenditure (i.e., internal revenue services) and the national and sub-national level institutions (i.e., municipalities). The resulting statistics will usually be of national scale, and can sometimes be disaggregated by functional governmental entities or by governmental levels (national, local). The national accounts and the government finance statistics are typically the divisions in the statistical institutes that need to be involved when developing these figures. These statistics are expressed in monetary units, typically with annual periodicity, depending on the availability of resources. Therefore, an increasing number of countries can engage in estimating public environment protection expenditure.
Topic 5.1.2: Corporate, non-profit institution and household environment protection and management expenditure 3.175. Environment protection expenditure statistics for corporations, non-profit institutions
and households usually requires the use of specific surveys of establishments in different sectors and industries. Therefore, key elements that affect the quality of statistics being produced through this type of source include the existence of updated and precise establishment registers, sampling procedures and questionnaire quality. The technical capacity of individual establishments to respond adequately to environmental management questions is also an important factor.
Sub-component 5.2: Environmental Governance, Regulation and Engagement 3.176. Sustaining and protecting the environment requires the participation of stakeholders
as well as strong engagement of the public. Successful national environmental governance requires institutional strength, as well as regulatory capabilities. Therefore, this sub-component includes the setting of standards and norms, the provision of adequate resources and ensuring the capability for enforcement of those standards and norms. Additionally, a nation’s participation in MEAs and global environmental conventions are also included in this sub-component as a way of describing national participation in the global commitment to protect the environment.

Draft – Subject to revision
67
3.177. Stakeholders need to be made aware of and must sometimes also be given incentives to comply with norms and standards. Sector or industry-based voluntary agreements would also be included in this section. However, it is also critical that they are encouraged to voluntarily accept changes in production and consumption behaviour in order to protect the environment and use it in a sustainable manner. In this respect, information, education and perception elements are also included in this sub-component.
3.178. The following topics and sub-topics illustrate a practical structuring of these types of
environment statistics.
Topic 5.2.1: Institutional strength 3.179. This topic can include but is not restricted to the characterization of: (i)
environmental institutional extent and strength (i.e., existing infrastructure, dedicated budget and staff); (ii) environmental licensing systems (existence of a system and magnitude of operations); and (iii) enforcement capabilities (i.e., existing infrastructure, dedicated budget and staff).
3.180. The main institutional partners here include the environmental authority, national
revenue services and other environmentally relevant authorities, along with other possible institutions where environmental regulations are enforced (i.e., local governments or sectoral authorities). The information to be produced for this topic should be mainly descriptive, but can also include monetary statistics on budgets. It is usually compiled at the national level but should also cover regional authorities.
Topic 5.2.2: Environmental regulation and instruments 3.181. This topic can include but is not restricted to the characterization of: (i) direct
regulation instruments (e.g., environmental quality norms/standards for air, water, land, soil, ocean and for productive activities in particular, energy efficiency and renewability programmes, among others); (ii) application of economic instruments (e.g., green taxes, green subsidies, labelling, certification, etc); and (iii) voluntary agreements for environment protection and eco-efficiency (e.g., cleaner production for a corporation, energy efficient voluntary agreements).
3.182. The main institutional partners in this case include the environmental authority,
national revenue services and other environmentally relevant authorities, along with other possible institutions where environmental regulations are enforced (i.e., local governments or sectoral authorities). Information to be produced for this topic should be mainly descriptive, but can also include monetary statistics on budgets. It is usually constructed at the national level.
Draft – Subject to revision
68
Topic 5.2.3: Participation in MEAs and environmental conventions 3.183. Under this topic, countries may wish to list their participation in the different MEAs
and other global environmental conventions. 3.184. The main institutional partners in this case include the environmental authority, along
with other possible institutions in charge of MEAs or environmental conventions. The information to be produced in this topic is mainly descriptive. It is usually compiled at the national level.
Sub-component 5.3: Environmental Information, Education and Perception 3.185. The statistics describing the production and availability of information, education and
public awareness about the environmental situation in the country are included in this sub-component.
3.186. Information dissemination, outreach and education, as well as measuring the public
perceptions on environmental issues and policies are all necessary, although not sufficient elements to forge environmentally sustainable options. As information and awareness increases in a society, more pro-environmental behaviour and choices are expected from individuals and groups. Informed consumers and organized citizens have been able to change environmental and social practices in some industries, provided that there are reasonable alternatives and that the incentives are put in the right place.
3.187. The statistical topics included here are at an emerging stage in general, although
important good practices and know-how have been accumulated by different countries. Because of the method of production, sources and institutional partners in each of the following sets of environment statistics differs, the following disaggregation is proposed for the statistical topics:
Topic 5.3.1: Environmental information 3.188. The topic of environmental information can include but is not restricted to the
characterization of the: (i) environmental information system (e.g., existence, dedicated resources and staff, products, user statistics); and (ii) environment statistics programme within national statistical systems (e.g., existence, dedicated resources and staff, products, user statistics, inter-institutional collaboration mechanism).
3.189. Measuring and constructing statistics on information production and use is not very
difficult, once a methodology is established and the updating of the information is done on a comparable basis. Figuring out which institution is responsible for producing which types of information can be helpful in identifying areas of overlapping responsibility or

Draft – Subject to revision
69
efforts, information gaps or potential focus for efficiency gains. Quantitative and descriptive information such as the structure and details of environment statistics programmes within NSOs and including their mandates, resources and dedicated staff, has been increasingly examined. These efforts have formed part of global and regional efforts to strengthen this emerging field within official statistics offices and have been applicable at both the national and sub-national levels. It is also important to place the role of the NSOs into the wider picture of the institutions involved in producing environmental information.
3.190. The main institutional partners in this instance include the environmental authority
and the NSO, along with other possible institutions where environmental reports containing statistics and indicators are produced. Information to be produced in this topic is mainly descriptive but can also include monetary statistics on budgets. It is usually compiled at the national level.
Topic 5.3.2: Environmental education and awareness 3.191. The environmental education and awareness topic can include but is not restricted to
the characterization of environmental education programmes, the specific actions associated with them and the results they achieve.
3.192. Constructing statistics on environmental education programmes is considerably more
challenging from the methodological stand point. There is typically some information available on curricula, numbers of students, graduates and hours of courses but it can prove hard to convert this information into systematic statistics in most countries, mostly for lack of metadata but also because of comparability problems.
3.193. The main institutional partners in this case include the ministry of education and the
NSO, along with other possible institutions, like universities and schools, where curricula on environmental education are developed and delivered. The information to be produced for this topic is mainly descriptive, but can also include monetary data on resources spent. It is usually compiled at the national and sub-national levels.
Topic 5.3.3: Environmental perception 3.194. Information on environmental perceptions can include both the public and a specific
group´s level and type of knowledge, attitudes, behaviour and perceptions on environmental issues and policies, as measured by regular surveys.
3.195. Increasingly, countries and international polling companies have been surveying the
public to measure environmental knowledge, attitudes and reported behaviour. As a

Draft – Subject to revision
70
consequence some of the statistical results in this field, when they are available and considered to be reliable, can be included in this component. These statistics reflect public perceptions of different aspects of the environment. This body of information has been developing rapidly around the world. However, methodological challenges remain; particularly regarding reliable and valid questionnaires. Additionally, international comparability in this area is weak. Nevertheless, these statistics can prove to be useful at the local level.
3.196. The main institutional partners in this case include the environmental authority and
the NSO, along with other possible institutions where environmental perception surveys could be carried out (e.g., local governments). These statistics are produced through surveys designed for data collection on this topic. Statistics belonging to this topic are mainly descriptive, and are usually compiled at the local (sub-national) level. Ideally they are generated on an annual basis.

Draft – Subject to revision
71
Chapter 4: The Core Set of Environment Statistics <To include intro paragraph on purpose and structure of chapter.> <Current Chapter 4 is to be considered as background as it is still under development; this section, particularly the identification of the Core Set, is subject to extensive expert consultation and revision.>
4.1 What is the Core Set of Environment Statistics 4.1. The Core Set of Environment Statistics proposes a minimum set of environmental
information that can be used for analysis and reporting on the environment. 4.2. The Core Set aims at providing guidance to countries that are in the early stages of
developing official environmental information and statistics programmes. As such, it is recommended as a technical reference depicting the basic set of statistics about the environment that are relevant and useful. Each country can and should adapt and complement the Core Set with environment statistics according to its own circumstances and reporting needs. Therefore, compiling and reporting on the Core Set is not mandatory for countries.
4.3. However, the Core Set, together with nationally relevant additional environment
statistics can furnish appropriate and adequate means for describing the environment when responding to reporting and policy needs or public information requirements for a given country or territory. Because it represents a broad consensus of opinion on the applicability of these statistics, it also fosters coordination and harmonization of environment statistics at the national, regional and international levels.
4.4. The Core Set is organized according to the structure of the FDES that is outlined in
Chapter 3. The Core Set proposes a basic, or minimum, set of environment statistics for each topic that effectively describe a specific portion of the environment. As a whole, the statistics contained in the Core Set provide a schema that contains quantitative as well as descriptive elements that can be used for data collection and reporting on the environment at different levels.
4.5. The Core Set does not constitute an exhaustive collection of environment statistics. It
gives guidance for prioritizing data collection for environment statistics and has been designed to be methodologically sound and easily understood.
Draft – Subject to revision
72
4.2 The need for the Core Set of Environment Statistics 4.6. The FDES 1984 consists of statistical topics which describe those aspects of
environmental concerns which can, at least theoretically, be subjected to statistical assessment. The determination of statistical topics constitutes an important step towards the identification of relevant statistics required for each topic. The FDES 1984 does not specify statistics, indicators, classifications, tabulations or methods of data collection. These were later elaborated in two accompanying technical reports on environment statistics.17,18 11,12
4.7. Since the FDES and its technical reports were published there has been a plethora of
different indicator lists proposed or developed by international, regional and inter-governmental organizations in response to policy demands and data reporting requirements stemming from MEAs and global environmental conventions, including the UNSD List of Environmental Indicators that was adopted by the Statistical Commission in 1995.
4.8. It was therefore recommended by the Expert Group Meeting (EGM) in New York in
2009, and further approved by the Statistical Commission in 2010 as part of the programme of work, that UNSD develop, in parallel to the revision of the UN FDES, a core set of environment statistics to support the development of environmental indicators typically found in different indicator lists. It was also decided that the revised FDES would contain the Core Set of Environment Statistics but more detailed information, for example, methodological description and guidance for data collection, would be provided in subsequent manuals.
4.3 Objective of the Core Set of Environment Statistics <Additional content will be added to this section> 4.9. With the growing importance of increased monitoring and reporting on the
environment, it is recognized that sound policy decisions must be made using timely and reliable information. A major difficulty in assessing the implementation of such decisions, however, has been a lack of basic environmental statistics and indicators. Environment statistics is still a relatively new field of statistics and countries are at varying stages of development. Furthermore, there are emerging environmental issues, such as climate change or green economy/green growth, which create new and additional
17 Concepts and Methods of Environment Statistics: Human Settlements Statistics – A Technical Report, Studies in Methods, Series F, No. 51, United Nations publication, Sales No. E88.XVII.14 18 Concepts and Methods of Environment Statistics: Statistics of the Natural Environment – A Technical Report, Studies in Methods, Series F, No. 57, United Nations publication, Sales No. E91.XVII.18
Draft – Subject to revision
73
data demands, and which are sometimes difficult to define or measure. These additional demands add to the challenges countries already face, such as the lack of financial and human resources, and the lack of basic data and related time series. In addition, environment statistics are often collected by institutions outside the national statistical system, such as meteorological and hydrological institutes, pollution control authorities and nature protection agencies. Further, even when the institutions may theoretically fall within the national statistical system, as is the case for ministries of agriculture, environment or fisheries, there is often a lack of coordination among these institutions.
4.10. Defining a core set of environment statistics can technically assist countries in the
following ways: provide guidance to countries with limited resources and at early stages in the development of environment statistics; serve as a comparable minimum set of environment statistics that most countries will be able to produce; and serve as the underlying statistics for deriving environmental indicators - the indicators which are in fact the most in need of strengthening of the three pillars of the sustainable development indicators.
4.11. By embedding the Core Set into the revised FDES will allow countries to view it
within the context of the full spectrum of environment statistics. By placing the Core Set into its larger context should assist in identifying priorities and data gaps. Nevertheless, since countries have varied and limited capabilities, it will be necessary for each country to establish priorities for the collection of the Core Set of Environment Statistics. Once countries have incorporated these statistics into their regular environment statistics programmes and when methodological guidance has been developed, consideration could be made for adopting these statistics for global data collection to obtain internationally comparable environment statistics.
4.12. In defining the statistics in the Core Set, it was decided that a core statistic should be
one that is either important in its own right or one that is needed for the derivation of a multitude of indicators. For example, Forest area or Land area, which are statistics, can be used as a denominator for one or more of the indicators needed to monitor or evaluate environmental and sustainable development policies, or to assess progress toward meeting the MDGs.
4.13. It should be noted that in addition to the Core Set there is a larger set of statistics that
can be compiled which may be important and widely applicable in the area of environment statistics. Such “non-core statistics” can enable countries to implement more comprehensive monitoring and assessment of the environment. They can be distinguished from the Core Set because they require a more significant outlay of effort
Draft – Subject to revision
74
and resources in their production. Additionally, while they may not be of utmost importance to all countries, they can be of high importance in specific national contexts. Countries are encouraged to produce these non-core statistics, as their needs and capabilities allow and should plan to incorporate them over time into the minimum set of environment statistics that are generated.
4.4 The process of development of the Core Set 4.14. In recommending the Core Set, the EGM noted that the Core Set should be limited in
number and should provide national and international policy-makers with the most necessary information on issues of interest to countries, but also on issues that go well beyond national boundaries. They should also facilitate the assessment of international data collections, monitoring of major global and regional indicator initiatives, and should consider the most pertinent data needs created by global environmental conventions and MEAs.
4.15. In addressing the mandates, it was agreed at the EGM in New York in November
2010 that the focus of the Core Set of statistics should be the identification of the underlying statistics needed for the development of the most common indicators. It was proposed that UNSD compile the list of statistics as well as include some examples of derived indicators clearly showing the underlying statistics from which they are calculated.
4.16. For the EGM in May 2011, UNSD compiled indicators from 37 sources (65 lists/sets
as some have more than one list/set) comprising international, regional, inter-governmental institutions, global environmental conventions, academia and NGOs, and selected preliminary themes/sub-themes under which to organize them. It was noted by UNSD that although an extensive number of lists/sets of indicators were consulted, there could still be some missing, and that UNSD would carry out a final review to try to capture all relevant lists (the final number will be added later). The compilation included a total of 2575 reviewed indicators/statistics and it was divided into two stages. The only criterion used for inclusion of the indicators/statistics in this compilation was the number of times (frequency of or most common indicators/statistics) they appeared in lists/sets.
4.17. Firstly, the entire compilation, which was subdivided into 10 environmental themes,
consisted of both indicators and statistics. For example, in the theme of forests, protected forest area as well as protected forest area as a percentage of total forest area were both included. Typically, protected forest area would be considered a statistic, while protected forest area as a percentage of total forest area would be considered an indicator, as the latter relates two statistics to each other.
Draft – Subject to revision
75
4.18. Next, a more refined list of indicators/statistics was presented by UNSD to the EGM
in May 2011. It consisted of the following 10 preliminary/proposed themes: Forests, Energy, Agriculture, Land, Waste, Coastal and marine areas, Natural disasters and extreme events, Air and climate, Freshwater, and Ecosystems and biodiversity. Within each theme, sub-themes were also developed. These themes along with newly defined sub-themes formed the preliminary basis for the Core Set to be finalized in accordance with the completed structure of the revised FDES. For each of the sub-themes, one or more indicators/statistics were proposed, depending on whether the sub-theme was further disaggregated. While this list contained more “statistics” than “indicators”, it was noted that further work still had to be done to establish a core set of “statistics”.
4.19. The EGM agreed with this approach that reviewed the existing international/regional
indicator/statistics sets, recognizing that it: (i) gave a good indication of global, regional and also thematic priorities; and (ii) provided the opportunity to identify important borderline themes (such as environmental health) that, due to their importance, have to be handled within the FDES and therefore have an effect on the scope of the FDES itself and its links with other statistics. The EGM also noted that, while the focus of the Core Set of Environment Statistics should be on the environment, some related socio-economic statistics should also be included.
4.20. Going beyond the Core Set, the EGM suggested that a wider reference set of statistics
should be recommended, from which countries could select those statistics that were most relevant for their purposes. However, it was recognized that this reference set should originate from the statistical topics of the FDES itself (the full scope of environment statistics) and that countries would prioritize based on the relevance of the given topic to their specific conditions. They further agreed that the elaboration of the FDES at the level of statistics would be supported by a suite of topic-specific recommendations and guidelines.
4.21. The EGM recommended further reducing and prioritizing the Core Set by filtering
out duplications and overlaps. The aim was for the Core Set to be aligned with the FDES structure, included in the FDES document and to become part of the global consultation process.
4.22. The EGM stressed the need for the Core Set to focus on “statistics” as distinct from
“indicators” and above all that the statistics should be policy-relevant at the global level, methodologically sound, commonly used and applicable at the individual national level.

Draft – Subject to revision
76
4.23. In November 2011 the EGM was introduced to a compilation of the most frequently used indicators. In this review, indicators were allocated into the newly proposed structure of the FDES according to its five components and their related sub-components, topics and sub-topics. The indicator/statistics list was analyzed and for each of these indicators, an attempt was made to identify the necessary underlying statistics. This comprehensive tabular presentation aimed to arrive at a complete presentation, as far as possible, of the indicators and statistics of the Core Set, with clear indication of their articulation with the structure of the FDES. The EGM decided to constitute a sub-group to assist UNSD with the finalization of this work. The sub-group’s contributions were fundamental to the development of the Core Set contained in this document.
4.5 Key conceptual considerations - indicators, statistics and the criteria for selection <Additional content will be added to this section> 4.24. In this application, indicators are used to synthesize and present complex information.
They are a means of summarizing, simplifying and communicating information to decision makers, policy analysts, researchers, the business community and the general public. They are used for making comparisons over time, within and between countries. These indicators can be individual statistics, aggregates, ratios or some other form of derived data. They provide an agreed reference point to be used for assessing, monitoring or comparing against a standard. In this capacity, some statistics are already used as indicators for particular purposes, e.g., the MDG Goal 7 indicator on “Consumption of ozone-depleting substances”. However, it is more common that indicators combine several statistics such as the MDG Goal 7 indicator on “Proportion of land area covered by forest”.
4.25. A definition of an indicator has not yet been singled out. From several definitions, an
indicator can generally be characterised by two basic elements: i. It is a statistic, fact, measurement, statistical series (quantitative) or some form of
evidence or perception (qualitative); and ii. It has a purpose of defining objectives, assessing present and future direction with
respect to goals and values, evaluating specific programmes, demonstrating progress, measuring changes in a specific condition or situation over time, determining impact of programmes and conveying messages.
4.26. A statistic on the other hand, normally measures a single phenomenon, e.g., forest
area simply measures the area covered by forest, whereas the indicator, Proportion of land area covered by forest, measures the ratio between the forest area and the land area of a country.

Draft – Subject to revision
77
4.27. Regarding the chosen criteria for the selection of the statistics in the Core Set, the
characteristics of policy relevance, measurability, methodological soundness and frequency of use can be further elaborated as follows:
i. Policy relevance: they should meet the needs of the targeted users and be responsive to changes in the environment and related human activities;
ii. Measurability: they should be readily available, have supporting meta-data, be of accepted quality, and be regularly updated;
iii. Methodological soundness: they should adhere to professional methods and internationally agreed concepts and definitions;
iv. Frequency of use: they should be included in a sufficient number of lists/sets of indicators/statistics for them to be considered readily used by various sources; and
v. Additionally, the statistics should be important in their own right or needed for the derivation of a multitude of indicators.
4.6 Further work towards the implementation of the Core Set 4.28. In addition to the Core Set it would be useful to develop metadata or methodology
sheets for the statistics included. These would include definitions and methodology for compilation, frequency of collection and some directive on which indicators they can be used to derive. It is intended that separate documents be developed to elaborate on these methodologies.
4.7 The Core Set of Environment Statistics <The following list is a preliminary background list of environment statistics; the allocation of topics and the identification of the Core Set are subject to extensive expert consultation and revision.> LEGEND:
1. Generally, the first level in the tables, which is preceded by a lower-case letter (e.g., a., b., c., etc.), is the statistics group/category; though, in some cases where there are no statistics below the first level, this level may also describe a specific statistic.
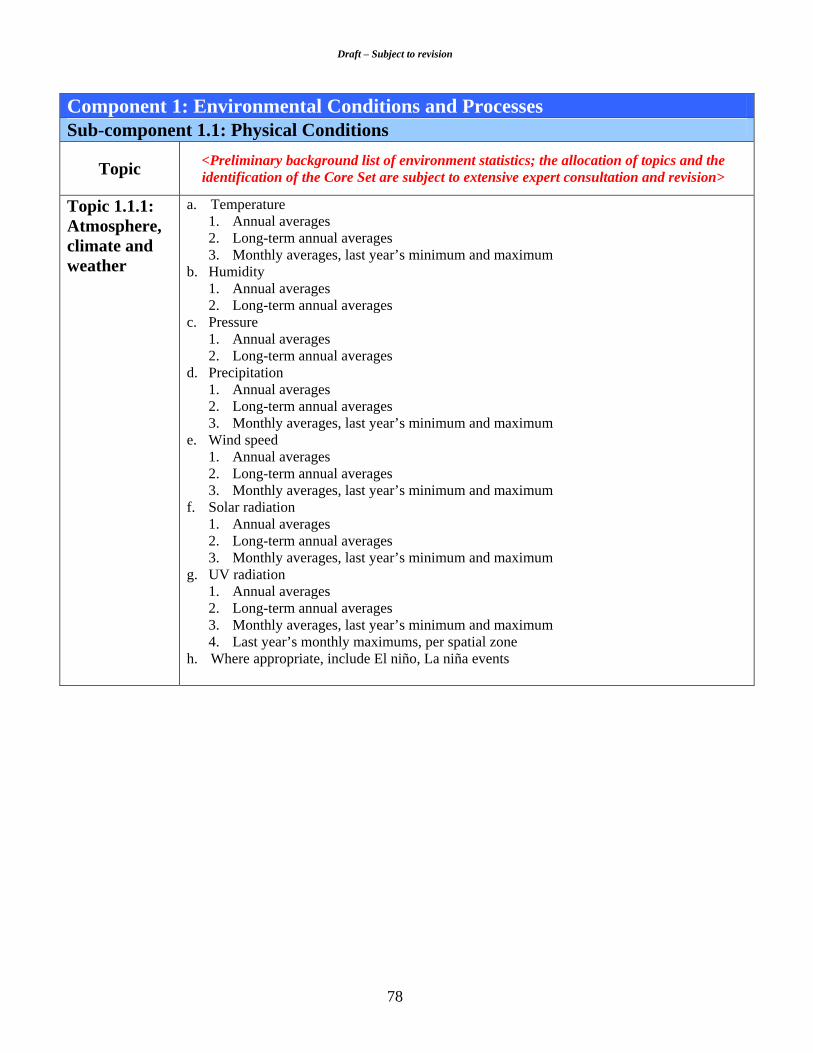
Draft – Subject to revision
78
Component 1: Environmental Conditions and Processes Sub-component 1.1: Physical Conditions
Topic <Preliminary background list of environment statistics; the allocation of topics and the identification of the Core Set are subject to extensive expert consultation and revision>
Topic 1.1.1: Atmosphere, climate and weather
a. Temperature 1. Annual averages 2. Long-term annual averages 3. Monthly averages, last year’s minimum and maximum
b. Humidity 1. Annual averages 2. Long-term annual averages
c. Pressure 1. Annual averages 2. Long-term annual averages
d. Precipitation 1. Annual averages 2. Long-term annual averages 3. Monthly averages, last year’s minimum and maximum
e. Wind speed 1. Annual averages 2. Long-term annual averages 3. Monthly averages, last year’s minimum and maximum
f. Solar radiation 1. Annual averages 2. Long-term annual averages 3. Monthly averages, last year’s minimum and maximum
g. UV radiation 1. Annual averages 2. Long-term annual averages 3. Monthly averages, last year’s minimum and maximum 4. Last year’s monthly maximums, per spatial zone
h. Where appropriate, include El niño, La niña events
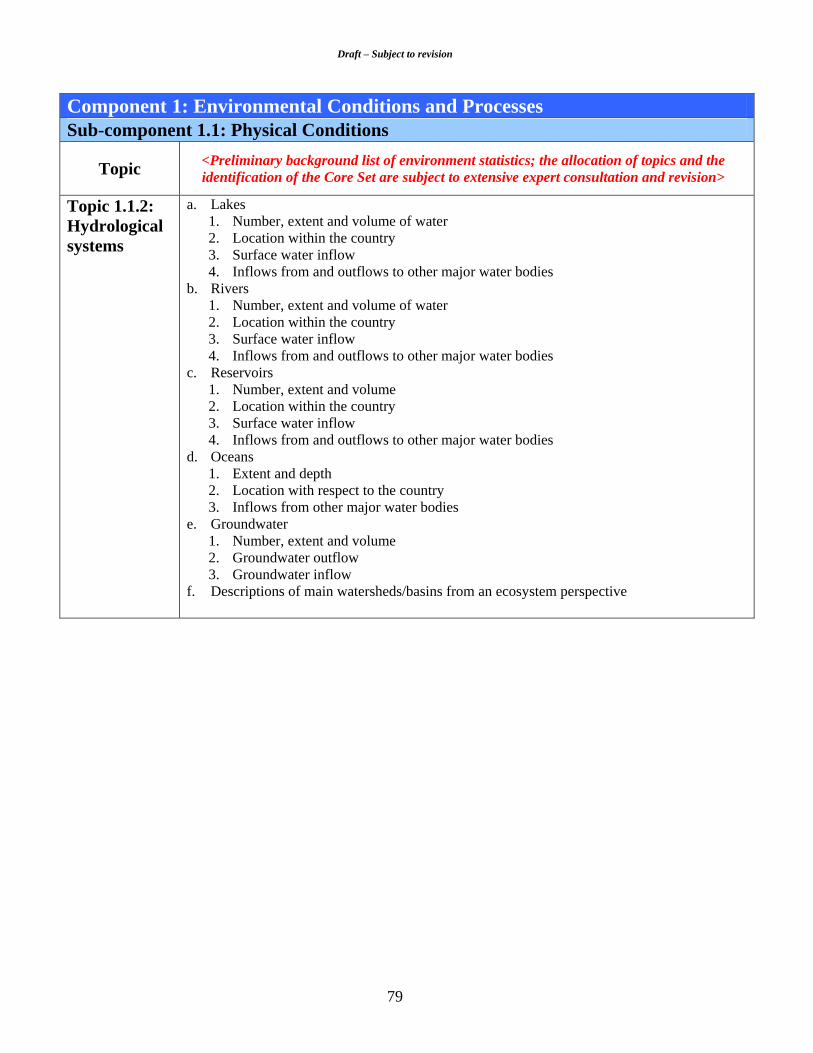
Draft – Subject to revision
79
Component 1: Environmental Conditions and Processes Sub-component 1.1: Physical Conditions
Topic <Preliminary background list of environment statistics; the allocation of topics and the identification of the Core Set are subject to extensive expert consultation and revision>
Topic 1.1.2: Hydrological systems
a. Lakes 1. Number, extent and volume of water 2. Location within the country 3. Surface water inflow 4. Inflows from and outflows to other major water bodies
b. Rivers 1. Number, extent and volume of water 2. Location within the country 3. Surface water inflow 4. Inflows from and outflows to other major water bodies
c. Reservoirs 1. Number, extent and volume 2. Location within the country 3. Surface water inflow 4. Inflows from and outflows to other major water bodies
d. Oceans 1. Extent and depth 2. Location with respect to the country 3. Inflows from other major water bodies
e. Groundwater 1. Number, extent and volume 2. Groundwater outflow 3. Groundwater inflow
f. Descriptions of main watersheds/basins from an ecosystem perspective
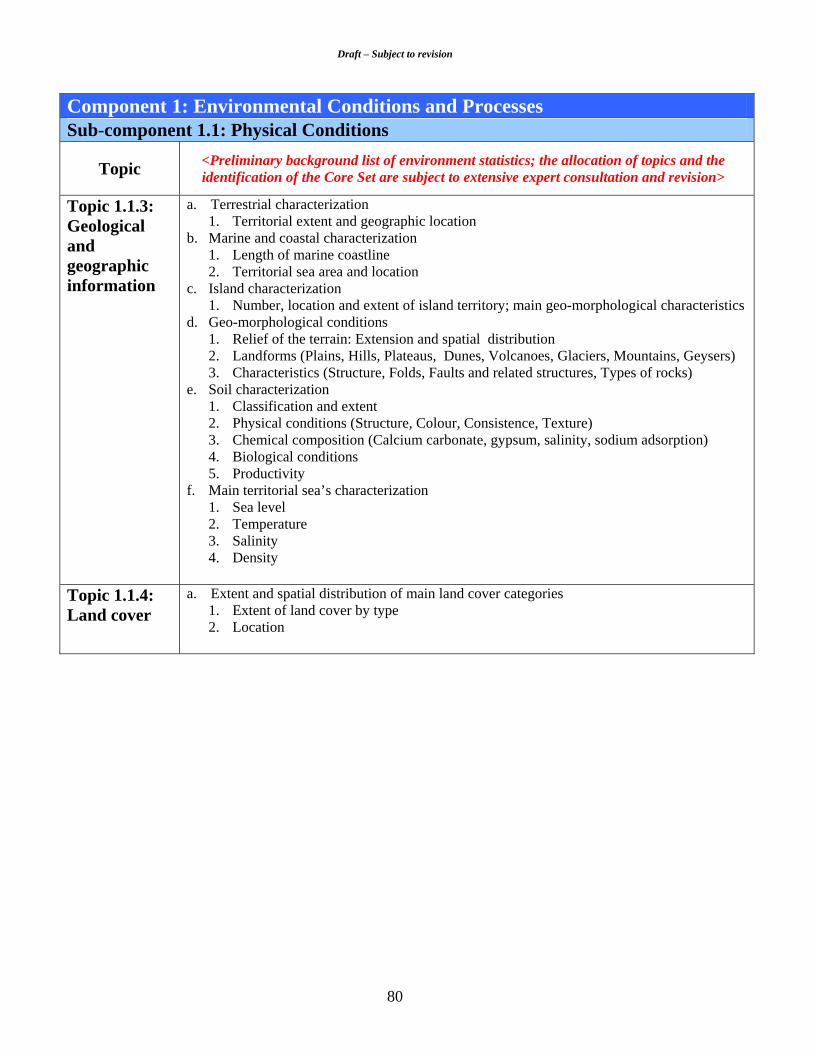
Draft – Subject to revision
80
Component 1: Environmental Conditions and Processes Sub-component 1.1: Physical Conditions
Topic <Preliminary background list of environment statistics; the allocation of topics and the identification of the Core Set are subject to extensive expert consultation and revision>
Topic 1.1.3: Geological and geographic information
a. Terrestrial characterization 1. Territorial extent and geographic location
b. Marine and coastal characterization 1. Length of marine coastline 2. Territorial sea area and location
c. Island characterization 1. Number, location and extent of island territory; main geo-morphological characteristics
d. Geo-morphological conditions 1. Relief of the terrain: Extension and spatial distribution 2. Landforms (Plains, Hills, Plateaus, Dunes, Volcanoes, Glaciers, Mountains, Geysers) 3. Characteristics (Structure, Folds, Faults and related structures, Types of rocks)
e. Soil characterization 1. Classification and extent 2. Physical conditions (Structure, Colour, Consistence, Texture) 3. Chemical composition (Calcium carbonate, gypsum, salinity, sodium adsorption) 4. Biological conditions 5. Productivity
f. Main territorial sea’s characterization 1. Sea level 2. Temperature 3. Salinity 4. Density
Topic 1.1.4: Land cover
a. Extent and spatial distribution of main land cover categories 1. Extent of land cover by type 2. Location
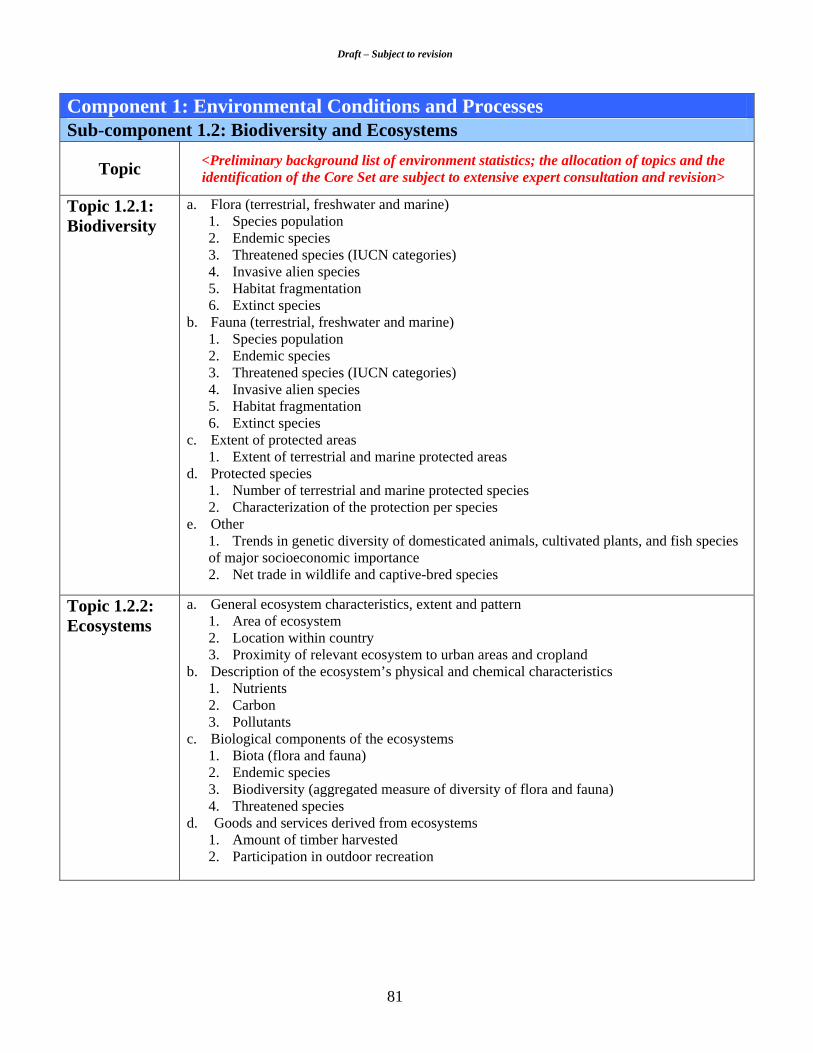
Draft – Subject to revision
81
Component 1: Environmental Conditions and Processes Sub-component 1.2: Biodiversity and Ecosystems
Topic <Preliminary background list of environment statistics; the allocation of topics and the identification of the Core Set are subject to extensive expert consultation and revision>
Topic 1.2.1: Biodiversity
a. Flora (terrestrial, freshwater and marine) 1. Species population 2. Endemic species 3. Threatened species (IUCN categories) 4. Invasive alien species 5. Habitat fragmentation 6. Extinct species
b. Fauna (terrestrial, freshwater and marine) 1. Species population 2. Endemic species 3. Threatened species (IUCN categories) 4. Invasive alien species 5. Habitat fragmentation 6. Extinct species
c. Extent of protected areas 1. Extent of terrestrial and marine protected areas
d. Protected species 1. Number of terrestrial and marine protected species 2. Characterization of the protection per species
e. Other 1. Trends in genetic diversity of domesticated animals, cultivated plants, and fish species of major socioeconomic importance 2. Net trade in wildlife and captive-bred species
Topic 1.2.2: Ecosystems
a. General ecosystem characteristics, extent and pattern 1. Area of ecosystem 2. Location within country 3. Proximity of relevant ecosystem to urban areas and cropland
b. Description of the ecosystem’s physical and chemical characteristics 1. Nutrients 2. Carbon 3. Pollutants
c. Biological components of the ecosystems 1. Biota (flora and fauna) 2. Endemic species 3. Biodiversity (aggregated measure of diversity of flora and fauna) 4. Threatened species
d. Goods and services derived from ecosystems 1. Amount of timber harvested 2. Participation in outdoor recreation

Draft – Subject to revision
82
Component 1: Environmental Conditions and Processes Sub-component 1.3: Environmental Quality
Topic <Preliminary background list of environment statistics; the allocation of topics and the identification of the Core Set are subject to extensive expert consultation and revision>
Topic 1.3.1: Air quality
a. Breathable particles 1. Concentration levels of SPM10 2. Concentration levels of SPM2.5 3. Maximum allowable levels 4. Number of days where maximum allowable levels were surpassed per year
b. Breathable gases 1. Concentration levels of CO 2. Concentration level of tropospheric Ozone, O3 3. Maximum allowable levels 4. Number of days where maximum allowable levels were surpassed per year
c. Other relevant pollutants 1. Concentration levels of SO2 2. Concentration levels of Lead 3. Concentration levels of NOx 4. Concentration levels of NMVOCs 5. Concentration levels of dioxins 6. Concentration levels of furans 7. Maximum allowable levels 8. Number of days where maximum allowable levels were surpassed per year
Topic 1.3.2: Freshwater quality
a. Concentration of nutrients 1. Residuals from agriculture in freshwater bodies (nitrates and phosphates) 2. Maximum allowable levels; adequate levels
b. Oxygen in freshwater bodies 1. Concentration of dissolved oxygen in freshwater bodies 2. Biochemical oxygen demand (BOD) in freshwater bodies 3. Chemical oxygen demand (COD) in freshwater bodies 4. Maximum allowable levels; adequate levels
c. Bacterial pollutants 1. Concentration of faecal coliforms in freshwater bodies 2. Maximum allowable levels
d. pH/Acidity/Alkalinity e. Temperature in freshwater bodies f. Concentration of heavy metals in freshwater bodies

Draft – Subject to revision
83
Component 1: Environmental Conditions and Processes Sub-component 1.3: Environmental Quality
Topic <Preliminary background list of environment statistics; the allocation of topics and the identification of the Core Set are subject to extensive expert consultation and revision>
Topic 1.3.3: Marine water quality
At local level: a. Plastic waste
1. Estimated amount of plastic waste in marine waters b. Bacterial pollutants
1. Faecal coliform concentrations in recreational marine waters 2. Maximum allowable levels
c. Coral bleaching 1. Area affected by coral bleaching
d. Surface runoff e. Urban runoff f. Sedimentation At national and supra-national level: a. Acidification of marine water bodies
1. PH b. Plastic waste
1. Estimated amount of plastic waste in marine waters c. Oil spills
1. Number of oil spills 2. Amount of oil released into marine environment
d. Coral bleaching 1. Area affected by coral bleaching
e. Persistent toxins (PCBs, DDT, pesticides, furans, dioxins, phenols and radioactive waste) 1. Maximum allowable levels
f. Heavy metals that bioacummulate (mercury, lead, nickel, arsenic, cadmium) 1. Maximum allowable levels
Topic 1.3.4: Soil quality
g. Land area affected by contamination from: 1. Petroleum hydrocarbons (oil residuals) 2. Solvents 3. Pesticides 4. Heavy metals 5. Acidification
h. Nutrient content of soil, measured in levels of: 1. Calcium (Ca) 2. Magnesium (Mg) 3. Nitrogen (N) 4. Phosphorus (P) 5. Potassium (K) 6. Zinc (Zn)
Topic 1.3.5: Noise
a. Levels of noise pollution (decibels) from specific sources b. Levels of noise pollution (decibels) in specific locations c. Maximum allowable levels from different sources or in specific surrounding locations

Draft – Subject to revision
84
Component 2: Environmental Assets and their Use Sub-component 2.1: Mineral and Energy Resources
Topic <Preliminary background list of environment statistics; the allocation of topics and the identification of the Core Set are subject to extensive expert consultation and revision>
Topic 2.1.1: Stocks of mineral and energy resources
a. Non-energy minerals: 1. Reserves of non-energy minerals 2. Stocks of non-energy mineral resources by type 3. Additions to non-energy mineral resources 4. Reductions in non-energy mineral resources
b. Energy: 1. Reserves of energy resources 2. Stocks of non-renewable energy resources by source 3. Additions to non-renewable energy resources 4. Reductions in non-renewable energy resources
Topic 2.1.2: Extraction and use of mineral and energy resources
a. Volume of non-energy minerals extracted b. Volume of energy minerals extracted c. Total energy production d. Primary energy production e. Secondary energy production f. Electricity production g. Renewable energy production h. Total energy consumption i. Primary energy consumption j. Renewable energy consumption/production k. Non renewable energy consumption/production l. Electricity consumption m. Total fossil fuel exports/imports n. Population using solid fuels
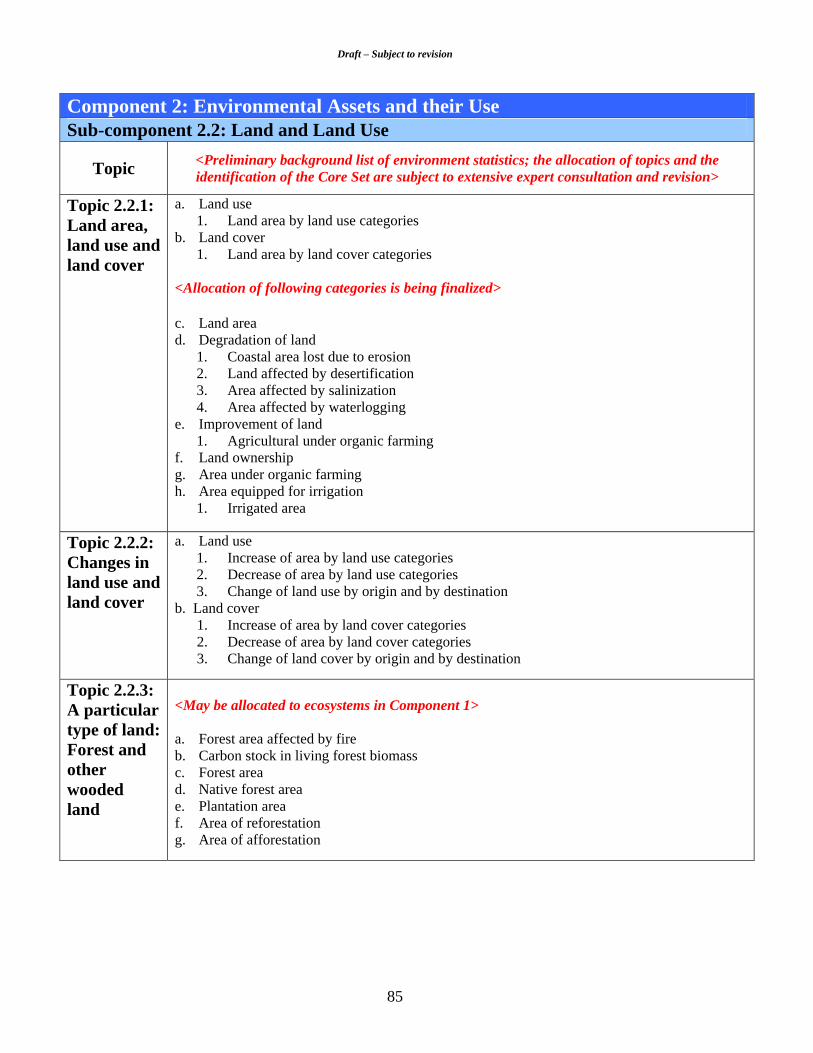
Draft – Subject to revision
85
Component 2: Environmental Assets and their Use Sub-component 2.2: Land and Land Use
Topic <Preliminary background list of environment statistics; the allocation of topics and the identification of the Core Set are subject to extensive expert consultation and revision>
Topic 2.2.1: Land area, land use and land cover
a. Land use 1. Land area by land use categories
b. Land cover 1. Land area by land cover categories
<Allocation of following categories is being finalized> c. Land area d. Degradation of land
1. Coastal area lost due to erosion 2. Land affected by desertification 3. Area affected by salinization 4. Area affected by waterlogging
e. Improvement of land 1. Agricultural under organic farming
f. Land ownership g. Area under organic farming h. Area equipped for irrigation
1. Irrigated area
Topic 2.2.2: Changes in land use and land cover
a. Land use 1. Increase of area by land use categories 2. Decrease of area by land use categories 3. Change of land use by origin and by destination
b. Land cover 1. Increase of area by land cover categories 2. Decrease of area by land cover categories 3. Change of land cover by origin and by destination
Topic 2.2.3: A particular type of land: Forest and other wooded land
<May be allocated to ecosystems in Component 1> a. Forest area affected by fire b. Carbon stock in living forest biomass c. Forest area d. Native forest area e. Plantation area f. Area of reforestation g. Area of afforestation

Draft – Subject to revision
86
Component 2: Environmental Assets and their Use Sub-component 2.3: Soil Resources
Topic <Preliminary background list of environment statistics; the allocation of topics and the identification of the Core Set are subject to extensive expert consultation and revision>
Topic 2.3.1: Area and change of area of soil resources Topic 2.3.2: Volume and change of volume of soil resources Topic 2.3.3: Soil resources as biological systems
a. Area and volume of soils by soil type b. Area and volume of soils by soil quality c. Volume of nutrients in soil d. Additions to soil resources e. Reductions in soil resources f. Area and volume of soils by soil type g. Area and volume of soils by soil quality h. Volume of nutrients in soil i. Area affected by soil erosion j. Land affected by desertification k. Area affected by salinization l. Area affected by waterlogging m. Acidification n. Apparent consumption of fertilizers o. Apparent consumption of pesticides p. Volume of soil excavated q. Volume of nutrients uptake r. Volume of nutrient replenishment (fertilizers) s. Soil loss
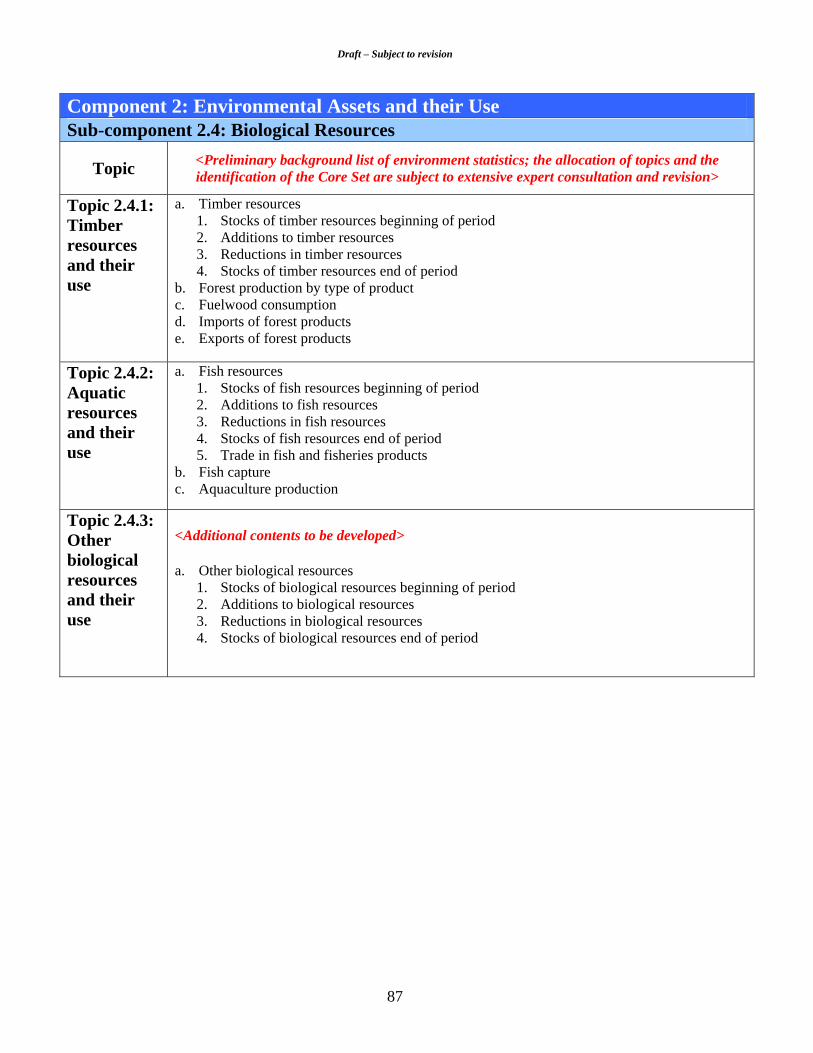
Draft – Subject to revision
87
Component 2: Environmental Assets and their Use Sub-component 2.4: Biological Resources
Topic <Preliminary background list of environment statistics; the allocation of topics and the identification of the Core Set are subject to extensive expert consultation and revision>
Topic 2.4.1: Timber resources and their use
a. Timber resources 1. Stocks of timber resources beginning of period 2. Additions to timber resources 3. Reductions in timber resources 4. Stocks of timber resources end of period
b. Forest production by type of product c. Fuelwood consumption d. Imports of forest products e. Exports of forest products
Topic 2.4.2: Aquatic resources and their use
a. Fish resources 1. Stocks of fish resources beginning of period 2. Additions to fish resources 3. Reductions in fish resources 4. Stocks of fish resources end of period 5. Trade in fish and fisheries products
b. Fish capture c. Aquaculture production
Topic 2.4.3: Other biological resources and their use
<Additional contents to be developed> a. Other biological resources
1. Stocks of biological resources beginning of period 2. Additions to biological resources 3. Reductions in biological resources 4. Stocks of biological resources end of period

Draft – Subject to revision
88
Component 2: Environmental Assets and their Use Sub-component 2.5: Water Resources and their Use
Topic <Preliminary background list of environment statistics; the allocation of topics and the identification of the Core Set are subject to extensive expert consultation and revision>
Topic 2.5.1: Water resources
a. Precipitation b. Total surface water resources
1. Volume of renewable surface water resources 2. Volume of non-renewable surface water resources
c. Total groundwater resources 1. Volume of renewable groundwater resources by source 2. Volume of non-renewable groundwater resources by source
d. Internal renewable water sources e. External renewable water resources f. Opening Stocks g. Additions to stocks
1. Total returns from the economy (discharges) 2. Precipitation 3. External inflow
h. Reductions in stocks 4. Total abstractions by the economy 5. Actual evapotranspiration
i. Closing stocks
Topic 2.5.2: Abstraction and use of waters
a. Water abstraction b. Consumption/Use c. Gross freshwater abstracted d. Gross fresh groundwater abstracted e. Gross fresh surface water abstracted f. Freshwater abstracted by economic activity g. Water use by supply category h. Water use by economic activity i. Total non-conventional water
Topic 2.5.3: Returns of waters
a. Wastewater discharged by economic activity b. Cooling water discharged by economic activity c. Other discharges (e.g., from hydropower etc)

Draft – Subject to revision
89
Component 3: Emissions, Residuals and Waste Sub-component 3.1: Emissions to Air
Topic <Preliminary background list of environment statistics; the allocation of topics and the identification of the Core Set are subject to extensive expert consultation and revision>
Topic 3.1.1: Emissions to air
a. Total emissions of direct greenhouse gases, by gas: 1. Carbon dioxide (CO2) 2. Methane (CH4) 3. Nitrous oxide (N2O) 4. Perfluorocarbons (PFCs) 5. Hydroflourocarbons (HFCs) 6. Sulphur hexafluoride (SF6)
b. Total emissions of indirect greenhouse gases, by gas: 1. Sulphur dioxide (SO2) 2. Nitrogen oxides (NOx) 3. Non-Methane Volatile Organic Compounds (NM-VOCs) 4. Other
c. Emissions of other substances: 1. Lead (Pb) 2. Other
d. Consumption of ozone depleting substances (ODS), by substance: 1. Chlorofluorocarbons (CFCs) 2. Hydrochlorofluorocarbons (HCFCs) 3. Bromofluorocarbons 4. Methyl chloroform 5. Carbon tetrachloride 6. Methyl bromide 7. Other
e. Total emissions of direct greenhouse gases, by sector or economic activity (using ISIC) and by type of source (fixed, mobile)
f. Consumption of ozone depleting substances (ODS), by sector or economic activity (using ISIC)
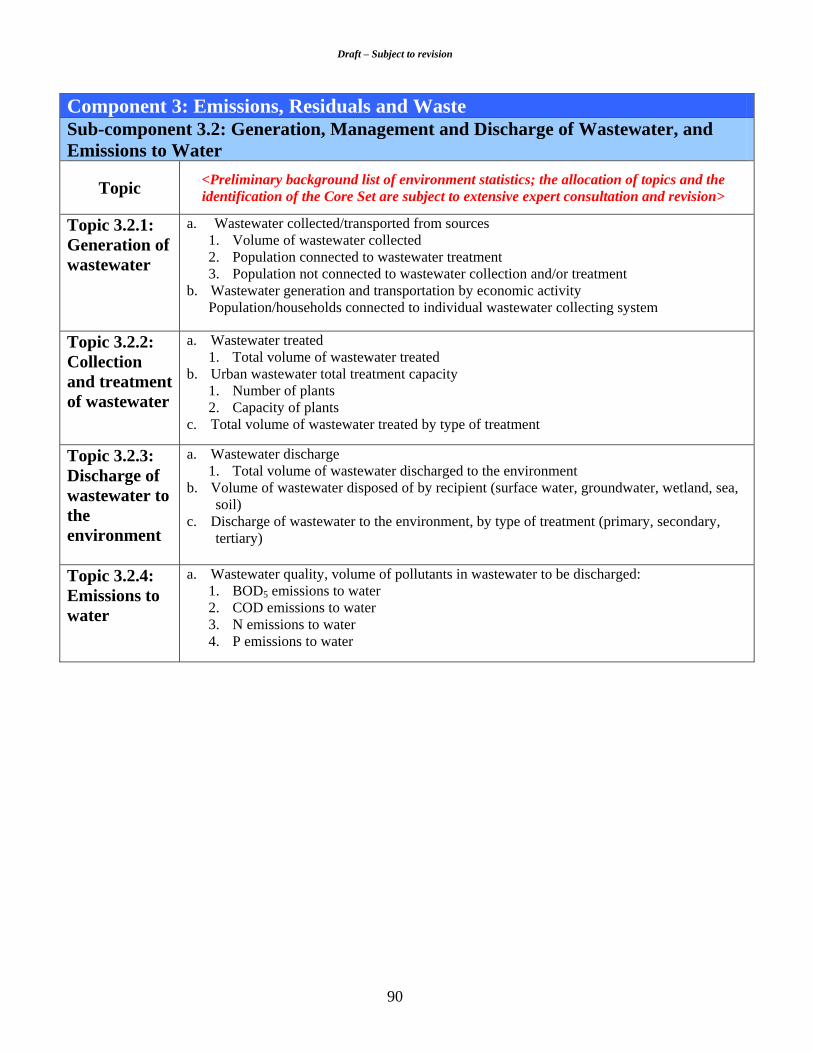
Draft – Subject to revision
90
Component 3: Emissions, Residuals and Waste Sub-component 3.2: Generation, Management and Discharge of Wastewater, and Emissions to Water
Topic <Preliminary background list of environment statistics; the allocation of topics and the identification of the Core Set are subject to extensive expert consultation and revision>
Topic 3.2.1: Generation of wastewater
a. Wastewater collected/transported from sources 1. Volume of wastewater collected 2. Population connected to wastewater treatment 3. Population not connected to wastewater collection and/or treatment
b. Wastewater generation and transportation by economic activity Population/households connected to individual wastewater collecting system
Topic 3.2.2: Collection and treatment of wastewater
a. Wastewater treated 1. Total volume of wastewater treated
b. Urban wastewater total treatment capacity 1. Number of plants 2. Capacity of plants
c. Total volume of wastewater treated by type of treatment
Topic 3.2.3: Discharge of wastewater to the environment
a. Wastewater discharge 1. Total volume of wastewater discharged to the environment
b. Volume of wastewater disposed of by recipient (surface water, groundwater, wetland, sea, soil)
c. Discharge of wastewater to the environment, by type of treatment (primary, secondary, tertiary)
Topic 3.2.4: Emissions to water
a. Wastewater quality, volume of pollutants in wastewater to be discharged: 1. BOD5 emissions to water 2. COD emissions to water 3. N emissions to water 4. P emissions to water

Draft – Subject to revision
91
Component 3: Emissions, Residuals and Waste Sub-component 3.3: Generation, Management and Disposal of Solid Waste
Topic <Preliminary background list of environment statistics; the allocation of topics and the identification of the Core Set are subject to extensive expert consultation and revision>
Topic 3.3.1: Generation of solid waste
a. Generation of waste by source/economic activity b. Generation of waste by waste category c. Generation of hazardous waste
1. Hazardous waste generated by economic activity
Topic 3.3.2: Management of solid waste
a. Municipal waste 1. Total municipal waste collected 2. Amount of municipal waste recycled, composted, incinerated, landfilled 3. Number and capacity of municipal waste treatment and disposal facilities
b. Hazardous waste 1. Total hazardous waste collected 2. Amount of hazardous waste recycled, incinerated, landfilled 3. Number and capacity of hazardous waste treatment and disposal facilities
c. Waste treatment by waste category d. Recycling rates for specific waste streams, overall recycling rate e. Import and export of waste, by waste category f. Import and export of hazardous waste, by waste category
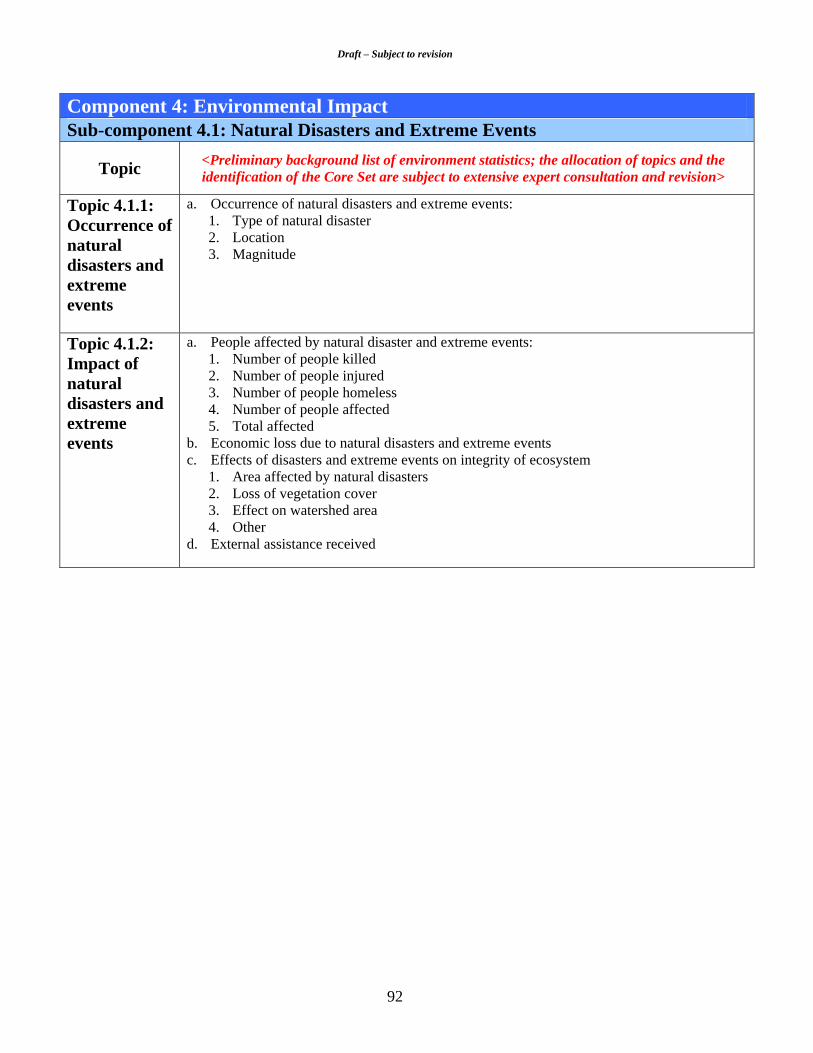
Draft – Subject to revision
92
Component 4: Environmental Impact Sub-component 4.1: Natural Disasters and Extreme Events
Topic <Preliminary background list of environment statistics; the allocation of topics and the identification of the Core Set are subject to extensive expert consultation and revision>
Topic 4.1.1: Occurrence of natural disasters and extreme events
a. Occurrence of natural disasters and extreme events: 1. Type of natural disaster 2. Location 3. Magnitude
Topic 4.1.2: Impact of natural disasters and extreme events
a. People affected by natural disaster and extreme events: 1. Number of people killed 2. Number of people injured 3. Number of people homeless 4. Number of people affected 5. Total affected
b. Economic loss due to natural disasters and extreme events c. Effects of disasters and extreme events on integrity of ecosystem
1. Area affected by natural disasters 2. Loss of vegetation cover 3. Effect on watershed area 4. Other
d. External assistance received
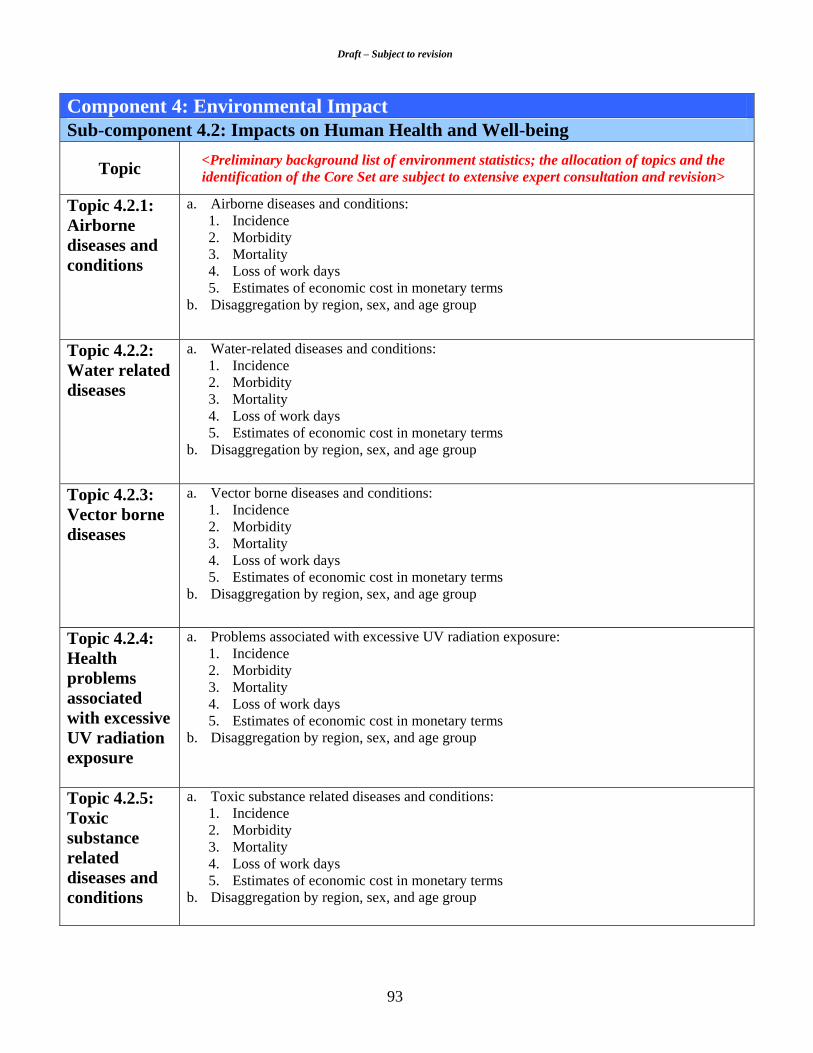
Draft – Subject to revision
93
Component 4: Environmental Impact Sub-component 4.2: Impacts on Human Health and Well-being
Topic <Preliminary background list of environment statistics; the allocation of topics and the identification of the Core Set are subject to extensive expert consultation and revision>
Topic 4.2.1: Airborne diseases and conditions
a. Airborne diseases and conditions: 1. Incidence 2. Morbidity 3. Mortality 4. Loss of work days 5. Estimates of economic cost in monetary terms
b. Disaggregation by region, sex, and age group
Topic 4.2.2: Water related diseases
a. Water-related diseases and conditions: 1. Incidence 2. Morbidity 3. Mortality 4. Loss of work days 5. Estimates of economic cost in monetary terms
b. Disaggregation by region, sex, and age group
Topic 4.2.3: Vector borne diseases
a. Vector borne diseases and conditions: 1. Incidence 2. Morbidity 3. Mortality 4. Loss of work days 5. Estimates of economic cost in monetary terms
b. Disaggregation by region, sex, and age group
Topic 4.2.4: Health problems associated with excessive UV radiation exposure
a. Problems associated with excessive UV radiation exposure: 1. Incidence 2. Morbidity 3. Mortality 4. Loss of work days 5. Estimates of economic cost in monetary terms
b. Disaggregation by region, sex, and age group
Topic 4.2.5: Toxic substance related diseases and conditions
a. Toxic substance related diseases and conditions: 1. Incidence 2. Morbidity 3. Mortality 4. Loss of work days 5. Estimates of economic cost in monetary terms
b. Disaggregation by region, sex, and age group
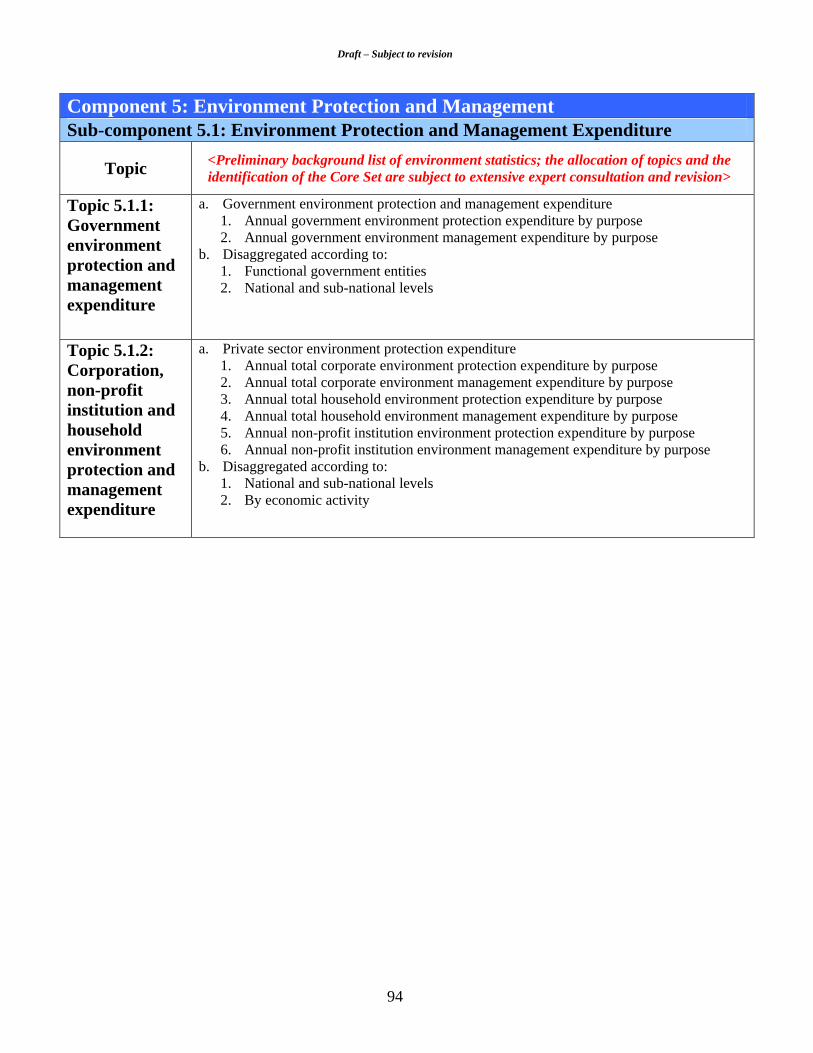
Draft – Subject to revision
94
Component 5: Environment Protection and Management Sub-component 5.1: Environment Protection and Management Expenditure
Topic <Preliminary background list of environment statistics; the allocation of topics and the identification of the Core Set are subject to extensive expert consultation and revision>
Topic 5.1.1: Government environment protection and management expenditure
a. Government environment protection and management expenditure 1. Annual government environment protection expenditure by purpose 2. Annual government environment management expenditure by purpose
b. Disaggregated according to: 1. Functional government entities 2. National and sub-national levels
Topic 5.1.2: Corporation, non-profit institution and household environment protection and management expenditure
a. Private sector environment protection expenditure 1. Annual total corporate environment protection expenditure by purpose 2. Annual total corporate environment management expenditure by purpose 3. Annual total household environment protection expenditure by purpose 4. Annual total household environment management expenditure by purpose 5. Annual non-profit institution environment protection expenditure by purpose 6. Annual non-profit institution environment management expenditure by purpose
b. Disaggregated according to: 1. National and sub-national levels 2. By economic activity

Draft – Subject to revision
95
Component 5: Environment Protection and Management Sub-component 5.2: Environmental Governance, Regulation and Engagement
Topic <Preliminary background list of environment statistics; the allocation of topics and the identification of the Core Set are subject to extensive expert consultation and revision>
Topic 5.2.1: Institutional strength
a. Environmental institutions and their resources 1. Existing environmental authorities/agencies 2. Budget of the institutions 3. Dedicated staff of the institutions
b. Disaggregated according to: 1. Functional government entities 2. National and sub-national levels
Topic 5.2.2: Environmental regulation and instruments
a. Direct regulation 1. Number of environmental quality norms made official in current year 2. Number, description of current norms per media (water, air, land, soil, oceans, etc.) or per ecosystems 3. Existence of system of environmental licensing of productive projects and facilities 4. Number of presented and approved projects per year 5. Number of mandatory recycling and energy efficiency programmes 6. Number of quotas and other restrictive production norms, per sector or economic activity 7. Budget and staff dedicated to enforcement of environmental regulations at the national level
b. Economic instruments, existence and level of: 1. Green taxes 2. Environmentally relevant subsidies 3. Eco labelling, certification and other market instruments applied 4. Other incentives and/or disincentives
Topic 5.2.3: Participation in MEAs and environmental conventions
a. Participation in MEAs 1. Year of participation of country in MEA and other global environmental conventions
b. Ratification of international conventions and agreements 1. Status of ratification of international conventions and agreements
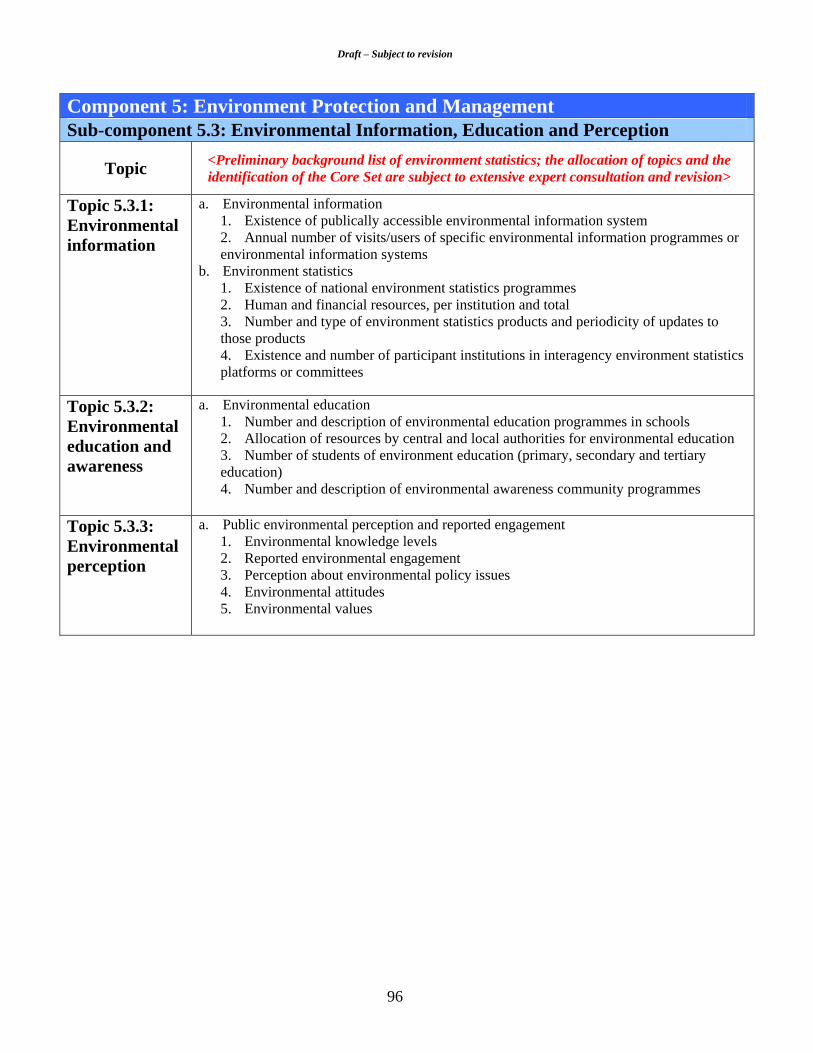
Draft – Subject to revision
96
Component 5: Environment Protection and Management Sub-component 5.3: Environmental Information, Education and Perception
Topic <Preliminary background list of environment statistics; the allocation of topics and the identification of the Core Set are subject to extensive expert consultation and revision>
Topic 5.3.1: Environmental information
a. Environmental information 1. Existence of publically accessible environmental information system 2. Annual number of visits/users of specific environmental information programmes or environmental information systems
b. Environment statistics 1. Existence of national environment statistics programmes 2. Human and financial resources, per institution and total 3. Number and type of environment statistics products and periodicity of updates to those products 4. Existence and number of participant institutions in interagency environment statistics platforms or committees
Topic 5.3.2: Environmental education and awareness
a. Environmental education 1. Number and description of environmental education programmes in schools 2. Allocation of resources by central and local authorities for environmental education 3. Number of students of environment education (primary, secondary and tertiary education) 4. Number and description of environmental awareness community programmes
Topic 5.3.3: Environmental perception
a. Public environmental perception and reported engagement 1. Environmental knowledge levels 2. Reported environmental engagement 3. Perception about environmental policy issues 4. Environmental attitudes 5. Environmental values