Draft Regulatory Impact Statement - ntc.gov.auF71E0D6C-96B1-7379-D72F-4F... · National Transport...
170
2014 Heavy Vehicle Charges Determination Draft Regulatory Impact Statement November 2013
Transcript of Draft Regulatory Impact Statement - ntc.gov.auF71E0D6C-96B1-7379-D72F-4F... · National Transport...
2014 Heavy Vehicle Charges Determination Draft Regulatory Impact Statement
November 2013

National Transport Commission
2014 Heavy Vehicle Charges Determination – Draft regulatory Impact statement
Report prepared by: National Transport Commission
ISBN:

Heavy vehicle charges determination – RIS February 2014 i
Report outline Title: Heavy Vehicle Charges Determination
Type of report: Regulatory Impact Statement
Purpose: For SCOTI noting
Abstract: This document presents the results of a comprehensive review of heavy vehicle charges the National Transport Commission (NTC) conducted in 2012 and 2013 in collaboration with a broad range of stakeholders, including industry representatives and the Australian, state and territory government. The NTC has identified several areas within the current charging framework that required further analysis. Where appropriate, the NTC recommends changes to address as many of the issues identified in the Heavy Vehicles Charges Review and improve the current charging framework. This Heavy Vehicle Charges Determination is the second step of a two-stage process, which was endorsed by ministers in November 2012. The determination aims at implementing new charges from 1 July 2014.
Key milestones: Public consultation: 25 November 2013 to 17 January 2014 SCOTI voting: February 2014
Key words: Heavy vehicles charges, PAYGO, determination, consultation, NTC, HVCI, NHVR, cost recovery, cost base, A-trailer, road expenditure, arterial roads, local roads, cost allocation matrix, pricing principles, usage data, annual adjustment, expenditure template, expenditure accountability, structure of charges, standard axle charge, axle grouping charge, pavement wear, equivalent standard axle, ESA, indexation, averaging, attributable costs, non-attributable costs, common costs, modularity, rebates, concessions, SMVU, road user charge, registration, weigh-in-motion, equity, economic efficiency.
Contact: National Transport Commission L15/628 Bourke Street MELBOURNE VIC 3000 (03) 9235 5000 or [email protected] www.ntc.gov.au
Heavy vehicle charges determination – RIS February 2014 ii
How to make a submission to the NTC Who can make a submission? Any individual or organisation can make a submission to the NTC.
How to submit To make an online submission please visit the NTC homepage (www.ntc.gov.au) and select ‘Make a submission to the NTC’ from the News & Publication menu.
Alternatively, you can mail your comments to: Chief Executive Officer, National Transport Commission, Level 15/628 Bourke Street, MELBOURNE VIC 3000. Where possible, you should provide evidence, such as data and documentation, to support your views.
Publication of submissions Unless submissions clearly request otherwise, all submissions will be published online. Submissions that contain defamatory or offensive content will not be published. The Freedom of Information Act 1982 (Cwlth) applies to the NTC
Public forums For those stakeholdes who do not wish to make a written submission, you can provide feedback at a public forum instead. The details of which are provided below:
Date Location Venue Time (tentative)
26/11/2013 Darwin Darwin Convention Centre 8.30am-12pm
27/11/2013 Fremantle Trade Winds Hotel 8.30am-12pm
28/11/2013 Port Headland The Esplanade Hotel 8.30am-12pm
2/12/2013 Sydney Novotel Brighton Beach 1pm-4:30pm
3/12/2013 Canberra Rydges Capital Hill 8.30am-12pm
4/12/2013 Brisbane Mecure Brisbane 8.30am-12pm
5/12/2013 Townsville Townsville Holiday Inn 8.30am-12pm
6/12/2013 Melbourne Melbourne
Convention and Exhibition Centre
8.30am-12pm
9/12/2013 Port Lincoln Port Lincoln Hotel 8.30am-12pm
10/12/2013 Adelaide Rydges South Park 10:30am – 2pm
11/12/2013 Mt Gambier Lakes Resort 8.30am-12pm
16/12/2013 Launceston Hotel Grand Chancellor 8.30am-12pm
17/12/2013 Albury Wodonga Albury Entertainment Centre 8.30am-12pm
18/12/2013 Dubbo Dubbo Regional
Theatre and Convention Centre
8.30am-12pm
Heavy vehicle charges determination – RIS February 2014 iii
Foreword
Road pricing and investment reform is the next important step in Australia’s continued micro-economic reform journey. The road sector is one of the last monopoly infrastructure providers to undergo structural reform, and for good reason. The challenges it poses are both complex and multifaceted, incorporating a diverse mix of users and asset owners.
However, the complexities and challenges to overcome can be matched by the efficiency dividend that will accompany successful reform. At stake is the prospect of unleashing a new wave of productivity across the nation, positively impacting on the lives of all Australians. Lower freight costs increase the affordability of virtually all consumer goods that travel by road.
Australia, like other countries, is grappling with the sustainability of its existing road tax arrangements. Our roads are becoming more congested, public finances are being stetched, and the fuels that propel our vehicles are becoming more diverse. All of these factors limit the longevity of the existing charging regime.
The Henry tax review in 2010 concluded that the Australian road transport system requires a transition from indiscriminate road taxes to a user-based charging and investment model. It stated this model will provide a foundation for further productivity growth, improved living standards and more sustainable cities.
With these incentives and challenges in mind, governments have charted a course for the future of road freight transport reform. This pricing determination aims to extend the life of the existing charging system in advance of more wide-ranging structural reform currently being investigated as part of the Heavy Vehicle Charging and Investment project.
This determination builds upon the findings of the Heavy Vehicle Charges Review, which was undertaken openly and collaboratively, resulting in a high degree of transparency, a better understanding of stakeholders’ needs, and a common ownership of outcomes. It is these principles of openness, collaboration and consultation that the National Transport Commission commits to further advancing the road productivity reform agenda in Australia.
This draft determination will now be the subject of an extensive consultation process. I strongly encourage all interested parties to become actively involved and provide feedback. Following the consultation process, the outcome of the determination will be presented to the Standing Council on Transport and Infrastructure in February 2014 for consideration. It will then provide the basis for implementing revised heavy vehicle charges on 1 July 2014.
On behalf of the National Transport Commission, I would like to thank everybody who has contributed to this determination, particularly those stakeholders who have shared their valuable time and expertise with us throughout the process.
Greg Martin PSM Chairman
Heavy vehicle charges determination – RIS February 2014 iv
Executive summary Introduction
All heavy vehicles in Australia are charged an annual registration fee and a road user charge (RUC) levied on each litre of diesel fuel. These charges are determined according to a charging framework known as PAYGO. The primary objective of PAYGO or ‘pay as you go’ is to deliver a nationally consistent set of heavy vehicle charges that efficiently recover the cost of providing and maintaining the road network. In November 2012 the Standing Council on Transport and Infrastructure (SCOTI) directed the National Transport Commission (NTC) to complete a comprehensive review of the heavy vehicle charging system in a two-step process. Step 1 was a comprehensive review of the current heavy vehicle charging system (the review), followed by Step 2, a new determination that recommends heavy vehicle charges based on the findings and recommendations of the completed review. The comprehensive review stage is now complete. The findings of the final report concluded that overall PAYGO had achieved its primary objective of recovering industry’s share of government spending on roads in recent years, and any under- or over-recovery in a given year was not only typical but a necessary feature of an averaging mechanism designed to ensure the smooth transition of charges from year to year. The review also concluded that, while sophisticated in its design, PAYGO at its best represents a hypothetical approximation of the heavy vehicle share of total expenditure on roads. Since the inception of PAYGO, repeated attempts to achieve greater precision has increased the complexity of the charging framework and eroded its simplicity and transparency. With this in mind, caution should be exercised when attempting to achieve greater precision as limitations will always exist when the primary charging tools remain registration and fuel excise. The adoption of a more precise and user pays charging framework is currently being explored by the Heavy Vehicle Charging and Investment (HVCI) reform. At its May 2013 meeting, SCOTI endorsed NTC proceeding with a determination on the basis of the review recommendations, with one of the key recommendations being to include options for raising the RUC above its current level. This determination builds upon the findings and analysis of the review and fulfils the second step of the review and determination process. The recommended charges, if approved, will be implemented from 1 July 2014. It is acknowledged that implementation may need to occur in multiple phases. Defining the regulatory problem
The overarching regulatory problem for this determination is to recommend an efficient and equitable set of heavy charges that adequately recovers the cost of road construction and maintenance for heavy vehicles over time. In doing so, the NTC is required to adhere to the pricing principles that originate from the Australian Transport Council (the predecessor of SCOTI) and the Council of Australian Governments (COAG). Furthermore, as part of the review process, the NTC has identified a number of secondary problems with the current PAYGO system, which have been addressed as part of this determination:

Heavy vehicle charges determination – RIS February 2014 v
how best to calculate the cost base ensuring ongoing cost recovery how to produce a consistent set of usage data how to ensure accurate and consistent reporting of expenditure data, and increase the
accountability of jurisdictional cost submissions what the most efficient and equitable structure of heavy vehicle charges is in terms of axle
grouping charging and split between RUC and registration how to improve the methodology for calculating pavement wear impacts of different vehicle
classes how to appropriately adjust heavy vehicle charges from one year to the next what the most appropriate approach to concessions and rebates is what the most appropriate mechanism for recovering NHVR costs in accordance with the
NHVR intergovernmental agreement is.
The options and implementation
This determination presents a range of charges options which can then be compared to the counterfactual. The Base Case (Annual Adjustment) represents the charges that would be in place if there were no determination, and an annual adjustment were made to the current charges as required by legislation. The annual adjustment increases current charges to ensure that overall cost recovery keeps pace with changes in road expenditure and vehicle usage. Under the Base Case, registration charges are set on the basis of an estimate of vehicle numbers at 420,246 using data from the Survey of Motor Vehicle Use.
The four alternative charging options considered in the RIS are described below, all of which incorporate the recovery of NHVR costs.
The option described as Updated Status Quo represents the minimal change that would need to be undertaken in any determination. This involves using the charges methodology underpinning the current charges with updated road expenditure and vehicle usage data. In addition, this option uses the most recent vehicle numbers from jurisdiction registration databases to estimate registration revenue.
Option A incorporates a range of technical improvements resulting from the Review and further work undertaken since then while maintaining the current split in revenue raised through RUC and registration charges.
Options B and C include the same technical improvements as Option A, but recover a higher proportion of revenue through RUC than is currently the case. Option B represents a moderate shift whereas Option C represents the most significant shift that could reasonably be accommodated while leaving room for future annual adjustments.
The technical improvements included in Option A, Option B and Option C include all technical improvements recommended by the Review, such as ESA refinement, modular axle charging, and change of cost measurement.
The NTC found there was a strong efficiency argument for increasing the RUC to approximately 72%, which closely aligns with Option B. The option advocates approximately 72% recovery via RUC. When examining the practicalities of a higher variable charge and in particular avoiding the 38.1c/l excise cap, there did appear to be sufficient headroom to go beyond 72%; that is, there was adequate room to accommodate future annual adjustment increases without breaching the cap.
After considering the equity issues involved with setting the RUC, there appears to be no compelling case to either increase or decrease the level of RUC beyond what is determined to be efficient or practical.
Based on the analysis presented in this determination, there is a strong efficiency argument for Option B. However, Option A creates the least change in terms of revenue impacts to the jurisdicitons and Commonwealth and could be implemented more quicly than either option B or C. Option C goes the furthest in terms of changes to the split in revenue through RUC and registration

Heavy vehicle charges determination – RIS February 2014 vi
charges, and like option B, it would require an inter-governmental agreement to re-distribute the additional revenue raised through RUC to states and territories.
In terms of implementation pathways, the time that would be required to negotiate and implement a revenue-redistribution agreement suggests that a phased implementation path may be appropriate if Option B or C were to be adopted. For example, If Option B was selected as the preferred option, the following two-phase approach could be adopted for implementation:
Phase 1 – Option A (effective 1 July 2014) (see table 1); and Phase 2 – Option B (future date to be determined) (see table 2).
Heavy vehicle charges determination – RIS February 2014 vii
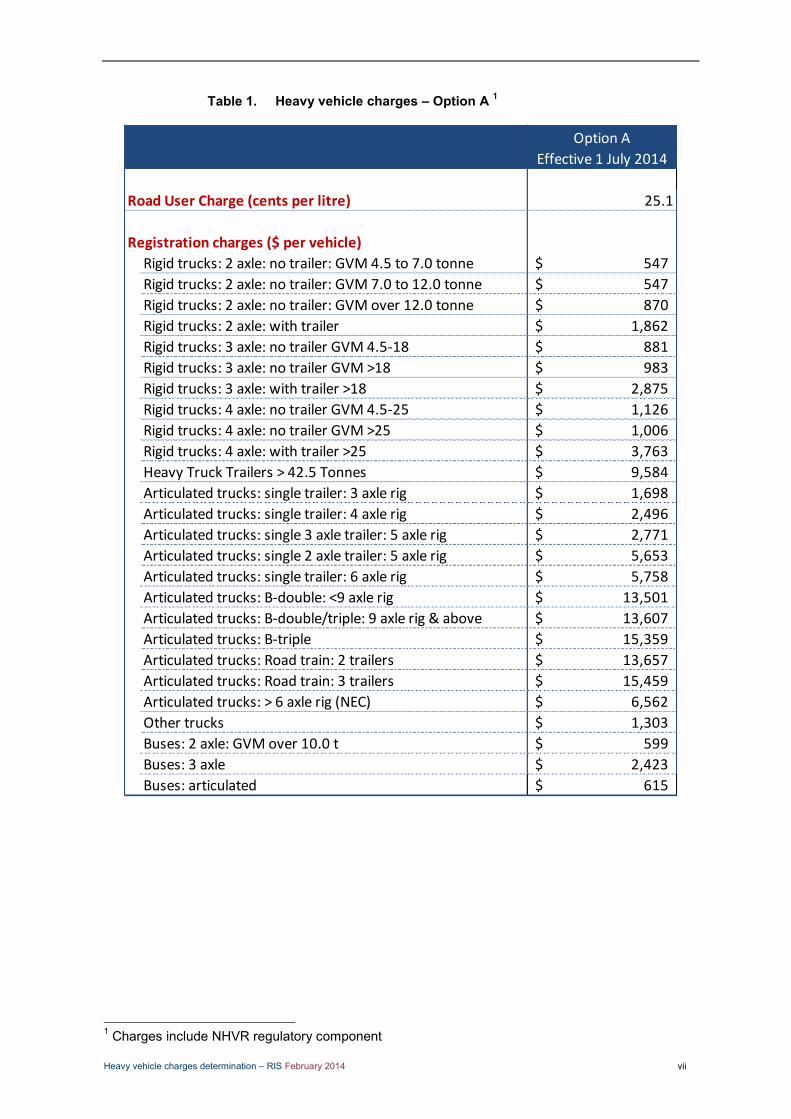
Heavy vehicle charges – Option A 1 Table 1.
1 Charges include NHVR regulatory component
Option A
Effective 1 July 2014
Road User Charge (cents per litre) 25.1
Registration charges ($ per vehicle)
Rigid trucks: 2 axle: no trailer: GVM 4.5 to 7.0 tonne 547$
Rigid trucks: 2 axle: no trailer: GVM 7.0 to 12.0 tonne 547$
Rigid trucks: 2 axle: no trailer: GVM over 12.0 tonne 870$
Rigid trucks: 2 axle: with trailer 1,862$
Rigid trucks: 3 axle: no trailer GVM 4.5-18 881$
Rigid trucks: 3 axle: no trailer GVM >18 983$
Rigid trucks: 3 axle: with trailer >18 2,875$
Rigid trucks: 4 axle: no trailer GVM 4.5-25 1,126$
Rigid trucks: 4 axle: no trailer GVM >25 1,006$
Rigid trucks: 4 axle: with trailer >25 3,763$
Heavy Truck Trailers > 42.5 Tonnes 9,584$
Articulated trucks: single trailer: 3 axle rig 1,698$
Articulated trucks: single trailer: 4 axle rig 2,496$
Articulated trucks: single 3 axle trailer: 5 axle rig 2,771$
Articulated trucks: single 2 axle trailer: 5 axle rig 5,653$
Articulated trucks: single trailer: 6 axle rig 5,758$
Articulated trucks: B-double: <9 axle rig 13,501$
Articulated trucks: B-double/triple: 9 axle rig & above 13,607$
Articulated trucks: B-triple 15,359$
Articulated trucks: Road train: 2 trailers 13,657$
Articulated trucks: Road train: 3 trailers 15,459$
Articulated trucks: > 6 axle rig (NEC) 6,562$
Other trucks 1,303$
Buses: 2 axle: GVM over 10.0 t 599$
Buses: 3 axle 2,423$
Buses: articulated 615$

Heavy vehicle charges determination – RIS February 2014 viii
Heavy vehicle charges – Option B 2 Table 2.
2 Charges include NHVR regulatory component
Option B
Effective 1 July 2015
Road User Charge (cents per litre) 29.0
Registration charges ($ per vehicle)
Rigid trucks: 2 axle: no trailer: GVM 4.5 to 7.0 tonne 484$
Rigid trucks: 2 axle: no trailer: GVM 7.0 to 12.0 tonne 484$
Rigid trucks: 2 axle: no trailer: GVM over 12.0 tonne 704$
Rigid trucks: 2 axle: with trailer 1,448$
Rigid trucks: 3 axle: no trailer GVM 4.5-18 715$
Rigid trucks: 3 axle: no trailer GVM >18 805$
Rigid trucks: 3 axle: with trailer >18 2,202$
Rigid trucks: 4 axle: no trailer GVM 4.5-25 960$
Rigid trucks: 4 axle: no trailer GVM >25 828$
Rigid trucks: 4 axle: with trailer >25 2,877$
Heavy Truck Trailers > 42.5 Tonnes 7,220$
Articulated trucks: single trailer: 3 axle rig 1,367$
Articulated trucks: single trailer: 4 axle rig 1,955$
Articulated trucks: single 3 axle trailer: 5 axle rig 2,158$
Articulated trucks: single 2 axle trailer: 5 axle rig 4,283$
Articulated trucks: single trailer: 6 axle rig 4,361$
Articulated trucks: B-double: <9 axle rig 10,223$
Articulated trucks: B-double/triple: 9 axle rig & above 10,300$
Articulated trucks: B-triple 11,605$
Articulated trucks: Road train: 2 trailers 10,350$
Articulated trucks: Road train: 3 trailers 11,705$
Articulated trucks: > 6 axle rig (NEC) 5,093$
Other trucks 1,043$
Buses: 2 axle: GVM over 10.0 t 599$
Buses: 3 axle 1,900$
Buses: articulated 615$
Heavy vehicle charges determination – RIS February 2014 ix
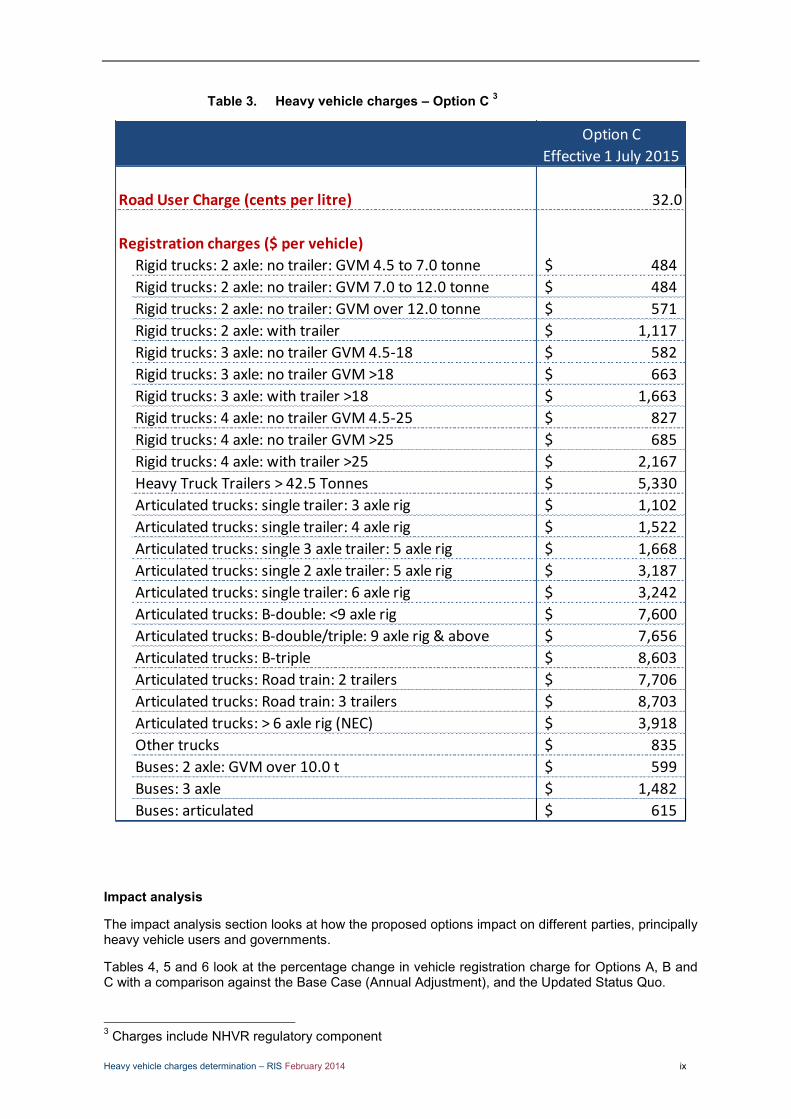
Heavy vehicle charges – Option C 3 Table 3.
Impact analysis
The impact analysis section looks at how the proposed options impact on different parties, principally heavy vehicle users and governments.
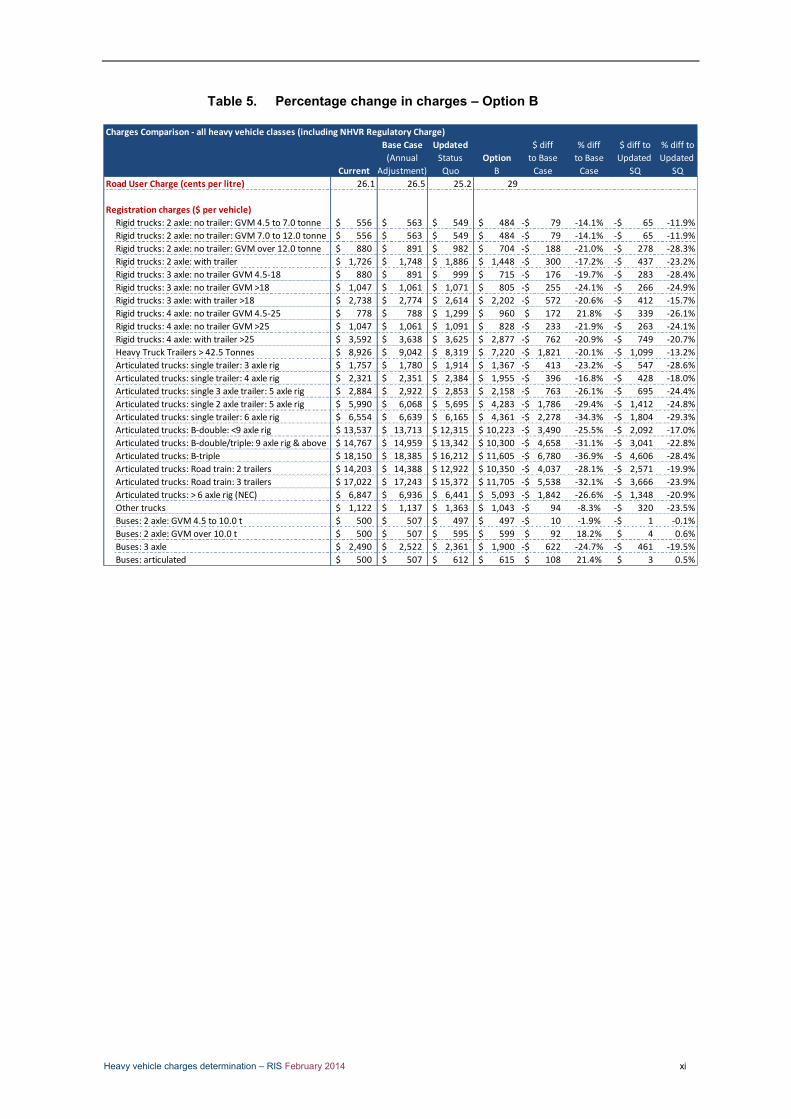
Tables 4, 5 and 6 look at the percentage change in vehicle registration charge for Options A, B and C with a comparison against the Base Case (Annual Adjustment), and the Updated Status Quo.
3 Charges include NHVR regulatory component
Option C
Effective 1 July 2015
Road User Charge (cents per litre) 32.0
Registration charges ($ per vehicle)
Rigid trucks: 2 axle: no trailer: GVM 4.5 to 7.0 tonne 484$
Rigid trucks: 2 axle: no trailer: GVM 7.0 to 12.0 tonne 484$
Rigid trucks: 2 axle: no trailer: GVM over 12.0 tonne 571$
Rigid trucks: 2 axle: with trailer 1,117$
Rigid trucks: 3 axle: no trailer GVM 4.5-18 582$
Rigid trucks: 3 axle: no trailer GVM >18 663$
Rigid trucks: 3 axle: with trailer >18 1,663$
Rigid trucks: 4 axle: no trailer GVM 4.5-25 827$
Rigid trucks: 4 axle: no trailer GVM >25 685$
Rigid trucks: 4 axle: with trailer >25 2,167$
Heavy Truck Trailers > 42.5 Tonnes 5,330$
Articulated trucks: single trailer: 3 axle rig 1,102$
Articulated trucks: single trailer: 4 axle rig 1,522$
Articulated trucks: single 3 axle trailer: 5 axle rig 1,668$
Articulated trucks: single 2 axle trailer: 5 axle rig 3,187$
Articulated trucks: single trailer: 6 axle rig 3,242$
Articulated trucks: B-double: <9 axle rig 7,600$
Articulated trucks: B-double/triple: 9 axle rig & above 7,656$
Articulated trucks: B-triple 8,603$
Articulated trucks: Road train: 2 trailers 7,706$
Articulated trucks: Road train: 3 trailers 8,703$
Articulated trucks: > 6 axle rig (NEC) 3,918$
Other trucks 835$
Buses: 2 axle: GVM over 10.0 t 599$
Buses: 3 axle 1,482$
Buses: articulated 615$
Heavy vehicle charges determination – RIS February 2014 x
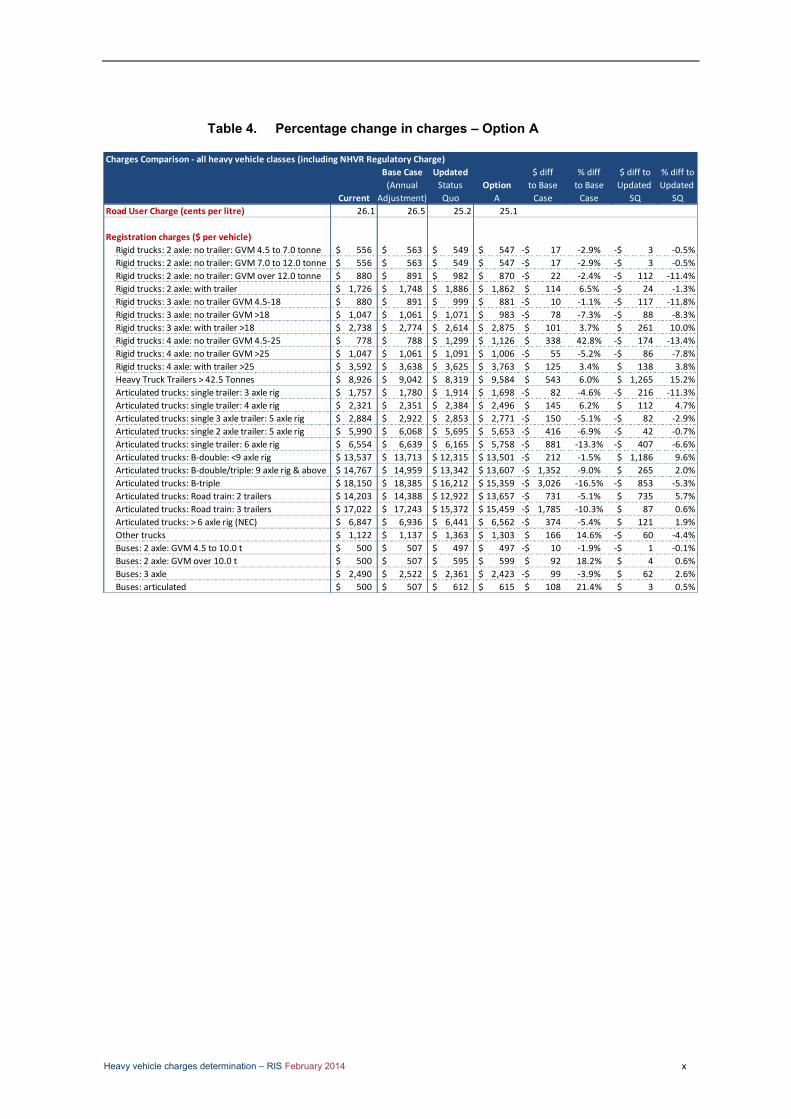
Percentage change in charges – Option A Table 4.
Charges Comparison - all heavy vehicle classes (including NHVR Regulatory Charge)
Base Case Updated $ diff % diff $ diff to % diff to
(Annual Status Option to Base to Base Updated Updated
Current Adjustment) Quo A Case Case SQ SQ
Road User Charge (cents per litre) 26.1 26.5 25.2 25.1
Registration charges ($ per vehicle)
1 Rigid trucks: 2 axle: no trailer: GVM 4.5 to 7.0 tonne 556$ 563$ 549$ 547$ 17-$ -2.9% 3-$ -0.5%
2 Rigid trucks: 2 axle: no trailer: GVM 7.0 to 12.0 tonne 556$ 563$ 549$ 547$ 17-$ -2.9% 3-$ -0.5%
3 Rigid trucks: 2 axle: no trailer: GVM over 12.0 tonne 880$ 891$ 982$ 870$ 22-$ -2.4% 112-$ -11.4%
4 Rigid trucks: 2 axle: with trailer 1,726$ 1,748$ 1,886$ 1,862$ 114$ 6.5% 24-$ -1.3%
5 Rigid trucks: 3 axle: no trailer GVM 4.5-18 880$ 891$ 999$ 881$ 10-$ -1.1% 117-$ -11.8%
6 Rigid trucks: 3 axle: no trailer GVM >18 1,047$ 1,061$ 1,071$ 983$ 78-$ -7.3% 88-$ -8.3%
7 Rigid trucks: 3 axle: with trailer >18 2,738$ 2,774$ 2,614$ 2,875$ 101$ 3.7% 261$ 10.0%
8 Rigid trucks: 4 axle: no trailer GVM 4.5-25 778$ 788$ 1,299$ 1,126$ 338$ 42.8% 174-$ -13.4%
9 Rigid trucks: 4 axle: no trailer GVM >25 1,047$ 1,061$ 1,091$ 1,006$ 55-$ -5.2% 86-$ -7.8%
# Rigid trucks: 4 axle: with trailer >25 3,592$ 3,638$ 3,625$ 3,763$ 125$ 3.4% 138$ 3.8%
# Heavy Truck Trailers > 42.5 Tonnes 8,926$ 9,042$ 8,319$ 9,584$ 543$ 6.0% 1,265$ 15.2%
# Articulated trucks: single trailer: 3 axle rig 1,757$ 1,780$ 1,914$ 1,698$ 82-$ -4.6% 216-$ -11.3%
# Articulated trucks: single trailer: 4 axle rig 2,321$ 2,351$ 2,384$ 2,496$ 145$ 6.2% 112$ 4.7%
# Articulated trucks: single 3 axle trailer: 5 axle rig 2,884$ 2,922$ 2,853$ 2,771$ 150-$ -5.1% 82-$ -2.9%
# Articulated trucks: single 2 axle trailer: 5 axle rig 5,990$ 6,068$ 5,695$ 5,653$ 416-$ -6.9% 42-$ -0.7%
# Articulated trucks: single trailer: 6 axle rig 6,554$ 6,639$ 6,165$ 5,758$ 881-$ -13.3% 407-$ -6.6%
# Articulated trucks: B-double: <9 axle rig 13,537$ 13,713$ 12,315$ 13,501$ 212-$ -1.5% 1,186$ 9.6%
# Articulated trucks: B-double/triple: 9 axle rig & above 14,767$ 14,959$ 13,342$ 13,607$ 1,352-$ -9.0% 265$ 2.0%
# Articulated trucks: B-triple 18,150$ 18,385$ 16,212$ 15,359$ 3,026-$ -16.5% 853-$ -5.3%
# Articulated trucks: Road train: 2 trailers 14,203$ 14,388$ 12,922$ 13,657$ 731-$ -5.1% 735$ 5.7%
# Articulated trucks: Road train: 3 trailers 17,022$ 17,243$ 15,372$ 15,459$ 1,785-$ -10.3% 87$ 0.6%
# Articulated trucks: > 6 axle rig (NEC) 6,847$ 6,936$ 6,441$ 6,562$ 374-$ -5.4% 121$ 1.9%
# Other trucks 1,122$ 1,137$ 1,363$ 1,303$ 166$ 14.6% 60-$ -4.4%
# Buses: 2 axle: GVM 4.5 to 10.0 t 500$ 507$ 497$ 497$ 10-$ -1.9% 1-$ -0.1%
# Buses: 2 axle: GVM over 10.0 t 500$ 507$ 595$ 599$ 92$ 18.2% 4$ 0.6%
# Buses: 3 axle 2,490$ 2,522$ 2,361$ 2,423$ 99-$ -3.9% 62$ 2.6%
# Buses: articulated 500$ 507$ 612$ 615$ 108$ 21.4% 3$ 0.5%
Heavy vehicle charges determination – RIS February 2014 xi
Percentage change in charges – Option B Table 5.
Charges Comparison - all heavy vehicle classes (including NHVR Regulatory Charge)
Base Case Updated $ diff % diff $ diff to % diff to
(Annual Status Option to Base to Base Updated Updated
Current Adjustment) Quo B Case Case SQ SQ
Road User Charge (cents per litre) 26.1 26.5 25.2 29
Registration charges ($ per vehicle)
Rigid trucks: 2 axle: no trailer: GVM 4.5 to 7.0 tonne 556$ 563$ 549$ 484$ 79-$ -14.1% 65-$ -11.9%
Rigid trucks: 2 axle: no trailer: GVM 7.0 to 12.0 tonne 556$ 563$ 549$ 484$ 79-$ -14.1% 65-$ -11.9%
Rigid trucks: 2 axle: no trailer: GVM over 12.0 tonne 880$ 891$ 982$ 704$ 188-$ -21.0% 278-$ -28.3%
Rigid trucks: 2 axle: with trailer 1,726$ 1,748$ 1,886$ 1,448$ 300-$ -17.2% 437-$ -23.2%
Rigid trucks: 3 axle: no trailer GVM 4.5-18 880$ 891$ 999$ 715$ 176-$ -19.7% 283-$ -28.4%
Rigid trucks: 3 axle: no trailer GVM >18 1,047$ 1,061$ 1,071$ 805$ 255-$ -24.1% 266-$ -24.9%
Rigid trucks: 3 axle: with trailer >18 2,738$ 2,774$ 2,614$ 2,202$ 572-$ -20.6% 412-$ -15.7%
Rigid trucks: 4 axle: no trailer GVM 4.5-25 778$ 788$ 1,299$ 960$ 172$ 21.8% 339-$ -26.1%
Rigid trucks: 4 axle: no trailer GVM >25 1,047$ 1,061$ 1,091$ 828$ 233-$ -21.9% 263-$ -24.1%
Rigid trucks: 4 axle: with trailer >25 3,592$ 3,638$ 3,625$ 2,877$ 762-$ -20.9% 749-$ -20.7%
Heavy Truck Trailers > 42.5 Tonnes 8,926$ 9,042$ 8,319$ 7,220$ 1,821-$ -20.1% 1,099-$ -13.2%
Articulated trucks: single trailer: 3 axle rig 1,757$ 1,780$ 1,914$ 1,367$ 413-$ -23.2% 547-$ -28.6%
Articulated trucks: single trailer: 4 axle rig 2,321$ 2,351$ 2,384$ 1,955$ 396-$ -16.8% 428-$ -18.0%
Articulated trucks: single 3 axle trailer: 5 axle rig 2,884$ 2,922$ 2,853$ 2,158$ 763-$ -26.1% 695-$ -24.4%
Articulated trucks: single 2 axle trailer: 5 axle rig 5,990$ 6,068$ 5,695$ 4,283$ 1,786-$ -29.4% 1,412-$ -24.8%
Articulated trucks: single trailer: 6 axle rig 6,554$ 6,639$ 6,165$ 4,361$ 2,278-$ -34.3% 1,804-$ -29.3%
Articulated trucks: B-double: <9 axle rig 13,537$ 13,713$ 12,315$ 10,223$ 3,490-$ -25.5% 2,092-$ -17.0%
Articulated trucks: B-double/triple: 9 axle rig & above 14,767$ 14,959$ 13,342$ 10,300$ 4,658-$ -31.1% 3,041-$ -22.8%
Articulated trucks: B-triple 18,150$ 18,385$ 16,212$ 11,605$ 6,780-$ -36.9% 4,606-$ -28.4%
Articulated trucks: Road train: 2 trailers 14,203$ 14,388$ 12,922$ 10,350$ 4,037-$ -28.1% 2,571-$ -19.9%
Articulated trucks: Road train: 3 trailers 17,022$ 17,243$ 15,372$ 11,705$ 5,538-$ -32.1% 3,666-$ -23.9%
Articulated trucks: > 6 axle rig (NEC) 6,847$ 6,936$ 6,441$ 5,093$ 1,842-$ -26.6% 1,348-$ -20.9%
Other trucks 1,122$ 1,137$ 1,363$ 1,043$ 94-$ -8.3% 320-$ -23.5%
Buses: 2 axle: GVM 4.5 to 10.0 t 500$ 507$ 497$ 497$ 10-$ -1.9% 1-$ -0.1%
Buses: 2 axle: GVM over 10.0 t 500$ 507$ 595$ 599$ 92$ 18.2% 4$ 0.6%
Buses: 3 axle 2,490$ 2,522$ 2,361$ 1,900$ 622-$ -24.7% 461-$ -19.5%
Buses: articulated 500$ 507$ 612$ 615$ 108$ 21.4% 3$ 0.5%

Heavy vehicle charges determination – RIS February 2014 xii
Percentage change in charges – Option C Table 6.
Charges Comparison - all heavy vehicle classes (including NHVR Regulatory Charge)
Base Case Updated $ diff % diff $ diff to % diff to
(Annual Status Option to Base to Base Updated Updated
Current Adjustment) Quo C Case Case SQ SQ
Road User Charge (cents per litre) 26.1 26.5 25.2 32
Registration charges ($ per vehicle)
Rigid trucks: 2 axle: no trailer: GVM 4.5 to 7.0 tonne 556$ 563$ 549$ 484$ 79-$ -14.1% 65-$ -11.9%
Rigid trucks: 2 axle: no trailer: GVM 7.0 to 12.0 tonne 556$ 563$ 549$ 484$ 79-$ -14.1% 65-$ -11.9%
Rigid trucks: 2 axle: no trailer: GVM over 12.0 tonne 880$ 891$ 982$ 571$ 321-$ -36.0% 411-$ -41.9%
Rigid trucks: 2 axle: with trailer 1,726$ 1,748$ 1,886$ 1,117$ 631-$ -36.1% 768-$ -40.7%
Rigid trucks: 3 axle: no trailer GVM 4.5-18 880$ 891$ 999$ 582$ 309-$ -34.7% 417-$ -41.7%
Rigid trucks: 3 axle: no trailer GVM >18 1,047$ 1,061$ 1,071$ 663$ 398-$ -37.5% 409-$ -38.2%
Rigid trucks: 3 axle: with trailer >18 2,738$ 2,774$ 2,614$ 1,663$ 1,110-$ -40.0% 950-$ -36.4%
Rigid trucks: 4 axle: no trailer GVM 4.5-25 778$ 788$ 1,299$ 827$ 39$ 4.9% 473-$ -36.4%
Rigid trucks: 4 axle: no trailer GVM >25 1,047$ 1,061$ 1,091$ 685$ 375-$ -35.4% 406-$ -37.2%
Rigid trucks: 4 axle: with trailer >25 3,592$ 3,638$ 3,625$ 2,167$ 1,471-$ -40.4% 1,458-$ -40.2%
Heavy Truck Trailers > 42.5 Tonnes 8,926$ 9,042$ 8,319$ 5,330$ 3,712-$ -41.1% 2,990-$ -35.9%
Articulated trucks: single trailer: 3 axle rig 1,757$ 1,780$ 1,914$ 1,102$ 678-$ -38.1% 812-$ -42.4%
Articulated trucks: single trailer: 4 axle rig 2,321$ 2,351$ 2,384$ 1,522$ 829-$ -35.2% 861-$ -36.1%
Articulated trucks: single 3 axle trailer: 5 axle rig 2,884$ 2,922$ 2,853$ 1,668$ 1,254-$ -42.9% 1,186-$ -41.6%
Articulated trucks: single 2 axle trailer: 5 axle rig 5,990$ 6,068$ 5,695$ 3,187$ 2,882-$ -47.5% 2,508-$ -44.0%
Articulated trucks: single trailer: 6 axle rig 6,554$ 6,639$ 6,165$ 3,242$ 3,396-$ -51.2% 2,922-$ -47.4%
Articulated trucks: B-double: <9 axle rig 13,537$ 13,713$ 12,315$ 7,600$ 6,113-$ -44.6% 4,715-$ -38.3%
Articulated trucks: B-double/triple: 9 axle rig & above 14,767$ 14,959$ 13,342$ 7,656$ 7,303-$ -48.8% 5,686-$ -42.6%
Articulated trucks: B-triple 18,150$ 18,385$ 16,212$ 8,603$ 9,782-$ -53.2% 7,608-$ -46.9%
Articulated trucks: Road train: 2 trailers 14,203$ 14,388$ 12,922$ 7,706$ 6,682-$ -46.4% 5,216-$ -40.4%
Articulated trucks: Road train: 3 trailers 17,022$ 17,243$ 15,372$ 8,703$ 8,540-$ -49.5% 6,669-$ -43.4%
Articulated trucks: > 6 axle rig (NEC) 6,847$ 6,936$ 6,441$ 3,918$ 3,018-$ -43.5% 2,523-$ -39.2%
Other trucks 1,122$ 1,137$ 1,363$ 835$ 302-$ -26.6% 528-$ -38.8%
Buses: 2 axle: GVM 4.5 to 10.0 t 500$ 507$ 497$ 497$ 10-$ -1.9% 1-$ -0.1%
Buses: 2 axle: GVM over 10.0 t 500$ 507$ 595$ 599$ 92$ 18.2% 4$ 0.6%
Buses: 3 axle 2,490$ 2,522$ 2,361$ 1,482$ 1,040-$ -41.2% 879-$ -37.2%
Buses: articulated 500$ 507$ 612$ 615$ 108$ 21.4% 3$ 0.5%

Heavy vehicle charges determination – RIS February 2014 xiii
Table 7 shows an estimation in the change of revenues under each option for the Commonwealth, state and territory governments.
Commonwealth and jurisdictional revenue implications Table 7.
Note: The total cost recovery for the base case is higher than the calculated cost base as charges are derived using a mid-point usage figure but revenue is estimated on an up to date registration number.
The following section provides an overview of the PAYGO charging framework, the key policy issues considered, and summary of the key recommendations to improve PAYGO.
Policy development process
In completing this draft determination, the NTC adopted a ‘co-design’ approach in formulating key recommendations and arriving at a final schedule of heavy vehicle charges. The determination builds upon the findings of the Heavy Vehicle Charges Review, which was undertaken openly and collaboratively, resulting in a high degree of transparency, a better understanding of stakeholders’ needs, and a common ownership of outcomes.
This approach included a series of stakeholder workshops, tele-presences, public forums, public consultations, and bilateral meetings. Like the charges review, the determination regulatory impact statement will be subject to the same level of public consultation and stakeholder engagement.
Background to PAYGO
PAYGO was implemented in 1995, when heavy vehicle registration charges varied widely between states and territories, resulting in significant market distortions. An operator’s competitive advantage was often dictated by the location the business was registered in, as opposed to the underlying efficiencies of the operator.
PAYGO introduced a system where industry was required to pay their fair share of government spending on roads through consistent national charges. These charges were also designed to meet a number of key efficiency and equity objectives enshrined in the first set of pricing principles.
Inherent limitations of the PAYGO charging framework
The determination aims to rectify a number of limitations of the current charging system. However, there are some inherent limitations that cannot be resolved without wholesale reform of heavy vehicle charging. These limitations include:
Averaging – Multiple levels of averaging will remain a feature of the current charging framework as more disaggregated data is not available. This includes averaging of costs across the network and usage across vehicle types.
Input data limitations – The current usage data is survey based as opposed to observable actual usage data and this will continue in the absence of any clear cost-effective alternative.
Jurisdictional Cost Recovery Summary
Base Case Updated Status Quo Option A Option B Option C
(Annual Adjustment) Registration Charge Registration Charge Registration Charge Registration Charge
Registration
New South Wales 283,308,105 268,034,646 269,059,459 210,693,626 166,338,215
Victoria 327,211,113 307,804,270 306,599,942 238,430,399 185,938,317
Queensland 323,023,582 302,963,304 304,281,757 236,144,102 183,283,014
South Australia 111,268,170 104,820,350 104,646,073 81,277,186 63,191,095
Western Australia 224,949,723 183,495,165 183,912,785 137,032,735 100,937,612
Tasmania 24,325,087 23,291,256 23,161,529 18,292,606 14,636,455
Northern Territory 21,865,229 20,300,604 20,465,336 15,900,042 12,374,178
Australian Capital Territory 3,452,570 3,395,051 3,363,573 2,744,128 2,296,227
Total Rego 1,319,403,579 1,214,104,647 1,215,490,454 940,514,826 728,995,112
Fuel
Commonwealth 1,867,014,009 1,776,765,598 1,769,714,941 2,044,690,569 2,256,210,283
Total Cost recovery(2) 3,186,417,588 2,990,870,245 2,985,205,395 2,985,205,395 2,985,205,395
HV Cost Base 2,954,750,000 2,990,870,245 2,985,205,395 2,985,205,395 2,985,205,395
New Charges
Heavy vehicle charges determination – RIS February 2014 xiv
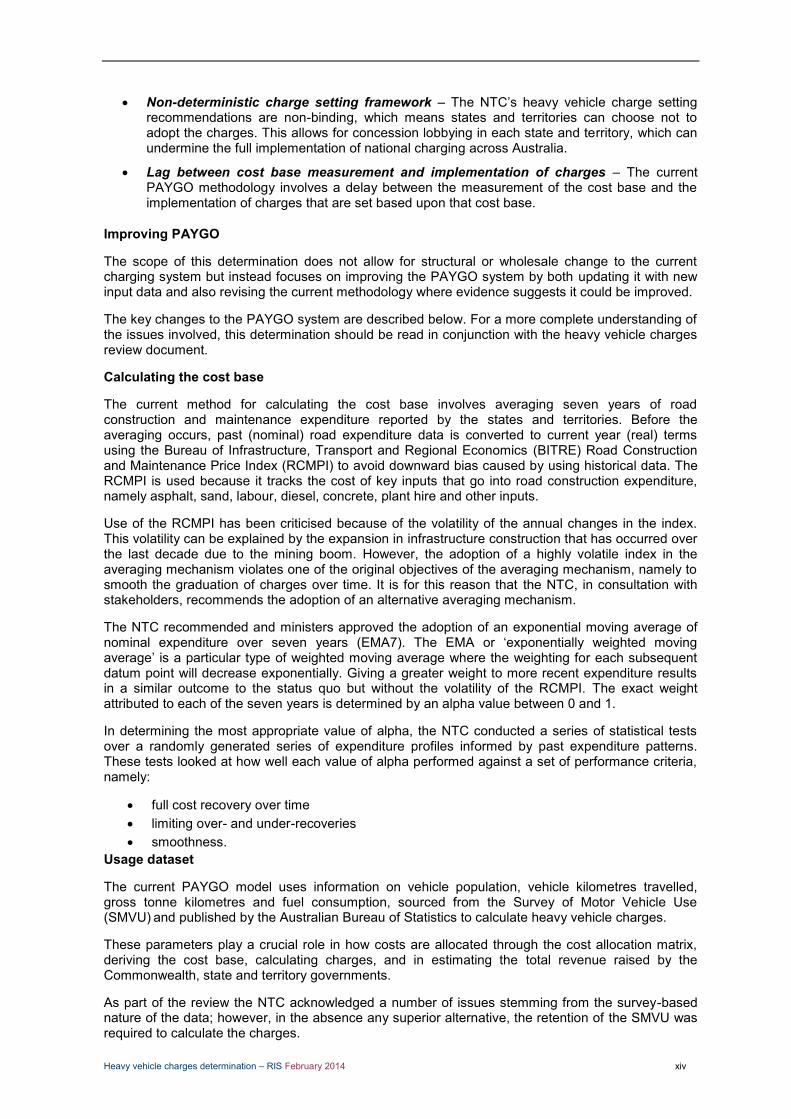
Non-deterministic charge setting framework – The NTC’s heavy vehicle charge setting recommendations are non-binding, which means states and territories can choose not to adopt the charges. This allows for concession lobbying in each state and territory, which can undermine the full implementation of national charging across Australia.
Lag between cost base measurement and implementation of charges – The current PAYGO methodology involves a delay between the measurement of the cost base and the implementation of charges that are set based upon that cost base.
Improving PAYGO
The scope of this determination does not allow for structural or wholesale change to the current charging system but instead focuses on improving the PAYGO system by both updating it with new input data and also revising the current methodology where evidence suggests it could be improved.
The key changes to the PAYGO system are described below. For a more complete understanding of the issues involved, this determination should be read in conjunction with the heavy vehicle charges review document.
Calculating the cost base
The current method for calculating the cost base involves averaging seven years of road construction and maintenance expenditure reported by the states and territories. Before the averaging occurs, past (nominal) road expenditure data is converted to current year (real) terms using the Bureau of Infrastructure, Transport and Regional Economics (BITRE) Road Construction and Maintenance Price Index (RCMPI) to avoid downward bias caused by using historical data. The RCMPI is used because it tracks the cost of key inputs that go into road construction expenditure, namely asphalt, sand, labour, diesel, concrete, plant hire and other inputs.
Use of the RCMPI has been criticised because of the volatility of the annual changes in the index. This volatility can be explained by the expansion in infrastructure construction that has occurred over the last decade due to the mining boom. However, the adoption of a highly volatile index in the averaging mechanism violates one of the original objectives of the averaging mechanism, namely to smooth the graduation of charges over time. It is for this reason that the NTC, in consultation with stakeholders, recommends the adoption of an alternative averaging mechanism.
The NTC recommended and ministers approved the adoption of an exponential moving average of nominal expenditure over seven years (EMA7). The EMA or ‘exponentially weighted moving average’ is a particular type of weighted moving average where the weighting for each subsequent datum point will decrease exponentially. Giving a greater weight to more recent expenditure results in a similar outcome to the status quo but without the volatility of the RCMPI. The exact weight attributed to each of the seven years is determined by an alpha value between 0 and 1.
In determining the most appropriate value of alpha, the NTC conducted a series of statistical tests over a randomly generated series of expenditure profiles informed by past expenditure patterns. These tests looked at how well each value of alpha performed against a set of performance criteria, namely:
full cost recovery over time limiting over- and under-recoveries smoothness.
Usage dataset
The current PAYGO model uses information on vehicle population, vehicle kilometres travelled, gross tonne kilometres and fuel consumption, sourced from the Survey of Motor Vehicle Use (SMVU) and published by the Australian Bureau of Statistics to calculate heavy vehicle charges.
These parameters play a crucial role in how costs are allocated through the cost allocation matrix, deriving the cost base, calculating charges, and in estimating the total revenue raised by the Commonwealth, state and territory governments.
As part of the review the NTC acknowledged a number of issues stemming from the survey-based nature of the data; however, in the absence any superior alternative, the retention of the SMVU was required to calculate the charges.

Heavy vehicle charges determination – RIS February 2014 xv
The review concluded that an up-to-date estimate of vehicle numbers should be used instead of a midpoint, and the estimate should be consistent with actual registration data supplied by the states and territories. In particular, the estimate should include ‘inactive’ vehicles.4 These changes were necessary to ensure consistency in the final heavy vehicle charges calculation; that is, an up-to-date estimate of costs should be spread over an up-to-date estimate of vehicle numbers, not a deflated midpoint. In addition, Options A, B and C use registration data supplied by the states and territories to ensure estimates of revenue from registration charges are accurate.
A key outcome of using updated vehicle numbers, based on actual registration figures has been a reduction in per vehicle registration charges.
In the determination the NTC also found that attempting to use a trended estimate for usage parameters created a number of nonsensical outcomes – that is, negative usage values. To resolve this issue the NTC employed a weighted averaging methodology similar to that used for the cost base calculation. Because of the two year survey frequency, there are only three data points within the seven-year window, so the the result is adjusted for recent changes in total vehicle numbers.
Expenditure template and accountability
Presently the NTC is required to accept expenditure data reported by each jurisdiction without mandate or additional powers to audit or independently assess the prudency or efficiency of those costs. There is also no role for the NTC to conduct any assessment on whether the jurisdictional expenditure data has been reported correctly.
In other network infrastructure businesses, expenditure accountability is a key feature of the regulatory regime, where capital and operational costs are reviewed ex-ante, ex-post or both. Designing an appropriate framework for the scrutiny of costs can deliver significant efficiency benefits for road users.
As part of the determination process, the NTC investigated the possibility of introducing procedural-style audits that would assess the accuracy and consistency of jurisdictional cost reporting through the NTC expenditure template. In assessing which of the options to recommend, the NTC carefully considered both industry expectations and jurisdictional resource constraints.
As part of broader accountability measures, the NTC has also committed to further investigating the introduction of benchmark reporting of jurisdictional costs. Benchmarking is an important accountability tool used in other network infrastructure businesses and helps explain cost differential to users of the network.
Charges for articulated trailers
The current charges system allocates costs, and sets charges based on vehicle configuration. While this approach works for the rigid fleet, it creates unintended distortions for articulated vehicles and trailers given their modular nature; that is, trailers and prime movers can be configured in a number of ways to form different combinations. In particular, ‘A-trailer’ charges have traditionally been set higher than other axle types in an attempt to ensure B-doubles ‘pay their way’. Sections of industry argued that operators who used A-trailers outside of the B-double configuration were being unfairly penalised; in addition, the relatively high A-trailer charge was dis-incentivising the use of safer and more productive vehicles. The review concluded that future charges for articulated vehicles and trailers should acknowledge their modularity, and proposed alternative methods for achieving that goal. As part of the draft determination, the NTC concluded that the axle grouping charge approach was superior because it: delivers a more accurate representation of the load carrying capacity that results in the road pavement impact; provides a logical progression of charges, meets the heavy vehicle charges requirements set by COAG; and provides a simple and easy-to-understand charging structure. Estimation of relative levels of pavement wear
All heavy vehicles are responsible for different levels of pavement wear, and measuring each vehicle’s relative impact is important in determining what charges they pay. In the PAYGO model, 4 Vehicles that pay registration but do not travel on public roads during the relevant survey period.

Heavy vehicle charges determination – RIS February 2014 xvi
pavement wear is measured using the equivalent standard axle (ESA) methodology. As part of the review, a number of issues arose requiring a re-examination of certain aspects of the methodology.
The review recommended the re-assessment of bus and coach ESAs due to misclassification of weigh-in-motion (WIM) records used to derive the ESA estimate. When categorising WIM records between vehicle classes, an overlap in wheelbase ranges made it impossible to distinguish certain rigid trucks from certain buses/coaches using WIM data alone. Research conducted as part of the determination has resolved this problem using verification techniques like number plate recognition technology to derive more accurate ESA estimates for buses and coaches.
As part of the draft determination, the NTC recommends the adoption of modular ESAs for allocating costs to articulated vehicles. This is similar to the articulated charging issue. Modular ESAs are superior in that they acknowledge that articulated vehicles are modular in their use, and therefore the measurement of their relative impact on pavement wear should also be modular.
An assumption of the PAYGO model is that light vehicles (vehicles weighing less than 4.5t) cause no pavement wear. This assumption is made on the basis that a well-built road designed for trucks will not be damaged by cars. Industry raised doubts about this assumption; however, after reviewing the latest research into the issue, the NTC concluded that the assumption does hold and ESA values for light vehicles should remain at zero for as part of this determination. The NTC may re-examine this assumption in a future determination if new research becomes available.
Annual adjustment
The annual adjustment process amends charges between determinations to take account of changes in heavy vehicle expenditure while also reflecting changes in the overall fleet size and mix between light and heavy vehicles. It was designed as a relatively simple, cost-effective and mechanistic method by which charges could be adjusted each year to ensure ongoing cost recovery.
The review found a number of issues relating to the current annual adjustment formula, and concluded it did not accurately reflect the changes in expenditure and usage from year to year. The review also recommended the adoption of an alternative formula.
As part of the draft determination, the NTC has explored a number of options and recommended the adoption of a ‘dynamic annual adjustment formula’. The key difference with this approach is that it better reflects actual changes in usage and expenditure from year to year between determinations.
Rebates / concessions / national charges
The purpose of this determination is to recommend a set of national heavy vehicle charges. However, states and territories have the ability to modify the national charges through rebates and concessions. As part of the determination, the NTC has recommended that jurisdictions consider the following principles when granting rebates or concessions:
Define clear objectives – define the problem and set clear objectives for the concession.
Minimise distortions – structure the concession to achieve the objective in the least distorted way (e.g. it should not impact on vehicle choice).
Ensure transparency – make the concession transparent in terms of the objective and the size of the subsidy.
Monitor and review – monitor and review the concession over time to see how much is being recovered and whether the original objectives are being met.
With respect to the road train discount and remote community service obligation (CSO), the NTC recommends setting the roads component of the converter dolly registration charge to zero, with the regulatory component remaining unchanged.
NHVR funding
The National Heavy Vehicle Regulator (NHVR) commenced operations on 21 January 2013, and is expected to commence administering the National Heavy Vehicle Law in the near future. As part of the determination, the NTC has been tasked with designing the mechanism for the recovery of ongoing NHVR costs as per the NHVR intergovernmental agreement.

Heavy vehicle charges determination – RIS February 2014 xvii
In evaluating various cost recovery options, the NTC concluded that when spreading the costs among vehicle classes primary consideration should be given to preserving the natural progression of charges as payload capacity increases, and to that end, the NTC recommends a ‘multifactor allocation mechanism’ for the recovery of NHVR costs.
Summary of recommendations
Presented in Table 8 is a summary of the recommendations to improve the current PAYGO system. These recommendations build upon previous recommendations made as part of the Heavy Vehicle Charges Review.
Summary of recommendations Table 8.
Issue Draft recommendations
1. Calculating the cost base The use of an exponential moving average (EMA) calculated over a 7 year period with an alpha value of 0.50.
2. Usage dataset The use of an EMA with three-year weights and alpha value consistent with that used in the cost base calculation (0.5).
3. Expenditure template and accountability
Implementation of a one-off audit/review of expenditure data modelled on ‘Option 4 – Site visit with detailed testing’ from next financial year.
The audit timing should take into account jurisdictional resource constraints (anticipated post October 2014 completion date).
The audit is paid for by respective jurisdictions. The cost of the audit is reported in the NTC expenditure
template and recoverable from heavy vehicles only. The NTC will coordinate the procurement and execution of
the audit. The NTC will investigate further the introduction of
benchmark reporting in consultation with each jurisdiction and industry.
4. Charges for articulated trailers
The adoption of an axle grouping charge for all trailer axles.
5. Estimation of relative levels of pavement wear
The use of modular ESAs for the purposes of calculating heavy vehicle charges.
Further research is conducted into refining the ESA measurement.
The adoption of the revised ESA estimates for buses and coaches for use in the PAYGO model.
The retention of the current ESA values for light vehicle classes.
6. Annual adjustment The adoption of the dynamic annual adjustment formula for future annual adjustments of heavy vehicle charges.
7. Rebates / concessions / national charges
When deciding to grant ex-post rebates and concessions, jurisdictions may wish to consider the principles listed in the

Heavy vehicle charges determination – RIS February 2014 xviii
Issue Draft recommendations
rebates/concessions report. The registration charge for road train converter dollies5 are
reduced to the value of the regulatory component as a means to reduce overall charges for road trains.
8. NHVR funding The use of a multi-factor allocation mechanism for the recovery of NHVR costs.
Next steps
This draft determination RIS will be subjected to a comprehensive public consultation process. The NTC will then consider the feedback received from stakeholders and prepare a final determination RIS.
The final determination RIS will then be presented to SCOTI, with the recommendation that it approve the final recommended heavy vehicle charges.
Following a SCOTI decision, NTC would then work with states, territories and the Commonwealth to implement the approved charges in accordance with SCOTI’s decisions.Acknowledgments
The NTC acknowledges Andradi Adhiputro, Matthew Bereni, Steve Condylios, Chris Egger, Peter Halligan and Ramon Staheli in preparing this report. The NTC also acknowledges significant input from the Australian Trucking Association and its state associations, NatRoad, Cement Concrete & Aggregates Australia, the National Road Freighters Association, Australian Livestock and Rural Transporters Association, the Heavy Vehicle Charging and Investment Reform Project, the National Heavy Vehicle Regulator, the Australian Taxation Office, the Office of Best Practice Regulation, the Commonwealth Department of Infrastructure and Transport, the Department of Infrastructure, The Treasury, the Department of Infrastructure, Energy & Resources Tasmania, Transport for NSW, the Department of Transport and Main Roads Queensland, the Department of Planning, Transport and Infrastructure South Australia, Main Roads Western Australia, VicRoads and each state and territory road authority.
5 Road train converter dollies are short trailers with a draw bar, equipped with a turntable. A semi-trailer is attached to the turntable and the converter dolly then carries part of the weight carried by the attached semi-trailer. Road train converter dollies are unique to road trains and are not used in other articulated vehicle configurations such as B-doubles or B-triples.
Heavy vehicle charges determination – RIS February 2014 1
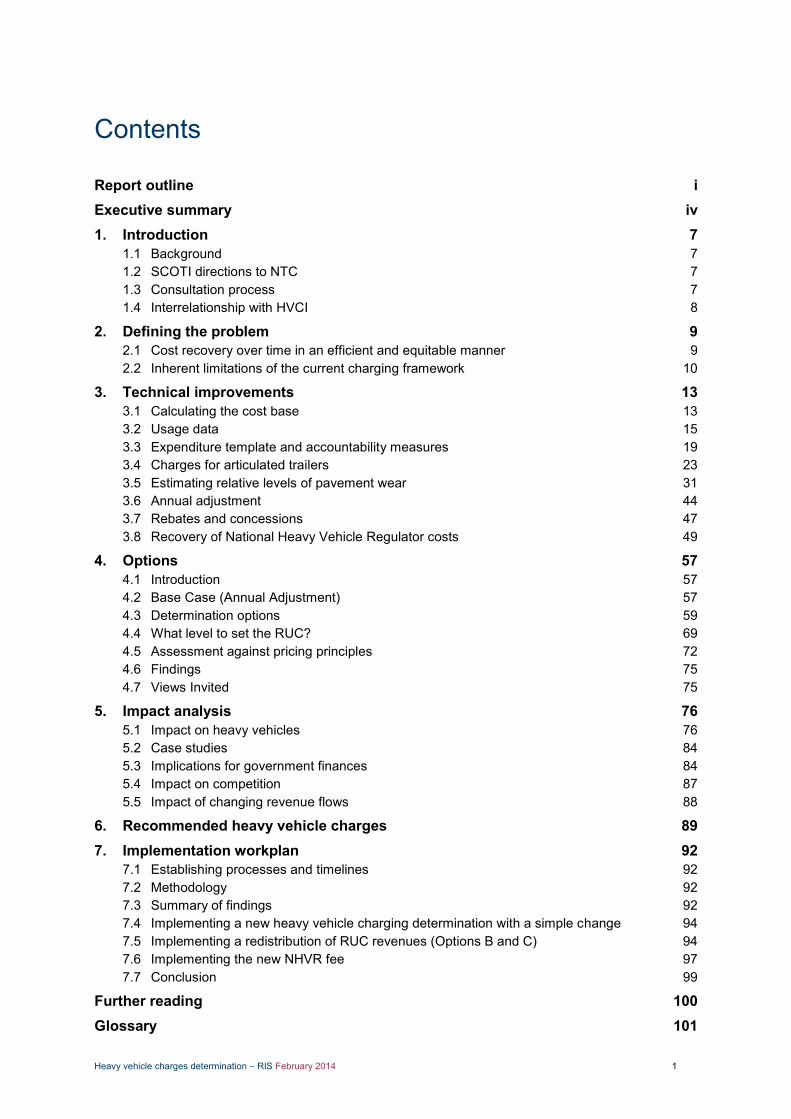
Contents
Report outline i Executive summary iv
1. Introduction 7
1.1 Background 7 1.2 SCOTI directions to NTC 7 1.3 Consultation process 7 1.4 Interrelationship with HVCI 8
2. Defining the problem 9 2.1 Cost recovery over time in an efficient and equitable manner 9 2.2 Inherent limitations of the current charging framework 10
3. Technical improvements 13
3.1 Calculating the cost base 13 3.2 Usage data 15 3.3 Expenditure template and accountability measures 19 3.4 Charges for articulated trailers 23 3.5 Estimating relative levels of pavement wear 31 3.6 Annual adjustment 44 3.7 Rebates and concessions 47 3.8 Recovery of National Heavy Vehicle Regulator costs 49
4. Options 57
4.1 Introduction 57 4.2 Base Case (Annual Adjustment) 57 4.3 Determination options 59 4.4 What level to set the RUC? 69 4.5 Assessment against pricing principles 72 4.6 Findings 75 4.7 Views Invited 75
5. Impact analysis 76
5.1 Impact on heavy vehicles 76 5.2 Case studies 84 5.3 Implications for government finances 84 5.4 Impact on competition 87 5.5 Impact of changing revenue flows 88
6. Recommended heavy vehicle charges 89
7. Implementation workplan 92 7.1 Establishing processes and timelines 92 7.2 Methodology 92 7.3 Summary of findings 92 7.4 Implementing a new heavy vehicle charging determination with a simple change 94 7.5 Implementing a redistribution of RUC revenues (Options B and C) 94 7.6 Implementing the new NHVR fee 97 7.7 Conclusion 99
Further reading 100
Glossary 101
Heavy vehicle charges determination – RIS February 2014 2
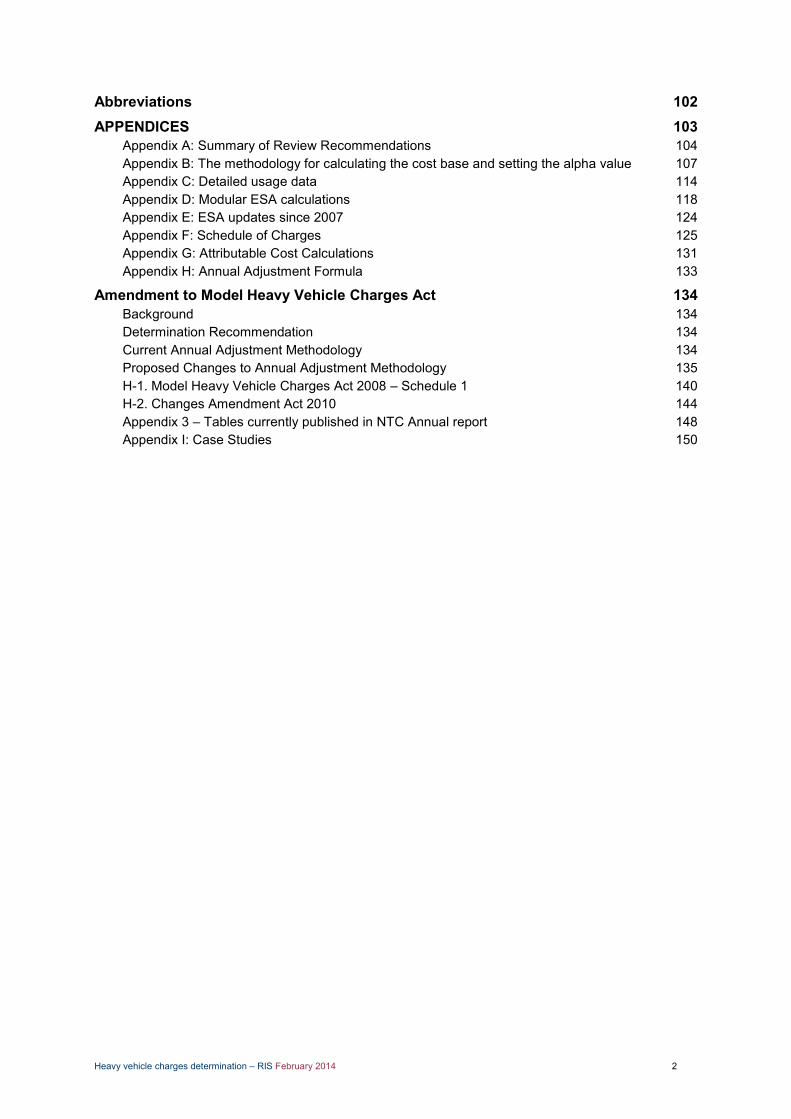
Abbreviations 102
APPENDICES 103 Appendix A: Summary of Review Recommendations 104 Appendix B: The methodology for calculating the cost base and setting the alpha value 107 Appendix C: Detailed usage data 114 Appendix D: Modular ESA calculations 118 Appendix E: ESA updates since 2007 124 Appendix F: Schedule of Charges 125 Appendix G: Attributable Cost Calculations 131 Appendix H: Annual Adjustment Formula 133
Amendment to Model Heavy Vehicle Charges Act 134
Background 134 Determination Recommendation 134 Current Annual Adjustment Methodology 134 Proposed Changes to Annual Adjustment Methodology 135 H-1. Model Heavy Vehicle Charges Act 2008 – Schedule 1 140 H-2. Changes Amendment Act 2010 144 Appendix 3 – Tables currently published in NTC Annual report 148 Appendix I: Case Studies 150
Heavy vehicle charges determination – RIS February 2014 3
List of tables
Heavy vehicle charges – Option A vii Table 1.
Heavy vehicle charges – Option B viii Table 2.
Percentage change in charges – Option A x Table 4.
Percentage change in charges – Option B xi Table 5.
Commonwealth and jurisdictional revenue implications xiii Table 7.
Summary of recommendations xvii Table 8.
SMVU availability summary 16 Table 9.
Jurisdictional scaling summary 18 Table 10.
Summary of audit options 20 Table 11.
Articulated trailer assumptions 24 Table 12.
Option A with status quo axle charges 24 Table 13.
Articulated trailer assumptions 25 Table 14.
Option A with standard axle charge 25 Table 15.
Articulated trailer assumptions 26 Table 16.
Option A with axle grouping charges 26 Table 17.
Comparison of total trailer charges outcomes 27 Table 18.
Total registration comparisons for selected heavy vehicle classes 27 Table 19.
Summary of weight characteristics and charges under each scenario 29 Table 20.
Modular calculation of AGM and ESA estimates for tri-axle semitrailers 33 Table 21.
Current, raw July 2013 and modular ESAs 34 Table 22.
Heavy vehicle bus classes 38 Table 23.
Sample size for confidence interval for specific margin of error 39 Table 24.
Bus and coach ESA estimates 42 Table 25.
Annual adjustment options 44 Table 26.
Example calculation 52 Table 27.
Allocation methodologies 53 Table 28.
Assessment of outcomes 56 Table 29.
Current charges vs Base Case (Annual Adjustment) charges 58 Table 30.
Base Case (Annual Adjustment) revenue estimate 59 Table 31.
Assumptions 60 Table 32.
Updated Status Quo charges comparison 61 Table 33.
Updated Status Quo revenue estimate 62 Table 34.

Heavy vehicle charges determination – RIS February 2014 4
Option A charges comparison 63 Table 35.
Option A revenue estimate 64 Table 36.
Option B charges comparison 65 Table 37.
Option B revenue estimate 66 Table 38.
Option C charges 67 Table 39.
Option C revenue 68 Table 40.
Common assumptions for Options A, B and C 68 Table 41.
Setting fixed and variable charges 70 Table 42.
Assessment of options against pricing principles 73 Table 43.
Comparison of percentage change in charges paid 80 Table 44.
Jurisdictional cost recovery summary 86 Table 45.
Difference in total revenue raised under Option A compared with Base Case Table 46.(annual adjustment) 87
Heavy Vehicle charges – Option A 89 Table 47.
Heavy Vehicle charges – Option B 90 Table 48.
Axle grouping charges – Options A, B and C 91 Table 50.
Summary of timing estimates 93 Table 51.
Process steps and estimated time taken to negotiate and implement a Table 52.redistribution of RUC revenues 96
Estimate of de-averaged heavy-vehicle-related road expenditure (1997 to 2012)107 Table 53.
Historic comparison of averaging methodologies 112 Table 54.
VKT 114 Table 55.
Vehicle numbers 115 Table 56.
Fuel use 116 Table 57.
GTK 117 Table 58.
Heavy vehicle charges determination – RIS February 2014 5
List of figures
Figure 1. Interrelationship with HVCI project 8
Figure 2. Timing difference illustration 11
Figure 3. Fuel use example – seven-year trend displaying negative results 16
Figure 4. Fuel use and VKT totals 17
Figure 5. SMVU use in usage data calculation 19
Figure 6. Two articulated configurations with similar payload capacity 28
Figure 7. Axle grouping charge progression of charges against GML 29
Figure 8. Axle grouping charge – progression of charges against ESA 30
Figure 9. Unlikely heavy vehicle configurations 32
Figure 10. Example of data mining used to identify unlikely heavy vehicle configurations 32
Figure 11. Example of problem vehicle configurations 33
Figure 12. Current, raw July 2013 and modular ESAs 35
Figure 13. ESA updates since 2007 36
Figure 14. Vehicle identification process used by heavy vehicle checking stations in NSW39
Figure 15. Example of TruckScan data results (NSW data only, two-axle buses ≥ 10t) 40
Figure 16. Sample axle load calculation 40
Figure 17. Sample bus usage profile 41
Figure 18. Sample urban bus loading profiles 41
Figure 19. Retrospective performance of Option 3 – CPI increase 46
Figure 20. B-triple vs double road train – status quo registration comparison 48
Figure 21. Registration charge comparison – with and without dolly discount (Option A) 48
Figure 22. Process for including NHVR costs in yearly registration charges 50
Figure 23. Current road cost recovery situation 51
Figure 24. Effect of splitting registration charge 51
Figure 25. The resulting regulatory charges for selected vehicle categories 54
Figure 26. The change in the total yearly registration charge for selected vehicle categories54
Figure 27. The percentage change in registration charges for selected vehicle categories.55
Figure 28. Setting the fixed and variable charge 70
Figure 29. Distributional efficiency impact on different vehicle type 71
Figure 30. Headroom analysis 72
Figure 31. Heavy vehicle cost components 77
Figure 32. Cost of transporting freight per vehicle type 78
Figure 33. Total charges paid per vehicle type over GTK – Option B 79

Heavy vehicle charges determination – RIS February 2014 6
Figure 34. Rigid truck: 2 axle: no trailer: GVM 4.5 to 7.0 tonne 81
Figure 35. Rigid truck: 3 axle: no trailer: GVM > 18 tonne 81
Figure 36. Heavy Truck trailer > 42.5 tonnes 82
Figure 37. Articulated trucks: single trailer: 6 axle rig 82
Figure 38. Articulated trucks: B-double: 9 axle rig & above 83
Figure 39. Articulated trucks: Road Train: 2 trailers 83
Figure 40. Articulated trucks: Road Train: 3 trailers 84
Figure 41. Number of heavy vehicles, 2003–2013 85
Figure 42. Implementation timeline for simple change 94
Figure 43. Estimated time to negotiate and implement a redistribution of RUC 95
Figure 44. Estimated time taken to implement the separately identified NHVR fee 98
Figure 45. Bounded normal distribution 108
Figure 46. Cost base scenario testing using past expenditure 109
Figure 47. Frequency distribution of optimal alpha (equal weights) 110
Figure 48. Trade-off between FCR, OU and SM: a stylised example 110
Figure 49. Frequency distribution of optimal alpha (differentiated weights) 111
Figure 50. Weights for EMA7 with alpha value equal to 0.50 112
Figure 51. Historic comparison of current methodology vs EMA7 (0.50 alpha) 113
Heavy vehicle charges determination – RIS February 2014 7
1. Introduction
1.1 Background Heavy vehicles in Australia are defined as any vehicle weighing 4.5 tonnes or heavier. These vehicles are charged an annual registration charge and a road user charge (RUC), which is levied on each litre of diesel fuel. These charges are determined according to a charging framework known as PAYGO. The primary objective of PAYGO or ‘pay as you go’ is to deliver nationally consistent heavy vehicle charges that recover both capital and operating costs related to heavy vehicle use in the year they are incurred. These charges are designed to promote the optimal use of the existing network. The National Transport Commission (NTC) has been administering the PAYGO system for almost two decades. During that time the NTC has completed several heavy vehicle charges determinations aimed at refining the PAYGO system. This determination was initiated after the ‘A-trailer’ review of February 2012, when it became apparent that the structure of charges was potentially inhibiting the use of safer and more productive vehicles. The ‘A trailer’ review also highlighted a number of limitations in both source data and methodology when calculating a final schedule of charges.
1.2 SCOTI directions to NTC In November 2012 the Standing Council on Transport and Infrastructure (SCOTI) directed the NTC to complete a comprehensive review of the heavy vehicle charging system in a two-step process. Step 1 was a comprehensive review of the current heavy vehicle charging system (the review), followed by Step 2, a new determination that recommends heavy vehicle charges based on the findings and recommendations of the completed review. The comprehensive review stage was completed in 2012 and early 2013, with the final policy paper published in May 2013. At its May 2013 meeting SCOTI endorsed NTC to proceed with a determination on the basis of the review recommendations, with one of the key recommendations being to include options for raising the RUC above its current level6. This determination builds upon the findings and analysis of the review and fulfils the second step of the review and determination process. The recommended charges, if approved, will be implemented from 1 July 2014. It is acknowledged that implementation may need to occur in multiple steps.
1.3 Consultation process The NTC has carried out the review and determination processes in cooperation with a wide range of stakeholders. The adoption of a ‘co-design’ approach has been a key feature of this process, which has resulted in a shared understanding of issues among stakeholders and co-ownership of outcomes. In completing the heavy vehicle charges review, the NTC conducted wide-ranging consultation activities including:
an initial scoping workshop policy development workshops a modelling workshop Australia-wide consultation forums bilateral consultation sessions.
6 A full summary of the review recommendations can be found in Appendix A.
Heavy vehicle charges determination – RIS February 2014 8
In progressing to the determination, the NTC committed to undertaking a similar level of consultation.
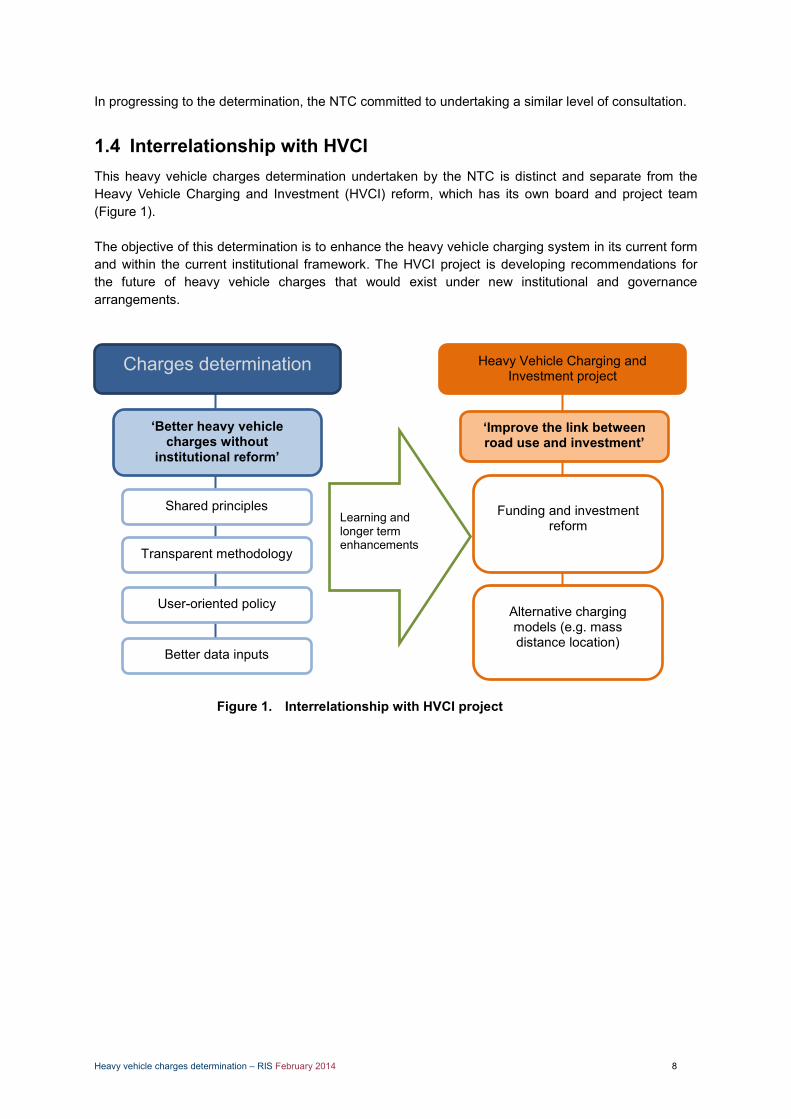
1.4 Interrelationship with HVCI This heavy vehicle charges determination undertaken by the NTC is distinct and separate from the Heavy Vehicle Charging and Investment (HVCI) reform, which has its own board and project team (Figure 1). The objective of this determination is to enhance the heavy vehicle charging system in its current form and within the current institutional framework. The HVCI project is developing recommendations for the future of heavy vehicle charges that would exist under new institutional and governance arrangements.
Figure 1. Interrelationship with HVCI project
Charges determination Heavy Vehicle Charging and Investment project
‘Better heavy vehicle charges without
institutional reform’
Shared principles
‘Improve the link between road use and investment’
Transparent methodology
User-oriented policy
Better data inputs
Alternative charging models (e.g. mass distance location)
Learning and longer term enhancements
Funding and investment reform
Heavy vehicle charges determination – RIS February 2014 9
2. Defining the problem
2.1 Cost recovery over time in an efficient and equitable manner The overarching regulatory problem for this determination is to recommend an efficient and equitable set of heavy charges that adequately recovers the cost of road construction and maintenance for heavy vehicles in Australia. In doing so, the NTC is required to adhere to the pricing principles that originate from the Australian Transport Council (ATC) (the predecessor of SCOTI) and the Council of Australian Governments (COAG). The principles are: ‘National heavy vehicle road use prices should promote optimal use of infrastructure, vehicles and transport modes. This is subject to the following:
full recovery of allocated infrastructure costs while minimising both the over and under recovery from any class of vehicle
cost effectiveness of pricing instruments transparency the need to balance administrative simplicity, efficiency and equity (e.g. impact on regional
and remote communities/access) the need to have regard to other pricing applications such as light vehicle charges, tolling and
congestion.’
Following the Productivity Commission's inquiry into road and rail infrastructure pricing, the ATC provided further direction to the NTC: ‘ATC direct the NTC, in developing its determination, to apply principles and methods that ensure the delivery of full cost recovery in aggregate, further develop indexation adjustment arrangements to ensure the ongoing delivery of full expenditure recovery in aggregate and remove cross-subsidisation across different heavy vehicle classes, recognising that transition to any new arrangement may require a phased approach’ (COAG 2007). As part of the review process, the NTC has identified several secondary problems, which are addressed in this report:
What is the best way to calculate the cost base? How to produce a consistent set of usage data? How to ensure accurate and consistent reporting of expenditure data? How will the accountability of jurisdictional cost submissions be increased? What is the most efficient and equitable structure for heavy vehicle charges in terms of axle
charging and split between RUC and registration? How can the methodology for calculating pavement wear impacts of different vehicle classes
be improved? How should heavy vehicle charges be appropriately adjusted from one year to the next? What is the most appropriate approach to concessions, rebates and road train adjustments? What is the most appropriate mechanism for recovering National Heavy Vehicle Regulator
(NHVR) costs in accordance with the NHVR intergovernmental agreement?
Heavy vehicle charges determination – RIS February 2014 10
2.2 Inherent limitations of the current charging framework While this determination seeks to address as many of the outstanding issues associated with the current heavy vehicle charging system as possible, there are inherent limitations that cannot be resolved without more extensive reform, as being considered through the HVCI project. These limitations are outlined below.
2.2.1 Averaging
It is common for an infrastructure charging regime to apply averaging to some degree, as deriving a user’s precise cost on the network is ether impossible or too costly to ascertain. The PAYGO charging framework in particular uses multiple levels of averaging to calculate heavy vehicle charges. This includes averaging multiple usage parameters and expenditure of jurisdictions.
2.2.1.1 Averaging usage data
The charging model uses Survey of Motor Vehicle Use (SMVU) data from the Australian Bureau of Statistics (ABS) for vehicle kilometres travelled (VKT), fuel consumption and gross tonne kilometres (GTK) for each vehicle category. These inputs are in the form of an average for each vehicle class. The result of this approach is that users within a vehicle class who travel less, or weigh less than the average, will pay a higher cost per tonne/kilometre than another user who travels above the average. This ‘inequity’ within vehicle class typically affects certain types of operators (e.g. primary producers who only use their vehicle seasonally to move livestock from the paddock to the point of sale). Similarly, volume-constrained operators will fare differently to mass-constrained operators. Effectively, the fact that charges for different vehicle classes are set based on average usage characteristics creates ‘winners and losers’. Which operators end up ‘winning‘ or ‘losing‘ depends on the structure of charges and the balance between registration and the RUC.
2.2.1.2 Averaging state expenditure
The heavy vehicle cost base is derived by averaging heavy-vehicle-related road expenditure across all jurisdictions. Heavy vehicle charges are then set to recover the annualised amount. However, this methodology does not ensure that the revenue returned to state or territory equals their historic or future expenditure, thus creating a disjoint between investment and revenue. This disjoint creates perverse incentives for jurisdictions when undertaking both maintenance and capital works, as the jurisdiction undertaking new works will not recoup the full value of the expenditure, while those jurisdictions who did not undertake the work will benefit, thus introducing geographic cross-subsidisation.
2.2.2 Input data limitations
The PAYGO model uses SMVU datasets from the ABS to calculate heavy vehicle charges. The ABS published these datasets annually until 2007. No data was collected in 2008 or 2009. In 2010 the survey recommenced, with the collection frequency reduced to once every two years (biennually). Reducing the frequency of the SMVU to once every two years has reduced its reliability and accuracy. Furthermore, the SMVU dataset originates from a survey rather than a full census of heavy vehicle usage, making it an estimate rather than a precise measure. This is reflected in the standard errors associated with certain vehicle classes. A further limitation of the survey method used to produce the SMVU dataset is the self-report method of data collection. Poor recollection of the required information or misunderstanding of the question can contribute to inaccuracies in the data.

Heavy vehicle charges determination – RIS February 2014 11
2.2.3 Non-deterministic charge setting framework
The NTC makes what is effectively a recommendation on national charges, which is not technically binding on state and territory governments. Non-implementation and a wide range of concessions being offered across state and territory governments have the potential to undermine the national nature of the charges. The charging framework also lacks an appropriate governance framework to provide guidance on the triggering conditions for new heavy vehicle charges determinations. This lack of clarity leads to price reviews being initiated on an ad hoc basis.
2.2.4 Lag between cost base measurement and implementation of charges
The current PAYGO methodology involves a lag between the measurement of the cost base and the implementation of charges that are set to recover the cost base. For example, the charges outlined in this draft regulatory impact statement are based on expenditure data for the seven years up to, and including, the 2012–13 financial year. However, any charges approved by SCOTI would not become effective until 1 July 2014 at the earliest. This has always been a feature of PAYGO and any associated annual adjustment mechanism. Figure 2 illustrates the delay.
Figure 2. Timing difference illustration Under PAYGO, the expenditure data and vehicle numbers estimated after the end of Year 1 (based on the seven years of expenditure and fuel consumption data leading up to and including Year 1) are used to determine the cost base and set charges that then apply throughout Year 3. These charges are collected in year 3 from the number of vehicles registered in Year 3, and on the amount of fuel used in Year 3. Changes in the estimated cost base over time will be different from changes in vehicle numbers and fuel use. This is illustrated above where the cost base expands more rapidly (measured as a
Heavy vehicle charges determination – RIS February 2014 12
percentage change) than either the number of registered vehicles or fuel consumption. Where this is the case, the following outcomes are likely to occur:
Actual revenue in Year 3 will usually be higher than the expected revenue calculated at the time the charges are set. This is because expected revenue is calculated on the basis of vehicle numbers and fuel consumption in Year 1 because this is the latest available information when charges are set.
Where the cost base expands rapidly it is possible that actual revenue in Year 3 is lower than the cost base would be for that year.
Over time, revenue will ‘catch up’ to the cost base during periods where the cost base grows more slowly than the combined revenue base of fuel consumption and vehicle numbers.
Even under a worst-case scenario where growth in the cost base permanently outpaces the combined growth in fuel consumption and vehicle numbers, the outcome is that the growth in revenue will lag the growth in the cost base. However, in the long run, total revenue will exceed total expenditure due to the revenue uplift provided by the growth in fuel consumption and vehicle numbers.
The only effective way to eliminate circumstances where there is a delay in collecting the appropriate level of revenue (to match the actual cost base) would be to set charges based on a forward looking cost base derived from forecast expenditure. While adopting a forward-looking cost base would be desirable for a number of reasons, this is a formidable task and cannot be achieved within the timeframe of this determination. This issue is currently being explored by the HVCI project.
Heavy vehicle charges determination – RIS February 2014 13
3. Technical improvements SCOTI asked the NTC to proceed with this determination on the basis of the review recommendations. A number of the review recommendations were final and these have been directly incorporated in the options presented in this determination. The review also contained a number of recommendations that required further work to be undertaken as part of the determination. These recommendations are explored in the remainder of this section, which builds on the recommendations that were made to transport ministers in the final review.
3.1 Calculating the cost base
3.1.1 Background
The heavy vehicle cost base is derived from total road expenditure reported by states and territories each year. It includes arterial road expenditure data provided by states and territories, as well as local road expenditure data from the ABS. Until the 2007 determination the NTC’s charges methodology used an average of three years of heavy vehicle allocated expenditure to calculate the cost base to be recovered through heavy vehicle charges. Following the 2007 determination this period was extended to seven years to increase the smoothing effect due to the rapid rise in road expenditure that occurred from 2003–04 onwards. The 2013 Heavy Vehicle Charges Review focused on the examination of the following three major features of the cost base calculation.
3.1.1.1 Indexing
The current methodology employs indexation as a way to estimate the cost base and to avoid downward bias caused by the application of historical data. When deriving the cost base, past (nominal) road expenditure data is converted to current year (real) terms using BITRE Road Construction and Maintenance Price Index (RCMPI). Use of the RCMPI has been criticised by numerous stakeholders because of the volatility of the annual changes in the index. During consultation with stakeholders the use of alternative indexing mechanisms was suggested. After reviewing various indexing mechanisms, the NTC recommended dropping the use of any indexing mechanisms in favour of a more mechanistic approach, which would achieve a similar outcome but would avoid confusion and outside influences. Ministers supported the NTC proceeding towards developing the determination on this basis.
3.1.1.2 Averaging period
The averaging methodology currently used to calculate the cost base relies on a seven-year simple moving average. During consultation with stakeholders, the use of alternative averaging periods was suggested. The analysis undertaken as part of the 2013 Heavy Vehicle Charges Review demonstrated that a longer averaging period (e.g. seven years) was preferable to a shorter averaging period (e.g. three years) in most cases. Consequently, the NTC recommends retaining the averaging period of seven years.
3.1.1.3 Averaging mechanism
As outlined in the 2013 Heavy Vehicle Charges Review, the use of de-averaged latest year’s expenditure data to calculate the cost base would lead to unacceptably volatile charges. It is therefore essential to use an averaging mechanism to estimate current expenditures. Several averaging mechanisms were investigated during this review. The NTC created a dedicated assessment framework to compare the respective performance of these averaging mechanisms. The assessment framework is based on the following four objectives, noting that the second and third objectives conflict.

Heavy vehicle charges determination – RIS February 2014 14
1. Full cost recovery over time 2. Limiting over and under-recoveries 3. Smoothness 4. Simple and transparent
After a comprehensive evaluation of several possible averaging mechanisms and consultation with stakeholders, the review recommended amending the current averaging mechanism in favour of an exponential moving average (EMA), with an alpha value (which determines each year’s weighting in the series) to be set during the determination process. An EMA is simply a type of weighted average where more recent observations are weighted more heavily than older observations. The alpha value determines how much weight is placed on more recent observations. The weights can be expressed as simple percentages. It is worth noting that an EMA or ‘exponentially weighted moving average’ is a particular type of weighted moving average where the weighting for each subsequent datum point will decrease exponentially. For instance, in a seven-year EMA, the latest year has weight (1-α)0=1, the second latest (1-α)1 =(1-α), down to (1-α). The alpha coefficient α represents the degree of weighting decrease, a constant smoothing factor between 0 and 1. A higher α discounts older observations faster.
3.1.2 Setting the alpha value
The review demonstrated that EMAs with higher alpha values perform best with respect to full cost recovery and limiting over and under recoveries. In contrast, lower values produce less variation from year to year – that is, they are smoother. Even though it would not lead to a desirable outcome overall, the best performing averaging mechanism with respect to full cost recovery and limiting over and under recoveries would only be for an EMA with an alpha value equal to 1. This would mean that the cost base would only be calculated using the most recent 12 months worth of road expenditure reported by states and territories. On the other end of the performance spectrum, an EMA with a zero alpha value would be the best performing averaging mechanism with respect to smoothness, although this would be at the expense of full cost recovery and limiting over and under recoveries over the same period. This type of averaging mechanism would effectively be equivalent to a simple moving average, which forms the basis of the current methodology. The review recommended the adoption of an EMA methodology but left it to the determination to explore and recommend an alpha value to set the weights to be assigned to each year of the seven-year averaging period. The methodology used to optimise the cost base calculation and set the alpha value is shown in appendix B.
3.1.3 Recommendation
Based on the analysis of the available evidence and stakeholder feedback, the NTC recommends using an EMA with an alpha value of 0.50 to calculate the cost base.
Heavy vehicle charges determination – RIS February 2014 15
3.2 Usage data
3.2.1 Background
The PAYGO model uses information on vehicle population, Vehicle Kilometres Travelled (VKT), Gross Tonne Kilometres (GTK) and fuel consumption, sourced from the SMVU7 to calculate heavy vehicle charges. The SMVU data was published annually until 2007, but the survey was suspended in 2008 and 2009. In 2010 the survey recommenced with the frequency reduced to once every two years. In the past, the NTC adopted a double-trending methodology to estimate the missing values and interpolate the results to obtain the midpoint across the seven-year averaging period. Usage data effectively determines how costs are allocated through the cost allocation matrix, the size of the heavy vehicle cost base, and the calculation of the total revenue raised by the Commonwealth, state and territory governments. The NTC made several recommendations in the review to improve the consistency and accuracy of the usage data used in the PAYGO model. The review concluded that an up-to-date estimate of vehicle numbers should be used instead of a midpoint, and the estimate should be consistent with actual registration data. In particular, the estimate should include ‘inactive’ vehicles when setting charges.8 These changes were necessary to ensure consistency in the final heavy vehicle charges calculation; that is, an up-to-date estimate of costs should be spread over an up-to-date estimate of vehicle numbers, not a deflated midpoint.
3.2.2 Outstanding issues
3.2.2.1 Methodology
Analysis and stakeholder feedback have shown that the seven-year averaging period is an appropriate length of time to improve data reliability while not incorporating data from so far back so as to reduce data quality. The review also concluded that it was more appropriate to use an estimate of the endpoint of the seven-year averaging period (as opposed to the midpoint used previously).This is because using the midpoint tends to underestimate vehicle numbers and fuel usage and lead to higher charges. An ordinary least squares (OLS) regression methodology was used on usage data in previous determinations. This is a sound methodology for estimating underlying linear trends under certain conditions. However, OLS regression will produce less reliable results (shown as high relative standard errors or RSEs) where a small number of data points is available. Similarly, it is problematic to extrapolate trends outside the available data range. Figure 3 provides an example of this. OLS regression is therefore not a suitable methodology to compensate for gaps in SMVU data.
7 Published by the Australian Bureau of Statistics (ABS) 8 Vehicles that pay registration but do not travel on public roads

Heavy vehicle charges determination – RIS February 2014 16
Figure 3. Fuel use example – seven-year trend displaying negative results9
3.2.2.2 Irregularity in SMVU provision
Currently, the ABS is planning to conduct the SMVU every two years. The latest available survey is the 2012 SMVU, which covered the period from 1 July 2011 to 30 June 2012, and was published in March 2013. The 2014 data, however, will be collected during the period 1 November 2013 – 31 October 2014, pushing the publication date back to September 2015. The SMVU for 2016 and beyond are expected to be collected over the financial year and published the following March. The expected survey period and delivery dates of future SMVU data can be seen in Table 9.
SMVU availability summary Table 9.
SMVU title
2007 2010 2012 2014 2016 2018
SMVU survey period
1 Nov 2006 to 31 Oct 2007
1 Nov 2009 to 31 Oct 2010
1 July 2011 to 30 June 2012
1 Nov 2013 to 31 Oct 2014
1 July 2015 to 30 June 2016
1 July 2017 to 30 June 2018
Delivery date
Sep 2008 Sep 2011 Mar 2013 Sep 2015 Mar 2017 Mar 2019
9 Rigid truck: four-axle, no trailer; GVM 4.5–25
-2,000
-
2,000
4,000
6,000
8,000
10,000
2006 2008 2010 2012 2014
Fue
l Use
('0
00
Lit
res)
Year
SMVU Data
7-year (3 datapoints) estimate
EMA (3-year weights, α = 0.6)
7-year (3-datapoint) OLSRegression
2016 SMVU and beyond will use financial year as survey period
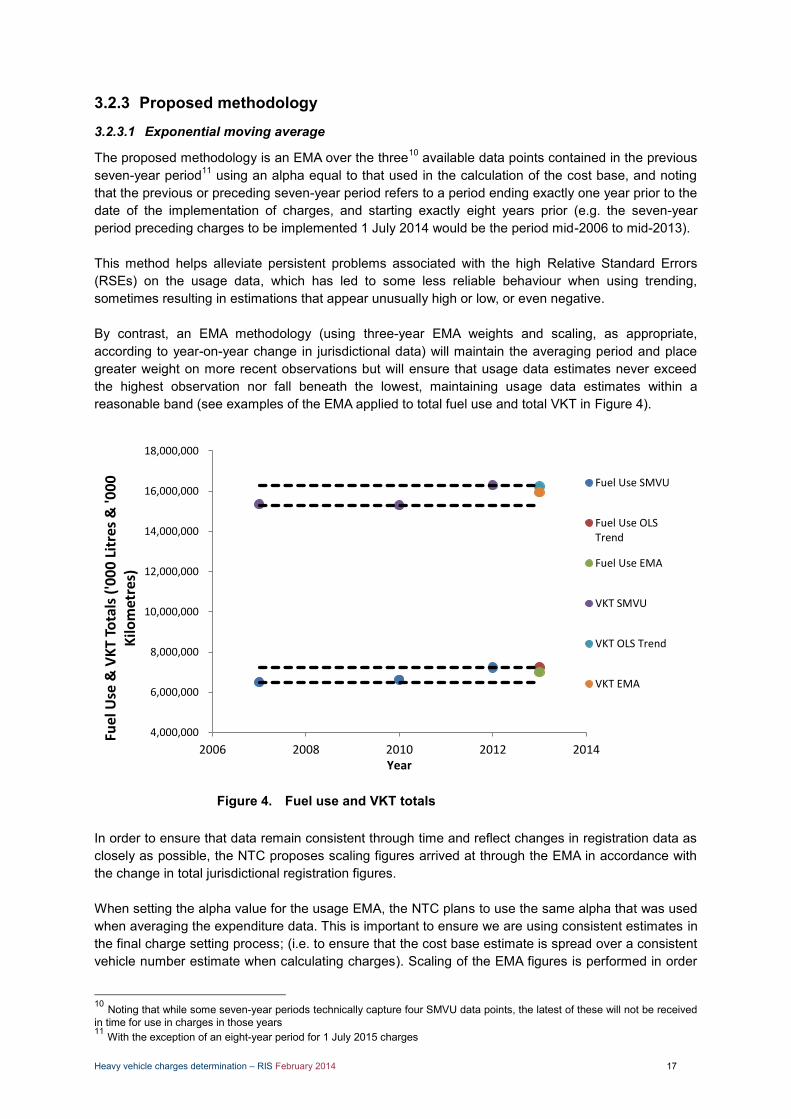
Heavy vehicle charges determination – RIS February 2014 17
3.2.3 Proposed methodology
3.2.3.1 Exponential moving average
The proposed methodology is an EMA over the three10 available data points contained in the previous seven-year period11 using an alpha equal to that used in the calculation of the cost base, and noting that the previous or preceding seven-year period refers to a period ending exactly one year prior to the date of the implementation of charges, and starting exactly eight years prior (e.g. the seven-year period preceding charges to be implemented 1 July 2014 would be the period mid-2006 to mid-2013). This method helps alleviate persistent problems associated with the high Relative Standard Errors (RSEs) on the usage data, which has led to some less reliable behaviour when using trending, sometimes resulting in estimations that appear unusually high or low, or even negative. By contrast, an EMA methodology (using three-year EMA weights and scaling, as appropriate, according to year-on-year change in jurisdictional data) will maintain the averaging period and place greater weight on more recent observations but will ensure that usage data estimates never exceed the highest observation nor fall beneath the lowest, maintaining usage data estimates within a reasonable band (see examples of the EMA applied to total fuel use and total VKT in Figure 4).
Figure 4. Fuel use and VKT totals In order to ensure that data remain consistent through time and reflect changes in registration data as closely as possible, the NTC proposes scaling figures arrived at through the EMA in accordance with the change in total jurisdictional registration figures. When setting the alpha value for the usage EMA, the NTC plans to use the same alpha that was used when averaging the expenditure data. This is important to ensure we are using consistent estimates in the final charge setting process; (i.e. to ensure that the cost base estimate is spread over a consistent vehicle number estimate when calculating charges). Scaling of the EMA figures is performed in order
10 Noting that while some seven-year periods technically capture four SMVU data points, the latest of these will not be received in time for use in charges in those years 11 With the exception of an eight-year period for 1 July 2015 charges
4,000,000
6,000,000
8,000,000
10,000,000
12,000,000
14,000,000
16,000,000
18,000,000
2006 2008 2010 2012 2014
Fuel
Use
& V
KT
To
tals
('0
00
Lit
res
& '0
00
K
ilom
etre
s)
Year
Fuel Use SMVU
Fuel Use OLSTrend
Fuel Use EMA
VKT SMVU
VKT OLS Trend
VKT EMA
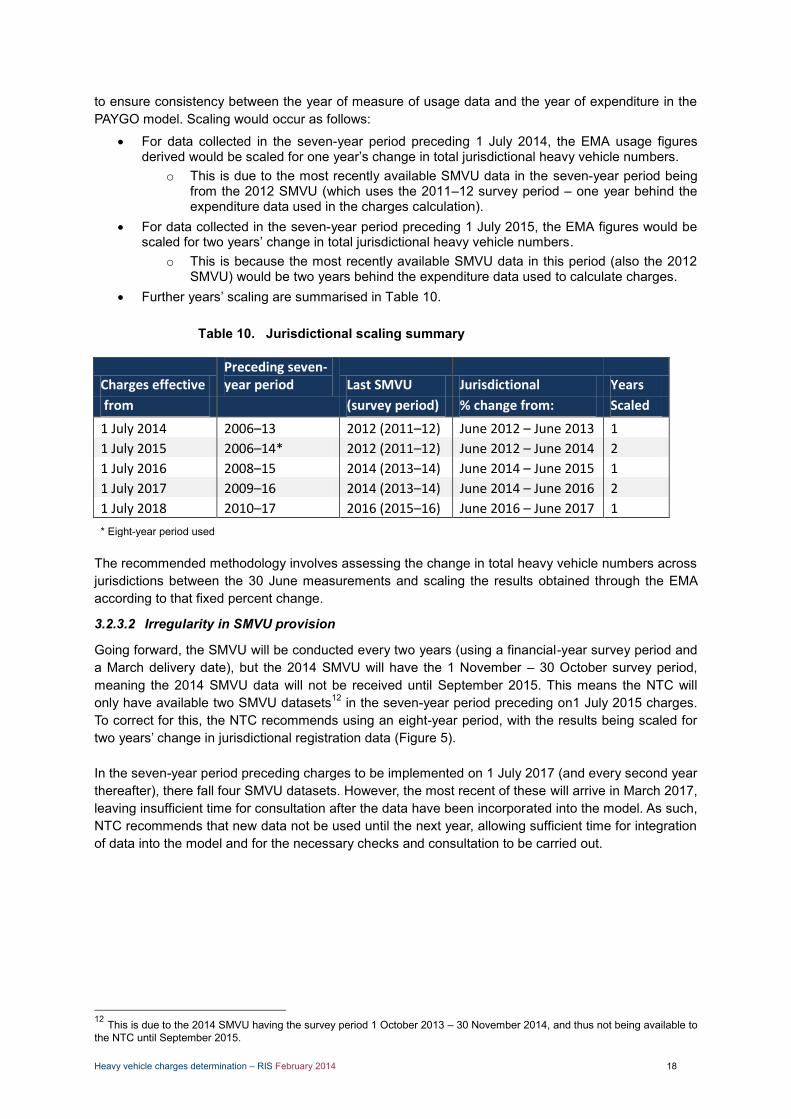
Heavy vehicle charges determination – RIS February 2014 18
to ensure consistency between the year of measure of usage data and the year of expenditure in the PAYGO model. Scaling would occur as follows:
For data collected in the seven-year period preceding 1 July 2014, the EMA usage figures derived would be scaled for one year’s change in total jurisdictional heavy vehicle numbers.
o This is due to the most recently available SMVU data in the seven-year period being from the 2012 SMVU (which uses the 2011–12 survey period – one year behind the expenditure data used in the charges calculation).
For data collected in the seven-year period preceding 1 July 2015, the EMA figures would be scaled for two years’ change in total jurisdictional heavy vehicle numbers.
o This is because the most recently available SMVU data in this period (also the 2012 SMVU) would be two years behind the expenditure data used to calculate charges.
Further years’ scaling are summarised in Table 10.
Jurisdictional scaling summary Table 10.
Charges effective Preceding seven-year period Last SMVU Jurisdictional Years
from
(survey period) % change from: Scaled
1 July 2014 2006–13 2012 (2011–12) June 2012 – June 2013 1
1 July 2015 2006–14* 2012 (2011–12) June 2012 – June 2014 2
1 July 2016 2008–15 2014 (2013–14) June 2014 – June 2015 1
1 July 2017 2009–16 2014 (2013–14) June 2014 – June 2016 2
1 July 2018 2010–17 2016 (2015–16) June 2016 – June 2017 1
* Eight-year period used
The recommended methodology involves assessing the change in total heavy vehicle numbers across jurisdictions between the 30 June measurements and scaling the results obtained through the EMA according to that fixed percent change.
3.2.3.2 Irregularity in SMVU provision
Going forward, the SMVU will be conducted every two years (using a financial-year survey period and a March delivery date), but the 2014 SMVU will have the 1 November – 30 October survey period, meaning the 2014 SMVU data will not be received until September 2015. This means the NTC will only have available two SMVU datasets12 in the seven-year period preceding on1 July 2015 charges. To correct for this, the NTC recommends using an eight-year period, with the results being scaled for two years’ change in jurisdictional registration data (Figure 5). In the seven-year period preceding charges to be implemented on 1 July 2017 (and every second year thereafter), there fall four SMVU datasets. However, the most recent of these will arrive in March 2017, leaving insufficient time for consultation after the data have been incorporated into the model. As such, NTC recommends that new data not be used until the next year, allowing sufficient time for integration of data into the model and for the necessary checks and consultation to be carried out.
12 This is due to the 2014 SMVU having the survey period 1 October 2013 – 30 November 2014, and thus not being available to the NTC until September 2015.

Heavy vehicle charges determination – RIS February 2014 19
Figure 5. SMVU use in usage data calculation
3.2.4 Recommendations
On the basis of the analysis conducted and stakeholder feedback, the NTC recommends the use of an exponential moving average (EMA) with three-year weights and alpha value consistent with that used in the cost base calculation (0.5).
3.3 Expenditure template and accountability measures
3.3.1 Background
The NTC expenditure template has been in existence for almost two decades and has not changed significantly over this time. In many instances the cost categories in the expenditure template are different from how jurisdictions record their financial costs. This has given rise to a number of reporting issues. The NTC is required to accept expenditure data reported by each jurisdiction without an independent assessment of the prudence, efficiency or accuracy of those costs. There is also no independent assessment of whether reported expenditure has resulted in defined levels of service being met. As part of the review process, the NTC revisited the expenditure template with a series of interactive stakeholder workshops. These workshops resulted in a number of template issues being resolved and an update to the current year’s expenditure template guidelines. Issues resolved included, for example, the treatment of information technology systems, speed cameras, intelligent transport systems (ITS), public–private partnership (PPP) establishment costs and clarification on a number of cost categories. In addition to the template itself, a number of industry representatives raised concerns surrounding the accuracy and consistency of the reported expenditure, and asked for additional measures to be implemented to increase user confidence in the calculation of the heavy vehicle cost base. On the other hand, state and territory stakeholders expressed concern with the timing, cost and availability of staff that would be associated with any additional accountability measures. During consultative forums around the country another consistent message raised was value for money. Operators raised questions around how individual road agencies could demonstrate they were spending heavy vehicle charges efficiently when constructing and maintaining the network.
SMVU Title 2007 N/A N/A 2010 N/A 2012 N/A 2014 N/A 2016* N/A 2018*
Survey Period 2006-7 2009-10 2011-12 2013-14 2015-16 2017-18
X X X 1 July 2014
X X 1 July 2015
X X X 1 July 2016
X X X X 1 July 2017
X X X 1 July 2018
* Assumes SMVU follows July - June survey period
Charges effective from
X SMVU to arrive in March
Legend
Year In which SMVU is carried out

Heavy vehicle charges determination – RIS February 2014 20
3.3.2 Outstanding issues
In addition to changing the expenditure template and guidelines, the NTC committed to investigate the possibility of introducing procedural-style audits for the completion of the returned expenditure templates, and examine the viability of benchmark reporting of jurisdictional costs. Presently the NTC is required to accept expenditure data reported by each jurisdiction without mandate or additional powers to audit or independently assess the prudence or efficiency of those costs. There is also no role for the NTC to conduct any assessment on whether the jurisdictional expenditure data has been reported correctly.
In other network infrastructure businesses, expenditure accountability is a key feature of the regulatory regime, where capital and operational costs are reviewed ex-ante, ex-post or both. Designing an appropriate framework for the scrutiny of costs can deliver significant efficiency benefits for road users.
The NTC commissioned an independent external consultant to design and evaluate a range of audit options that could be implemented to increase the transparency and accountability of reported costs.13 This work detailed a number of options, which are summarised in Table 11.
Summary of audit options Table 11.
Audit program options
Number Audit option Description Level of confidence
External cost estimate
Option 1 Status quo with CEO attestation, increased guidance from improved guidelines and expenditure template
Improve the expenditure template and guidelines to help achieve consistent application across all jurisdictions
A sign-off statement should be provided by each organisation’s chief executive officer or equivalent when lodging the NTC expenditure template
Low The audit fee to be paid to external parties to implement this option would be $0
Option 2 Analytical review for reasonableness
Perform a high-level analytical assessment of the expenditure data reported by each jurisdiction to identify variances and trends including a comparison between jurisdictions
Low The cost paid to external parties to implement this audit is estimated as approximately $30K–$35K across all jurisdictions
13 The full report undertaken by EY can be found in the “News and Publications – Other Reports” section of the NTC website.
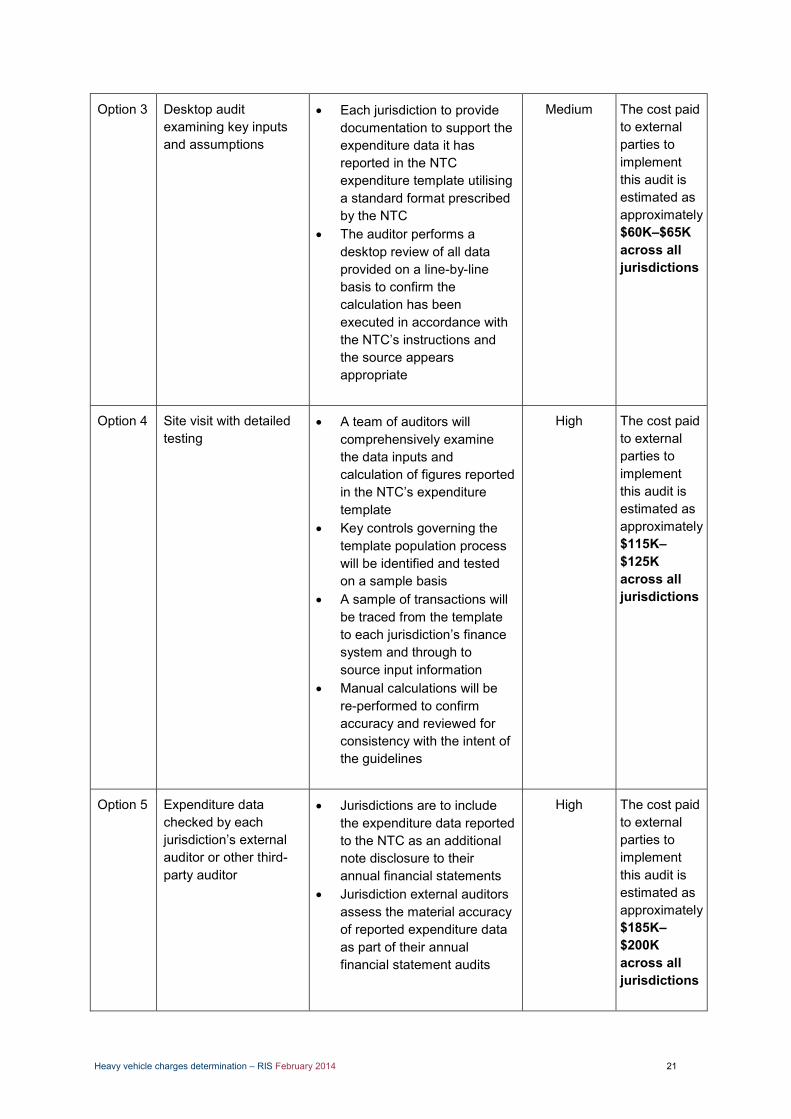
Heavy vehicle charges determination – RIS February 2014 21
Option 3 Desktop audit examining key inputs and assumptions
Each jurisdiction to provide documentation to support the expenditure data it has reported in the NTC expenditure template utilising a standard format prescribed by the NTC
The auditor performs a desktop review of all data provided on a line-by-line basis to confirm the calculation has been executed in accordance with the NTC’s instructions and the source appears appropriate
Medium The cost paid to external parties to implement this audit is estimated as approximately $60K–$65K across all jurisdictions
Option 4 Site visit with detailed testing
A team of auditors will comprehensively examine the data inputs and calculation of figures reported in the NTC’s expenditure template
Key controls governing the template population process will be identified and tested on a sample basis
A sample of transactions will be traced from the template to each jurisdiction’s finance system and through to source input information
Manual calculations will be re-performed to confirm accuracy and reviewed for consistency with the intent of the guidelines
High The cost paid to external parties to implement this audit is estimated as approximately $115K–$125K across all jurisdictions
Option 5 Expenditure data checked by each jurisdiction’s external auditor or other third-party auditor
Jurisdictions are to include the expenditure data reported to the NTC as an additional note disclosure to their annual financial statements
Jurisdiction external auditors assess the material accuracy of reported expenditure data as part of their annual financial statement audits
High The cost paid to external parties to implement this audit is estimated as approximately $185K–$200K across all jurisdictions
Heavy vehicle charges determination – RIS February 2014 22
In assessing which of the options to recommend, the NTC carefully considered the positions of both industry and jurisdictions. On the industry side, operators require a level of comfort that reported expenditure has been subject to due process and has been independently verified. On the other hand jurisdictions are still not convinced a case has been made for the introduction of an audit, and any recommendation should acknowledge the timing and resource implications for each jurisdiction. On balance the NTC believes an audit similar to Option 4 should be carried out as an ex-post review of expenditure data as a starting point. The results of the audit can then be shared and will influence any future decisions on possible permanent audit regimes. The timing of the audit should also reflect jurisdictional resource constraints, with an anticipated October to December 2014 window for completion as coordinated by the NTC. The cost of the audit would also be recoverable from heavy vehicles and reported through the NTC expenditure template by each jurisdiction, and address the issue of recovering the audit cost. As part of broader accountability measures, the NTC has also committed to further investigating the introduction of benchmark reporting of jurisdictional costs. Benchmarking is an important accountability tool used in other network infrastructure businesses and helps explain cost differential to users of the network. The NTC canvassed the views of stakeholders at a policy workshop on the introduction of benchmark reporting. Positive endorsement was received from industry representatives. Jurisdictional representatives expressed some concern that benchmark costs by themselves do not explain the cost drivers of road construction and maintenance, and any reporting of benchmark costs should be accompanied by an explanation of variances.
3.3.3 Recommendations
On the basis of independent expert advice, and stakeholder feedback, the NTC recommends:
A one-off audit/review of expenditure data modelled on ‘Option 4 – Site visit with detailed testing’ should be implemented from next financial year.
The audit timing should take into account jurisdictional resource constraints (anticipated post October 2014 completion date).
The audit is paid for by respective jurisdictions. The cost of the audit is reported in the NTC expenditure template and recoverable from heavy
vehicles only. The NTC will coordinate the procurement and execution of the audit. The NTC will further investigate the introduction of benchmark reporting in consultation with
each jurisdiction and industry.

Heavy vehicle charges determination – RIS February 2014 23
3.4 Charges for articulated trailers
3.4.1 Background
The current charges system allocates costs, and sets charges based on vehicle configuration. While this approach works for the rigid fleet, it creates unintended distortions for articulated vehicles and trailers given their modular nature. In the 2007 determination, the NTC introduced a differential charge for lead trailer axles. This charge was deemed necessary to ensure B-doubles in particular ‘paid their way’. The charge was largely a response to a COAG direction that the charging framework should remove cross-subsidies between vehicle classes. However, during the three-year phase-in of the A-trailer axle charge, industry raised concerns about the distortionary effect the differential axle charge was having on vehicle choice. Sections of industry argued that operators who used A-trailers outside of the B-double configuration were being unfairly penalised, and in addition, the high A-trailer charge was dis-incentivising the use of safer and more productive vehicles. During the charges review in February 2012 the A-trailer axle charge was significantly reduced as part of an equivalent standard axle (ESA) recalibration. However, the timing and scope of the review did not permit a wholesale re-examination of the charges structure. The review concluded that future charges for articulated vehicles and trailers should acknowledge their modularity, and proposed alternative methods for achieving that goal. The NTC sought to achieve an outcome that reduces the gap between vehicles with similar carrying capacity and also achieve a charges outcome that is intuitive and easy to understand by operators. In the final recommendations of the Heavy Vehicle Charges Review, the NTC proposed an axle grouping charge as the preferred method to better reflect the modularity of the trailer fleet. The analysis below examines the current approach and the alternative options in greater detail. The alternative options as outlined in the review are:
standard trailer axle charge axle grouping trailer charge.
Under both alternative options, all modular trailers are effectively treated as a single class. In the case of the standard axle charge, these costs are spread equally over all trailer axles, whereas under the axle grouping charge, the cost allocation will depend on the number of axles in each group and their respective impact on road wear.
3.4.2 Description of approaches
3.4.2.1 Status quo trailer axle charge
Under the status quo, charges are set according to the following axle classifications:
standard axle semitrailer axle B-double lead tandem axle B-double lead tri-axle.
The make-up of articulated truck configurations is based on the trailer axle assumptions presented in Table 12.
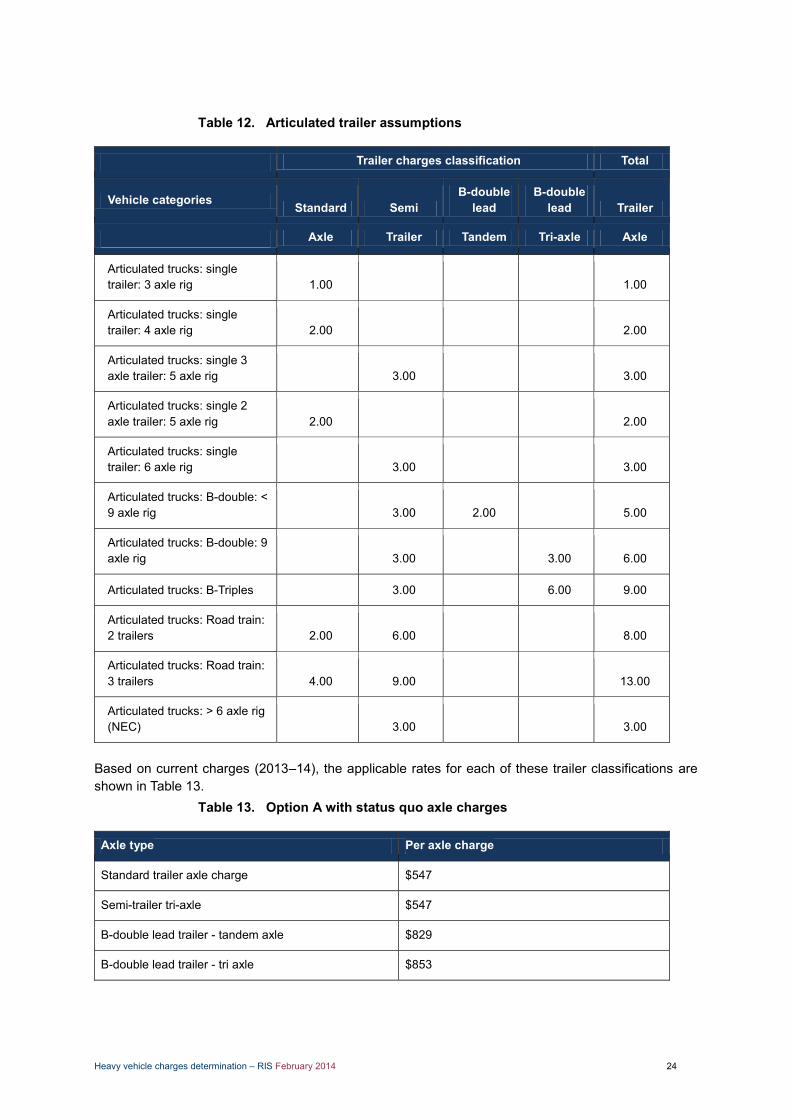
Heavy vehicle charges determination – RIS February 2014 24
Articulated trailer assumptions Table 12.
Trailer charges classification Total
Vehicle categories Standard Semi B-double
lead B-double
lead Trailer
Axle Trailer Tandem Tri-axle Axle
Articulated trucks: single trailer: 3 axle rig 1.00 1.00
Articulated trucks: single trailer: 4 axle rig 2.00 2.00
Articulated trucks: single 3 axle trailer: 5 axle rig 3.00 3.00
Articulated trucks: single 2 axle trailer: 5 axle rig 2.00 2.00
Articulated trucks: single trailer: 6 axle rig 3.00 3.00
Articulated trucks: B-double: < 9 axle rig 3.00 2.00 5.00
Articulated trucks: B-double: 9 axle rig 3.00 3.00 6.00
Articulated trucks: B-Triples 3.00 6.00 9.00
Articulated trucks: Road train: 2 trailers 2.00 6.00 8.00
Articulated trucks: Road train: 3 trailers 4.00 9.00 13.00
Articulated trucks: > 6 axle rig (NEC) 3.00 3.00
Based on current charges (2013–14), the applicable rates for each of these trailer classifications are shown in Table 13.
Option A with status quo axle charges Table 13.
Axle type Per axle charge
Standard trailer axle charge $547
Semi-trailer tri-axle $547
B-double lead trailer - tandem axle $829
B-double lead trailer - tri axle $853
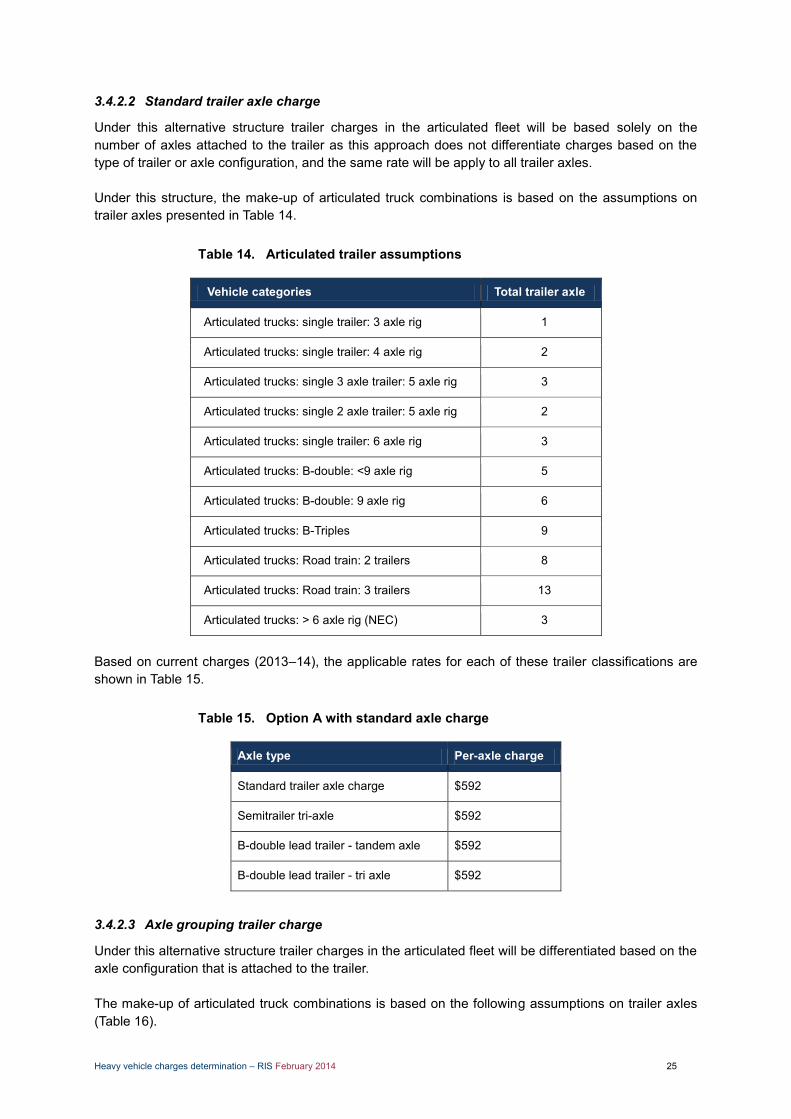
Heavy vehicle charges determination – RIS February 2014 25
3.4.2.2 Standard trailer axle charge
Under this alternative structure trailer charges in the articulated fleet will be based solely on the number of axles attached to the trailer as this approach does not differentiate charges based on the type of trailer or axle configuration, and the same rate will be apply to all trailer axles. Under this structure, the make-up of articulated truck combinations is based on the assumptions on trailer axles presented in Table 14.
Articulated trailer assumptions Table 14.
Vehicle categories Total trailer axle
Articulated trucks: single trailer: 3 axle rig 1
Articulated trucks: single trailer: 4 axle rig 2
Articulated trucks: single 3 axle trailer: 5 axle rig 3
Articulated trucks: single 2 axle trailer: 5 axle rig 2
Articulated trucks: single trailer: 6 axle rig 3
Articulated trucks: B-double: <9 axle rig 5
Articulated trucks: B-double: 9 axle rig 6
Articulated trucks: B-Triples 9
Articulated trucks: Road train: 2 trailers 8
Articulated trucks: Road train: 3 trailers 13
Articulated trucks: > 6 axle rig (NEC) 3
Based on current charges (2013–14), the applicable rates for each of these trailer classifications are shown in Table 15.
Option A with standard axle charge Table 15.
Axle type Per-axle charge
Standard trailer axle charge $592
Semitrailer tri-axle $592
B-double lead trailer - tandem axle $592
B-double lead trailer - tri axle $592
3.4.2.3 Axle grouping trailer charge
Under this alternative structure trailer charges in the articulated fleet will be differentiated based on the axle configuration that is attached to the trailer. The make-up of articulated truck combinations is based on the following assumptions on trailer axles (Table 16).
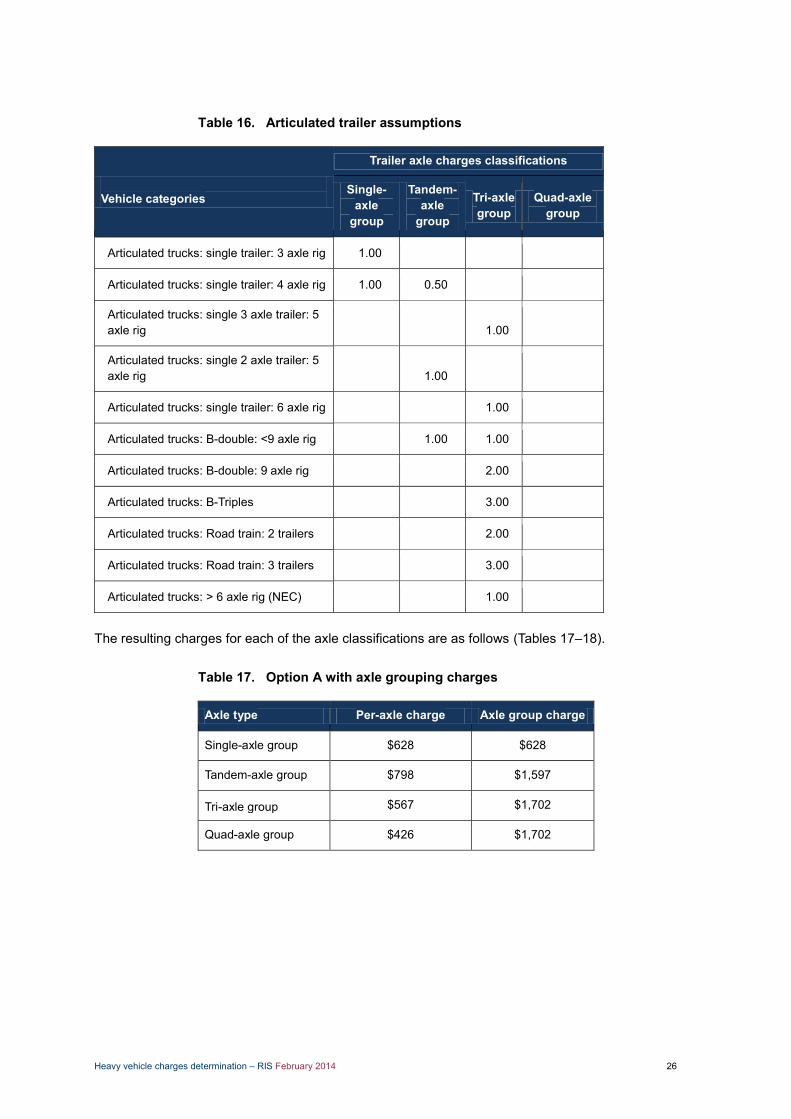
Heavy vehicle charges determination – RIS February 2014 26
Articulated trailer assumptions Table 16.
Vehicle categories
Trailer axle charges classifications
Single-axle
group
Tandem-axle
group
Tri-axle group
Quad-axle group
Articulated trucks: single trailer: 3 axle rig 1.00
Articulated trucks: single trailer: 4 axle rig 1.00 0.50
Articulated trucks: single 3 axle trailer: 5 axle rig 1.00
Articulated trucks: single 2 axle trailer: 5 axle rig 1.00
Articulated trucks: single trailer: 6 axle rig 1.00
Articulated trucks: B-double: <9 axle rig 1.00 1.00
Articulated trucks: B-double: 9 axle rig 2.00
Articulated trucks: B-Triples 3.00
Articulated trucks: Road train: 2 trailers 2.00
Articulated trucks: Road train: 3 trailers 3.00
Articulated trucks: > 6 axle rig (NEC) 1.00
The resulting charges for each of the axle classifications are as follows (Tables 17–18).
Option A with axle grouping charges Table 17.
Axle type Per-axle charge Axle group charge
Single-axle group $628 $628
Tandem-axle group $798 $1,597
Tri-axle group $567 $1,702
Quad-axle group $426 $1,702

Heavy vehicle charges determination – RIS February 2014 27
Comparison of total trailer charges outcomes 14 Table 18.
Trailer classification
Option A with
SQ axle approach total trailer charge
Option A standard axle
total trailer charge
Option A axle grouping
total trailer charge
Semitrailer tandem axle $1,094 $1,185 $1,597
Semitrailer tri-axle $1,641 $1,777 $1,702
B-double lead trailer – tandem axle $1,658 $1,185 $1,597
B-double lead trailer – tri-axle $2,558 $1,777 $1,702
3.4.3 Analysis and findings
3.4.3.1 Standard axle vs axle grouping charge
Both the standard axle and axle grouping charge options are preferable to the status quo axle charge option as they reflect the modularity of the trailer fleet. However, from a pavement engineering perspective the axle grouping charge is superior as it better reflects the road wear impact of spreading the same load over a different number of axles. This can be measured in the different ESA values for each truck, and is presented in Table 19.
Total registration comparisons for selected heavy vehicle Table 19.classes 15
Annual adjustment
outcome
Option A with
SQ axle charges
Option A with
standard axle
Option A with
axle grouping
Heavy truck/trailer over 42.5 tonnes
$9,042 $9,300 $9,459 $9,584
6 axle articulated truck $6,639 $5,697 $5,833 $5,758
B-double 9 axle $14,767 $14,402 $13,757 $13,607
B-triple $18,150 $17,010 $15,584 $15,359
Double road train $14,203 $13,535 $13,807 $13,657
Triple road train $17,022 $15,276 $15,684 $15,459 Note: Annual adjustment outcome shows the estimated 2014–15 charges, should an annual adjustment process is to be carried out. This concept is demonstrated in the following example. Shown in Figure 6 are two trucks with a relatively similar payload capacity but with a different number of axles. Scenario 1 shows charges that 14 Option A assume a 63.8% RUC, and 36.2% registration split. Figures exclude Regulatory Charge component. 15 Option A assume a 63.8% RUC, and 36.2% registration split. Figures include Regulatory Charge component.
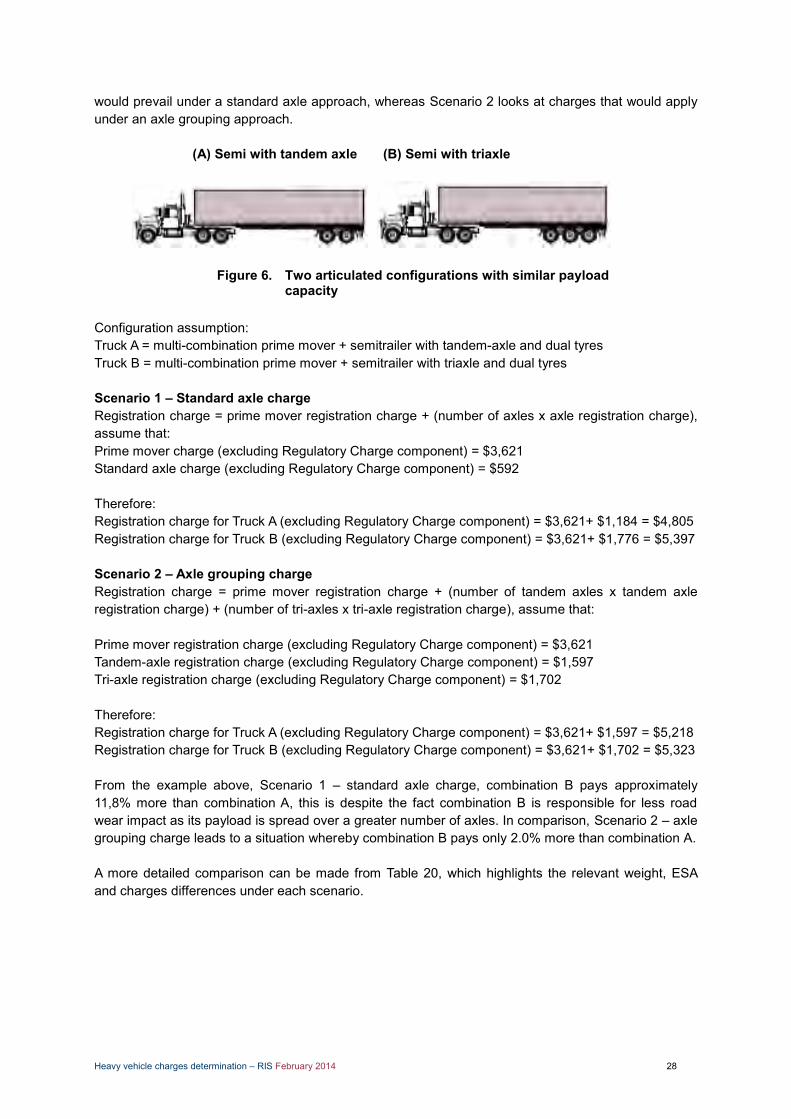
Heavy vehicle charges determination – RIS February 2014 28
would prevail under a standard axle approach, whereas Scenario 2 looks at charges that would apply under an axle grouping approach.
(A) Semi with tandem axle (B) Semi with triaxle
Figure 6. Two articulated configurations with similar payload capacity
Configuration assumption: Truck A = multi-combination prime mover + semitrailer with tandem-axle and dual tyres Truck B = multi-combination prime mover + semitrailer with triaxle and dual tyres Scenario 1 – Standard axle charge Registration charge = prime mover registration charge + (number of axles x axle registration charge), assume that: Prime mover charge (excluding Regulatory Charge component) = $3,621 Standard axle charge (excluding Regulatory Charge component) = $592
Therefore: Registration charge for Truck A (excluding Regulatory Charge component) = $3,621+ $1,184 = $4,805 Registration charge for Truck B (excluding Regulatory Charge component) = $3,621+ $1,776 = $5,397 Scenario 2 – Axle grouping charge Registration charge = prime mover registration charge + (number of tandem axles x tandem axle registration charge) + (number of tri-axles x tri-axle registration charge), assume that: Prime mover registration charge (excluding Regulatory Charge component) = $3,621 Tandem-axle registration charge (excluding Regulatory Charge component) = $1,597 Tri-axle registration charge (excluding Regulatory Charge component) = $1,702 Therefore: Registration charge for Truck A (excluding Regulatory Charge component) = $3,621+ $1,597 = $5,218 Registration charge for Truck B (excluding Regulatory Charge component) = $3,621+ $1,702 = $5,323 From the example above, Scenario 1 – standard axle charge, combination B pays approximately 11,8% more than combination A, this is despite the fact combination B is responsible for less road wear impact as its payload is spread over a greater number of axles. In comparison, Scenario 2 – axle grouping charge leads to a situation whereby combination B pays only 2.0% more than combination A. A more detailed comparison can be made from Table 20, which highlights the relevant weight, ESA and charges differences under each scenario.
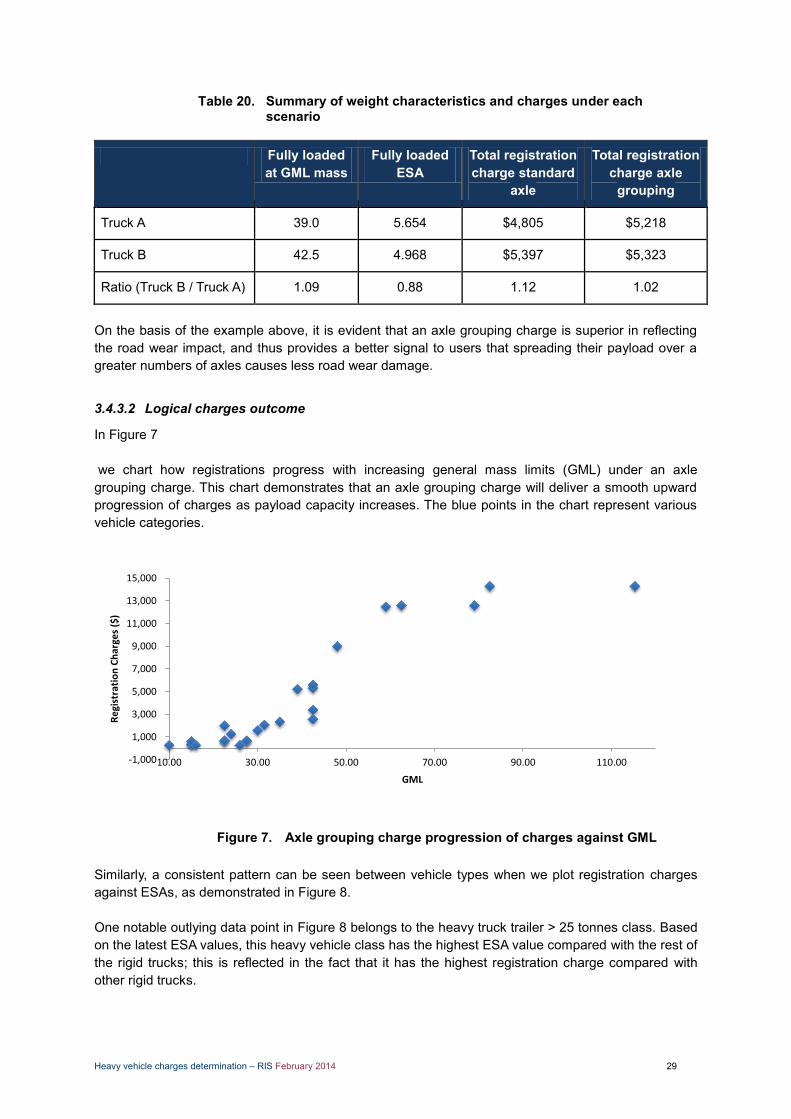
Heavy vehicle charges determination – RIS February 2014 29
Summary of weight characteristics and charges under each Table 20.scenario
Fully loaded at GML mass
Fully loaded ESA
Total registration charge standard
axle
Total registration charge axle
grouping
Truck A 39.0 5.654 $4,805 $5,218
Truck B 42.5 4.968 $5,397 $5,323
Ratio (Truck B / Truck A) 1.09 0.88 1.12 1.02
On the basis of the example above, it is evident that an axle grouping charge is superior in reflecting the road wear impact, and thus provides a better signal to users that spreading their payload over a greater numbers of axles causes less road wear damage.
3.4.3.2 Logical charges outcome
In Figure 7 we chart how registrations progress with increasing general mass limits (GML) under an axle grouping charge. This chart demonstrates that an axle grouping charge will deliver a smooth upward progression of charges as payload capacity increases. The blue points in the chart represent various vehicle categories.
Figure 7. Axle grouping charge progression of charges against GML Similarly, a consistent pattern can be seen between vehicle types when we plot registration charges against ESAs, as demonstrated in Figure 8. One notable outlying data point in Figure 8 belongs to the heavy truck trailer > 25 tonnes class. Based on the latest ESA values, this heavy vehicle class has the highest ESA value compared with the rest of the rigid trucks; this is reflected in the fact that it has the highest registration charge compared with other rigid trucks.
-1,000
1,000
3,000
5,000
7,000
9,000
11,000
13,000
15,000
10.00 30.00 50.00 70.00 90.00 110.00
Re
gist
rati
on
Ch
arge
s ($
)
GML

Heavy vehicle charges determination – RIS February 2014 30
Figure 8. Axle grouping charge – progression of charges against ESA
3.4.3.3 Avoiding cross-subsidisation between vehicle class
While most industry stakeholders support the adoption of an axle grouping charge to reflect the modularity of the trailer fleet, some stakeholders raised concerns about whether this would re-introduce cross-subsidies between classes. The pricing principles are clear in their requirement that there should be no cross-subsidisation across different vehicle classes, and each class should at least meet their attributable costs. NTC modelling shows that under the axle grouping charges structure, all vehicle classes meet the attributable cost requirements and that total cost recovery is achieved.
3.4.3.4 Simplicity vs accuracy
In determining whether to adopt a standard axle or axle grouping charge, consideration must be given to the trade-off between simplicity and accuracy. The simplicity of the standard axle is appealing and is easily understood, whereas the axle grouping charge is a more accurate measurement of the road wear impact. In weighing up the trade-off between these two objectives, the NTC concluded, in consultation with stakeholders, that the axle grouping charge was more intuitive, and sent an important signal to users regarding the impact different vehicle configurations had on the road network. In summary the axle grouping charge is preferable because it:
delivers a more accurate representation of the load-carrying capacity that results in the road pavement impact
provides a logical progression of charges meets the heavy vehicle charges requirements set by COAG provides a simple and easy-to-understand charging structure.
3.4.4 Recommendation
The NTC recommends the adoption of an axle grouping charge.
-1,000
1,000
3,000
5,000
7,000
9,000
11,000
13,000
15,000
- 0.50 1.00 1.50 2.00 2.50 3.00 3.50 4.00 4.50 5.00
Reg
istr
atio
n C
har
ges
($)
ESA

Heavy vehicle charges determination – RIS February 2014 31
3.5 Estimating relative levels of pavement wear
3.5.1 Pavement wear due to heavy vehicle traffic
3.5.1.1 Background
As outlined in the Heavy Vehicle Charges Review, relative levels of pavement wear are calculated using the ESA methodology,16 which provides an estimate of the relative pavement wear associated with different loads, axle groups and tyre configurations. The review provided a summary of the research studies undertaken since 2007 with regard to the estimation of relative levels of pavement wear. Numerous refinements to the way ESA values are produced have been made since 2007 (e.g. Vehicle Kilometres Travelled adjustment per state, improvement in heavy vehicle composite categories classification). However, the review listed a number of issues to be addressed by the heavy vehicle charges determination. For instance, it emphasised that the concept of vehicle modularity is not fully reflected in the way ESA values are calculated. The modular approach applied to B-triples takes the view that B-double trailers are logical building blocks for B-triple combinations. Consistent with observations from industry stakeholders, it would be logical that the average ESA value of a B-triple combination equals the sum of the average ESA value of a B-double combination plus the ESA value of a tri-axle-led trailer. Similar reasoning would be used to derive the ESA value of any multi-combination vehicle. Consequently, the review recommended refining the ESA methodology to reflect the modularity concept and to prepare for the possible implementation of axle grouping charging.
3.5.1.2 Outstanding issues
The incompatibility between the way average gross mass (AGM) and ESA estimates are derived and the mixing/matching of individual vehicle units by transport operators may be addressed by examining the extensive weigh-in-motion (WIM) database in a different fashion, which would essentially consist of using an axle grouping-based approach. Departing from the approach used in previous projects, the NTC requested the Australian Road Research Board (ARRB) adopt a bottom-up approach that involve the estimation of AGM and ESA values at an individual axle group level, with the prospect of aggregating axle group characteristics to derive whole-of-vehicle estimates. Effectively a modular approach was being evaluated at the lowest level practical using WIM data. a. Applying the modular approach to WIM data Applying this approach on the same dataset of 75 million WIM records from 2005 to 2007 used for Austroads research TS1398, ARRB produced a set of AGM and ESA estimates that are in essence identical to current AGM and ESA estimates. Unlike previous studies, ARRB was this time able to provide the NTC with AGM and ESA values at an individual axle group level. b. Applying a VKT adjustment per state and per vehicle class The amount of WIM data received from jurisdictions is a function of the amount of operational sites at present in each jurisdiction, and is therefore not representative of the total heavy vehicle fleet. As part of the NTC’s 2012 A-trailer charge review, a number of significant improvements from the methods and inputs used in the 2007 determination were incorporated by ARRB. One of these improvements was a VKT adjustment per vehicle class. This type of VKT adjustment consists of adjusting vehicle category sample sizes according to relative proportions of VKT between jurisdictions. It was done for two vehicle categories: (1) rigid trucks and articulated vehicles up to nine-axle B-doubles; and (2) B-triples and other road trains.
16 The ESA value represents a comparative measure of the impact of a heavy vehicle compared with a single axle with dual tyres weighing 8.15 tonnes.
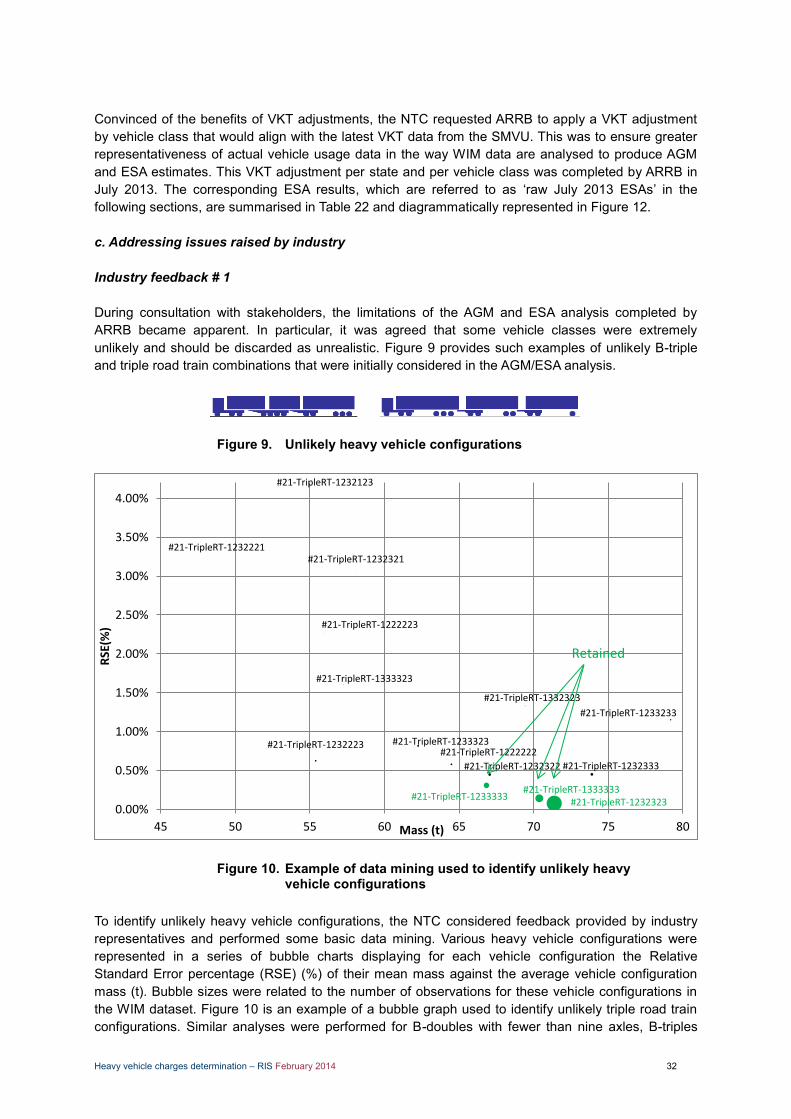
Heavy vehicle charges determination – RIS February 2014 32
Convinced of the benefits of VKT adjustments, the NTC requested ARRB to apply a VKT adjustment by vehicle class that would align with the latest VKT data from the SMVU. This was to ensure greater representativeness of actual vehicle usage data in the way WIM data are analysed to produce AGM and ESA estimates. This VKT adjustment per state and per vehicle class was completed by ARRB in July 2013. The corresponding ESA results, which are referred to as ‘raw July 2013 ESAs’ in the following sections, are summarised in Table 22 and diagrammatically represented in Figure 12. c. Addressing issues raised by industry Industry feedback # 1 During consultation with stakeholders, the limitations of the AGM and ESA analysis completed by ARRB became apparent. In particular, it was agreed that some vehicle classes were extremely unlikely and should be discarded as unrealistic. Figure 9 provides such examples of unlikely B-triple and triple road train combinations that were initially considered in the AGM/ESA analysis.
Figure 9. Unlikely heavy vehicle configurations
Figure 10. Example of data mining used to identify unlikely heavy vehicle configurations
To identify unlikely heavy vehicle configurations, the NTC considered feedback provided by industry representatives and performed some basic data mining. Various heavy vehicle configurations were represented in a series of bubble charts displaying for each vehicle configuration the Relative Standard Error percentage (RSE) (%) of their mean mass against the average vehicle configuration mass (t). Bubble sizes were related to the number of observations for these vehicle configurations in the WIM dataset. Figure 10 is an example of a bubble graph used to identify unlikely triple road train configurations. Similar analyses were performed for B-doubles with fewer than nine axles, B-triples
#21-TripleRT-1222222
#21-TripleRT-1222223
#21-TripleRT-1232123
#21-TripleRT-1232221
#21-TripleRT-1232223
#21-TripleRT-1232321
#21-TripleRT-1232322
#21-TripleRT-1232323
#21-TripleRT-1232333
#21-TripleRT-1233233
#21-TripleRT-1233323
#21-TripleRT-1233333
#21-TripleRT-1332323
#21-TripleRT-1333323
#21-TripleRT-1333333
0.00%
0.50%
1.00%
1.50%
2.00%
2.50%
3.00%
3.50%
4.00%
45 50 55 60 65 70 75 80
RSE
(%)
Mass (t)
Retained
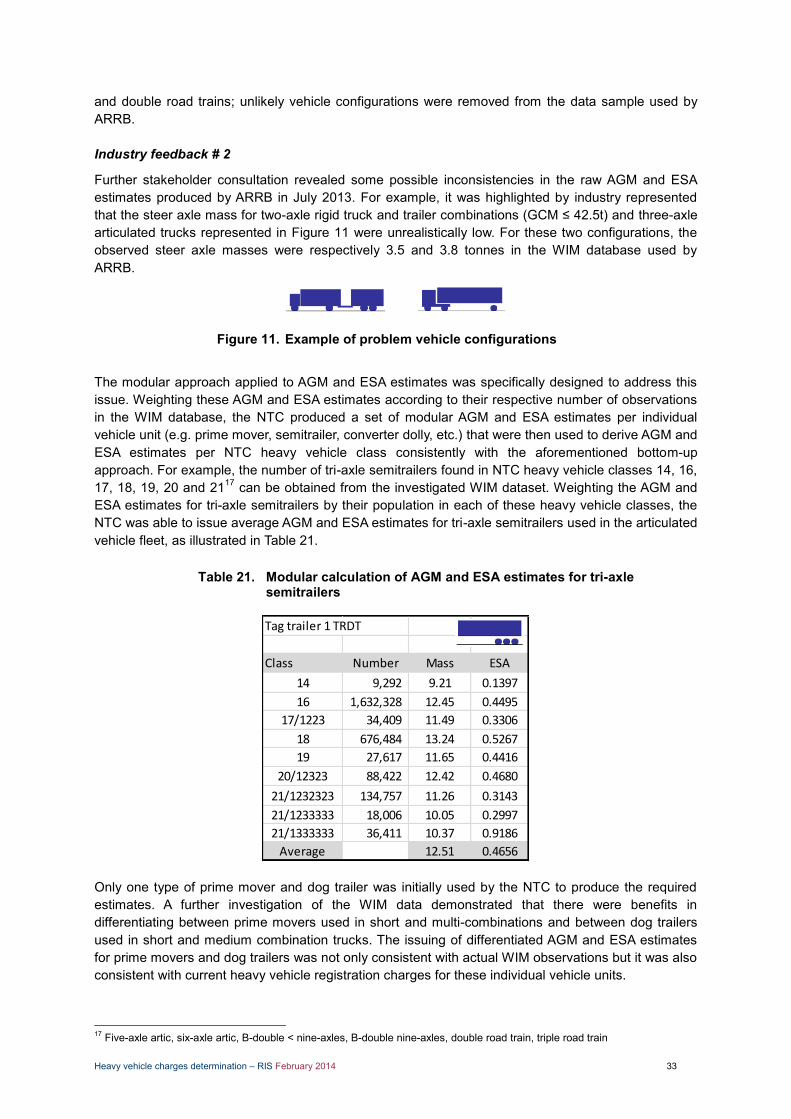
Heavy vehicle charges determination – RIS February 2014 33
and double road trains; unlikely vehicle configurations were removed from the data sample used by ARRB. Industry feedback # 2
Further stakeholder consultation revealed some possible inconsistencies in the raw AGM and ESA estimates produced by ARRB in July 2013. For example, it was highlighted by industry represented that the steer axle mass for two-axle rigid truck and trailer combinations (GCM ≤ 42.5t) and three-axle articulated trucks represented in Figure 11 were unrealistically low. For these two configurations, the observed steer axle masses were respectively 3.5 and 3.8 tonnes in the WIM database used by ARRB.
Figure 11. Example of problem vehicle configurations
The modular approach applied to AGM and ESA estimates was specifically designed to address this issue. Weighting these AGM and ESA estimates according to their respective number of observations in the WIM database, the NTC produced a set of modular AGM and ESA estimates per individual vehicle unit (e.g. prime mover, semitrailer, converter dolly, etc.) that were then used to derive AGM and ESA estimates per NTC heavy vehicle class consistently with the aforementioned bottom-up approach. For example, the number of tri-axle semitrailers found in NTC heavy vehicle classes 14, 16, 17, 18, 19, 20 and 2117 can be obtained from the investigated WIM dataset. Weighting the AGM and ESA estimates for tri-axle semitrailers by their population in each of these heavy vehicle classes, the NTC was able to issue average AGM and ESA estimates for tri-axle semitrailers used in the articulated vehicle fleet, as illustrated in Table 21.
Modular calculation of AGM and ESA estimates for tri-axle Table 21.semitrailers
Only one type of prime mover and dog trailer was initially used by the NTC to produce the required estimates. A further investigation of the WIM data demonstrated that there were benefits in differentiating between prime movers used in short and multi-combinations and between dog trailers used in short and medium combination trucks. The issuing of differentiated AGM and ESA estimates for prime movers and dog trailers was not only consistent with actual WIM observations but it was also consistent with current heavy vehicle registration charges for these individual vehicle units.
17 Five-axle artic, six-axle artic, B-double < nine-axles, B-double nine-axles, double road train, triple road train
Tag trailer 1 TRDT
Class Number Mass ESA
14 9,292 9.21 0.1397
16 1,632,328 12.45 0.4495
17/1223 34,409 11.49 0.3306
18 676,484 13.24 0.5267
19 27,617 11.65 0.4416
20/12323 88,422 12.42 0.4680
21/1232323 134,757 11.26 0.3143
21/1233333 18,006 10.05 0.2997
21/1333333 36,411 10.37 0.9186
Average 12.51 0.4656
Tag trailer 1 QADT
Class Number Mass ESA
22 3,582 15.08 0.3943
Average 15.08 0.3943
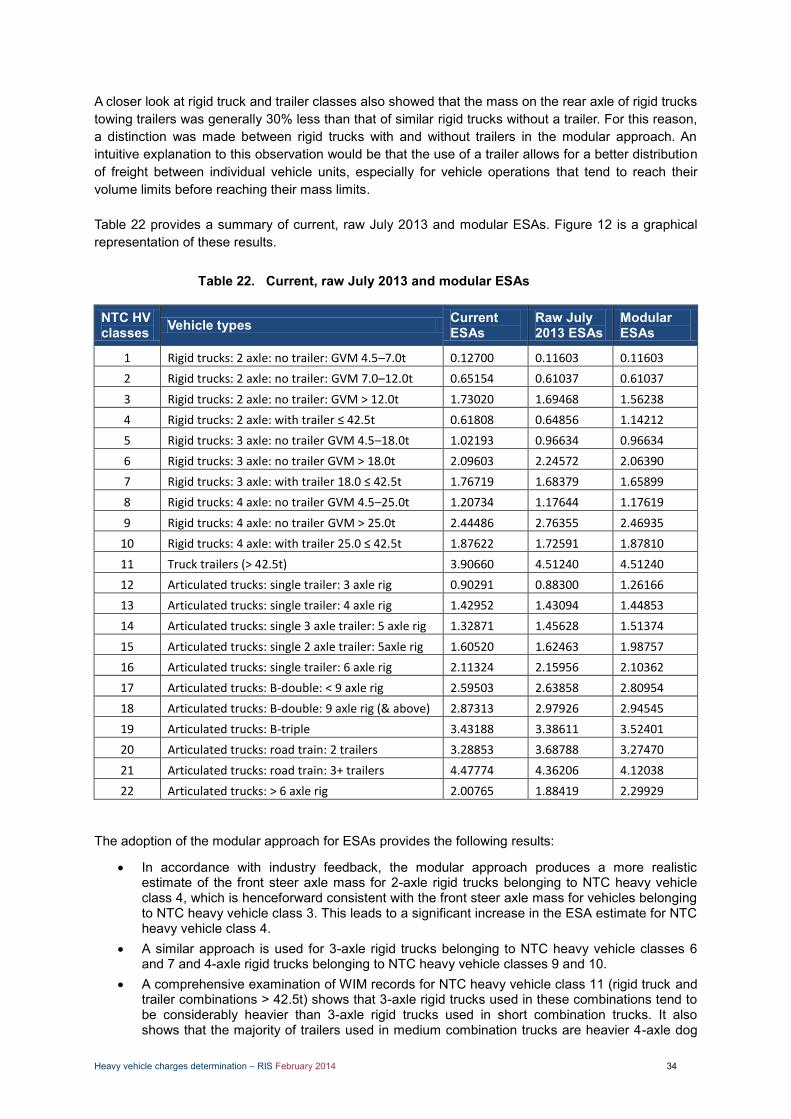
Heavy vehicle charges determination – RIS February 2014 34
A closer look at rigid truck and trailer classes also showed that the mass on the rear axle of rigid trucks towing trailers was generally 30% less than that of similar rigid trucks without a trailer. For this reason, a distinction was made between rigid trucks with and without trailers in the modular approach. An intuitive explanation to this observation would be that the use of a trailer allows for a better distribution of freight between individual vehicle units, especially for vehicle operations that tend to reach their volume limits before reaching their mass limits. Table 22 provides a summary of current, raw July 2013 and modular ESAs. Figure 12 is a graphical representation of these results.
Current, raw July 2013 and modular ESAs Table 22.
NTC HV classes Vehicle types Current
ESAs Raw July 2013 ESAs
Modular ESAs
1 Rigid trucks: 2 axle: no trailer: GVM 4.5–7.0t 0.12700 0.11603 0.11603
2 Rigid trucks: 2 axle: no trailer: GVM 7.0–12.0t 0.65154 0.61037 0.61037
3 Rigid trucks: 2 axle: no trailer: GVM > 12.0t 1.73020 1.69468 1.56238
4 Rigid trucks: 2 axle: with trailer ≤ 42.5t 0.61808 0.64856 1.14212
5 Rigid trucks: 3 axle: no trailer GVM 4.5–18.0t 1.02193 0.96634 0.96634
6 Rigid trucks: 3 axle: no trailer GVM > 18.0t 2.09603 2.24572 2.06390
7 Rigid trucks: 3 axle: with trailer 18.0 ≤ 42.5t 1.76719 1.68379 1.65899
8 Rigid trucks: 4 axle: no trailer GVM 4.5–25.0t 1.20734 1.17644 1.17619
9 Rigid trucks: 4 axle: no trailer GVM > 25.0t 2.44486 2.76355 2.46935
10 Rigid trucks: 4 axle: with trailer 25.0 ≤ 42.5t 1.87622 1.72591 1.87810
11 Truck trailers (> 42.5t) 3.90660 4.51240 4.51240
12 Articulated trucks: single trailer: 3 axle rig 0.90291 0.88300 1.26166
13 Articulated trucks: single trailer: 4 axle rig 1.42952 1.43094 1.44853
14 Articulated trucks: single 3 axle trailer: 5 axle rig 1.32871 1.45628 1.51374
15 Articulated trucks: single 2 axle trailer: 5axle rig 1.60520 1.62463 1.98757
16 Articulated trucks: single trailer: 6 axle rig 2.11324 2.15956 2.10362
17 Articulated trucks: B-double: < 9 axle rig 2.59503 2.63858 2.80954
18 Articulated trucks: B-double: 9 axle rig (& above) 2.87313 2.97926 2.94545
19 Articulated trucks: B-triple 3.43188 3.38611 3.52401
20 Articulated trucks: road train: 2 trailers 3.28853 3.68788 3.27470
21 Articulated trucks: road train: 3+ trailers 4.47774 4.36206 4.12038
22 Articulated trucks: > 6 axle rig 2.00765 1.88419 2.29929
The adoption of the modular approach for ESAs provides the following results:
In accordance with industry feedback, the modular approach produces a more realistic estimate of the front steer axle mass for 2-axle rigid trucks belonging to NTC heavy vehicle class 4, which is henceforward consistent with the front steer axle mass for vehicles belonging to NTC heavy vehicle class 3. This leads to a significant increase in the ESA estimate for NTC heavy vehicle class 4.
A similar approach is used for 3-axle rigid trucks belonging to NTC heavy vehicle classes 6 and 7 and 4-axle rigid trucks belonging to NTC heavy vehicle classes 9 and 10.
A comprehensive examination of WIM records for NTC heavy vehicle class 11 (rigid truck and trailer combinations > 42.5t) shows that 3-axle rigid trucks used in these combinations tend to be considerably heavier than 3-axle rigid trucks used in short combination trucks. It also shows that the majority of trailers used in medium combination trucks are heavier 4-axle dog

Heavy vehicle charges determination – RIS February 2014 35
trailers rather than 3-axle dog trailers. Even though the ESA value for NTC heavy vehicle class 11 is noticeably higher than that of classes 7 and 10, this was expected as NTC heavy vehicle class 11 brings together the heaviest truck and dog trailer configurations by definition.
The increased mass estimate on the steer and drive axles for 2-axle prime movers from NTC heavy vehicle class 12 (3-axle articulated configurations) leads to a significant increase in the ESA estimate for this class.
The increased mass estimate on the tandem drive axles for 3-axle prime movers from NTC heavy vehicle class 15 (5-axle articulated configurations) leads to a significant increase in the ESA estimate for this class.
The decreased mass estimate on the tandem drive axles for 3-axle prime movers from NTC heavy vehicle classes 20 and 21 (double and triple road trains) leads to a significant decrease in the ESA estimates for these two classes.
Figure 12. Current, raw July 2013 and modular ESAs Figure 13 is a summary of the ESA values used by the NTC since the 2007 determination. A few observations can be made from this graph:
Generally speaking, the raw July 2013 ESAs and modular ESAs are very similar and not very far apart from the current ESAs.
The raw July 2013 ESAs and modular ESAs tend to be higher than the 2007 determination ESAs for rigid and trailer trucks, while they tend to be lower than the 2007 determination ESAs for articulated vehicle combinations.
The 2009 ESA estimates from project TS1398 produced some quite ‘extreme’ ESA values, which was certainly due to a paradigm shift in the way these ESA estimates were produced and some lack of refinement in the analysis of the WIM database collected by ARRB.
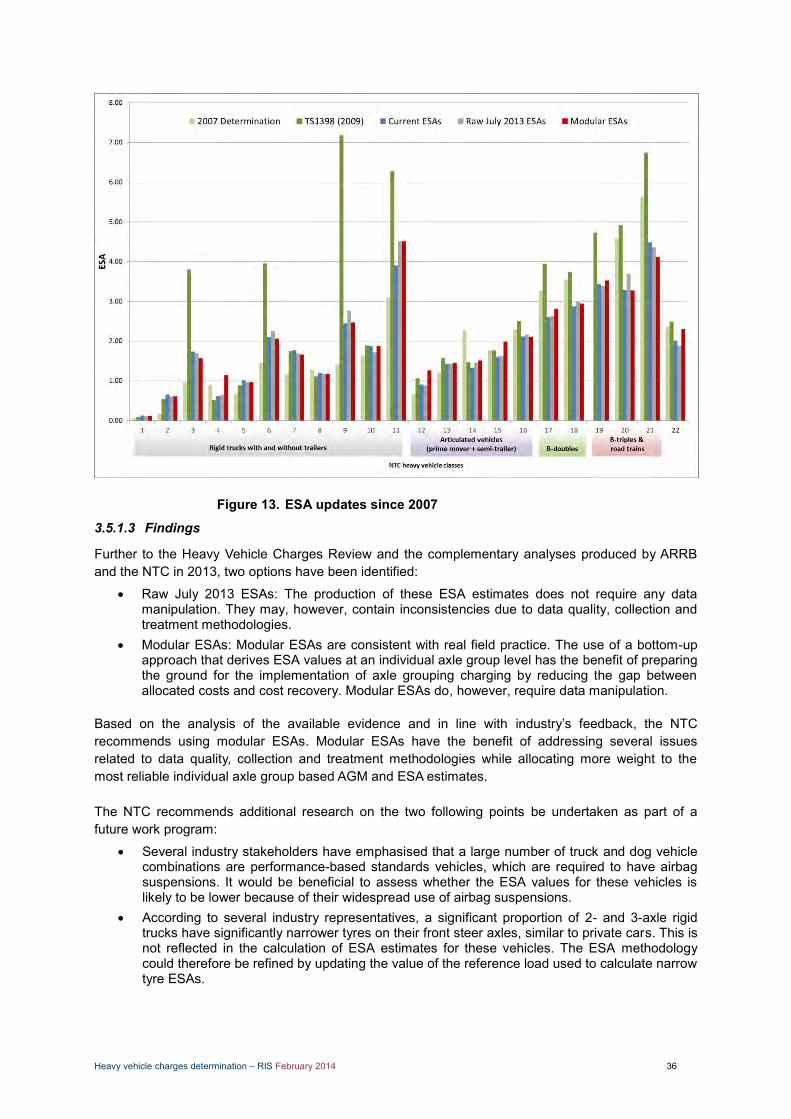
Heavy vehicle charges determination – RIS February 2014 36
Figure 13. ESA updates since 2007
3.5.1.3 Findings
Further to the Heavy Vehicle Charges Review and the complementary analyses produced by ARRB and the NTC in 2013, two options have been identified:
Raw July 2013 ESAs: The production of these ESA estimates does not require any data manipulation. They may, however, contain inconsistencies due to data quality, collection and treatment methodologies.
Modular ESAs: Modular ESAs are consistent with real field practice. The use of a bottom-up approach that derives ESA values at an individual axle group level has the benefit of preparing the ground for the implementation of axle grouping charging by reducing the gap between allocated costs and cost recovery. Modular ESAs do, however, require data manipulation.
Based on the analysis of the available evidence and in line with industry’s feedback, the NTC recommends using modular ESAs. Modular ESAs have the benefit of addressing several issues related to data quality, collection and treatment methodologies while allocating more weight to the most reliable individual axle group based AGM and ESA estimates. The NTC recommends additional research on the two following points be undertaken as part of a future work program:
Several industry stakeholders have emphasised that a large number of truck and dog vehicle combinations are performance-based standards vehicles, which are required to have airbag suspensions. It would be beneficial to assess whether the ESA values for these vehicles is likely to be lower because of their widespread use of airbag suspensions.
According to several industry representatives, a significant proportion of 2- and 3-axle rigid trucks have significantly narrower tyres on their front steer axles, similar to private cars. This is not reflected in the calculation of ESA estimates for these vehicles. The ESA methodology could therefore be refined by updating the value of the reference load used to calculate narrow tyre ESAs.
Heavy vehicle charges determination – RIS February 2014 37
3.5.1.4 Recommendations
Based on independent expert advice, stakeholder feedback and the NTC’s own analysis, the NTC recommends:
the use of modular ESAs for the purposes of calculating heavy vehicle charges further research conducted into refining the ESA measurement.
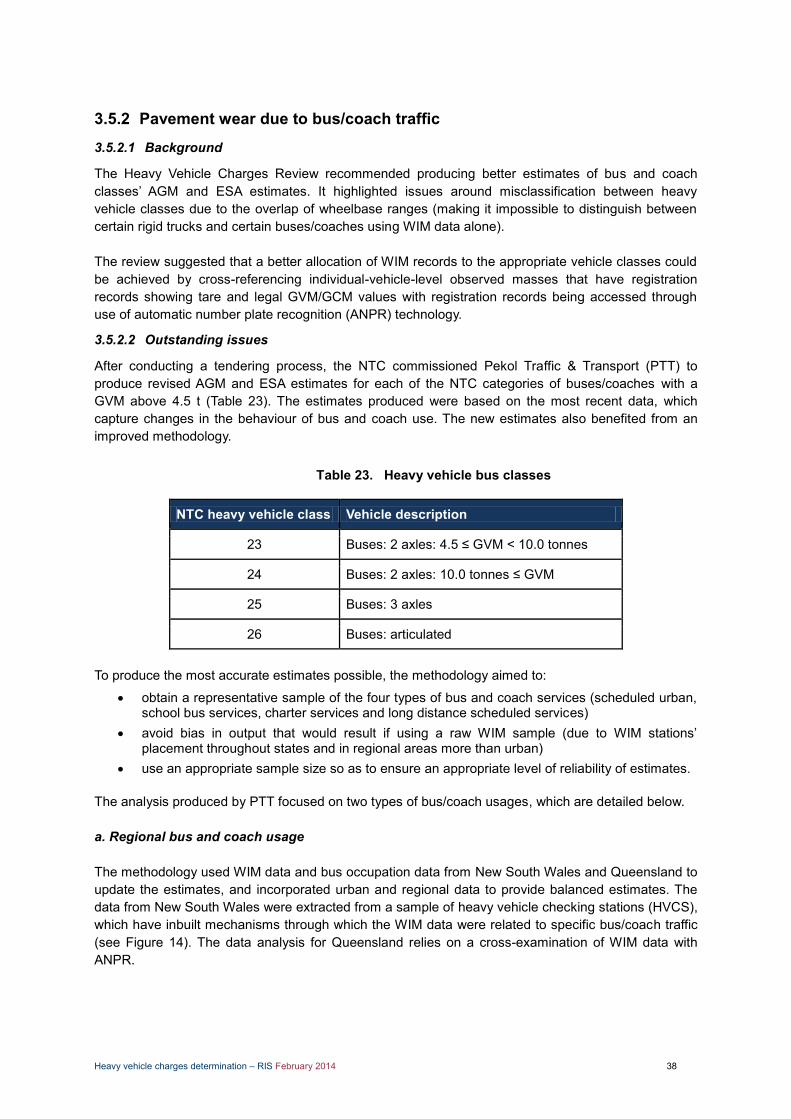
Heavy vehicle charges determination – RIS February 2014 38
3.5.2 Pavement wear due to bus/coach traffic
3.5.2.1 Background
The Heavy Vehicle Charges Review recommended producing better estimates of bus and coach classes’ AGM and ESA estimates. It highlighted issues around misclassification between heavy vehicle classes due to the overlap of wheelbase ranges (making it impossible to distinguish between certain rigid trucks and certain buses/coaches using WIM data alone). The review suggested that a better allocation of WIM records to the appropriate vehicle classes could be achieved by cross-referencing individual-vehicle-level observed masses that have registration records showing tare and legal GVM/GCM values with registration records being accessed through use of automatic number plate recognition (ANPR) technology.
3.5.2.2 Outstanding issues
After conducting a tendering process, the NTC commissioned Pekol Traffic & Transport (PTT) to produce revised AGM and ESA estimates for each of the NTC categories of buses/coaches with a GVM above 4.5 t (Table 23). The estimates produced were based on the most recent data, which capture changes in the behaviour of bus and coach use. The new estimates also benefited from an improved methodology.
Heavy vehicle bus classes Table 23.
NTC heavy vehicle class Vehicle description
23 Buses: 2 axles: 4.5 ≤ GVM < 10.0 tonnes
24 Buses: 2 axles: 10.0 tonnes ≤ GVM
25 Buses: 3 axles
26 Buses: articulated
To produce the most accurate estimates possible, the methodology aimed to:
obtain a representative sample of the four types of bus and coach services (scheduled urban, school bus services, charter services and long distance scheduled services)
avoid bias in output that would result if using a raw WIM sample (due to WIM stations’ placement throughout states and in regional areas more than urban)
use an appropriate sample size so as to ensure an appropriate level of reliability of estimates. The analysis produced by PTT focused on two types of bus/coach usages, which are detailed below. a. Regional bus and coach usage The methodology used WIM data and bus occupation data from New South Wales and Queensland to update the estimates, and incorporated urban and regional data to provide balanced estimates. The data from New South Wales were extracted from a sample of heavy vehicle checking stations (HVCS), which have inbuilt mechanisms through which the WIM data were related to specific bus/coach traffic (see Figure 14). The data analysis for Queensland relies on a cross-examination of WIM data with ANPR.

Heavy vehicle charges determination – RIS February 2014 39
Is Plate Number available?
Vehicle Screening
Plate Number Intercepted Previously?
Yes
Limit Vehicle Category to Previous Intercept
Yes
Is Vehicle Type Unique Based on Axle Count?
Is Vehicle Type Unique Based on Axle Config?
Is Vehicle Type Unique Based on Axle Spacing?
No
No
No
Use Time-of-Day to Guess Vehicle Type
No
Vehicle Type Determined
Yes
Yes
Yes
No
Figure 14. Vehicle identification process used by heavy vehicle checking stations in NSW
In order to gain reliable AGM estimates, a sufficient sample size was obtained and used. Table 24 shows the sample size required in order to gain AGM estimates with a specific confidence interval and to within a specified margin of error (per cent) for an average vehicle mass of 17.5t and standard deviation of 2.0t. It was desirable to have estimates to within ±2% of the true value, with 98–99% confidence. This degree of reliability required a sample size of approximately 177–217.
Sample size for confidence interval for specific margin of error Table 24.
Confidence Interval
% error 95% 98% 99%
5% 21 29 35
2% 126 177 217
1% 502 707 867
The greater the sample size, the greater the general level of reliability of the estimates derived from the sample. In the case of regional data, 37,200 New South Wales and 17,786 Queensland WIM records were used for 2 axle buses with a GVM above 10.0 tonnes. Figure 15 shows an example of mass distribution for 2-axle buses obtained through the examination of WIM records collected by one heavy vehicle checking station in NSW
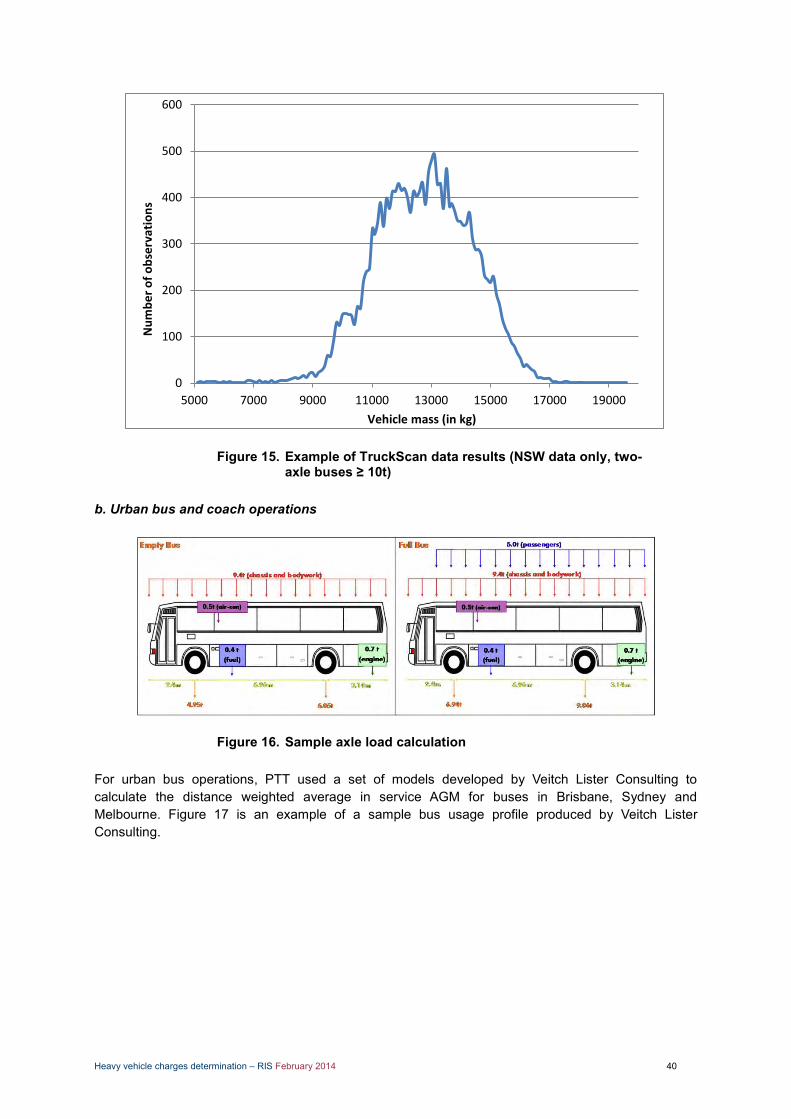
Heavy vehicle charges determination – RIS February 2014 40
Figure 15. Example of TruckScan data results (NSW data only, two-axle buses ≥ 10t)
b. Urban bus and coach operations
Figure 16. Sample axle load calculation For urban bus operations, PTT used a set of models developed by Veitch Lister Consulting to calculate the distance weighted average in service AGM for buses in Brisbane, Sydney and Melbourne. Figure 17 is an example of a sample bus usage profile produced by Veitch Lister Consulting.
0
100
200
300
400
500
600
5000 7000 9000 11000 13000 15000 17000 19000
Nu
mb
er
of
ob
serv
atio
ns
Vehicle mass (in kg)

Heavy vehicle charges determination – RIS February 2014 41
Figure 17. Sample bus usage profile This data was cross-checked against data provided by VicRoads, Translink (Queensland) and Roads & Maritime Services (NSW). These values were used in conjunction with registration data, which showed the makes and models for each bus/coach type, and from which the tare masses could be obtained. People and baggage weights were added to the tare masses and the relevant AGM and ESA estimates were derived to produce urban bus loading profiles such as the one presented in Figure 18.
Figure 18. Sample urban bus loading profiles Table 25 contains new estimates for bus and coach ESAs. These estimates are based on the more recent WIM data and are ascertained through the improved methodology.

Heavy vehicle charges determination – RIS February 2014 42
Bus and coach ESA estimates Table 25.
NTC heavy vehicle class 2007 determination Revised 2013 estimates
AGM (t) ESA AGM (t) ESA
Buses: 2 axles: 4.5 ≤ GVM < 10.0t 5.4 0.0775 4.8 0.05
Buses: 2 axles: 10.0t ≤ GVM 10 0.7010 11.46 1.08
Buses: 3 axles 15.2 1.2393 14.02 0.91
Buses: articulated 16.6 0.7460 17.7 1.1
3.5.2.3 Recommendation
Based on the available evidence, The NTC recommends the adoption of the revised ESA estimates for buses and coaches for use in the PAYGO model.

Heavy vehicle charges determination – RIS February 2014 43
3.5.3 Pavement wear due to light vehicle traffic
3.5.3.1 Background
The Heavy Vehicle Charges Review observed that the ESA value for several light vehicle classes (motorcycles, passenger cars, passenger vans and light buses) is assumed to be nil. Because of this assumption, these light vehicle classes do not contribute to the recovery of government expenditure on roads based on ESA-km. Several industry stakeholders emphasised that lighter vehicles could have a non-negligible impact in terms of road wear, considering their traffic volume. Subsequently, the review recommended reviewing the ESA values for light vehicle classes.
3.5.3.2 Outstanding issues
Further to the review, the NTC researched and reviewed existing literature on the issue of pavement wear due to light vehicles. From a road design perspective, the Austroads Pavement Design code makes the assumption that the impact of light vehicle traffic on good-condition roads designed to sustain heavy vehicle traffic is negligible. Generally speaking, it appears that no internationally recognised pavement design system considers the number of light vehicles in the structural design of the pavement. Furthermore, the Austroads Pavement Design code does not make any mention of the potential impact of light vehicle traffic on poor and moderately performing aggregates. To further its understanding of this issue, the NTC contacted several subject matter experts including David Alabaster, Principal Pavement Engineer with the NZ Transport Agency. Alabaster confirmed that under constant amplitude cyclic loading, an aggregate will tend towards a constant density state. If the loading amplitude is increased then the aggregate will tend towards a new state; it is said to be shaking down. Alabaster added that the ‘shakedown’ theory suggests that at very light loads (below the elastic limit for specific aggregates) a well-built sealed pavement behaves elastically; that is, cars do not damage roads built for trucks. The use of the fourth power law18 (or any other published power law) is only relevant in situations where pavement stress is known to be above the acceptable limit for the considered material. If a road is well designed and built to carry trucks, it is very unlikely that stresses due to light vehicle traffic will be above the elastic limit for this road and therefore it would not be sensible to use the fourth power law outside the bound it was developed for. Alabaster informed the NTC that research is currently being conducted at the Canterbury Accelerated Pavement Testing Indoor Facility (CAPTIF) at the light end of the truck axle loading spectrum. Early stages of the research involved the completion of 300,000 load cycles. Consequently, the timing of this research will not allow the relevant results to be considered as part of this heavy vehicle charges determination. Cyrille Chazallon, Professor at the National Institutes of Applied Sciences in Strasbourg, France, confirmed that light vehicle traffic would only cause road wear in the top layer of well-designed and well-drained roads designed and built to carry trucks. In Australia the ARRB owns the Accelerated Loading Facility (ALF) to simulate heavy vehicle trafficking on pavement structures under controlled conditions. ARRB experts Didier Boidin, Principal Research Engineer, Pavements and Surfacings and Anthony Germanchev, Team Leader, Heavy Vehicles, both confirm there is no evidence to support the view that light vehicles have a measurable impact on roads designed to accomadate heavy vehicles.
3.5.3.3 Recommendation
Based on the analysis of the available evidence, the NTC recommends retaining the current ESA values for light vehicle classes.
18 Road wear damage caused by a particular axle load can be measured by dividing it by the reference axle load and raising it to the power of four.
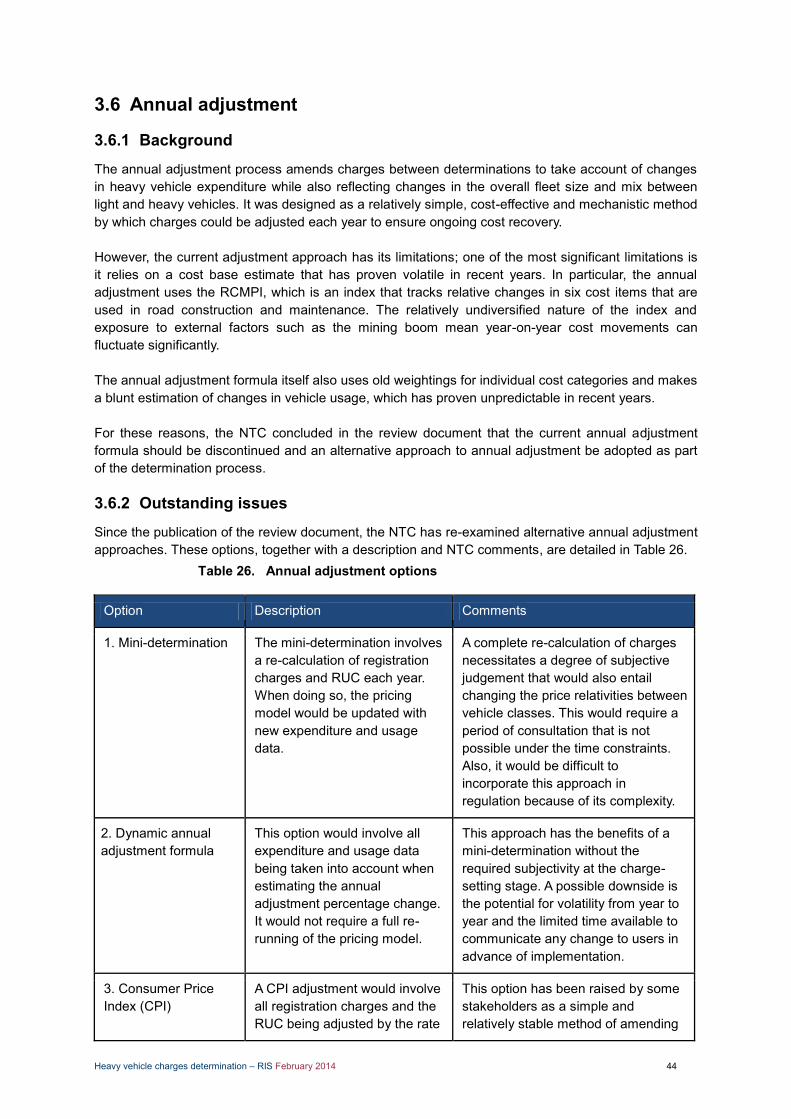
Heavy vehicle charges determination – RIS February 2014 44
3.6 Annual adjustment
3.6.1 Background
The annual adjustment process amends charges between determinations to take account of changes in heavy vehicle expenditure while also reflecting changes in the overall fleet size and mix between light and heavy vehicles. It was designed as a relatively simple, cost-effective and mechanistic method by which charges could be adjusted each year to ensure ongoing cost recovery. However, the current adjustment approach has its limitations; one of the most significant limitations is it relies on a cost base estimate that has proven volatile in recent years. In particular, the annual adjustment uses the RCMPI, which is an index that tracks relative changes in six cost items that are used in road construction and maintenance. The relatively undiversified nature of the index and exposure to external factors such as the mining boom mean year-on-year cost movements can fluctuate significantly. The annual adjustment formula itself also uses old weightings for individual cost categories and makes a blunt estimation of changes in vehicle usage, which has proven unpredictable in recent years. For these reasons, the NTC concluded in the review document that the current annual adjustment formula should be discontinued and an alternative approach to annual adjustment be adopted as part of the determination process.
3.6.2 Outstanding issues
Since the publication of the review document, the NTC has re-examined alternative annual adjustment approaches. These options, together with a description and NTC comments, are detailed in Table 26.
Annual adjustment options Table 26.
Option Description Comments
1. Mini-determination The mini-determination involves a re-calculation of registration charges and RUC each year. When doing so, the pricing model would be updated with new expenditure and usage data.
A complete re-calculation of charges necessitates a degree of subjective judgement that would also entail changing the price relativities between vehicle classes. This would require a period of consultation that is not possible under the time constraints. Also, it would be difficult to incorporate this approach in regulation because of its complexity.
2. Dynamic annual adjustment formula
This option would involve all expenditure and usage data being taken into account when estimating the annual adjustment percentage change. It would not require a full re-running of the pricing model.
This approach has the benefits of a mini-determination without the required subjectivity at the charge-setting stage. A possible downside is the potential for volatility from year to year and the limited time available to communicate any change to users in advance of implementation.
3. Consumer Price Index (CPI)
A CPI adjustment would involve all registration charges and the RUC being adjusted by the rate
This option has been raised by some stakeholders as a simple and relatively stable method of amending

Heavy vehicle charges determination – RIS February 2014 45
Option Description Comments
of inflation each year. charges each year, and can be communicated to users well in advance of implementation. CPI adjustments are used in other network infrastructure businesses to increase the cost base from year to year. The downside of this approach is that it lacks accuracy and does not reflect what is happening with actual expenditure and usage on the road network. As a consequence, this approach is likely to lead to higher levels of under- or over-recovery.
The revised annual adjustment approach is aimed to provide a mechanism that best meets the following criteria:
predictability reflects changes in expenditure and vehicle use by using the most up-to-date heavy vehicle
costs and usage data achieves ongoing full cost recovery does not require discretionary decision making on the part of the NTC.
In assessing the options against the above criteria, the NTC are of the view that Option 1 requires too much discretion on the part of the NTC, which, as a consequence would also require additional consultation with stakeholders. Given the time constraints on the annual adjustment process, this option is not viable. Furthermore, incorporating the ‘mini determination’ approach into regulations also poses a number of challenges which further impact on implementation timelines. Of the two remaining viable options, Option 2 – the dynamic annual adjustment formula is the more accurate. New charges determined under this approach will take into account the most up-to-date changes in usage and expenditure using the following sources:
heavy vehicle usage data – SMVU road expenditure data – jurisdictional expenditure templates and ABS statistics for local road
expenditure. In contrast the CPI tracks the change in prices of a basket of goods and services typically purchased by a domestic Australian family, and therefore has no correlation with changes in the cost or usage of the road network. However, CPI does typically result in smoother and more stable changes over time, increasing its predictability. The preferred option is ultimately a trade-off between accuracy and simplicity, with Option 2 offering the more accurate approach, whereas Option 3 represents a more simple and predictable method. Figure 19 shows how Option 3 would have compared historically with actual heavy-vehicle-related expenditure and the derived cost base for those years.
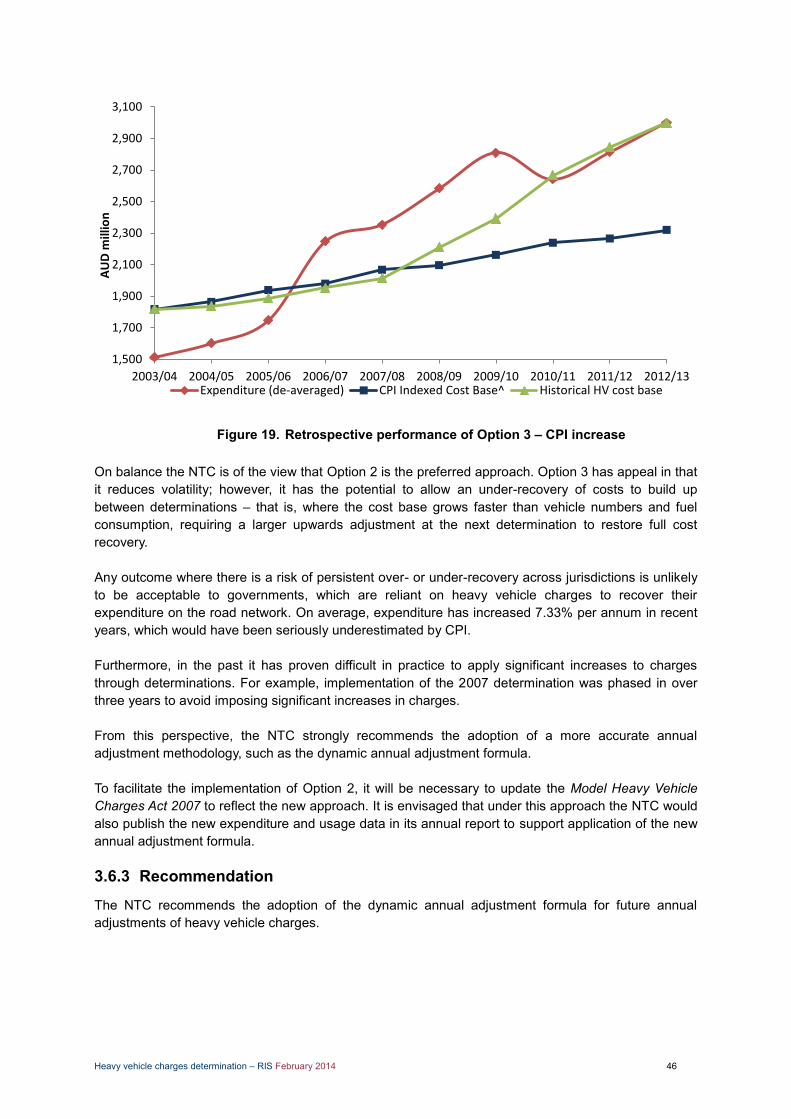
Heavy vehicle charges determination – RIS February 2014 46
Figure 19. Retrospective performance of Option 3 – CPI increase On balance the NTC is of the view that Option 2 is the preferred approach. Option 3 has appeal in that it reduces volatility; however, it has the potential to allow an under-recovery of costs to build up between determinations – that is, where the cost base grows faster than vehicle numbers and fuel consumption, requiring a larger upwards adjustment at the next determination to restore full cost recovery. Any outcome where there is a risk of persistent over- or under-recovery across jurisdictions is unlikely to be acceptable to governments, which are reliant on heavy vehicle charges to recover their expenditure on the road network. On average, expenditure has increased 7.33% per annum in recent years, which would have been seriously underestimated by CPI. Furthermore, in the past it has proven difficult in practice to apply significant increases to charges through determinations. For example, implementation of the 2007 determination was phased in over three years to avoid imposing significant increases in charges. From this perspective, the NTC strongly recommends the adoption of a more accurate annual adjustment methodology, such as the dynamic annual adjustment formula. To facilitate the implementation of Option 2, it will be necessary to update the Model Heavy Vehicle Charges Act 2007 to reflect the new approach. It is envisaged that under this approach the NTC would also publish the new expenditure and usage data in its annual report to support application of the new annual adjustment formula.
3.6.3 Recommendation
The NTC recommends the adoption of the dynamic annual adjustment formula for future annual adjustments of heavy vehicle charges.
1,500
1,700
1,900
2,100
2,300
2,500
2,700
2,900
3,100
2012/132011/122010/112009/102008/092007/082006/072005/062004/052003/04
AU
D m
illio
n
Expenditure (de-averaged) CPI Indexed Cost Base^ Historical HV cost base

Heavy vehicle charges determination – RIS February 2014 47
3.7 Rebates and concessions
3.7.1 Background
The purpose of this determination is to recommend a set of national heavy vehicle charges. However, states and territories have the ability to modify the national charges through rebates and concessions. The majority of rebates and concessions are typically granted by individual states and territories and are targeted towards certain classes of operators that are deemed disadvantaged by national charges. Within the national charging framework there are two concessions in the form of the unsealed road discount and remote community service obligation (CSO). In the review, the NTC concluded that:
Concessions should remain the prerogative of individual jurisdictions. To enhance transparency, a list of concessions will be collated and made available to the
public on the NTC website. As part of the determination process, the NTC will explore the option of establishing agreed
principles to encourage a consistent approach to concessions across jurisdictions. As part of the determination process, the NTC will explore ways to continue the unsealed road
discount that road trains have received in previous pricing determinations.
3.7.2 Outstanding issues
Since the publication of the review document, the NTC commissioned an inventory of all existing rebates and concessions, the reason why they were introduced, and a quantification of their value.19 As part of this report, the independent consultant also drafted a set of principles that jurisdictions may wish to consider when deciding to grant concessions to certain classes of operator. The proposed principles were:
Define clear objectives. Define the problem and set clear objectives for the concession. Minimise distortions. Structure the concession to achieve the objective in the least distorted
way (e.g. should not impact on vehicle choice). Ensure transparency. Make the concession transparent in terms of objective and size of
subsidy. Monitor and review. Monitor and review the concession over time to see how much is being
recovered and whether the original objectives are being met. With respect to the road train discount, the NTC accepted in the review that the discount accorded to road trains in compensation for travelling on unsealed roads, and servicing remote communities should continue in some form.
3.7.2.1 Current approach to road trains
Under the current charging regime, all vehicle combinations are allocated attributable costs – that is, costs that can be directly attributed to that class. This allocation in effect sets the cost recovery target. However, in the last determination road trains received a reduction in their attributable cost target. This reduction took the form of the unsealed road discount and a remote communities CSO. The former was to compensate road trains for the distance they travelled on poorer quality unsealed roads, while the latter reduction was in acknowledgment of the service road trains provide to remote communities.
19 The report into rebates and concessions completed by Marsden Jacob Associates (MJA) can be found in the “News and Publications – Other Reports” section of the NTC website.
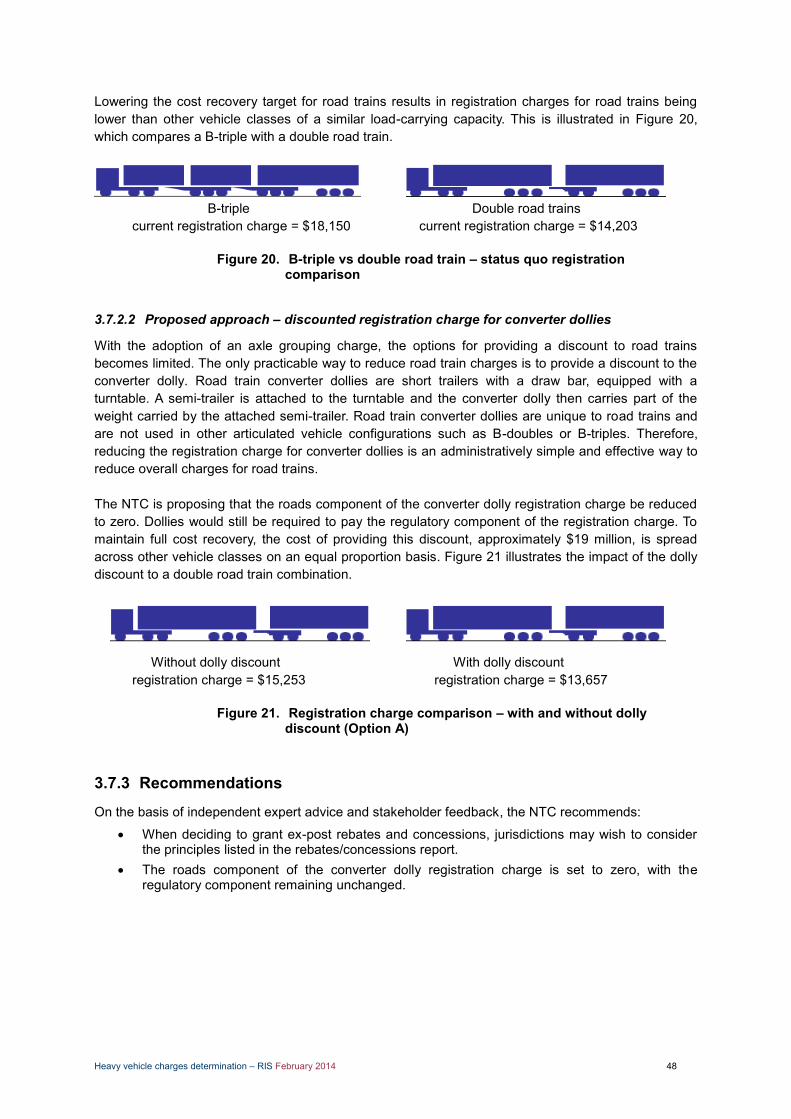
Heavy vehicle charges determination – RIS February 2014 48
Lowering the cost recovery target for road trains results in registration charges for road trains being lower than other vehicle classes of a similar load-carrying capacity. This is illustrated in Figure 20, which compares a B-triple with a double road train.
B-triple Double road trains
current registration charge = $18,150 current registration charge = $14,203
Figure 20. B-triple vs double road train – status quo registration comparison
3.7.2.2 Proposed approach – discounted registration charge for converter dollies
With the adoption of an axle grouping charge, the options for providing a discount to road trains becomes limited. The only practicable way to reduce road train charges is to provide a discount to the converter dolly. Road train converter dollies are short trailers with a draw bar, equipped with a turntable. A semi-trailer is attached to the turntable and the converter dolly then carries part of the weight carried by the attached semi-trailer. Road train converter dollies are unique to road trains and are not used in other articulated vehicle configurations such as B-doubles or B-triples. Therefore, reducing the registration charge for converter dollies is an administratively simple and effective way to reduce overall charges for road trains. The NTC is proposing that the roads component of the converter dolly registration charge be reduced to zero. Dollies would still be required to pay the regulatory component of the registration charge. To maintain full cost recovery, the cost of providing this discount, approximately $19 million, is spread across other vehicle classes on an equal proportion basis. Figure 21 illustrates the impact of the dolly discount to a double road train combination. Without dolly discount With dolly discount registration charge = $15,253 registration charge = $13,657
Figure 21. Registration charge comparison – with and without dolly discount (Option A)
3.7.3 Recommendations
On the basis of independent expert advice and stakeholder feedback, the NTC recommends:
When deciding to grant ex-post rebates and concessions, jurisdictions may wish to consider the principles listed in the rebates/concessions report.
The roads component of the converter dolly registration charge is set to zero, with the regulatory component remaining unchanged.
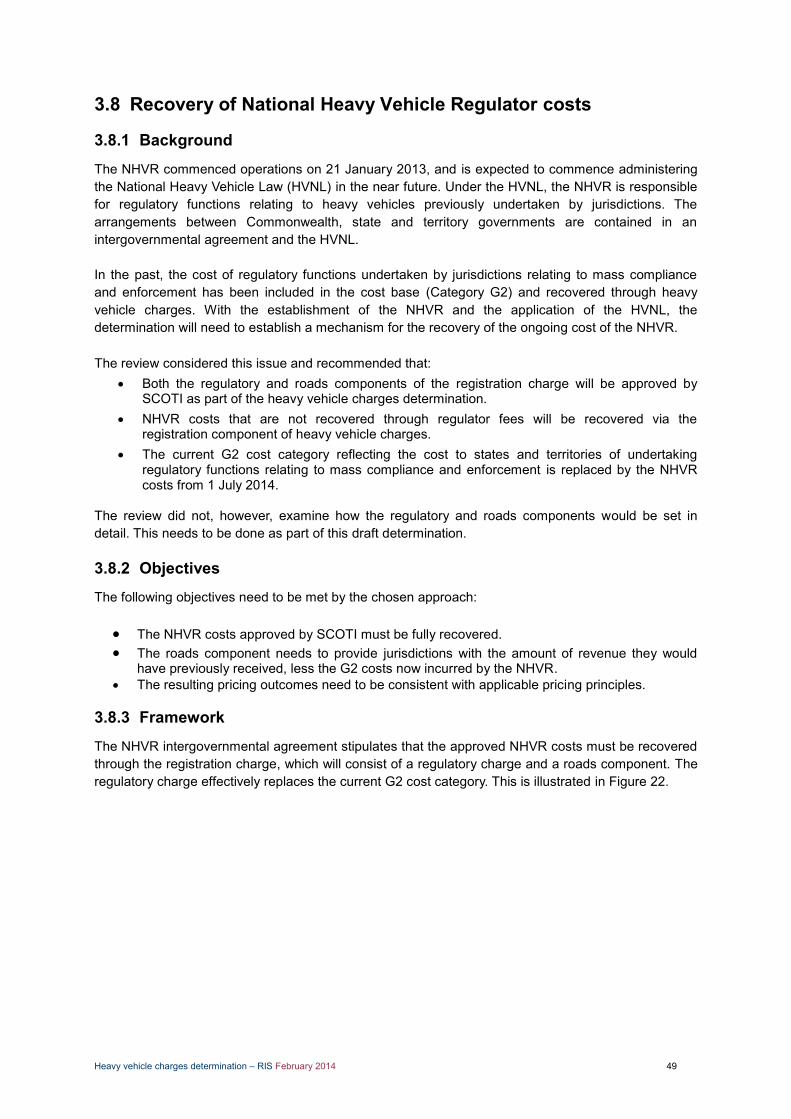
Heavy vehicle charges determination – RIS February 2014 49
3.8 Recovery of National Heavy Vehicle Regulator costs
3.8.1 Background
The NHVR commenced operations on 21 January 2013, and is expected to commence administering the National Heavy Vehicle Law (HVNL) in the near future. Under the HVNL, the NHVR is responsible for regulatory functions relating to heavy vehicles previously undertaken by jurisdictions. The arrangements between Commonwealth, state and territory governments are contained in an intergovernmental agreement and the HVNL. In the past, the cost of regulatory functions undertaken by jurisdictions relating to mass compliance and enforcement has been included in the cost base (Category G2) and recovered through heavy vehicle charges. With the establishment of the NHVR and the application of the HVNL, the determination will need to establish a mechanism for the recovery of the ongoing cost of the NHVR. The review considered this issue and recommended that:
Both the regulatory and roads components of the registration charge will be approved by SCOTI as part of the heavy vehicle charges determination.
NHVR costs that are not recovered through regulator fees will be recovered via the registration component of heavy vehicle charges.
The current G2 cost category reflecting the cost to states and territories of undertaking regulatory functions relating to mass compliance and enforcement is replaced by the NHVR costs from 1 July 2014.
The review did not, however, examine how the regulatory and roads components would be set in detail. This needs to be done as part of this draft determination.
3.8.2 Objectives
The following objectives need to be met by the chosen approach:
The NHVR costs approved by SCOTI must be fully recovered. The roads component needs to provide jurisdictions with the amount of revenue they would
have previously received, less the G2 costs now incurred by the NHVR. The resulting pricing outcomes need to be consistent with applicable pricing principles.
3.8.3 Framework
The NHVR intergovernmental agreement stipulates that the approved NHVR costs must be recovered through the registration charge, which will consist of a regulatory charge and a roads component. The regulatory charge effectively replaces the current G2 cost category. This is illustrated in Figure 22.
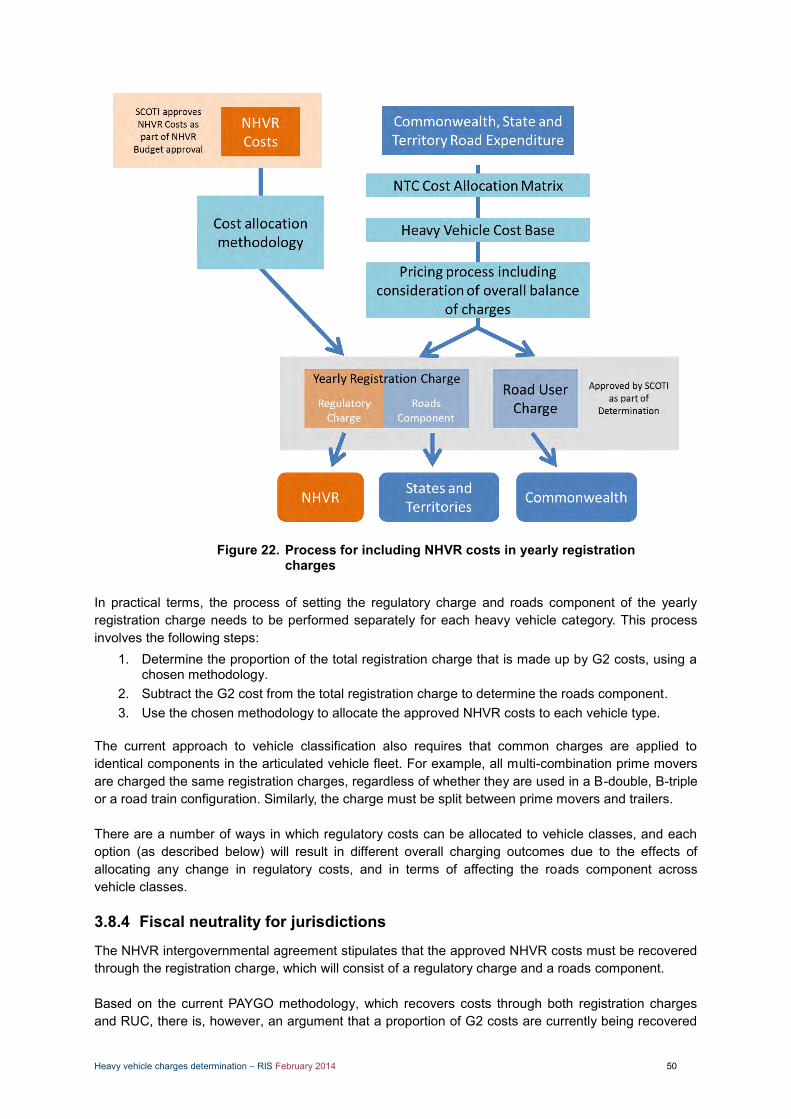
Heavy vehicle charges determination – RIS February 2014 50
Figure 22. Process for including NHVR costs in yearly registration charges
In practical terms, the process of setting the regulatory charge and roads component of the yearly registration charge needs to be performed separately for each heavy vehicle category. This process involves the following steps:
1. Determine the proportion of the total registration charge that is made up by G2 costs, using a chosen methodology.
2. Subtract the G2 cost from the total registration charge to determine the roads component. 3. Use the chosen methodology to allocate the approved NHVR costs to each vehicle type.
The current approach to vehicle classification also requires that common charges are applied to identical components in the articulated vehicle fleet. For example, all multi-combination prime movers are charged the same registration charges, regardless of whether they are used in a B-double, B-triple or a road train configuration. Similarly, the charge must be split between prime movers and trailers. There are a number of ways in which regulatory costs can be allocated to vehicle classes, and each option (as described below) will result in different overall charging outcomes due to the effects of allocating any change in regulatory costs, and in terms of affecting the roads component across vehicle classes.
3.8.4 Fiscal neutrality for jurisdictions
The NHVR intergovernmental agreement stipulates that the approved NHVR costs must be recovered through the registration charge, which will consist of a regulatory charge and a roads component. Based on the current PAYGO methodology, which recovers costs through both registration charges and RUC, there is, however, an argument that a proportion of G2 costs are currently being recovered
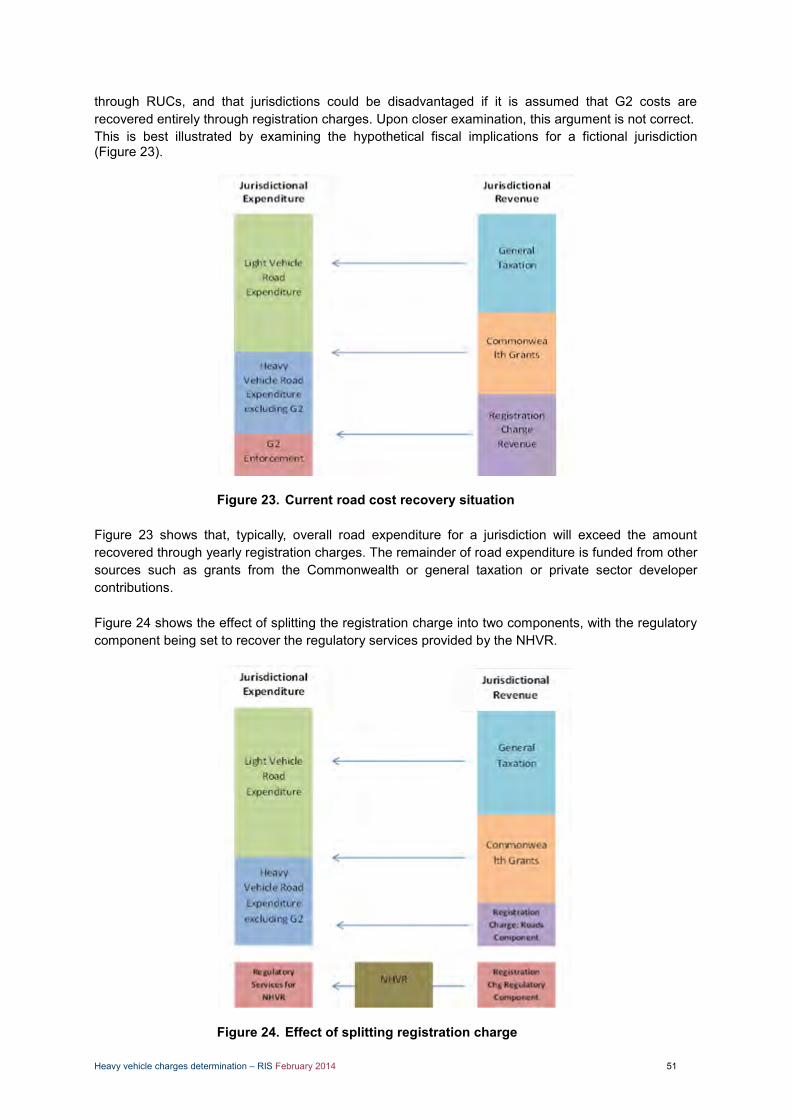
Heavy vehicle charges determination – RIS February 2014 51
through RUCs, and that jurisdictions could be disadvantaged if it is assumed that G2 costs are recovered entirely through registration charges. Upon closer examination, this argument is not correct. This is best illustrated by examining the hypothetical fiscal implications for a fictional jurisdiction (Figure 23).
Figure 23. Current road cost recovery situation
Figure 23 shows that, typically, overall road expenditure for a jurisdiction will exceed the amount recovered through yearly registration charges. The remainder of road expenditure is funded from other sources such as grants from the Commonwealth or general taxation or private sector developer contributions. Figure 24 shows the effect of splitting the registration charge into two components, with the regulatory component being set to recover the regulatory services provided by the NHVR.
Figure 24. Effect of splitting registration charge

Heavy vehicle charges determination – RIS February 2014 52
This is further illustrated by the example calculation provided in Table 27, which shows that the above approach is fiscally neutral for the jurisdiction because the reduction in revenue from registration charges is offset by the reduction in expenditure in the G2 category.
Example calculation Table 27.
Consequently, NHVR costs can be recovered purely through the registration charge without imposing losses on jurisdictions.
3.8.5 Modelling approach
The graphs and numbers presented below have been calculated based on historical information to provide an indication of the likely outcomes of each allocation option in broad terms. The calculations in the scenarios include the following steps:
1. Take the current registration charge. 2. Calculate the implied G2 expenditure based on the chosen allocation methodology and total
G2 cost of $75.6 million. 3. Work out the implied roads component by subtracting the implied G2 expenditure from the
existing registration fee. 4. Calculate the regulatory component on the basis of the chosen allocation methodology, based
upon an assumed NHVR budget of $135 million. 5. The new yearly registration charge is equal to the sum of the implied roads component and
the new regulatory component.
A basic assumption underpinning all calculations is that a common methodology is applied for calculating the implied G2 expenditure proportion of the current yearly registration charge and also for allocating the NHVR costs to individual vehicle categories to form the new regulatory component.
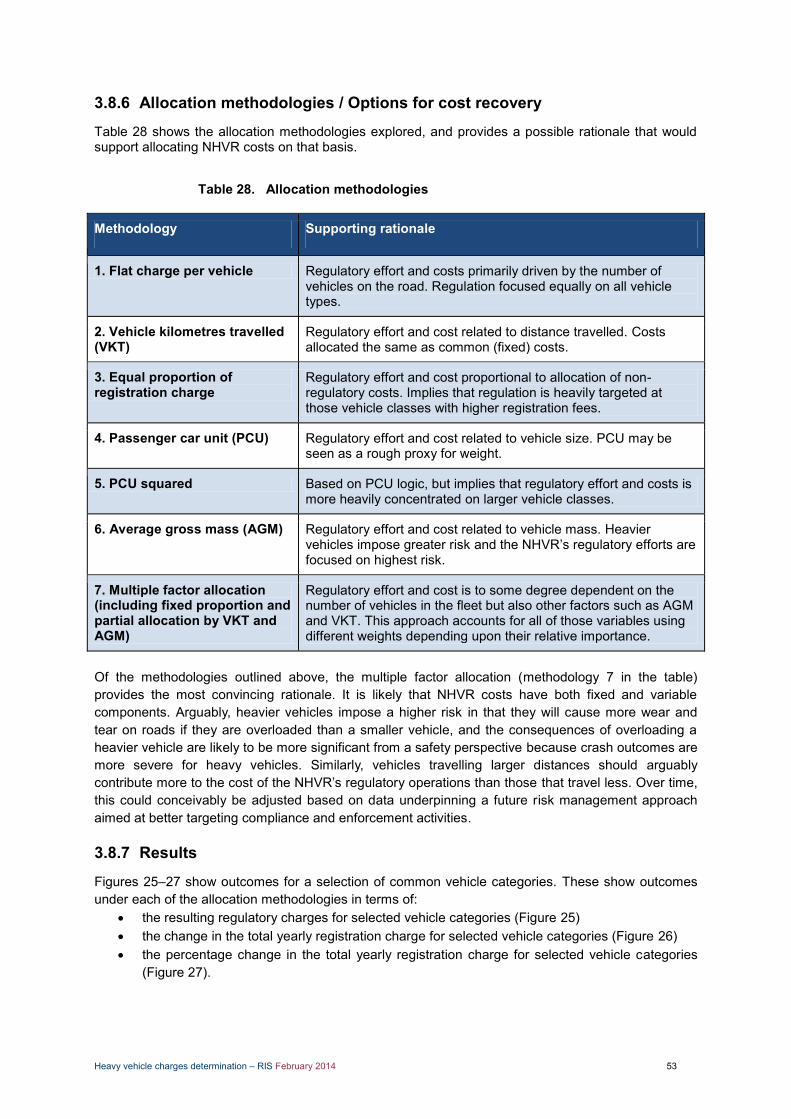
Heavy vehicle charges determination – RIS February 2014 53
3.8.6 Allocation methodologies / Options for cost recovery
Table 28 shows the allocation methodologies explored, and provides a possible rationale that would support allocating NHVR costs on that basis.
Allocation methodologies Table 28.
Methodology Supporting rationale
1. Flat charge per vehicle Regulatory effort and costs primarily driven by the number of vehicles on the road. Regulation focused equally on all vehicle types.
2. Vehicle kilometres travelled (VKT)
Regulatory effort and cost related to distance travelled. Costs allocated the same as common (fixed) costs.
3. Equal proportion of registration charge
Regulatory effort and cost proportional to allocation of non-regulatory costs. Implies that regulation is heavily targeted at those vehicle classes with higher registration fees.
4. Passenger car unit (PCU) Regulatory effort and cost related to vehicle size. PCU may be seen as a rough proxy for weight.
5. PCU squared Based on PCU logic, but implies that regulatory effort and costs is more heavily concentrated on larger vehicle classes.
6. Average gross mass (AGM) Regulatory effort and cost related to vehicle mass. Heavier vehicles impose greater risk and the NHVR’s regulatory efforts are focused on highest risk.
7. Multiple factor allocation (including fixed proportion and partial allocation by VKT and AGM)
Regulatory effort and cost is to some degree dependent on the number of vehicles in the fleet but also other factors such as AGM and VKT. This approach accounts for all of those variables using different weights depending upon their relative importance.
Of the methodologies outlined above, the multiple factor allocation (methodology 7 in the table) provides the most convincing rationale. It is likely that NHVR costs have both fixed and variable components. Arguably, heavier vehicles impose a higher risk in that they will cause more wear and tear on roads if they are overloaded than a smaller vehicle, and the consequences of overloading a heavier vehicle are likely to be more significant from a safety perspective because crash outcomes are more severe for heavy vehicles. Similarly, vehicles travelling larger distances should arguably contribute more to the cost of the NHVR’s regulatory operations than those that travel less. Over time, this could conceivably be adjusted based on data underpinning a future risk management approach aimed at better targeting compliance and enforcement activities.
3.8.7 Results
Figures 25–27 show outcomes for a selection of common vehicle categories. These show outcomes under each of the allocation methodologies in terms of:
the resulting regulatory charges for selected vehicle categories (Figure 25) the change in the total yearly registration charge for selected vehicle categories (Figure 26) the percentage change in the total yearly registration charge for selected vehicle categories
(Figure 27).
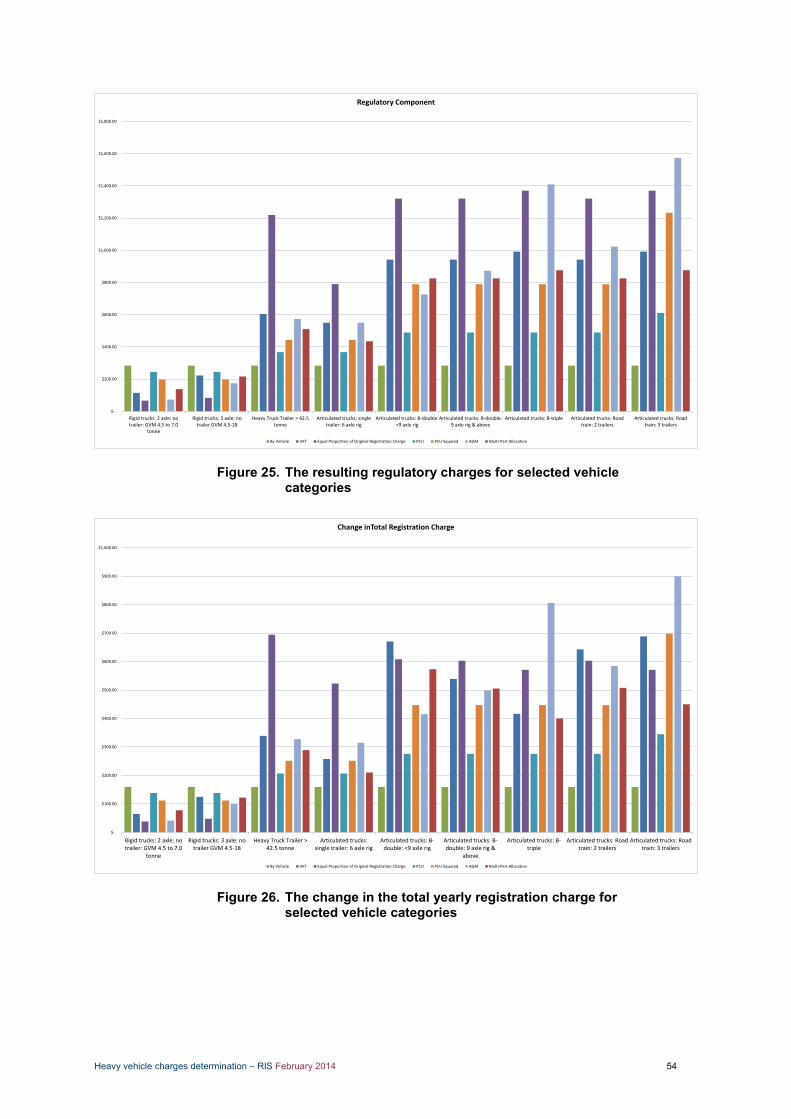
Heavy vehicle charges determination – RIS February 2014 54
Figure 25. The resulting regulatory charges for selected vehicle categories
Figure 26. The change in the total yearly registration charge for selected vehicle categories
$-
$200.00
$400.00
$600.00
$800.00
$1,000.00
$1,200.00
$1,400.00
$1,600.00
$1,800.00
Rigid trucks: 2 axle: notrailer: GVM 4.5 to 7.0
tonne
Rigid trucks: 3 axle: notrailer GVM 4.5-18
Heavy Truck Trailer > 42.5tonne
Articulated trucks: singletrailer: 6 axle rig
Articulated trucks: B-double:<9 axle rig
Articulated trucks: B-double:9 axle rig & above
Articulated trucks: B-triple Articulated trucks: Roadtrain: 2 trailers
Articulated trucks: Roadtrain: 3 trailers
Regulatory Component
By Vehicle VKT Equal Proportion of Original Registration Charge PCU PCU Squared AGM Multi-Part Allocation
$-
$100.00
$200.00
$300.00
$400.00
$500.00
$600.00
$700.00
$800.00
$900.00
$1,000.00
Rigid trucks: 2 axle: notrailer: GVM 4.5 to 7.0
tonne
Rigid trucks: 3 axle: notrailer GVM 4.5-18
Heavy Truck Trailer >42.5 tonne
Articulated trucks:single trailer: 6 axle rig
Articulated trucks: B-double: <9 axle rig
Articulated trucks: B-double: 9 axle rig &
above
Articulated trucks: B-triple
Articulated trucks: Roadtrain: 2 trailers
Articulated trucks: Roadtrain: 3 trailers
Change inTotal Registration Charge
By Vehicle VKT Equal Proportion of Original Registration Charge PCU PCU Squared AGM Multi-Part Allocation
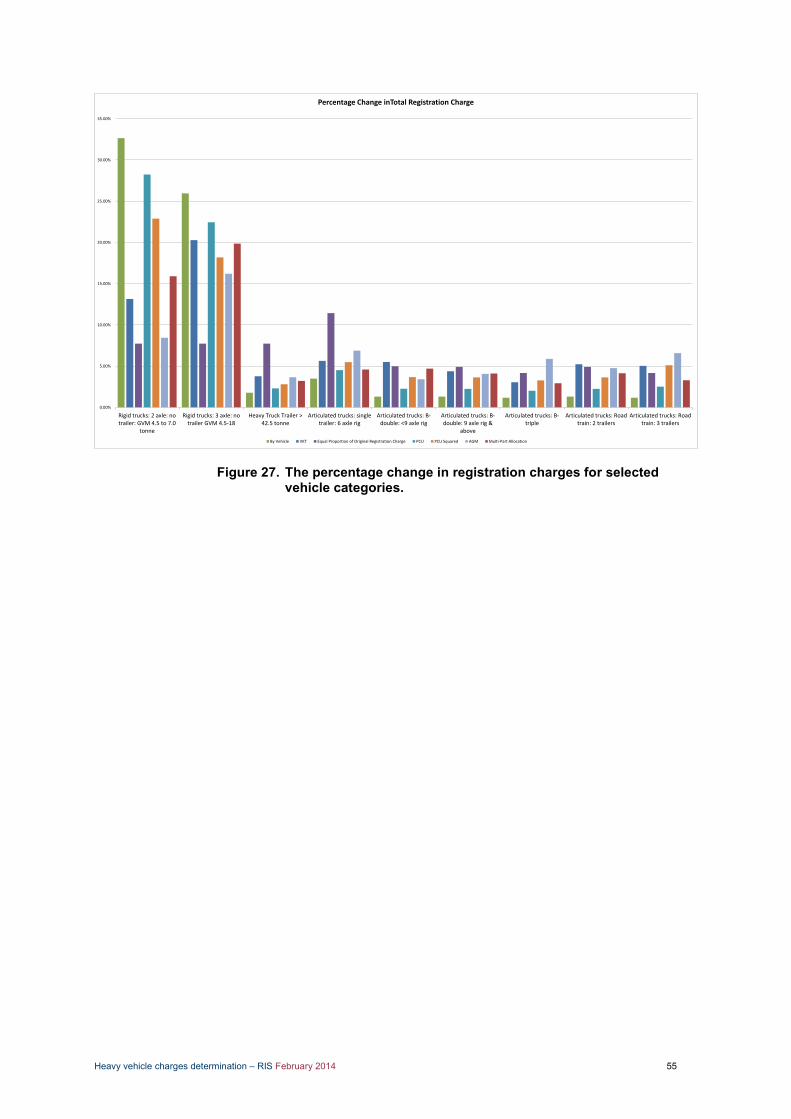
Heavy vehicle charges determination – RIS February 2014 55
Figure 27. The percentage change in registration charges for selected vehicle categories.
0.00%
5.00%
10.00%
15.00%
20.00%
25.00%
30.00%
35.00%
Rigid trucks: 2 axle: notrailer: GVM 4.5 to 7.0
tonne
Rigid trucks: 3 axle: notrailer GVM 4.5-18
Heavy Truck Trailer >42.5 tonne
Articulated trucks: singletrailer: 6 axle rig
Articulated trucks: B-double: <9 axle rig
Articulated trucks: B-double: 9 axle rig &
above
Articulated trucks: B-triple
Articulated trucks: Roadtrain: 2 trailers
Articulated trucks: Roadtrain: 3 trailers
Percentage Change inTotal Registration Charge
By Vehicle VKT Equal Proportion of Original Registration Charge PCU PCU Squared AGM Multi-Part Allocation

Heavy vehicle charges determination – RIS February 2014 56
Assessment of outcomes Table 29.
Methodology Comment on outcome
1. Flat charge per vehicle Highly regressive for smaller vehicle classes. Percentage increase on original registration charges unevenly distributed.
2. Vehicle kilometres travelled (VKT)
Results in very high charges for articulated fleet. Treats NHVR costs as entirely related to average distance travelled. May not be a good proxy for actual cost drivers.
3. Equal proportion of registration charge
Articulated vehicle fleet and heavier rigid vehicle would pay for the majority of NHVR costs, whereas smaller vehicles would pay very little.
4. Passenger car unit (PCU) Results in relatively high charges for smallest vehicles and low charges for the articulated fleet. Likely to be too blunt as an allocation methodology.
5. PCU squared Similar to methodology 4 (PCU) but slightly less punitive on smallest vehicles. Overall, does not allow for much differentiation between vehicle classes.
6. Average gross mass (AGM)
Results in relatively high charges for smallest vehicles and the articulated fleet. Particularly high cost for triple road trains.
7. Multiple factor allocation (including fixed proportion and partial allocation by VKT and AGM)
Provides flexibility to achieve reasonable progression of charges from lighter/smaller to heavier/larger vehicle classes. Aligned with likely reality that NHVR regulatory efforts and costs are driven by multiple factors. The allocation factors can be revised over time as cost drivers are better understood. Overall, this is the best option.
Each option produces broadly similar amounts of revenue for jurisdictions. This means that the choice of option does not need to be driven by fiscal considerations. The NTC considers that methodology 7, the multiple factor allocation, produces the best outcomes in terms of recovering the NHVR’s costs. In addition, it offers the benefit of being able to adjust the allocation parameters in the future, once the understanding of relevant cost drivers improves. The charges developed as part of this determination have therefore been based on this option.
3.8.8 Recommendation
Based on the analysis presented above, the NTC recommends the use of a multiple factor allocation mechanism for the recovery of NHVR costs.

Heavy vehicle charges determination – RIS February 2014 57
4. Options
4.1 Introduction
This section outlines the charging options evaluated as part of this draft regulatory impact statement. The options have been developed on the basis of the review recommendations and further research undertaken since then. The options include the Base Case (Annual Adjustment) as the counterfactual against which any potential new set of charges needs to be assessed. This is the set of charges that would exist in the absence of any determination. Against this base case, we present an Updated Status Quo representing the current methodology, updated to include the latest expenditure data, usage data and vehicle numbers. Options A, B and C then include all the technical improvements recommended as part of the Review.
4.2 Base Case (Annual Adjustment)
This is the counterfactual against which all options are assessed. It needs to describe the state that would exist if this determination were not implemented. If SCOTI makes no decisions as part of this determination, then the current charges would be adjusted for 2014–15 using the current annual adjustment mechanism as outlined in the Model Heavy Vehicle Charges Act 2007 and Model Heavy Vehicle Charges (Amendment) Act 2010. Calculating the cost base for this option requires historical expenditure to be inflated by the RCMPI. BITRE is currently updating the RCMPI and NTC understands that this will translate into an annual adjustment of 1.3%. This is the assumption used to calculate charges under the Base Case (Annual Adjustment)
4.2.1 Base Case (Annual Adjustment) heavy vehicle charges
The cost base calculated under the annual adjustment formula is $2,954.8 billion. The annual adjustment then requires that current charges be inflated by a fixed percentage to ensure this cost base is recovered, taking into account updated information on vehicle numbers and fuel consumption (based on SMVU, trended midpoint of seven-year averaging period). Under this scenario, the current RUC of 26.1c/l would be increased by 1.3% to 26.5c/l. Registration charges would also be increased by an identical 1.3% above current rates as shown in Table 30.
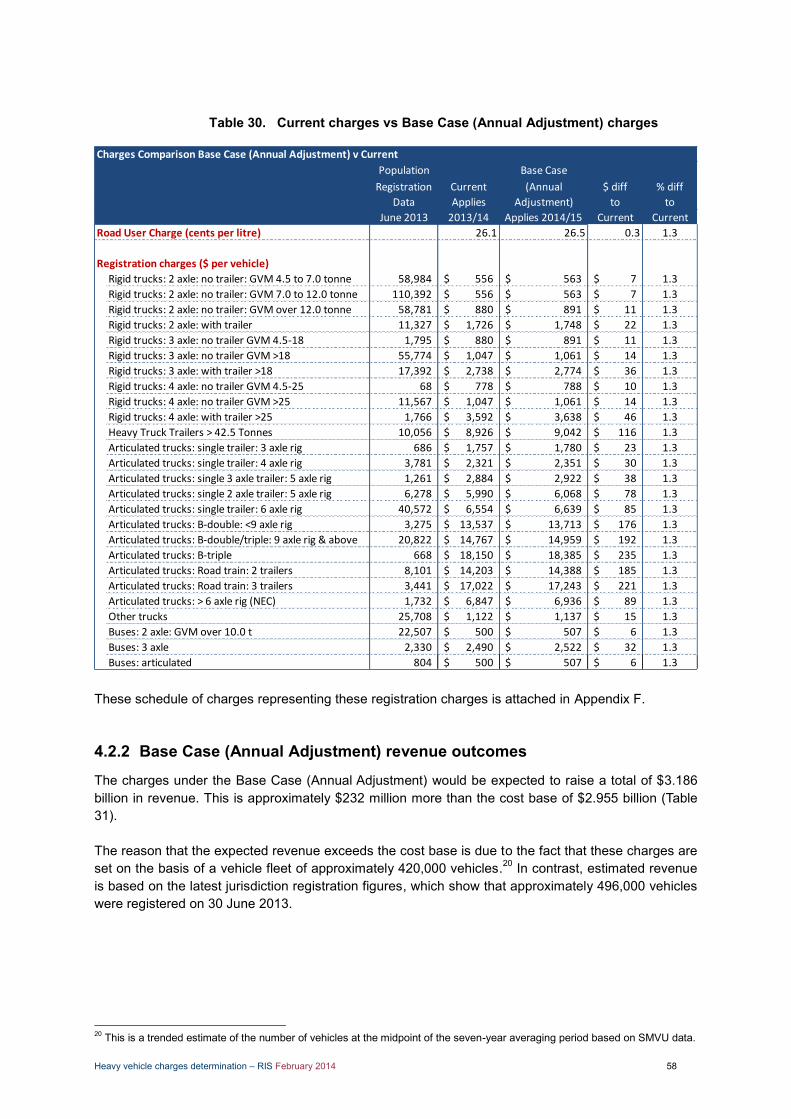
Heavy vehicle charges determination – RIS February 2014 58
Current charges vs Base Case (Annual Adjustment) charges Table 30.
These schedule of charges representing these registration charges is attached in Appendix F.
4.2.2 Base Case (Annual Adjustment) revenue outcomes
The charges under the Base Case (Annual Adjustment) would be expected to raise a total of $3.186 billion in revenue. This is approximately $232 million more than the cost base of $2.955 billion (Table 31). The reason that the expected revenue exceeds the cost base is due to the fact that these charges are set on the basis of a vehicle fleet of approximately 420,000 vehicles.20 In contrast, estimated revenue is based on the latest jurisdiction registration figures, which show that approximately 496,000 vehicles were registered on 30 June 2013.
20 This is a trended estimate of the number of vehicles at the midpoint of the seven-year averaging period based on SMVU data.
Population Base Case
Registration Current (Annual $ diff % diff
Data Applies Adjustment) to to
June 2013 2013/14 Applies 2014/15 Current Current
Road User Charge (cents per litre) 26.1 26.5 0.3 1.3
Registration charges ($ per vehicle)
Rigid trucks: 2 axle: no trailer: GVM 4.5 to 7.0 tonne 58,984 556$ 563$ 7$ 1.3
Rigid trucks: 2 axle: no trailer: GVM 7.0 to 12.0 tonne 110,392 556$ 563$ 7$ 1.3
Rigid trucks: 2 axle: no trailer: GVM over 12.0 tonne 58,781 880$ 891$ 11$ 1.3
Rigid trucks: 2 axle: with trailer 11,327 1,726$ 1,748$ 22$ 1.3
Rigid trucks: 3 axle: no trailer GVM 4.5-18 1,795 880$ 891$ 11$ 1.3
Rigid trucks: 3 axle: no trailer GVM >18 55,774 1,047$ 1,061$ 14$ 1.3
Rigid trucks: 3 axle: with trailer >18 17,392 2,738$ 2,774$ 36$ 1.3
Rigid trucks: 4 axle: no trailer GVM 4.5-25 68 778$ 788$ 10$ 1.3
Rigid trucks: 4 axle: no trailer GVM >25 11,567 1,047$ 1,061$ 14$ 1.3
Rigid trucks: 4 axle: with trailer >25 1,766 3,592$ 3,638$ 46$ 1.3
Heavy Truck Trailers > 42.5 Tonnes 10,056 8,926$ 9,042$ 116$ 1.3
Articulated trucks: single trailer: 3 axle rig 686 1,757$ 1,780$ 23$ 1.3
Articulated trucks: single trailer: 4 axle rig 3,781 2,321$ 2,351$ 30$ 1.3
Articulated trucks: single 3 axle trailer: 5 axle rig 1,261 2,884$ 2,922$ 38$ 1.3
Articulated trucks: single 2 axle trailer: 5 axle rig 6,278 5,990$ 6,068$ 78$ 1.3
Articulated trucks: single trailer: 6 axle rig 40,572 6,554$ 6,639$ 85$ 1.3
Articulated trucks: B-double: <9 axle rig 3,275 13,537$ 13,713$ 176$ 1.3
Articulated trucks: B-double/triple: 9 axle rig & above 20,822 14,767$ 14,959$ 192$ 1.3
Articulated trucks: B-triple 668 18,150$ 18,385$ 235$ 1.3
Articulated trucks: Road train: 2 trailers 8,101 14,203$ 14,388$ 185$ 1.3
Articulated trucks: Road train: 3 trailers 3,441 17,022$ 17,243$ 221$ 1.3
Articulated trucks: > 6 axle rig (NEC) 1,732 6,847$ 6,936$ 89$ 1.3
Other trucks 25,708 1,122$ 1,137$ 15$ 1.3
Buses: 2 axle: GVM over 10.0 t 22,507 500$ 507$ 6$ 1.3
Buses: 3 axle 2,330 2,490$ 2,522$ 32$ 1.3
Buses: articulated 804 500$ 507$ 6$ 1.3
Charges Comparison Base Case (Annual Adjustment) v Current
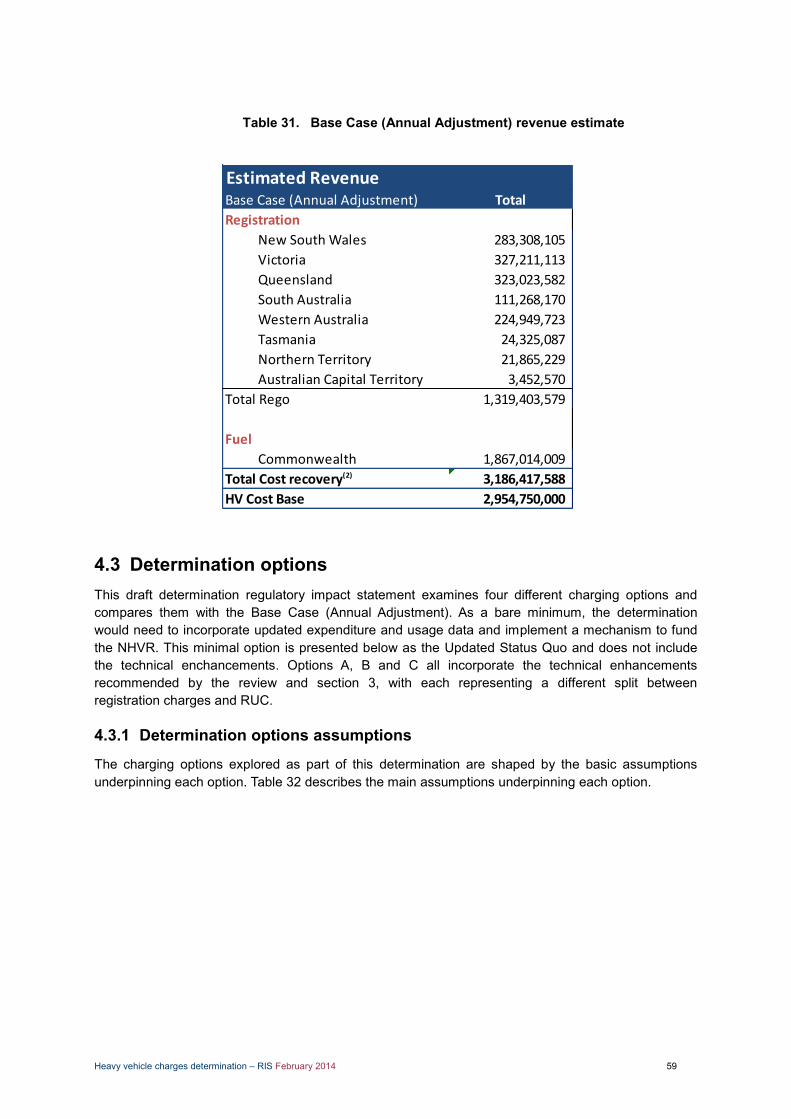
Heavy vehicle charges determination – RIS February 2014 59
Base Case (Annual Adjustment) revenue estimate Table 31.
4.3 Determination options This draft determination regulatory impact statement examines four different charging options and compares them with the Base Case (Annual Adjustment). As a bare minimum, the determination would need to incorporate updated expenditure and usage data and implement a mechanism to fund the NHVR. This minimal option is presented below as the Updated Status Quo and does not include the technical enchancements. Options A, B and C all incorporate the technical enhancements recommended by the review and section 3, with each representing a different split between registration charges and RUC.
4.3.1 Determination options assumptions
The charging options explored as part of this determination are shaped by the basic assumptions underpinning each option. Table 32 describes the main assumptions underpinning each option.
Estimated RevenueBase Case (Annual Adjustment) Total
Registration
New South Wales 283,308,105
Victoria 327,211,113
Queensland 323,023,582
South Australia 111,268,170
Western Australia 224,949,723
Tasmania 24,325,087
Northern Territory 21,865,229
Australian Capital Territory 3,452,570
Total Rego 1,319,403,579
Fuel
Commonwealth 1,867,014,009
Total Cost recovery(2) 3,186,417,588
HV Cost Base 2,954,750,000
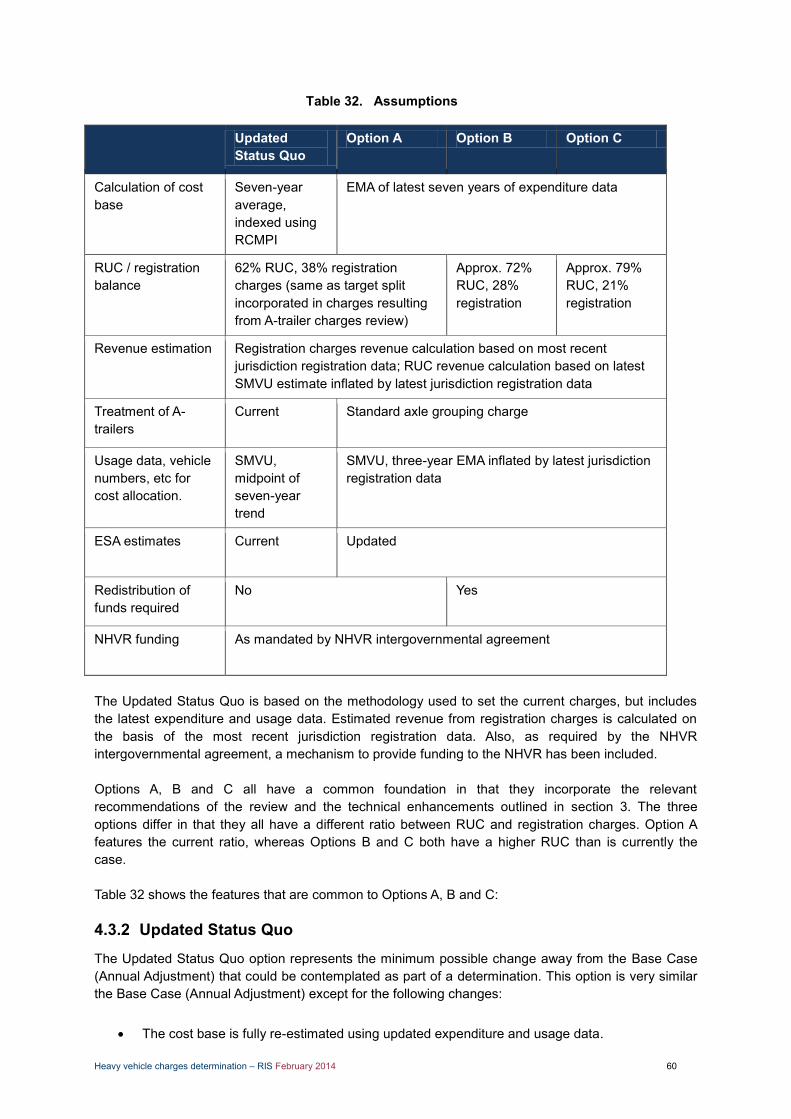
Heavy vehicle charges determination – RIS February 2014 60
Assumptions Table 32.
Updated Status Quo
Option A Option B Option C
Calculation of cost base
Seven-year average, indexed using RCMPI
EMA of latest seven years of expenditure data
RUC / registration balance
62% RUC, 38% registration charges (same as target split incorporated in charges resulting from A-trailer charges review)
Approx. 72% RUC, 28% registration
Approx. 79% RUC, 21% registration
Revenue estimation Registration charges revenue calculation based on most recent jurisdiction registration data; RUC revenue calculation based on latest SMVU estimate inflated by latest jurisdiction registration data
Treatment of A-trailers
Current Standard axle grouping charge
Usage data, vehicle numbers, etc for cost allocation.
SMVU, midpoint of seven-year trend
SMVU, three-year EMA inflated by latest jurisdiction registration data
ESA estimates Current Updated
Redistribution of funds required
No Yes
NHVR funding As mandated by NHVR intergovernmental agreement
The Updated Status Quo is based on the methodology used to set the current charges, but includes the latest expenditure and usage data. Estimated revenue from registration charges is calculated on the basis of the most recent jurisdiction registration data. Also, as required by the NHVR intergovernmental agreement, a mechanism to provide funding to the NHVR has been included. Options A, B and C all have a common foundation in that they incorporate the relevant recommendations of the review and the technical enhancements outlined in section 3. The three options differ in that they all have a different ratio between RUC and registration charges. Option A features the current ratio, whereas Options B and C both have a higher RUC than is currently the case. Table 32 shows the features that are common to Options A, B and C:
4.3.2 Updated Status Quo
The Updated Status Quo option represents the minimum possible change away from the Base Case (Annual Adjustment) that could be contemplated as part of a determination. This option is very similar the Base Case (Annual Adjustment) except for the following changes:
The cost base is fully re-estimated using updated expenditure and usage data.
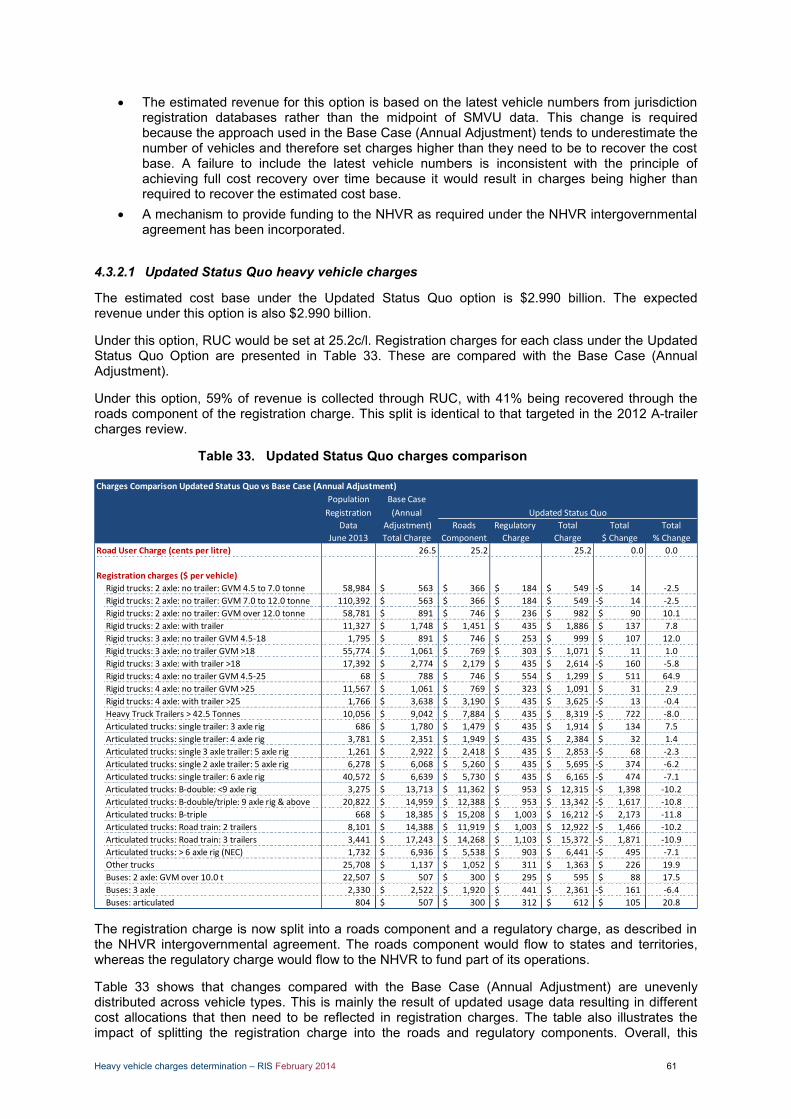
Heavy vehicle charges determination – RIS February 2014 61
The estimated revenue for this option is based on the latest vehicle numbers from jurisdiction registration databases rather than the midpoint of SMVU data. This change is required because the approach used in the Base Case (Annual Adjustment) tends to underestimate the number of vehicles and therefore set charges higher than they need to be to recover the cost base. A failure to include the latest vehicle numbers is inconsistent with the principle of achieving full cost recovery over time because it would result in charges being higher than required to recover the estimated cost base.
A mechanism to provide funding to the NHVR as required under the NHVR intergovernmental agreement has been incorporated.
4.3.2.1 Updated Status Quo heavy vehicle charges
The estimated cost base under the Updated Status Quo option is $2.990 billion. The expected revenue under this option is also $2.990 billion.
Under this option, RUC would be set at 25.2c/l. Registration charges for each class under the Updated Status Quo Option are presented in Table 33. These are compared with the Base Case (Annual Adjustment).
Under this option, 59% of revenue is collected through RUC, with 41% being recovered through the roads component of the registration charge. This split is identical to that targeted in the 2012 A-trailer charges review.
Updated Status Quo charges comparison Table 33.
The registration charge is now split into a roads component and a regulatory charge, as described in the NHVR intergovernmental agreement. The roads component would flow to states and territories, whereas the regulatory charge would flow to the NHVR to fund part of its operations.
Table 33 shows that changes compared with the Base Case (Annual Adjustment) are unevenly distributed across vehicle types. This is mainly the result of updated usage data resulting in different cost allocations that then need to be reflected in registration charges. The table also illustrates the impact of splitting the registration charge into the roads and regulatory components. Overall, this
Population Base Case
Registration (Annual
Data Adjustment) Roads Regulatory Total Total Total
June 2013 Total Charge Component Charge Charge $ Change % Change
Road User Charge (cents per litre) 26.5 25.2 25.2 0.0 0.0
Registration charges ($ per vehicle)
Rigid trucks: 2 axle: no trailer: GVM 4.5 to 7.0 tonne 58,984 563$ 366$ 184$ 549$ 14-$ -2.5
Rigid trucks: 2 axle: no trailer: GVM 7.0 to 12.0 tonne 110,392 563$ 366$ 184$ 549$ 14-$ -2.5
Rigid trucks: 2 axle: no trailer: GVM over 12.0 tonne 58,781 891$ 746$ 236$ 982$ 90$ 10.1
Rigid trucks: 2 axle: with trailer 11,327 1,748$ 1,451$ 435$ 1,886$ 137$ 7.8
Rigid trucks: 3 axle: no trailer GVM 4.5-18 1,795 891$ 746$ 253$ 999$ 107$ 12.0
Rigid trucks: 3 axle: no trailer GVM >18 55,774 1,061$ 769$ 303$ 1,071$ 11$ 1.0
Rigid trucks: 3 axle: with trailer >18 17,392 2,774$ 2,179$ 435$ 2,614$ 160-$ -5.8
Rigid trucks: 4 axle: no trailer GVM 4.5-25 68 788$ 746$ 554$ 1,299$ 511$ 64.9
Rigid trucks: 4 axle: no trailer GVM >25 11,567 1,061$ 769$ 323$ 1,091$ 31$ 2.9
Rigid trucks: 4 axle: with trailer >25 1,766 3,638$ 3,190$ 435$ 3,625$ 13-$ -0.4
Heavy Truck Trailers > 42.5 Tonnes 10,056 9,042$ 7,884$ 435$ 8,319$ 722-$ -8.0
Articulated trucks: single trailer: 3 axle rig 686 1,780$ 1,479$ 435$ 1,914$ 134$ 7.5
Articulated trucks: single trailer: 4 axle rig 3,781 2,351$ 1,949$ 435$ 2,384$ 32$ 1.4
Articulated trucks: single 3 axle trailer: 5 axle rig 1,261 2,922$ 2,418$ 435$ 2,853$ 68-$ -2.3
Articulated trucks: single 2 axle trailer: 5 axle rig 6,278 6,068$ 5,260$ 435$ 5,695$ 374-$ -6.2
Articulated trucks: single trailer: 6 axle rig 40,572 6,639$ 5,730$ 435$ 6,165$ 474-$ -7.1
Articulated trucks: B-double: <9 axle rig 3,275 13,713$ 11,362$ 953$ 12,315$ 1,398-$ -10.2
Articulated trucks: B-double/triple: 9 axle rig & above 20,822 14,959$ 12,388$ 953$ 13,342$ 1,617-$ -10.8
Articulated trucks: B-triple 668 18,385$ 15,208$ 1,003$ 16,212$ 2,173-$ -11.8
Articulated trucks: Road train: 2 trailers 8,101 14,388$ 11,919$ 1,003$ 12,922$ 1,466-$ -10.2
Articulated trucks: Road train: 3 trailers 3,441 17,243$ 14,268$ 1,103$ 15,372$ 1,871-$ -10.9
Articulated trucks: > 6 axle rig (NEC) 1,732 6,936$ 5,538$ 903$ 6,441$ 495-$ -7.1
Other trucks 25,708 1,137$ 1,052$ 311$ 1,363$ 226$ 19.9
Buses: 2 axle: GVM over 10.0 t 22,507 507$ 300$ 295$ 595$ 88$ 17.5
Buses: 3 axle 2,330 2,522$ 1,920$ 441$ 2,361$ 161-$ -6.4
Buses: articulated 804 507$ 300$ 312$ 612$ 105$ 20.8
Updated Status Quo
Charges Comparison Updated Status Quo vs Base Case (Annual Adjustment)
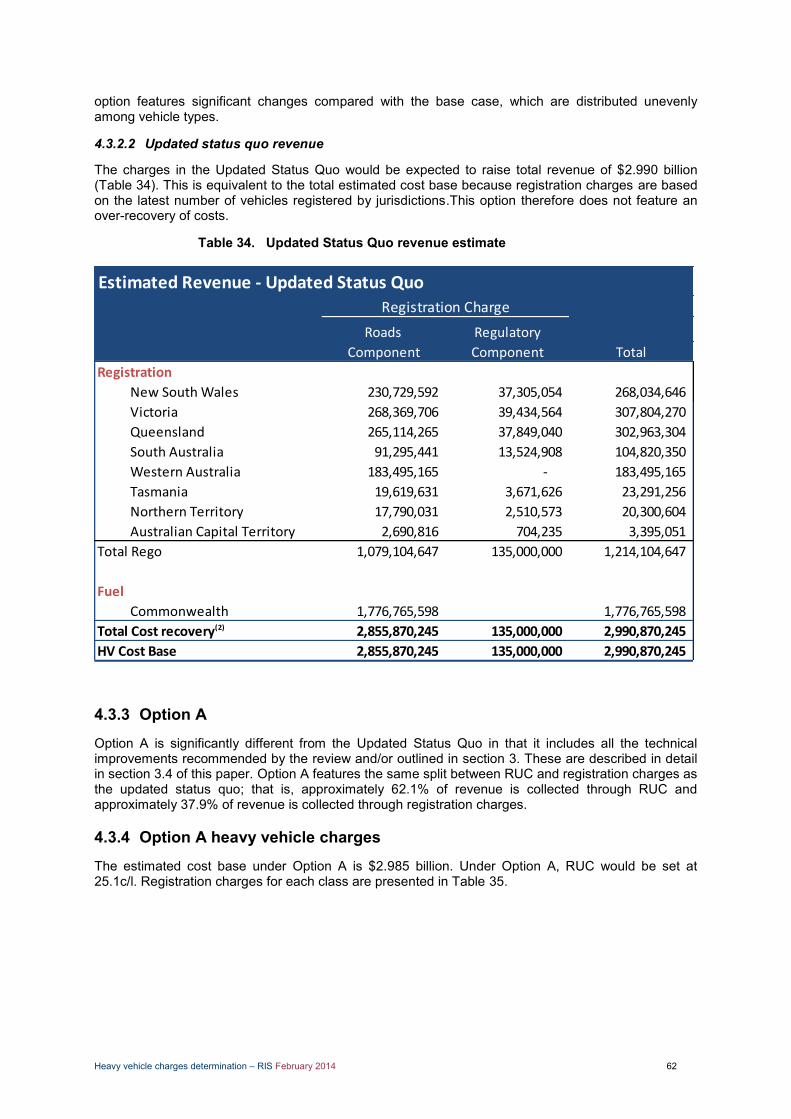
Heavy vehicle charges determination – RIS February 2014 62
option features significant changes compared with the base case, which are distributed unevenly among vehicle types.
4.3.2.2 Updated status quo revenue
The charges in the Updated Status Quo would be expected to raise total revenue of $2.990 billion (Table 34). This is equivalent to the total estimated cost base because registration charges are based on the latest number of vehicles registered by jurisdictions.This option therefore does not feature an over-recovery of costs.
Updated Status Quo revenue estimate Table 34.
4.3.3 Option A
Option A is significantly different from the Updated Status Quo in that it includes all the technical improvements recommended by the review and/or outlined in section 3. These are described in detail in section 3.4 of this paper. Option A features the same split between RUC and registration charges as the updated status quo; that is, approximately 62.1% of revenue is collected through RUC and approximately 37.9% of revenue is collected through registration charges.
4.3.4 Option A heavy vehicle charges
The estimated cost base under Option A is $2.985 billion. Under Option A, RUC would be set at 25.1c/l. Registration charges for each class are presented in Table 35.
Estimated Revenue - Updated Status Quo
Roads Regulatory
Component Component Total
Registration
New South Wales 230,729,592 37,305,054 268,034,646
Victoria 268,369,706 39,434,564 307,804,270
Queensland 265,114,265 37,849,040 302,963,304
South Australia 91,295,441 13,524,908 104,820,350
Western Australia 183,495,165 - 183,495,165
Tasmania 19,619,631 3,671,626 23,291,256
Northern Territory 17,790,031 2,510,573 20,300,604
Australian Capital Territory 2,690,816 704,235 3,395,051
Total Rego 1,079,104,647 135,000,000 1,214,104,647
Fuel
Commonwealth 1,776,765,598 1,776,765,598
Total Cost recovery(2) 2,855,870,245 135,000,000 2,990,870,245
HV Cost Base 2,855,870,245 135,000,000 2,990,870,245
Registration Charge
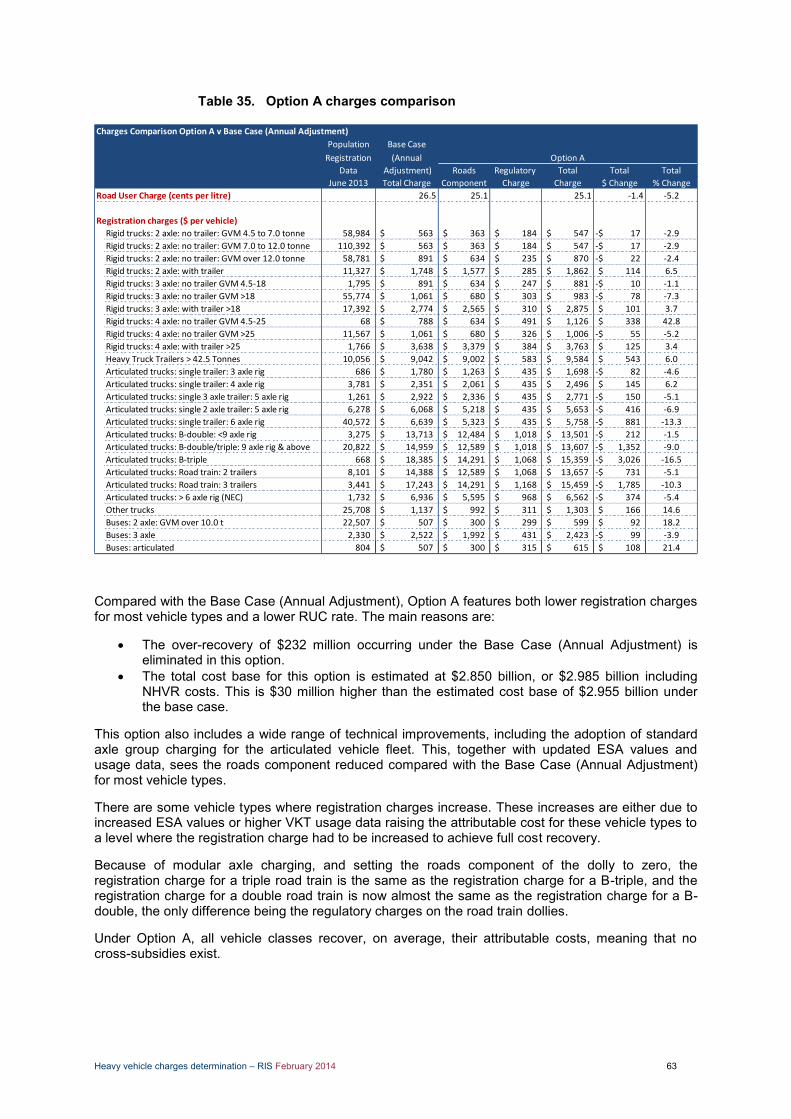
Heavy vehicle charges determination – RIS February 2014 63
Option A charges comparison Table 35.
Compared with the Base Case (Annual Adjustment), Option A features both lower registration charges for most vehicle types and a lower RUC rate. The main reasons are:
The over-recovery of $232 million occurring under the Base Case (Annual Adjustment) is eliminated in this option.
The total cost base for this option is estimated at $2.850 billion, or $2.985 billion including NHVR costs. This is $30 million higher than the estimated cost base of $2.955 billion under the base case.
This option also includes a wide range of technical improvements, including the adoption of standard axle group charging for the articulated vehicle fleet. This, together with updated ESA values and usage data, sees the roads component reduced compared with the Base Case (Annual Adjustment) for most vehicle types.
There are some vehicle types where registration charges increase. These increases are either due to increased ESA values or higher VKT usage data raising the attributable cost for these vehicle types to a level where the registration charge had to be increased to achieve full cost recovery.
Because of modular axle charging, and setting the roads component of the dolly to zero, the registration charge for a triple road train is the same as the registration charge for a B-triple, and the registration charge for a double road train is now almost the same as the registration charge for a B-double, the only difference being the regulatory charges on the road train dollies.
Under Option A, all vehicle classes recover, on average, their attributable costs, meaning that no cross-subsidies exist.
Population Base Case
Registration (Annual
Data Adjustment) Roads Regulatory Total Total Total
June 2013 Total Charge Component Charge Charge $ Change % Change
Road User Charge (cents per litre) 26.5 25.1 25.1 -1.4 -5.2
Registration charges ($ per vehicle)
Rigid trucks: 2 axle: no trailer: GVM 4.5 to 7.0 tonne 58,984 563$ 363$ 184$ 547$ 17-$ -2.9
Rigid trucks: 2 axle: no trailer: GVM 7.0 to 12.0 tonne 110,392 563$ 363$ 184$ 547$ 17-$ -2.9
Rigid trucks: 2 axle: no trailer: GVM over 12.0 tonne 58,781 891$ 634$ 235$ 870$ 22-$ -2.4
Rigid trucks: 2 axle: with trailer 11,327 1,748$ 1,577$ 285$ 1,862$ 114$ 6.5
Rigid trucks: 3 axle: no trailer GVM 4.5-18 1,795 891$ 634$ 247$ 881$ 10-$ -1.1
Rigid trucks: 3 axle: no trailer GVM >18 55,774 1,061$ 680$ 303$ 983$ 78-$ -7.3
Rigid trucks: 3 axle: with trailer >18 17,392 2,774$ 2,565$ 310$ 2,875$ 101$ 3.7
Rigid trucks: 4 axle: no trailer GVM 4.5-25 68 788$ 634$ 491$ 1,126$ 338$ 42.8
Rigid trucks: 4 axle: no trailer GVM >25 11,567 1,061$ 680$ 326$ 1,006$ 55-$ -5.2
Rigid trucks: 4 axle: with trailer >25 1,766 3,638$ 3,379$ 384$ 3,763$ 125$ 3.4
Heavy Truck Trailers > 42.5 Tonnes 10,056 9,042$ 9,002$ 583$ 9,584$ 543$ 6.0
Articulated trucks: single trailer: 3 axle rig 686 1,780$ 1,263$ 435$ 1,698$ 82-$ -4.6
Articulated trucks: single trailer: 4 axle rig 3,781 2,351$ 2,061$ 435$ 2,496$ 145$ 6.2
Articulated trucks: single 3 axle trailer: 5 axle rig 1,261 2,922$ 2,336$ 435$ 2,771$ 150-$ -5.1
Articulated trucks: single 2 axle trailer: 5 axle rig 6,278 6,068$ 5,218$ 435$ 5,653$ 416-$ -6.9
Articulated trucks: single trailer: 6 axle rig 40,572 6,639$ 5,323$ 435$ 5,758$ 881-$ -13.3
Articulated trucks: B-double: <9 axle rig 3,275 13,713$ 12,484$ 1,018$ 13,501$ 212-$ -1.5
Articulated trucks: B-double/triple: 9 axle rig & above 20,822 14,959$ 12,589$ 1,018$ 13,607$ 1,352-$ -9.0
Articulated trucks: B-triple 668 18,385$ 14,291$ 1,068$ 15,359$ 3,026-$ -16.5
Articulated trucks: Road train: 2 trailers 8,101 14,388$ 12,589$ 1,068$ 13,657$ 731-$ -5.1
Articulated trucks: Road train: 3 trailers 3,441 17,243$ 14,291$ 1,168$ 15,459$ 1,785-$ -10.3
Articulated trucks: > 6 axle rig (NEC) 1,732 6,936$ 5,595$ 968$ 6,562$ 374-$ -5.4
Other trucks 25,708 1,137$ 992$ 311$ 1,303$ 166$ 14.6
Buses: 2 axle: GVM over 10.0 t 22,507 507$ 300$ 299$ 599$ 92$ 18.2
Buses: 3 axle 2,330 2,522$ 1,992$ 431$ 2,423$ 99-$ -3.9
Buses: articulated 804 507$ 300$ 315$ 615$ 108$ 21.4
Option A
Charges Comparison Option A v Base Case (Annual Adjustment)

Heavy vehicle charges determination – RIS February 2014 64
4.3.4.1 Option A revenue
The charges under Option A would be expected to raise a total of $2.985 billion in revenue (Table 36). Similar to the updated status quo, this option uses up-to-date vehicle numbers to estimate revenue, resulting in lower charges than the base case. Using an up to date vehicle number estimate (including nil use vehicles) has the effect of spreading the cost base over a greater number of vehicles, and thus leading to lower charges than the Base Case (Annual Adjustment) which assumes a smaller vehicle population.
Option A revenue estimate Table 36.
4.3.5 Option B
Option B is essentially the same as Option A, with the exception that a higher proportion of the cost base is recovered through RUC. This reflects the review recommendation to investigate options for moving to a charging structure that relies more heavily on variable charges.
Option B represents a moderate shift towards a higher RUC. This option has been designed to set the relative revenue shares collected through RUC and registration charges as close as possible to the efficient level (as described in section 4.4).
4.3.5.1 Option B heavy vehicle charges
The estimated cost base for Option B is the same as Option A at $2.850 billion, or $2.985 billion including NHVR costs. However, under this option, the RUC rate is increased to be able to reduce registration charges. RUC would now be set at 29c/l. As a result, approximately 71.7% of revenue would now be collected through RUC, with the remaining 28.3% collected through registration charges. The registration charges that would apply under Option B are outlined in Table 37.
Estimated Revenue - Option A
Roads Regulatory
Component Component Total
Registration
New South Wales 231,722,733 37,336,726 269,059,459
Victoria 267,107,643 39,492,299 306,599,942
Queensland 266,195,305 38,086,452 304,281,757
South Australia 91,422,368 13,223,704 104,646,073
Western Australia 183,912,785 - 183,912,785
Tasmania 19,526,094 3,635,435 23,161,529
Northern Territory 17,944,571 2,520,765 20,465,336
Australian Capital Territory 2,658,955 704,618 3,363,573
Total Rego 1,080,490,454 135,000,000 1,215,490,454
Fuel
Commonwealth 1,769,714,941 Not Applicable 1,769,714,941
Total Cost recovery(2) 2,850,205,395 135,000,000 2,985,205,395
HV Cost Base 2,850,205,395 135,000,000 2,985,205,395
Registration Charge

Heavy vehicle charges determination – RIS February 2014 65
Option B charges comparison Table 37.
The additional revenue provided by the higher RUC is used to reduce the roads component of the registration charges. However, the reductions are minimal at the smaller end of the fleet. This is due to the need to ensure the lowest heavy vehicle registration charges do not fall below registration charges for light vehicles. The reduction in registration charges enabled by the increase in RUC is greatest for larger vehicle classes.
Under Option B, all vehicle classes recover, on average, their attributable costs, except heavy truck trailers above 45 tonnes ($971 below, on average) and triple road trains ($564.4 below). This means that a small degree of cross-subsidy may exist. However, it is important to note that the calculations of attributable costs presented in Appendix G are based on survey-based estimates of usage data from the SMVU. The NTC considers that minor, unavoidable under-recoveries of attributable costs are extremely difficult to avoid given the limitations of the current charging system. Therefore, they should not be viewed in absolute terms.
The schedule of charges representing these charges is presented in Appendix F.
4.3.5.2 Option B revenue
Table 38 shows that the charges under Option B recover the same total revenue as Option A. However, a significantly higher amount is now recovered through RUC, reducing registration revenue to states and territories.
Population Base Case
Registration (Annual
Data Adjustment) Roads Regulatory Total Total Total
June 2013 Total Charge Component Charge Charge $ Change % Change
Road User Charge (cents per litre) 26.5 29.0 29.0 2.5 9.5
Registration charges ($ per vehicle)
Rigid trucks: 2 axle: no trailer: GVM 4.5 to 7.0 tonne 58,984 563$ 300$ 184$ 484$ 79-$ -14.1
Rigid trucks: 2 axle: no trailer: GVM 7.0 to 12.0 tonne 110,392 563$ 300$ 184$ 484$ 79-$ -14.1
Rigid trucks: 2 axle: no trailer: GVM over 12.0 tonne 58,781 891$ 468$ 235$ 704$ 188-$ -21.0
Rigid trucks: 2 axle: with trailer 11,327 1,748$ 1,163$ 285$ 1,448$ 300-$ -17.2
Rigid trucks: 3 axle: no trailer GVM 4.5-18 1,795 891$ 468$ 247$ 715$ 176-$ -19.7
Rigid trucks: 3 axle: no trailer GVM >18 55,774 1,061$ 502$ 303$ 805$ 255-$ -24.1
Rigid trucks: 3 axle: with trailer >18 17,392 2,774$ 1,892$ 310$ 2,202$ 572-$ -20.6
Rigid trucks: 4 axle: no trailer GVM 4.5-25 68 788$ 468$ 491$ 960$ 172$ 21.8
Rigid trucks: 4 axle: no trailer GVM >25 11,567 1,061$ 502$ 326$ 828$ 233-$ -21.9
Rigid trucks: 4 axle: with trailer >25 1,766 3,638$ 2,492$ 384$ 2,877$ 762-$ -20.9
Heavy Truck Trailers > 42.5 Tonnes 10,056 9,042$ 6,638$ 583$ 7,220$ 1,821-$ -20.1
Articulated trucks: single trailer: 3 axle rig 686 1,780$ 932$ 435$ 1,367$ 413-$ -23.2
Articulated trucks: single trailer: 4 axle rig 3,781 2,351$ 1,520$ 435$ 1,955$ 396-$ -16.8
Articulated trucks: single 3 axle trailer: 5 axle rig 1,261 2,922$ 1,723$ 435$ 2,158$ 763-$ -26.1
Articulated trucks: single 2 axle trailer: 5 axle rig 6,278 6,068$ 3,848$ 435$ 4,283$ 1,786-$ -29.4
Articulated trucks: single trailer: 6 axle rig 40,572 6,639$ 3,926$ 435$ 4,361$ 2,278-$ -34.3
Articulated trucks: B-double: <9 axle rig 3,275 13,713$ 9,205$ 1,018$ 10,223$ 3,490-$ -25.5
Articulated trucks: B-double/triple: 9 axle rig & above 20,822 14,959$ 9,283$ 1,018$ 10,300$ 4,658-$ -31.1
Articulated trucks: B-triple 668 18,385$ 10,538$ 1,068$ 11,605$ 6,780-$ -36.9
Articulated trucks: Road train: 2 trailers 8,101 14,388$ 9,283$ 1,068$ 10,350$ 4,037-$ -28.1
Articulated trucks: Road train: 3 trailers 3,441 17,243$ 10,538$ 1,168$ 11,705$ 5,538-$ -32.1
Articulated trucks: > 6 axle rig (NEC) 1,732 6,936$ 4,126$ 968$ 5,093$ 1,842-$ -26.6
Other trucks 25,708 1,137$ 732$ 311$ 1,043$ 94-$ -8.3
Buses: 2 axle: GVM over 10.0 t 22,507 507$ 300$ 299$ 599$ 92$ 18.2
Buses: 3 axle 2,330 2,522$ 1,469$ 431$ 1,900$ 622-$ -24.7
Buses: articulated 804 507$ 300$ 315$ 615$ 108$ 21.4
Option B
Charges Comparison Option B v Base Case (Annual Adjustment)

Heavy vehicle charges determination – RIS February 2014 66
Option B revenue estimate Table 38.
NTC considers that this option would need to be implemented together with an intergovernmental agreement to redistribute the additional revenue provided by the higher RUC to states and territories to compensate them for the reduced registration revenue. It is envisaged that this redistribution mechanism would be designed to be fiscally neutral to all parties.
4.3.6 Option C
The estimated cost base for Option C is the same for the other options. Option C builds on Option B but involves the maximum possible increase in RUC, which is compatible with being able to accommodate likely future annual adjustments for approximately five years before reaching the ceiling imposed by the current fuel excise rate of 38.1c/l.
Under Option C the RUC would be set at 32.0c/l, leaving 6.1c/l for future adjustments. Approximately 79.2% of revenue is collected through RUC, with the remaining 20.8% collected through registration charges.
4.3.6.1 Option C heavy vehicle charges
The estimated cost base for Option C is the same as Option A and Option B at $2.850 billion, or $2.985 billion including NHVR costs. However, under this option, the RUC rate is further increased, and registration charges are reduced. RUC would now be set at 32c/l. The registration charges that would apply under Option B are outlined in Table 39.
Estimated Revenue - Option B
Roads Regulatory
Component Component Total
Registration
New South Wales 173,356,900 37,336,726 210,693,626
Victoria 198,938,100 39,492,299 238,430,399
Queensland 198,057,650 38,086,452 236,144,102
South Australia 68,053,482 13,223,704 81,277,186
Western Australia 137,032,735 - 137,032,735
Tasmania 14,657,171 3,635,435 18,292,606
Northern Territory 13,379,277 2,520,765 15,900,042
Australian Capital Territory 2,039,510 704,618 2,744,128
Total Rego 805,514,826 135,000,000 940,514,826
Fuel
Commonwealth 2,044,690,569 Not Applicable 2,044,690,569
Total Cost recovery(2) 2,850,205,395 135,000,000 2,985,205,395
HV Cost Base 2,850,205,395 135,000,000 2,985,205,395
Registration Charge
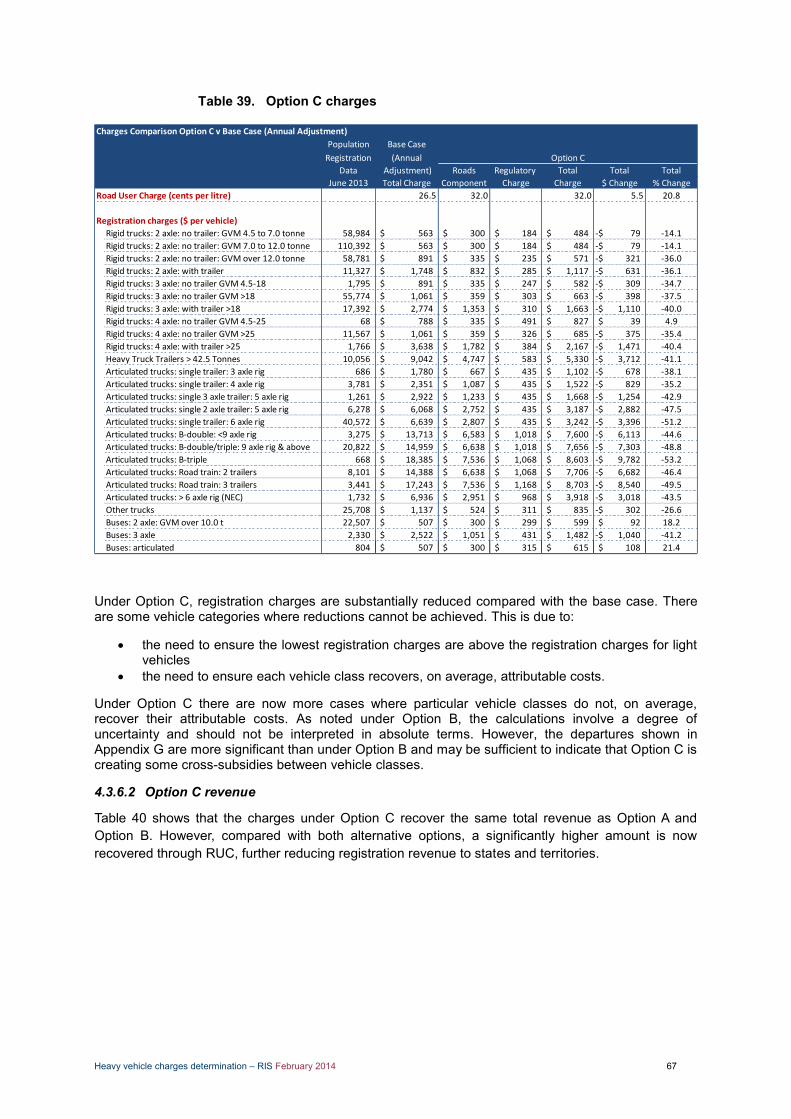
Heavy vehicle charges determination – RIS February 2014 67
Option C charges Table 39.
Under Option C, registration charges are substantially reduced compared with the base case. There are some vehicle categories where reductions cannot be achieved. This is due to:
the need to ensure the lowest registration charges are above the registration charges for light vehicles
the need to ensure each vehicle class recovers, on average, attributable costs.
Under Option C there are now more cases where particular vehicle classes do not, on average, recover their attributable costs. As noted under Option B, the calculations involve a degree of uncertainty and should not be interpreted in absolute terms. However, the departures shown in Appendix G are more significant than under Option B and may be sufficient to indicate that Option C is creating some cross-subsidies between vehicle classes.
4.3.6.2 Option C revenue
Table 40 shows that the charges under Option C recover the same total revenue as Option A and Option B. However, compared with both alternative options, a significantly higher amount is now recovered through RUC, further reducing registration revenue to states and territories.
Population Base Case
Registration (Annual
Data Adjustment) Roads Regulatory Total Total Total
June 2013 Total Charge Component Charge Charge $ Change % Change
Road User Charge (cents per litre) 26.5 32.0 32.0 5.5 20.8
Registration charges ($ per vehicle)
Rigid trucks: 2 axle: no trailer: GVM 4.5 to 7.0 tonne 58,984 563$ 300$ 184$ 484$ 79-$ -14.1
Rigid trucks: 2 axle: no trailer: GVM 7.0 to 12.0 tonne 110,392 563$ 300$ 184$ 484$ 79-$ -14.1
Rigid trucks: 2 axle: no trailer: GVM over 12.0 tonne 58,781 891$ 335$ 235$ 571$ 321-$ -36.0
Rigid trucks: 2 axle: with trailer 11,327 1,748$ 832$ 285$ 1,117$ 631-$ -36.1
Rigid trucks: 3 axle: no trailer GVM 4.5-18 1,795 891$ 335$ 247$ 582$ 309-$ -34.7
Rigid trucks: 3 axle: no trailer GVM >18 55,774 1,061$ 359$ 303$ 663$ 398-$ -37.5
Rigid trucks: 3 axle: with trailer >18 17,392 2,774$ 1,353$ 310$ 1,663$ 1,110-$ -40.0
Rigid trucks: 4 axle: no trailer GVM 4.5-25 68 788$ 335$ 491$ 827$ 39$ 4.9
Rigid trucks: 4 axle: no trailer GVM >25 11,567 1,061$ 359$ 326$ 685$ 375-$ -35.4
Rigid trucks: 4 axle: with trailer >25 1,766 3,638$ 1,782$ 384$ 2,167$ 1,471-$ -40.4
Heavy Truck Trailers > 42.5 Tonnes 10,056 9,042$ 4,747$ 583$ 5,330$ 3,712-$ -41.1
Articulated trucks: single trailer: 3 axle rig 686 1,780$ 667$ 435$ 1,102$ 678-$ -38.1
Articulated trucks: single trailer: 4 axle rig 3,781 2,351$ 1,087$ 435$ 1,522$ 829-$ -35.2
Articulated trucks: single 3 axle trailer: 5 axle rig 1,261 2,922$ 1,233$ 435$ 1,668$ 1,254-$ -42.9
Articulated trucks: single 2 axle trailer: 5 axle rig 6,278 6,068$ 2,752$ 435$ 3,187$ 2,882-$ -47.5
Articulated trucks: single trailer: 6 axle rig 40,572 6,639$ 2,807$ 435$ 3,242$ 3,396-$ -51.2
Articulated trucks: B-double: <9 axle rig 3,275 13,713$ 6,583$ 1,018$ 7,600$ 6,113-$ -44.6
Articulated trucks: B-double/triple: 9 axle rig & above 20,822 14,959$ 6,638$ 1,018$ 7,656$ 7,303-$ -48.8
Articulated trucks: B-triple 668 18,385$ 7,536$ 1,068$ 8,603$ 9,782-$ -53.2
Articulated trucks: Road train: 2 trailers 8,101 14,388$ 6,638$ 1,068$ 7,706$ 6,682-$ -46.4
Articulated trucks: Road train: 3 trailers 3,441 17,243$ 7,536$ 1,168$ 8,703$ 8,540-$ -49.5
Articulated trucks: > 6 axle rig (NEC) 1,732 6,936$ 2,951$ 968$ 3,918$ 3,018-$ -43.5
Other trucks 25,708 1,137$ 524$ 311$ 835$ 302-$ -26.6
Buses: 2 axle: GVM over 10.0 t 22,507 507$ 300$ 299$ 599$ 92$ 18.2
Buses: 3 axle 2,330 2,522$ 1,051$ 431$ 1,482$ 1,040-$ -41.2
Buses: articulated 804 507$ 300$ 315$ 615$ 108$ 21.4
Option C
Charges Comparison Option C v Base Case (Annual Adjustment)
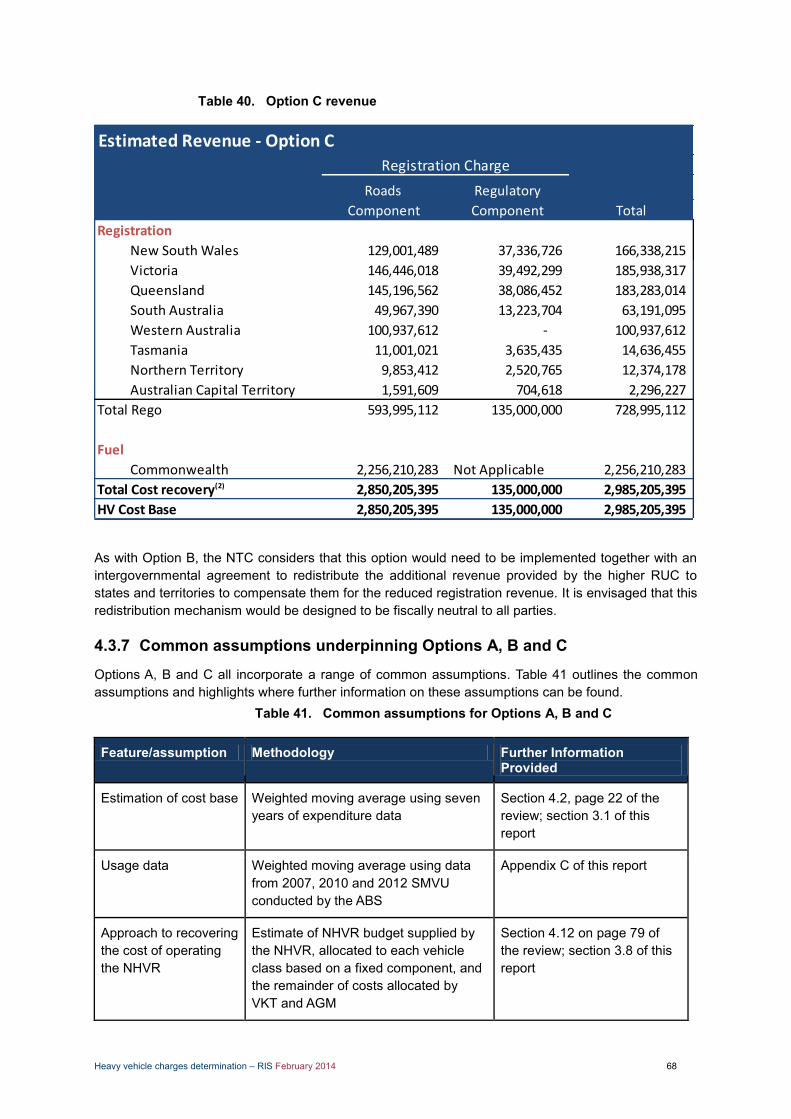
Heavy vehicle charges determination – RIS February 2014 68
Option C revenue Table 40.
As with Option B, the NTC considers that this option would need to be implemented together with an intergovernmental agreement to redistribute the additional revenue provided by the higher RUC to states and territories to compensate them for the reduced registration revenue. It is envisaged that this redistribution mechanism would be designed to be fiscally neutral to all parties.
4.3.7 Common assumptions underpinning Options A, B and C
Options A, B and C all incorporate a range of common assumptions. Table 41 outlines the common assumptions and highlights where further information on these assumptions can be found.
Common assumptions for Options A, B and C Table 41.
Feature/assumption Methodology Further Information Provided
Estimation of cost base Weighted moving average using seven years of expenditure data
Section 4.2, page 22 of the review; section 3.1 of this report
Usage data Weighted moving average using data from 2007, 2010 and 2012 SMVU conducted by the ABS
Appendix C of this report
Approach to recovering the cost of operating the NHVR
Estimate of NHVR budget supplied by the NHVR, allocated to each vehicle class based on a fixed component, and the remainder of costs allocated by VKT and AGM
Section 4.12 on page 79 of the review; section 3.8 of this report
Estimated Revenue - Option C
Roads Regulatory
Component Component Total
Registration
New South Wales 129,001,489 37,336,726 166,338,215
Victoria 146,446,018 39,492,299 185,938,317
Queensland 145,196,562 38,086,452 183,283,014
South Australia 49,967,390 13,223,704 63,191,095
Western Australia 100,937,612 - 100,937,612
Tasmania 11,001,021 3,635,435 14,636,455
Northern Territory 9,853,412 2,520,765 12,374,178
Australian Capital Territory 1,591,609 704,618 2,296,227
Total Rego 593,995,112 135,000,000 728,995,112
Fuel
Commonwealth 2,256,210,283 Not Applicable 2,256,210,283
Total Cost recovery(2) 2,850,205,395 135,000,000 2,985,205,395
HV Cost Base 2,850,205,395 135,000,000 2,985,205,395
Registration Charge

Heavy vehicle charges determination – RIS February 2014 69
Approach to setting registration charges for trailers in the articulated heavy vehicle fleet
Modular approach, standard axle grouping charges
Section 4.7 on page 53 of the review; section 3.4 of this report
Concession for road trains
100% discount on roads component of yearly registration charge for dollies
Section 4.11 on page 77 of the review; section 3.7 of this report
Minimum yearly registration charge
Minimum yearly registration charge set at the level applicable to light vehicles
Allocation of costs to vehicle categories
Using existing cost allocation matrix Section 4.6 on page 47 of the review
ESAs Modular ESAs developed by the NTC on the basis of ARRB research report for all categories except buses Bus ESAs as per estimates provided by PTT
Section 3.5 of this report; report from ARRB on truck ESAs and report from PTT on bus ESAs
Approach to prime mover charges
One common charge for all single combination prime movers One common charge for multi-combination prime movers
As per current methodology
In setting registration charges under all three options the NTC has adopted the principle of seeking to preserve the relativities between vehicle classes as much as possible and to avoid significant changes wherever possible. The rationale behind this approach is to minimise the potential for operators of particular heavy vehicle classes to experience significant fluctuations in charges.
4.4 What level to set the RUC?
The decision on which charging option to recommend ultimately comes down to which level of RUC is believed to be the most appropriate. In making this assessment, it is useful to consider the following questions.
4.4.1 What is the theoretically most efficient level to set RUC?
There is a considerable body of economic literature that agree fixed and variable charges are most efficient when they reflect the underlying split between fixed and variable costs; that is, fixed costs should be recovered via fixed charges, and variable costs recovered by variable charges. Failure to meet this charging principle will lead to a cross-subsidisation between users. The matrix shown in Table 42 demonstrates how ‘below average’ and ‘above average’ users would be affected by ‘variablising’ fixed costs or ‘fixing’ variable costs.
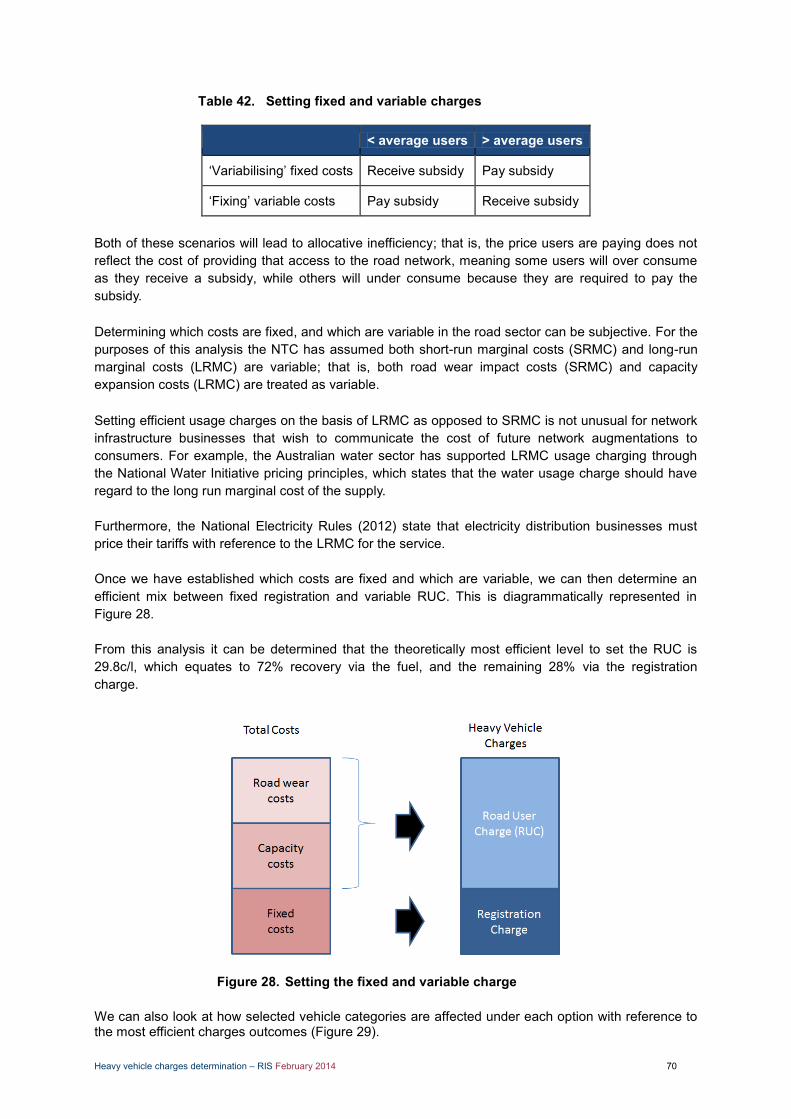
Heavy vehicle charges determination – RIS February 2014 70
Setting fixed and variable charges Table 42.
< average users > average users
‘Variabilising’ fixed costs Receive subsidy Pay subsidy
‘Fixing’ variable costs Pay subsidy Receive subsidy
Both of these scenarios will lead to allocative inefficiency; that is, the price users are paying does not reflect the cost of providing that access to the road network, meaning some users will over consume as they receive a subsidy, while others will under consume because they are required to pay the subsidy. Determining which costs are fixed, and which are variable in the road sector can be subjective. For the purposes of this analysis the NTC has assumed both short-run marginal costs (SRMC) and long-run marginal costs (LRMC) are variable; that is, both road wear impact costs (SRMC) and capacity expansion costs (LRMC) are treated as variable. Setting efficient usage charges on the basis of LRMC as opposed to SRMC is not unusual for network infrastructure businesses that wish to communicate the cost of future network augmentations to consumers. For example, the Australian water sector has supported LRMC usage charging through the National Water Initiative pricing principles, which states that the water usage charge should have regard to the long run marginal cost of the supply. Furthermore, the National Electricity Rules (2012) state that electricity distribution businesses must price their tariffs with reference to the LRMC for the service. Once we have established which costs are fixed and which are variable, we can then determine an efficient mix between fixed registration and variable RUC. This is diagrammatically represented in Figure 28. From this analysis it can be determined that the theoretically most efficient level to set the RUC is 29.8c/l, which equates to 72% recovery via the fuel, and the remaining 28% via the registration charge.
Figure 28. Setting the fixed and variable charge We can also look at how selected vehicle categories are affected under each option with reference to the most efficient charges outcomes (Figure 29).

Heavy vehicle charges determination – RIS February 2014 71
Figure 29. Distributional efficiency impact on different vehicle type
4.4.2 What are the practical considerations in setting the RUC?
Any RUC rate recommended by the NTC must leave sufficient headroom for future annual adjustments; that is, it would be prudent to assume that this determination may have to last approximately five years until an alternative charging system is implemented as part of HVCI or another future charging determination process. Figure 30 looks at the trade-off between a higher RUC and the length of time available before the RUC nears the current excise cap of 38.1c/l. For the purposes of the analysis varying scenarios are presented with respect to a carbon price: no carbon price, 2c/l and 4c/l. The analysis also assumes a constant 2.5% annual adjustment each year. The assumed 2.5% increase is considerably less than we have seen in recent years; however, expenditure has moderated in the last two years, which should result in smaller annual increases going forward.
-
5,000.00
10,000.00
15,000.00
20,000.00
25,000.00
30,000.00
35,000.00
40,000.00
45,000.00
50,000.00
2 axlerigid: 4.5
to 7tonnes
3 axlerigid: >18tonne: no
trailer
HeavyTruck
Trailers >42.5
Tonnes
Artic: 6axle
B-Bouble -9 axle
DoubleRoad train
Tripleroad train
Tota
l ch
arge
s p
aid
A
B
C
Eff RUC
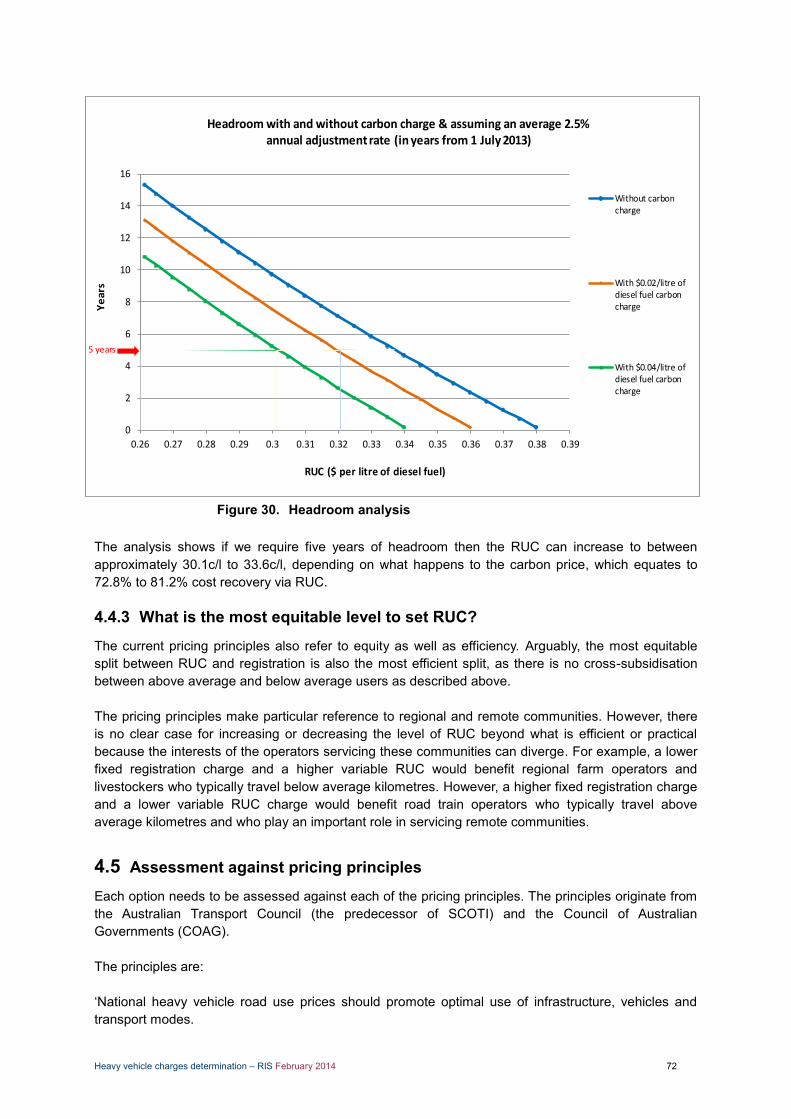
Heavy vehicle charges determination – RIS February 2014 72
Figure 30. Headroom analysis The analysis shows if we require five years of headroom then the RUC can increase to between approximately 30.1c/l to 33.6c/l, depending on what happens to the carbon price, which equates to 72.8% to 81.2% cost recovery via RUC.
4.4.3 What is the most equitable level to set RUC?
The current pricing principles also refer to equity as well as efficiency. Arguably, the most equitable split between RUC and registration is also the most efficient split, as there is no cross-subsidisation between above average and below average users as described above. The pricing principles make particular reference to regional and remote communities. However, there is no clear case for increasing or decreasing the level of RUC beyond what is efficient or practical because the interests of the operators servicing these communities can diverge. For example, a lower fixed registration charge and a higher variable RUC would benefit regional farm operators and livestockers who typically travel below average kilometres. However, a higher fixed registration charge and a lower variable RUC charge would benefit road train operators who typically travel above average kilometres and who play an important role in servicing remote communities.
4.5 Assessment against pricing principles Each option needs to be assessed against each of the pricing principles. The principles originate from the Australian Transport Council (the predecessor of SCOTI) and the Council of Australian Governments (COAG). The principles are: ‘National heavy vehicle road use prices should promote optimal use of infrastructure, vehicles and transport modes.
0
2
4
6
8
10
12
14
16
0.26 0.27 0.28 0.29 0.3 0.31 0.32 0.33 0.34 0.35 0.36 0.37 0.38 0.39
Ye
ars
RUC ($ per litre of diesel fuel)
Headroom with and without carbon charge & assuming an average 2.5% annual adjustment rate (in years from 1 July 2013)
Without carboncharge
With $0.02/litre ofdiesel fuel carboncharge
With $0.04/litre ofdiesel fuel carboncharge
5 years
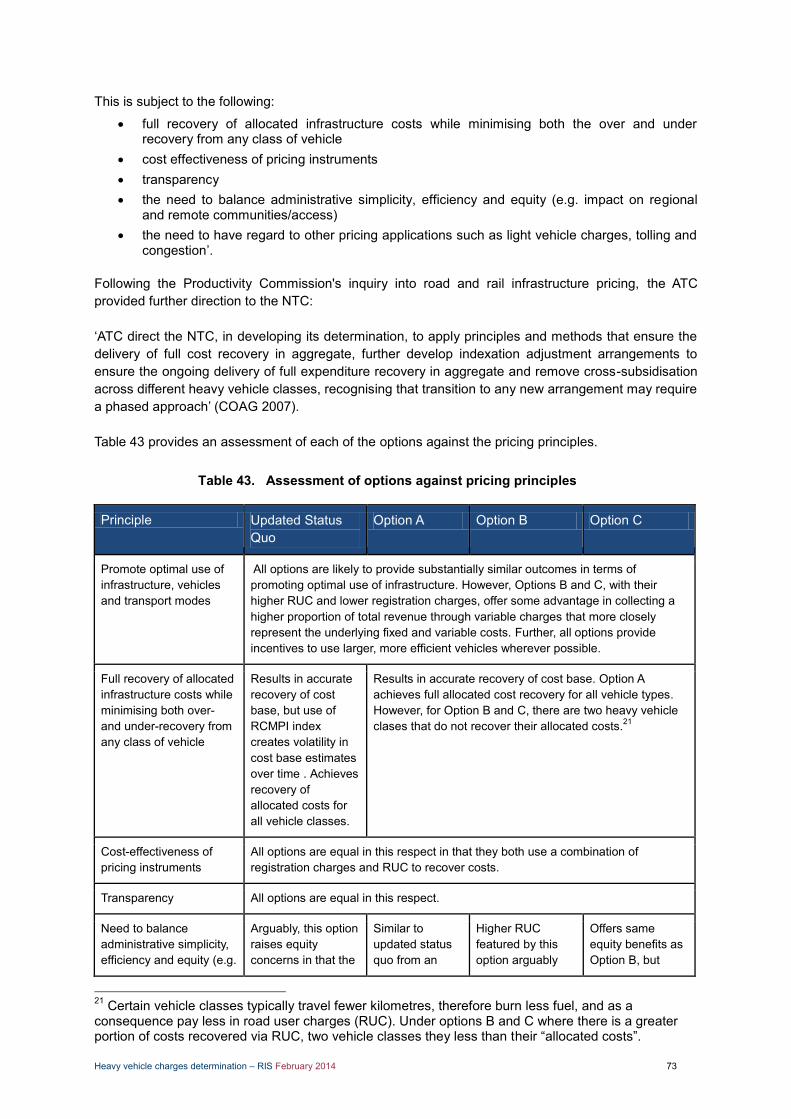
Heavy vehicle charges determination – RIS February 2014 73
This is subject to the following:
full recovery of allocated infrastructure costs while minimising both the over and under recovery from any class of vehicle
cost effectiveness of pricing instruments transparency the need to balance administrative simplicity, efficiency and equity (e.g. impact on regional
and remote communities/access) the need to have regard to other pricing applications such as light vehicle charges, tolling and
congestion’. Following the Productivity Commission's inquiry into road and rail infrastructure pricing, the ATC provided further direction to the NTC: ‘ATC direct the NTC, in developing its determination, to apply principles and methods that ensure the delivery of full cost recovery in aggregate, further develop indexation adjustment arrangements to ensure the ongoing delivery of full expenditure recovery in aggregate and remove cross-subsidisation across different heavy vehicle classes, recognising that transition to any new arrangement may require a phased approach’ (COAG 2007). Table 43 provides an assessment of each of the options against the pricing principles.
Assessment of options against pricing principles Table 43.
Principle Updated Status Quo
Option A Option B Option C
Promote optimal use of infrastructure, vehicles and transport modes
All options are likely to provide substantially similar outcomes in terms of promoting optimal use of infrastructure. However, Options B and C, with their higher RUC and lower registration charges, offer some advantage in collecting a higher proportion of total revenue through variable charges that more closely represent the underlying fixed and variable costs. Further, all options provide incentives to use larger, more efficient vehicles wherever possible.
Full recovery of allocated infrastructure costs while minimising both over- and under-recovery from any class of vehicle
Results in accurate recovery of cost base, but use of RCMPI index creates volatility in cost base estimates over time . Achieves recovery of allocated costs for all vehicle classes.
Results in accurate recovery of cost base. Option A achieves full allocated cost recovery for all vehicle types. However, for Option B and C, there are two heavy vehicle clases that do not recover their allocated costs.21
Cost-effectiveness of pricing instruments
All options are equal in this respect in that they both use a combination of registration charges and RUC to recover costs.
Transparency All options are equal in this respect.
Need to balance administrative simplicity, efficiency and equity (e.g.
Arguably, this option raises equity concerns in that the
Similar to updated status quo from an
Higher RUC featured by this option arguably
Offers same equity benefits as Option B, but
21 Certain vehicle classes typically travel fewer kilometres, therefore burn less fuel, and as a consequence pay less in road user charges (RUC). Under options B and C where there is a greater portion of costs recovered via RUC, two vehicle classes they less than their “allocated costs”.
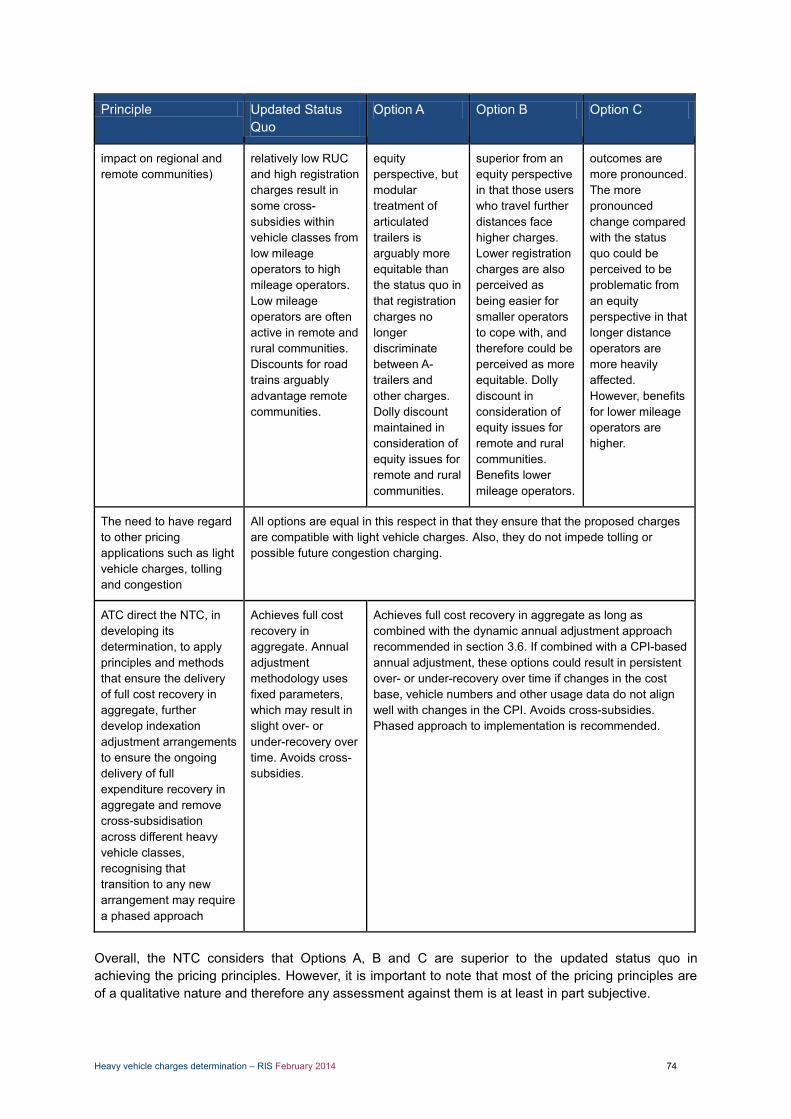
Heavy vehicle charges determination – RIS February 2014 74
Principle Updated Status Quo
Option A Option B Option C
impact on regional and remote communities)
relatively low RUC and high registration charges result in some cross-subsidies within vehicle classes from low mileage operators to high mileage operators. Low mileage operators are often active in remote and rural communities. Discounts for road trains arguably advantage remote communities.
equity perspective, but modular treatment of articulated trailers is arguably more equitable than the status quo in that registration charges no longer discriminate between A-trailers and other charges. Dolly discount maintained in consideration of equity issues for remote and rural communities.
superior from an equity perspective in that those users who travel further distances face higher charges. Lower registration charges are also perceived as being easier for smaller operators to cope with, and therefore could be perceived as more equitable. Dolly discount in consideration of equity issues for remote and rural communities. Benefits lower mileage operators.
outcomes are more pronounced. The more pronounced change compared with the status quo could be perceived to be problematic from an equity perspective in that longer distance operators are more heavily affected. However, benefits for lower mileage operators are higher.
The need to have regard to other pricing applications such as light vehicle charges, tolling and congestion
All options are equal in this respect in that they ensure that the proposed charges are compatible with light vehicle charges. Also, they do not impede tolling or possible future congestion charging.
ATC direct the NTC, in developing its determination, to apply principles and methods that ensure the delivery of full cost recovery in aggregate, further develop indexation adjustment arrangements to ensure the ongoing delivery of full expenditure recovery in aggregate and remove cross-subsidisation across different heavy vehicle classes, recognising that transition to any new arrangement may require a phased approach
Achieves full cost recovery in aggregate. Annual adjustment methodology uses fixed parameters, which may result in slight over- or under-recovery over time. Avoids cross-subsidies.
Achieves full cost recovery in aggregate as long as combined with the dynamic annual adjustment approach recommended in section 3.6. If combined with a CPI-based annual adjustment, these options could result in persistent over- or under-recovery over time if changes in the cost base, vehicle numbers and other usage data do not align well with changes in the CPI. Avoids cross-subsidies. Phased approach to implementation is recommended.
Overall, the NTC considers that Options A, B and C are superior to the updated status quo in achieving the pricing principles. However, it is important to note that most of the pricing principles are of a qualitative nature and therefore any assessment against them is at least in part subjective.
Heavy vehicle charges determination – RIS February 2014 75
However, the NTC considers that all of the options considered comply with the pricing principles. The key choice between the options is the degree to which costs are to be recovered through RUC.
4.6 Findings From an efficiency perspective there is a strong case for Option B (69% cost recovery via RUC), which closely aligns with the theoretical efficient level of 72% (assuming LRMC pricing). Moving to Option C could lead cross-subsidisation between users and allocative inefficiencies. When considering the practicalities of increasing the RUC, and the current excise cap of 38.1 c/l there appears to be sufficient headroom to allow for RUC to increase beyond that envisioned in Option B; however, it may be prudent to target a lower RUC to ensure there is sufficient longevity in the current charging regime. This case is made stronger if we assume that the 2.5% annual adjustment rate is too conservative, or if our assumption that a new technology-based charging regime will be in place within five years is not achievable. After considering the equity issues involved with setting the RUC, there appears to be no compelling case to either increase or decrease the level of RUC beyond what is determined to be efficient or practical.
4.7 Views Invited The NTC is seeking views from stakeholders on which option is prefereable.
Heavy vehicle charges determination – RIS February 2014 76
5. Impact analysis This section looks at a variety of impacts of the proposed charging options. The analysis ranges from the impact on heavy vehicle operators themselves to the financial implications for jurisdictional and Commonwealth governments. Also addressed are other indirect impacts such as competition issues, safety, productivity and end-user impacts.
5.1 Impact on heavy vehicles
5.1.1 Vehicle choice
As part of the determination process, the NTC commissioned an independent expert to examine the total cost structure of each category of vehicle class as categorised in the NTC pricing model (Figure 31). In doing so the expert produced a vehicle operator cost (VOC) model. The purpose of the model is to better understand the total cost structure of various types of heavy vehicle operator and how different charging options might shift the underlying cost profile of the heavy vehicle fleet and therefore influence vehicle choice. Cost estimates produced as part of the VOC modelling are hypothetical and for comparison purposes only. They are not intended for any other use.
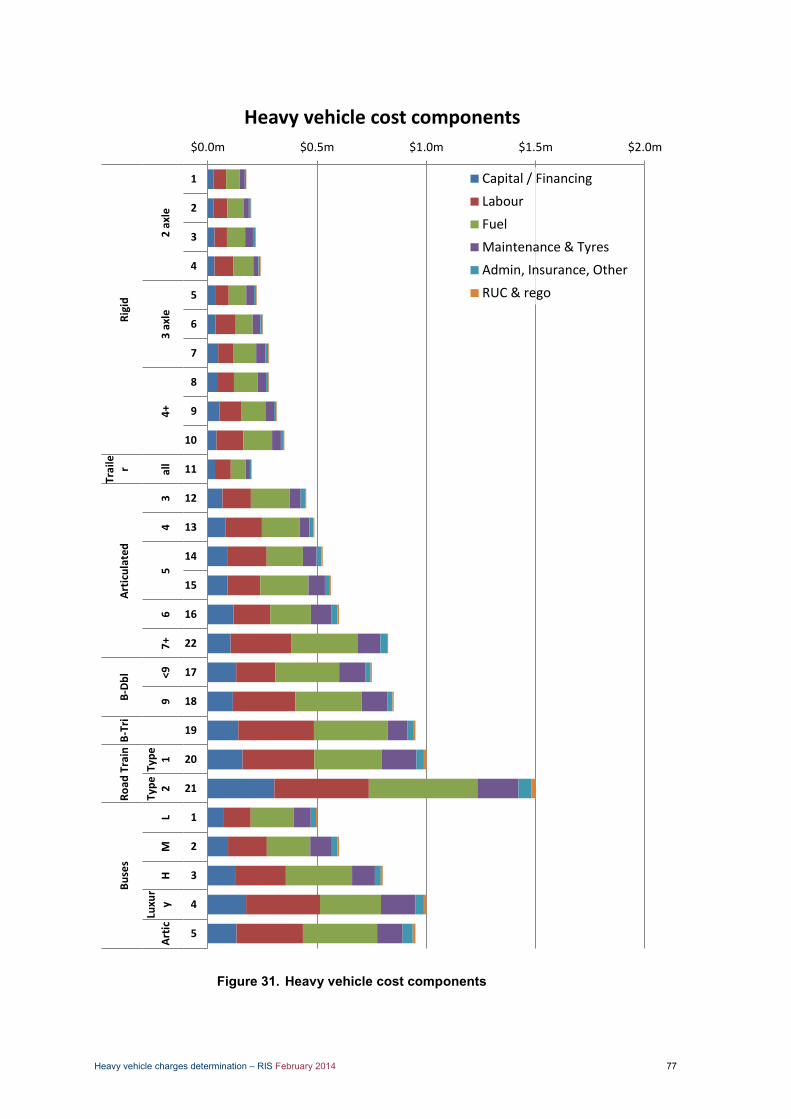
Heavy vehicle charges determination – RIS February 2014 77
Figure 31. Heavy vehicle cost components
$0.0m $0.5m $1.0m $1.5m $2.0m
1
2
3
4
5
6
7
8
9
10
11
12
13
14
15
16
22
17
18
19
20
21
1
2
3
4
5
2 a
xle
3 a
xle
4+
all
34
56
7+
<99
Typ
e1
Typ
e2
LM
HLu
xur
yA
rtic
Rig
idTr
aile
rA
rtic
ula
ted
B-D
bl
B-T
riR
oad
Tra
inB
use
sHeavy vehicle cost components
Capital / Financing
Labour
Fuel
Maintenance & Tyres
Admin, Insurance, Other
RUC & rego
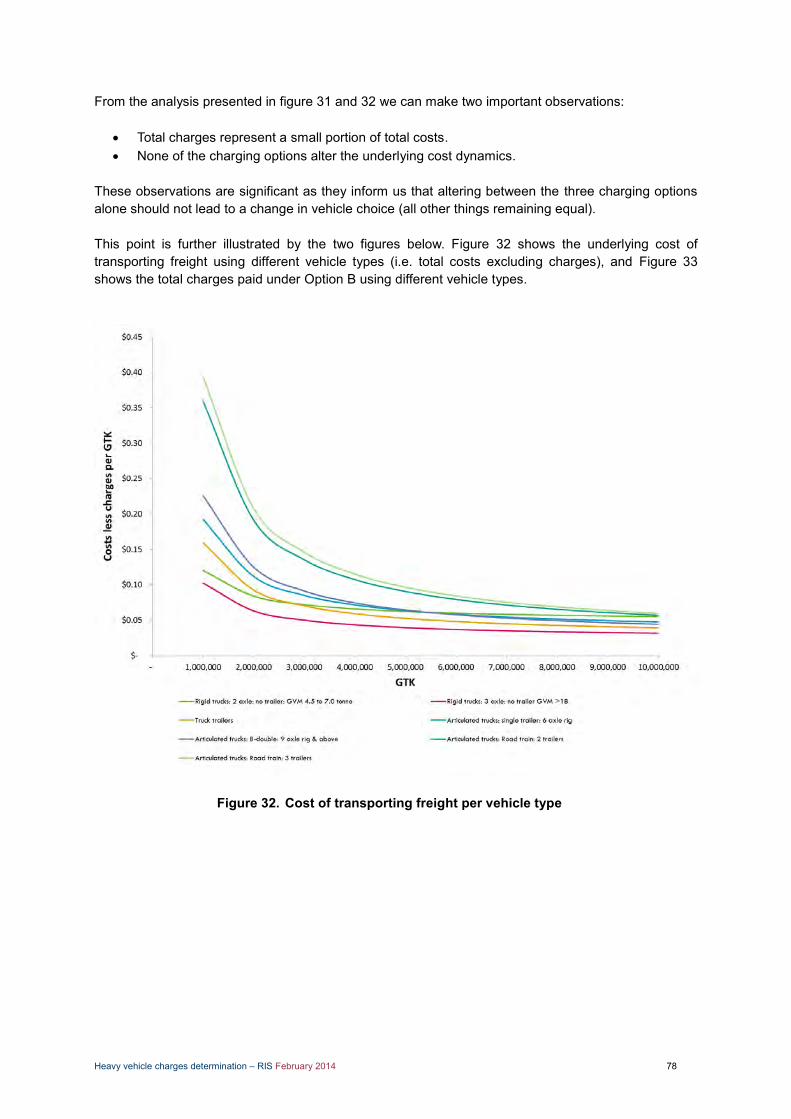
Heavy vehicle charges determination – RIS February 2014 78
From the analysis presented in figure 31 and 32 we can make two important observations:
Total charges represent a small portion of total costs. None of the charging options alter the underlying cost dynamics.
These observations are significant as they inform us that altering between the three charging options alone should not lead to a change in vehicle choice (all other things remaining equal). This point is further illustrated by the two figures below. Figure 32 shows the underlying cost of transporting freight using different vehicle types (i.e. total costs excluding charges), and Figure 33 shows the total charges paid under Option B using different vehicle types.
Figure 32. Cost of transporting freight per vehicle type
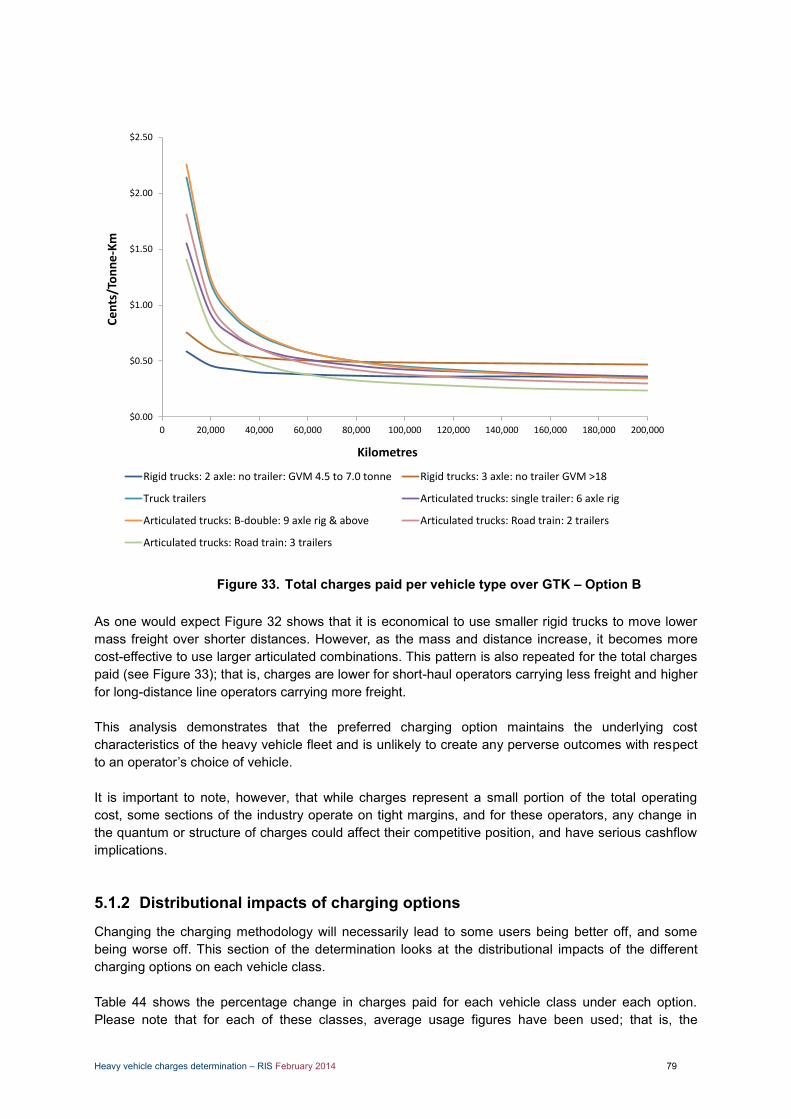
Heavy vehicle charges determination – RIS February 2014 79
Figure 33. Total charges paid per vehicle type over GTK – Option B As one would expect Figure 32 shows that it is economical to use smaller rigid trucks to move lower mass freight over shorter distances. However, as the mass and distance increase, it becomes more cost-effective to use larger articulated combinations. This pattern is also repeated for the total charges paid (see Figure 33); that is, charges are lower for short-haul operators carrying less freight and higher for long-distance line operators carrying more freight. This analysis demonstrates that the preferred charging option maintains the underlying cost characteristics of the heavy vehicle fleet and is unlikely to create any perverse outcomes with respect to an operator’s choice of vehicle. It is important to note, however, that while charges represent a small portion of the total operating cost, some sections of the industry operate on tight margins, and for these operators, any change in the quantum or structure of charges could affect their competitive position, and have serious cashflow implications.
5.1.2 Distributional impacts of charging options
Changing the charging methodology will necessarily lead to some users being better off, and some being worse off. This section of the determination looks at the distributional impacts of the different charging options on each vehicle class. Table 44 shows the percentage change in charges paid for each vehicle class under each option. Please note that for each of these classes, average usage figures have been used; that is, the
$0.00
$0.50
$1.00
$1.50
$2.00
$2.50
0 20,000 40,000 60,000 80,000 100,000 120,000 140,000 160,000 180,000 200,000
Ce
nts
/To
nn
e-K
m
Kilometres
Rigid trucks: 2 axle: no trailer: GVM 4.5 to 7.0 tonne Rigid trucks: 3 axle: no trailer GVM >18
Truck trailers Articulated trucks: single trailer: 6 axle rig
Articulated trucks: B-double: 9 axle rig & above Articulated trucks: Road train: 2 trailers
Articulated trucks: Road train: 3 trailers

Heavy vehicle charges determination – RIS February 2014 80
assumption is that each vehicle class has travelled a certain distance with an assumed load. For a more informative analysis of the distributional impacts please see figures 34 to 40.
Comparison of percentage change in charges paid Table 44.
As mentioned above, the analysis presented in Table 44 is limited because it assumes static usage parameters. The analysis below takes a more dynamic look at the distributional impacts of the charging options for a selected cross-section of the heavy vehicle fleet (see Figures 34–40):
two axle rigid – 4.5 to 7 tonnes three axle rigid > 18 tonne – no trailer heavy truck trailer > 42.5 tonnes six-axle articulated truck nine-axle B-double double road train triple road train. .
Charges Comparison - all heavy vehicle classes (including NHVR Regulatory Charge)
Base Case Updated % diff % diff % diff % diff
(Annual Status to Base Option to Base Option Difference to Base Option to Base
Current Adjustment) Quo Case A Case B Case C Case
Road User Charge (cents per litre) 26.1 26.5 25.2 25.1 29.0 32.0
Registration charges ($ per vehicle)
1 Rigid trucks: 2 axle: no trailer: GVM 4.5 to 7.0 tonne 556$ 563$ 549$ -2.5% 547$ -2.9% 484$ 79-$ -14.1% 484$ -14.1%
2 Rigid trucks: 2 axle: no trailer: GVM 7.0 to 12.0 tonne 556$ 563$ 549$ -2.5% 547$ -2.9% 484$ 79-$ -14.1% 484$ -14.1%
3 Rigid trucks: 2 axle: no trailer: GVM over 12.0 tonne 880$ 891$ 982$ 10.1% 870$ -2.4% 704$ 188-$ -21.0% 571$ -36.0%
4 Rigid trucks: 2 axle: with trailer 1,726$ 1,748$ 1,886$ 7.8% 1,862$ 6.5% 1,448$ 300-$ -17.2% 1,117$ -36.1%
5 Rigid trucks: 3 axle: no trailer GVM 4.5-18 880$ 891$ 999$ 12.0% 881$ -1.1% 715$ 176-$ -19.7% 582$ -34.7%
6 Rigid trucks: 3 axle: no trailer GVM >18 1,047$ 1,061$ 1,071$ 1.0% 983$ -7.3% 805$ 255-$ -24.1% 663$ -37.5%
7 Rigid trucks: 3 axle: with trailer >18 2,738$ 2,774$ 2,614$ -5.8% 2,875$ 3.7% 2,202$ 572-$ -20.6% 1,663$ -40.0%
8 Rigid trucks: 4 axle: no trailer GVM 4.5-25 778$ 788$ 1,299$ 64.9% 1,126$ 42.8% 960$ 172$ 21.8% 827$ 4.9%
9 Rigid trucks: 4 axle: no trailer GVM >25 1,047$ 1,061$ 1,091$ 2.9% 1,006$ -5.2% 828$ 233-$ -21.9% 685$ -35.4%
# Rigid trucks: 4 axle: with trailer >25 3,592$ 3,638$ 3,625$ -0.4% 3,763$ 3.4% 2,877$ 762-$ -20.9% 2,167$ -40.4%
# Heavy Truck Trailers > 42.5 Tonnes 8,926$ 9,042$ 8,319$ -8.0% 9,584$ 6.0% 7,220$ 1,821-$ -20.1% 5,330$ -41.1%
# Articulated trucks: single trailer: 3 axle rig 1,757$ 1,780$ 1,914$ 7.5% 1,698$ -4.6% 1,367$ 413-$ -23.2% 1,102$ -38.1%
# Articulated trucks: single trailer: 4 axle rig 2,321$ 2,351$ 2,384$ 1.4% 2,496$ 6.2% 1,955$ 396-$ -16.8% 1,522$ -35.2%
# Articulated trucks: single 3 axle trailer: 5 axle rig 2,884$ 2,922$ 2,853$ -2.3% 2,771$ -5.1% 2,158$ 763-$ -26.1% 1,668$ -42.9%
# Articulated trucks: single 2 axle trailer: 5 axle rig 5,990$ 6,068$ 5,695$ -6.2% 5,653$ -6.9% 4,283$ 1,786-$ -29.4% 3,187$ -47.5%
# Articulated trucks: single trailer: 6 axle rig 6,554$ 6,639$ 6,165$ -7.1% 5,758$ -13.3% 4,361$ 2,278-$ -34.3% 3,242$ -51.2%
# Articulated trucks: B-double: <9 axle rig 13,537$ 13,713$ 12,315$ -10.2% 13,501$ -1.5% 10,223$ 3,490-$ -25.5% 7,600$ -44.6%
# Articulated trucks: B-double/triple: 9 axle rig & above 14,767$ 14,959$ 13,342$ -10.8% 13,607$ -9.0% 10,300$ 4,658-$ -31.1% 7,656$ -48.8%
# Articulated trucks: B-triple 18,150$ 18,385$ 16,212$ -11.8% 15,359$ -16.5% 11,605$ 6,780-$ -36.9% 8,603$ -53.2%
# Articulated trucks: Road train: 2 trailers 14,203$ 14,388$ 12,922$ -10.2% 13,657$ -5.1% 10,350$ 4,037-$ -28.1% 7,706$ -46.4%
# Articulated trucks: Road train: 3 trailers 17,022$ 17,243$ 15,372$ -10.9% 15,459$ -10.3% 11,705$ 5,538-$ -32.1% 8,703$ -49.5%
# Articulated trucks: > 6 axle rig (NEC) 6,847$ 6,936$ 6,441$ -7.1% 6,562$ -5.4% 5,093$ 1,842-$ -26.6% 3,918$ -43.5%
# Other trucks 1,122$ 1,137$ 1,363$ 19.9% 1,303$ 14.6% 1,043$ 94-$ -8.3% 835$ -26.6%
# Buses: 2 axle: GVM 4.5 to 10.0 t 500$ 507$ 497$ -1.8% 497$ -1.9% 497$ 10-$ -1.9% 497$ -1.9%
# Buses: 2 axle: GVM over 10.0 t 500$ 507$ 595$ 17.5% 599$ 18.2% 599$ 92$ 18.2% 599$ 18.2%
# Buses: 3 axle 2,490$ 2,522$ 2,361$ -6.4% 2,423$ -3.9% 1,900$ 622-$ -24.7% 1,482$ -41.2%
# Buses: articulated 500$ 507$ 612$ 20.8% 615$ 21.4% 615$ 108$ 21.4% 615$ 21.4%

Heavy vehicle charges determination – RIS February 2014 81
Figure 34. Rigid truck: 2 axle: no trailer: GVM 4.5 to 7.0 tonne
Figure 35. Rigid truck: 3 axle: no trailer: GVM > 18 tonne
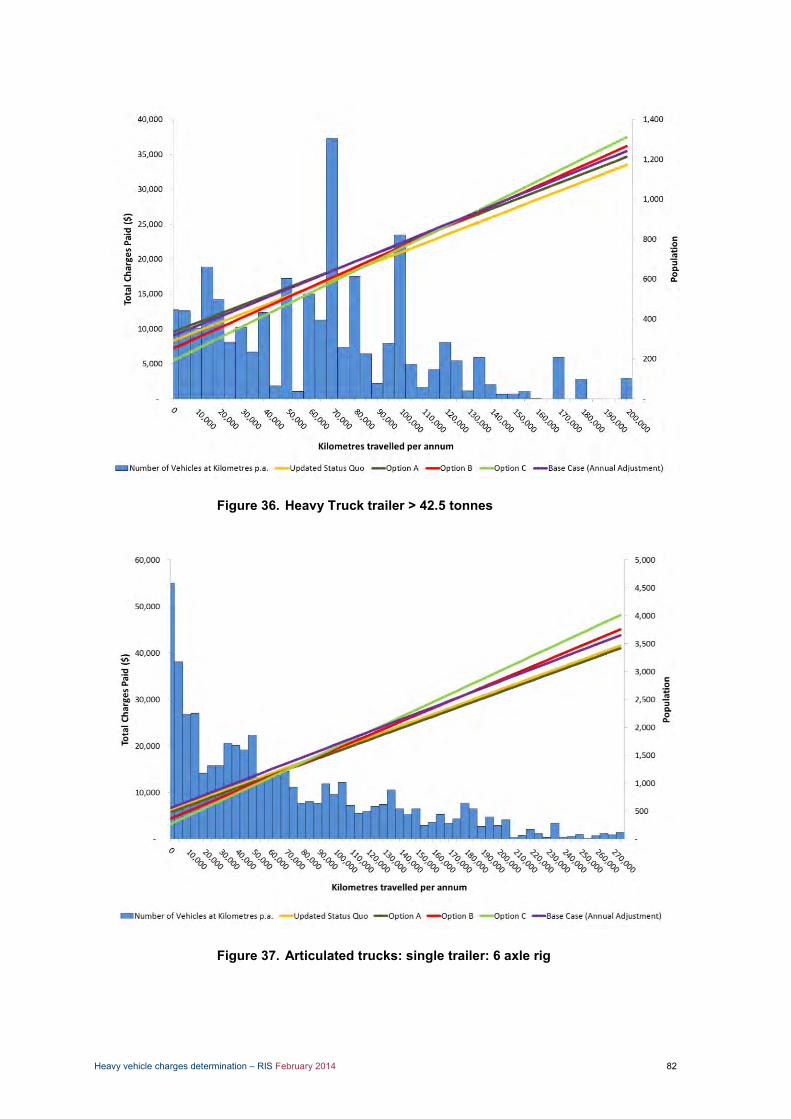
Heavy vehicle charges determination – RIS February 2014 82
Figure 36. Heavy Truck trailer > 42.5 tonnes
Figure 37. Articulated trucks: single trailer: 6 axle rig

Heavy vehicle charges determination – RIS February 2014 83
Figure 38. Articulated trucks: B-double: 9 axle rig & above
Figure 39. Articulated trucks: Road Train: 2 trailers
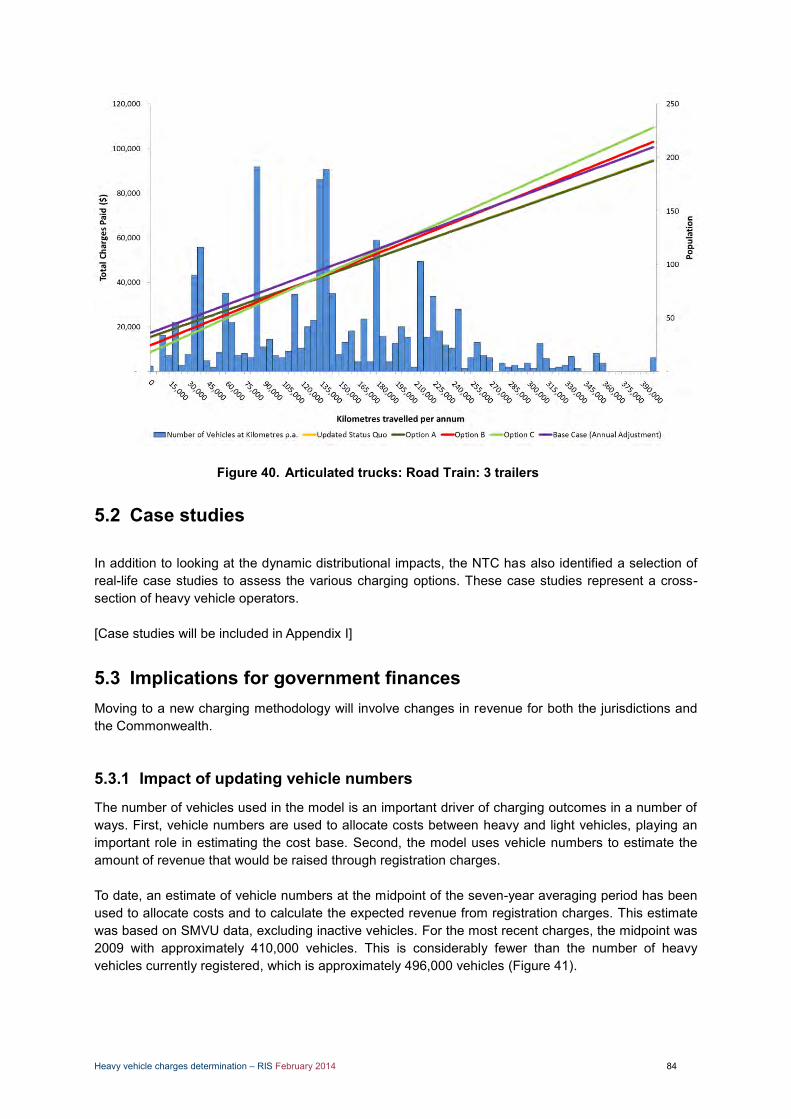
Heavy vehicle charges determination – RIS February 2014 84
Figure 40. Articulated trucks: Road Train: 3 trailers
5.2 Case studies In addition to looking at the dynamic distributional impacts, the NTC has also identified a selection of real-life case studies to assess the various charging options. These case studies represent a cross-section of heavy vehicle operators. [Case studies will be included in Appendix I]
5.3 Implications for government finances Moving to a new charging methodology will involve changes in revenue for both the jurisdictions and the Commonwealth.
5.3.1 Impact of updating vehicle numbers
The number of vehicles used in the model is an important driver of charging outcomes in a number of ways. First, vehicle numbers are used to allocate costs between heavy and light vehicles, playing an important role in estimating the cost base. Second, the model uses vehicle numbers to estimate the amount of revenue that would be raised through registration charges. To date, an estimate of vehicle numbers at the midpoint of the seven-year averaging period has been used to allocate costs and to calculate the expected revenue from registration charges. This estimate was based on SMVU data, excluding inactive vehicles. For the most recent charges, the midpoint was 2009 with approximately 410,000 vehicles. This is considerably fewer than the number of heavy vehicles currently registered, which is approximately 496,000 vehicles (Figure 41).
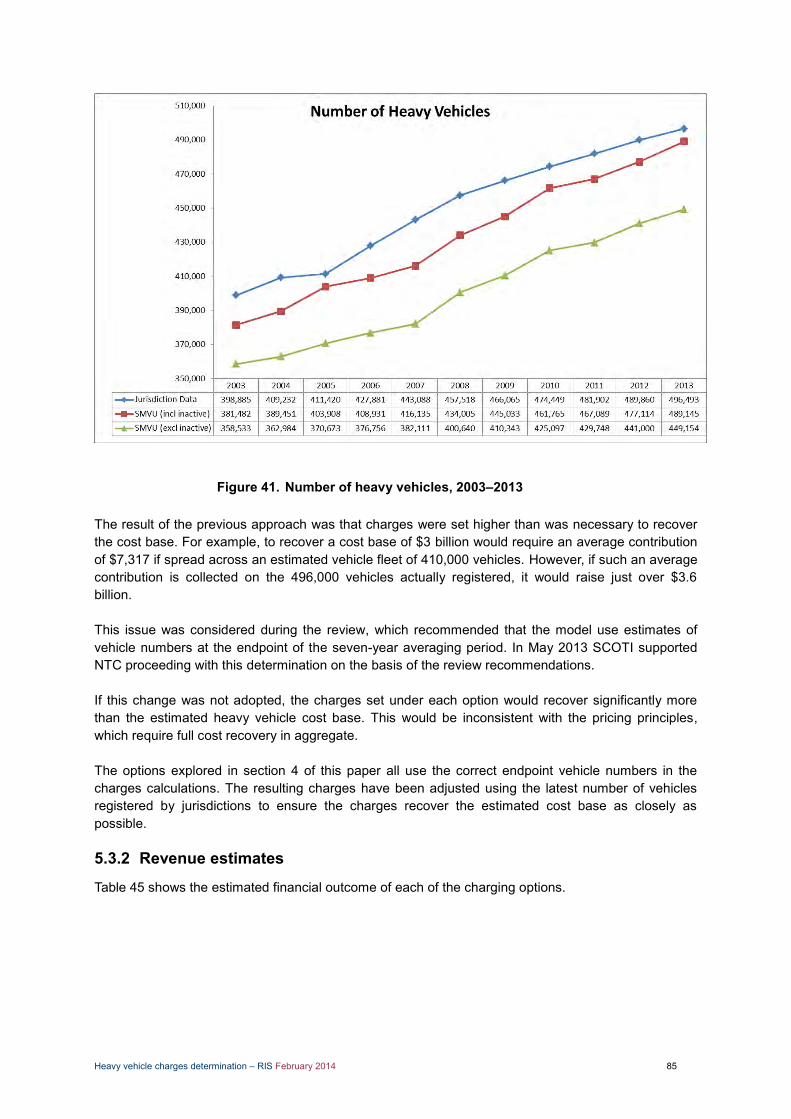
Heavy vehicle charges determination – RIS February 2014 85
Figure 41. Number of heavy vehicles, 2003–2013 The result of the previous approach was that charges were set higher than was necessary to recover the cost base. For example, to recover a cost base of $3 billion would require an average contribution of $7,317 if spread across an estimated vehicle fleet of 410,000 vehicles. However, if such an average contribution is collected on the 496,000 vehicles actually registered, it would raise just over $3.6 billion. This issue was considered during the review, which recommended that the model use estimates of vehicle numbers at the endpoint of the seven-year averaging period. In May 2013 SCOTI supported NTC proceeding with this determination on the basis of the review recommendations. If this change was not adopted, the charges set under each option would recover significantly more than the estimated heavy vehicle cost base. This would be inconsistent with the pricing principles, which require full cost recovery in aggregate. The options explored in section 4 of this paper all use the correct endpoint vehicle numbers in the charges calculations. The resulting charges have been adjusted using the latest number of vehicles registered by jurisdictions to ensure the charges recover the estimated cost base as closely as possible.
5.3.2 Revenue estimates
Table 45 shows the estimated financial outcome of each of the charging options.
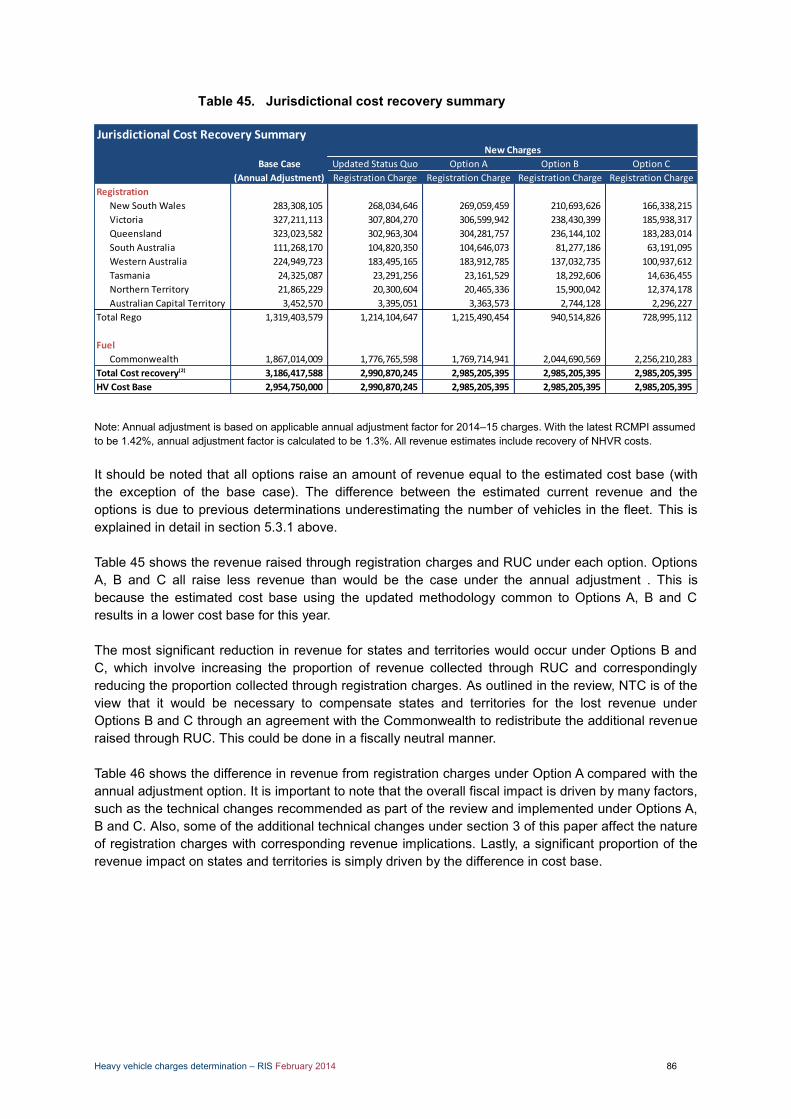
Heavy vehicle charges determination – RIS February 2014 86
Jurisdictional cost recovery summary Table 45.
Note: Annual adjustment is based on applicable annual adjustment factor for 2014–15 charges. With the latest RCMPI assumed to be 1.42%, annual adjustment factor is calculated to be 1.3%. All revenue estimates include recovery of NHVR costs. It should be noted that all options raise an amount of revenue equal to the estimated cost base (with the exception of the base case). The difference between the estimated current revenue and the options is due to previous determinations underestimating the number of vehicles in the fleet. This is explained in detail in section 5.3.1 above. Table 45 shows the revenue raised through registration charges and RUC under each option. Options A, B and C all raise less revenue than would be the case under the annual adjustment . This is because the estimated cost base using the updated methodology common to Options A, B and C results in a lower cost base for this year. The most significant reduction in revenue for states and territories would occur under Options B and C, which involve increasing the proportion of revenue collected through RUC and correspondingly reducing the proportion collected through registration charges. As outlined in the review, NTC is of the view that it would be necessary to compensate states and territories for the lost revenue under Options B and C through an agreement with the Commonwealth to redistribute the additional revenue raised through RUC. This could be done in a fiscally neutral manner. Table 46 shows the difference in revenue from registration charges under Option A compared with the annual adjustment option. It is important to note that the overall fiscal impact is driven by many factors, such as the technical changes recommended as part of the review and implemented under Options A, B and C. Also, some of the additional technical changes under section 3 of this paper affect the nature of registration charges with corresponding revenue implications. Lastly, a significant proportion of the revenue impact on states and territories is simply driven by the difference in cost base.
Jurisdictional Cost Recovery Summary
Base Case Updated Status Quo Option A Option B Option C
(Annual Adjustment) Registration Charge Registration Charge Registration Charge Registration Charge
Registration
New South Wales 283,308,105 268,034,646 269,059,459 210,693,626 166,338,215
Victoria 327,211,113 307,804,270 306,599,942 238,430,399 185,938,317
Queensland 323,023,582 302,963,304 304,281,757 236,144,102 183,283,014
South Australia 111,268,170 104,820,350 104,646,073 81,277,186 63,191,095
Western Australia 224,949,723 183,495,165 183,912,785 137,032,735 100,937,612
Tasmania 24,325,087 23,291,256 23,161,529 18,292,606 14,636,455
Northern Territory 21,865,229 20,300,604 20,465,336 15,900,042 12,374,178
Australian Capital Territory 3,452,570 3,395,051 3,363,573 2,744,128 2,296,227
Total Rego 1,319,403,579 1,214,104,647 1,215,490,454 940,514,826 728,995,112
Fuel
Commonwealth 1,867,014,009 1,776,765,598 1,769,714,941 2,044,690,569 2,256,210,283
Total Cost recovery(2) 3,186,417,588 2,990,870,245 2,985,205,395 2,985,205,395 2,985,205,395
HV Cost Base 2,954,750,000 2,990,870,245 2,985,205,395 2,985,205,395 2,985,205,395
New Charges
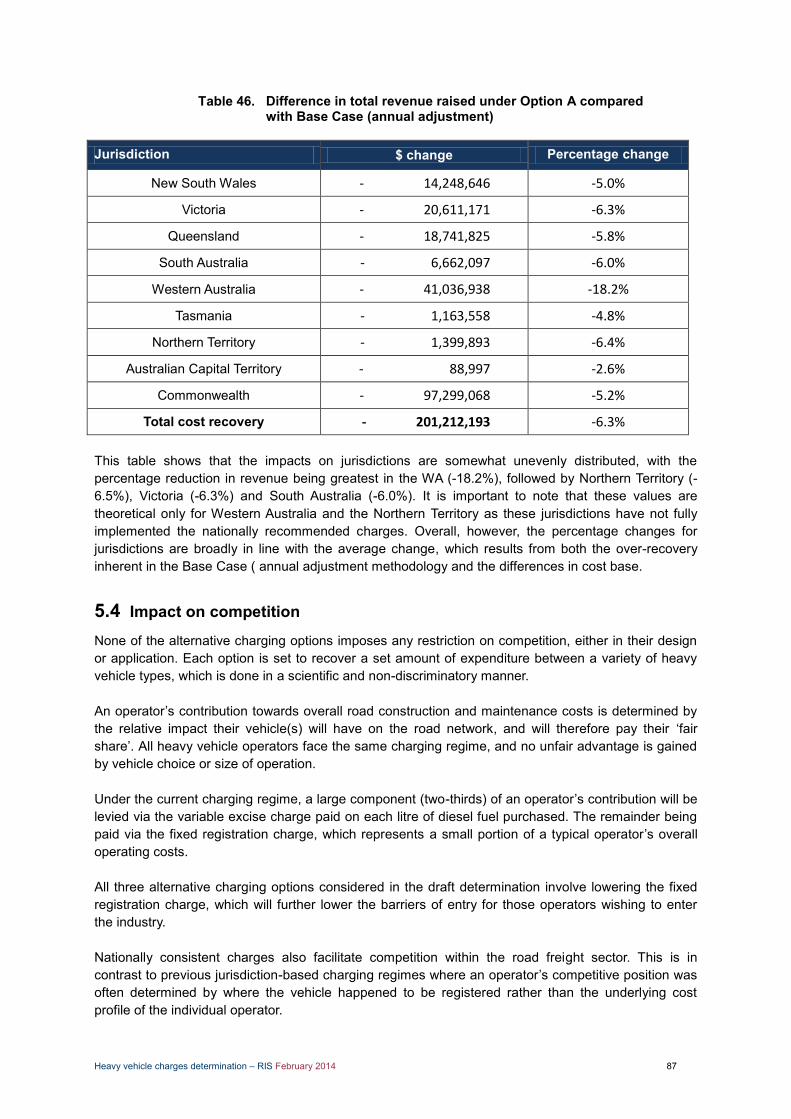
Heavy vehicle charges determination – RIS February 2014 87
Difference in total revenue raised under Option A compared Table 46.with Base Case (annual adjustment)
Jurisdiction $ change Percentage change
New South Wales - 14,248,646 -5.0%
Victoria - 20,611,171 -6.3%
Queensland - 18,741,825 -5.8%
South Australia - 6,662,097 -6.0%
Western Australia - 41,036,938 -18.2%
Tasmania - 1,163,558 -4.8%
Northern Territory - 1,399,893 -6.4%
Australian Capital Territory - 88,997 -2.6%
Commonwealth - 97,299,068 -5.2%
Total cost recovery - 201,212,193 -6.3% This table shows that the impacts on jurisdictions are somewhat unevenly distributed, with the percentage reduction in revenue being greatest in the WA (-18.2%), followed by Northern Territory (-6.5%), Victoria (-6.3%) and South Australia (-6.0%). It is important to note that these values are theoretical only for Western Australia and the Northern Territory as these jurisdictions have not fully implemented the nationally recommended charges. Overall, however, the percentage changes for jurisdictions are broadly in line with the average change, which results from both the over-recovery inherent in the Base Case ( annual adjustment methodology and the differences in cost base.
5.4 Impact on competition
None of the alternative charging options imposes any restriction on competition, either in their design or application. Each option is set to recover a set amount of expenditure between a variety of heavy vehicle types, which is done in a scientific and non-discriminatory manner. An operator’s contribution towards overall road construction and maintenance costs is determined by the relative impact their vehicle(s) will have on the road network, and will therefore pay their ‘fair share’. All heavy vehicle operators face the same charging regime, and no unfair advantage is gained by vehicle choice or size of operation. Under the current charging regime, a large component (two-thirds) of an operator’s contribution will be levied via the variable excise charge paid on each litre of diesel fuel purchased. The remainder being paid via the fixed registration charge, which represents a small portion of a typical operator’s overall operating costs. All three alternative charging options considered in the draft determination involve lowering the fixed registration charge, which will further lower the barriers of entry for those operators wishing to enter the industry. Nationally consistent charges also facilitate competition within the road freight sector. This is in contrast to previous jurisdiction-based charging regimes where an operator’s competitive position was often determined by where the vehicle happened to be registered rather than the underlying cost profile of the individual operator.
Heavy vehicle charges determination – RIS February 2014 88
5.5 Impact of changing revenue flows
To address the proposed changes in revenue flows under options B and C, the NTC proposes a revenue equalisation mechanism that would involve the transfer of increased RUC receipts from the Commonwealth to jurisdictions, with the stated aim of returning each party to their original fiscal position – that is, the position that would have prevailed under Option A. The proposed mechanism involves calculating estimated receipts under Option A, as well as estimated receipts under the preferred option. The difference would then be paid by the Commonwealth to jurisdictions to keep all parties whole. This issue is addressed in further detail in section 7.
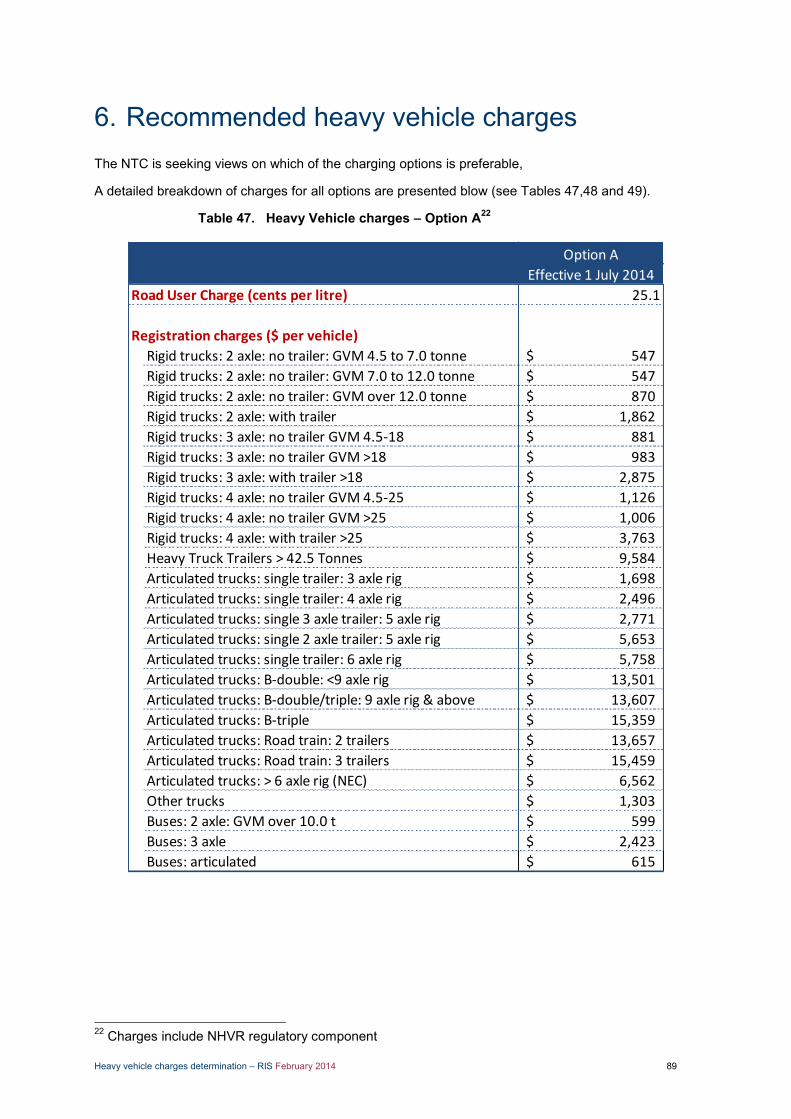
Heavy vehicle charges determination – RIS February 2014 89
6. Recommended heavy vehicle charges The NTC is seeking views on which of the charging options is preferable,
A detailed breakdown of charges for all options are presented blow (see Tables 47,48 and 49).
Heavy Vehicle charges – Option A22 Table 47.
22 Charges include NHVR regulatory component
Option A
Effective 1 July 2014
Road User Charge (cents per litre) 25.1
Registration charges ($ per vehicle)
Rigid trucks: 2 axle: no trailer: GVM 4.5 to 7.0 tonne 547$
Rigid trucks: 2 axle: no trailer: GVM 7.0 to 12.0 tonne 547$
Rigid trucks: 2 axle: no trailer: GVM over 12.0 tonne 870$
Rigid trucks: 2 axle: with trailer 1,862$
Rigid trucks: 3 axle: no trailer GVM 4.5-18 881$
Rigid trucks: 3 axle: no trailer GVM >18 983$
Rigid trucks: 3 axle: with trailer >18 2,875$
Rigid trucks: 4 axle: no trailer GVM 4.5-25 1,126$
Rigid trucks: 4 axle: no trailer GVM >25 1,006$
Rigid trucks: 4 axle: with trailer >25 3,763$
Heavy Truck Trailers > 42.5 Tonnes 9,584$
Articulated trucks: single trailer: 3 axle rig 1,698$
Articulated trucks: single trailer: 4 axle rig 2,496$
Articulated trucks: single 3 axle trailer: 5 axle rig 2,771$
Articulated trucks: single 2 axle trailer: 5 axle rig 5,653$
Articulated trucks: single trailer: 6 axle rig 5,758$
Articulated trucks: B-double: <9 axle rig 13,501$
Articulated trucks: B-double/triple: 9 axle rig & above 13,607$
Articulated trucks: B-triple 15,359$
Articulated trucks: Road train: 2 trailers 13,657$
Articulated trucks: Road train: 3 trailers 15,459$
Articulated trucks: > 6 axle rig (NEC) 6,562$
Other trucks 1,303$
Buses: 2 axle: GVM over 10.0 t 599$
Buses: 3 axle 2,423$
Buses: articulated 615$
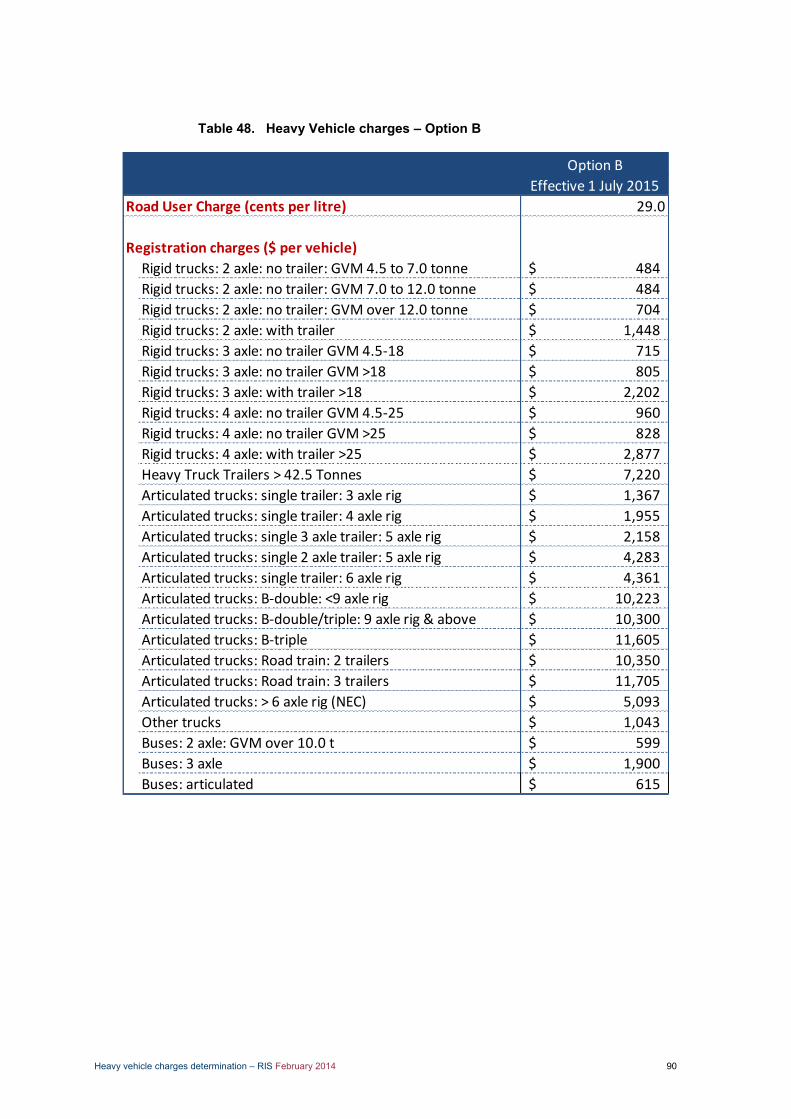
Heavy vehicle charges determination – RIS February 2014 90
Heavy Vehicle charges – Option B Table 48.
Option B
Effective 1 July 2015
Road User Charge (cents per litre) 29.0
Registration charges ($ per vehicle)
Rigid trucks: 2 axle: no trailer: GVM 4.5 to 7.0 tonne 484$
Rigid trucks: 2 axle: no trailer: GVM 7.0 to 12.0 tonne 484$
Rigid trucks: 2 axle: no trailer: GVM over 12.0 tonne 704$
Rigid trucks: 2 axle: with trailer 1,448$
Rigid trucks: 3 axle: no trailer GVM 4.5-18 715$
Rigid trucks: 3 axle: no trailer GVM >18 805$
Rigid trucks: 3 axle: with trailer >18 2,202$
Rigid trucks: 4 axle: no trailer GVM 4.5-25 960$
Rigid trucks: 4 axle: no trailer GVM >25 828$
Rigid trucks: 4 axle: with trailer >25 2,877$
Heavy Truck Trailers > 42.5 Tonnes 7,220$
Articulated trucks: single trailer: 3 axle rig 1,367$
Articulated trucks: single trailer: 4 axle rig 1,955$
Articulated trucks: single 3 axle trailer: 5 axle rig 2,158$
Articulated trucks: single 2 axle trailer: 5 axle rig 4,283$
Articulated trucks: single trailer: 6 axle rig 4,361$
Articulated trucks: B-double: <9 axle rig 10,223$
Articulated trucks: B-double/triple: 9 axle rig & above 10,300$
Articulated trucks: B-triple 11,605$
Articulated trucks: Road train: 2 trailers 10,350$
Articulated trucks: Road train: 3 trailers 11,705$
Articulated trucks: > 6 axle rig (NEC) 5,093$
Other trucks 1,043$
Buses: 2 axle: GVM over 10.0 t 599$
Buses: 3 axle 1,900$
Buses: articulated 615$
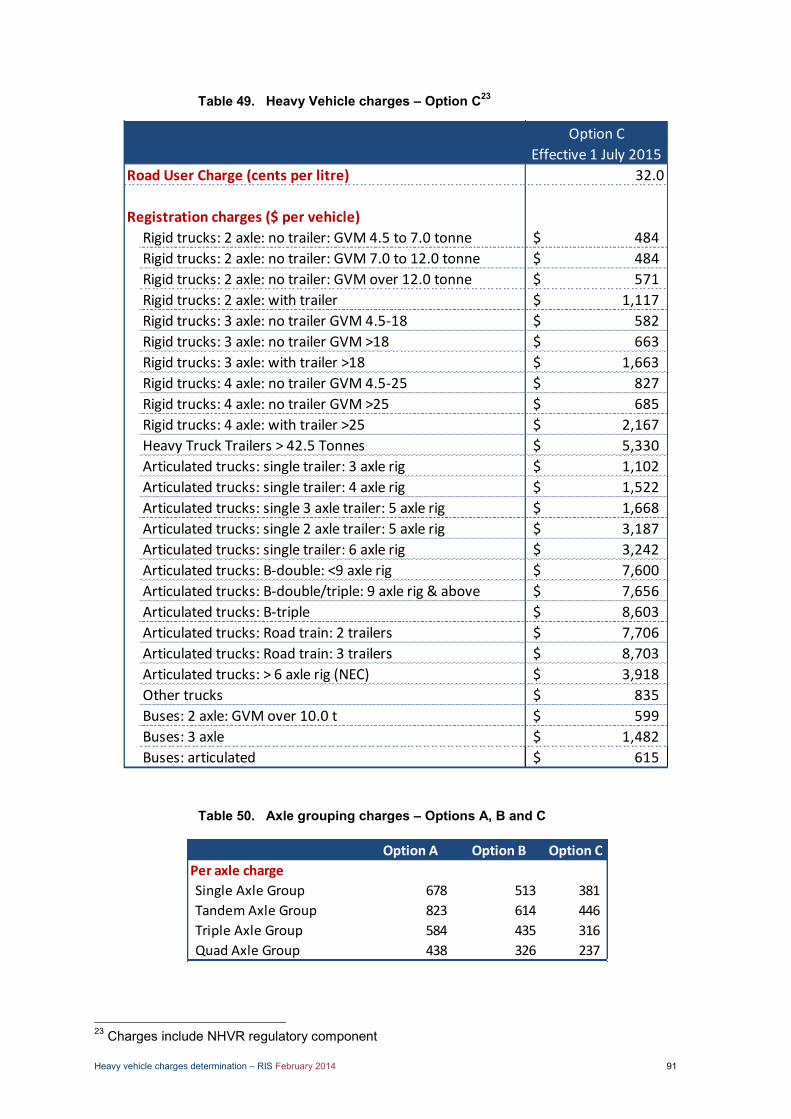
Heavy vehicle charges determination – RIS February 2014 91
Heavy Vehicle charges – Option C23 Table 49.
Axle grouping charges – Options A, B and C Table 50.
23 Charges include NHVR regulatory component
Option C
Effective 1 July 2015
Road User Charge (cents per litre) 32.0
Registration charges ($ per vehicle)
Rigid trucks: 2 axle: no trailer: GVM 4.5 to 7.0 tonne 484$
Rigid trucks: 2 axle: no trailer: GVM 7.0 to 12.0 tonne 484$
Rigid trucks: 2 axle: no trailer: GVM over 12.0 tonne 571$
Rigid trucks: 2 axle: with trailer 1,117$
Rigid trucks: 3 axle: no trailer GVM 4.5-18 582$
Rigid trucks: 3 axle: no trailer GVM >18 663$
Rigid trucks: 3 axle: with trailer >18 1,663$
Rigid trucks: 4 axle: no trailer GVM 4.5-25 827$
Rigid trucks: 4 axle: no trailer GVM >25 685$
Rigid trucks: 4 axle: with trailer >25 2,167$
Heavy Truck Trailers > 42.5 Tonnes 5,330$
Articulated trucks: single trailer: 3 axle rig 1,102$
Articulated trucks: single trailer: 4 axle rig 1,522$
Articulated trucks: single 3 axle trailer: 5 axle rig 1,668$
Articulated trucks: single 2 axle trailer: 5 axle rig 3,187$
Articulated trucks: single trailer: 6 axle rig 3,242$
Articulated trucks: B-double: <9 axle rig 7,600$
Articulated trucks: B-double/triple: 9 axle rig & above 7,656$
Articulated trucks: B-triple 8,603$
Articulated trucks: Road train: 2 trailers 7,706$
Articulated trucks: Road train: 3 trailers 8,703$
Articulated trucks: > 6 axle rig (NEC) 3,918$
Other trucks 835$
Buses: 2 axle: GVM over 10.0 t 599$
Buses: 3 axle 1,482$
Buses: articulated 615$
Option A Option B Option C
Per axle charge
Single Axle Group 678 513 381
Tandem Axle Group 823 614 446
Triple Axle Group 584 435 316
Quad Axle Group 438 326 237
Heavy vehicle charges determination – RIS February 2014 92
7. Implementation workplan This section of the draft determination explores likely implementation timeframes. For the purpose of illustrating the complexity associated with moving to any option which involves a re-balancing of charges towards RUC, this section considers a possible two phase approach which would see Option A implemented first, and Option B implemented as a second step. Option B includes the following requirements from an implementation perspective:
introducing a new set of registration charges changing the balance between RUC and registration charges to raise RUC to 29.0 c/l and
correspondingly reducing the proportion of revenue raised through registration charges establishing an agreement between the Commonwealth and jurisdictions to redistribute a
proportion of the revenue raised through RUC to jurisdictions to offset the revenue foregone through the implementation of lower registration charges
implementing a separate regulatory portion of the registration charge to recover the NHVR’s approved costs, eventually to be identified separately on invoices to vehicle owners.
7.1 Establishing processes and timelines The NTC engaged Marsden Jacob Associates to investigate the processes and timelines involved in implementing a new set of heavy vehicle charges by Commonwealth, state and territory governments. Marsden Jacob investigated implementation of the following aspects of the recommended charges:
A standard heavy vehicle charges determination with no changes to the structure of charges that would require business system changes. This is similar to Option A.
Implementing an arrangement that would provide for financial redistribution of some of the additional RUC revenue. This would be required under Options B and C.
Implementing a new fee to recover the cost of the NHVR. This is required under all options. Marsden Jacob was also asked to review the impact of different charging options – for example, a charge per axle that would be the same for all trailer types. However, after considering this option and taking into account feedback from governments, Marsden Jacob has advised that this could be dealt with under a standard charging determination with no changes to the structure of charges.
7.2 Methodology To develop an understanding of the processes and expected timelines required to implement the determination, Marsden Jacob engaged with governments through posing a series of initial questions to each government and then following up by phone to clarify the responses and ask additional questions. The timelines provided by governments through this process are estimates and, in some cases, Marsden Jacob was required to interpret responses to fit into the overall framework.
7.3 Summary of findings Table 51 provides a summary of the review. This shows that most governments are able to meet a 1 July 2014 implementation date for a basic heavy vehicle charges determination, such as Option A. For options requiring an arrangement to redistribute RUC revenues (Options B and C), the estimated time
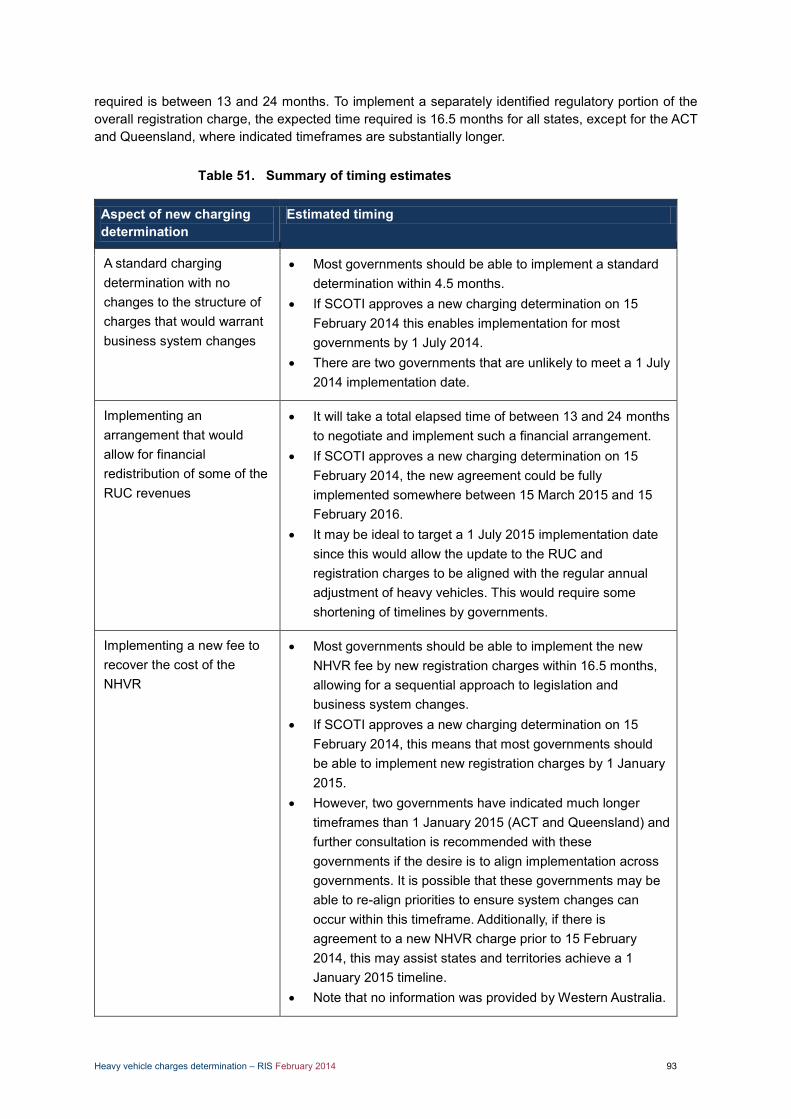
Heavy vehicle charges determination – RIS February 2014 93
required is between 13 and 24 months. To implement a separately identified regulatory portion of the overall registration charge, the expected time required is 16.5 months for all states, except for the ACT and Queensland, where indicated timeframes are substantially longer.
Summary of timing estimates Table 51.
Aspect of new charging determination
Estimated timing
A standard charging determination with no changes to the structure of charges that would warrant business system changes
Most governments should be able to implement a standard determination within 4.5 months.
If SCOTI approves a new charging determination on 15 February 2014 this enables implementation for most governments by 1 July 2014.
There are two governments that are unlikely to meet a 1 July 2014 implementation date.
Implementing an arrangement that would allow for financial redistribution of some of the RUC revenues
It will take a total elapsed time of between 13 and 24 months to negotiate and implement such a financial arrangement.
If SCOTI approves a new charging determination on 15 February 2014, the new agreement could be fully implemented somewhere between 15 March 2015 and 15 February 2016.
It may be ideal to target a 1 July 2015 implementation date since this would allow the update to the RUC and registration charges to be aligned with the regular annual adjustment of heavy vehicles. This would require some shortening of timelines by governments.
Implementing a new fee to recover the cost of the NHVR
Most governments should be able to implement the new NHVR fee by new registration charges within 16.5 months, allowing for a sequential approach to legislation and business system changes.
If SCOTI approves a new charging determination on 15 February 2014, this means that most governments should be able to implement new registration charges by 1 January 2015.
However, two governments have indicated much longer timeframes than 1 January 2015 (ACT and Queensland) and further consultation is recommended with these governments if the desire is to align implementation across governments. It is possible that these governments may be able to re-align priorities to ensure system changes can occur within this timeframe. Additionally, if there is agreement to a new NHVR charge prior to 15 February 2014, this may assist states and territories achieve a 1 January 2015 timeline.
Note that no information was provided by Western Australia.
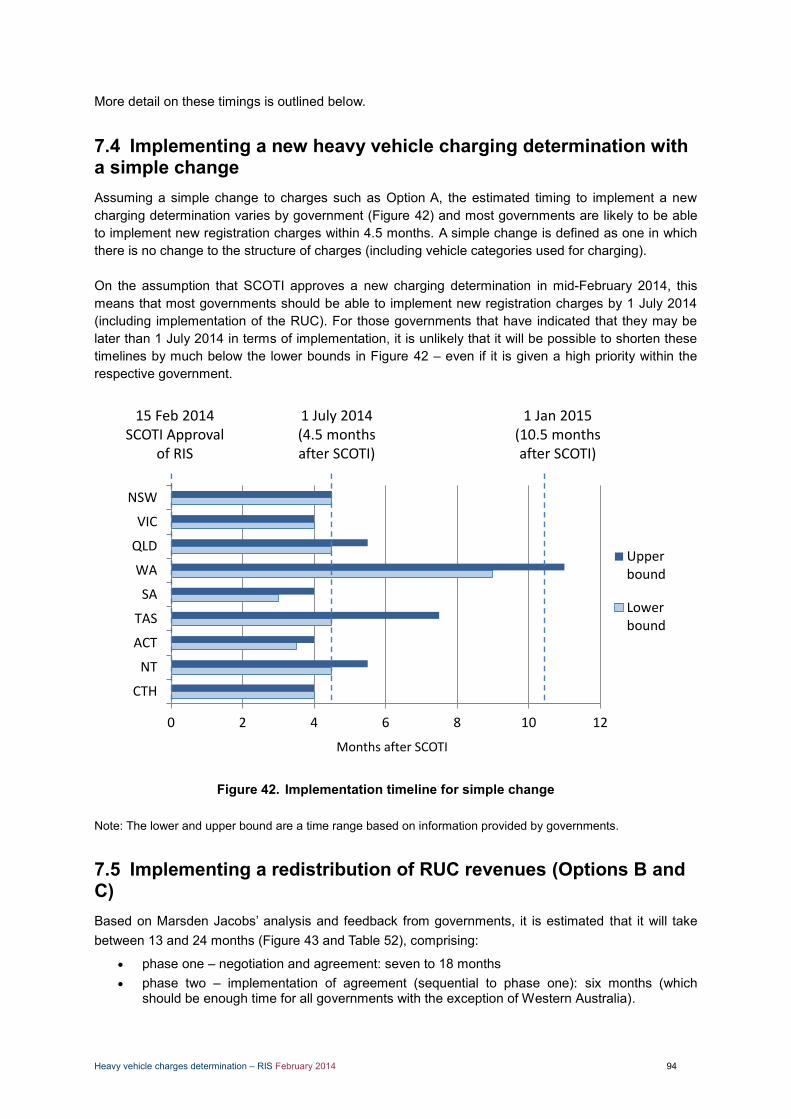
Heavy vehicle charges determination – RIS February 2014 94
More detail on these timings is outlined below.
7.4 Implementing a new heavy vehicle charging determination with a simple change Assuming a simple change to charges such as Option A, the estimated timing to implement a new charging determination varies by government (Figure 42) and most governments are likely to be able to implement new registration charges within 4.5 months. A simple change is defined as one in which there is no change to the structure of charges (including vehicle categories used for charging). On the assumption that SCOTI approves a new charging determination in mid-February 2014, this means that most governments should be able to implement new registration charges by 1 July 2014 (including implementation of the RUC). For those governments that have indicated that they may be later than 1 July 2014 in terms of implementation, it is unlikely that it will be possible to shorten these timelines by much below the lower bounds in Figure 42 – even if it is given a high priority within the respective government.
Figure 42. Implementation timeline for simple change Note: The lower and upper bound are a time range based on information provided by governments.
7.5 Implementing a redistribution of RUC revenues (Options B and C) Based on Marsden Jacobs’ analysis and feedback from governments, it is estimated that it will take between 13 and 24 months (Figure 43 and Table 52), comprising:
phase one – negotiation and agreement: seven to 18 months phase two – implementation of agreement (sequential to phase one): six months (which
should be enough time for all governments with the exception of Western Australia).
0 2 4 6 8 10 12
CTH
NT
ACT
TAS
SA
WA
QLD
VIC
NSW
Upperbound
Lowerbound
15 Feb 2014 SCOTI Approval
of RIS
1 July 2014(4.5 months after SCOTI)
1 Jan 2015(10.5 months after SCOTI)
Months after SCOTI
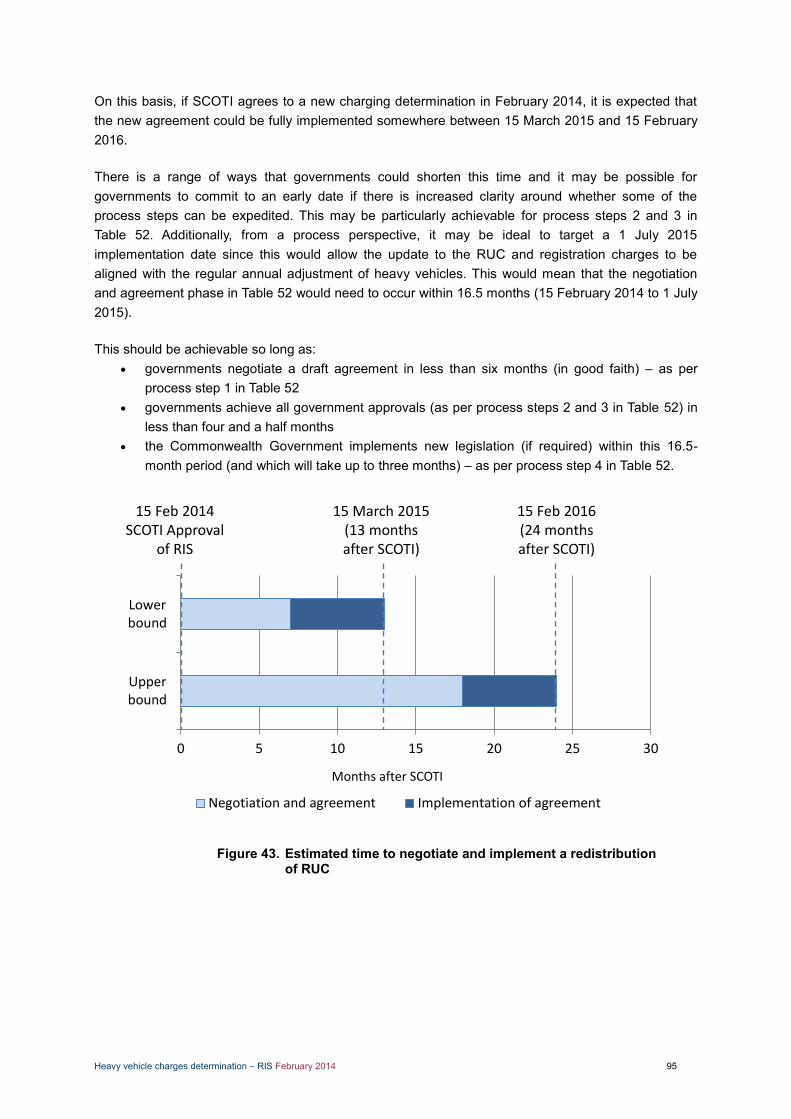
Heavy vehicle charges determination – RIS February 2014 95
On this basis, if SCOTI agrees to a new charging determination in February 2014, it is expected that the new agreement could be fully implemented somewhere between 15 March 2015 and 15 February 2016. There is a range of ways that governments could shorten this time and it may be possible for governments to commit to an early date if there is increased clarity around whether some of the process steps can be expedited. This may be particularly achievable for process steps 2 and 3 in Table 52. Additionally, from a process perspective, it may be ideal to target a 1 July 2015 implementation date since this would allow the update to the RUC and registration charges to be aligned with the regular annual adjustment of heavy vehicles. This would mean that the negotiation and agreement phase in Table 52 would need to occur within 16.5 months (15 February 2014 to 1 July 2015). This should be achievable so long as:
governments negotiate a draft agreement in less than six months (in good faith) – as per process step 1 in Table 52
governments achieve all government approvals (as per process steps 2 and 3 in Table 52) in less than four and a half months
the Commonwealth Government implements new legislation (if required) within this 16.5-month period (and which will take up to three months) – as per process step 4 in Table 52.
Figure 43. Estimated time to negotiate and implement a redistribution of RUC
0 5 10 15 20 25 30
Upperbound
Lowerbound
Negotiation and agreement Implementation of agreement
15 Feb 2014 SCOTI Approval
of RIS
15 Feb 2016(24 months after SCOTI)
15 March 2015(13 months after SCOTI)
Months after SCOTI

Heavy vehicle charges determination – RIS February 2014 96
Process steps and estimated time taken to negotiate and Table 52.implement a redistribution of RUC revenues
Process Estimated timing
PHASE ONE – NEGOTIATION AND AGREEMENT
1. Negotiating a draft financial agreement 3 to 6 months
2. Gaining formal approval within each government 3 to 6 months (sequential to step 1)
3. Gaining coordinated approval from relevant Ministers across governments
1 to 3 months (sequential to step 2)
4. Establishing new financial redistribution arrangements (commonwealth government)
0 to 3 months
PHASE ONE TOTAL 7 to 18 months
PHASE TWO – IMPLEMENTATION OF AGREEMENT (sequential to phase one)
5. Establishing new financial redistribution arrangements (state government)
0 to 3 months
6. Implementing changes to the RUC 4 months
7. Implementing changes to registration charges 6 months
8. Financial payments to state and territory governments 0 months (ongoing)
PHASE TWO TOTAL 6 months (all steps in phase two can theoretically be undertaken simultaneously)
TOTAL 13 to 24 months
In terms of this last point, the Commonwealth Treasury has advised that the need for legislative change will be dependent on the design of the financial arrangements (process step 1). For example, legislation will likely be required if a special appropriation is required in order to source funds from RUC revenue and pass through to state and territory governments. The Commonwealth Treasury will be consulted as part of drafting the final regulatory impact statement (prior to SCOTI consideration in February 2014). Following treasury advice, it may become clearer as to whether the drafting of legislation can begin during the negotiation or approval processes. If the former option is possible a 1 July 2015 date maybe achievable. Achieving implementation by 1 July 2015 will also require tight management of the process for coordinating all First Ministers signing the appropriate agreement – The NTC would expect the Commonwealth Government to manage this process.
Heavy vehicle charges determination – RIS February 2014 97
7.6 Implementing the new NHVR fee The estimated likely timing to implement a separately identified NHVR regulatory portions of registration charges varies by government (Figure 44) and could take as long as 17 months. However, it is plausible that most governments should be able to implement the new NHVR regulatory portions within 10.5 months, allowing for a sequential approach to legislation and business system changes. On the assumption that SCOTI approves a new charging determination in mid-February 2014, most governments should be able to implement separately identified NHVR regulatory portions of registration charges by 1 January 2015. For those governments that have indicated that they may be later than 1 January 2015 in terms of implementation, the following observations can be made:
The ACT Government has indicated that the expected timelines are affected by competing priorities and resourcing constraints. Further investigation with the ACT is recommended to further explore this issue.
The Queensland Government has indicated that their expected timelines for implementing may reduce if the scope of the changes is known as early as possible.
No information was provided by the Western Australia Government since it has not yet signed the NHVR intergovernmental agreement. In order to assist in meeting timelines, the New South Wales Government recommended that the NTC submit a proposal to SCOTI for decision in November 2013 on the manner in which the NHVR fee is to be applied to enable jurisdictions sufficient time to implement the required changes. This approach could be considered to assist the ACT and Queensland in achieving their system changes by 1 January 2015. If the intention is to implement the NHVR fee by 1 July 2014, a potential approach that could be applied in the interim is for the charge to be included in the standard registration charges and not split out the NHVR regulatory portion in the business systems or on invoices.
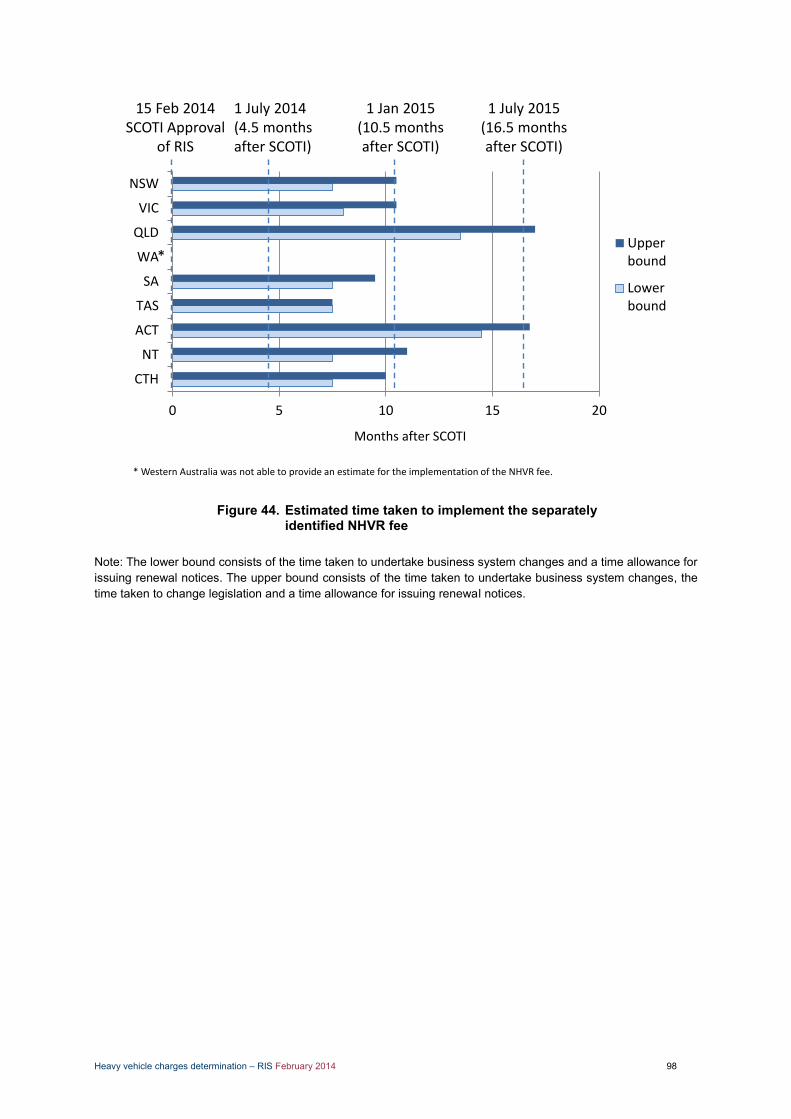
Heavy vehicle charges determination – RIS February 2014 98
Figure 44. Estimated time taken to implement the separately identified NHVR fee
Note: The lower bound consists of the time taken to undertake business system changes and a time allowance for issuing renewal notices. The upper bound consists of the time taken to undertake business system changes, the time taken to change legislation and a time allowance for issuing renewal notices.
0 5 10 15 20
CTH
NT
ACT
TAS
SA
WA
QLD
VIC
NSW
Upperbound
Lowerbound
15 Feb 2014 SCOTI Approval
of RIS
1 July 2014(4.5 months after SCOTI)
1 July 2015(16.5 months after SCOTI)
1 Jan 2015(10.5 months after SCOTI)
Months after SCOTI
*
* Western Australia was not able to provide an estimate for the implementation of the NHVR fee.
Heavy vehicle charges determination – RIS February 2014 99
7.7 Conclusion The NTC is seeking views a the preferred charging option and the most appropriate implementation plan. The NTC recommends the implementation of aseparately identified NHVR fee as soon as possible in each individual jurisdiction.

Heavy vehicle charges determination – RIS February 2014 100
Further reading NTC (December 2007) Heavy Vehicle Charges Determination. Regulatory Impact Statement. http://www.ntc.gov.au/filemedia/Reports/2007HVChargesDetRISVol1Dec2007.pdf NTC (May 2013) Heavy Vehicle Charges Review. Policy Paper. http://www.ntc.gov.au/filemedia/Reports/HVChargesReviewPaperFINALMay2013.pdf Productivity Commission (December 2006) Inquiry into road and rail infrastructure pricing. http://www.pc.gov.au/__data/assets/pdf_file/0003/47532/freight.pdf
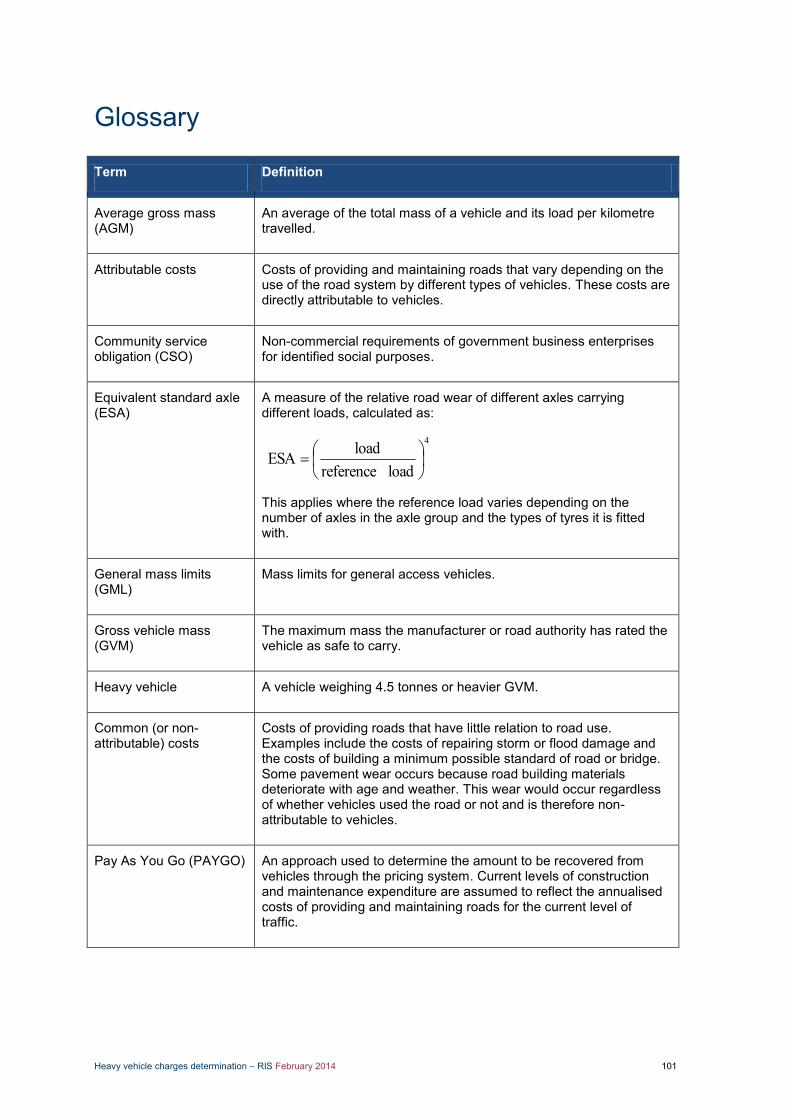
Heavy vehicle charges determination – RIS February 2014 101
Glossary
Term Definition
Average gross mass (AGM)
An average of the total mass of a vehicle and its load per kilometre travelled.
Attributable costs Costs of providing and maintaining roads that vary depending on the use of the road system by different types of vehicles. These costs are directly attributable to vehicles.
Community service obligation (CSO)
Non-commercial requirements of government business enterprises for identified social purposes.
Equivalent standard axle (ESA)
A measure of the relative road wear of different axles carrying different loads, calculated as:
4
load referenceloadESA
This applies where the reference load varies depending on the number of axles in the axle group and the types of tyres it is fitted with.
General mass limits (GML)
Mass limits for general access vehicles.
Gross vehicle mass (GVM)
The maximum mass the manufacturer or road authority has rated the vehicle as safe to carry.
Heavy vehicle A vehicle weighing 4.5 tonnes or heavier GVM.
Common (or non-attributable) costs
Costs of providing roads that have little relation to road use. Examples include the costs of repairing storm or flood damage and the costs of building a minimum possible standard of road or bridge. Some pavement wear occurs because road building materials deteriorate with age and weather. This wear would occur regardless of whether vehicles used the road or not and is therefore non-attributable to vehicles.
Pay As You Go (PAYGO) An approach used to determine the amount to be recovered from vehicles through the pricing system. Current levels of construction and maintenance expenditure are assumed to reflect the annualised costs of providing and maintaining roads for the current level of traffic.
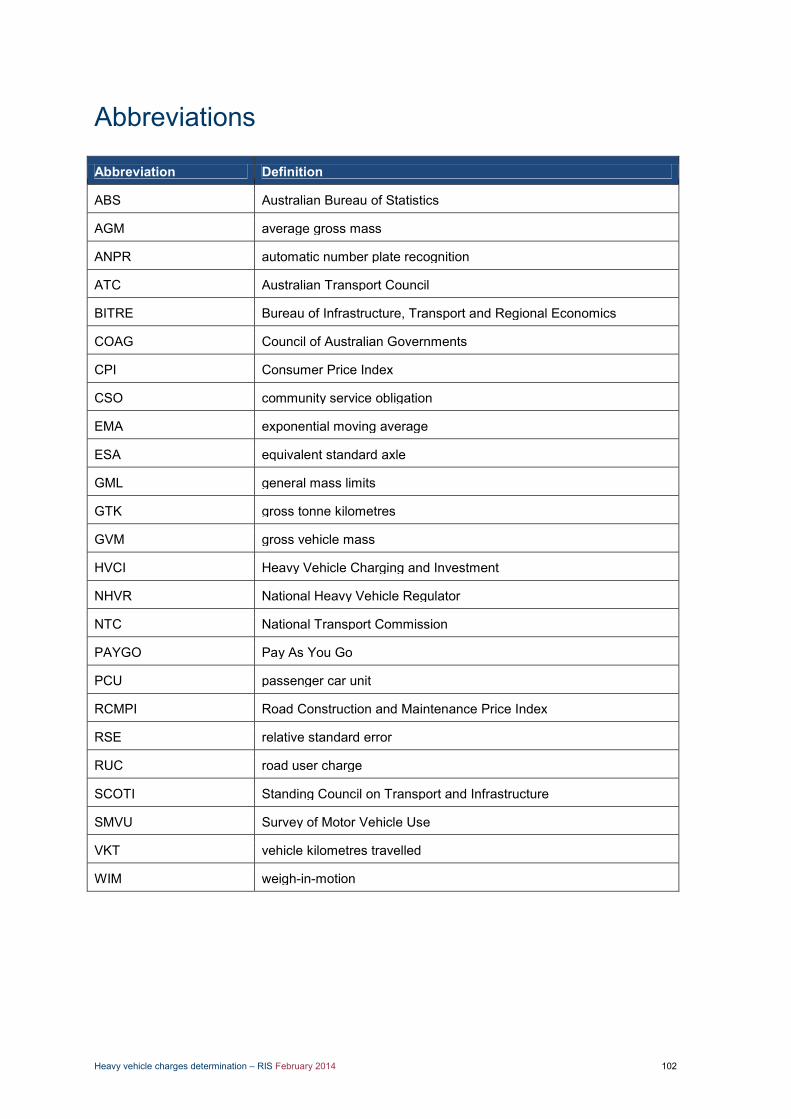
Heavy vehicle charges determination – RIS February 2014 102
Abbreviations
Abbreviation Definition
ABS Australian Bureau of Statistics
AGM average gross mass
ANPR automatic number plate recognition
ATC Australian Transport Council
BITRE Bureau of Infrastructure, Transport and Regional Economics
COAG Council of Australian Governments
CPI Consumer Price Index
CSO community service obligation
EMA exponential moving average
ESA equivalent standard axle
GML general mass limits
GTK gross tonne kilometres
GVM gross vehicle mass
HVCI Heavy Vehicle Charging and Investment
NHVR National Heavy Vehicle Regulator
NTC National Transport Commission
PAYGO Pay As You Go
PCU passenger car unit
RCMPI Road Construction and Maintenance Price Index
RSE relative standard error
RUC road user charge
SCOTI Standing Council on Transport and Infrastructure
SMVU Survey of Motor Vehicle Use
VKT vehicle kilometres travelled
WIM weigh-in-motion

Heavy vehicle charges determination – RIS February 2014 103
APPENDICES Appendix A: Summary of review recommendations
Appendix B: The methodology for calculating the cost base and setting the alpha value
Appendix C: Detailed usage data
Appendix D: Modular calculation – AGM and ESA estimates per individual vehicle units
Appendix E: ESA updates since 2007
Appendix F: Schedule of charges
Appendix G: Attributable Cost Calculations
Appendix H: Annual Adjustment Formula
Appendix I: Case Studies

Heavy vehicle charges determination – RIS February 2014 104
Appendix A: Summary of Review Recommendations
Issue Draft recommendation
Pricing principles While the principles should remain unchanged, in their application:
The interpretation of vehicle class should take account of the modularity of the trailer fleet.
An explanation of how the principles are interpreted should accompany any future charges determination.
With respect to externalities, the view of the NTC is:
Externalities should not be explicitly included in the pricing principles.
Externalities should only be included in the cost base to the extent they are internalised in infrastructure expenditure.
Calculating the cost base
The averaging period of 7 years should be retained. The averaging mechanism should be replaced with an
exponential moving average (EMA) with weightings (alpha value) to be set during the determination process.
Usage data set The use of Survey of Motor Vehicle Use (SMVU) data should be retained for charging purposes.
SMVU data to be trended using a linear regression methodology to the most recent year for charging purposes rather than the current 7-year mid-point.
The NTC to explore with the ABS the cost of conducting the SMVU annually and increasing the sample size to reduce standard errors.
The NTC to continue to monitor SMVU population data to ensure it remains consistent with actual registration data.
Expenditure template The NTC to review and further update the expenditure template in line with Deloitte recommendations and in consultation with stakeholders.
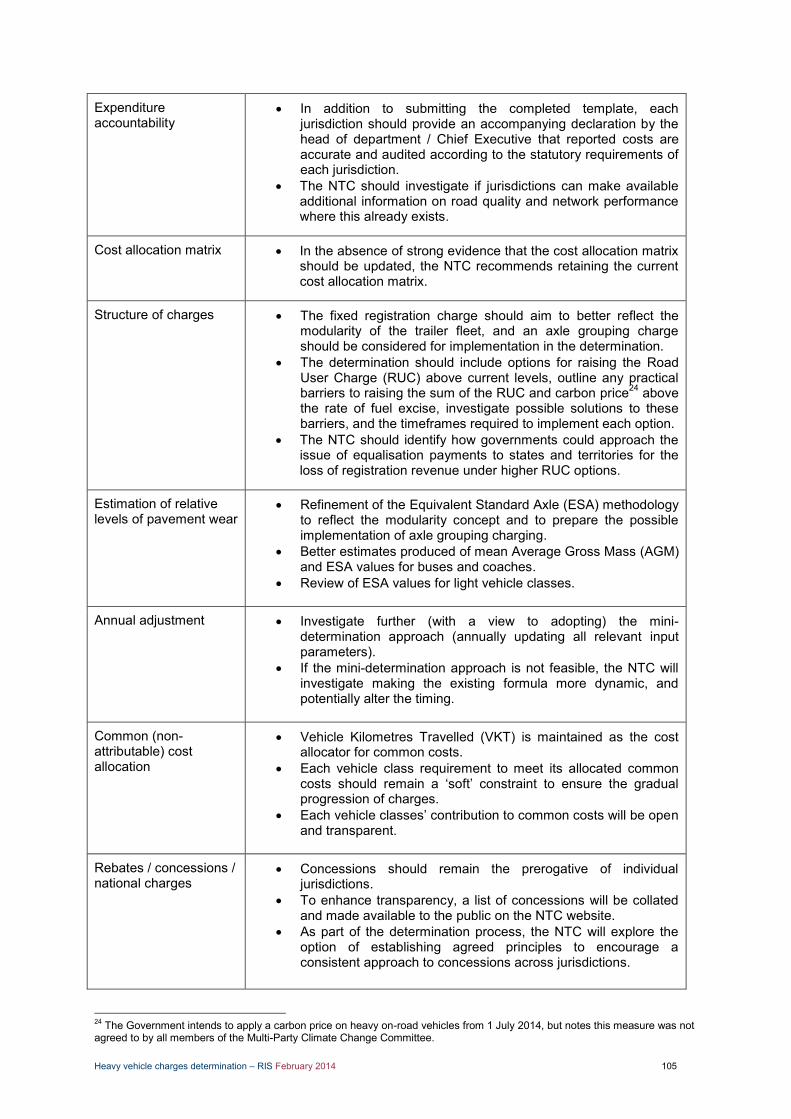
Heavy vehicle charges determination – RIS February 2014 105
Expenditure accountability
In addition to submitting the completed template, each jurisdiction should provide an accompanying declaration by the head of department / Chief Executive that reported costs are accurate and audited according to the statutory requirements of each jurisdiction.
The NTC should investigate if jurisdictions can make available additional information on road quality and network performance where this already exists.
Cost allocation matrix In the absence of strong evidence that the cost allocation matrix should be updated, the NTC recommends retaining the current cost allocation matrix.
Structure of charges The fixed registration charge should aim to better reflect the modularity of the trailer fleet, and an axle grouping charge should be considered for implementation in the determination.
The determination should include options for raising the Road User Charge (RUC) above current levels, outline any practical barriers to raising the sum of the RUC and carbon price24 above the rate of fuel excise, investigate possible solutions to these barriers, and the timeframes required to implement each option.
The NTC should identify how governments could approach the issue of equalisation payments to states and territories for the loss of registration revenue under higher RUC options.
Estimation of relative levels of pavement wear
Refinement of the Equivalent Standard Axle (ESA) methodology to reflect the modularity concept and to prepare the possible implementation of axle grouping charging.
Better estimates produced of mean Average Gross Mass (AGM) and ESA values for buses and coaches.
Review of ESA values for light vehicle classes.
Annual adjustment Investigate further (with a view to adopting) the mini-determination approach (annually updating all relevant input parameters).
If the mini-determination approach is not feasible, the NTC will investigate making the existing formula more dynamic, and potentially alter the timing.
Common (non-attributable) cost allocation
Vehicle Kilometres Travelled (VKT) is maintained as the cost allocator for common costs.
Each vehicle class requirement to meet its allocated common costs should remain a ‘soft’ constraint to ensure the gradual progression of charges.
Each vehicle classes’ contribution to common costs will be open and transparent.
Rebates / concessions / national charges
Concessions should remain the prerogative of individual jurisdictions.
To enhance transparency, a list of concessions will be collated and made available to the public on the NTC website.
As part of the determination process, the NTC will explore the option of establishing agreed principles to encourage a consistent approach to concessions across jurisdictions.
24 The Government intends to apply a carbon price on heavy on-road vehicles from 1 July 2014, but notes this measure was not agreed to by all members of the Multi-Party Climate Change Committee.

Heavy vehicle charges determination – RIS February 2014 106
As part of the determination process, the NTC will explore ways to continue the unsealed road discount for road trains.
NHVR funding Both the regulatory and roads components of the registration charge will be approved by SCOTI as part of the heavy vehicle charges determination.
NHVR costs will be solely recovered via the registration component of heavy vehicle charges.
The G2 cost category is replaced by the NHVR’s costs from 1 July 2014.

Heavy vehicle charges determination – RIS February 2014 107
0
500
1,000
1,500
2,000
2,500
3,000
1995 2000 2005 2010 2015
$' m
illio
n
Original Expenditures in$ million related to HVuse(example)
Appendix B: The methodology for calculating the cost base and setting the alpha value
Methodology used to optimise the cost base calculation
To achieve the best overall outcome, it is necessary to find the alpha value that produces the best outcome measured across the three following objectives:
full cost recovery over time (FCR) limiting over- and under-recoveries (OU) smoothness (SM).
This optimisation across multiple parameters can be simplified by calculating a performance indicator (PI), which is the sum of the absolute values of the three previous parameters (i.e. PI = |FCR| + |OU| + |SM|). The objective then becomes one of minimising the value of the PI. This is achieved through a three-step approach detailed in the following sections.
Characterising historical expenditure data
As introduced in the review, the comparison of different expenditure-averaging methodologies requires a series of annual road expenditure. To relate this expenditure to heavy vehicle usage, the total road expenditure data and usage data for all vehicle classes for the period 1997–2012 has been used to run the NTC cost allocation model on a one-year basis. The data in Table 53 is an estimate of heavy-vehicle-related road expenditure.
Estimate of de-averaged heavy-vehicle-related road Table 53.expenditure (1997 to 2012)
An examination of de-averaged heavy-vehicle-related road expenditure from 1997 to 2012 shows that:
Year
Original expenditures in $ million related to heavy vehicle use (example)
% change (year on year)
1998 1,045
1999 1,083 3.6
2000 1,235 14.0
2001 1,282 3.8
2002 1,302 1.6
2003 1,334 2.5
2004 1,512 13.3
2005 1,602 6.0
2006 1,748 9.1
2007 2,248 28.6
2008 2,353 4.7
2009 2,583 9.8
2010 2,809 8.7
2011 2,642 –5.9
2012 2,814 6.5
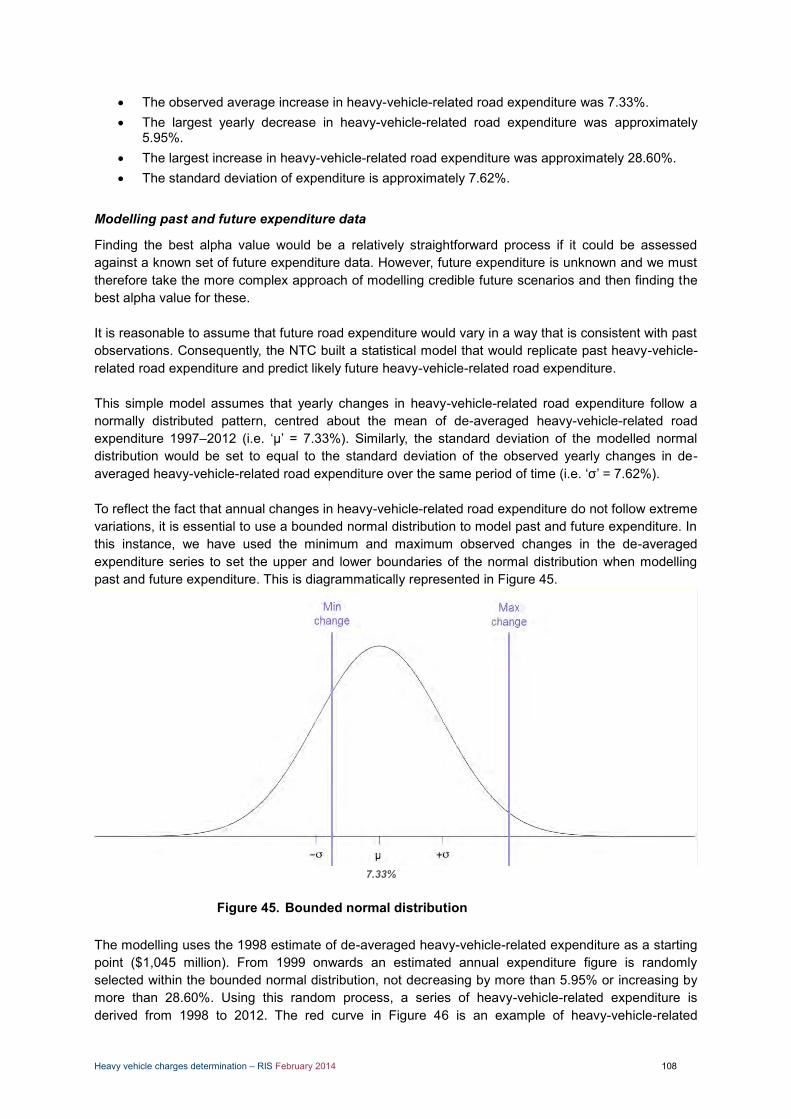
Heavy vehicle charges determination – RIS February 2014 108
The observed average increase in heavy-vehicle-related road expenditure was 7.33%. The largest yearly decrease in heavy-vehicle-related road expenditure was approximately
5.95%. The largest increase in heavy-vehicle-related road expenditure was approximately 28.60%. The standard deviation of expenditure is approximately 7.62%.
Modelling past and future expenditure data
Finding the best alpha value would be a relatively straightforward process if it could be assessed against a known set of future expenditure data. However, future expenditure is unknown and we must therefore take the more complex approach of modelling credible future scenarios and then finding the best alpha value for these. It is reasonable to assume that future road expenditure would vary in a way that is consistent with past observations. Consequently, the NTC built a statistical model that would replicate past heavy-vehicle-related road expenditure and predict likely future heavy-vehicle-related road expenditure. This simple model assumes that yearly changes in heavy-vehicle-related road expenditure follow a normally distributed pattern, centred about the mean of de-averaged heavy-vehicle-related road expenditure 1997–2012 (i.e. ‘μ’ = 7.33%). Similarly, the standard deviation of the modelled normal distribution would be set to equal to the standard deviation of the observed yearly changes in de-averaged heavy-vehicle-related road expenditure over the same period of time (i.e. ‘σ’ = 7.62%). To reflect the fact that annual changes in heavy-vehicle-related road expenditure do not follow extreme variations, it is essential to use a bounded normal distribution to model past and future expenditure. In this instance, we have used the minimum and maximum observed changes in the de-averaged expenditure series to set the upper and lower boundaries of the normal distribution when modelling past and future expenditure. This is diagrammatically represented in Figure 45.
Figure 45. Bounded normal distribution The modelling uses the 1998 estimate of de-averaged heavy-vehicle-related expenditure as a starting point ($1,045 million). From 1999 onwards an estimated annual expenditure figure is randomly selected within the bounded normal distribution, not decreasing by more than 5.95% or increasing by more than 28.60%. Using this random process, a series of heavy-vehicle-related expenditure is derived from 1998 to 2012. The red curve in Figure 46 is an example of heavy-vehicle-related
7.33%
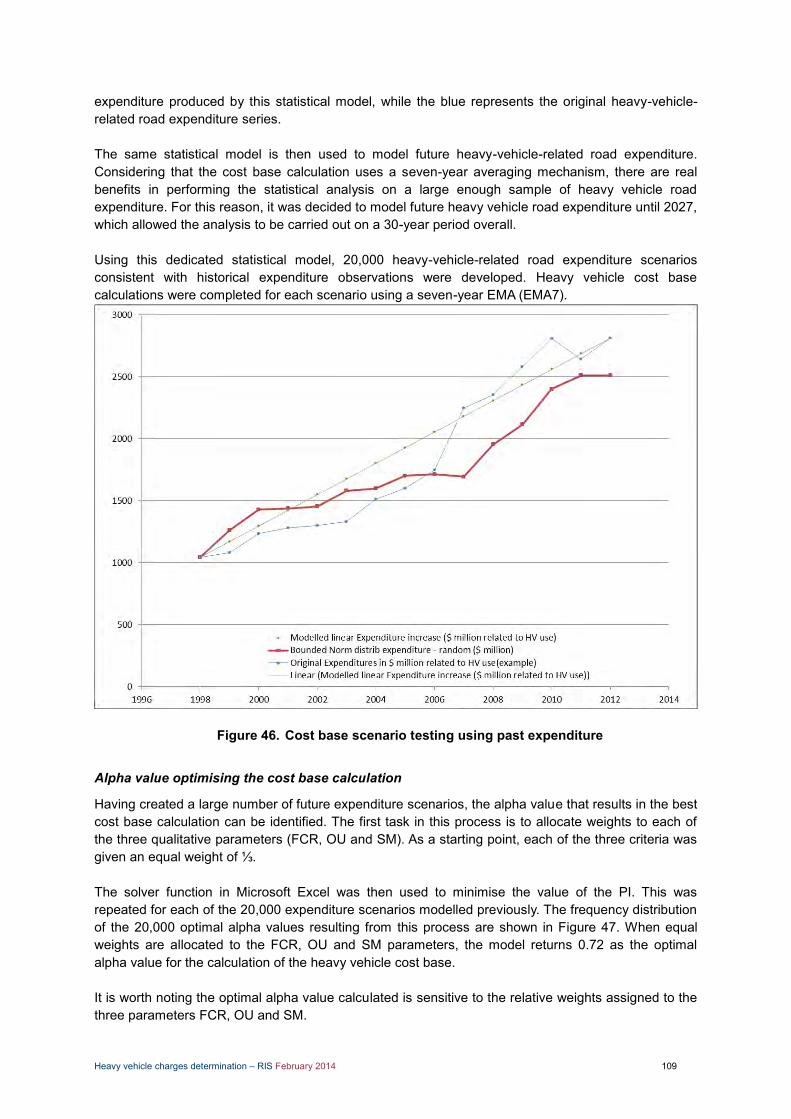
Heavy vehicle charges determination – RIS February 2014 109
expenditure produced by this statistical model, while the blue represents the original heavy-vehicle-related road expenditure series. The same statistical model is then used to model future heavy-vehicle-related road expenditure. Considering that the cost base calculation uses a seven-year averaging mechanism, there are real benefits in performing the statistical analysis on a large enough sample of heavy vehicle road expenditure. For this reason, it was decided to model future heavy vehicle road expenditure until 2027, which allowed the analysis to be carried out on a 30-year period overall. Using this dedicated statistical model, 20,000 heavy-vehicle-related road expenditure scenarios consistent with historical expenditure observations were developed. Heavy vehicle cost base calculations were completed for each scenario using a seven-year EMA (EMA7).
Figure 46. Cost base scenario testing using past expenditure
Alpha value optimising the cost base calculation
Having created a large number of future expenditure scenarios, the alpha value that results in the best cost base calculation can be identified. The first task in this process is to allocate weights to each of the three qualitative parameters (FCR, OU and SM). As a starting point, each of the three criteria was given an equal weight of ⅓. The solver function in Microsoft Excel was then used to minimise the value of the PI. This was repeated for each of the 20,000 expenditure scenarios modelled previously. The frequency distribution of the 20,000 optimal alpha values resulting from this process are shown in Figure 47. When equal weights are allocated to the FCR, OU and SM parameters, the model returns 0.72 as the optimal alpha value for the calculation of the heavy vehicle cost base. It is worth noting the optimal alpha value calculated is sensitive to the relative weights assigned to the three parameters FCR, OU and SM.

Heavy vehicle charges determination – RIS February 2014 110
Figure 47. Frequency distribution of optimal alpha (equal weights) Figure 48 is a stylised example that illustrates that when the weight allocated to the smoothness parameter increases, the value of the SM parameter naturally decreases, unlike the value of both the FCR and OU parameters. As the PI is equal to the sum of the absolute values of these three parameters, the cost base calculation will be optimised at the intersection of the FCR, OU and SM curves.
Figure 48. Trade-off between FCR, OU and SM: a stylised example
0
2
4
6
8
10
12
14
16
18
20
0 0.05 0.1 0.15 0.2 0.25 0.3 0.35 0.4 0.45 0.5 0.55 0.6 0.65 0.7 0.75 0.8 0.85 0.9 0.95 1
Freq
uen
cy (
%)
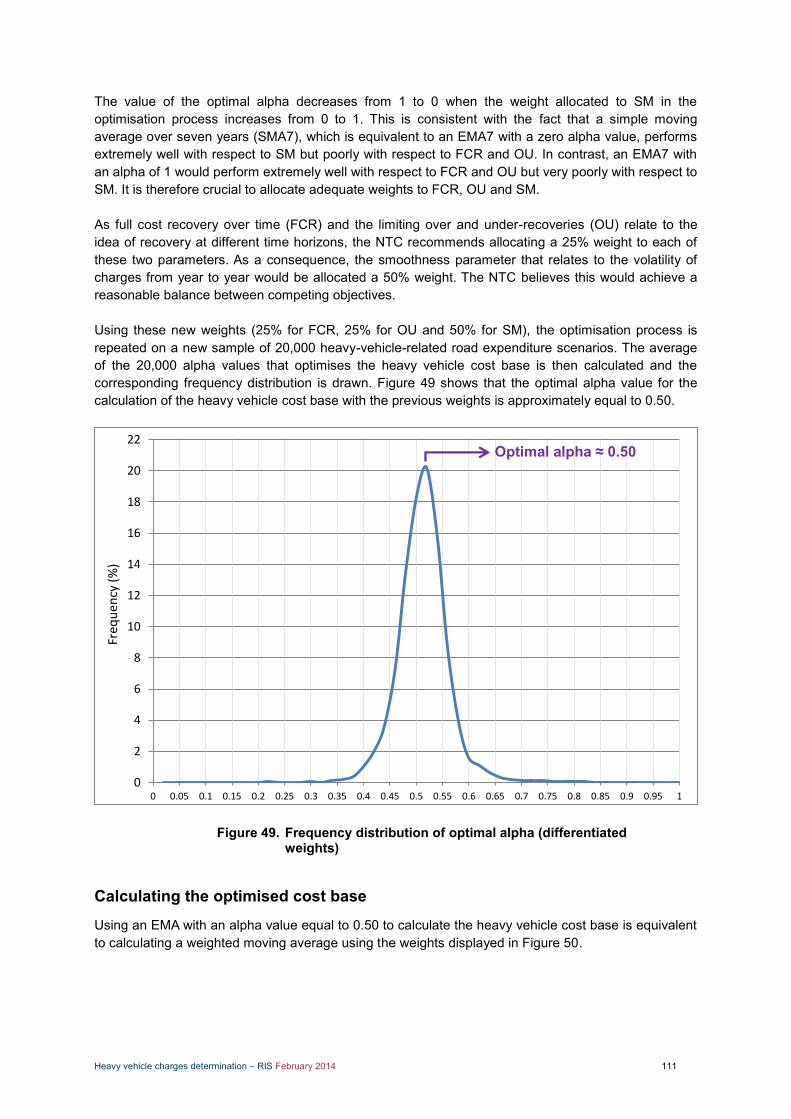
Heavy vehicle charges determination – RIS February 2014 111
The value of the optimal alpha decreases from 1 to 0 when the weight allocated to SM in the optimisation process increases from 0 to 1. This is consistent with the fact that a simple moving average over seven years (SMA7), which is equivalent to an EMA7 with a zero alpha value, performs extremely well with respect to SM but poorly with respect to FCR and OU. In contrast, an EMA7 with an alpha of 1 would perform extremely well with respect to FCR and OU but very poorly with respect to SM. It is therefore crucial to allocate adequate weights to FCR, OU and SM. As full cost recovery over time (FCR) and the limiting over and under-recoveries (OU) relate to the idea of recovery at different time horizons, the NTC recommends allocating a 25% weight to each of these two parameters. As a consequence, the smoothness parameter that relates to the volatility of charges from year to year would be allocated a 50% weight. The NTC believes this would achieve a reasonable balance between competing objectives. Using these new weights (25% for FCR, 25% for OU and 50% for SM), the optimisation process is repeated on a new sample of 20,000 heavy-vehicle-related road expenditure scenarios. The average of the 20,000 alpha values that optimises the heavy vehicle cost base is then calculated and the corresponding frequency distribution is drawn. Figure 49 shows that the optimal alpha value for the calculation of the heavy vehicle cost base with the previous weights is approximately equal to 0.50.
Figure 49. Frequency distribution of optimal alpha (differentiated weights)
Calculating the optimised cost base
Using an EMA with an alpha value equal to 0.50 to calculate the heavy vehicle cost base is equivalent to calculating a weighted moving average using the weights displayed in Figure 50.
0
2
4
6
8
10
12
14
16
18
20
22
0 0.05 0.1 0.15 0.2 0.25 0.3 0.35 0.4 0.45 0.5 0.55 0.6 0.65 0.7 0.75 0.8 0.85 0.9 0.95 1
Freq
uen
cy (
%)
Optimal alpha ≈ 0.50
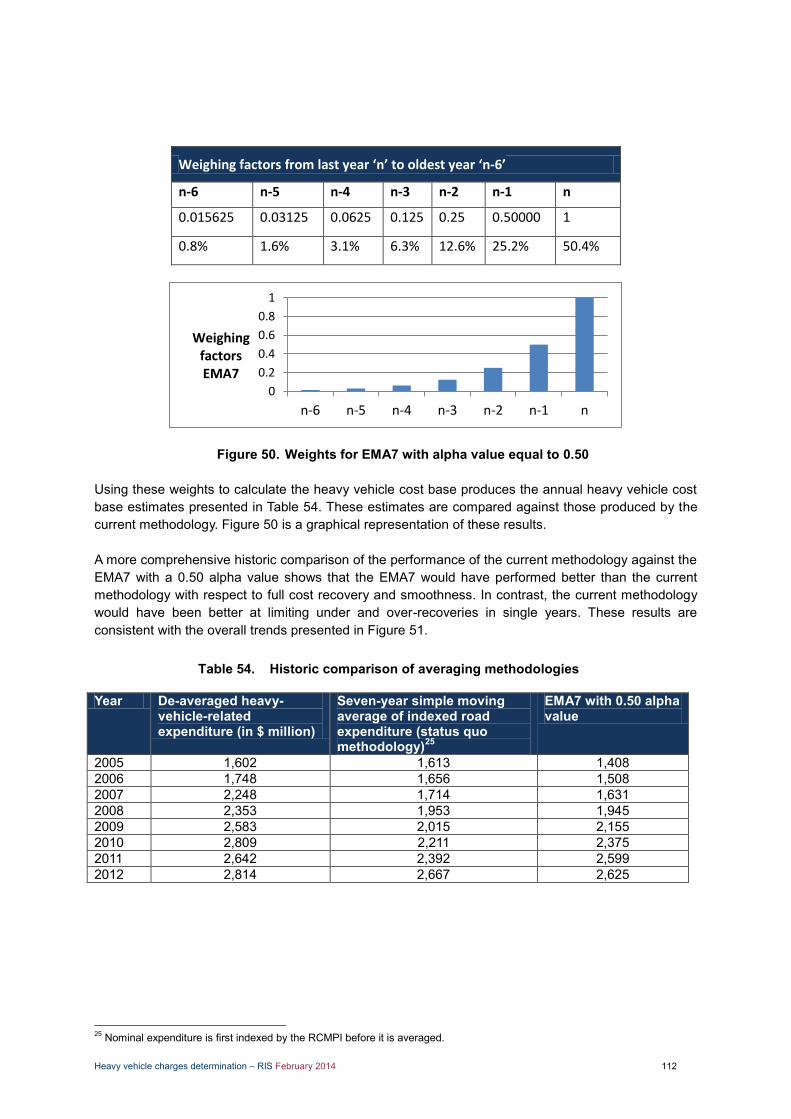
Heavy vehicle charges determination – RIS February 2014 112
Weighing factors from last year ‘n’ to oldest year ‘n-6’
n-6 n-5 n-4 n-3 n-2 n-1 n
0.015625 0.03125 0.0625 0.125 0.25 0.50000 1
0.8% 1.6% 3.1% 6.3% 12.6% 25.2% 50.4%
Figure 50. Weights for EMA7 with alpha value equal to 0.50
Using these weights to calculate the heavy vehicle cost base produces the annual heavy vehicle cost base estimates presented in Table 54. These estimates are compared against those produced by the current methodology. Figure 50 is a graphical representation of these results. A more comprehensive historic comparison of the performance of the current methodology against the EMA7 with a 0.50 alpha value shows that the EMA7 would have performed better than the current methodology with respect to full cost recovery and smoothness. In contrast, the current methodology would have been better at limiting under and over-recoveries in single years. These results are consistent with the overall trends presented in Figure 51.
Historic comparison of averaging methodologies Table 54.
Year De-averaged heavy-vehicle-related expenditure (in $ million)
Seven-year simple moving average of indexed road expenditure (status quo methodology)25
EMA7 with 0.50 alpha value
2005 1,602 1,613 1,408 2006 1,748 1,656 1,508 2007 2,248 1,714 1,631 2008 2,353 1,953 1,945 2009 2,583 2,015 2,155 2010 2,809 2,211 2,375 2011 2,642 2,392 2,599 2012 2,814 2,667 2,625
25 Nominal expenditure is first indexed by the RCMPI before it is averaged.
0
0.2
0.4
0.6
0.8
1
n-6 n-5 n-4 n-3 n-2 n-1 n
Weighing factors EMA7
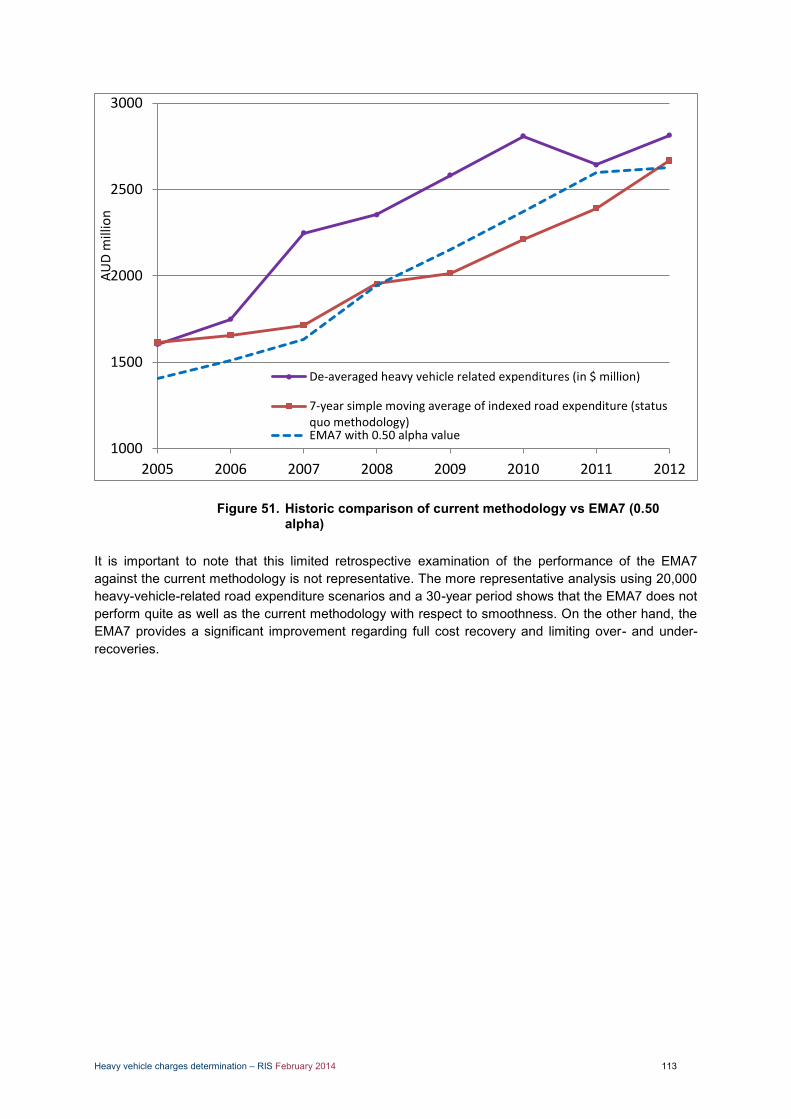
Heavy vehicle charges determination – RIS February 2014 113
Figure 51. Historic comparison of current methodology vs EMA7 (0.50 alpha)
It is important to note that this limited retrospective examination of the performance of the EMA7 against the current methodology is not representative. The more representative analysis using 20,000 heavy-vehicle-related road expenditure scenarios and a 30-year period shows that the EMA7 does not perform quite as well as the current methodology with respect to smoothness. On the other hand, the EMA7 provides a significant improvement regarding full cost recovery and limiting over- and under-recoveries.
1000
1500
2000
2500
3000
2005 2006 2007 2008 2009 2010 2011 2012
AU
D m
illio
n
De-averaged heavy vehicle related expenditures (in $ million)
7-year simple moving average of indexed road expenditure (statusquo methodology)EMA7 with 0.50 alpha value
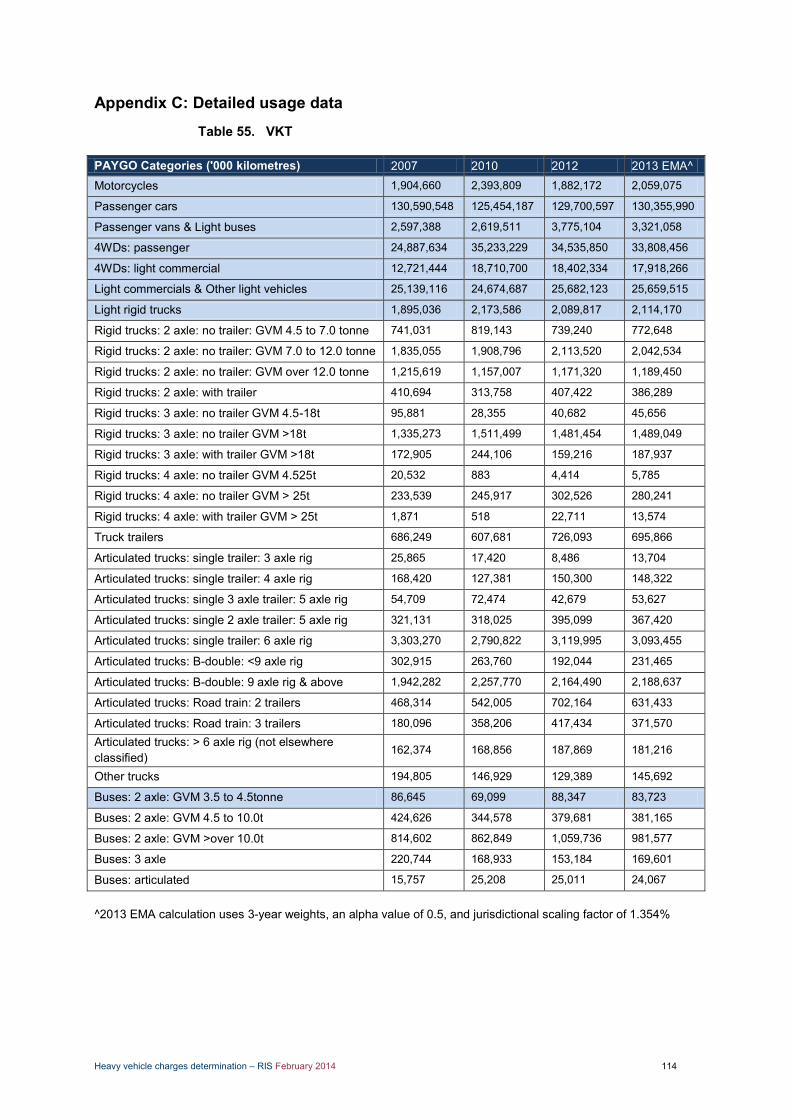
Heavy vehicle charges determination – RIS February 2014 114
Appendix C: Detailed usage data
VKT Table 55.
PAYGO Categories ('000 kilometres) 2007 2010 2012 2013 EMA^ Motorcycles 1,904,660 2,393,809 1,882,172 2,059,075
Passenger cars 130,590,548 125,454,187 129,700,597 130,355,990
Passenger vans & Light buses 2,597,388 2,619,511 3,775,104 3,321,058
4WDs: passenger 24,887,634 35,233,229 34,535,850 33,808,456
4WDs: light commercial 12,721,444 18,710,700 18,402,334 17,918,266
Light commercials & Other light vehicles 25,139,116 24,674,687 25,682,123 25,659,515
Light rigid trucks 1,895,036 2,173,586 2,089,817 2,114,170
Rigid trucks: 2 axle: no trailer: GVM 4.5 to 7.0 tonne 741,031 819,143 739,240 772,648
Rigid trucks: 2 axle: no trailer: GVM 7.0 to 12.0 tonne 1,835,055 1,908,796 2,113,520 2,042,534
Rigid trucks: 2 axle: no trailer: GVM over 12.0 tonne 1,215,619 1,157,007 1,171,320 1,189,450
Rigid trucks: 2 axle: with trailer 410,694 313,758 407,422 386,289
Rigid trucks: 3 axle: no trailer GVM 4.5-18t 95,881 28,355 40,682 45,656
Rigid trucks: 3 axle: no trailer GVM >18t 1,335,273 1,511,499 1,481,454 1,489,049
Rigid trucks: 3 axle: with trailer GVM >18t 172,905 244,106 159,216 187,937
Rigid trucks: 4 axle: no trailer GVM 4.525t 20,532 883 4,414 5,785
Rigid trucks: 4 axle: no trailer GVM > 25t 233,539 245,917 302,526 280,241
Rigid trucks: 4 axle: with trailer GVM > 25t 1,871 518 22,711 13,574
Truck trailers 686,249 607,681 726,093 695,866
Articulated trucks: single trailer: 3 axle rig 25,865 17,420 8,486 13,704
Articulated trucks: single trailer: 4 axle rig 168,420 127,381 150,300 148,322
Articulated trucks: single 3 axle trailer: 5 axle rig 54,709 72,474 42,679 53,627
Articulated trucks: single 2 axle trailer: 5 axle rig 321,131 318,025 395,099 367,420
Articulated trucks: single trailer: 6 axle rig 3,303,270 2,790,822 3,119,995 3,093,455
Articulated trucks: B-double: <9 axle rig 302,915 263,760 192,044 231,465
Articulated trucks: B-double: 9 axle rig & above 1,942,282 2,257,770 2,164,490 2,188,637
Articulated trucks: Road train: 2 trailers 468,314 542,005 702,164 631,433
Articulated trucks: Road train: 3 trailers 180,096 358,206 417,434 371,570
Articulated trucks: > 6 axle rig (not elsewhere classified)
162,374 168,856 187,869 181,216
Other trucks 194,805 146,929 129,389 145,692
Buses: 2 axle: GVM 3.5 to 4.5tonne 86,645 69,099 88,347 83,723
Buses: 2 axle: GVM 4.5 to 10.0t 424,626 344,578 379,681 381,165
Buses: 2 axle: GVM >over 10.0t 814,602 862,849 1,059,736 981,577
Buses: 3 axle 220,744 168,933 153,184 169,601
Buses: articulated 15,757 25,208 25,011 24,067
^2013 EMA calculation uses 3-year weights, an alpha value of 0.5, and jurisdictional scaling factor of 1.354%

Heavy vehicle charges determination – RIS February 2014 115
Vehicle numbers Table 56.
PAYGO categories 2007 2010 2012 2013 EMA^
Motor cycles 383,080 504,969 521,216 503,568
Passenger cars 9,346,435 9,457,565 10,042,555 9,908,342
Passenger vans & Light buses 171,214 229,744 249,153 235,621
4WDs: passenger 1,519,896 2,086,863 1,914,350 1,933,115
4WDs: light commercial 677,484 946,853 996,497 949,424
Light commercials & Other light vehicles 1,443,746 1,408,085 1,557,108 1,518,624
Light rigid trucks 96,777 104,995 105,842 105,717
Rigid trucks: 2 axle: no trailer: GVM 4.5 to 7.0 tonne 45,853 49,859 51,298 50,788
Rigid trucks: 2 axle: no trailer: GVM 7.0 to 12.0 tonne 81,877 94,137 104,465 99,618
Rigid trucks: 2 axle: no trailer: GVM over 12.0 tonne 54,018 56,138 49,188 52,566
Rigid trucks: 2 axle: with trailer 13,604 16,714 15,170 15,596
Rigid trucks: 3 axle: no trailer GVM 4.5-18 2,625 2,775 1,536 2,073
Rigid trucks: 3 axle: no trailer GVM >18 40,420 50,680 54,474 52,078
Rigid trucks: 3 axle: with trailer >18 4,436 6,906 5,060 5,573
Rigid trucks: 4 axle: no trailer GVM 4.5-25 623 416 639 581
Rigid trucks: 4 axle: no trailer GVM >25 6,131 7,717 9,162 8,429
Rigid trucks: 4 axle: with trailer >25 52 108 545 354
Truck trailers 9,760 8,167 10,637 9,939
Articulated trucks: single trailer: 3 axle rig 1,018 694 752 784
Articulated trucks: single trailer: 4 axle rig 3,502 3,740 3,704 3,735
Articulated trucks: single 3 axle trailer: 5 axle rig 962 1,251 1,480 1,359
Articulated trucks: single 2 axle trailer: 5 axle rig 6,476 6,222 7,641 7,165
Articulated trucks: single trailer: 6 axle rig 39,277 39,939 43,630 42,522
Articulated trucks: B-double: <9 axle rig 1,916 1,906 1,415 1,649
Articulated trucks: B-double: 9 axle rig & above 10,454 13,601 12,706 12,811
Articulated trucks: Road train: 2 trailers 4,229 4,874 6,131 5,575
Articulated trucks: Road train: 3 trailers 1,076 2,365 2,822 2,475 Articulated trucks: > 6 axle rig (not elsewhere classified) 1,752 1,620 2,428 2,129
Other trucks 14,403 16,228 14,033 14,912
Buses: 2 axle: GVM 3.5 to 4.5 tonne 4,140 3,763 3,862 3,926
Buses: 2 axle: GVM 4.5 to 10.0 t 14,977 15,414 15,429 15,568
Buses: 2 axle: GVM over 10.0 t 19,413 20,921 23,766 22,634
Buses: 3 axle 2,826 2,150 2,249 2,334
Buses: articulated 431 555 640 594 ^2013 EMA calculation uses three-year weights, an alpha value of 0.5, and jurisdictional scaling factor of 1.354%

Heavy vehicle charges determination – RIS February 2014 116
Fuel use Table 57.
PAYGO categories ('000 litres) 2007 2010 2012 2013 EMA^
Motor cycles 124,068 147,058 110,786 124,713
Passenger cars 14,481,042 13,467,156 13,759,321 13,965,524
Passenger vans & Light buses 354,427 335,910 511,825 445,024
4WDs: passenger 3,283,801 4,631,600 4,314,080 4,315,268
4WDs: light commercial 1,698,336 2,350,651 2,239,179 2,223,470
Light commercials & Other light vehicles 3,275,237 3,279,626 3,349,380 3,363,798
Light rigid trucks 313,306 342,769 307,006 322,432
Rigid trucks: 2 axle: no trailer: GVM 4.5 to 7.0 tonne 148,339 165,392 152,420 157,649
Rigid trucks: 2 axle: no trailer: GVM 7.0 to 12.0 tonne 431,967 436,787 509,402 484,060
Rigid trucks: 2 axle: no trailer: GVM over 12.0 tonne 351,010 322,002 341,223 341,694
Rigid trucks: 2 axle: with trailer 127,267 84,357 120,598 112,702
Rigid trucks: 3 axle: no trailer GVM 4.5-18 35,890 9,515 12,767 15,346
Rigid trucks: 3 axle: no trailer GVM >18 532,549 622,138 602,160 606,020
Rigid trucks: 3 axle: with trailer >18 73,241 96,904 80,319 85,184
Rigid trucks: 4 axle: no trailer GVM 4.5-25 9,064 442 2,156 2,689
Rigid trucks: 4 axle: no trailer GVM >25 101,386 122,613 157,192 141,227
Rigid trucks: 4 axle: with trailer >25 900 287 10,600 6,353
Truck trailers 338,112 315,939 357,246 347,351
Articulated trucks: single trailer: 3 axle rig 9,191 6,661 1,894 4,357
Articulated trucks: single trailer: 4 axle rig 71,552 49,250 60,708 59,782
Articulated trucks: single 3 axle trailer: 5 axle rig 24,056 33,955 16,141 22,664
Articulated trucks: single 2 axle trailer: 5 axle rig 153,941 155,840 199,443 182,929
Articulated trucks: single trailer: 6 axle rig 1,660,674 1,399,050 1,612,219 1,579,335
Articulated trucks: B-double: <9 axle rig 164,076 147,256 105,290 127,380
Articulated trucks: B-double: 9 axle rig & above 1,127,193 1,332,479 1,318,642 1,312,784
Articulated trucks: Road train: 2 trailers 324,392 355,890 484,273 430,503
Articulated trucks: Road train: 3 trailers 145,296 289,876 323,555 292,373 Articulated trucks: > 6 axle rig (not elsewhere classified) 104,354 114,007 133,483 125,433
Other trucks 64,637 51,641 36,875 45,670
Buses: 2 axle: GVM 3.5 to 4.5 tonne 13,276 9,367 12,106 11,646
Buses: 2 axle: GVM 4.5 to 10.0 t 85,044 66,224 72,235 73,327
Buses: 2 axle: GVM over 10.0 t 331,868 364,843 452,264 415,640
Buses: 3 axle 79,781 65,900 58,070 64,267
Buses: articulated 7,678 12,952 13,935 12,933 ^2013 EMA calculation uses three-year weights, an alpha value of 0.5, and jurisdictional scaling factor of 1.354%
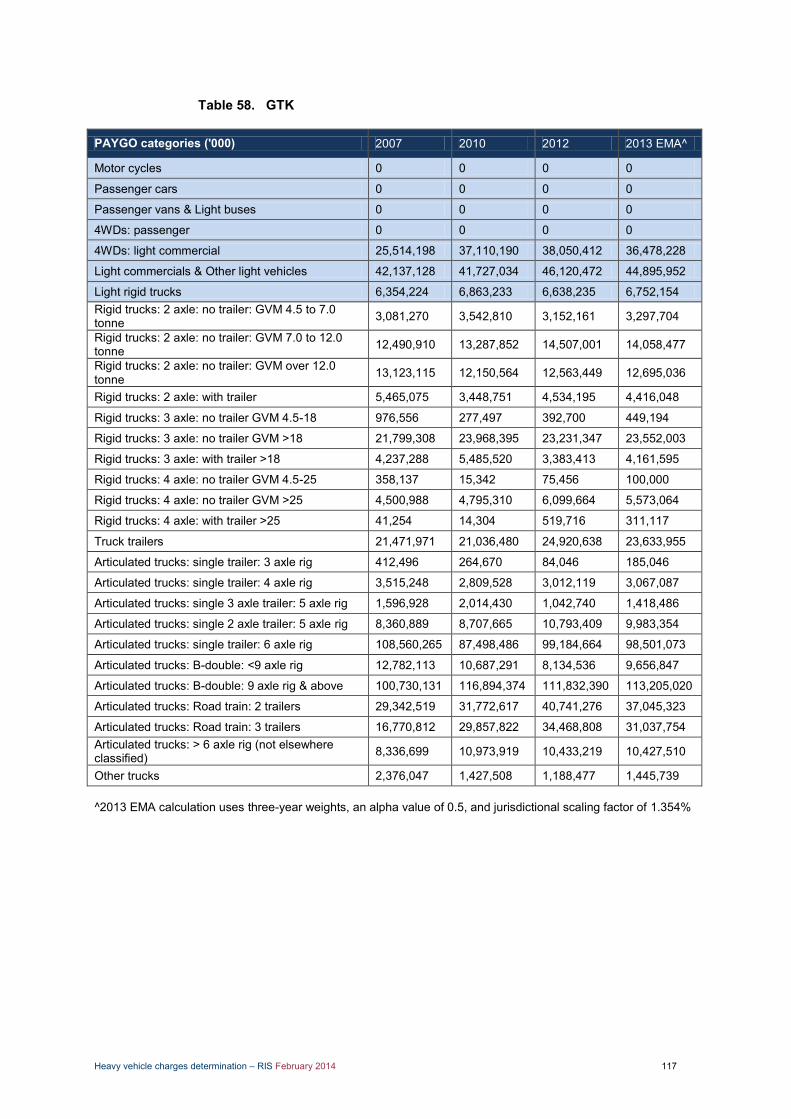
Heavy vehicle charges determination – RIS February 2014 117
GTK Table 58.
PAYGO categories ('000) 2007 2010 2012 2013 EMA^
Motor cycles 0 0 0 0
Passenger cars 0 0 0 0
Passenger vans & Light buses 0 0 0 0
4WDs: passenger 0 0 0 0
4WDs: light commercial 25,514,198 37,110,190 38,050,412 36,478,228
Light commercials & Other light vehicles 42,137,128 41,727,034 46,120,472 44,895,952
Light rigid trucks 6,354,224 6,863,233 6,638,235 6,752,154 Rigid trucks: 2 axle: no trailer: GVM 4.5 to 7.0 tonne 3,081,270 3,542,810 3,152,161 3,297,704
Rigid trucks: 2 axle: no trailer: GVM 7.0 to 12.0 tonne 12,490,910 13,287,852 14,507,001 14,058,477
Rigid trucks: 2 axle: no trailer: GVM over 12.0 tonne 13,123,115 12,150,564 12,563,449 12,695,036
Rigid trucks: 2 axle: with trailer 5,465,075 3,448,751 4,534,195 4,416,048
Rigid trucks: 3 axle: no trailer GVM 4.5-18 976,556 277,497 392,700 449,194
Rigid trucks: 3 axle: no trailer GVM >18 21,799,308 23,968,395 23,231,347 23,552,003
Rigid trucks: 3 axle: with trailer >18 4,237,288 5,485,520 3,383,413 4,161,595
Rigid trucks: 4 axle: no trailer GVM 4.5-25 358,137 15,342 75,456 100,000
Rigid trucks: 4 axle: no trailer GVM >25 4,500,988 4,795,310 6,099,664 5,573,064
Rigid trucks: 4 axle: with trailer >25 41,254 14,304 519,716 311,117
Truck trailers 21,471,971 21,036,480 24,920,638 23,633,955
Articulated trucks: single trailer: 3 axle rig 412,496 264,670 84,046 185,046
Articulated trucks: single trailer: 4 axle rig 3,515,248 2,809,528 3,012,119 3,067,087
Articulated trucks: single 3 axle trailer: 5 axle rig 1,596,928 2,014,430 1,042,740 1,418,486
Articulated trucks: single 2 axle trailer: 5 axle rig 8,360,889 8,707,665 10,793,409 9,983,354
Articulated trucks: single trailer: 6 axle rig 108,560,265 87,498,486 99,184,664 98,501,073
Articulated trucks: B-double: <9 axle rig 12,782,113 10,687,291 8,134,536 9,656,847
Articulated trucks: B-double: 9 axle rig & above 100,730,131 116,894,374 111,832,390 113,205,020
Articulated trucks: Road train: 2 trailers 29,342,519 31,772,617 40,741,276 37,045,323
Articulated trucks: Road train: 3 trailers 16,770,812 29,857,822 34,468,808 31,037,754 Articulated trucks: > 6 axle rig (not elsewhere classified) 8,336,699 10,973,919 10,433,219 10,427,510
Other trucks 2,376,047 1,427,508 1,188,477 1,445,739 ^2013 EMA calculation uses three-year weights, an alpha value of 0.5, and jurisdictional scaling factor of 1.354%

Heavy vehicle charges determination – RIS February 2014 118
Appendix D: Modular ESA calculations
Pig trailers
Converter dolly trailers
Pig Trailer 1 SADT
Class Number Mass ESA
4 14,513 1.95 0.0624
7 8,506 3.79 0.1513
10 383 3.69 0.1296
Average 2.65 0.0958
Pig Trailer 1 TADT
Class Number Mass ESA
4 29,818 3.45 0.0475
7 93,706 7.51 0.3291
10 3,450 6.56 0.1624
Average 6.53 0.2584
Pig Trailer 1 TRDT
Class Number Mass ESA
4 7,426 4.12 0.0211
7 225,952 10.27 0.2783
10 1,087 10.05 0.2201
Average 10.07 0.2699
Converter dolly 1 TADT
Class Number Mass ESA
20/12222 4,414 9.64 0.5610
20/12322 2,150 7.75 0.3357
20/12323 44,211 9.53 0.5047
21/1232323 89,838 9.39 0.4474
Average 9.42 0.4673
Converter dolly 1 TRDT
Class Number Mass ESA
21/1233333 12,004 10.35 0.2817
21/1333333 24,274 10.60 0.2906
Average 10.52 0.2876
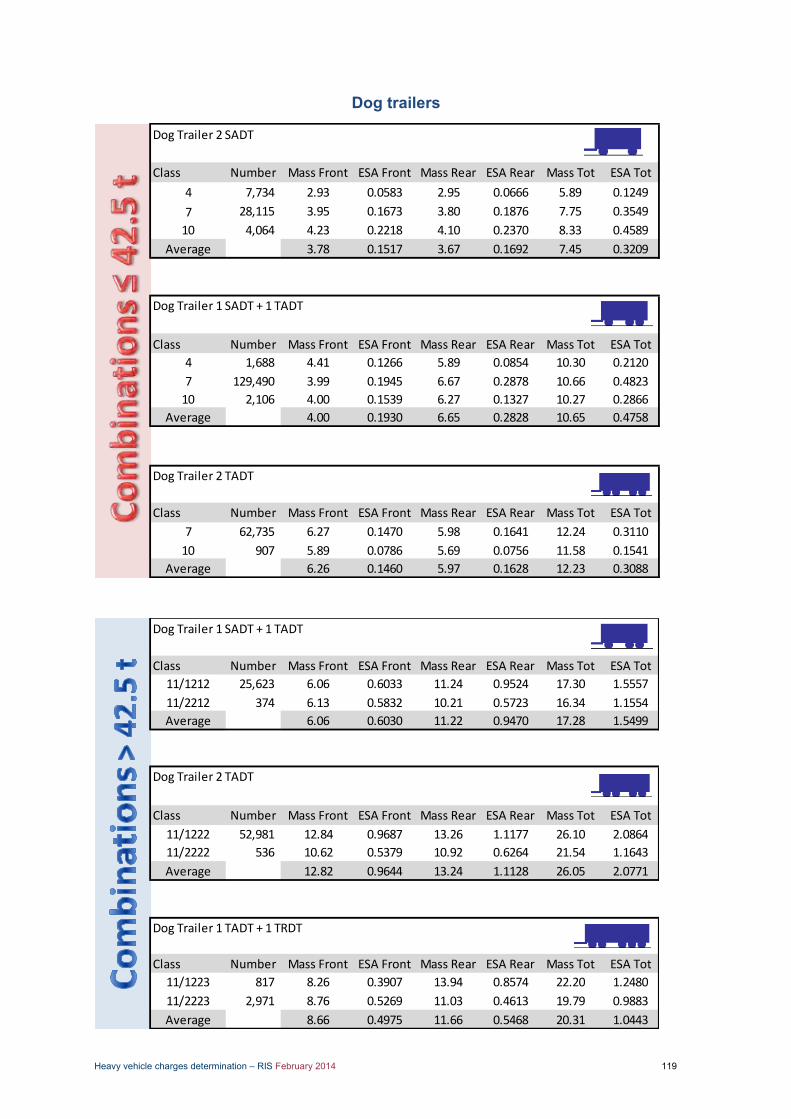
Heavy vehicle charges determination – RIS February 2014 119
Dog trailers
Dog Trailer 2 SADT
Class Number Mass Front ESA Front Mass Rear ESA Rear Mass Tot ESA Tot
4 7,734 2.93 0.0583 2.95 0.0666 5.89 0.1249
7 28,115 3.95 0.1673 3.80 0.1876 7.75 0.3549
10 4,064 4.23 0.2218 4.10 0.2370 8.33 0.4589
Average 3.78 0.1517 3.67 0.1692 7.45 0.3209
Dog Trailer 1 SADT + 1 TADT
Class Number Mass Front ESA Front Mass Rear ESA Rear Mass Tot ESA Tot
4 1,688 4.41 0.1266 5.89 0.0854 10.30 0.2120
7 129,490 3.99 0.1945 6.67 0.2878 10.66 0.4823
10 2,106 4.00 0.1539 6.27 0.1327 10.27 0.2866
Average 4.00 0.1930 6.65 0.2828 10.65 0.4758
Dog Trailer 2 TADT
Class Number Mass Front ESA Front Mass Rear ESA Rear Mass Tot ESA Tot
7 62,735 6.27 0.1470 5.98 0.1641 12.24 0.3110
10 907 5.89 0.0786 5.69 0.0756 11.58 0.1541
Average 6.26 0.1460 5.97 0.1628 12.23 0.3088
Dog Trailer 1 SADT + 1 TADT
Class Number Mass Front ESA Front Mass Rear ESA Rear Mass Tot ESA Tot
11/1212 25,623 6.06 0.6033 11.24 0.9524 17.30 1.5557
11/2212 374 6.13 0.5832 10.21 0.5723 16.34 1.1554
Average 6.06 0.6030 11.22 0.9470 17.28 1.5499
Dog Trailer 2 TADT
Class Number Mass Front ESA Front Mass Rear ESA Rear Mass Tot ESA Tot
11/1222 52,981 12.84 0.9687 13.26 1.1177 26.10 2.0864
11/2222 536 10.62 0.5379 10.92 0.6264 21.54 1.1643
Average 12.82 0.9644 13.24 1.1128 26.05 2.0771
Dog Trailer 1 TADT + 1 TRDT
Class Number Mass Front ESA Front Mass Rear ESA Rear Mass Tot ESA Tot
11/1223 817 8.26 0.3907 13.94 0.8574 22.20 1.2480
11/2223 2,971 8.76 0.5269 11.03 0.4613 19.79 0.9883
Average 8.66 0.4975 11.66 0.5468 20.31 1.0443

Heavy vehicle charges determination – RIS February 2014 120
Semitrailers
Tag trailer 1 SADT
Class Number Mass ESA
12 71,178 4.40 0.2070
13/121 15,577 4.62 0.2435
Average 4.44 0.2136
Tag trailer 1 TADT
Class Number Mass ESA
13/112 123,485 7.57 0.1935
15 307,373 8.88 0.3445
17/1122 12,499 7.61 0.1285
17/1222 119,786 9.13 0.5326
17/1232 37,569 7.28 0.3336
20/12222 8,827 9.83 0.5810
20/12322 2,150 8.06 0.4655
Average 8.55 0.3496
Tag trailer 1 TRDT
Class Number Mass ESA
14 9,292 9.21 0.1397
16 1,632,328 12.45 0.4495
17/1223 34,409 11.49 0.3306
18 676,484 13.24 0.5267
19 27,617 11.65 0.4416
20/12323 88,422 12.42 0.4680
21/1232323 134,757 11.26 0.3143
21/1233333 18,006 10.05 0.2997
21/1333333 36,411 10.37 0.9186
Average 12.51 0.4656
Tag trailer 1 QADT
Class Number Mass ESA
22 3,582 15.08 0.3943
Average 15.08 0.3943
Lead/A trailer 1 TADT
Class Number Mass ESA
17/1122 12,499 9.11 0.2396
17/1222 119,787 9.77 0.5546
17/1223 34,409 10.69 0.6118
Average 9.91 0.5428
Lead/A trailer 1 TRDT
Class Number Mass ESA
17/1232 37,570 11.90 0.3733
18 676,484 14.33 0.6010
19 55,234 12.08 0.4436
Average 14.05 0.5786
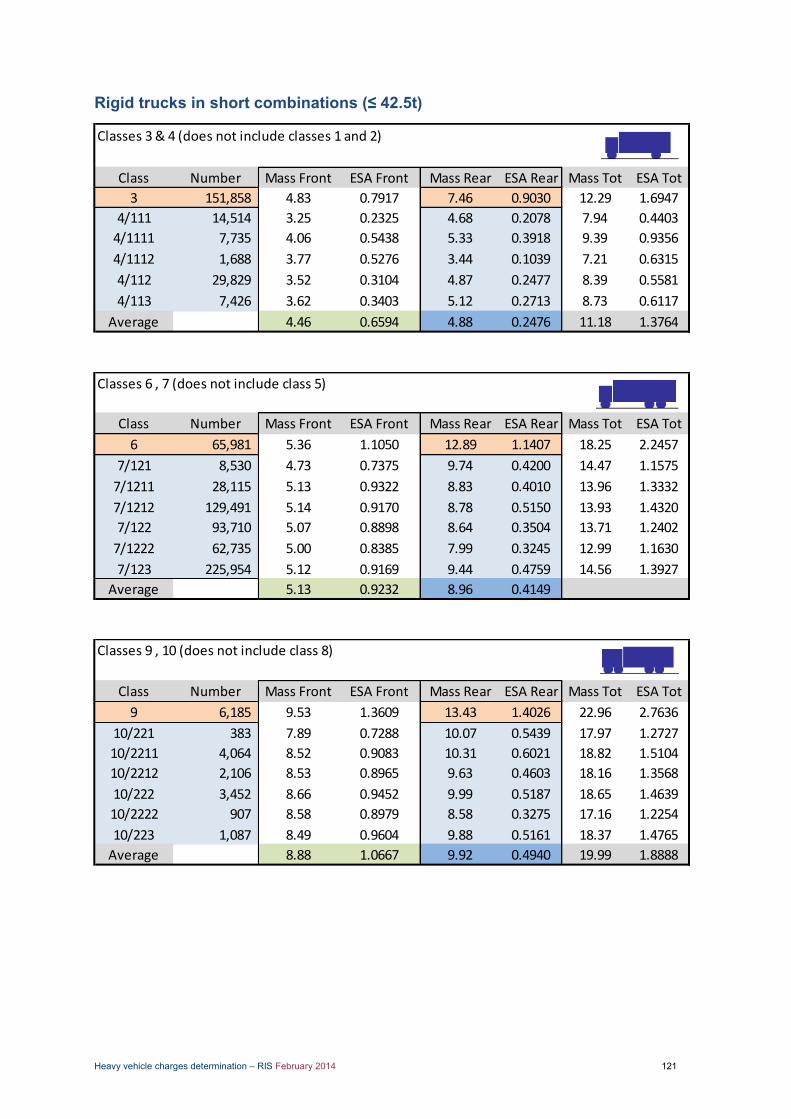
Heavy vehicle charges determination – RIS February 2014 121
Rigid trucks in short combinations (≤ 42.5t)
Classes 3 & 4 (does not include classes 1 and 2)
Class Number Mass Front ESA Front Mass Rear ESA Rear Mass Tot ESA Tot
3 151,858 4.83 0.7917 7.46 0.9030 12.29 1.6947
4/111 14,514 3.25 0.2325 4.68 0.2078 7.94 0.4403
4/1111 7,735 4.06 0.5438 5.33 0.3918 9.39 0.9356
4/1112 1,688 3.77 0.5276 3.44 0.1039 7.21 0.6315
4/112 29,829 3.52 0.3104 4.87 0.2477 8.39 0.5581
4/113 7,426 3.62 0.3403 5.12 0.2713 8.73 0.6117
Average 4.46 0.6594 4.88 0.2476 11.18 1.3764
Classes 6 , 7 (does not include class 5)
Class Number Mass Front ESA Front Mass Rear ESA Rear Mass Tot ESA Tot
6 65,981 5.36 1.1050 12.89 1.1407 18.25 2.2457
7/121 8,530 4.73 0.7375 9.74 0.4200 14.47 1.1575
7/1211 28,115 5.13 0.9322 8.83 0.4010 13.96 1.3332
7/1212 129,491 5.14 0.9170 8.78 0.5150 13.93 1.4320
7/122 93,710 5.07 0.8898 8.64 0.3504 13.71 1.2402
7/1222 62,735 5.00 0.8385 7.99 0.3245 12.99 1.1630
7/123 225,954 5.12 0.9169 9.44 0.4759 14.56 1.3927
Average 5.13 0.9232 8.96 0.4149
Classes 9 , 10 (does not include class 8)
Class Number Mass Front ESA Front Mass Rear ESA Rear Mass Tot ESA Tot
9 6,185 9.53 1.3609 13.43 1.4026 22.96 2.7636
10/221 383 7.89 0.7288 10.07 0.5439 17.97 1.2727
10/2211 4,064 8.52 0.9083 10.31 0.6021 18.82 1.5104
10/2212 2,106 8.53 0.8965 9.63 0.4603 18.16 1.3568
10/222 3,452 8.66 0.9452 9.99 0.5187 18.65 1.4639
10/2222 907 8.58 0.8979 8.58 0.3275 17.16 1.2254
10/223 1,087 8.49 0.9604 9.88 0.5161 18.37 1.4765
Average 8.88 1.0667 9.92 0.4940 19.99 1.8888

Heavy vehicle charges determination – RIS February 2014 122
Rigid trucks in medium combinations (> 42.5t)
Short-combination prime movers (hauling one trailer only)
Class 11 - 3 axles
Class Number Mass Front ESA Front Mass Rear ESA Rear Mass Tot ESA Tot
11/1212 25,623 5.53 1.2012 13.00 1.3881 18.53 2.5893
11/1222 52,981 5.54 1.2000 14.67 1.5502 20.21 2.7501
11/1223 817 5.17 0.9928 9.46 0.4413 14.63 1.4340
Average 5.53 1.1982 14.07 1.4865 19.61 2.6847
Class 11 - 4 axles
Class Number Mass Front ESA Front Mass Rear ESA Rear Mass Tot ESA Tot
11/2212 374 9.37 1.2433 12.96 1.1553 22.33 2.3986
11/2222 536 9.72 1.3887 13.20 1.1514 22.92 2.5401
11/2223 2,971 8.65 0.9965 9.52 0.6861 18.18 1.6826
Average 8.87 1.0745 10.36 0.7956 19.23 1.8700
Prime mover 2 axles
Class Number Mass Front ESA Front Mass Rear ESA Rear Mass Tot ESA Tot
12/111 71,178 3.78 0.3774 5.35 0.2986 9.14 0.6760
13/112 123,485 4.80 0.7582 6.19 0.4842 10.99 1.2424
14/113 9,292 4.96 0.8317 6.19 0.4849 11.16 1.3166
Average 4.45 0.6286 5.90 0.4195 10.35 1.0481
Prime mover 3 axles
Class Number Mass Front ESA Front Mass Rear ESA Rear Mass Tot ESA Tot
13/121 15,577 4.74 0.7054 9.86 0.4427 14.59 1.1481
15/122 307,373 5.10 0.9031 9.58 0.3771 14.68 1.2802
16/123 1,632,328 5.25 0.9891 11.13 0.7210 16.39 1.7100
Average 5.23 0.9733 10.88 0.6647 16.10 1.6380
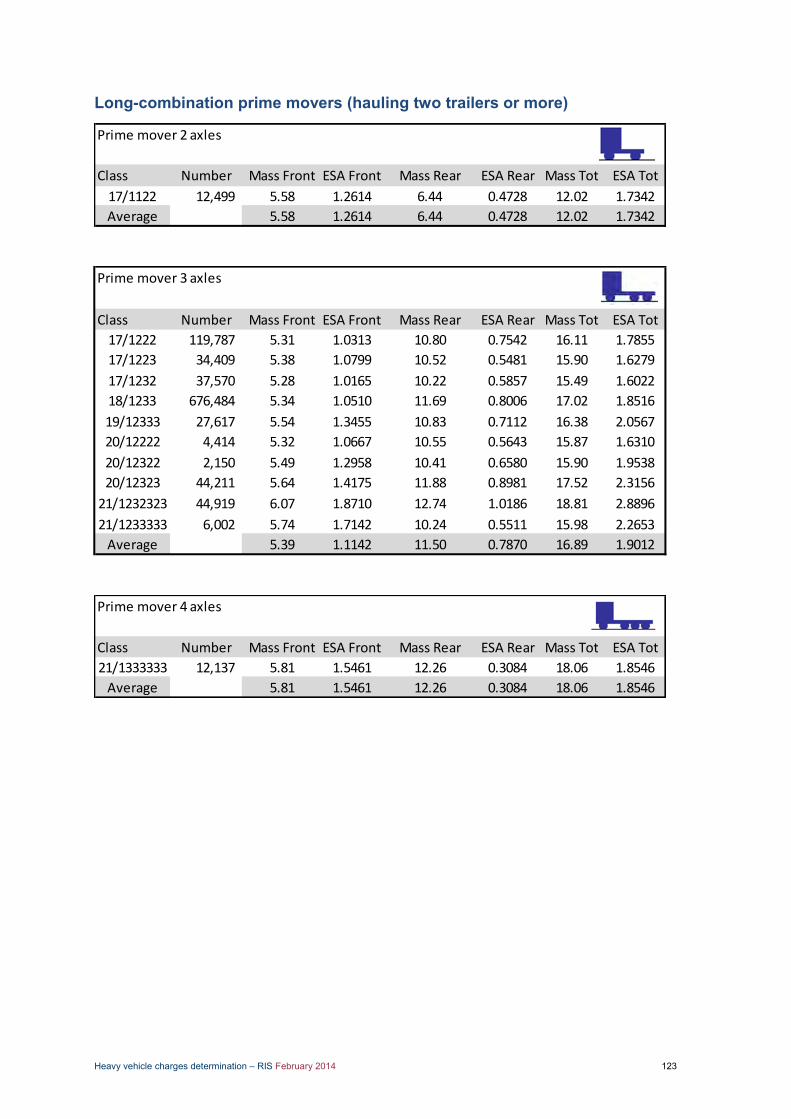
Heavy vehicle charges determination – RIS February 2014 123
Long-combination prime movers (hauling two trailers or more)
Prime mover 2 axles
Class Number Mass Front ESA Front Mass Rear ESA Rear Mass Tot ESA Tot
17/1122 12,499 5.58 1.2614 6.44 0.4728 12.02 1.7342
Average 5.58 1.2614 6.44 0.4728 12.02 1.7342
Prime mover 3 axles
Class Number Mass Front ESA Front Mass Rear ESA Rear Mass Tot ESA Tot
17/1222 119,787 5.31 1.0313 10.80 0.7542 16.11 1.7855
17/1223 34,409 5.38 1.0799 10.52 0.5481 15.90 1.6279
17/1232 37,570 5.28 1.0165 10.22 0.5857 15.49 1.6022
18/1233 676,484 5.34 1.0510 11.69 0.8006 17.02 1.8516
19/12333 27,617 5.54 1.3455 10.83 0.7112 16.38 2.0567
20/12222 4,414 5.32 1.0667 10.55 0.5643 15.87 1.6310
20/12322 2,150 5.49 1.2958 10.41 0.6580 15.90 1.9538
20/12323 44,211 5.64 1.4175 11.88 0.8981 17.52 2.3156
21/1232323 44,919 6.07 1.8710 12.74 1.0186 18.81 2.8896
21/1233333 6,002 5.74 1.7142 10.24 0.5511 15.98 2.2653
Average 5.39 1.1142 11.50 0.7870 16.89 1.9012
Prime mover 4 axles
Class Number Mass Front ESA Front Mass Rear ESA Rear Mass Tot ESA Tot
21/1333333 12,137 5.81 1.5461 12.26 0.3084 18.06 1.8546
Average 5.81 1.5461 12.26 0.3084 18.06 1.8546
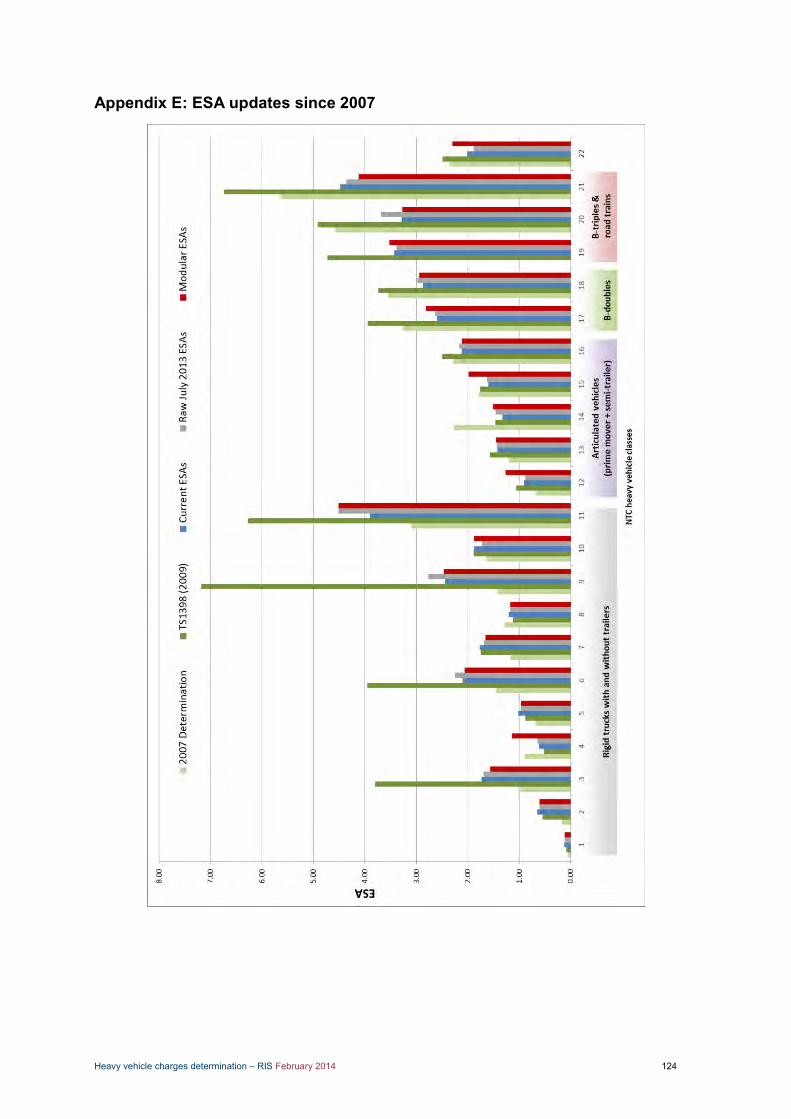
Heavy vehicle charges determination – RIS February 2014 124
Appendix E: ESA updates since 2007
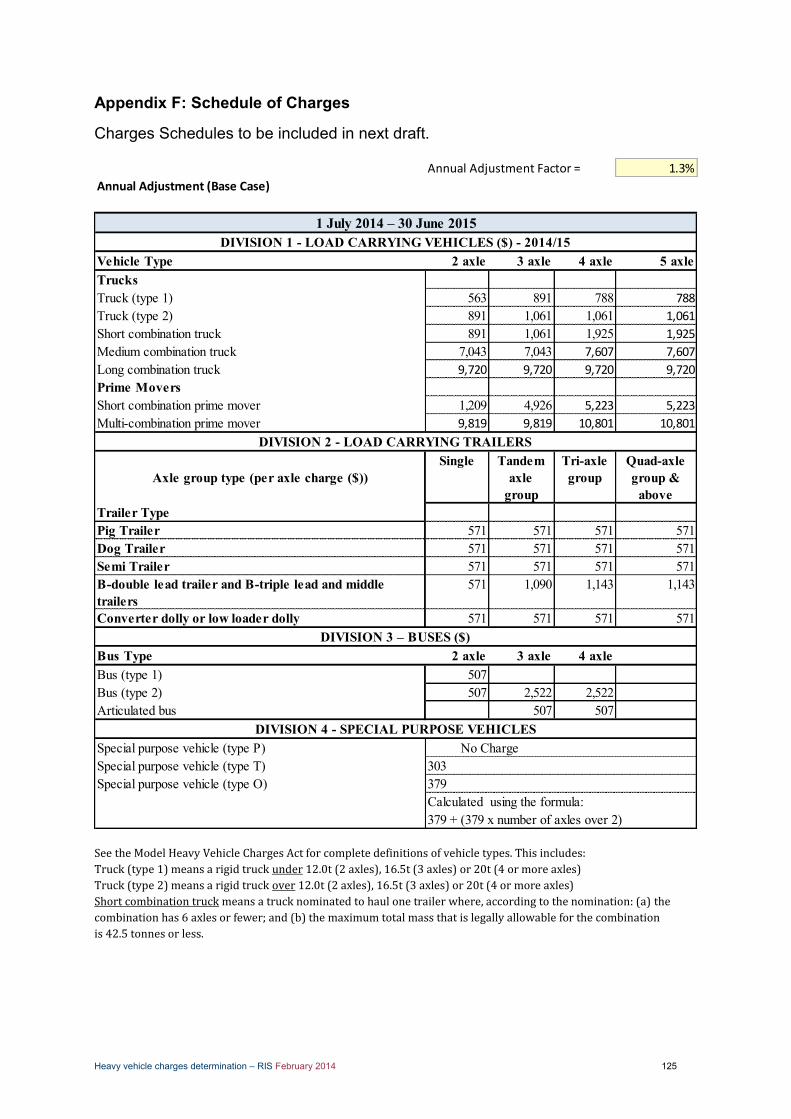
Heavy vehicle charges determination – RIS February 2014 125
Appendix F: Schedule of Charges Charges Schedules to be included in next draft.
See the Model Heavy Vehicle Charges Act for complete definitions of vehicle types. This includes:
Truck (type 1) means a rigid truck under 12.0t (2 axles), 16.5t (3 axles) or 20t (4 or more axles)
Truck (type 2) means a rigid truck over 12.0t (2 axles), 16.5t (3 axles) or 20t (4 or more axles)
Short combination truck means a truck nominated to haul one trailer where, according to the nomination: (a) the
combination has 6 axles or fewer; and (b) the maximum total mass that is legally allowable for the combination
is 42.5 tonnes or less.
Annual Adjustment Factor = 1.3%
Annual Adjustment (Base Case)
Vehicle Type 2 axle 3 axle 4 axle 5 axleTrucksTruck (type 1) 563 891 788 788
Truck (type 2) 891 1,061 1,061 1,061
Short combination truck 891 1,061 1,925 1,925
Medium combination truck 7,043 7,043 7,607 7,607
Long combination truck 9,720 9,720 9,720 9,720
Prime MoversShort combination prime mover 1,209 4,926 5,223 5,223
Multi-combination prime mover 9,819 9,819 10,801 10,801
Axle group type (per axle charge ($))Single Tandem
axle group
Tri-axle group
Quad-axle group &
above Trailer TypePig Trailer 571 571 571 571Dog Trailer 571 571 571 571Semi Trailer 571 571 571 571B-double lead trailer and B-triple lead and middle trailers
571 1,090 1,143 1,143
Converter dolly or low loader dolly 571 571 571 571
Bus Type 2 axle 3 axle 4 axleBus (type 1) 507Bus (type 2) 507 2,522 2,522 Articulated bus 507 507
Special purpose vehicle (type P)Special purpose vehicle (type T) 303Special purpose vehicle (type O) 379
379 + (379 x number of axles over 2)
1 July 2014 – 30 June 2015DIVISION 1 - LOAD CARRYING VEHICLES ($) - 2014/15
DIVISION 2 - LOAD CARRYING TRAILERS
DIVISION 3 – BUSES ($)
DIVISION 4 - SPECIAL PURPOSE VEHICLESNo Charge
Calculated using the formula:
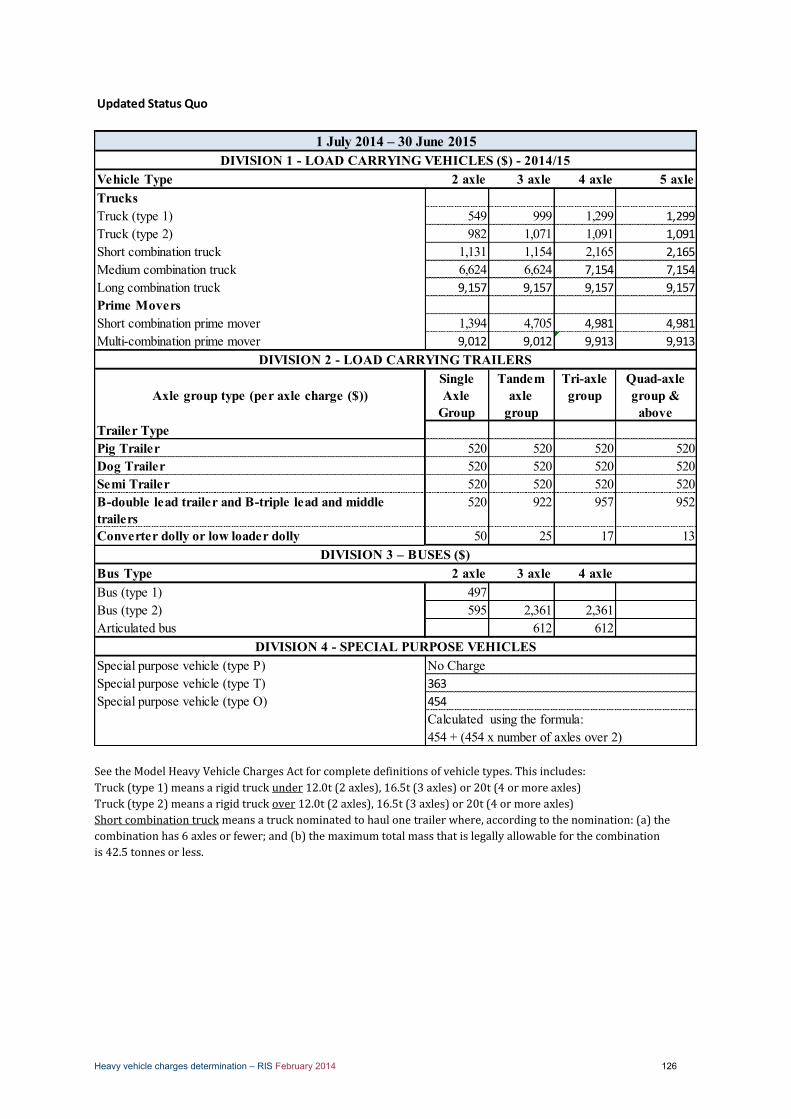
Heavy vehicle charges determination – RIS February 2014 126
See the Model Heavy Vehicle Charges Act for complete definitions of vehicle types. This includes:
Truck (type 1) means a rigid truck under 12.0t (2 axles), 16.5t (3 axles) or 20t (4 or more axles)
Truck (type 2) means a rigid truck over 12.0t (2 axles), 16.5t (3 axles) or 20t (4 or more axles)
Short combination truck means a truck nominated to haul one trailer where, according to the nomination: (a) the
combination has 6 axles or fewer; and (b) the maximum total mass that is legally allowable for the combination
is 42.5 tonnes or less.
Updated Status Quo
Vehicle Type 2 axle 3 axle 4 axle 5 axleTrucksTruck (type 1) 549 999 1,299 1,299
Truck (type 2) 982 1,071 1,091 1,091
Short combination truck 1,131 1,154 2,165 2,165
Medium combination truck 6,624 6,624 7,154 7,154
Long combination truck 9,157 9,157 9,157 9,157
Prime MoversShort combination prime mover 1,394 4,705 4,981 4,981
Multi-combination prime mover 9,012 9,012 9,913 9,913
Axle group type (per axle charge ($))Single Axle
Group
Tandem axle
group
Tri-axle group
Quad-axle group &
above Trailer TypePig Trailer 520 520 520 520Dog Trailer 520 520 520 520Semi Trailer 520 520 520 520B-double lead trailer and B-triple lead and middle trailers
520 922 957 952
Converter dolly or low loader dolly 50 25 17 13
Bus Type 2 axle 3 axle 4 axleBus (type 1) 497Bus (type 2) 595 2,361 2,361 Articulated bus 612 612
Special purpose vehicle (type P)Special purpose vehicle (type T) 363
Special purpose vehicle (type O) 454
454 + (454 x number of axles over 2)Calculated using the formula:
DIVISION 4 - SPECIAL PURPOSE VEHICLESNo Charge
DIVISION 2 - LOAD CARRYING TRAILERS
DIVISION 3 – BUSES ($)
1 July 2014 – 30 June 2015DIVISION 1 - LOAD CARRYING VEHICLES ($) - 2014/15

Heavy vehicle charges determination – RIS February 2014 127
See the Model Heavy Vehicle Charges Act for complete definitions of vehicle types. This includes:
Truck (type 1) means a rigid truck under 12.0t (2 axles), 16.5t (3 axles) or 20t (4 or more axles)
Truck (type 2) means a rigid truck over 12.0t (2 axles), 16.5t (3 axles) or 20t (4 or more axles)
Short combination truck means a truck nominated to haul one trailer where, according to the nomination: (a) the
combination has 6 axles or fewer; and (b) the maximum total mass that is legally allowable for the combination
is 42.5 tonnes or less.
Option A
Vehicle Type 2 axle 3 axle 4 axle 5 axleTrucksTruck (type 1) 547 881 1,126 1,126
Truck (type 2) 870 983 1,006 1,006
Short combination truck 869 940 1,828 1,828
Medium combination truck 7,335 7,335 7,922 7,922
Long combination truck 10,140 10,140 10,140 10,140
Prime MoversShort combination prime mover 1,019 4,006 4,810 4,810
Multi-combination prime mover 10,103 10,103 11,113 11,113
Axle group type (per axle charge ($))Single Axle
Group
Tandem axle
group
Tri-axle group
Quad-axle group &
above Trailer TypePig Trailer 678 678 678 678Dog Trailer 678 678 678 678Semi Trailer 678 823 584 438B-double lead trailer and B-triple lead and middle trailers
678 823 584 438
Converter dolly or low loader dolly 50 25 17 13
Bus Type 2 axle 3 axle 4 axleBus (type 1) 497Bus (type 2) 599 2,423 2,423 Articulated bus 615 615
Special purpose vehicle (type P)Special purpose vehicle (type T) 347
Special purpose vehicle (type O) 434
434 + (434 x number of axles over 2)Calculated using the formula:
DIVISION 4 - SPECIAL PURPOSE VEHICLESNo Charge
DIVISION 2 - LOAD CARRYING TRAILERS
DIVISION 3 – BUSES ($)
1 July 2014 – 30 June 2015DIVISION 1 - LOAD CARRYING VEHICLES ($) - 2014/15

Heavy vehicle charges determination – RIS February 2014 128
See the Model Heavy Vehicle Charges Act for complete definitions of vehicle types. This includes:
Truck (type 1) means a rigid truck under 12.0t (2 axles), 16.5t (3 axles) or 20t (4 or more axles)
Truck (type 2) means a rigid truck over 12.0t (2 axles), 16.5t (3 axles) or 20t (4 or more axles)
Short combination truck means a truck nominated to haul one trailer where, according to the nomination: (a) the
combination has 6 axles or fewer; and (b) the maximum total mass that is legally allowable for the combination
is 42.5 tonnes or less.
Option B
Vehicle Type 2 axle 3 axle 4 axle 5 axleTrucksTruck (type 1) 484 715 960 960
Truck (type 2) 704 805 828 828
Short combination truck 703 762 1,437 1,437
Medium combination truck 5,549 5,549 5,993 5,993
Long combination truck 7,671 7,671 7,671 7,671
Prime MoversShort combination prime mover 853 3,056 3,788 3,788
Multi-combination prime mover 7,691 7,691 8,460 8,460
Axle group type (per axle charge ($))Single Axle
Group
Tandem axle
group
Tri-axle group
Quad-axle group &
above Trailer TypePig Trailer 513 513 513 513Dog Trailer 513 513 513 513Semi Trailer 513 614 435 326B-double lead trailer and B-triple lead and middle trailers
513 614 435 326
Converter dolly or low loader dolly 50 25 17 13
Bus Type 2 axle 3 axle 4 axleBus (type 1) 497Bus (type 2) 599 1,900 1,900 Articulated bus 615 615
Special purpose vehicle (type P)Special purpose vehicle (type T) 278
Special purpose vehicle (type O) 348
348 + (348 x number of axles over 2)Calculated using the formula:
DIVISION 4 - SPECIAL PURPOSE VEHICLESNo Charge
DIVISION 2 - LOAD CARRYING TRAILERS
DIVISION 3 – BUSES ($)
1 July 2014 – 30 June 2015DIVISION 1 - LOAD CARRYING VEHICLES ($) - 2014/15

Heavy vehicle charges determination – RIS February 2014 129
See the Model Heavy Vehicle Charges Act for complete definitions of vehicle types. This includes:
Truck (type 1) means a rigid truck under 12.0t (2 axles), 16.5t (3 axles) or 20t (4 or more axles)
Truck (type 2) means a rigid truck over 12.0t (2 axles), 16.5t (3 axles) or 20t (4 or more axles)
Short combination truck means a truck nominated to haul one trailer where, according to the nomination: (a) the
combination has 6 axles or fewer; and (b) the maximum total mass that is legally allowable for the combination
is 42.5 tonnes or less.
Option C
Vehicle Type 2 axle 3 axle 4 axle 5 axleTrucksTruck (type 1) 484 582 827 827
Truck (type 2) 571 663 685 685
Short combination truck 570 620 1,123 1,123
Medium combination truck 4,120 4,120 4,450 4,450
Long combination truck 5,696 5,696 5,696 5,696
Prime MoversShort combination prime mover 720 2,295 2,971 2,971
Multi-combination prime mover 5,761 5,761 6,337 6,337
Axle group type (per axle charge ($))Single Axle
Group
Tandem axle
group
Tri-axle group
Quad-axle group &
above Trailer TypePig Trailer 381 381 381 381Dog Trailer 381 381 381 381Semi Trailer 381 446 316 237B-double lead trailer and B-triple lead and middle trailers
381 446 316 237
Converter dolly or low loader dolly 50 25 17 13
Bus Type 2 axle 3 axle 4 axleBus (type 1) 497Bus (type 2) 599 1,482 1,482 Articulated bus 615 615
Special purpose vehicle (type P)Special purpose vehicle (type T) 222
Special purpose vehicle (type O) 278
278 + (278 x number of axles over 2)Calculated using the formula:
DIVISION 4 - SPECIAL PURPOSE VEHICLESNo Charge
DIVISION 2 - LOAD CARRYING TRAILERS
DIVISION 3 – BUSES ($)
1 July 2014 – 30 June 2015DIVISION 1 - LOAD CARRYING VEHICLES ($) - 2014/15

Heavy vehicle charges determination – RIS February 2014 130

Heavy vehicle charges determination – RIS February 2014 131
Appendix G: Attributable Cost Calculations
Option A
Option B
Cost Recovery Constraints - Checks
Attrib/Vehicle Attrib/Vehicle Non Attributable Allocated Cost Cost Recovery Cost Recovery
Vehicle Class (Pre-discounts) (Post Discounts) per vehicle per vehicle per vehicle Greater than
Attributable cost
Rigid trucks: 2 axle: no trailer: GVM 4.5 to 7.0 tonne 391.21 389.97 454.26 844.23 1,033.66 Y
Rigid trucks: 2 axle: no trailer: GVM 7.0 to 12.0 tonne 1,004.90 998.68 641.64 1,640.32 1,463.41 Y
Rigid trucks: 2 axle: no trailer: GVM over 12.0 tonne 2,009.56 1,994.70 701.73 2,696.43 2,093.39 Y
Rigid trucks: 2 axle: with trailer 2,844.44 2,821.11 1,182.65 4,003.76 4,074.22 Y
Rigid trucks: 3 axle: no trailer GVM 4.5-18 1,883.40 1,868.72 882.04 2,750.76 2,780.22 Y
Rigid trucks: 3 axle: no trailer GVM >18 3,428.46 3,398.69 925.84 4,324.53 3,406.85 Y
Rigid trucks: 3 axle: with trailer >18 1,359.00 1,344.05 374.73 1,718.78 3,793.92 Y
Rigid trucks: 4 axle: no trailer GVM 4.5-25 8,011.70 7,927.63 2,950.21 10,877.84 10,560.15 Y
Rigid trucks: 4 axle: no trailer GVM >25 3,635.34 3,602.31 840.17 4,442.49 3,744.15 Y
Rigid trucks: 4 axle: with trailer >25 1,147.11 1,132.57 266.56 1,399.13 4,424.80 Y
Truck trailers 17,796.97 17,626.15 2,399.71 20,025.86 17,671.51 Y
Articulated trucks: single trailer: 3 axle rig 2,016.83 1,994.94 818.93 2,813.87 2,856.69 Y
Articulated trucks: single trailer: 4 axle rig 4,588.21 4,532.99 1,608.09 6,141.07 6,029.60 Y
Articulated trucks: single 3 axle trailer: 5 axle rig 5,562.85 5,488.29 1,743.33 7,231.61 6,847.60 Y
Articulated trucks: single 2 axle trailer: 5 axle rig 8,633.96 8,525.13 2,399.12 10,924.25 12,531.42 Y
Articulated trucks: single trailer: 6 axle rig 12,307.48 12,142.28 3,125.56 15,267.85 15,093.69 Y
Articulated trucks: B-double: <9 axle rig 14,933.50 14,723.89 2,897.25 17,621.14 22,246.24 Y
Articulated trucks: B-double/triple: 9 axle rig & above 24,096.45 23,741.86 4,308.86 28,050.72 28,414.02 Y
B-Triple New 41,490.95 34,134.34 6,154.11 40,288.45 43,940.94 Y
Articulated trucks: Road train: 2 trailers 19,935.61 18,038.28 3,195.21 21,233.49 25,927.63 Y
Articulated trucks: Road train: 3 trailers 27,037.47 29,092.50 3,231.88 32,324.37 29,861.88 Y
Articulated trucks: > 6 axle rig (not elsewhere classified) 20,189.88 19,884.65 4,289.03 24,173.67 23,772.23 Y
Other trucks 665.34 658.30 160.74 819.04 1,437.72 Y
Buses: 2 axle: GVM 3.5 to 4.5 t
Buses: 2 axle: GVM 4.5 to 10.0 t 687.91 684.67 794.55 1,479.22 1,406.34 Y
Buses: 2 axle: GVM over 10.0 t 2,731.83 2,709.94 1,512.40 4,222.33 4,935.25 Y
Buses: 3 axle 7,293.60 7,214.13 2,983.89 10,198.03 8,915.15 Y
Buses: articulated 2,431.67 2,403.64 1,227.08 3,630.72 4,337.56 Y
Per Vehicle Analysis
Cost Recovery Constraints - Checks
Attrib/Vehicle Attrib/Vehicle Non Attributable Allocated Cost Cost Recovery
Vehicle Class (Pre-discounts) (Post Discounts) per vehicle per vehicle per vehicle Greater than
Attributable cost
Rigid trucks: 2 axle: no trailer: GVM 4.5 to 7.0 tonne 391.21 389.97 454.26 844.23 1,075.10 Y
Rigid trucks: 2 axle: no trailer: GVM 7.0 to 12.0 tonne 1,004.90 998.68 641.64 1,640.32 1,571.63 Y
Rigid trucks: 2 axle: no trailer: GVM over 12.0 tonne 2,009.56 1,994.70 701.73 2,696.43 2,154.13 Y
Rigid trucks: 2 axle: with trailer 2,844.44 2,821.11 1,182.65 4,003.76 4,048.73 Y
Rigid trucks: 3 axle: no trailer GVM 4.5-18 1,883.40 1,868.72 882.04 2,750.76 2,947.68 Y
Rigid trucks: 3 axle: no trailer GVM >18 3,428.46 3,398.69 925.84 4,324.53 3,652.76 Y
Rigid trucks: 3 axle: with trailer >18 1,359.00 1,344.05 374.73 1,718.78 3,311.96 Y
Rigid trucks: 4 axle: no trailer GVM 4.5-25 8,011.70 7,927.63 2,950.21 10,877.84 11,936.44 Y
Rigid trucks: 4 axle: no trailer GVM >25 3,635.34 3,602.31 840.17 4,442.49 4,042.46 Y
Rigid trucks: 4 axle: with trailer >25 1,147.11 1,132.57 266.56 1,399.13 3,700.33 Y
Truck trailers 17,796.97 17,626.15 2,399.71 20,025.86 16,654.82 N
Articulated trucks: single trailer: 3 axle rig 2,016.83 1,994.94 818.93 2,813.87 2,773.36 Y
Articulated trucks: single trailer: 4 axle rig 4,588.21 4,532.99 1,608.09 6,141.07 6,105.52 Y
Articulated trucks: single 3 axle trailer: 5 axle rig 5,562.85 5,488.29 1,743.33 7,231.61 6,935.52 Y
Articulated trucks: single 2 axle trailer: 5 axle rig 8,633.96 8,525.13 2,399.12 10,924.25 12,297.88 Y
Articulated trucks: single trailer: 6 axle rig 12,307.48 12,142.28 3,125.56 15,267.85 15,214.25 Y
Articulated trucks: B-double: <9 axle rig 14,933.50 14,723.89 2,897.25 17,621.14 20,484.66 Y
Articulated trucks: B-double/triple: 9 axle rig & above 24,096.45 23,741.86 4,308.86 28,050.72 27,566.75 Y
B-Triple New 41,490.95 34,134.34 6,154.11 40,288.45 44,794.70 Y
Articulated trucks: Road train: 2 trailers 19,935.61 18,038.28 3,195.21 21,233.49 24,694.03 Y
Articulated trucks: Road train: 3 trailers 27,037.47 29,092.50 3,231.88 32,324.37 28,528.05 N
Articulated trucks: > 6 axle rig (not elsewhere classified) 20,189.88 19,884.65 4,289.03 24,173.67 25,127.75 Y
Other trucks 665.34 658.30 160.74 819.04 1,247.14 Y
Buses: 2 axle: GVM 3.5 to 4.5 t
Buses: 2 axle: GVM 4.5 to 10.0 t 687.91 684.67 794.55 1,479.22 1,578.24 Y
Buses: 2 axle: GVM over 10.0 t 2,731.83 2,709.94 1,512.40 4,222.33 5,655.47 Y
Buses: 3 axle 7,293.60 7,214.13 2,983.89 10,198.03 9,468.30 Y
Buses: articulated 2,431.67 2,403.64 1,227.08 3,630.72 4,964.91 Y
Cost Recovery
Per Vehicle Analysis

Heavy vehicle charges determination – RIS February 2014 132
Option C
Cost Recovery Constraints - Checks
Attrib/Vehicle Attrib/Vehicle Non Attributable Allocated Cost Cost Recovery
Vehicle Class (Pre-discounts) (Post Discounts) per vehicle per vehicle per vehicle Greater than
Attributable cost
Rigid trucks: 2 axle: no trailer: GVM 4.5 to 7.0 tonne 391.21 389.97 454.26 844.23 1,155.28 Y
Rigid trucks: 2 axle: no trailer: GVM 7.0 to 12.0 tonne 1,004.90 998.68 641.64 1,640.32 1,703.17 Y
Rigid trucks: 2 axle: no trailer: GVM over 12.0 tonne 2,009.56 1,994.70 701.73 2,696.43 2,192.18 Y
Rigid trucks: 2 axle: with trailer 2,844.44 2,821.11 1,182.65 4,003.76 4,008.06 Y
Rigid trucks: 3 axle: no trailer GVM 4.5-18 1,883.40 1,868.72 882.04 2,750.76 3,067.82 Y
Rigid trucks: 3 axle: no trailer GVM >18 3,428.46 3,398.69 925.84 4,324.53 3,832.65 Y
Rigid trucks: 3 axle: with trailer >18 1,359.00 1,344.05 374.73 1,718.78 3,084.72 Y
Rigid trucks: 4 axle: no trailer GVM 4.5-25 8,011.70 7,927.63 2,950.21 10,877.84 12,986.45 Y
Rigid trucks: 4 axle: no trailer GVM >25 3,635.34 3,602.31 840.17 4,442.49 4,262.67 Y
Rigid trucks: 4 axle: with trailer >25 1,147.11 1,132.57 266.56 1,399.13 3,002.76 Y
Truck trailers 17,796.97 17,626.15 2,399.71 20,025.86 15,976.05 N
Articulated trucks: single trailer: 3 axle rig 2,016.83 1,994.94 818.93 2,813.87 2,692.33 Y
Articulated trucks: single trailer: 4 axle rig 4,588.21 4,532.99 1,608.09 6,141.07 6,136.50 Y
Articulated trucks: single 3 axle trailer: 5 axle rig 5,562.85 5,488.29 1,743.33 7,231.61 6,972.11 Y
Articulated trucks: single 2 axle trailer: 5 axle rig 8,633.96 8,525.13 2,399.12 10,924.25 12,049.33 Y
Articulated trucks: single trailer: 6 axle rig 12,307.48 12,142.28 3,125.56 15,267.85 15,236.70 Y
Articulated trucks: B-double: <9 axle rig 14,933.50 14,723.89 2,897.25 17,621.14 18,965.18 Y
Articulated trucks: B-double/triple: 9 axle rig & above 24,096.45 23,741.86 4,308.86 28,050.72 26,749.21 Y
B-Triple New 41,490.95 34,134.34 6,154.11 40,288.45 45,263.27 Y
Articulated trucks: Road train: 2 trailers 19,935.61 18,038.28 3,195.21 21,233.49 23,579.31 Y
Articulated trucks: Road train: 3 trailers 27,037.47 29,092.50 3,231.88 32,324.37 27,313.87 N
Articulated trucks: > 6 axle rig (not elsewhere classified) 20,189.88 19,884.65 4,289.03 24,173.67 26,096.58 Y
Other trucks 665.34 658.30 160.74 819.04 1,087.16 Y
Buses: 2 axle: GVM 3.5 to 4.5 t
Buses: 2 axle: GVM 4.5 to 10.0 t 687.91 684.67 794.55 1,479.22 1,710.47 Y
Buses: 2 axle: GVM over 10.0 t 2,731.83 2,709.94 1,512.40 4,222.33 6,209.49 Y
Buses: 3 axle 7,293.60 7,214.13 2,983.89 10,198.03 9,867.27 Y
Buses: articulated 2,431.67 2,403.64 1,227.08 3,630.72 5,447.49 Y
Cost Recovery
Per Vehicle Analysis

Heavy vehicle charges determination – RIS February 2014 133
Appendix H: Annual Adjustment Formula

Heavy vehicle charges determination – RIS February 2014 134
Amendment to Model Heavy Vehicle Charges Act
CHANGING OF THE ANNUAL ADJUSTMENT METHODOLOGY – PRELIMINARY LEGAL DRAFTING INSTRUCTIONS
Background The Annual adjustment process is used to adjust heavy vehicle charges in years which fall between pricing determinations.
The annual adjustment formula derives what is known as the Annual Adjustment Factor. This factor is expressed as a percentage and is uniformly applied to all registration charges and and also to the road user charge (RUC). This adjustment takes place in July of each year. The adjustment ensures that revenue raised from charges reflects changing road expenditure, and changes in vehicle usage.
This formula is captured in the Model Heavy Vehicle Charges Act 2008 – Schedule 1 Annual Adjustment Factor, and has subsequently been amended in the Model Heavy Vehicle Charges (Amendment) Act 2010.
The objectives of the annual adjustment can be broadly defined as follows::
1. To amend charges so that they reflect changes in road expenditure and vehicle use. 2. To ensure the resulting charges are efficient (revenues match the estimated costs of road use)
and provide continuity between charging determinations 3. To provide a simple, readily understandable and transparent approach to amending charges
from one year to the next 4. To ensure continuity between charging determinations, the charges adjustment calculation
should be consistent with the underlying methodology of the pricing determination. 5.
Determination Recommendation
As part of the pricing determination, the NTC have recommended the adoption of a dynamic annual adjustment formula, which would involve all expenditure and usage data being taken into account when estimating the annual adjustment percentage change. This represents a significant departure from the current annual adjustment process and will require the following amendments being made to the Model Heavy Vehicle Charges Act 2008.
Current Annual Adjustment Methodology
Schedule 1 of Model Heavy Vehicle Charges Act 2008
See Section H-1.
Model Heavy Vehicle Charges (Amendment) Act 2010
See Section H-2.
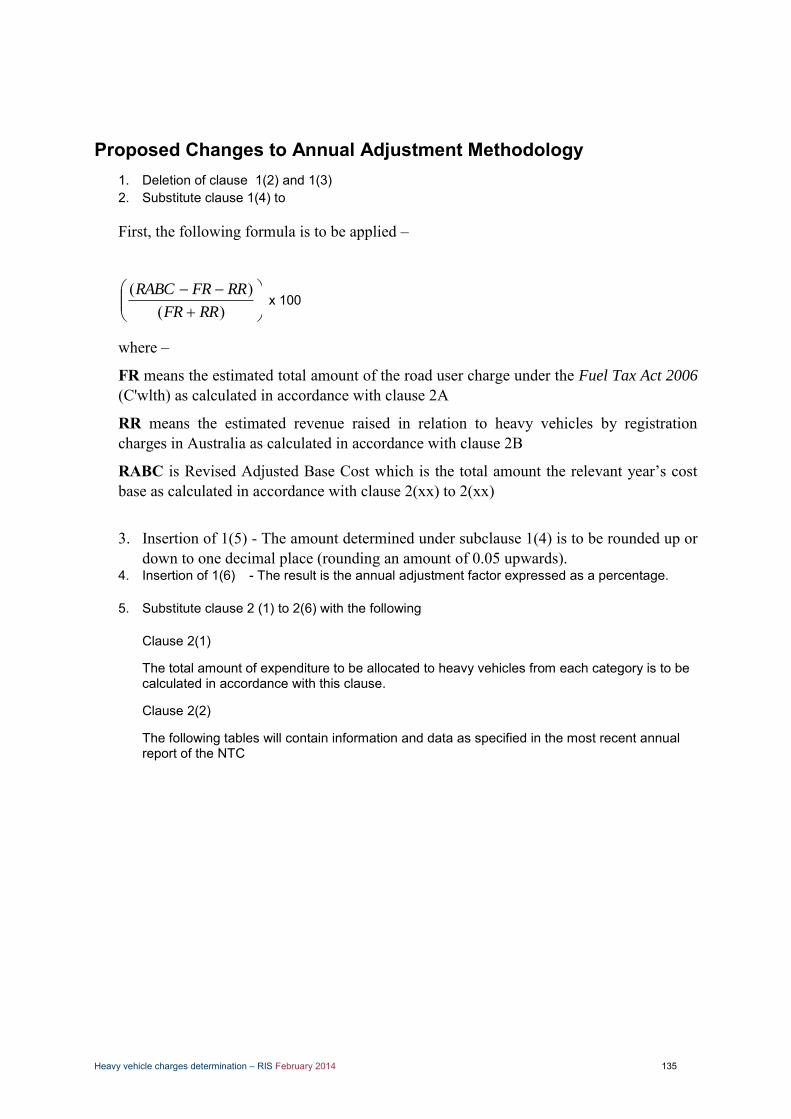
Heavy vehicle charges determination – RIS February 2014 135
Proposed Changes to Annual Adjustment Methodology 1. Deletion of clause 1(2) and 1(3) 2. Substitute clause 1(4) to
First, the following formula is to be applied –
)()(
RRFR
RRFRRABC x 100
where –
FR means the estimated total amount of the road user charge under the Fuel Tax Act 2006
(C'wlth) as calculated in accordance with clause 2A
RR means the estimated revenue raised in relation to heavy vehicles by registration charges in Australia as calculated in accordance with clause 2B
RABC is Revised Adjusted Base Cost which is the total amount the relevant year’s cost base as calculated in accordance with clause 2(xx) to 2(xx)
3. Insertion of 1(5) - The amount determined under subclause 1(4) is to be rounded up or down to one decimal place (rounding an amount of 0.05 upwards).
4. Insertion of 1(6) - The result is the annual adjustment factor expressed as a percentage.
5. Substitute clause 2 (1) to 2(6) with the following Clause 2(1)
The total amount of expenditure to be allocated to heavy vehicles from each category is to be calculated in accordance with this clause.
Clause 2(2)
The following tables will contain information and data as specified in the most recent annual report of the NTC
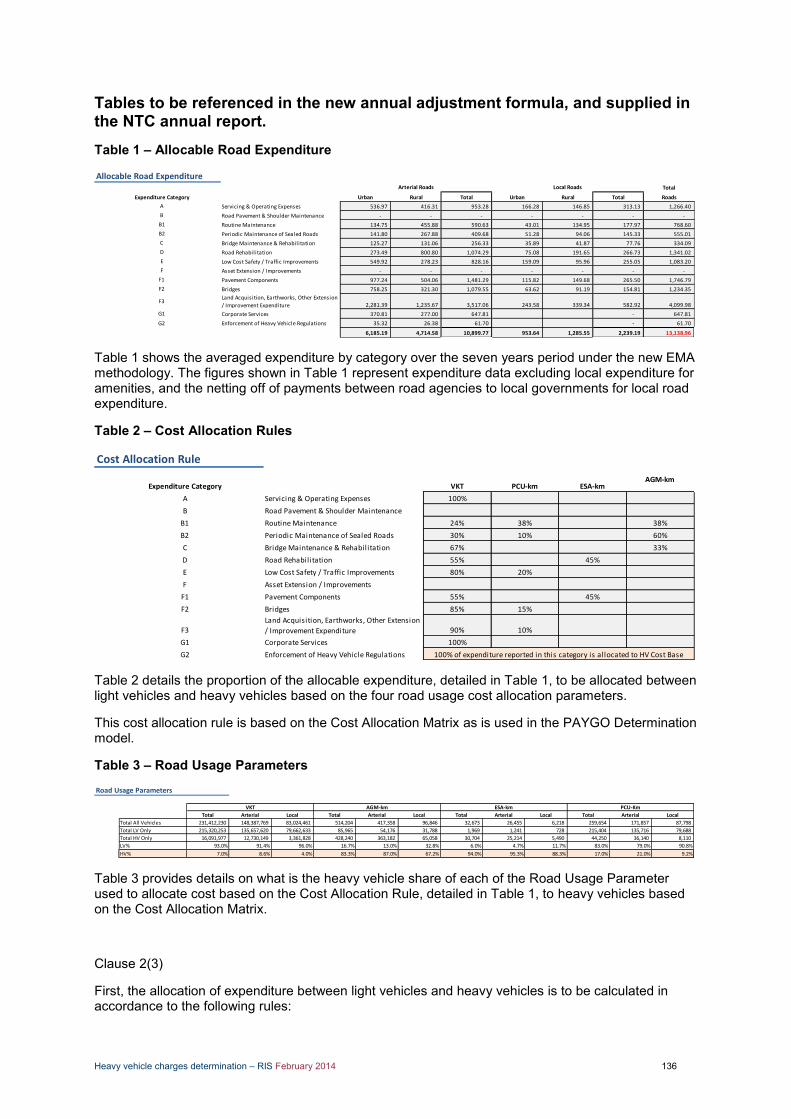
Heavy vehicle charges determination – RIS February 2014 136
Tables to be referenced in the new annual adjustment formula, and supplied in the NTC annual report. Table 1 – Allocable Road Expenditure
Table 1 shows the averaged expenditure by category over the seven years period under the new EMA methodology. The figures shown in Table 1 represent expenditure data excluding local expenditure for amenities, and the netting off of payments between road agencies to local governments for local road expenditure.
Table 2 – Cost Allocation Rules
Table 2 details the proportion of the allocable expenditure, detailed in Table 1, to be allocated between light vehicles and heavy vehicles based on the four road usage cost allocation parameters.
This cost allocation rule is based on the Cost Allocation Matrix as is used in the PAYGO Determination model.
Table 3 – Road Usage Parameters
Table 3 provides details on what is the heavy vehicle share of each of the Road Usage Parameter used to allocate cost based on the Cost Allocation Rule, detailed in Table 1, to heavy vehicles based on the Cost Allocation Matrix.
Clause 2(3)
First, the allocation of expenditure between light vehicles and heavy vehicles is to be calculated in accordance to the following rules:
Allocable Road Expenditure Total
Expenditure Category Urban Rural Total Urban Rural Total Roads
A Servicing & Operating Expenses 536.97 416.31 953.28 166.28 146.85 313.13 1,266.40
B Road Pavement & Shoulder Maintenance - - - - - - -
B1 Routine Maintenance 134.75 455.88 590.63 43.01 134.95 177.97 768.60
B2 Periodic Maintenance of Sealed Roads 141.80 267.88 409.68 51.28 94.06 145.33 555.01
C Bridge Maintenance & Rehabilitation 125.27 131.06 256.33 35.89 41.87 77.76 334.09
D Road Rehabilitation 273.49 800.80 1,074.29 75.08 191.65 266.73 1,341.02
E Low Cost Safety / Traffic Improvements 549.92 278.23 828.16 159.09 95.96 255.05 1,083.20
F Asset Extension / Improvements - - - - - - -
F1 Pavement Components 977.24 504.06 1,481.29 115.82 149.68 265.50 1,746.79
F2 Bridges 758.25 321.30 1,079.55 63.62 91.19 154.81 1,234.35
F3Land Acquisition, Earthworks, Other Extension
/ Improvement Expenditure 2,281.39 1,235.67 3,517.06 243.58 339.34 582.92 4,099.98
G1 Corporate Services 370.81 277.00 647.81 - 647.81
G2 Enforcement of Heavy Vehicle Regulations 35.32 26.38 61.70 - 61.70
6,185.19 4,714.58 10,899.77 953.64 1,285.55 2,239.19 13,138.96
Arterial Roads Local Roads
Cost Allocation Rule
Expenditure Category VKT PCU-km ESA-kmAGM-km
A Servicing & Operating Expenses 100%
B Road Pavement & Shoulder Maintenance
B1 Routine Maintenance 24% 38% 38%
B2 Periodic Maintenance of Sealed Roads 30% 10% 60%
C Bridge Maintenance & Rehabilitation 67% 33%
D Road Rehabilitation 55% 45%
E Low Cost Safety / Traffic Improvements 80% 20%
F Asset Extension / Improvements
F1 Pavement Components 55% 45%
F2 Bridges 85% 15%
F3Land Acquisition, Earthworks, Other Extension
/ Improvement Expenditure 90% 10%
G1 Corporate Services 100%
G2 Enforcement of Heavy Vehicle Regulations 100% of expenditure reported in this category is allocated to HV Cost Base
Road Usage Parameters
VKT AGM-km ESA-km PCU-Km
Total Arterial Local Total Arterial Local Total Arterial Local Total Arterial Local
Total All Vehicles 231,412,230 148,387,769 83,024,461 514,204 417,358 96,846 32,673 26,455 6,218 259,654 171,857 87,798
Total LV Only 215,320,253 135,657,620 79,662,633 85,965 54,176 31,788 1,969 1,241 728 215,404 135,716 79,688
Total HV Only 16,091,977 12,730,149 3,361,828 428,240 363,182 65,058 30,704 25,214 5,490 44,250 36,140 8,110
LV% 93.0% 91.4% 96.0% 16.7% 13.0% 32.8% 6.0% 4.7% 11.7% 83.0% 79.0% 90.8%
HV% 7.0% 8.6% 4.0% 83.3% 87.0% 67.2% 94.0% 95.3% 88.3% 17.0% 21.0% 9.2%
Heavy vehicle charges determination – RIS February 2014 137
Expenditure category A – 100% of expenditure reported in category A is to be allocated between LV and HV based on VKT parameter (see clause 2(4)).
Expenditure category B1 – 38% of expenditure reported in category B is to be allocated between LV and HV based on PCU-km parameter, another 38% is to be allocated based on AGM-km parameter, and 24% is to be allocated based on VKT parameter (see clause 2(4)).
Expenditure category B2 – 10% of expenditure reported in category B2 is to be allocated between LV and HV based on PCU-km parameter, 60% is to be allocated based on AGM-km parameter, and 30% is to be allocated based on VKT parameter (see clause 2(4)).
Expenditure category C – 33% of expenditure reported in category C is to be allocated between LV and HV based on AGM-km parameter, and 67% is to be allocated based on VKT parameter (see clause 2(4)).
Expenditure category D – 45% of expenditure reported in category D is to be allocated between LV and HV based on ESA-km parameter, and 55% is to be allocated based on VKT parameter (see clause 2(4)).
Expenditure category E – 20% of expenditure reported in category E is to be allocated between LV and HV based on PCU-km parameter, and 80% is to be allocated based on VKT parameter (see clause 2(4)).
Expenditure category F1 – 45% of expenditure reported in category F1 is to be allocated between LV and HV based on ESA-km parameter, and 55% is to be allocated based on VKT parameter (see clause 2(4)).
Expenditure category F2 – 15% of expenditure reported in category F2 is to be allocated between LV and HV based on PCU-km parameter, and 85% is to be allocated based on VKT parameter (see clause 2(4)).
Expenditure category F3 – 15% of expenditure reported in category F3 is to be allocated between LV and HV based on PCU-km parameter, and 85% is to be allocated based on VKT parameter (see clause 2(4)).
Expenditure category G1 – 100% of expenditure reported in category G1 is to be allocated between LV and HV based on VKT parameter (see clause 2(4)).
Expenditure category G2 – 100% of expenditure reported in category G2 is to be allocated directly to heavy vehicle cost base (see clause 2(4)).
Clause 2(4)
The proportion of cost allocation for different cost allocation parameters are those that are specified in Table 3 under clause 2(2)
Clause 2(5)
The calculation of the heavy vehicle cost base as described in clause 2(2) to 2(4) is to be conducted separately for the Arterial and Local road expenditure.
Clause 2(6)
The total heavy vehicle cost base is that equal to the sum of all cost allocated to heavy vehicles for each of the cost categories for the arterial and local road expenditure, as per the following formula –

Heavy vehicle charges determination – RIS February 2014 138
Total Arterial Cost Base
Category A Arterial = Total ArterialA x HV% Arterial VKT
Category B1 Arterial = [0.38 x Total ArterialB1 x HV% Arterial PCU-km] + [0.38 x Total ArterialB1 x HV% Arterial AGM-km] + [0.24 x Total ArterialB1 x HV% Arterial VKT]
Category B2 Arterial = [0.10 x Total ArterialB2 x HV% Arterial PCU-km] + [0.60 x Total ArterialB2 x HV% Arterial AGM-km] + [0.30 x Total ArterialB2 x HV% Arterial VKT]
Category C Arterial = [0.33 x Total ArterialC x HV% Arterial AGM-km] + [0.67 x Total ArterialC x HV% Arterial VKT]
Category D Arterial = [0.45 x Total ArterialD x HV% Arterial ESA-km] + [0.55 x Total ArterialD x HV% Arterial VKT]
Category E Arterial = [0.20 x Total ArterialE x HV% Arterial PCU-km] + [0.80 x Total ArterialE x HV% Arterial VKT]
Category F1 Arterial = [0.45 x Total ArterialF1 x HV% Arterial ESA-km] + [0.55 x Total ArterialF1 x HV% Arterial VKT]
Category F2 Arterial = [0.15 x Total ArterialF2 x HV% Arterial PCU-km] + [0.85 x Total ArterialF2 x HV% Arterial VKT]
Category F3 Arterial = [0.10 x Total ArterialF3 x HV% Arterial PCU-km] + [0.90 x Total ArterialF3 x HV% Arterial VKT]
Category G1 Arterial = Total ArterialG1 x HV% Arterial VKT
Category G2 Arterial = Total ArterialG2
Total Cost Base Arterial = Sum of Above
Total Local Cost Base
Category A Local = Total LocalA x HV% Local VKT
Category B1 Local = [0.38 x Total LocalB1 x HV% Local PCU-km] + [0.38 x Total LocalB1 x HV% Local AGM-km] + [0.24 x Total LocalB1 x HV% Local VKT]
Category B2 Local = [0.10 x Total LocalB2 x HV% Local PCU-km] + [0.60 x Total LocalB2 x HV% Local AGM-km] + [0.30 x Total LocalB2 x HV% Local VKT]
Category C Local = [0.33 x Total LocalC x HV% Local AGM-km] + [0.67 x Total LocalC x HV% Local VKT]
Category D Local = [0.45 x Total LocalD x HV% Local ESA-km] + [0.55 x Total LocalD x HV% Local VKT]
Category E Local = [0.20 x Total LocalE x HV% Local PCU-km] + [0.80 x Total LocalE x HV% Local VKT]
Category F1 Local = [0.45 x Total LocalF1 x HV% Local ESA-km] + [0.55 x Total LocalF1 x HV% Local VKT]
Category F2 Local = [0.15 x Total LocalF2 x HV% Local PCU-km] + [0.85 x Total LocalF2 x HV% Local VKT]
Category F3 Local = [0.10 x Total LocalF3 x HV% Local PCU-km] + [0.90 x Total LocalF3 x HV% Local VKT]
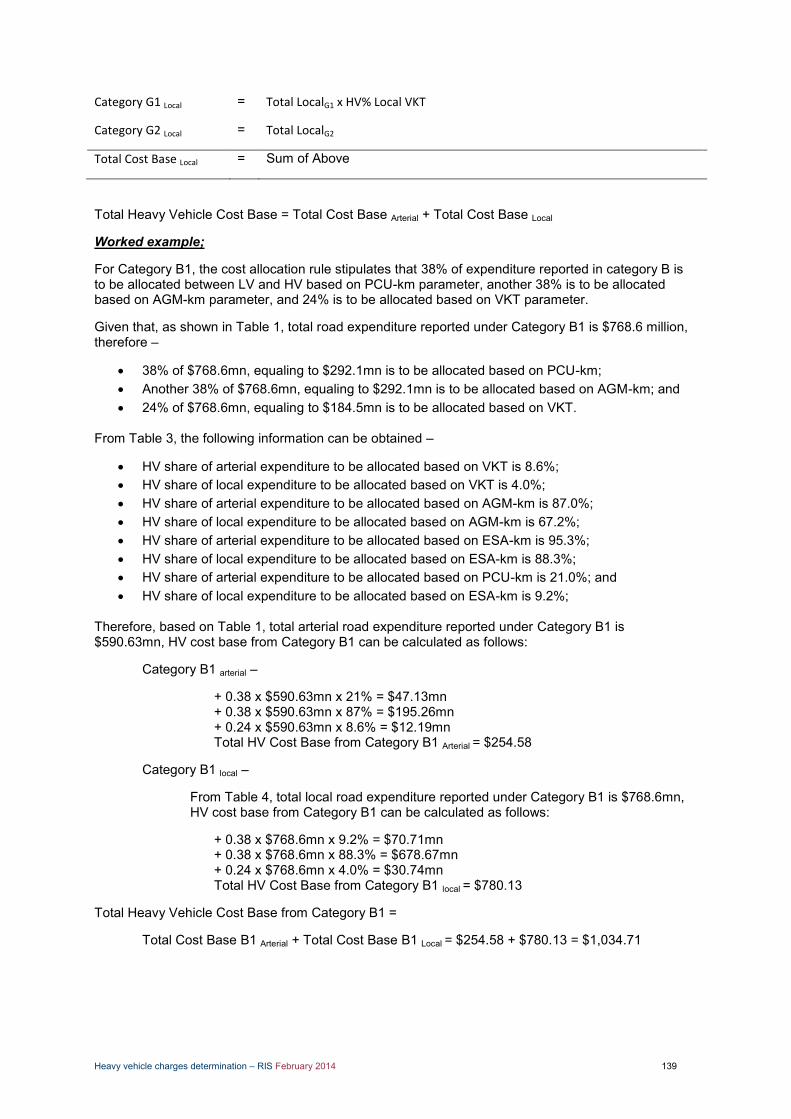
Heavy vehicle charges determination – RIS February 2014 139
Category G1 Local = Total LocalG1 x HV% Local VKT
Category G2 Local = Total LocalG2
Total Cost Base Local = Sum of Above
Total Heavy Vehicle Cost Base = Total Cost Base Arterial + Total Cost Base Local
Worked example;
For Category B1, the cost allocation rule stipulates that 38% of expenditure reported in category B is to be allocated between LV and HV based on PCU-km parameter, another 38% is to be allocated based on AGM-km parameter, and 24% is to be allocated based on VKT parameter.
Given that, as shown in Table 1, total road expenditure reported under Category B1 is $768.6 million, therefore –
38% of $768.6mn, equaling to $292.1mn is to be allocated based on PCU-km; Another 38% of $768.6mn, equaling to $292.1mn is to be allocated based on AGM-km; and 24% of $768.6mn, equaling to $184.5mn is to be allocated based on VKT.
From Table 3, the following information can be obtained –
HV share of arterial expenditure to be allocated based on VKT is 8.6%; HV share of local expenditure to be allocated based on VKT is 4.0%; HV share of arterial expenditure to be allocated based on AGM-km is 87.0%; HV share of local expenditure to be allocated based on AGM-km is 67.2%; HV share of arterial expenditure to be allocated based on ESA-km is 95.3%; HV share of local expenditure to be allocated based on ESA-km is 88.3%; HV share of arterial expenditure to be allocated based on PCU-km is 21.0%; and HV share of local expenditure to be allocated based on ESA-km is 9.2%;
Therefore, based on Table 1, total arterial road expenditure reported under Category B1 is $590.63mn, HV cost base from Category B1 can be calculated as follows:
Category B1 arterial –
+ 0.38 x $590.63mn x 21% = $47.13mn + 0.38 x $590.63mn x 87% = $195.26mn + 0.24 x $590.63mn x 8.6% = $12.19mn Total HV Cost Base from Category B1 Arterial = $254.58
Category B1 local –
From Table 4, total local road expenditure reported under Category B1 is $768.6mn, HV cost base from Category B1 can be calculated as follows:
+ 0.38 x $768.6mn x 9.2% = $70.71mn + 0.38 x $768.6mn x 88.3% = $678.67mn + 0.24 x $768.6mn x 4.0% = $30.74mn Total HV Cost Base from Category B1 local = $780.13
Total Heavy Vehicle Cost Base from Category B1 =
Total Cost Base B1 Arterial + Total Cost Base B1 Local = $254.58 + $780.13 = $1,034.71
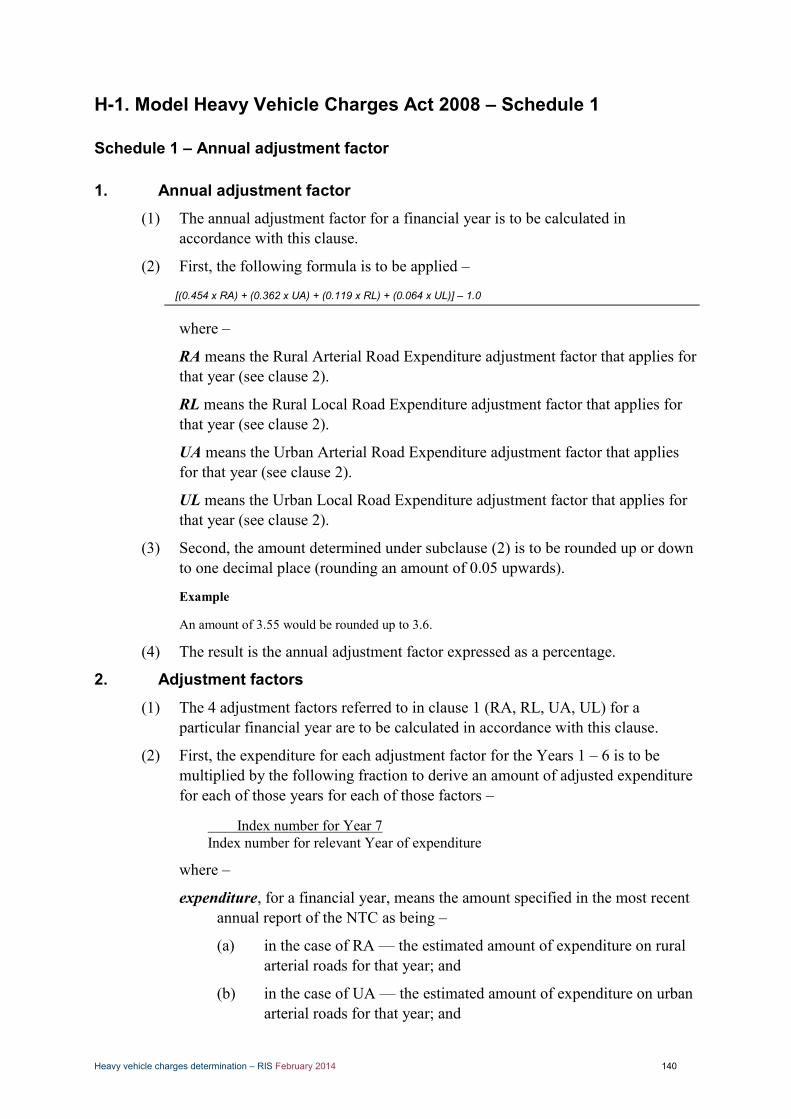
Heavy vehicle charges determination – RIS February 2014 140
H-1. Model Heavy Vehicle Charges Act 2008 – Schedule 1
Schedule 1 – Annual adjustment factor
1. Annual adjustment factor (1) The annual adjustment factor for a financial year is to be calculated in
accordance with this clause.
(2) First, the following formula is to be applied –
[(0.454 x RA) + (0.362 x UA) + (0.119 x RL) + (0.064 x UL)] – 1.0
where –
RA means the Rural Arterial Road Expenditure adjustment factor that applies for that year (see clause 2).
RL means the Rural Local Road Expenditure adjustment factor that applies for that year (see clause 2).
UA means the Urban Arterial Road Expenditure adjustment factor that applies for that year (see clause 2).
UL means the Urban Local Road Expenditure adjustment factor that applies for that year (see clause 2).
(3) Second, the amount determined under subclause (2) is to be rounded up or down to one decimal place (rounding an amount of 0.05 upwards).
Example
An amount of 3.55 would be rounded up to 3.6.
(4) The result is the annual adjustment factor expressed as a percentage.
2. Adjustment factors
(1) The 4 adjustment factors referred to in clause 1 (RA, RL, UA, UL) for a particular financial year are to be calculated in accordance with this clause.
(2) First, the expenditure for each adjustment factor for the Years 1 – 6 is to be multiplied by the following fraction to derive an amount of adjusted expenditure for each of those years for each of those factors –
Index number for Year 7 Index number for relevant Year of expenditure
where –
expenditure, for a financial year, means the amount specified in the most recent annual report of the NTC as being –
(a) in the case of RA — the estimated amount of expenditure on rural arterial roads for that year; and
(b) in the case of UA — the estimated amount of expenditure on urban arterial roads for that year; and
Heavy vehicle charges determination – RIS February 2014 141
(c) in the case of RL — the estimated amount of expenditure on rural local roads for that year; and
(d) in the case of UL — the estimated amount of expenditure on urban local roads for that year;
index number, for a particular financial year, means the road construction and maintenance price index number for 30 June of that year published by the Bureau of Transport and Regional Economics;
Example
In August 2007 the BTRE published its index figure. As at 30 June 2007 the index number was 150.5. Thus the index number for the 2006 – 2007 financial year is 150.5.
most recent annual report of the NTC means the last annual report of the National Transport Commission that was tabled in each House of the Commonwealth Parliament before the start of the financial year for which the annual adjustment factor is being determined;
Year 1 means the financial year immediately before Year 2;
Year 2 means the financial year immediately before Year 3;
Year 3 means the financial year immediately before Year 4;
Year 4 means the financial year immediately before Year 5;
Year 5 means the financial year immediately before Year 6;
Year 6 means the financial year immediately before Year 7;
Year 7 means the financial year immediately before Year 8;
Year 8 means the latest financial year for which the amount of estimated expenditure on the relevant type of road mentioned in the definition of expenditure is specified in the most recent annual report of the NTC.
Examples of the determination of Year 8
Suppose that, on 1 March 2010, the most recent annual report of the NTC to have been tabled is the annual report for 2008-2009, and that that report contains estimated expenditure figures for arterial roads up to and including the 2008 – 2009 financial year and estimated expenditure figures for local roads up to and including the 2006 – 2007 financial year. For the purpose of calculating RA and UA for the 2010 – 2011 financial year, Year 8 is the 2008 – 2009 financial year. For the purpose of calculating RL and UL for the 2010 – 2011 financial year, Year 8 is the 2006 – 2007 financial year.
Example of the calculation of the amount of adjusted expenditure for a year
Suppose that the Estimated Urban Arterial Road Expenditure for Year 4 is $2,010,000,000; that the index number for Year 4 is 129.7; and that the index number for Year 7 is 154.26. The adjusted expenditure for UA for Year 4 is $2,390,613,720 (that is (154.26/129.7) x $2,010,000,000).
(3) Second, for each adjustment factor, the amount of adjusted expenditure for each of Years 1 – 6 is to be added together, and the expenditure for Year 7 is to be added to the total to derive the Combined Adjusted Expenditure for Years 1 – 7.
Heavy vehicle charges determination – RIS February 2014 142
(4) Third, the expenditure for each adjustment factor for the Years 2 – 7 is to be multiplied by the following fraction to derive an amount of adjusted expenditure for each of those years for each of those factors –
Index number for Year 8 Index number for relevant Year of expenditure
(5) Fourth, for each adjustment factor, the amount of adjusted expenditure for each of Years 2 – 7 is to be added together, and the expenditure for Year 8 is to be added to the total to derive the Combined Adjusted Expenditure for Years 2 – 8.
(6) Fifth, for each adjustment factor, the following formula is to be applied –
100 x 17)-1 Yearsfor eExpenditur Adjusted Combined
8 - 2 Yearsfor eExpenditur Adjusted Combined
where –
Combined Adjusted Expenditure for Years 2 – 8 – see subclause (5);
Combined Adjusted Expenditure for Years 1 – 7 – see subclause (3).
Note
Clause 3 varies the operation of this clause with respect to the calculation of RA and UA for the purposes of calculating the annual adjustment factor for the 2009 – 2010 financial year.
(4) Lastly, the amount determined under subclause (6) is to be rounded up or down to 4 decimal places (rounding an amount of 0.00005 upwards).
Example
An amount of 2.35065 would be rounded up to 2.3507.
(5) The result is the amount that is to be used for that adjustment factor in the formula in clause 1(2).
3. Transitional provision in relation to the calculation of the annual adjustment factor for 2009 – 2010
(1) Despite anything to the contrary in clause 2, for the purposes of calculating the annual adjustment factor for the 2009 – 2010 financial year, RA and UA are to be calculated by applying the following formula –
100 x 1 eExpenditur Combined Base
eExpenditur Combined
where –
amount of adjusted expenditure is the amount derived using the method set out in clause 2(2);

Heavy vehicle charges determination – RIS February 2014 143
Combined Expenditure is the sum of the amounts of adjusted expenditure for the 2001 – 2002 (Year 1), 2002 – 2003 (Year 2), 2003 – 2004 (Year 3), 2004 – 2005 (Year 4), 2005 – 2006 (Year 5) and 2006 – 2007 (Year 6) financial years, and the amount of expenditure for the 2007 – 2008 (Year 7) financial year, based on the expenditure amounts set out in the annual report of the NTC for the 2007 – 2008 financial year, adjusted in the case of Years 1 – 6 using the index number for the 2007 – 2008 financial year as the numerator in the adjustment fraction;
Base Combined Expenditure is–
(a) in the case of RA, $22,877,279,156;
(b) in the case of UA, $22,628,161,494.
(2) All terms defined in clause 2 that are used in this clause have the same meaning as they have in clause 2, unless a contrary intention appears.
Heavy vehicle charges determination – RIS February 2014 144
H-2. Changes Amendment Act 2010
ATTACHMENT 1
Model Heavy Vehicle Charges (Amendment) Act 2010
The following provisions are intended to provide the basis for nationally consistent transport laws on the topics with which they deal. They do not, of themselves, have any legal effect.
1. Name This is the Model Heavy Vehicle Charges (Amendment) Act 2010.
2. Purpose The purpose of this Act is to refine the method by which the annual adjustment
for registration charges is to be calculated.
3. Approval This Act was approved by the Australian Transport Council on xx xxxx 2010.
4. Provision amended by this Act This Act amends Schedule 1 of the Model Heavy Vehicle Charges Act
5. Modification of calculation of annual adjustment factor (1) In clause 1(1), after "a financial year" insert "(the "relevant year")".
(2) For clause 1(4) substitute –
"(4) The result is the raw annual adjustment factor ("RAAF") expressed as a percentage.
(5) If the annual report of the National Transport Commission for the financial year that ended 1 year before the start of the relevant year does not provide the information needed to calculate the value of "TFU" in clause 2A and the values of "HV" and "TTR" in clause 2B, then the raw annual adjustment factor is the annual adjustment factor for the relevant year.
Heavy vehicle charges determination – RIS February 2014 145
(6) If subclause (5) does not apply, then the following formula is to be applied –
PRABC x (1+RAAF)
where –
PRABC is the Revised Adjusted Base Cost derived in calculating the annual adjustment factor in the previous financial year.
(7) The result is the Revised Adjusted Base Cost ("RABC").
(8) Next, the following formula is to be applied –
)()(
RRFR
RRFRRABC x 100
where –
FR means the estimated total amount of the road user charge under the Fuel Tax Act 2006 (C'wlth) as calculated in accordance with clause 2A
RR means the estimated revenue raised in relation to heavy vehicles by registration charges in Australia as calculated in accordance with clause 2B.
(9) Finally, the amount determined under subclause (8) is to be rounded up or down to one decimal place (rounding an amount of 0.05 upwards).
(10) The result is the annual adjustment factor expressed as a percentage.".
6. Insertion of new clauses 2A and 2B After clause 2 insert –
"2A. Calculation of the estimated total amount of the road user charge (1) The estimated total amount of the road user charge under the Fuel Tax
Act 2006 (C'wlth) ("FR") is to be calculated in accordance with this clause.
(2) First, the following formula is to be applied –
TFU x RUC where –
TFU is the total fuel use by heavy vehicles in litres determined by adding together the estimated annual fuel use shown in the relevant annual report of the NTC for each category of heavy vehicle
RUC is the road user charge rate (expressed in dollars) for the previous year that applied under section 43-10 of the Fuel Tax Act 2006
(C'wlth), or if more than one rate applied in that year, the last rate that applied in that year

Heavy vehicle charges determination – RIS February 2014 146
previous year means the financial year that immediately preceded the relevant year
relevant annual report of the NTC means the annual report of the National Transport Commission for the financial year that ended 1 year before the start of the relevant year
relevant year means the financial year for which the annual adjustment factor is being calculated.
(3) Second, the amount determined under subclause (2) is to be divided by
1 000 000.
(4) Third, the amount determined under subclause (3) is to be rounded up or down to 2 decimal places (rounding an amount of 0.005 upwards).
(5) The result is the estimated total amount of the road user charge.
2B. Calculation of estimated revenue raised from registration charges (1) The estimated revenue raised in relation to heavy vehicles by
registration charges in Australia ("RR") is to be calculated in accordance with this clause.
(2) First, the following formula is to be applied –
HV + TRR
where –
HV is the sum of the amounts shown in the relevant annual report of the NTC as the estimated vehicle registration revenue excluding trailers for each category of heavy vehicle
TTR is the sum of the amounts shown in the relevant annual report of the NTC as the estimated trailer registration revenue for each relevant category of heavy vehicle
relevant annual report of the NTC means the annual report of the National Transport Commission for the financial year that ended 1 year before the start of the financial year for which the annual adjustment factor is being calculated.
(3) Second, the amount determined under subclause (2) is to be divided by 1 000 000.
(4) Third, the amount determined under subclause (3) is to be rounded up or down to 2 decimal places (rounding an amount of 0.005 upwards).
(5) The result is the estimated revenue raised in relation to heavy vehicles by registration charges in Australia.".
7. Insertion of transitional provision After clause 3 insert –

Heavy vehicle charges determination – RIS February 2014 147
"4. Transitional provision in relation to the calculation of the annual adjustment factor for 2010 – 2011
Despite anything to the contrary in clause 1, for the purposes of calculating the annual adjustment factor for the 2010 – 2011 financial year –
(a) in clause 1(6), PRABC is 2015.15; and
(b) in clauses 2A and 2B, a reference to "the relevant annual report of the NTC" is to be read as if it was a reference to "the tables published by the National Transport Commission before 1 July 2010 in the Commonwealth Government Gazette for the purposes of this Schedule".".
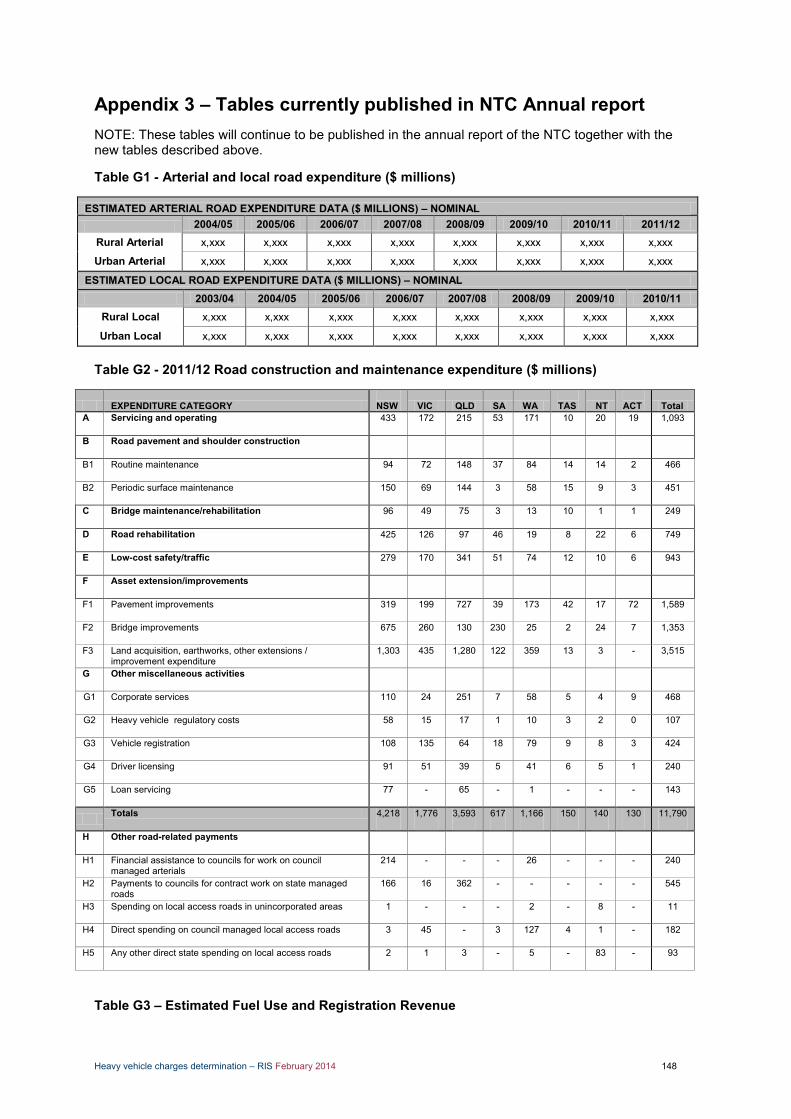
Heavy vehicle charges determination – RIS February 2014 148
Appendix 3 – Tables currently published in NTC Annual report NOTE: These tables will continue to be published in the annual report of the NTC together with the new tables described above.
Table G1 - Arterial and local road expenditure ($ millions)
ESTIMATED ARTERIAL ROAD EXPENDITURE DATA ($ MILLIONS) – NOMINAL 2004/05 2005/06 2006/07 2007/08 2008/09 2009/10 2010/11 2011/12
Rural Arterial x,xxx x,xxx x,xxx x,xxx x,xxx x,xxx x,xxx x,xxx
Urban Arterial x,xxx x,xxx x,xxx x,xxx x,xxx x,xxx x,xxx x,xxx
ESTIMATED LOCAL ROAD EXPENDITURE DATA ($ MILLIONS) – NOMINAL 2003/04 2004/05 2005/06 2006/07 2007/08 2008/09 2009/10 2010/11
Rural Local x,xxx x,xxx x,xxx x,xxx x,xxx x,xxx x,xxx x,xxx
Urban Local x,xxx x,xxx x,xxx x,xxx x,xxx x,xxx x,xxx x,xxx
Table G2 - 2011/12 Road construction and maintenance expenditure ($ millions)
EXPENDITURE CATEGORY NSW VIC QLD SA WA
TAS NT
ACT Total
A Servicing and operating 433 172 215 53 171 10 20 19 1,093
B Road pavement and shoulder construction
B1 Routine maintenance 94 72 148 37 84 14 14 2 466
B2 Periodic surface maintenance 150 69 144 3 58 15 9 3 451
C Bridge maintenance/rehabilitation 96 49 75 3 13 10 1 1 249
D Road rehabilitation 425 126 97 46 19 8 22 6 749
E Low-cost safety/traffic 279 170 341 51 74 12 10 6 943
F Asset extension/improvements
F1 Pavement improvements 319 199 727 39 173 42 17 72 1,589
F2 Bridge improvements 675 260 130 230 25 2 24 7 1,353
F3 Land acquisition, earthworks, other extensions / improvement expenditure
1,303 435 1,280 122 359 13 3 - 3,515
G Other miscellaneous activities
G1 Corporate services 110 24 251 7 58 5 4 9 468
G2 Heavy vehicle regulatory costs 58 15 17 1 10 3 2 0 107
G3 Vehicle registration 108 135 64 18 79 9 8 3 424
G4 Driver licensing 91 51 39 5 41 6 5 1 240
G5 Loan servicing 77 - 65 - 1 - - - 143
Totals 4,218 1,776 3,593 617 1,166 150 140 130 11,790
H Other road-related payments
H1 Financial assistance to councils for work on council managed arterials
214 - - - 26 - - - 240
H2 Payments to councils for contract work on state managed roads
166 16 362 - - - - - 545
H3 Spending on local access roads in unincorporated areas 1 - - - 2 - 8 - 11
H4 Direct spending on council managed local access roads 3 45 - 3 127 4 1 - 182
H5 Any other direct state spending on local access roads 2 1 3 - 5 - 83 - 93
Table G3 – Estimated Fuel Use and Registration Revenue
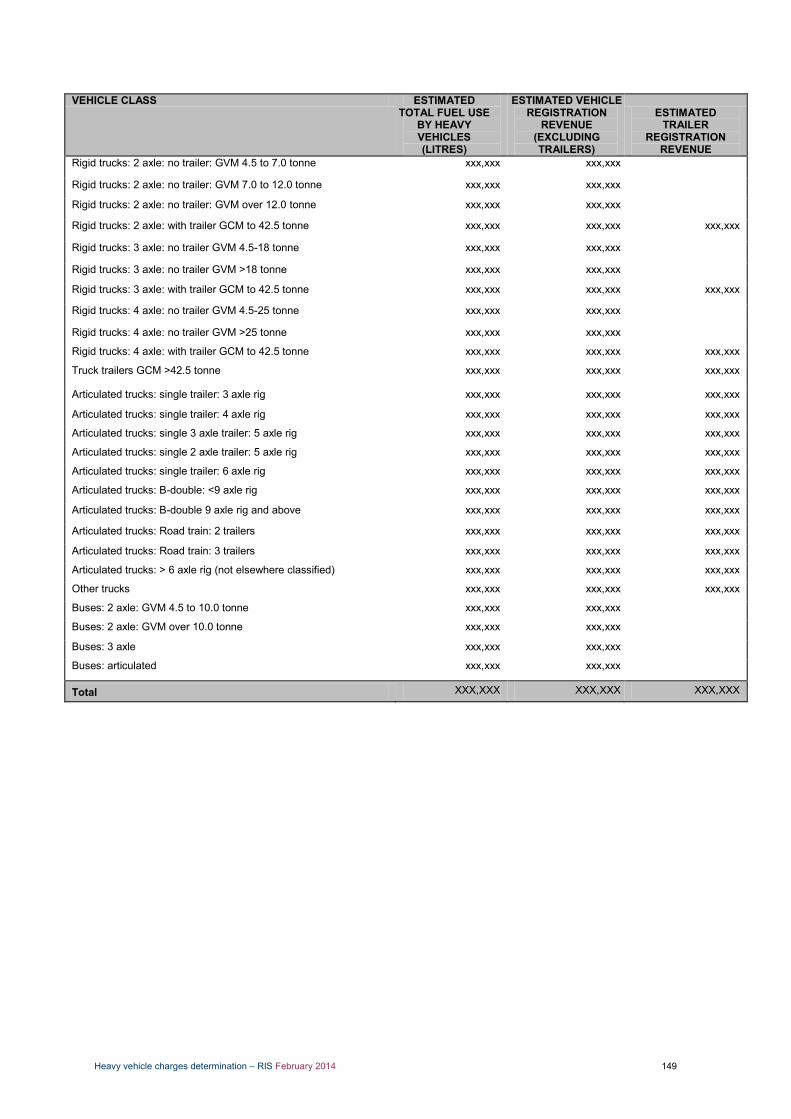
Heavy vehicle charges determination – RIS February 2014 149
VEHICLE CLASS ESTIMATED TOTAL FUEL USE
BY HEAVY VEHICLES (LITRES)
ESTIMATED VEHICLE REGISTRATION
REVENUE (EXCLUDING TRAILERS)
ESTIMATED TRAILER
REGISTRATION REVENUE
Rigid trucks: 2 axle: no trailer: GVM 4.5 to 7.0 tonne xxx,xxx xxx,xxx
Rigid trucks: 2 axle: no trailer: GVM 7.0 to 12.0 tonne xxx,xxx xxx,xxx
Rigid trucks: 2 axle: no trailer: GVM over 12.0 tonne xxx,xxx xxx,xxx
Rigid trucks: 2 axle: with trailer GCM to 42.5 tonne xxx,xxx xxx,xxx xxx,xxx
Rigid trucks: 3 axle: no trailer GVM 4.5-18 tonne xxx,xxx xxx,xxx
Rigid trucks: 3 axle: no trailer GVM >18 tonne xxx,xxx xxx,xxx
Rigid trucks: 3 axle: with trailer GCM to 42.5 tonne xxx,xxx xxx,xxx xxx,xxx
Rigid trucks: 4 axle: no trailer GVM 4.5-25 tonne xxx,xxx xxx,xxx
Rigid trucks: 4 axle: no trailer GVM >25 tonne xxx,xxx xxx,xxx
Rigid trucks: 4 axle: with trailer GCM to 42.5 tonne xxx,xxx xxx,xxx xxx,xxx
Truck trailers GCM >42.5 tonne xxx,xxx xxx,xxx xxx,xxx
Articulated trucks: single trailer: 3 axle rig xxx,xxx xxx,xxx xxx,xxx
Articulated trucks: single trailer: 4 axle rig xxx,xxx xxx,xxx xxx,xxx
Articulated trucks: single 3 axle trailer: 5 axle rig xxx,xxx xxx,xxx xxx,xxx
Articulated trucks: single 2 axle trailer: 5 axle rig xxx,xxx xxx,xxx xxx,xxx
Articulated trucks: single trailer: 6 axle rig xxx,xxx xxx,xxx xxx,xxx
Articulated trucks: B-double: <9 axle rig xxx,xxx xxx,xxx xxx,xxx
Articulated trucks: B-double 9 axle rig and above xxx,xxx xxx,xxx xxx,xxx
Articulated trucks: Road train: 2 trailers xxx,xxx xxx,xxx xxx,xxx
Articulated trucks: Road train: 3 trailers xxx,xxx xxx,xxx xxx,xxx
Articulated trucks: > 6 axle rig (not elsewhere classified) xxx,xxx xxx,xxx xxx,xxx
Other trucks xxx,xxx xxx,xxx xxx,xxx
Buses: 2 axle: GVM 4.5 to 10.0 tonne xxx,xxx xxx,xxx
Buses: 2 axle: GVM over 10.0 tonne xxx,xxx xxx,xxx
Buses: 3 axle xxx,xxx xxx,xxx
Buses: articulated xxx,xxx xxx,xxx
Total XXX,XXX XXX,XXX XXX,XXX
Heavy vehicle charges determination – RIS February 2014 150
Appendix I: Case Studies
NTC has conducted a range of case studies to illustrate the expected impact on a range of industry participants. Most case studies are based on information obtained from industry participants, some of whom have chosen to remain anonymous.
Where we were unable to obtain the required information from industry participants, we have used data from the Survey of Motor Vehicle use to create case studies representing a hypothetical vehicle operator. These case studies are marked as ‘generic’.