
DRAFT – PLEASE TREAT APPROPIATELY - …repec.umb.edu/RePEc/files/macewan-ruiz-dollars.doc · Web...
44
Washington Dollars and the Puerto Rican Economy: Amounts, Impacts, Alternatives Arthur MacEwan and Angel Ruiz Paper presented to the Asociación de Economistas de Puerto Rico, La Vigésimacuarta Asamblea Anual, Estrategia Económica De Puerto Rico, 24 de Agosto de 2007. Abstract By examining the Washington to Puerto Rico flow of funds in some detail and comparing it with the flow of federal funds to the states, this paper demonstrates that the island’s receipt of funds is not uniquely large and cannot be viewed as representing the “largess” of U.S. taxpayers. The funds coming from Washington to Puerto Rico cannot bear the weight of responsibility for the island’s economic problems that various sources have placed upon them. Puerto Rico’s economic ills have to be explained by a larger set of factors. Nonetheless, some of the Washington to Puerto Rico transfer programs may create a set of incentives that are not in the interests of Puerto Ricans. As a result, the policy prescriptions offered here have much in common with those of analysts who see the transfer programs as a major problem, in particular with regard to the Earned Income Tax Credit. The policy prescriptions offered here, however, go beyond others in suggesting a more favorable treatment of Puerto Rico with regard to federal procurements and the Child Tax Credit. An overall message of the analysis is that the flow of federal funds could be changed in a positive rather than punitive manner to improve the operation of the Puerto Rican economy
Transcript of DRAFT – PLEASE TREAT APPROPIATELY - …repec.umb.edu/RePEc/files/macewan-ruiz-dollars.doc · Web...

Washington Dollars and the Puerto Rican Economy:Amounts, Impacts, Alternatives
Arthur MacEwan and Angel Ruiz
Paper presented to the Asociación de Economistas de Puerto Rico, La Vigésimacuarta Asamblea Anual, Estrategia Económica De Puerto Rico, 24 de Agosto de 2007.
Abstract
By examining the Washington to Puerto Rico flow of funds in some detail and comparing it with the flow of federal funds to the states, this paper demonstrates that the island’s receipt of funds is not uniquely large and cannot be viewed as representing the “largess” of U.S. taxpayers. The funds coming from Washington to Puerto Rico cannot bear the weight of responsibility for the island’s economic problems that various sources have placed upon them. Puerto Rico’s economic ills have to be explained by a larger set of factors. Nonetheless, some of the Washington to Puerto Rico transfer programs may create a set of incentives that are not in the interests of Puerto Ricans. As a result, the policy prescriptions offered here have much in common with those of analysts who see the transfer programs as a major problem, in particular with regard to the Earned Income Tax Credit. The policy prescriptions offered here, however, go beyond others in suggesting a more favorable treatment of Puerto Rico with regard to federal procurements and the Child Tax Credit. An overall message of the analysis is that the flow of federal funds could be changed in a positive rather than punitive manner to improve the operation of the Puerto Rican economy
JEL Classification: H77, O11, O19, O20, R11Key Words: Puerto Rico, Flow of Funds, Development Policy, Earned Income
Tax Credit
Arthur MacEwanDepartment of EconomicsUniversity of Massachusetts Bostone-mail: [email protected]
Angel RuizDoctoral Program of Business Administration Interamerican University of Puerto Rico, Metropolitan Branche-mail: [email protected]

DRAFT – PLEASE TREAT APPROPRIATELY
Washington Dollars and the Puerto Rican Economy:Amounts, Impacts, Alternatives 1
Arthur MacEwan and Angel Ruiz
August 2007
I. Introduction
In fiscal year 2004, Puerto Rico received $15.475 billion from the federal government, including funds in all categories of federal expenditures – ranging from federal procurements and federal salaries to support for the Nutritional Assistance Program, from Social Security and Medicare payments to grants for the public schools. This amounted to $4,003 per person on the island, as compared to per capita personal income of $11,844.2
Was this a lot or a little? How did the federal funds received by Puerto Rico compare with the federal funds received by the fifty states and DC? Which categories of funds flowing to Puerto Rico and the states from Washington were large and which were small? How might these funds have affected economic activity in Puerto Rico? Are there alternative ways that federal funds could be directed to Puerto Rico such that the economic impact would be more positive?
These sorts of questions about the Puerto Rican economy and its relation to policies in Washington have long been of interest. They have, however, been given new urgency in recent years by the relatively slow growth of the Puerto Rican economy and by a number of pronouncements to the effect that funds from Washington are responsible for the island’s economic problems, for the low rate of economic growth and a low level
1 Paper to be presented to the Asociación de Economistas de Puerto Rico, La Vigésimacuarta Asamblea Anual, Estrategia Económica De Puerto Rico, 24 de Agosto de 2007. The authors are, respectively, Professor of Economics at the University of Massachussets Boston and Professor of Economics in the Doctoral Program of Business Administration, Interamerican University of Puerto Rico, Metropolitan Branch.
2 More recent data providing the detail necessary for the empirical work presented here are not yet available. In particular, the Consolidated Federal Funds Report for Fiscal Year 2004, issued in December 2005 by the U.S. Census Bureau, is the most recent such report available. We are grateful to Arjuna Costa for many of the calculations on which this paper is based.
2

of participation in the paid labor force. These pronouncements have appeared in both the popular media and scholarly publications.
On October 23, 2006, for example, an editorial in the New York Times lamented the poor economic condition of Puerto Rico and told its readers: “Much of the blame can be put on Washington.” Suggesting that Puerto Rico was getting too much support from Washington, the Times continued:
“The study [by the Center for the New Economy (CNE) and the Brookings Institution] is spurring a debate over welfare and other social programs. Some of the economists’ prescriptions are harsh, including curtailment of food stamps. But part of the mission seems to be shock therapy. That may work and might even help to get policy makers on the search for solutions.”3
In its May 25, 2006, issue, The Economist, also drawing on the volume from the CNE and Brookings, had published an article under the heading: “Trouble on Welfare Island: Overbearing government and the welfare state are hurting the United States' poorest citizens.” The Economist opined that in Puerto Rico, “Many things have gone wrong. Most important, however, is that the United States government assumed too big a role in the Puerto Rican economy…” The “largess” of the U.S. government and “generous United States taxpayers” have, according to The Economist, generated a perverse set of practices and incentives that keeps labor participation low and undermines ambitions.
The scholarly analyses in the CNE-Brookings volume are more carefully stated and their conclusions are qualified. Yet it is readily apparent how the Times and The Economist pulled from this volume the message that excessive federal funds flowing to Puerto Rico are a foundation of the island’s economic problems. Two complementary chapters in the CNE-Brookings report are especially relevant: “Labor Supply and Public Transfers” by Gary Burtless and Orlando Sotomayor, and “Why Don’t More Puerto Rican Men Work? The Rich Uncle (Sam) Hypothesis” by María E. Enchautegui and Richard B. Freeman.
The Burtless-Sotomayor essay repeatedly describes the transfer payments from Washington to Puerto Rico as “generous” and argues:
“Low-income Puerto Ricans enjoy relatively generous income supplements and retirement benefits without imposing heavy tax burdens on highly compensated workers. The transfers received by less affluent citizens depress the incentive for them to work or to migrate to the mainland to find better jobs or wages. Because the commonwealth does not have to pay for all these transfers, benefits are almost certainly more
3 The “study” referred to by the Times is The Economy of Puerto Rico: Restoring Growth, edited by Susan M. Collins, Barry P. Bosworth, and Miguel A. Soto-Class, Center for the New Economy, San Juan, and Brookings Institution, Washington, 2006.
3

generous than would be the case if their full cost fell on island taxpayers. As a result, relatively generous redistribution on behalf of Puerto Rico’s poor, aged, and disabled populations reduces employment rates below where they would be if all transfers in the island were financed with taxes imposed on Puerto Rican residents.” (page 82-3, emphasis added)4
Enchautegui and Freeman, examine a variety of factors affecting the labor force participation rate of Puerto Rican men, including the possible incentive impact of transfer payments but also other aspects of the Puerto Rico-Washington relationship. Yet the central theme of their argument, that the largess of a “rich uncle (Sam)” is responsible for much of Puerto Rico’s economic difficulties, carries the same basic message as that of Burtless and Sotomayor. It is, moreover, a message that resonates through much of the CNE-Brookings volume.
Yet the picture presented in these popular and scholarly sources is highly misleading. A full examination of the flow of funds from Washington to Puerto Rico does not justify the “generous” characterization. A comparison of the situation of Puerto Rico to that of the individual states shows that the island’s receipt of funds is not uniquely large and cannot be viewed as representing the “largess” of U.S. taxpayers (or a “rich uncle”). A more complete picture of the situation suggests that the funds coming from Washington to Puerto Rico cannot bear the weight of responsibility for the island’s economic problems that these various sources place upon them. The economic ills given attention by Burtless and Sotomayor and by Enchautegui and Freeman have to be explained by a larger set of factors.
Nonetheless, some of the Washington-to-Puerto Rico transfer programs may create a set of incentives that are not in the interests of Puerto Ricans. As a result, the policy prescriptions offered here have much in common with those of Burtless and Sotomayor and Enchautegui and Freeman, in particular with regard to the Earned Income Tax Credit – though the prescriptions offered here go beyond theirs in suggesting a more favorable treatment of Puerto Rico with regard to federal procurements and the Child Tax Credit. Equally important, the analysis here does not provide support for the argument that Puerto Rico is getting “too much” and that the correction for the island’s economic ills may lie in a cut-off in the manner suggested in the Times’ call for “shock therapy.” Indeed, an overall message of the analysis here is that the flow of federal funds could be changed in a positive rather than punitive manner to improve the operation of the Puerto Rican economy
4 The emphasis given by Burtless and Sotomayor to the point that the benefits received in Puerto Rico do not place a tax burden on highly compensated Puerto Ricans is somewhat misleading. In their analysis, benefits received through payroll taxes are an important issue, and Puerto Ricans pay the payroll taxes just like citizens in all of the states. In this regard, then, the situation of Puerto Rico is the same as that of the individual states.
4

II. How Large is the Flow of Funds to Puerto Rico: Comparison with the States
A. A Starting Point: The Gross Flow of Funds
There are various ways to appraise the magnitude of funds flowing from Washington to Puerto Rico. To begin with, taking as a starting point the $4,003 per capita that Puerto Rico received in fiscal year 2004, the island received less from the federal government than did any state or the District of Columbia (DC). In that year, the average per capita funds going to the states, DC and Puerto Rico was $7,273. Thus, in per capita terms, Puerto Rico received 55 percent of the average.
What was true overall was also true in almost every broad category of funds that go from the federal government to the states, DC and Puerto Rico: in per capita terms, Puerto Rico was at the bottom or near the bottom of the list. A summary of Puerto Rico’s position for fiscal year 2004 is shown in Table 1.5 Regarding the various categories of funds shown in Table 1:
In the largest category, which includes social security, disability and Medicare, in fiscal year 2004 Puerto Rico received $1,903 per capita, less than any state or DC; this was only 58.6 percent of the average. Puerto Ricans pay the payroll taxes that contribute to the financing of these receipts.
In the category “other direct payments,” which includes funds for the Nutritional Assistance Program (food stamps) and other welfare-type payments, Puerto Rico’s position rises to 49th.6 Its receipts per capita of $331 in fiscal year 2004 were 72.9 percent of the average. All payments in this category amounted to 2.8 percent of per capita personal income in Puerto Rico in 2004. (See notes to Table 1 for more on the content of this category.)
In the large category of “grants” – second to social security, disability and Medicare – Puerto Rico received $1,373 per capita and rose to 38th on the list (89 percent of the average). This category includes several programs that are designed – either by formula or discretionary policy – to support low-income areas. (See notes to Table 1 for more on the content of this category.)
5 Data in the tables for this paper are from the following sources: IRS Data Book, FY 2004; Consolidated Federal Funds Report for Fiscal Year 2004, U.S. Census Bureau; Bureau of Economic Analysis: Regional Economic Accounts; Government Development Bank for Puerto Rico.
6 The food stamp program as such has not existed in Puerto Rico since 1982, when, as pointed out by Burtless and Sotomayor, “…the federal government eliminated the standard food stamp program in Puerto Rico and replaced it with a nutrition block grant payable to the commonwealth government…To maintain a food assistance program under a smaller budget, the commonwealth government established a replacement program known as the Nutritional Assistance Program (NAP).” (p. 99).
5

Table 1: Federal Government Payments to Puerto Rico Per Capita; Rank of Puerto Rico Among States, DC, and Puerto Rico; and Payments to Puerto Rico as a Percentage of Average to States, DC and Puerto Rico, Fiscal Year 2004
Category of Payments Amount per capita Rank Percent of AverageRetirement, Disability & Medicare $1,903 52 58.6Other Direct Payments7 331 49 72.9EITC and CTC8 13 52 5.3Grants9 1,373 38 89.0Salaries and Wages 265 52 35.6Salaries and Wages w/o Defense 180 52 41.0Procurement 119 52 11.1Procurement w/o Defense 46 52 11.6
7 Other Direct Payments consist primarily of direct payments for individuals, other than retirement, disability and Medicare. Major categories of such payments include unemployment compensation, food stamp payments, federal employees’ life and health insurance and agricultural assistance.
8 Tax credits under the Earned Income Tax Credit and Child Tax Credit Programs. Puerto Ricans are generally not eligible for either of these credits with regard to income earned on the island; they are eligible for the Child Tax Credit if they have three or more children.
9 Grants include both Formula Grants (allocation of money to states and subdivisions according to a distribution formula prescribed by law and not related to a specific program) and Project Grants (funding of either specific projects or the delivery of specific products and services). Principal funders include the departments of Health and Human Services, Transportation, HUD, Education and Agriculture.
6

Puerto Ricans are generally not eligible for the Earned Income Tax Credit or the Child Tax Credit. (The main exception is that Puerto Ricans may claim the latter when they have three or more children.) Thus for this “tax expenditure,” Puerto Rico is not only at the bottom of the list, but receives only 5.3 percent of the average.
In the categories of federal wages and salaries and procurements, Puerto Rico is again at the bottom of the list, receiving 35.6 percent of the average in the former category and 11.1 percent in the latter.
Thus when the dispersal of federal funds is viewed in terms of payments per capita, Puerto Rico does not appear to receive very much from the federal government. Quite the contrary: the island receives significantly less than any state or DC. Even when focus is placed on those categories of funds that are usually classified as social welfare or as directed toward low-income regions, Puerto Rico does not stand out as a large recipient in terms of the per capita receipt of funds from the federal government. Also, as is well known, while federal procurements and federal payments of wages and salaries serve other functions as well, they are also used to support jobs and incomes in the various parts of the country; and Puerto Rico’s share in this category of funding is especially low.
B. The Flow in Relation to Income
When, however, the dispersal of federal funds is viewed in relation to the per capita personal income of the states, DC and Puerto Rico, the situation might be subject to a different interpretation. After all, in 2004, per capita personal income in Puerto Rico was only slightly more than one-third of per capita personal income in the states, DC and Puerto Rico taken all together – $11,844 as compared to $32,620.
Table 2, then, shows that in relation to personal income, Puerto Rico ranked fourth in terms of the amount of funds it received from Washington. For Puerto Rico, in 2004 total funds per capita coming from Washington amounted to 33.8 percent of per capita personal income. DC (132.8 percent), Alaska (38.1 percent) and New Mexico (40.2 percent) each received more in relation to per capita personal income than did Puerto Rico; Virginia (33.8 percent), West Virginia (32.8 percent), North Dakota (32.5 percent), and Mississippi (31.8 percent) received only slightly less. Of course in some of these states, and especially DC, wages and salaries and procurement play an especially large role. But, again, federal wages and salaries and procurement expenditures are used to support jobs and incomes (though DC and perhaps Virginia are special cases).
7

Table 2: Federal Government Payments to Puerto Rico Per Capita as a Percentage of Per Capita Personal Income; Rank of Puerto Rico Among States, DC, and Puerto Rico; and Payments to Puerto Rico as a Percentage of Average to States, DC and Puerto Rico, Fiscal Year 200410
Category of Payments Percent of Per Capita Personal Income
Rank Percent of Average
Retirement, Disability & Medicare
16.1 2 161.6
Other Direct Payments 2.8 7 201.1EITC and CTC 0.1 52 15.7Grants 11.6 3 245.2Salaries and Wages 2.2 27 96.5Salaries and Wages w/o Defense
1.5 16 111.5
Procurement 1.0 51 30.3Procurement w/o Defense 0.4 49 32.9Total 33.8 4 153.6
10 See notes to Table 1.
8

Table 2 also shows that in no broad category was Puerto Rico receiving the largest amount of funds per capita in relation to per capita personal income. With regard to the largest category – retirement, disability and Medicare – West Virginia ranked higher, receiving an amount in this category of 17.3 percent of per capita personal income, as compared to Puerto Rico’s 16.1 percent. (In the retirement, disability and Medicare category, where Puerto Rico ranks second to the top, it is important to keep in mind, as noted above, that Puerto Ricans contribute to the payroll taxes that finance these payments – as do people throughout the United States.) In the other large category, grants, Puerto Rico ranked third behind DC and Alaska. In the “other direct payments” category, including the Nutritional Assistance Program (food stamps), Puerto Rico was seventh. And in the procurement category, Puerto Rico is almost at the bottom; and of course with regard to CTC and EITC, Puerto Rico is last on the list.
Much of federal payments to states, DC and Puerto Rico is intended and justified precisely on the basis that those payments are a means to provide support where incomes are low. This is true not only of such programs as food stamps and the large category of “grants,” but it is also to some degree the case for procurements and various other forms of federal spending. Thus, as we would expect, many of the states that rank high in terms of the funds they receive relative to personal income are the states with low personal income per capita. Puerto Rico has a per capita personal income well below that of any state (in 2004, 48.3 percent of that of Mississippi, the lowest income state). Still, Puerto Rico is not at the top of the list, not overall and not in any category.
C. The Net Flow by Various Measures
Perhaps it could be argued that Puerto Rico receives a large amount of federal funds relative to the amount of federal taxes that Puerto Ricans pay. Puerto Ricans do not pay federal income tax on income earned in Puerto Rico, though they do pay federal payroll taxes. Thus the payments by Puerto Rico to the federal government are small relative to states.11
Yet, when Puerto Rico, DC and the states are ranked by net receipts per capita from the federal government – that is, receipts less federal taxes – Puerto Rico is far from the top of the list. For fiscal year 2004, when all categories of federal expenditures are taken into account, Puerto Rico ranks 19th. Alaska, the highest ranking state, received on net
11 As evident in the quote in the Introduction above, Burtless and Sotomayor give some importance to this net concept, arguing: “Because the commonwealth does not have to pay for all these transfers, benefits are almost certainly more generous than would be the case if their full cost fell on island taxpayers.” However, see footnote number 4 above.
9

$8,005 per capita; Puerto Rico on net received $2,823.12 Table 3 presents these data for the fifty states, Puerto Rico, and DC.
Table 3: Per Capita Net Receipts of Federal Funds, 2004: States, Puerto Rico, and DC(dollars)*
Net Receipts RankNet Receipts
Rank
District of Columbia 37,457 1 Missouri 1,381 27Alaska 8,005 2 Kansas 1,282 28New Mexico 7,348 3 Indiana 1,019 29Virginia 5,940 4 Oregon 916 30West Virginia 5,562 5 New Hampshire 689 31North Dakota 5,157 6 Pennsylvania 658 32Montana 4,792 7 Washington 525 33Mississippi 4,700 8 North Carolina 236 34Alabama 4,629 9 California -62 35South Dakota 4,389 10 Nevada -129 36Maryland 4,383 11 Rhode Island -188 37Maine 4,175 12 Michigan -225 38South Carolina 3,586 13 Arkansas -310 39Kentucky 3,514 14 Georgia -350 40Hawaii 3,093 15 Texas -380 41Arizona 2,984 16 Wisconsin -473 42Wyoming 2,980 17 Massachusetts -837 43Louisiana 2,887 18 Colorado -906 44Puerto Rico 2,823 19 Ohio -1,181 45Vermont 2,596 20 New York -1,370 46Idaho 1,887 21 Nebraska -1,385 46Oklahoma 1,858 22 Illinois -2,393 48Utah 1,826 23 Connecticut -3,223 49Iowa 1,768 24 New Jersey -4,025 50Florida 1,677 25 Minnesota -5,639 51Tennessee 1,557 26 Delaware -7,010 52
* Net receipts are all federal expenditures to the state, Puerto Rico, or DC less totaltaxes paid to the federal government from the state, Puerto Rico, or DC.
12 The District of Columbia is at the top of the list, with net per capita receipts of $37,457, but it is clearly a special case. Several of the states, including Alaska and New Mexico (right behind Alaska with $7,348 per capita) owe their high rankings to large military expenditures relative to population; and Virginia, next on the list, ranks high because of its proximity to Washington. However, several of the states ranking higher than Puerto Rico are not obvious “special cases” – for example, West Virginia, Mississippi, Alabama, Maine, South Carolina and Louisiana.
10

Puerto Rico’s position may be surprising because, as noted, Puerto Ricans do not pay federal income tax on Puerto Rican source income. The very small amounts of federal wages and salaries and federal procurement expenditures received in Puerto Rico provide a large part of the explanation for its low (relative to expectations) ranking. Puerto Rico is near the top of the ranking only when retirement, disability and Medicare are considered alone. (See Appendix I for these more detailed results.)
The meaning of these net measures is not clear, and there is little rationale – if any – behind the idea that the payments of the states and regions to the federal government should balance their receipts. Federal payments are designed to serve multiple functions, ranging from providing income and employment in relatively low-income regions to building infrastructure (e.g., highways) throughout the country to establishing military bases and purchasing military equipment. There is no reason that for any state or region the payments should equal the receipts. Indeed, because of an implicit federal commitment to support regional income convergence, it is to be expected that low-income regions would necessarily have relatively large net receipts and relatively low payments. (Moreover, as will be demonstrated shortly, if balanced fiscal relations with the federal government were imposed on the individual states and Puerto Rico, the impacts could be devastating.)
Yet even accepting the net receipts measure as meaningful, Puerto Rico is far from the top of the list, as shown in Table 3. Furthermore, if the data on net federal receipts are viewed in relation to personal income, an approach that makes Puerto Rico’s ranking relatively high, the island does not stand as an outlier, distinct from high recipient states. (See Appendix I for details.)
III. Economic Impact
There are at least two ways that the flow of federal funds to the states, Puerto Rico, and DC affect local economies. On the one hand, clearly the federal funds provide a demand stimulus to economic activity, creating jobs and raising incomes.13 Indeed, it is reasonable to assume that there is a multiplier impact, with each dollar of federal funds going to a state creating more than a dollar of additional income in that state. On the other hand, federal funds flowing to a region may have a negative impact. A heavy reliance on federal defense procurements, for example, could pre-empt the development of other types of business activity in a region. Or, as Burtless and Sotomayor and Enchautegui and Freeman argue, the flow of social welfare funds to a region might undermine work incentives and help explain Puerto Rico’s low labor force participation rate – about 47 percent as compared to 66 percent in the states.
13 The stimulus is at the margin, a stimulus resulting from an extra dollar of fund going to a region, given the amount of taxes or federal borrowing that comes out of that region. Whether or not the overall stimulus from the inflow of federal funds to a region is greater than the outflow of funds (federal taxes and borrowing) from that region is a separate and more complex question. In general, however, for those regions (Puerto Rico, DC and several states) where the inflow of funds is substantially greater than the outflow of taxes and borrowing, the stimulus would clearly be positive.
11

As to the positive economic impact of the federal flow of funds to the states, DC and Puerto Rico, the data suggest that several states receive a larger positive stimulus than does Puerto Rico. Table 4 provides a crude estimate of the impact of the demand stimulus provided by the flow of federal funds to Puerto Rico, the states and DC. The table shows the decline (or increase) in GDP for each state, DC and Puerto Rico that would result from changing the net flow of federal funds to zero – that is by moving to a situation where the federal funds flowing to each region equaled the federal taxes flowing from that region, assuming a multiplier of 2. (That is, $2 of GDP would be lost for every $1 reduction in the net flow of federal funds. It should be emphasized that this is only illustrative, but the relative impacts in Puerto Rico and the various states would be the same regardless of the value of the multiplier that is assumed. In reality, however, the multiplier for the different states would vary depending on the nature of federal expenditures and local conditions.)
For Puerto Rico, the impact would be large, with a reduction of GDP of 27.7 percent (the right hand column of Table 4). Or, putting things the other way, the net flow of funds that come to Puerto Rico can be viewed as increasing GDP by 38.4 percent over what it would be without the net inflow of federal funds. However, for seven states (to say nothing of DC) the impact on GDP would be larger. In this crude case, New Mexico’s GDP would be 43.9 percent smaller without the federal funds; West Virginia’s, 40.5 percent smaller; and Mississippi’s 35.4 percent smaller. Certainly Puerto Rico’s economy is stimulated by the net inflow of federal funds, but not as much as the economies of several states.
Regarding the potential negative impact of the flow of federal funds, the possibility of the pre-emption of other types of business activity because of federal procurement is not of significant relevance for Puerto Rico. But what about the impact of federal funds on work incentives?
A determination of the role of federal funds in affecting work incentives in Puerto Rico would require an examination of particular programs, how they are structured, and how they are implemented. Such an examination is beyond the scope of this paper. Burtless and Sotomayor and Enchautegui and Freeman have begun this task, and their analyses suggest the existence of a problem.
However, the data presented here – either the aggregate flow of funds or the flow of funds in particular broad categories – do not suggest that Puerto Rico presents a special case, a case of extreme overall reliance on federal funds in a manner that would undermine work incentives. The per capita federal funds received by each state, DC and Puerto Rico are independent of the per capita amount of taxes paid by each of these entities. Therefore it is the variation of gross federal expenditures in relation to per capita income, not the variation of net expenditures (federal expenditures minus taxes) that would have an impact (if any) on work incentives. The gross figures are those of Table 2. While the data in Tables 3 (and the data in the appendix tables) may be interesting and useful, they are largely irrelevant to the work incentives issue.
12

Table 4: Impact on Per Capita Gross Domestic Product of the States and Puerto Rico Assuming the Removal of All Net Federal Expenditures and a Multiplier Effect of 2, Fiscal Year 2004
13
GDP Per Capita
State Rank
Net Expend. Per Capita
State Rank
Adjusted GDP Per Capita
State Rank
Change in Rank
% Change in GDP
Total U.S + P.R. 39,438 528 38,383
District of Columbia 140,030 1 37,457 1 65,117 2 (1) 53.5%New Mexico 33,439 41 7,348 3 18,744 49 (8) 43.9%West Virginia 27,489 50 5,562 5 16,366 51 (1) 40.5%Mississippi 26,561 51 4,700 8 17,161 50 1 35.4%Montana 29,759 49 4,792 7 20,175 48 1 32.2%Alabama 31,205 47 4,629 9 21,947 47 - 29.7%Alaska 54,907 3 8,005 2 38,898 19 (16) 29.2%North Dakota 35,771 34 5,157 6 25,457 43 (9) 28.8%Puerto Rico 20,355 52 2,823 19 14,708 52 - 27.7%Virginia 43,839 10 5,940 4 31,960 33 (23) 27.1%Maine 32,840 42 4,175 12 24,489 45 (3) 25.4%South Carolina 31,322 45 3,586 13 24,151 46 (1) 22.9%South Dakota 38,526 22 4,389 10 29,747 38 (16) 22.8%Kentucky 32,080 43 3,514 14 25,052 44 (1) 21.9%Maryland 41,507 15 4,383 11 32,741 32 (17) 21.1%Arizona 33,818 40 2,984 16 27,850 41 (1) 17.6%Louisiana 35,473 36 2,887 18 29,698 39 (3) 16.3%Hawaii 39,782 19 3,093 15 33,596 30 (11) 15.6%Vermont 35,391 37 2,596 20 30,199 37 - 14.7%Wyoming 47,563 6 2,980 17 41,603 13 (7) 12.5%Idaho 31,228 46 1,887 21 27,453 42 4 12.1%Oklahoma 31,740 44 1,858 22 28,025 40 4 11.7%Utah 34,552 39 1,826 23 30,899 35 4 10.6%Florida 35,027 38 1,677 25 31,674 34 4 9.6%Iowa 37,303 28 1,768 24 33,767 27 1 9.5%Tennessee 36,735 31 1,557 26 33,620 28 3 8.5%Missouri 35,771 35 1,381 27 33,010 31 4 7.7%Kansas 36,164 33 1,282 28 33,601 29 4 7.1%Indiana 36,785 30 1,019 29 34,747 26 4 5.5%Oregon 37,449 26 916 30 35,617 25 1 4.9%Pennsylvania 37,380 27 658 32 36,064 24 3 3.5%New Hampshire 40,080 18 689 31 38,702 20 (2) 3.4%Washington 40,795 16 525 33 39,745 15 1 2.6%North Carolina 37,929 24 236 34 37,457 22 2 1.2%California 42,325 13 (62) 35 42,449 11 2 -0.3%Nevada 42,464 12 (129) 36 42,722 10 2 -0.6%Rhode Island 38,722 21 (188) 37 39,097 18 3 -1.0%Michigan 36,252 32 (225) 38 36,702 23 9 -1.2%Georgia 38,477 23 (350) 40 39,176 17 6 -1.8%Texas 40,160 17 (380) 41 40,921 14 3 -1.9%Arkansas 30,048 48 (310) 39 30,668 36 12 -2.1%Wisconsin 37,709 25 (473) 42 38,655 21 4 -2.5%Massachusetts 48,734 5 (837) 43 50,407 6 (1) -3.4%Colorado 43,768 11 (906) 44 45,580 9 2 -4.1%New York 47,162 8 (1,370) 46 49,901 7 1 -5.8%Ohio 37,104 29 (1,181) 45 39,465 16 13 -6.4%Nebraska 38,913 20 (1,385) 47 41,682 12 8 -7.1%Illinois 41,981 14 (2,393) 48 46,767 8 6 -11.4%Connecticut 52,080 4 (3,223) 49 58,525 3 1 -12.4%New Jersey 47,168 7 (4,025) 50 55,218 5 2 -17.1%Delaware 62,982 2 (7,010) 52 77,001 1 1 -22.3%Minnesota 44,035 9 (5,639) 51 55,313 4 5 -25.6%
Source: Bureau of Economic Analysis: Regional Economic Accounts (Gross Domestic Product by State) Puerto Rico data from Government Development Bank for Puerto Rico Consolidated Federal Funds Report for Fiscal Year 2004, US Census Bureau

The data in Table 2 presenting “Federal Government Payments to Puerto Rico Per Capita as a Percentage of Per Capita Personal Income” do not show Puerto Rico as an outlier; it is not the exceptional region. Even looking at those categories of expenditure that might be associated with a negative work incentive – social security, Medicare and disability; other direct payments; and grants – in none does Puerto Rico rank at the top. Indeed, in the case of “other direct payments,” Puerto Rico ranks 7th; this category includes “foods stamps” (actually the Nutritional Assistance Program), often referred to (e.g., in the Times editorial) as a major negative work incentive in Puerto Rico. The first category of Table 2, including disability payments, is one where negative work incentives might arise. Even here, Puerto Rico (16.1 percent) is not at the top of the list, ranking second to West Virginia (17.3 percent), and not far from Mississippi, Alabama and Arkansas (14.6 percent, 14.5 percent and 14.5 percent, respectively).
Although Puerto Rico’s situation with regard to the flow of funds from Washington is comparable to that of several individual states, it is still possible that the Washington connection may have some negative impacts on the Puerto Rican economy – but it is also likely that these same negative impacts would exists in some of the states, e.g., West Virginia and Mississippi. In the next section, attention will be given to alternative ways in which the fiscal relation with Washington might be structured, ways that would have more positive impacts on Puerto Rico.
Here, however, it is useful to note that laying the blame for the malaise of the Puerto Rican economy on the flow of funds from Washington is not only problematic in itself, as argued above. In addition, such an explanation ignores numerous other factors affecting the low labor force participation rate and the weak performance of the island’s economy. For example:
The severe fiscal problems of the Puerto Rican government have created a degree of uncertainty that weakens private sector activity. Following the crisis of spring 2006 and the downgrading of Puerto Rican government bonds, the public sector has been limited in providing essential support for business in terms of infrastructure and other services.
The continuing debate and uncertainty over Puerto Rico’s political status undermines investment, as business continue to be unsure of the longer run ‘rules of the game.’
Economic policy emanating from Washington and not directly related to the flow of funds, has been problematic. After the early success of “Operation Bootstrap,” in the third quarter of the last century, there has been no effective development policy for the island. Section 936, while yielding major gains for U.S. firms, did little to support Puerto Rican employment or economic growth.
The large informal sector, while not unrelated to the incentives embodied in transfer payments, has broader roots, tied to the overall structure of the Puerto Rican economy and the low level of income. In this regard, Puerto Rico’s
14

experience is more reasonably compared to that of other parts of Latin America than to the states.
Likewise, Puerto Rico’s low level of labor force participation is partly explained by the role of women, perhaps more akin to that in low-income countries than to that in the states.
The unusual connection to the economy on the mainland generates numerous problems for Puerto Rico, ranging from an apparent “brain drain” to a disadvantageous set of incentives regarding work and education.
Furthermore, there is a problem is explaining the slow growth of the Puerto Rican economy as a consequence of the low labor force participation rate, which in turn is seen by Burtless and Sotomayor as largely a result of the incentives associated with funds from Washington. It is not reasonable to explain a low rate of growth by a low and relatively stable level of labor force participation. Even if the low level of labor force participation were explained by the incentives embodied in transfer payments, that level has been relatively stable since the late 1970s and cannot explain the continuing slow growth of the economy since that time. 14
Thus, beyond the analysis we have presented above, there is much more to an explanation of Puerto Rico’s weak economic performance in recent years than the structure or size of transfer payments from Washington.
IV. Alternatives
Nonetheless, Puerto Rico does have serious economic problems. While it is not reasonable to attribute these problems to the level of the federal funds that flow to the island, the form of those funds may be a factor. The issues raised by Burtless and Sotomayor and by Enchautegui and Freeman, as well as by others, are relevant, notwithstanding the analysis we have developed above. The incentives embodied in various federal expenditures are important aspects of economic policy in general, and they may be of special importance in Puerto Rico even while they may only be a part of the problem.
The question is: What sorts of policies are most appropriate to improve the incentive impact of federal funds coming to Puerto Rico? Punitive policies such as those suggested by the NY Times in its reference to “shock therapy” cannot be taken seriously. They would, first of all, be counterproductive in that any positive incentive impact would likely be outweighed by the negative demand impact. Furthermore, as the discussion above indicates, punitive policies toward Puerto Rico could not be justified without similar policies being applied to the various states. Such policies would be more economically damaging to several states than to Puerto Rico (see Table 4) and are a political impossibility.
14 See Burtless and Sotomayor’s figure on page 85.
15

There are, however, positive policies that could be adopted in structuring the flow of federal funds to Puerto Rico. One of these has been given considerable attention in the CNE-Brookings volume, namely the extension of the Earned Income Tax Credit (EITC) to Puerto Rico. Making Puerto Ricans eligible for the EITC could have a considerable positive impact, especially if combined with an expansion in Puerto Rico of the Child Tax Credit (for which Puerto Ricans are now eligible only if they have three or more children). A second positive policy would be expanding the amount of federal procurement expenditures in Puerto Rico.
These sorts of policies have direct positive impacts, creating jobs and incentives to work. Also, by bringing more people into the work force and raising incomes, they have the potential indirect impact of reducing federal transfers in those categories that are often cited as creating the most problematic incentive effects – i.e., the Nutritional Assistance Program (food stamps) and Disability Payments (under SSI). Accordingly, in what follows, we examine each of these policy alternatives.
A. The Earned Income Tax Credit and the Child Tax Credit
The Earned Income Tax Credit (EITC) and Child Tax Credit (CTC) are currently not available to Puerto Ricans on the island. These tax credits are tied to the federal income tax, and Puerto Ricans on the island do not pay federal income tax on Puerto Rican source income.15
There are, however, good reasons to include Puerto Rico in these programs. A primary justification for the EITC has been to offset the regressive payroll taxes, and Puerto Ricans pay both Social Security and Medicare taxes. Also, both credits have been put in place and expanded in order to alleviate poverty by supplementing earned income and thus providing an incentive for people to draw a paycheck. The poverty rate in Puerto Rico is substantially higher than on the mainland, with about fifty percent of Puerto Ricans living below the poverty line. Furthermore, the EITC has been designed to encourage people to participate in the paid labor force, and, as emphasized above, Puerto Rico has an especially low labor force participation rate.
In addition, there is an issue of fairness. In 2006, a Puerto Rican single head of a household with two children and earning $25,000 from work would have paid Social Security and Medicare taxes of $1,912.50. A person living in the states with the same income form work and the same family circumstances – perhaps the sister of the person in Puerto Rico – would also have paid $1,912.50 in Social Security and Medicare taxes. But the person living in the states would have received a tax rebate of $3,627 because of the EITC and CTC. Both start off with $25,000 in earned income. The person in Puerto Rico, after paying federal taxes, ends up with $23,087.50. The person in the states ends up with $26,714.50.16 15 The EITC is available to Puerto Ricans if they earn incomes from work in the states and thus file federal income tax returns. The CTC is available to Puerto Ricans with three or more children, as noted above.
16 These figures were generated using TurboTax 2006.
16

The fact that Puerto Ricans on the island do not pay federal income tax has sometimes been cited to justify their exclusion from the EITC and the CTC. In fact, many recipients of EITC and CTC in the states do not pay any federal taxes simply because their incomes are too low. Furthermore, illustrating that there is no need to tie the credits to federal income tax payment, Puerto Ricans who have three or more children can claim the CTC by filing a federal tax form but paying no federal income taxes. The same procedure could be adopted for the EITC and for families with one or two children.17
Beyond its impact on individual families – the improvement of their living standards and moving them from welfare roles to paid employment – extending the EITC and CTC would provide a significant stimulus to the Puerto Rican economy. The stimulus would be both direct, by increasing consumer demand, and indirect, by encouraging a higher labor force participation rate. The impact from the expansion of consumer demand alone could raise overall income on the island by as much as three percent. (See Appendix II-C regarding the basis of this estimate.) Together, the infusion of funds and the greater engagement in productive work would make a major contribution towards transforming the island’s economy out of relative stagnation and onto a healthy growth rate.
Our estimate of the impact of extending the EITC and CTC to Puerto Ricans on the island indicates that for 2006 the cost would have been approximately $1 billion. As the Puerto Rican economy grows over the next decade, costs would decline slightly each year because a smaller share of families would be eligible for these tax credits. (The details of the procedures for these cost estimates are explained Appendix II-A.) This $1 billion estimate does not take into account the degree to which extending these programs to Puerto Rico would raise the rate of economic growth on the island, as noted above through both direct stimulus and greater labor force participation. More rapid economic growth would raise incomes and move many Puerto Ricans to positions where they would no longer receive (or need) these credits. Thus, in a sense, the extension of the EITC and CTC to Puerto Rico would in effect be partially self-financing.
We have used an input-output framework to trace the demand impact of this additional $1 billion. The open input-output model was solved by assuming the $1 billion
17 There is, however, an additional and different issue of fairness. Were these credits extended to Puerto Rico, the fact that Puerto Ricans do not pay federal income tax would make it necessary to enact an adjustment in their application on the island. In the states, when the income level of a family is high enough so that without the EITC and CTC the family would be paying some tax, the family’s refund from these programs amounts to the credits minus the tax owed. Applied to Puerto Rico, where the family would not be libel for any federal income tax, the refund would be larger for any level of income (at higher levels of eligibility for the credits). It would seem appropriate, therefore, in extending the EITC and CTC to Puerto Rico that the refund be no greater than it would be for an equivalent family in states. In all the cost calculations discussed here, it is assumed that such a “cap” on EITC and CTC refunds would be enacted for Puerto Rico. (See the example in Appendix II.)
17

was distributed according to proportions derived from the vector of consumer expenditures of input-output data bank. Table 5A below summarizes the results.
The data of Table 5A show that if EITC and CTC programs had been extended to Puerto Ricans during year 2006 direct and indirect employment would have increased by 15,474. Had labor force remained unchanged the additional employment would had reduced the unemployment rate of fiscal year 2006 by one percentage point (from 11.7% to 10.7%). Value added in the form of wage income would have increased by $242.9 million at constant 1992 prices and 320.1 million at current 2006 prices.
In terms of the impact on particular sectors, wholesale and retail trade, other services (specially professional services) and manufacturing would had greatly benefited in terms of jobs and income created. The impacts by sector are shown in Table 5B.
18

Table 5A
Table 5B
19
DIRECT AND INDIRECT IMPACT OF EXTENDING THE EITC AND CTC TO PUERTO RICANS ASSUMING $1 BILLION INITIAL COST, HAD THE PROGRAM INITIATED IN YEAR 2006Final Demand (in thousand dollars) Constant 1992 prices 777,959.0 Current prices 1,000,000Output (in thousand dollars) Constant 1992 prices 1,138,613.7 Current prices 1,807,043.1Direct and Indirect employment 15,474Direct and Indirect Income (in thousand dollars) Constant 1992 prices 242,921.5 Current prices 320,072.0
IMPACT OF EXTENDING EITC AND CTC PROGRAMS TO PUERTO RICANS ASSUMING AND INITIAL COST OF $I BILLION, FISCAL YEAR 2006
Final Direct and IndirectDemand Output Direct and Indirect Income
Industrial Sector (in thousand $) (in thousand $) Employment (in thousand $)Agriculture 7,004.0 17,995.7 554 5,651.9Mining and Construction 0.0 16,321.6 214 2,400.8Manufacturing 133,458.0 203,766.5 1,565 46,376.8Transportation, Communications andPublic Utilities 60,587.0 112,077.1 1,287 30,890.7Wholesale and Retail trade 262,107.0 309,121.0 4,406 55,961.9Finances, Insurance and Real State 173,322.0 251,295.4 780 18,935.3Other Services 123,473.0 199,758.9 5,894 64,253.3Govrnment 18,008.0 28,277.7 774 18,450.8Total 777,959.0 1,138,613.7 15,474 242,921.5
B. Federal Procurement Expenditures
As pointed out above, Puerto Rico receives an especially small amount of funds from the federal government in terms of procurements. In terms of receipts per capita, Puerto Rico ranks behind all of the states and DC, receiving only 11.1 percent of the average. When the figures are computed in relation to per capita personal income, only one state ranks below Puerto Rico (Delaware, with a relatively high income and a small amount of federal procurement); by this measure, Puerto Rico gets 30.3 percent of the average. (See Tables 1 and 2.) Federal procurement expenditures, as payments for goods and services, directly create jobs and bring people into the labor force.
While federal procurements are formally expenditures to meet particular needs of the federal government (and do serve those needs), it is widely recognized that they are distributed among the states in a political process. They are, moreover, often used to create jobs and bolster income in relatively low-income states. It is noteworthy, therefore, that Puerto Rico receives such a small share of federal procurement expenditures.
How would Puerto Rico be affected were it to receive a larger amount of these expenditures? In 2004, Puerto Rico received $462 million in this category, or $119 per capita. It seems reasonable to suggest that Puerto Rico’s share of federal procurements should be what its economy could manage, and its economy is smaller than that of the average in the states. If Puerto Rico were to receive a share of federal procurements expenditures equal to that of states in relation to per capita income (one measure of the capacity of the economy), the $462 million would rise to $1.391 billion, an increase of $929 million. Alternatively, if Puerto Rico were to receive a share of federal procurements expenditures equal to that of states in relation to per GDP (an alternative and substantially larger measure of the capacity of the economy), the $462 million would rise to $2.088 billion, an increase of $1.626 billion.
We have then carried out two input-output experiments, increasing federal procurements as follows:
$1,391 million, or an increase of $929 million, representing what Puerto Rico would get if it got the same as the states on per capita income basis.
$2,088 million, or an increase of $1,626 million, representing what Puerto Rico would get if it got the same as the states on a per capita GDP basis
The above figures were distributed to the final demand vector of our input-output model by using proportions of 2004 procurement expenses of federal government by industrial sector. The results of the experiments are shown in Table 6 below.
20
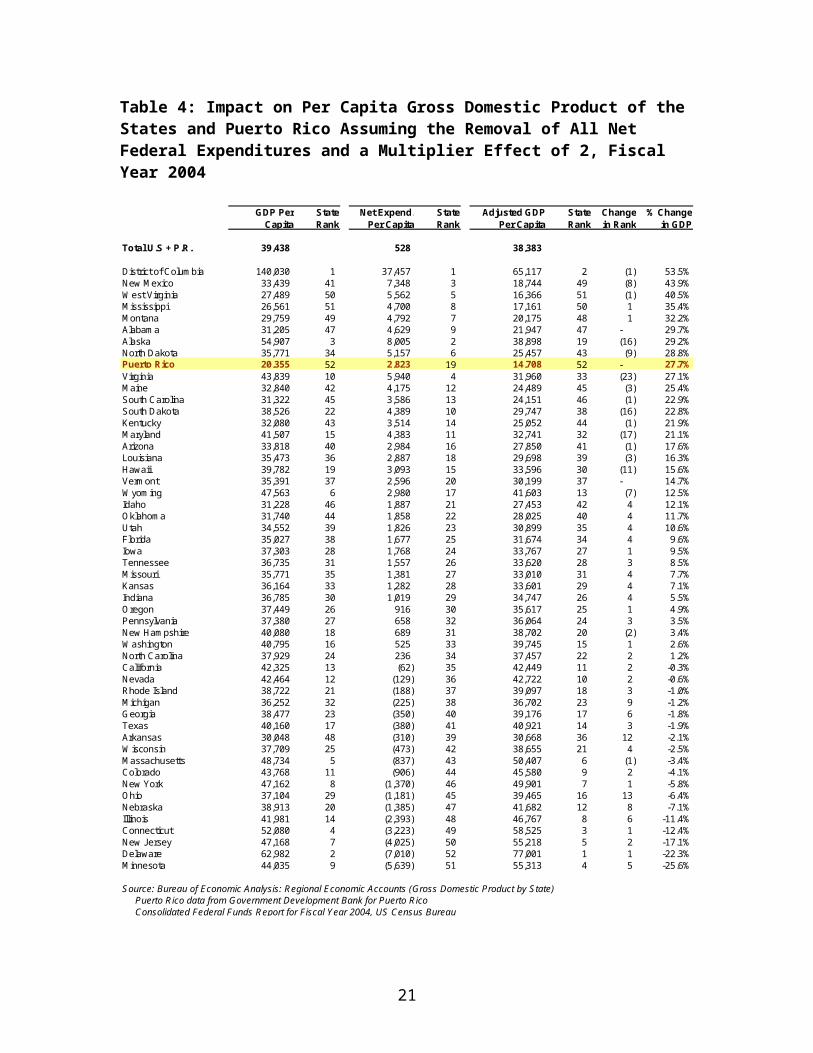
Table 6
21
SUMMARY RESULTS OF TWO EXPERIMENTS: INCREASING ACTUAL 2004 PROCUREMENT FIGURES BY $1,626 AND $929 MILLION RESPECTIVELY (thousand dollars)
First Experiment: Second Experiment:Actual Final Increasing Increasing
Demand Procurements ProcurementsProcurement, 2004 by $1,626 million by $929 million
Procurement Asigned to Final DemandConstant 1992 prices 368,379 1,626,000 929,000Current 2004 prices 462000 1,664,883 1,109,125Output GeneratedConstant 1992 prices 545,368.1 2,464,780.7 1,642,006.6Current 2004 prices 802,886.1 3,628,628.5 2,417,347.8Direct and Indirect Employment 6,290 28,428 18,939
Direct and Indirect IncomeConstant 1992 prices 104,276.1 471,274.0 313,956.9Current 2004 prices 125,162.4 565,669.3 376,842.0

Both experiments indicate that the impact on increased federal procurements expenditures on employment would have been quite significant. In the first experiment, with the larger increase in federal procurement expenditures, the direct and indirect employment increase amounted to 28,428. If the labor force had remained constant at 1,360,000, employment would have increased from 1,206,000 to 1,234,428 reducing the unemployment rate from 11.4% to 9.3%. In the second experiment the unemployment rate for fiscal year 2004 would had been reduced from 11.4% to 10%.
Gross Domestic Product is approximately 50% of gross output (intermediate plus final demand). Assuming this percentage, in the first experiment GDP would have increased from 79,209.4 to 82,838.03. From 2003 to 2004 the rate of increase of GDP (at constant prices) was 3.0%. Adding the results of the first experiment, the GDP increase would have been 5.4%, or 2.4% more than the actual figure. For illustration purposes the results were obtained under the assumption that the whole impact was felt in year 2004 which of course it is not necessarily true.
As with the impact of extending the EITC and CTC to Puerto Rico, this infusion of federal expenditures could yield a substantial increase in the level of economic activity. While increased federal procurements do not embody the explicit work incentives that are embodied in tax credits, they are certainly employment generating.
V. Conclusions
The data and discussion presented here do not support the assertion that Puerto Rico is the unusual case, the extreme exception, with regard to its receipt of federal funds. When compared to the situation of the various states and DC, by none of the measures presented here does Puerto Rico stand out alone; by few measures is it at the top of the list, and by many measures it is at the bottom. Also, with regard to simply the transfer payments component of the funds that flow from Washington to Puerto Rico, the term “generous,” with all its implications, does not seem appropriate.
Furthermore, if a major reason for the federal government to provide funds to states and other localities is to generate a greater degree of income equality across the country – a convergence of income levels – then Puerto Rico and the low income states (several of the highest ranking states in Table 3) will necessarily get larger amounts of federal funds. Thus it is important to recognize the fact that Puerto Rico does not receive more federal funds, in spite of the ostensible equalizing goal of federal expenditures and in spite of the island’s low level of income relative to the states.
Of course what distinguishes Puerto Rico in any comparisons with the states is that it is not a state. While the flow of funds from Washington to the various sections of the country is in part determined by general goals, such as the goal of achieving a convergence of incomes, it is also determined politically, by the influence of each state’s representatives in Congress and by the concern of the Executive for the popular vote in
22

each state. Puerto Rico does not have representatives in Congress and Puerto Ricans do not vote in presidential elections. Thus the fact that Puerto Rico does not receive more federal funds – especially in the salaries and wages and procurement categories – should be no surprise.18
There are ways that the form of Puerto Rico’s receipts from the federal government could be improved, providing a better foundation for the economic development of the island. Such improvement could be achieved by positive rather than punitive changes. In particular, the extension to Puerto Rico of the Earned Income Tax Credit and the Child Tax Credit would be a good start, and this start could be followed by an increase in Puerto Rico’s share of federal procurement expenditures.
18 The generally high ranking of West Virginia in the various measures discussed above is perhaps a good illustration of the importance of political representation in affecting the flow of federal funds. Its ranking might be dubbed “The Byrd Effect,” though other factors are surely involved.
23

Appendix INet Receipts of Federal Funds: Details on “The Highest
Ranking Recipient States and Puerto Rico
Tables A1, A2 and A3 present additional data on per capita net receipts of federal funds for Puerto Rico and “the highest ranking recipient states”. “The highest ranking recipient states” in these three tables are taken from Table 3; they are the ten states that receive the largest net amount of federal expenditures per capita – i.e., total federal expenditures per capita going to the state less total taxes per capita going to the federal government from the state.
Table A1, presents the data of Table 3, net receipts of federal funds per capita, broken down by major categories. The column at the far right, column 5, shows the ten highest ranking states in order, 2 through 11 (with DC, number 1 in Table 3, excluded) followed by Puerto Rico at 19. The first column in Table A1 shows the total payments for “retirement, disability, and Medicare” received in a state or Puerto Rico minus the total federal taxes paid by that state or Puerto Rico. The columns are then additive, moving from left to right, and the pattern and ranking are tracked for the ten highest ranking recipient states as shown in column 5. Thus in column 1 of Table A1, in fiscal year 2004 West Virginia’s per capita receipt of payments in the category “retirement, disability and Medicare” exceeded per capita all taxes paid to the federal government by $1,588; for Puerto Rico, the figure was $724; for Mississippi $487, and for Montana $26. For all other states (and DC), the figure was negative – that is, they paid more in taxes of all sorts to the federal government than they received from the federal government in this one category. In Column 2, the per capita receipt of payments in the first two categories combined (retirement, disability and Medicare plus other transfer payments) for West Virginia exceeded per capita all taxes paid to the federal government by $4,042; for Puerto Rico, the figure was $2,427. For these two categories taken together Puerto Rico’s ranking dropped to 8th.
In Table A2 the figures of Table A1 are presented as a percentage of state (or Puerto Rican) Gross Domestic Product per capita, and in Table A3 the figures of Table A1 are presented as a percentage of Personal Income per capita.19 In these tables, Puerto Rico’s relatively low income and Puerto Rican’s lack of federal income tax liability combine to move the island well up in the rankings.
However, even in Table A3, which presents the data in a manner that makes Puerto Rico’s ranking relatively high, the island does not stand as an outlier, distinct from high recipient states. In particular, Puerto Rico does not rank number one for the first and largest category of expenditures – retirement, disability, and Medicare. Furthermore, Puerto Rico drops out of the number one position when all federal wages and salaries and procurements are taken into account. Also, for all categories of expenditures, Puerto Rico’s situation overall is not dramatically different from that of some of the “highest 19 The figures for Puerto Rico in Tables A2 and A3 are substantially different because GDP in Puerto Rico is much greater than Personal Income (or Gross National Product) because such a large share of Puerto Rico’s GDP is the profits of non-Puerto Rican based firms. In 2004, GNP was about 64 percent of GDP in Puerto Rico.
24

ranking recipient states;” overall Puerto Rico trails New Mexico (with DC in the number 1 position) and is nearly on par with Alaska and West Virginia.
25

Table A1: The Ten Highest Ranking Recipient States and Puerto Rico, Ranked by Total Net Per Capita Federal Expenditures;and the Ranking of those States and Puerto Rico when the Various Categories of Federal Expenditures are Factored In - Fiscal Year 2004*
(1) (2) (3) (4) (5)Net
Retirement, Disability +
MedicareState Rank
(1) + Other Transfers
State Rank
(2) + EITC + CTC
State Rank
(3) + Salaries and Wages
State Rank
(4) + Procure-ments
State Rank
Average U.S + P.R. (3,496) (1,500) (1,292) (549) 528
Alaska (2,899) 28 2,593 7 2,775 7 5,411 2 8,005 2 New Mexico (34) 5 2,862 4 3,121 5 4,209 5 7,348 3 Virginia (2,746) 26 (1,182) 29 (986) 29 1,204 20 5,940 4 West Virginia 1,588 1 4,042 1 4,240 1 4,988 3 5,562 5 North Dakota (1,160) 12 2,940 3 3,123 4 4,364 4 5,157 6 Montana 26 4 3,001 2 3,203 2 4,159 6 4,792 7 Mississippi 487 3 2,827 5 3,162 3 3,883 7 4,700 8 Alabama (59) 6 1,893 10 2,181 9 2,951 9 4,629 9 South Dakota (1,025) 11 2,628 6 2,829 6 3,821 8 4,389 10 Maryland (3,808) 37 (1,442) 34 (1,253) 34 640 25 4,383 11 Puerto Rico 724 2 2,427 8 2,440 8 2,704 11 2,823 19
* "Total Net Per Capita Federal Expenditures" are total federal expenditures going to a state or Puerto Rico less all taxes paid to the federal governmentfrom that state or Puerto Rico. Ranking is based on Table 3. See text for further explanation.
26

Table A2: Net Per Capita Federal Expenditures of the Ten Highest Ranking Recipient States and Puerto Rico, Expressed as a Percenage of Gross Domestic Product Per Capita -Fiscal Year 2004*
(1) (2) (3) (4) (5)Net
Retirement, Disability +
Medicare By GDP
State Rank
(1) + Other Transfers By
GDPState Rank
(2) + EITC + CTC By GDP
State Rank
(3) + Salaries and Wages
By GDPState Rank
(4) + Procurements
By GDPState Rank
Average U.S + P.R. -8.9% -3.8% -3.3% -1.4% 1.3%
Alaska -5.3% 18 4.7% 11 5.1% 11 9.9% 8 14.6% 7 New Mexico -0.1% 5 8.6% 5 9.3% 5 12.6% 5 22.0% 2 Virginia -6.3% 24 -2.7% 29 -2.3% 29 2.7% 23 13.5% 10 West Virginia 5.8% 1 14.7% 1 15.4% 1 18.1% 1 20.2% 3 North Dakota -3.2% 12 8.2% 6 8.7% 6 12.2% 6 14.4% 8 Montana 0.1% 4 10.1% 4 10.8% 4 14.0% 3 16.1% 5 Mississippi 1.8% 3 10.6% 3 11.9% 3 14.6% 2 17.7% 4 Alabama -0.2% 6 6.1% 8 7.0% 8 9.5% 10 14.8% 6 South Dakota -2.7% 10 6.8% 7 7.3% 7 9.9% 7 11.4% 13 Maryland -9.2% 37 -3.5% 33 -3.0% 33 1.5% 25 10.6% 15 Puerto Rico 3.6% 2 11.9% 2 12.0% 2 13.3% 4 13.9% 9
* The "highest ranking recipient states" are those from Table A1.
27

Table A3: Net Per Capita Federal Expenditures of the Ten Highest Ranking Recipient States and Puerto Rico,Expressed as a Percentage of Personal Income Per Capita -Fiscal Year 2004*
(1) (2) (3) (4) (5)Net
Retirement, Disability +
Medicare By Personal Inc.
State Rank
(1) + Other Transfers By
Personal Income
State Rank
(2) + EITC + CTC By
Personal Income
State Rank
(3) + Salaries and Wages
By Personal Income
State Rank
(4) + Procure-ments By Personal
IncomeState Rank
Average U.S + P.R. -10.7% -4.6% -4.0% -1.7% 1.6%
Alaska -8.5% 27 7.6% 8 8.1% 8 15.9% 5 23.5% 4 New Mexico -0.1% 5 10.9% 4 11.9% 4 16.1% 4 28.1% 2 Virginia -7.6% 22 -3.3% 29 -2.7% 29 3.3% 22 16.4% 10 West Virginia 6.2% 1 15.7% 2 16.5% 2 19.4% 3 21.6% 5 North Dakota -3.9% 13 9.9% 6 10.6% 6 14.8% 8 17.4% 7 Montana 0.1% 4 10.9% 5 11.6% 5 15.0% 7 17.3% 8 Mississippi 2.0% 3 11.5% 3 12.9% 3 15.9% 6 19.2% 6 Alabama -0.2% 6 6.8% 9 7.9% 9 10.7% 10 16.7% 9 South Dakota -3.4% 10 8.7% 7 9.4% 7 12.7% 9 14.5% 11 Maryland -9.6% 31 -3.6% 30 -3.2% 31 1.6% 26 11.1% 15 Puerto Rico 6.1% 2 20.5% 1 20.6% 1 22.8% 2 23.8% 3
* The "highest ranking recipient states" are those from Table A1.
28

Appendix II – Estimating the Aggregate Fiscal Impact of Extending the Earned Income Tax Credit and the Child Tax Credit to Puerto Rico
1. As a basis for the cost estimates, data were obtained from the Puerto Rican Junta de Planificación and the Statistical Abstract of the United States. These data for Puerto Rico included: total personal income, population, number of families, average family size, number of families with children under 18, number of two families with two married parents present and two children under 18, number of families headed by a female with two children under 18. For 2006, however, these data were not yet available. Estimates were obtained for 2006 by assuming that the growth rate of the previous two years was maintained (in the cases of personal income and population) and assuming that the proportional breakdown of the population did not change (for the other categories).
2. From “Development and Income Distribution: The Case of Puerto Rico” by Orlando Sotomayor (World Development, 32:8, 2004), data were obtained on income distribution by deciles for 2000. It was then assumed that the distribution of income was the same in 2006. Sotomayor’s data are for households, they were used here as proxy for family income distribution. It was assumed that For families with two married parents present, it was assumed that they were spread across the income distribution in the same manner as families in general. For families headed by a single female parent, it was assumed tha all were in the bottom seven deciles of the income distribution, with one-seventh of these families in each of those decile groups.
3. With the data on total personal income and population, per capita personal income was calculated. Using data on average family size, average family income was obtained; this figure was multiplied by the number of families to obtain total family income (which was 90% of total personal income). Using the figure for total family income and the distribution data, the total income received by each decile of the families was computed. Then, dividing this figure by the number of families in each decile, the average income received in each decile group was obtained.
4. For each such decile average, TurboTax for 2006 was used to calculate the federal refund that would come to each family (two parent and one parent families separately), with the assumption that all families had had two children. This average federal refund figure was then multiplied by the number of families in each decile category to obtain the total refund for each decile group. The total refunds for each decile group – two parent and single parent – were then added to obtain the total refund for the year.
5. However, as pointed out above (see footnote 17), on the mainland, when the income level of a family is high enough so that without the EITC and CTC the family would be paying some federal income tax, the family’s refund from these programs amounts to the credits minus the tax owed. Applied to Puerto Rico, where the family would not be libel for any income tax, the refund would be larger for any level of income (at higher levels of eligibility for the credits). It would seem appropriate, therefore, in extending the EITC

and CTC to Puerto Rico that the refund be no greater than it would be for an equivalent family in states. In all the cost calculations discussed here, it is assumed that such a “cap” on EITC and CTC refunds would be enacted for Puerto Rico.
30


