Draft Measure Information Template Indoor Lighting - … · 04/04/2011 · Draft Measure...
100
Page 1 2013 California Building Energy Efficiency Standards Draft Report March 10, 2011 CODES AND STANDARDS ENHANCEMENT INITIATIVE (CASE) Draft Measure Information Template – Indoor Lighting - Retail 2013 California Building Energy Efficiency Standards California Utilities Statewide Codes and Standards Team, March 2011 This report was prepared by the California Statewide Utility Codes and Standards Program and funded by the California utility customers under the auspices of the California Public Utilities Commission. Copyright 2011 Pacific Gas and Electric Company, Southern California Edison, Sempra Utilities. All rights reserved, except that this document may be used, copied, and distributed without modification. Neither PG&E, SCE, SoCalGas, SDG&E, nor any of its employees makes any warranty, express of implied; or assumes any legal liability or responsibility for the accuracy, completeness or usefulness of any data, information, method, product, policy or process disclosed in this document; or represents that its use will not infringe any privately-owned rights including, but not limited to, patents, trademarks or copyrights
-
Upload
nguyenngoc -
Category
Documents
-
view
214 -
download
1
Transcript of Draft Measure Information Template Indoor Lighting - … · 04/04/2011 · Draft Measure...
Page 1
2013 California Building Energy Efficiency Standards Draft Report March 10, 2011
CODES AND STANDARDS ENHANCEMENT INITIATIVE (CASE)
Draft Measure Information Template – Indoor
Lighting - Retail
2013 California Building Energy Efficiency Standards
California Utilities Statewide Codes and Standards Team, March 2011
This report was prepared by the California Statewide Utility Codes and Standards Program and funded by the California utility customers under the auspices of the California Public Utilities Commission.
Copyright 2011 Pacific Gas and Electric Company, Southern California Edison, Sempra Utilities.
All rights reserved, except that this document may be used, copied, and distributed without modification.
Neither PG&E, SCE, SoCalGas, SDG&E, nor any of its employees makes any warranty, express of implied; or assumes any legal liability or
responsibility for the accuracy, completeness or usefulness of any data, information, method, product, policy or process disclosed in this document; or
represents that its use will not infringe any privately-owned rights including, but not limited to, patents, trademarks or copyrights
Page 2
2013 California Building Energy Efficiency Standards Draft Report March 10, 2011
Indoor Lighting
2011 California Building Energy Efficiency Standards
CONTENTS
1. Purpose ........................................................................................................................ 5
2. Overview ...................................................................................................................... 6
3. Methodology .............................................................................................................. 14
3.1 Surveys with Designers, Manufacturers, and End-users .......................................................... 14
3.2 Life Cycle Cost Analysis of Big Box and General lighting technologies as well as CMH and
LED Accent Lighting and Decorative Lighting ................................................................................. 15
3.3 Visual Observation of Recently Permitted Retail Stores ......................................................... 15
3.4 Retail Store Computer Modeling ............................................................................................. 16
3.5 Luminaire Photometric File Data ............................................................................................. 16
3.6 New Technology and Design Comparison Computer Models ................................................ 18
3.7 Review & Analysis of Retail Spaces Permitted under Title 24 2005, ASHRAE 90.1-04 and the
Washington State Energy Code ......................................................................................................... 18
3.8 Controls Evaluation .................................................................................................................. 19
3.9 Ornamental Lighting Evaluation for Title 24 2013 ................................................................. 19
3.10 Stakeholder Involvement ...................................................................................................... 19
4. Analysis and Results ................................................................................................ 21
4.1 Interviews with Designers, Contractors, Manufacturers, and End Users ................................ 21
4.2 Life Cycle Cost Analysis of Big Box and General lighting technologies as well as CMH and
LED Accent Lighting and Decorative Lighting ................................................................................. 26
4.3 Visual Observations of New Relevant Spaces ......................................................................... 34
4.4 Retail Store Computer Modeling ............................................................................................. 36
4.5 New Technology Lighting Models .......................................................................................... 44
4.6 Assessment of Lighting Controls ............................................................................................. 49
4.7 Comparative Studies of ASHRAE 90.1 2004 and 2010, Title 24-2005 and 2008, and the
Washington Energy Code including Washington 2010 ..................................................................... 52
4.8 Results of Ornamental Lighting Evaluation for Title 24 2013 ................................................ 59
4.9 Conclusions and Assumptions ................................................................................................. 64
5. Recommended Language for the Standards Document, ACM Manuals, and the Reference Appendices ....................................................................................................... 65
5.1 Code Change Proposals ........................................................................................................... 65
Page 3
2013 California Building Energy Efficiency Standards Draft Report March 10, 2011
5.2 Recommended Code Language ............................................................................................... 66
6. Appendices ................................................................................................................ 74
6.1 Appendix I--Designer, End-User and Manufacturer Interview ............................................... 74
6.3 Appendix II -Big Box Store (Model A) ................................................................................... 80
6.4 Appendix III High Atrium Store .............................................................................................. 82
6.5 Appendix IV High End Jewelry Store ..................................................................................... 84
6.6 Appendix X High Designer Shop ............................................................................................ 86
6.7 Appendix XI Small Store in Strip Mall ................................................................................... 88
6.8 Appendix XII Furniture and Home Accessories Store ............................................................ 90
6.9 Appendix IIX Kitchen Accessories and Tableware ................................................................. 92
6.10 Appendix IX New Technology and Design Comparison Computer Models ...................... 94
6.10.1 Model H ......................................................................................................................... 94
6.10.2 Model I ........................................................................................................................... 95
6.10.3 Model J ........................................................................................................................... 97
FIGURES
Figure 1: Summary Description of Retail Store Computer Models ....................................................... 17
Figure 3: 55W Halogen IR reference lamps versus equivalent light output 20W CMH lamps ............. 32
Figure 4: High Efficacy and Advance Lighting use by Surveyed Retail Spaces ................................... 34
Figure 5: High Efficacy and Advanced Accent Lighting used in Surveyed Retail Spaces .................... 35
Figure 6: High Efficacy and Advanced Ambient and Wall Lighting in Surveyed Retail Spaces .......... 35
Figure 7: Diagram for Advanced Lighting Controls Cost Analysis Model ........................................... 50
Figure 8: Washington Code Pass / Fail as compared to Title 24 for Retail Store Compliance ............. 56
Figure 9: Big Box Store (Model A) ........................................................................................................ 80
Figure 10: Computer Model A – Big Box Store Under Title 24 2008 Compliance .............................. 81
Figure 11: Computer Model A1 – Big Box Store New Luminaire Technology & IESNA Standards .. 81
Figure 12: High Center Atrium Store (Model B) ................................................................................... 82
Figure 13: High Atrium Retail ............................................................................................................... 82
Figure 14: Computer Model B – High Atrium Retail Under Title 24-2008 .......................................... 83
Figure 15: Computer Model B1 – High Atrium New Luminaire Technology & IESNA Standards ..... 83
Figure 16: High End Jewelry Store (Model C) ...................................................................................... 84
Figure 17: LPD Precious Jewelry ........................................................................................................... 84
Figure 18: Computer Model C – High End Jewelry Under Title 24 2008 ............................................. 85
Figure 19: Computer Model C1 - High End Jewelry New Luminaire Technology ............................... 85
Page 4
2013 California Building Energy Efficiency Standards Draft Report March 10, 2011
Figure 20: Model D High Designer Shop (High End & Designer Fashions) ......................................... 86
Figure 21: Computer Model D – Designer Shop Under Title 24-2008 .................................................. 87
Figure 22: Computer Model D1 - Designer Shop New Luminaire Technology .................................... 87
Figure 23: Small Store in Strip Mall (Model E) ..................................................................................... 88
Figure 24: Independent Retail Shop ....................................................................................................... 89
Figure 25: Computer Model E – Small Strip Mall Retail Store Under Title 24-2008 ........................... 89
Figure 26: Computer Model E1 – Small Strip Mall Retail New Luminaire Technology ...................... 89
Figure 27: Furniture & Home Accessories (Model F) ........................................................................... 90
Figure 28 .................................................................................................................................................. 90
Figure 29: Computer Model F – Furniture & Home Accessories Under Title 24-2008 ........................ 91
Figure 30: Computer Model F1 – Furniture & Home Accessories New Luminaire Technology .......... 91
Figure 31: Kitchen Accessories & Tableware (Model G) ...................................................................... 92
Figure 32: Kitchen Accessories Retail ................................................................................................... 92
Figure 33: Computer Model G – Kitchen Accessories & Tableware Under Title 24-2008 .................. 93
Figure 34: Computer Model G – Kitchen Accessories & Tableware New Luminaire Technology ...... 93
Figure 35: Wall Accents Comparisons (Model H) ................................................................................. 94
Figure 36: Computer Model H – Floor Accents Baseline Technology Options .................................... 94
Figure 37: Computer Model H – Wall Accents Advanced Technology Options .................................. 94
Figure 38: Wall Accents Comparisons (Model I) .................................................................................. 95
Figure 39: Computer Model I – Wall Accents Baseline Technology Options ...................................... 95
Figure 40: Computer Model I – Wall Accents Advanced Technology Options .................................... 96
Figure 41: Mounting Heights Comparisons (Model J) .......................................................................... 97
Figure 42: Mounting Height vs. Throw Distance Study – Layout Grid ................................................. 97
Page 5
2013 California Building Energy Efficiency Standards Draft Report March 10, 2011
1. Purpose
Proposed changes to Title 24 for improvements to the lighting component of building efficiency standards
as applied to nonresidential buildings, and retail spaces in particular, using the Tailored Method of
compliance are:
Reduce the allowed LPD for Floor Display, Wall Display and Ornamental Lighting under the Tailored
Compliance (Table 146G T24-2008) based on increased use of Ceramic Metal Halide (CMH) as the
primary display lighting source and judicious use of other efficient light sources such as the latest infrared
coated halogen lamps and LED based lamps. Lower cost display lighting systems based on advanced
halogen IR lighting can comply with this proposed measure provided they target the lower end of the
illumination levels recommended in IESNA RP-2. However, stores desiring high light levels and/or accent
lighting in high ceilings will need to use high efficacy display lighting sources such as Ceramic Metal
Halide.
Significantly reduce the space types (Table 146G T24-2008) allowed under the Tailored Method of
compliance. Spaces eligible for Tailored compliance would be Retail (Malls, Retail Sales, Grocery, Bank
Public Areas, etc.) Hospitality (Hotel, Restaurant, Auditoriums, Lounge etc.) Religious Worship,
Galleries/Museums and Public Venues (Convention Center, Auditoriums, Civic Meeting, etc.). All other
space type will move to Area Compliance (Table 146F T24-2008) except types with illuminance category
IESNA Handbook. IESNA HB types will form a new table within Tailored Compliance.
Re-alignment of mounting height adjustment factor (TABLE 146-H T24-2008) to adjust for the proposed
use of primarily CMH lamps versus halogen for high ceiling application.
Reduce allowed LPD for very valuable display power to account for greater use of CMH lamps for high
ceiling heights and LED based lamps for lower ceilings while still allowing some use of halogen for lower
ceiling heights.
1. Mandate use of comprehensive lighting controls as a prerequisite to using the Tailored Lighting
method of Title 24 compliance under the 2011 standards. Multi tier lighting zones, multi level
switching, demand responsive load shedding, and vacancy sensors are some of the control types
that are applicable. Use of a comprehensive controls will assure that the added power (LPDs)
allowed under the Tailored Method will be used only when required for the specific lighting
application and will be appropriately monitored. The control mandate must include commissioning
and verification.
Page 6
2013 California Building Energy Efficiency Standards Draft Report March 10, 2011
2. Overview
a. Measure
Title
NR-3 INDOOR LIGHTING TAILORED COMPLIANCE - Proposed Tailored
Method Revisions with Retail Lighting Focus
b.
Description
Proposed changes to Title 24 for improvements to the lighting component of building
efficiency standards as applied to nonresidential buildings, and retail spaces in
particular, using the Tailored Method of compliance are:
Reduce the allowed LPD for Floor Display, Wall Display and Ornamental Lighting
under the Tailored Compliance (Table 146G T24-2008) based on increased use of
Ceramic Metal Halide (CMH) as the primary display lighting source and judicious use
of other efficient light sources such as the latest infrared coated halogen lamps and
LED based lamps. Lower cost display lighting systems based on advanced halogen
IR lighting can comply with this proposed measure provided they target the lower end
of the illumination levels recommended in IESNA RP-2. However, stores desiring
high light levels and/or accent lighting in high ceilings will need to use high efficacy
display lighting sources such as Ceramic Metal Halide.
Significantly reduce the space types (Table 146G T24-2008) allowed under the
Tailored Method of compliance. Spaces eligible for Tailored compliance would be
Retail (Malls, Retail Sales, Grocery, Bank Public Areas, etc.) Hospitality (Hotel,
Restaurant, Auditoriums, Lounge etc.) Religious Worship, Galleries/Museums and
Public Venues (Convention Center, Auditoriums, Civic Meeting, etc.). All other
space type will move to Area Compliance (Table 146F T24-2008) except types with
illuminance category IESNA Handbook. IESNA HB types will form a new table
within Tailored Compliance.
Re-alignment of mounting height adjustment factor (TABLE 146-H T24-2008) to
adjust for the proposed use of primarily CMH lamps versus halogen for high ceiling
application.
Reduce allowed LPD for very valuable display power to account for greater use of
CMH lamps for high ceiling heights and LED based lamps for lower ceilings while
still allowing some use of halogen for lower ceiling heights.
Mandate use of comprehensive lighting controls as a prerequisite to using the Tailored
Lighting method of Title 24 compliance under the 2011 standards. Multi tier lighting
zones, multi-level switching, demand responsive load shedding, and vacancy sensors
are some of the control types that are applicable. Use of a comprehensive controls
will assure that the added power (LPDs) allowed under the Tailored Method will be
used only when required for the specific lighting application and will be appropriately
monitored. The control mandate must include commissioning and verification.
Page 7
2013 California Building Energy Efficiency Standards Draft Report March 10, 2011
c. Type of
Change
Mandatory Measure - The controls requirements that would be required if one
chooses to use the tailored method for compliance would be mandatory. Mandatory
measures must be satisfied with either the prescriptive or performance compliance
methods.
Prescriptive Requirement - The change would add or modify prescriptive
requirements in Section 146. Prescriptive requirements must be met for prescriptive
compliance and define the Standards baseline building in performance calculations,
but are not mandatory when the performance approach is used.
Compliance Option - Some of the controls requirements would be optional and
would add a new means to comply with the standards by adding a new compliance
option. This would likely be a simple Power Adjustment Factor applied of the
controlled lighting or a different allowance for lighting that is dimmed.
Modeling - The ACM would only be changed to reflect the changes in the LPD and
controls requirements. This proposal does not change the algorithms of how lighting
and controls are modeled. The change would modify the calculation procedures or
assumptions used in making performance calculations. This change would not add a
compliance option or a new requirement, but would affect the way that tradeoffs are
made.
Other - The scope of the standards is not changed by this proposal. The standards
have traditionally had the ability to limit the connected lighting power in spaces and
to require or give credit for lighting controls.
This proposal would result in modifications to the Standards, ACM, manuals, and the
compliance forms.
Page 8
2013 California Building Energy Efficiency Standards Draft Report March 10, 2011
d. Energy
Benefits
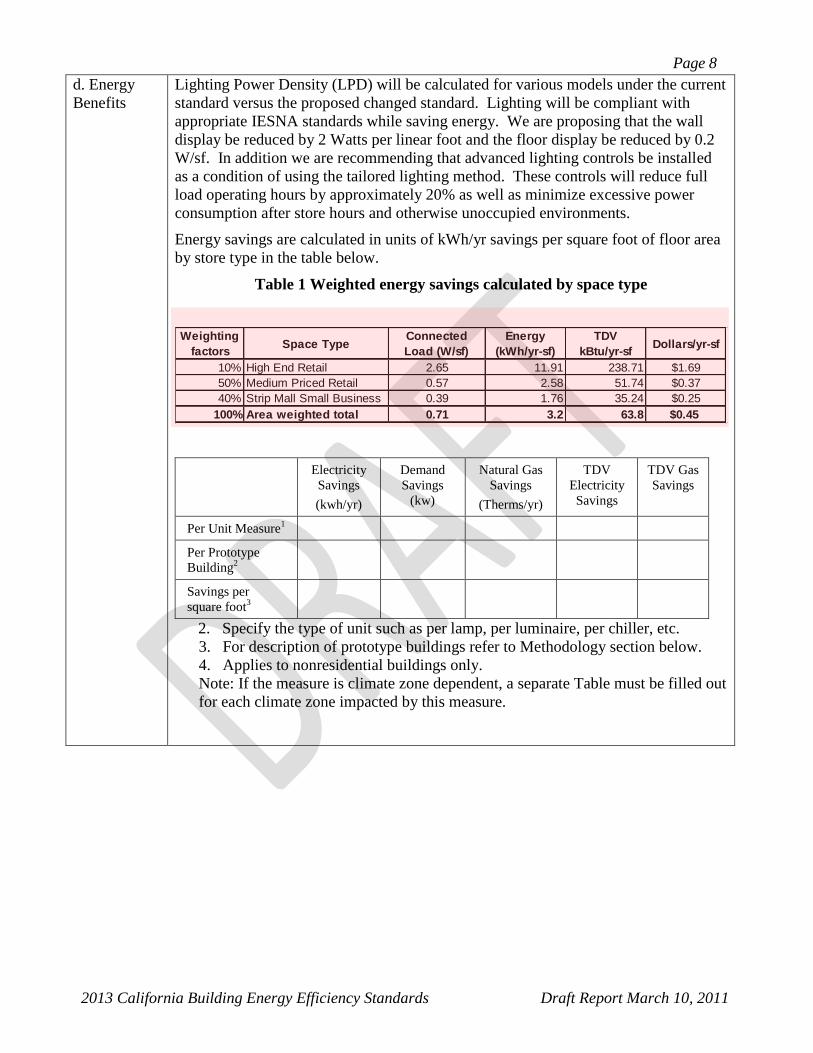
Lighting Power Density (LPD) will be calculated for various models under the current
standard versus the proposed changed standard. Lighting will be compliant with
appropriate IESNA standards while saving energy. We are proposing that the wall
display be reduced by 2 Watts per linear foot and the floor display be reduced by 0.2
W/sf. In addition we are recommending that advanced lighting controls be installed
as a condition of using the tailored lighting method. These controls will reduce full
load operating hours by approximately 20% as well as minimize excessive power
consumption after store hours and otherwise unoccupied environments.
Energy savings are calculated in units of kWh/yr savings per square foot of floor area
by store type in the table below.
Table 1 Weighted energy savings calculated by space type
Electricity
Savings
(kwh/yr)
Demand
Savings
(kw)
Natural Gas
Savings
(Therms/yr)
TDV
Electricity
Savings
TDV Gas
Savings
Per Unit Measure1
Per Prototype
Building2
Savings per
square foot3
2. Specify the type of unit such as per lamp, per luminaire, per chiller, etc.
3. For description of prototype buildings refer to Methodology section below.
4. Applies to nonresidential buildings only.
Note: If the measure is climate zone dependent, a separate Table must be filled out
for each climate zone impacted by this measure.
Weighting
factorsSpace Type
Connected
Load (W/sf)
Energy
(kWh/yr-sf)
TDV
kBtu/yr-sfDollars/yr-sf
10% High End Retail 2.65 11.91 238.71 $1.69
50% Medium Priced Retail 0.57 2.58 51.74 $0.37
40% Strip Mall Small Business 0.39 1.76 35.24 $0.25
100% Area weighted total 0.71 3.2 63.8 $0.45
Page 9
2013 California Building Energy Efficiency Standards Draft Report March 10, 2011
e. Non-
Energy
Benefits
Potential non-energy benefits include:
Reduction in air emissions that results from any energy savings measure and the
increase in electric system reliability that accompanies the reduction in peak electrical
demand.
Increased reliance on higher efficacy sources such as fluorescent and ceramic metal
halide (CMH) which have longer lamp life and as a result lower maintenance costs.
Improved lighting performance including better lumen maintenance (10-15%
improvement) and color stability. (All environments)
The evaluation of non-energy benefits is based on recent and current IESNA research
studies as well as other l industry publicly available testing and research.
f.
Environment
al Impact
The proposed changes/measures will not result in any adverse environmental impact.
On the contrary several of the changes/measures will actually impact environmental
issues in a positive vein. Such as use of the latest lamp/ballast technologies (required
to meet the standards) will most likely result in less mercury and other hazardous
materials
Page 10
2013 California Building Energy Efficiency Standards Draft Report March 10, 2011
g.
Technology
Measures
Measure Availability:
The following technologies enable the increased stringency of the proposed lighting
energy standards change:
For aggressive energy reduction in directional lighting applications, promote use of
CMH lamps as energy efficient alternative to IR halogen. Maturity of Ceramic Metal
Halide (quality, performance and cost effectiveness) warrant use of CMH over
Halogen where/when dimming of the directional lighting is not required.
For dimming applications improved IR designs with 14% to 20% efficiency over
previous IR lamps as well as LED based luminaire systems and lamps are available.
Latest generation T8 and T5 fluorescent systems allow reduced general and ambient
lighting connected load. The wide range of ballast factors and lamp lumen output
options, with improved efficacy, results in lower LPD‟s while maintaining required
illumination levels. Furthermore, encourage development of tunable and dimming
ballast and lamp options for both T8 and T5 lighting systems.
Encourage use of LED lights versus fluorescent and neon for some signage, markers,
visual effects, casework, under shelf and other specialty lighting applications. Also
encourage LED lamps versus halogen for specially and accent lighting in lower
ceilings and casework lighting.
Improved lighting design tools as well as revised IESNA design criteria allow
designers to more accurately model their spaces and fine tune their lighting designs to
the need of the retailer to present their product within the lighting budget constraints
of Title 24.
Useful Life, Persistence, and Maintenance:
Life, frequency of replacement, and maintenance procedures related to the measure
will be based on data gathered from the limited base of current users (where/ when
available). Manufacturers‟ technical data and recommendations will also be used
when/as available. Persistence energy savings related to the measure will be based on
life of the equipment. Persistence is related to performance verification. Proper
maintenance or lack of will have limited effect on persistence but may drastically
affect the non-energy related issues such as lighting quality. Projected life and
required maintenance is based upon manufacturer‟s information and feedback from
clients who are using various lighting products. Persistence of savings from CMH,
LED System and Fluorescent products is higher than for their halogen counterparts in
that CMH and fluorescent ballasts and LED drivers typically serve only one wattage
type per lamp. Thus it is harder to increase lamp wattage without replacing the whole
fixture.
Page 11
2013 California Building Energy Efficiency Standards Draft Report March 10, 2011
h.
Performance
Verification
of the
Proposed
Measure
Persistence is related to performance verification in that the installer must verify that
the system is in compliance and working. A licensed electrical contractor or the
electrical engineer of record can accomplish the required verification. Cost impact
will be minimal as such functions are often, if not always in the contractor‟s and/or
consultant‟s contract agreement as part of implementation.
Page 12
2013 California Building Energy Efficiency Standards Draft Report March 10, 2011
i. Cost Effectiveness
The proposed changes for T24-2011, “Tailored” method includes 15% to 25% lower LPD allowances
for retail spaces versus allowances under the T24-2008 tailored compliance. Reductions of 5% to
15% in allowed maximum LPDs can also occur for other “Tailored” method” spaces and several
categories under the “Area Category” compliance method. Increased implementation cost (design,
equipment, etc.) is anticipated for those projects which set lighting standards to IESNA recommended
practice. However, reduced cost of operation (lower maintenance and utility costs) will more than off
set increased first cost when analyzed on a “life cycle” basis.
Cost analysis modeling on the latest available Ceramic Metal Halide and Light Emitting Diode
technologies for feature lighting (accent, display, wall-wash, etc.) was one of the key drivers to
proposed LPD reductions. Cost analysis demonstrated that cost effectiveness for many of the options
studied is feasible within a seven year period. The seven year cost effectiveness is well under
luminaire life expectancy and conforms to the typical retail space where these systems are used.
Furthermore; the seven year period is far more conservative than the 15 year cost effective period
considered acceptable by the CEC for non residential non-envelope compliance measures.
Other sources (most recent fluorescent and halogen IR technologies) driving LPD reductions are
anticipated to have significantly shorter payback periods than the CMH and LED as demonstrated by
the cost analysis conducted on the AGI-32 model spaces and other model comparisons. The expanded
use of controls, as mandated under this proposal, is also cost effective and further reduces energy
consumption.
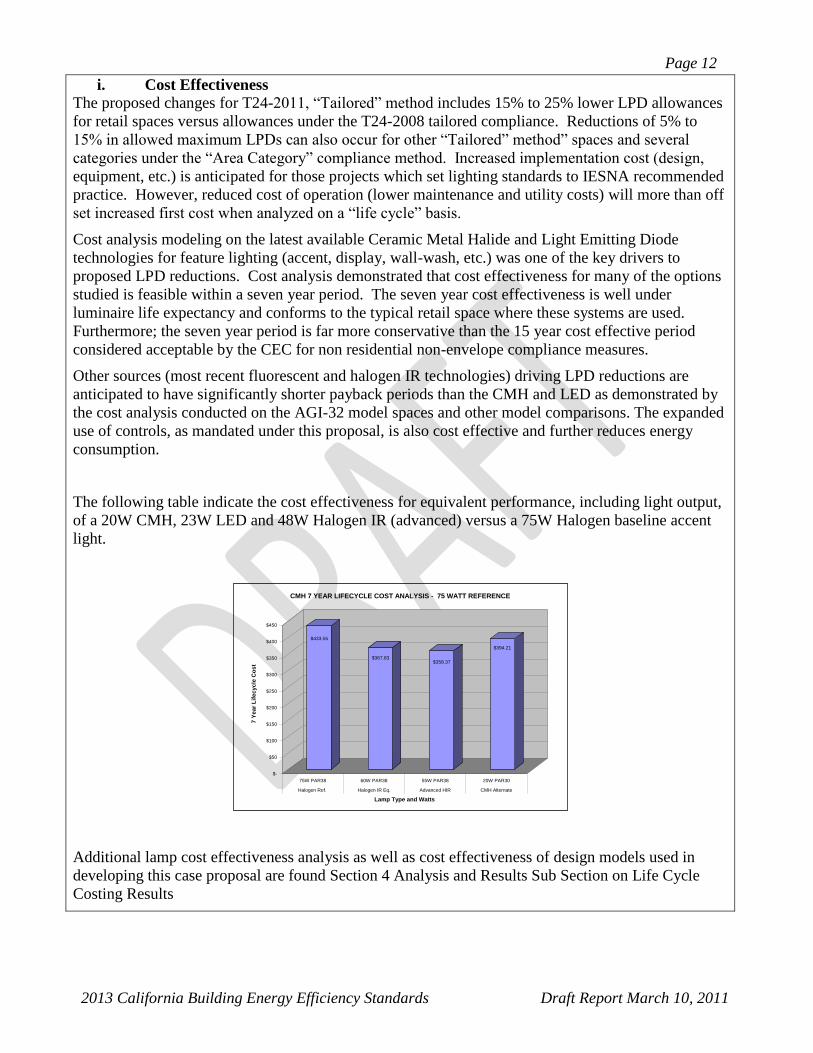
The following table indicate the cost effectiveness for equivalent performance, including light output,
of a 20W CMH, 23W LED and 48W Halogen IR (advanced) versus a 75W Halogen baseline accent
light.
Additional lamp cost effectiveness analysis as well as cost effectiveness of design models used in
developing this case proposal are found Section 4 Analysis and Results Sub Section on Life Cycle
Costing Results
$433.55
$367.83$358.37
$394.21
$-
$50
$100
$150
$200
$250
$300
$350
$400
$450
7 Y
ea
r L
ife
cy
cle
Co
st
75W PAR38 60W PAR38 55W PAR38 20W PAR30
Halogen Ref. Halogen IR Eq. Advanced HIR CMH Alternate
Lamp Type and Watts
CMH 7 YEAR LIFECYCLE COST ANALYSIS - 75 WATT REFERENCE
Page 13
2013 California Building Energy Efficiency Standards Draft Report March 10, 2011
j. Analysis
Tools
The tools used to perform the analysis for this CASE report fall under three
categories:
Spreadsheets (MS Excel) to approximate what lighting power densities are used under
different retail space types and categories. This will build on the spreadsheets used in
the developing the 2008 standards.
AGi32 lighting software to evaluate the lighting conditions of various lighting
designs, especially in terms of how changes to lighting technology or design affect
compliance. New proposed design guidelines for modeling are based on the soon to
be released RP-2 2011 edition of retail lighting recommendations and the IESNA
Lighting Handbook 10th Addition.
Spreadsheet to keep track of results from AGi32 runs the PV energy costs of
operating the system, the life cycle maintenance costs and the incremental first cost.
These figures are used to calculate the benefit/cost ratio of the system.
MS Access database and Excel spread sheet software for processing designer surveys
and store on site evaluation surveys.
k.
Relationship
to Other
Measures
None
Page 14
2013 California Building Energy Efficiency Standards Draft Report March 10, 2011
3. Methodology
This section describes the methodology that we followed to assess the savings, costs, and cost
effectiveness of the proposed code change. The CASE Team chose the eight major study areas based
on consideration of factors that affect the lighting of complex retail space and on maintaining the
relative light levels (footcandles) of the space over time.
The eight study areas are:
Interviews with Designers, Contractors, Manufacturers, and End Users
Life Cycle Cost Analysis of Big Box and General lighting technologies as well as CMH and
LED Lamps versus Incandescent (Halogen Baseline) lamps for accent and display lighting and
decorative lighting.
Visual Observation, Survey and Analysis of Recently Permitted Retails Stores
Computer modeling of seven (7) uniquely different retail stores types
New Technology and Design Comparison Computer Models
Comparative Studies of Title 24-2008, ASHRAE 90.1 2010 and 2010 Washington Energy
Codes
Controls Evaluation
Ornamental Lighting Comparisons and Evaluation Model
This work was publicly vetted through our stakeholder outreach process, which through in-person
meetings, webinars, email correspondence and phone calls, requested and received feedback on the
direction of the proposed changes. The stakeholder meeting process is described in section 3.10.
3.1 Surveys with Designers, Manufacturers, and End-users
The CASE Team conducted a survey of designers, end users, and manufacturers with the goal of
understanding the level of acceptance of current technology affecting lighting design, controls,
luminaire and lamps in retail settings. The sample was not intended to be a formal population-based
sample with weights developed for each respondent. Instead, we used our experience with the local
and national lighting market to contact the key players who have the most comprehensive
understanding of the market, available equipment, and the requirements of various codes. Data
collection consisted of telephone interviews and an online survey. The survey questionnaire contained
18 questions with a section to record the interviewee type, interview date, interviewer, etc. The full
text of the questionnaire is included in Appendix I--Designer, End-User and Manufacturer Interview.
Interviewees were asked questions in a numbered scale format, so the results could be more easily
quantified.
The interview covered the following issues:
Interviewees‟ experience with Title 24 in terms of finding it clear or contradictory / confusing.
A rank of 14 measures as most desirable to achieve LPD reductions
The prevalence and limits of new lighting technologies such as CMH and LED.
Usefulness of the tailored method
Use of track limiters
Page 15
2013 California Building Energy Efficiency Standards Draft Report March 10, 2011
3.2 Life Cycle Cost Analysis of Big Box and General lighting technologies as well as CMH
and LED Accent Lighting and Decorative Lighting
Life Cycle Costing on both a 7 year cycle and 15 year cycle was conducted on the lighting pallet used
to develop the seven (7) Retail Models as well as the Technology Floor and wall Display models. In
addition life cycle cost effectiveness was studied for Ornament lighting.
We conducted costing analysis on both 7 year and 15 year cycles. The 7 year analysis was used to
demonstrate to retailers (who usually remodel in this period and not 15 years) that the majority of the
alternate technologies being used in the modeling are cost effective in the 7 year window. However,
based on CEC criteria for cost effectiveness the 15 year analysis is used to demonstrate the cost
effectiveness of our proposals.
Detailed results for the analysis are shown in Section .3.0 Analysis and Results and consist of the
following comparisons:
PSMH versus CMH, T5/HO and Super T8 Systems for Primary Big Box Retail
Standard T8 versus Super T8 for secondary Big Box and General Lighting
Standard T8 versus T5 and Super T 8 for Wall-Wash and Perimeter Lighting
Halogen and standard T8 versus T5/T8 with dimming and LED (shelf and casework)
Halogen IR versus CMH and LED for boutique, low, medium and high ceiling configurations
(floor and wall accent light applications)
Incandescent versus Halogen Incandescent, CFL, CMH and LED for Ornamental and
Decorative Lighting
Various cost factors were determined for small retail establishments (low volume purchasing) and
large corporate high volume purchases. Luminaire and lamps first costs for low volume pricing was
determined using pricing data obtained from reputable on line merchants and national lighting
distributors. High volume pricing was determined by documentation from a large Retailer Stakeholder
as well as several National Accounts sales representatives.
Analysis was run at a 3% real discount rate as defined by the CEC in the 2011 Life Cycle Costing
Methodology Report (AEC 2010).
3.3 Visual Observation of Recently Permitted Retail Stores
Field observations were conducted of 168 newly constructed and/or renovated stores, with a goal to
determine the extent to which non-mandated new technology was being employed in current designs.
The stores included 160 shops and 8 anchor stores. The store sites were located at three new and four
recently renovated malls completed between November 2007 and August of 2009 located in Northern
California, Southern California, Washington and Arizona.
All 168 stores visited were visually inspected and a technology report generated. The stores that were
visited had been permitted under Title 24 2005, The Washington Energy Code and ASHRAE/IESNA
90.1 2004.
Sixty of the 168 stores visited were studied in more detail to compare design watts and code
compliance against the governing code. This included an analysis of the stores total LPD as well as the
Page 16
2013 California Building Energy Efficiency Standards Draft Report March 10, 2011
LPDs for General, Wall and Display lighting. Efficiency models were created using Microsoft Excel
to determine code compliance..
3.4 Retail Store Computer Modeling
The team created computer models of several existing stores with the goal of comparing the LPDs and
foot candle levels used prior to the implementation of Title 24 – 2008 to those of the newest
technology available for commercial use. Seven complete and several partial store models were
constructed using the computer program AGi32 v2.17 from Lighting Analysts, Inc., Littleton, CO.
The design input for each model was from existing CAD drawing files or from observation and
measurement. Luminaires were matched to the current design specification by downloading the
necessary IES file data from manufacturers. When exact luminaire data was unavailable Photometric
Toolbox, Professional Edition from Lighting Analysts was used to make modifications to existing
similar IES files to obtain the suitable and correct luminaire file. Photometric analysis was run on each
model.
Spaces were selected that best represented technology available prior to the implementation of Title
24-2008 and that would be good candidates for conversion to the most current lighting technology.
Varied room cavity ratios (RCR, i.e. the ratio of the wall area to the floor area of the space) were an
additional consideration in choosing the various stores to allow us to review the RCR effect on lighting
power density and appropriate light levels retail stores.
After base (reference) models were constructed and analyzed each was subjected to lighting design
changes. These changes incorporated the latest in fixture and lamp technology and were reanalyzed.
We concentrated on results for LPD, foot-candle levels on display cases and wall displays as well as
the effect of ambient lighting on the overall model LPD. Light levels were measured to compare the
older reference models with models using the newest technology available for commercial use.
Each model was designed to be compliant with Illuminating Engineering Society of North America
(IESNA) Recommended Practices for Lighting for Retail Environments (RP-2) as well as to meet,
thorough economic analysis, CEC approved 15 year period of analysis for evaluating Title 24 2013
proposals. Visibility requirements that translate into specific foot-candle levels, and lamp color
rendering index (CRI) were components of the model design procedure. Good color quality is a must
if the retail community is to accept any major changes to the traditional lamp selection. We chose
lamps that had high CRI‟s (80+) color quality over the life of the lamp as well as providing adequate
light levels.
3.5 Luminaire Photometric File Data
All photometry used for store modeling and partial space models was downloaded from each
manufacturer‟s IES file database. Total Light Loss Factors (LLFs) were calculated for each luminaire.
Dust depreciation was kept at a constant 0.90 for purposes of this study unless otherwise noted. The
following tables for each model describe the various luminaires and/or lamps along with fixture data
and quantities used. Note that for each model there is a REFERENCE (Title 24-2008) MODEL and a
NEW TECHNOLOGY MODEL which forms the basis for code change recommendations,
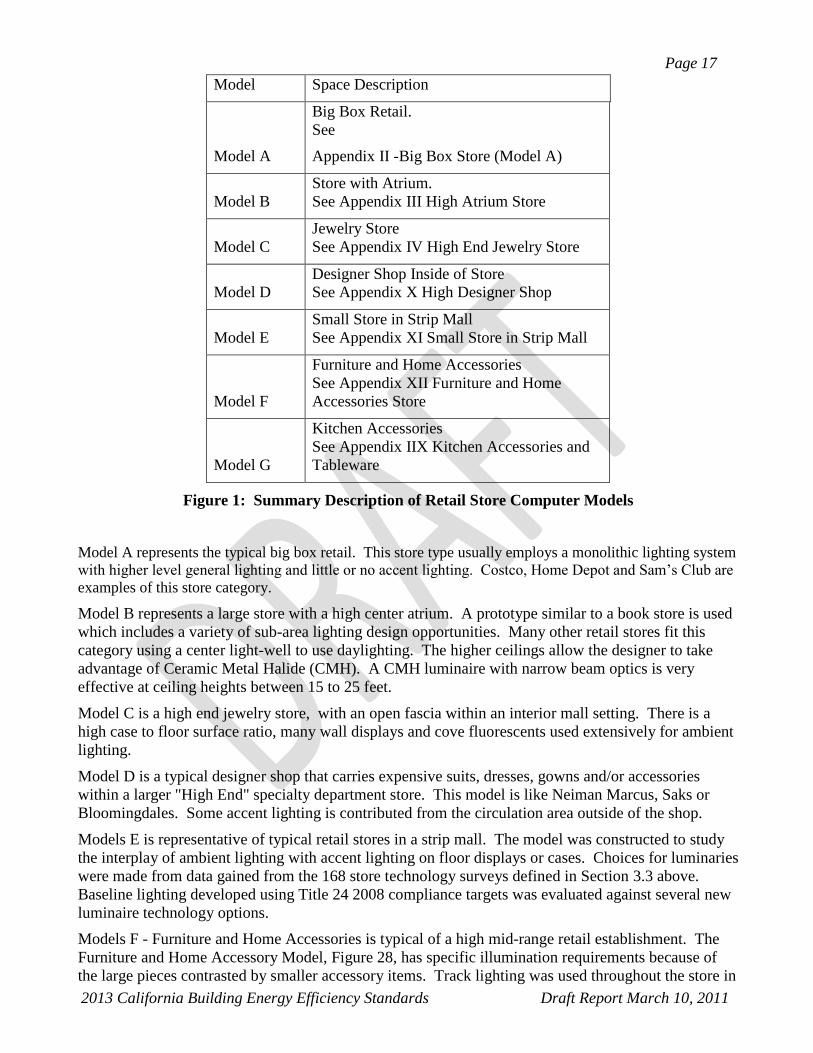
Page 17
2013 California Building Energy Efficiency Standards Draft Report March 10, 2011
Model Space Description
Model A
Big Box Retail.
See
Appendix II -Big Box Store (Model A)
Model B
Store with Atrium.
See Appendix III High Atrium Store
Model C
Jewelry Store
See Appendix IV High End Jewelry Store
Model D
Designer Shop Inside of Store
See Appendix X High Designer Shop
Model E
Small Store in Strip Mall
See Appendix XI Small Store in Strip Mall
Model F
Furniture and Home Accessories
See Appendix XII Furniture and Home
Accessories Store
Model G
Kitchen Accessories
See Appendix IIX Kitchen Accessories and
Tableware
Figure 1: Summary Description of Retail Store Computer Models
Model A represents the typical big box retail. This store type usually employs a monolithic lighting system
with higher level general lighting and little or no accent lighting. Costco, Home Depot and Sam‟s Club are
examples of this store category.
Model B represents a large store with a high center atrium. A prototype similar to a book store is used
which includes a variety of sub-area lighting design opportunities. Many other retail stores fit this
category using a center light-well to use daylighting. The higher ceilings allow the designer to take
advantage of Ceramic Metal Halide (CMH). A CMH luminaire with narrow beam optics is very
effective at ceiling heights between 15 to 25 feet.
Model C is a high end jewelry store, with an open fascia within an interior mall setting. There is a
high case to floor surface ratio, many wall displays and cove fluorescents used extensively for ambient
lighting.
Model D is a typical designer shop that carries expensive suits, dresses, gowns and/or accessories
within a larger "High End" specialty department store. This model is like Neiman Marcus, Saks or
Bloomingdales. Some accent lighting is contributed from the circulation area outside of the shop.
Models E is representative of typical retail stores in a strip mall. The model was constructed to study
the interplay of ambient lighting with accent lighting on floor displays or cases. Choices for luminaries
were made from data gained from the 168 store technology surveys defined in Section 3.3 above.
Baseline lighting developed using Title 24 2008 compliance targets was evaluated against several new
luminaire technology options.
Models F - Furniture and Home Accessories is typical of a high mid-range retail establishment. The
Furniture and Home Accessory Model, Figure 28, has specific illumination requirements because of
the large pieces contrasted by smaller accessory items. Track lighting was used throughout the store in
Page 18
2013 California Building Energy Efficiency Standards Draft Report March 10, 2011
combination with some puck lights in millwork and minimal use of fluorescent fill lighting. Baseline
lighting developed using Title 24 2008 compliance targets were evaluated against several new
luminaire technology options. The role of current limiters with track lighting was also evaluated.
Model G: Kitchen Accessories and Tableware Store. The Kitchen Accessories & Tableware Model is
similar to Williams Sonoma or Crate and Barrel. It uses a non-uniform illumination approach with
little accent lighting. The two demonstration areas are highlighted using a combination of fluorescent
and down lights. Track lighting was used extensively for flexibility.
3.6 New Technology and Design Comparison Computer Models
Partial computer models were constructed using AGi32 to simulate various feature lighting situations
that are encountered in most retail locations. Models included wall and floor accent lighting
simulations as well as simulations for casework, shelf and decorative lighting elements. Some of these
models were previously created for Title 24-2008 standards and updated for this 2013 upate. Others
were specifically created for this 2013 study.
Models for the New Technology and Design Comparison are:
Model H: Floor Accents Comparing CMH, LED, Advanced Halogen IR and Baseline Halogen
Model I: Wall Accents Comparing CMH, LED, Advanced Halogen IR and Baseline Halogen
Model J: Mounting Height vs. Throw Distance for Various Lamp Wattages and Lamp Types
See Appendix IX New Technology and Design Comparison Computer Models
A format similar to Section 3.4 Retail Store Computer Modeling was used for each analysis. Our goal
was to examine each design model for the best application of the latest lamp technology and determine
the strength and weakness of the currently available lamps and luminaires with respect to foot-candle
levels as they relate to ceiling (or luminaire) height and/or throw distance.
Model I compared vertical wall accent lighting with advanced technology options to a baseline model
using conventional halogen and MR-16 lamp options. Advanced technology option included Halogen
IR PAR and IR MR16 lamps, PAR38 self-ballasted CMH lamps and screw-in LED lamps. Lamps
were placed at 10 feet from the floor with 3 foot spacing 3 feet from the wall and at a 30 degree angle.
Model J: looks at the effects of mounting heights on accent and display lighting. Halogen IR , Ceramic
Metal Halide and Light Emitting Diode accent lights were studied to determine limitations, if any, of
CMH and LED lamps to provide a balanced design alternates to Halogen.
Only three CMH lamp wattages (20W, 39W, 70W) are available as alternates to replace the wide
variety of wattages (45W to 250W) of the popular PAR38 lamp for accent lighting. Based on the
limited CMH offerings we knew that there would be a gap at certain ceiling heights where the 20W
was not enough and the 39W and 70W CMH would be in excess of the desired foot-candle levels on
various targets.
Light Emitting Diode (LED) accent lighting lamps are limited to lower wattages and lower lumen
outputs. Based on current LED output we knew that there would be a limit to the effectiveness of LED
accent lights at certain ceiling heights. The model was used to determine those limits.
3.7 Review & Analysis of Retail Spaces Permitted under Title 24 2005, ASHRAE 90.1-04
and the Washington State Energy Code
We selected specific retail spaces that complied with Title 24 2005 and ASHRAE 90.1 2004. We
analyzed these spaces for their ability to comply with Title 24 2008 and the 2010 Washington Energy
Page 19
2013 California Building Energy Efficiency Standards Draft Report March 10, 2011
Code using current, higher efficacy technologies. Analysis and comparison of ASHRAE 90.1 2010
against the base models and Title 2402008 was also conducted. This information was then used to
extrapolate the possible LPD level recommendations for Title 24 2013.
3.8 Controls Evaluation
Lighting controls are an effective way to save energy without impacting the appearance of a space. By
its very nature the tailored lighting method is used when designers wish to install higher connected
lighting loads. A code requirement for additional controls when the tailored lighting method is used
helps minimize the energy impact of this method. In addition, since the lighting power densities are
higher in tailored method space, there is more wattage available to control and this helps accelerate
payback of control systems.
We have selected a prototypical control system for a small 2,500 sf retail space to evaluate the cost-
effectiveness of requiring controls that automatically reduce light levels in layers and turn off all lights
after hour. A presentation of the model and potential cost savings are discussed in the Results Section.
Additional savings can be achieved by integrating demand response controls and daylight harvesting
controls with the controls evaluated in this proposal.
3.9 Ornamental Lighting Evaluation for Title 24 2013
Ornamental lighting allowances in both the area category method and the tailored method are, at
present, based on incandescent light sources. This light source is often a medium or candelabra based
conventional incandescent lamp. There is now an array of halogen replacement lamps as well as
several CFL and LED options for most of these lamps.
In other cases ornamental lighting includes fairly high wattage incandescent lamps such as in theatrical
projectors. Projector luminaires are now available with higher efficiency metal halide sources and in
some cases LED lamping. These luminaire/lamp options not only offer vastly improved efficacy they
also exhibit longer lamp life and reduced maintenance.
Models created to evaluate options for Ornamental lighting are:
Large Chandelier (Baseline incandescent versus Halogen, CMH and High Lumen CFL)
Small Chandelier (Baseline incandescent versus Halogen and CFL)
Wall Sconce (Baseline incandescent versus Halogen, CFL and LED)
Decorative Pendant (Baseline incandescent versus Halogen, CFL and LED)
Luminous Panels (Baseline fluorescent, advanced dimming fluorescent and LED)
3.10 Stakeholder Involvement
All of the main approaches, assumptions and methods of analysis used in this proposal have been
presented for review at a series of public stakeholder meetings. The goal of the stakeholder meetings
was to present CASE Study findings, solicit comments from the stakeholders and work to identify
potential concerns or issues before the California Energy Commission's public workshops. At each
meeting, the utilities' CASE team invited feedback on the proposed language and analysis thus far, and
sent out a summary of what was discussed at the meeting, along with a summary of outstanding
questions and issues. A record of the Stakeholder Meeting presentations, summaries and other
supporting documents was catalogued on www.calcodesgroup.com.
Three stakeholder meetings were held This topic was presented on the same dates and at the same
Page 20
2013 California Building Energy Efficiency Standards Draft Report March 10, 2011
venues as the other lighting topics. The Statewide Utilities CASE Team organized and publicized the
meetings through www.calcodesgroup.com and through and email campaign. Key staff from the
California Energy Commission attended each meeting.
The goal of the first meeting was to present the scope and broad direction of the code change as well as
to request data and feedback on proposed methodology from stakeholders. The goal of the second
stakeholder meeting was to present the results of data collection and analysis as well as a potential
straw man of the code language. The final stakeholder meeting was an opportunity to present the
proposed code language as it will be presented to the California Energy Commission prior to their
public workshops in April. CASE Authors solicited all input prior to the final meeting.
Page 21
2013 California Building Energy Efficiency Standards Draft Report March 10, 2011
4. Analysis and Results
4.1 Interviews with Designers, Contractors, Manufacturers, and End Users
A survey of designers, end users, contractors and manufacturers was conducted to understand the
prevalence of the use of the tailored method, the use of track limiters and the use of the latest
technologies in practice. This section summarizes the survey results from all respondents and, where
appropriate, compares the responses of the different groups.
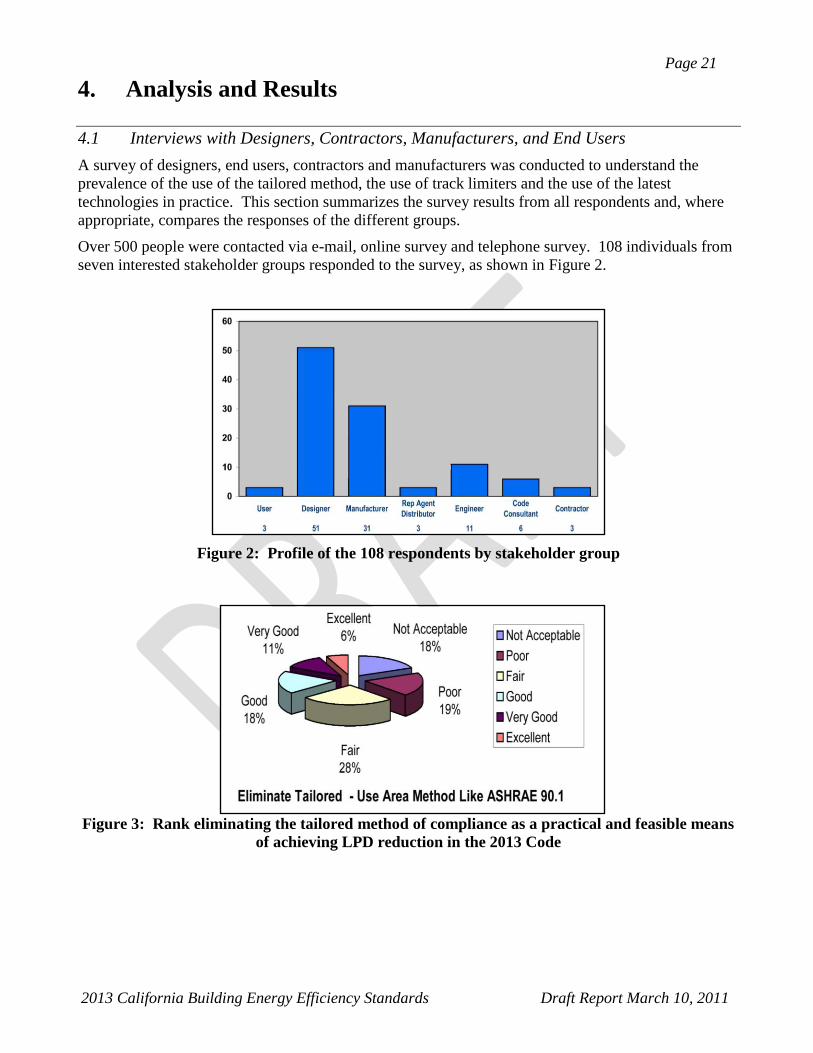
Over 500 people were contacted via e-mail, online survey and telephone survey. 108 individuals from
seven interested stakeholder groups responded to the survey, as shown in Figure 2.
Figure 2: Profile of the 108 respondents by stakeholder group
Figure 3: Rank eliminating the tailored method of compliance as a practical and feasible means
of achieving LPD reduction in the 2013 Code
Page 22
2013 California Building Energy Efficiency Standards Draft Report March 10, 2011
Those surveyed were asked to rate a variety of measures as practical and feasible means for reducing
LPD in the 2013 code. One of the measures rated was “Totally eliminate (do away with) Tailored
Method under 2013 standards and replace with limited power add-ons (similar to ASHRAE/IES 90.1)
specialized spaces / needs only.”. There was not a clear majority opinion on replacing the tailored
method with a space by space method similar to ASHRAE/IES 90.1. 35% thought it was a good to
excellent option, 28% thought it was only fair and 37% felt it was a poor to unacceptable option.
Based on these finding respondents, while not totally enamored with Title 24's Tailored Method, are
not ready to abandon it either.
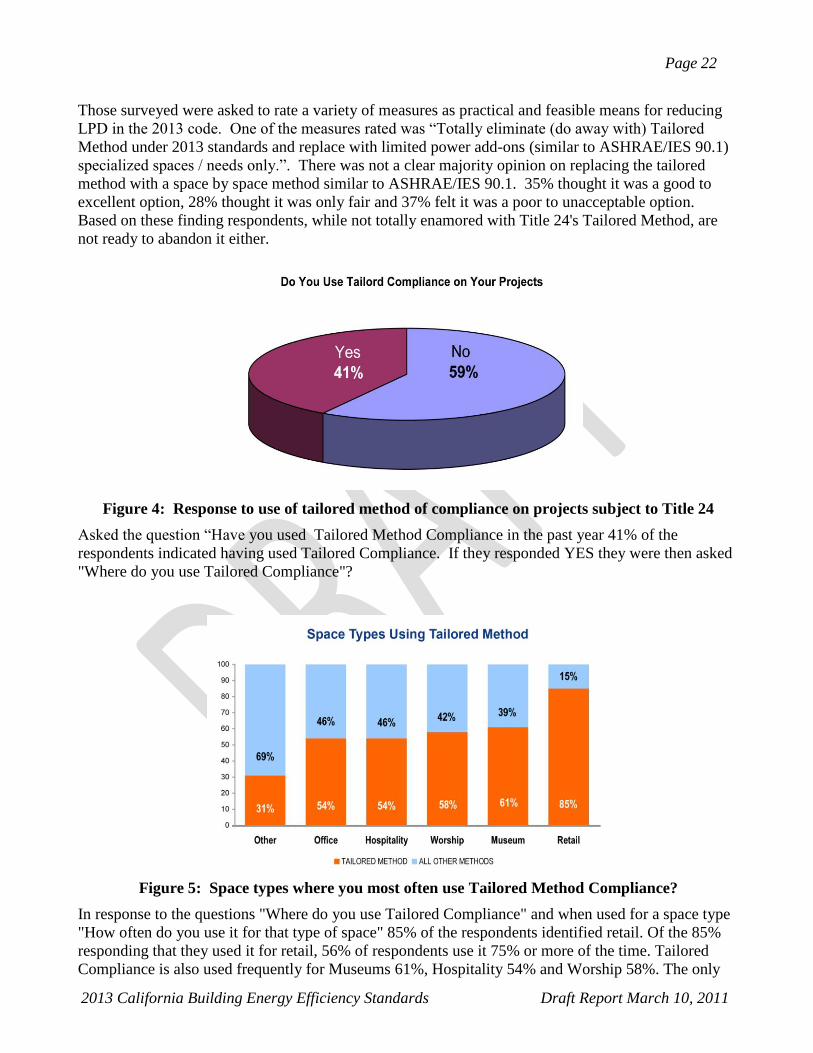
Figure 4: Response to use of tailored method of compliance on projects subject to Title 24
Asked the question “Have you used Tailored Method Compliance in the past year 41% of the
respondents indicated having used Tailored Compliance. If they responded YES they were then asked
"Where do you use Tailored Compliance"?
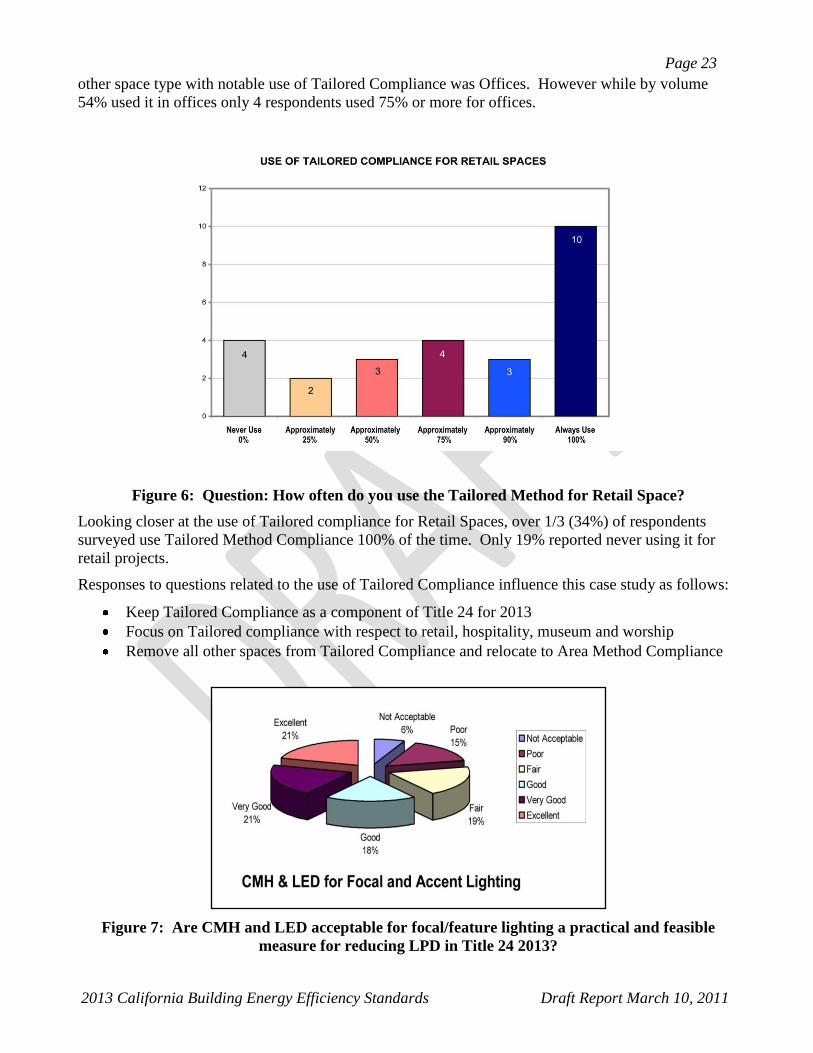
Figure 5: Space types where you most often use Tailored Method Compliance?
In response to the questions "Where do you use Tailored Compliance" and when used for a space type
"How often do you use it for that type of space" 85% of the respondents identified retail. Of the 85%
responding that they used it for retail, 56% of respondents use it 75% or more of the time. Tailored
Compliance is also used frequently for Museums 61%, Hospitality 54% and Worship 58%. The only
Page 23
2013 California Building Energy Efficiency Standards Draft Report March 10, 2011
other space type with notable use of Tailored Compliance was Offices. However while by volume
54% used it in offices only 4 respondents used 75% or more for offices.
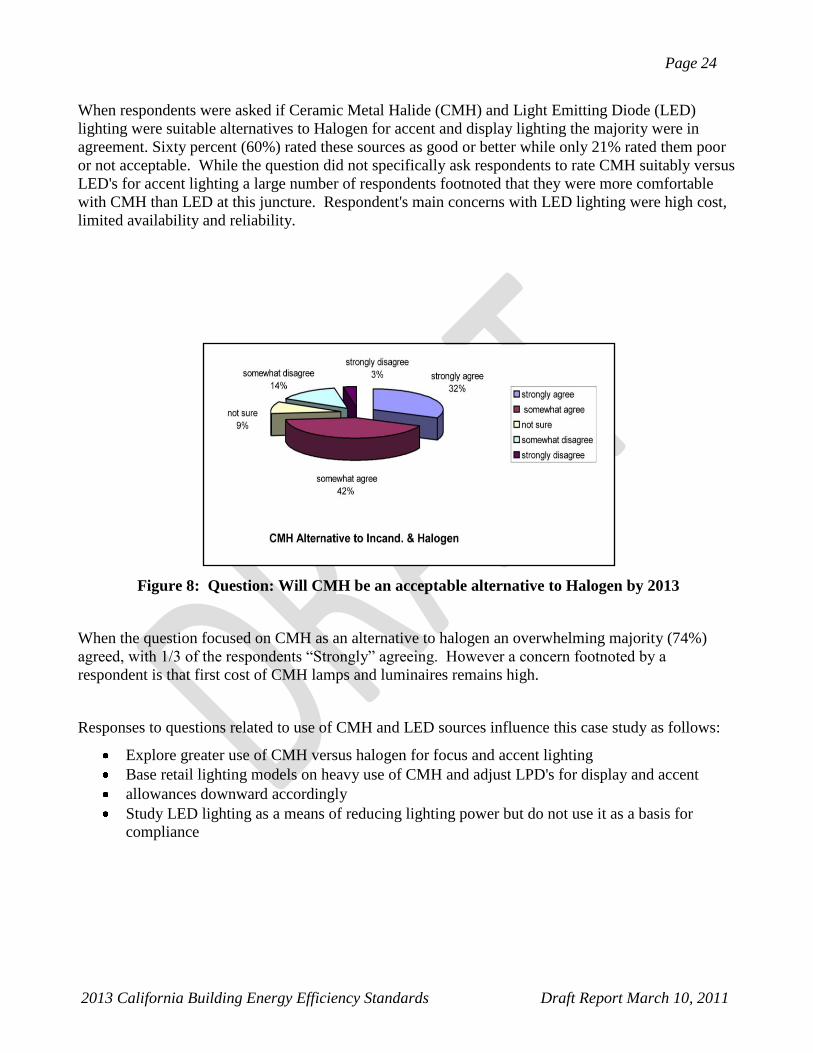
Figure 6: Question: How often do you use the Tailored Method for Retail Space?
Looking closer at the use of Tailored compliance for Retail Spaces, over 1/3 (34%) of respondents
surveyed use Tailored Method Compliance 100% of the time. Only 19% reported never using it for
retail projects.
Responses to questions related to the use of Tailored Compliance influence this case study as follows:
Keep Tailored Compliance as a component of Title 24 for 2013
Focus on Tailored compliance with respect to retail, hospitality, museum and worship
Remove all other spaces from Tailored Compliance and relocate to Area Method Compliance
Figure 7: Are CMH and LED acceptable for focal/feature lighting a practical and feasible
measure for reducing LPD in Title 24 2013?
Page 24
2013 California Building Energy Efficiency Standards Draft Report March 10, 2011
When respondents were asked if Ceramic Metal Halide (CMH) and Light Emitting Diode (LED)
lighting were suitable alternatives to Halogen for accent and display lighting the majority were in
agreement. Sixty percent (60%) rated these sources as good or better while only 21% rated them poor
or not acceptable. While the question did not specifically ask respondents to rate CMH suitably versus
LED's for accent lighting a large number of respondents footnoted that they were more comfortable
with CMH than LED at this juncture. Respondent's main concerns with LED lighting were high cost,
limited availability and reliability.
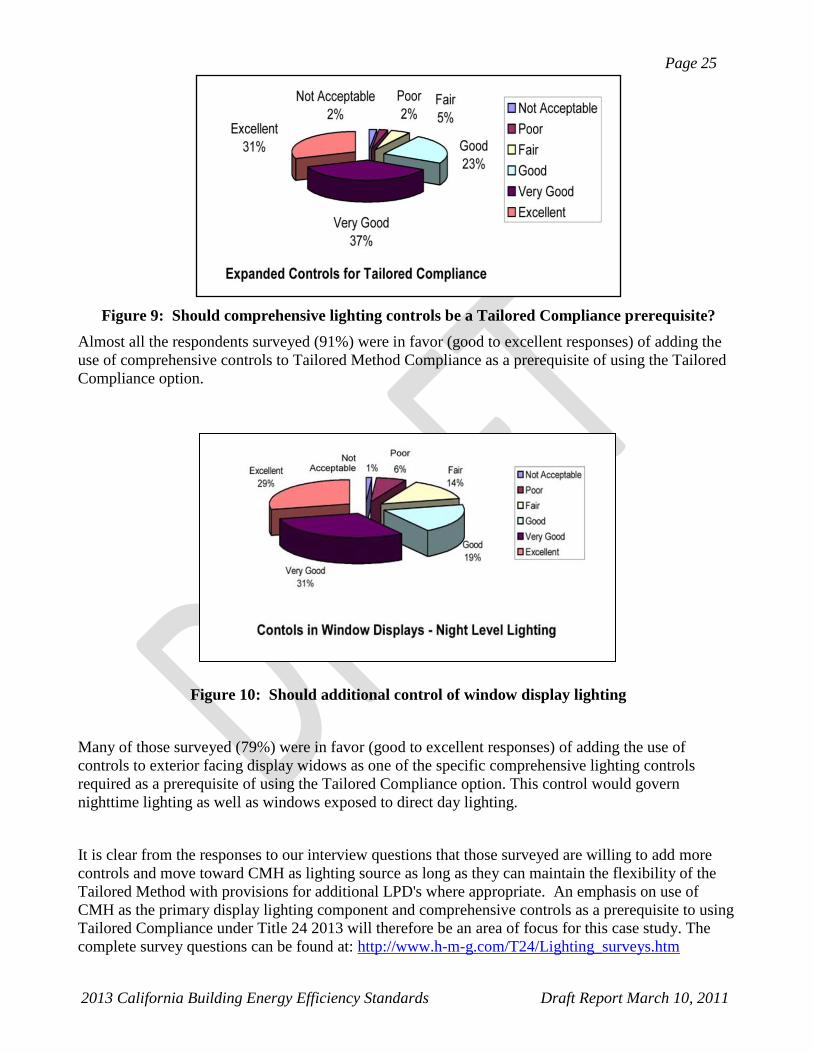
Figure 8: Question: Will CMH be an acceptable alternative to Halogen by 2013
When the question focused on CMH as an alternative to halogen an overwhelming majority (74%)
agreed, with 1/3 of the respondents “Strongly” agreeing. However a concern footnoted by a
respondent is that first cost of CMH lamps and luminaires remains high.
Responses to questions related to use of CMH and LED sources influence this case study as follows:
Explore greater use of CMH versus halogen for focus and accent lighting
Base retail lighting models on heavy use of CMH and adjust LPD's for display and accent
allowances downward accordingly
Study LED lighting as a means of reducing lighting power but do not use it as a basis for
compliance
Page 25
2013 California Building Energy Efficiency Standards Draft Report March 10, 2011
Figure 9: Should comprehensive lighting controls be a Tailored Compliance prerequisite?
Almost all the respondents surveyed (91%) were in favor (good to excellent responses) of adding the
use of comprehensive controls to Tailored Method Compliance as a prerequisite of using the Tailored
Compliance option.
Figure 10: Should additional control of window display lighting
Many of those surveyed (79%) were in favor (good to excellent responses) of adding the use of
controls to exterior facing display widows as one of the specific comprehensive lighting controls
required as a prerequisite of using the Tailored Compliance option. This control would govern
nighttime lighting as well as windows exposed to direct day lighting.
It is clear from the responses to our interview questions that those surveyed are willing to add more
controls and move toward CMH as lighting source as long as they can maintain the flexibility of the
Tailored Method with provisions for additional LPD's where appropriate. An emphasis on use of
CMH as the primary display lighting component and comprehensive controls as a prerequisite to using
Tailored Compliance under Title 24 2013 will therefore be an area of focus for this case study. The
complete survey questions can be found at: http://www.h-m-g.com/T24/Lighting_surveys.htm
Page 26
2013 California Building Energy Efficiency Standards Draft Report March 10, 2011
4.2 Life Cycle Cost Analysis of Big Box and General lighting technologies as well as CMH
and LED Accent Lighting and Decorative Lighting
Life Cycle Costing results for both a 15 year cycle is presented in this section. Cost effect analysis for
the lighting pallet used to develop the seven (7) Retail Models as well as the Technology Floor and
wall Display models is included. In addition life cycle cost effectiveness for the decorative and
Ornament lighting is presented. While we looked at cost effectiveness for both High Volume use and
low volume use only the 15 year TDV low volume use is presented here. The purchasing power
associated with high volume use will only improve the cost effectiveness results. That is to say that if
it‟s cost effective under low volume scenarios it will also be cost effective under the high volume
scenarios.
Detailed results for the analysis are shown as follows:
PSMH versus CMH, T5/HO and Super T8 Systems for Primary Big Box Retail
Standard T8 versus Super T8 for secondary Big Box and General Lighting
Standard T8 versus T5 and Super T 8 for Wall-Wash and Perimeter Lighting
Halogen and standard T8 versus T5/T8 with dimming and LED (shelf and casework)
Halogen IR versus CMH and LED for boutique, low, medium and high ceiling configurations
(floor and wall accent light applications)
Incandescent versus Halogen Incandescent, CFL, CMH and LED for Ornamental and
Decorative Lighting
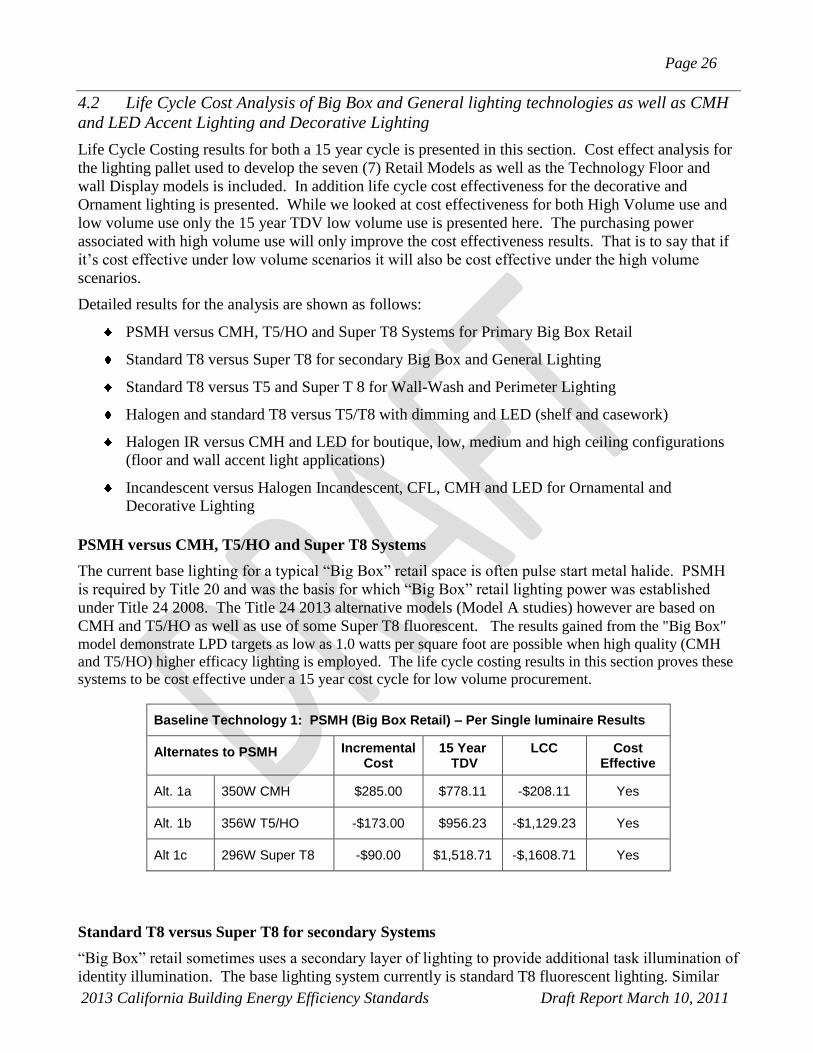
PSMH versus CMH, T5/HO and Super T8 Systems
The current base lighting for a typical “Big Box” retail space is often pulse start metal halide. PSMH
is required by Title 20 and was the basis for which “Big Box” retail lighting power was established
under Title 24 2008. The Title 24 2013 alternative models (Model A studies) however are based on
CMH and T5/HO as well as use of some Super T8 fluorescent. The results gained from the "Big Box"
model demonstrate LPD targets as low as 1.0 watts per square foot are possible when high quality (CMH
and T5/HO) higher efficacy lighting is employed. The life cycle costing results in this section proves these
systems to be cost effective under a 15 year cost cycle for low volume procurement.
Baseline Technology 1: PSMH (Big Box Retail) – Per Single luminaire Results
Alternates to PSMH Incremental Cost
15 Year TDV
LCC Cost Effective
Alt. 1a 350W CMH $285.00 $778.11 -$208.11 Yes
Alt. 1b 356W T5/HO -$173.00 $956.23 -$1,129.23 Yes
Alt 1c 296W Super T8 -$90.00 $1,518.71 -$,1608.71 Yes
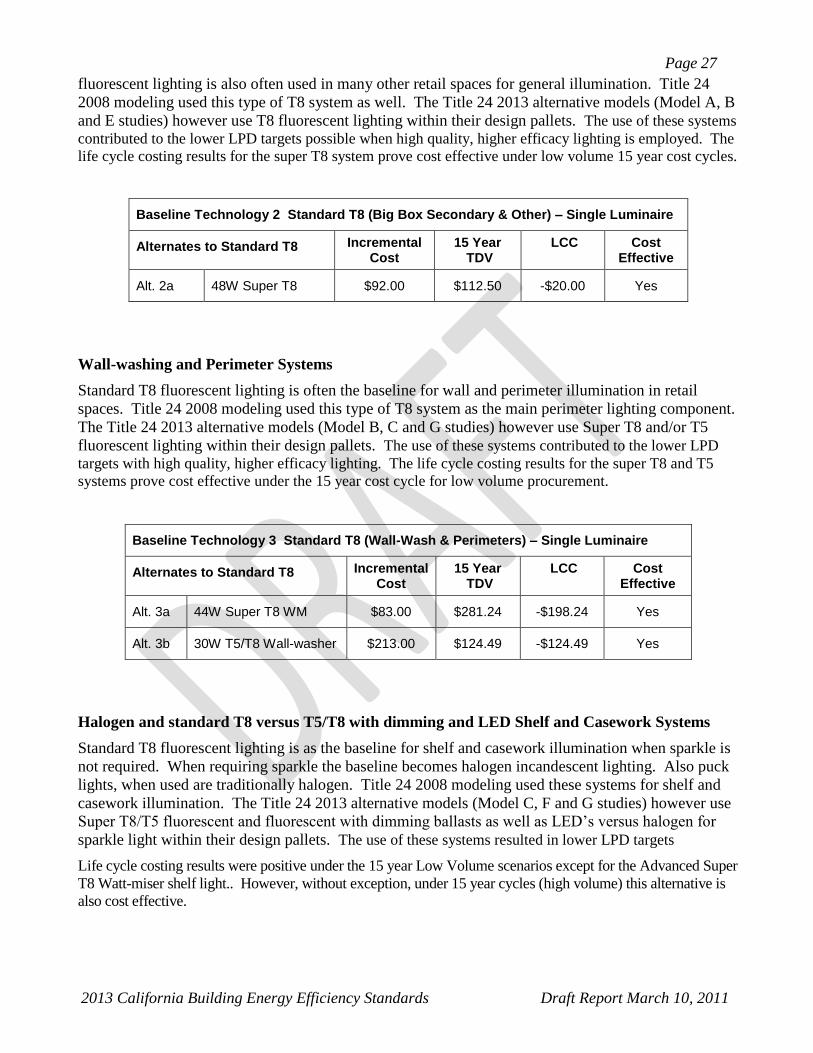
Standard T8 versus Super T8 for secondary Systems
“Big Box” retail sometimes uses a secondary layer of lighting to provide additional task illumination of
identity illumination. The base lighting system currently is standard T8 fluorescent lighting. Similar
Page 27
2013 California Building Energy Efficiency Standards Draft Report March 10, 2011
fluorescent lighting is also often used in many other retail spaces for general illumination. Title 24
2008 modeling used this type of T8 system as well. The Title 24 2013 alternative models (Model A, B
and E studies) however use T8 fluorescent lighting within their design pallets. The use of these systems
contributed to the lower LPD targets possible when high quality, higher efficacy lighting is employed. The
life cycle costing results for the super T8 system prove cost effective under low volume 15 year cost cycles.
Baseline Technology 2 Standard T8 (Big Box Secondary & Other) – Single Luminaire
Alternates to Standard T8 Incremental Cost
15 Year TDV
LCC Cost Effective
Alt. 2a 48W Super T8 $92.00 $112.50 -$20.00 Yes
Wall-washing and Perimeter Systems
Standard T8 fluorescent lighting is often the baseline for wall and perimeter illumination in retail
spaces. Title 24 2008 modeling used this type of T8 system as the main perimeter lighting component.
The Title 24 2013 alternative models (Model B, C and G studies) however use Super T8 and/or T5
fluorescent lighting within their design pallets. The use of these systems contributed to the lower LPD
targets with high quality, higher efficacy lighting. The life cycle costing results for the super T8 and T5
systems prove cost effective under the 15 year cost cycle for low volume procurement.
Baseline Technology 3 Standard T8 (Wall-Wash & Perimeters) – Single Luminaire
Alternates to Standard T8 Incremental Cost
15 Year TDV
LCC Cost Effective
Alt. 3a 44W Super T8 WM $83.00 $281.24 -$198.24 Yes
Alt. 3b 30W T5/T8 Wall-washer $213.00 $124.49 -$124.49 Yes
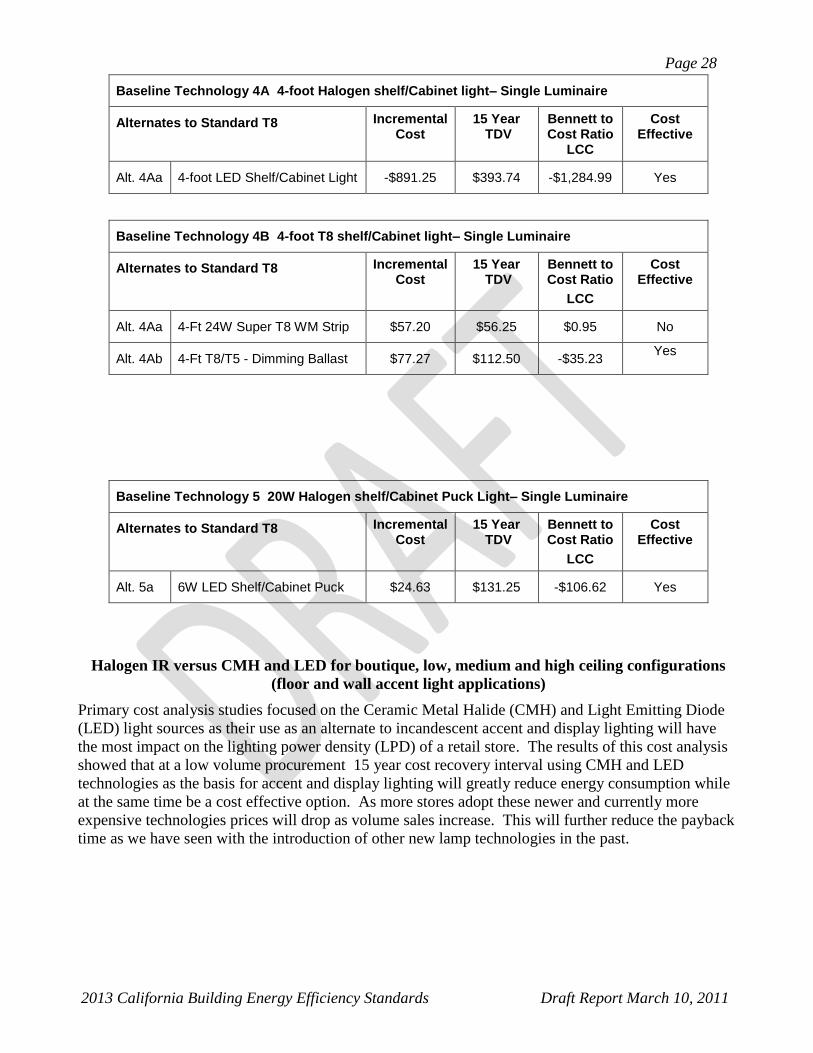
Halogen and standard T8 versus T5/T8 with dimming and LED Shelf and Casework Systems
Standard T8 fluorescent lighting is as the baseline for shelf and casework illumination when sparkle is
not required. When requiring sparkle the baseline becomes halogen incandescent lighting. Also puck
lights, when used are traditionally halogen. Title 24 2008 modeling used these systems for shelf and
casework illumination. The Title 24 2013 alternative models (Model C, F and G studies) however use
Super T8/T5 fluorescent and fluorescent with dimming ballasts as well as LED‟s versus halogen for
sparkle light within their design pallets. The use of these systems resulted in lower LPD targets
Life cycle costing results were positive under the 15 year Low Volume scenarios except for the Advanced Super
T8 Watt-miser shelf light.. However, without exception, under 15 year cycles (high volume) this alternative is
also cost effective.
Page 28
2013 California Building Energy Efficiency Standards Draft Report March 10, 2011
Baseline Technology 4A 4-foot Halogen shelf/Cabinet light– Single Luminaire
Alternates to Standard T8 Incremental Cost
15 Year TDV
Bennett to Cost Ratio
LCC
Cost Effective
Alt. 4Aa 4-foot LED Shelf/Cabinet Light -$891.25 $393.74 -$1,284.99 Yes
Baseline Technology 4B 4-foot T8 shelf/Cabinet light– Single Luminaire
Alternates to Standard T8 Incremental Cost
15 Year TDV
Bennett to Cost Ratio
LCC
Cost Effective
Alt. 4Aa 4-Ft 24W Super T8 WM Strip $57.20 $56.25 $0.95 No
Alt. 4Ab 4-Ft T8/T5 - Dimming Ballast $77.27 $112.50 -$35.23 Yes
Baseline Technology 5 20W Halogen shelf/Cabinet Puck Light– Single Luminaire
Alternates to Standard T8 Incremental Cost
15 Year TDV
Bennett to Cost Ratio
LCC
Cost Effective
Alt. 5a 6W LED Shelf/Cabinet Puck $24.63 $131.25 -$106.62 Yes
Halogen IR versus CMH and LED for boutique, low, medium and high ceiling configurations
(floor and wall accent light applications)
Primary cost analysis studies focused on the Ceramic Metal Halide (CMH) and Light Emitting Diode
(LED) light sources as their use as an alternate to incandescent accent and display lighting will have
the most impact on the lighting power density (LPD) of a retail store. The results of this cost analysis
showed that at a low volume procurement 15 year cost recovery interval using CMH and LED
technologies as the basis for accent and display lighting will greatly reduce energy consumption while
at the same time be a cost effective option. As more stores adopt these newer and currently more
expensive technologies prices will drop as volume sales increase. This will further reduce the payback
time as we have seen with the introduction of other new lamp technologies in the past.
Page 29
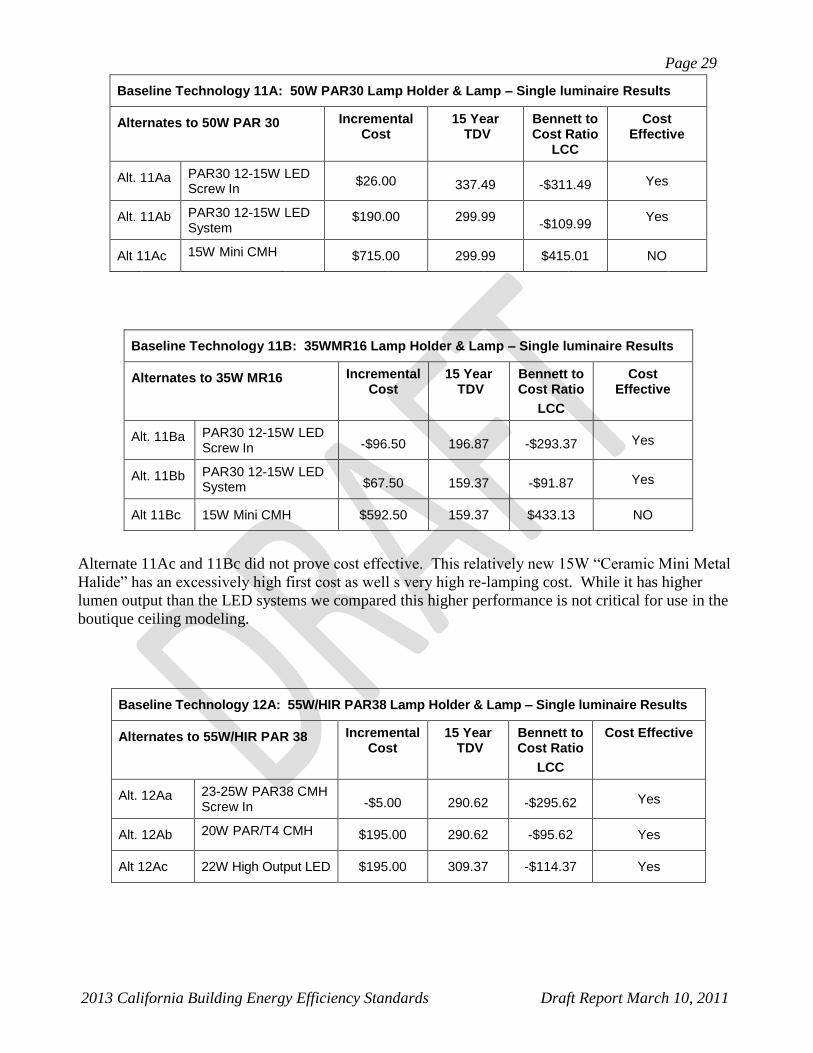
2013 California Building Energy Efficiency Standards Draft Report March 10, 2011
Baseline Technology 11A: 50W PAR30 Lamp Holder & Lamp – Single luminaire Results
Alternates to 50W PAR 30 Incremental Cost
15 Year TDV
Bennett to Cost Ratio
LCC
Cost Effective
Alt. 11Aa PAR30 12-15W LED Screw In
$26.00 337.49 -$311.49 Yes
Alt. 11Ab PAR30 12-15W LED System
$190.00 299.99 -$109.99
Yes
Alt 11Ac 15W Mini CMH $715.00 299.99 $415.01 NO
Baseline Technology 11B: 35WMR16 Lamp Holder & Lamp – Single luminaire Results
Alternates to 35W MR16 Incremental Cost
15 Year TDV
Bennett to Cost Ratio
LCC
Cost Effective
Alt. 11Ba PAR30 12-15W LED Screw In -$96.50 196.87 -$293.37 Yes
Alt. 11Bb PAR30 12-15W LED System $67.50 159.37 -$91.87 Yes
Alt 11Bc 15W Mini CMH $592.50 159.37 $433.13 NO
Alternate 11Ac and 11Bc did not prove cost effective. This relatively new 15W “Ceramic Mini Metal
Halide” has an excessively high first cost as well s very high re-lamping cost. While it has higher
lumen output than the LED systems we compared this higher performance is not critical for use in the
boutique ceiling modeling.
Baseline Technology 12A: 55W/HIR PAR38 Lamp Holder & Lamp – Single luminaire Results
Alternates to 55W/HIR PAR 38 Incremental Cost
15 Year TDV
Bennett to Cost Ratio
LCC
Cost Effective
Alt. 12Aa 23-25W PAR38 CMH Screw In -$5.00 290.62 -$295.62 Yes
Alt. 12Ab 20W PAR/T4 CMH $195.00 290.62 -$95.62 Yes
Alt 12Ac 22W High Output LED $195.00 309.37 -$114.37 Yes
Page 30
2013 California Building Energy Efficiency Standards Draft Report March 10, 2011
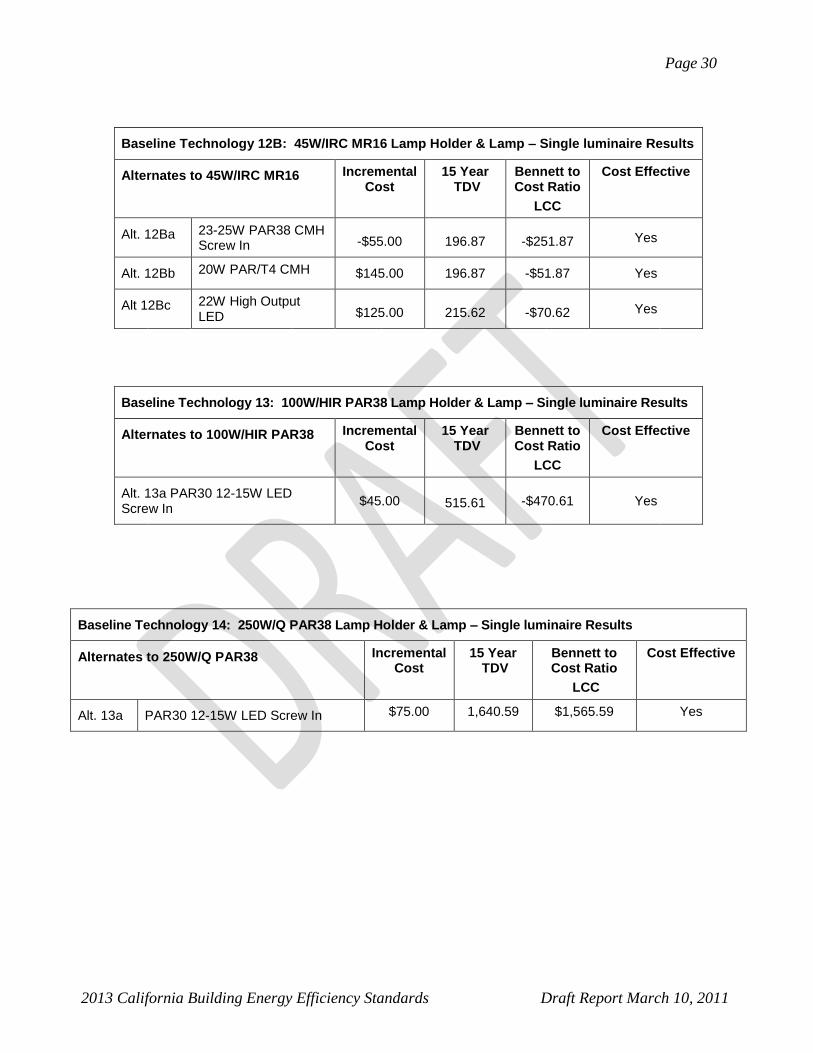
Baseline Technology 12B: 45W/IRC MR16 Lamp Holder & Lamp – Single luminaire Results
Alternates to 45W/IRC MR16 Incremental Cost
15 Year TDV
Bennett to Cost Ratio
LCC
Cost Effective
Alt. 12Ba 23-25W PAR38 CMH Screw In -$55.00 196.87 -$251.87 Yes
Alt. 12Bb 20W PAR/T4 CMH $145.00 196.87 -$51.87 Yes
Alt 12Bc 22W High Output LED $125.00 215.62 -$70.62 Yes
Baseline Technology 13: 100W/HIR PAR38 Lamp Holder & Lamp – Single luminaire Results
Alternates to 100W/HIR PAR38 Incremental Cost
15 Year TDV
Bennett to Cost Ratio
LCC
Cost Effective
Alt. 13a PAR30 12-15W LED Screw In
$45.00 515.61 -$470.61 Yes
Baseline Technology 14: 250W/Q PAR38 Lamp Holder & Lamp – Single luminaire Results
Alternates to 250W/Q PAR38 Incremental Cost
15 Year TDV
Bennett to Cost Ratio
LCC
Cost Effective
Alt. 13a PAR30 12-15W LED Screw In $75.00 1,640.59 $1,565.59 Yes
Page 31
2013 California Building Energy Efficiency Standards Draft Report March 10, 2011
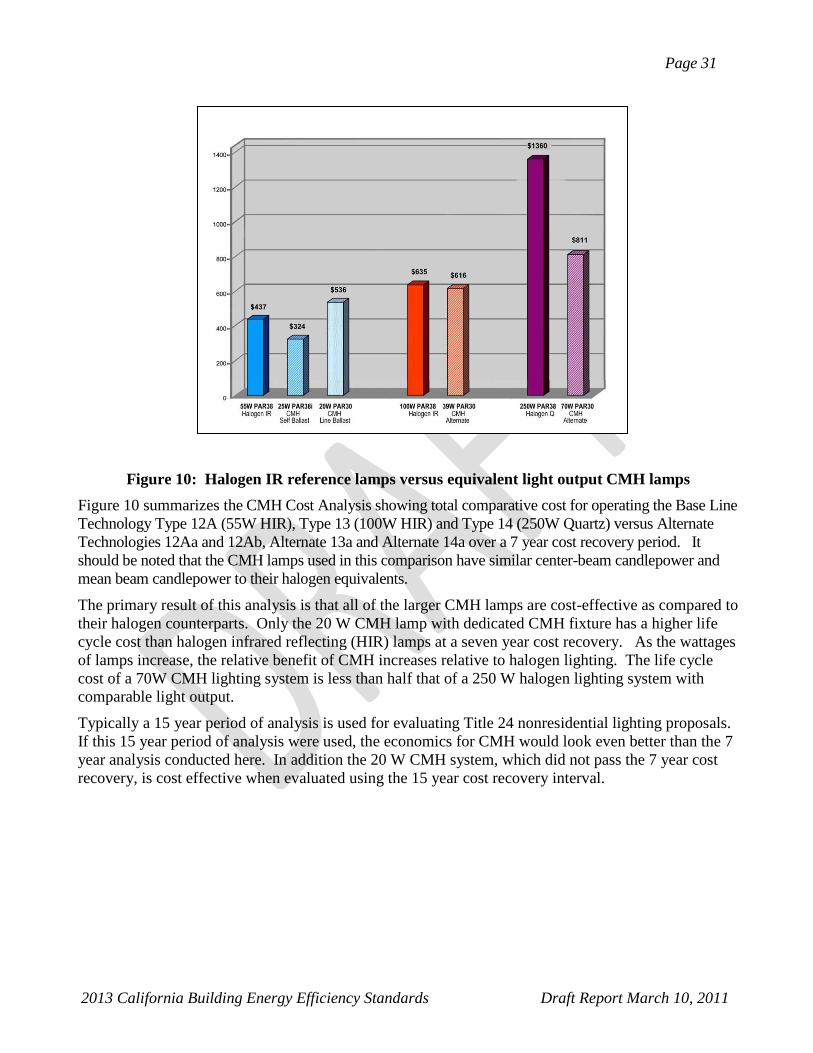
Figure 10: Halogen IR reference lamps versus equivalent light output CMH lamps
Figure 10 summarizes the CMH Cost Analysis showing total comparative cost for operating the Base Line
Technology Type 12A (55W HIR), Type 13 (100W HIR) and Type 14 (250W Quartz) versus Alternate
Technologies 12Aa and 12Ab, Alternate 13a and Alternate 14a over a 7 year cost recovery period. It
should be noted that the CMH lamps used in this comparison have similar center-beam candlepower and
mean beam candlepower to their halogen equivalents.
The primary result of this analysis is that all of the larger CMH lamps are cost-effective as compared to
their halogen counterparts. Only the 20 W CMH lamp with dedicated CMH fixture has a higher life
cycle cost than halogen infrared reflecting (HIR) lamps at a seven year cost recovery. As the wattages
of lamps increase, the relative benefit of CMH increases relative to halogen lighting. The life cycle
cost of a 70W CMH lighting system is less than half that of a 250 W halogen lighting system with
comparable light output.
Typically a 15 year period of analysis is used for evaluating Title 24 nonresidential lighting proposals.
If this 15 year period of analysis were used, the economics for CMH would look even better than the 7
year analysis conducted here. In addition the 20 W CMH system, which did not pass the 7 year cost
recovery, is cost effective when evaluated using the 15 year cost recovery interval.
Page 32
2013 California Building Energy Efficiency Standards Draft Report March 10, 2011
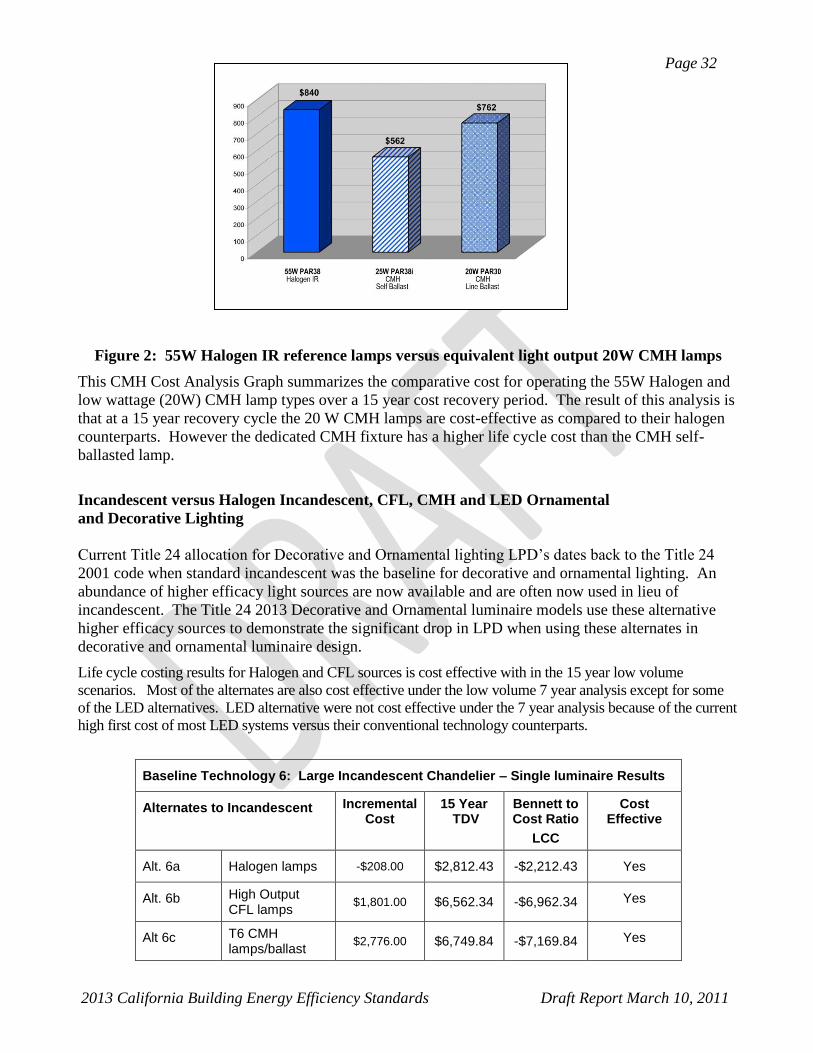
Figure 2: 55W Halogen IR reference lamps versus equivalent light output 20W CMH lamps
This CMH Cost Analysis Graph summarizes the comparative cost for operating the 55W Halogen and
low wattage (20W) CMH lamp types over a 15 year cost recovery period. The result of this analysis is
that at a 15 year recovery cycle the 20 W CMH lamps are cost-effective as compared to their halogen
counterparts. However the dedicated CMH fixture has a higher life cycle cost than the CMH self-
ballasted lamp.
Incandescent versus Halogen Incandescent, CFL, CMH and LED Ornamental
and Decorative Lighting
Current Title 24 allocation for Decorative and Ornamental lighting LPD‟s dates back to the Title 24
2001 code when standard incandescent was the baseline for decorative and ornamental lighting. An
abundance of higher efficacy light sources are now available and are often now used in lieu of
incandescent. The Title 24 2013 Decorative and Ornamental luminaire models use these alternative
higher efficacy sources to demonstrate the significant drop in LPD when using these alternates in
decorative and ornamental luminaire design.
Life cycle costing results for Halogen and CFL sources is cost effective with in the 15 year low volume
scenarios. Most of the alternates are also cost effective under the low volume 7 year analysis except for some
of the LED alternatives. LED alternative were not cost effective under the 7 year analysis because of the current
high first cost of most LED systems versus their conventional technology counterparts.
Baseline Technology 6: Large Incandescent Chandelier – Single luminaire Results
Alternates to Incandescent Incremental Cost
15 Year TDV
Bennett to Cost Ratio
LCC
Cost Effective
Alt. 6a Halogen lamps -$208.00 $2,812.43 -$2,212.43 Yes
Alt. 6b High Output CFL lamps
$1,801.00 $6,562.34 -$6,962.34 Yes
Alt 6c T6 CMH lamps/ballast
$2,776.00 $6,749.84 -$7,169.84 Yes
Page 33
2013 California Building Energy Efficiency Standards Draft Report March 10, 2011
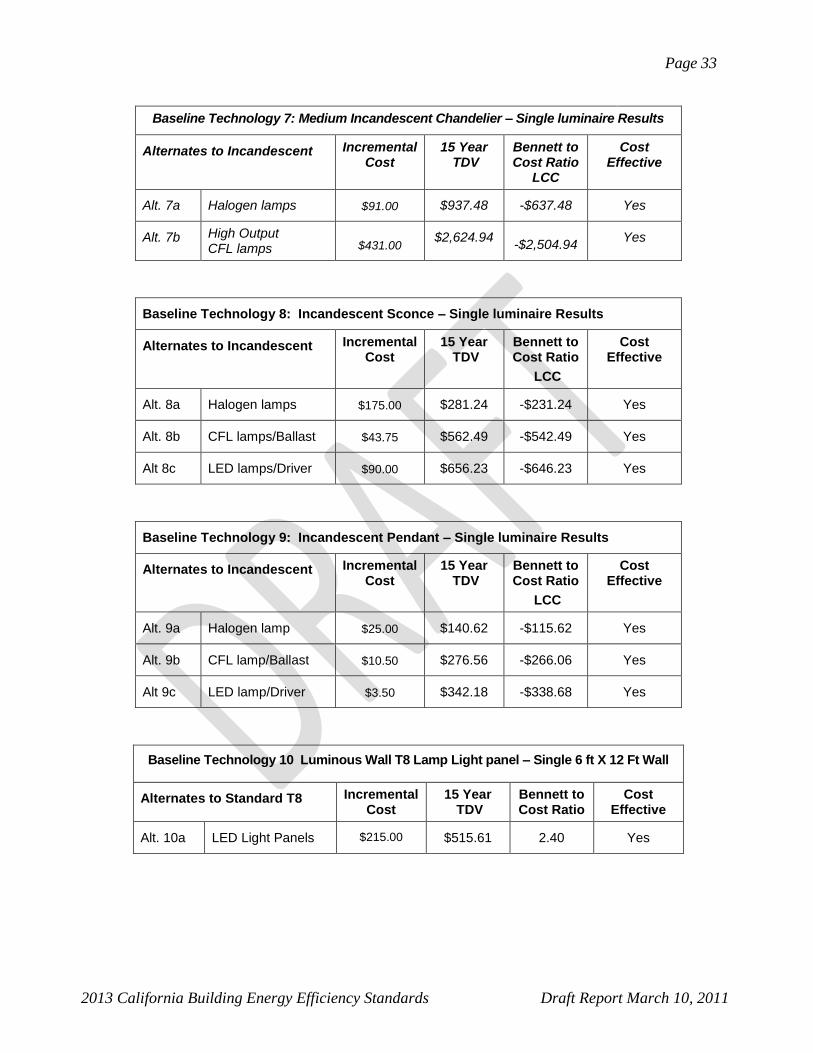
Baseline Technology 7: Medium Incandescent Chandelier – Single luminaire Results
Alternates to Incandescent Incremental Cost
15 Year TDV
Bennett to Cost Ratio
LCC
Cost Effective
Alt. 7a Halogen lamps $91.00 $937.48 -$637.48 Yes
Alt. 7b High Output CFL lamps $431.00
$2,624.94 -$2,504.94
Yes
Baseline Technology 8: Incandescent Sconce – Single luminaire Results
Alternates to Incandescent Incremental Cost
15 Year TDV
Bennett to Cost Ratio
LCC
Cost Effective
Alt. 8a Halogen lamps $175.00 $281.24 -$231.24 Yes
Alt. 8b CFL lamps/Ballast $43.75 $562.49 -$542.49 Yes
Alt 8c LED lamps/Driver $90.00 $656.23 -$646.23 Yes
Baseline Technology 9: Incandescent Pendant – Single luminaire Results
Alternates to Incandescent Incremental Cost
15 Year TDV
Bennett to Cost Ratio
LCC
Cost Effective
Alt. 9a Halogen lamp $25.00 $140.62 -$115.62 Yes
Alt. 9b CFL lamp/Ballast $10.50 $276.56 -$266.06 Yes
Alt 9c LED lamp/Driver $3.50 $342.18 -$338.68 Yes
Baseline Technology 10 Luminous Wall T8 Lamp Light panel – Single 6 ft X 12 Ft Wall
Alternates to Standard T8 Incremental Cost
15 Year TDV
Bennett to Cost Ratio
Cost Effective
Alt. 10a LED Light Panels $215.00 $515.61 2.40 Yes
Page 34
2013 California Building Energy Efficiency Standards Draft Report March 10, 2011
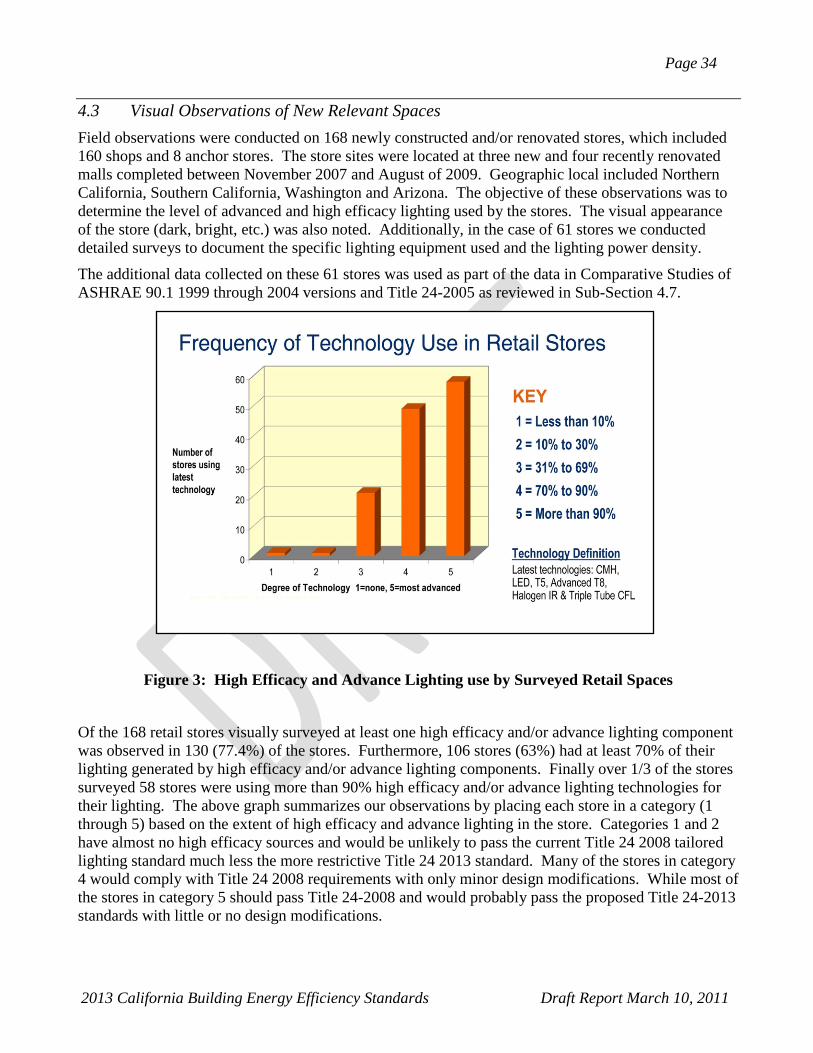
4.3 Visual Observations of New Relevant Spaces
Field observations were conducted on 168 newly constructed and/or renovated stores, which included
160 shops and 8 anchor stores. The store sites were located at three new and four recently renovated
malls completed between November 2007 and August of 2009. Geographic local included Northern
California, Southern California, Washington and Arizona. The objective of these observations was to
determine the level of advanced and high efficacy lighting used by the stores. The visual appearance
of the store (dark, bright, etc.) was also noted. Additionally, in the case of 61 stores we conducted
detailed surveys to document the specific lighting equipment used and the lighting power density.
The additional data collected on these 61 stores was used as part of the data in Comparative Studies of
ASHRAE 90.1 1999 through 2004 versions and Title 24-2005 as reviewed in Sub-Section 4.7.
Figure 3: High Efficacy and Advance Lighting use by Surveyed Retail Spaces
Of the 168 retail stores visually surveyed at least one high efficacy and/or advance lighting component
was observed in 130 (77.4%) of the stores. Furthermore, 106 stores (63%) had at least 70% of their
lighting generated by high efficacy and/or advance lighting components. Finally over 1/3 of the stores
surveyed 58 stores were using more than 90% high efficacy and/or advance lighting technologies for
their lighting. The above graph summarizes our observations by placing each store in a category (1
through 5) based on the extent of high efficacy and advance lighting in the store. Categories 1 and 2
have almost no high efficacy sources and would be unlikely to pass the current Title 24 2008 tailored
lighting standard much less the more restrictive Title 24 2013 standard. Many of the stores in category
4 would comply with Title 24 2008 requirements with only minor design modifications. While most of
the stores in category 5 should pass Title 24-2008 and would probably pass the proposed Title 24-2013
standards with little or no design modifications.
Page 35
2013 California Building Energy Efficiency Standards Draft Report March 10, 2011
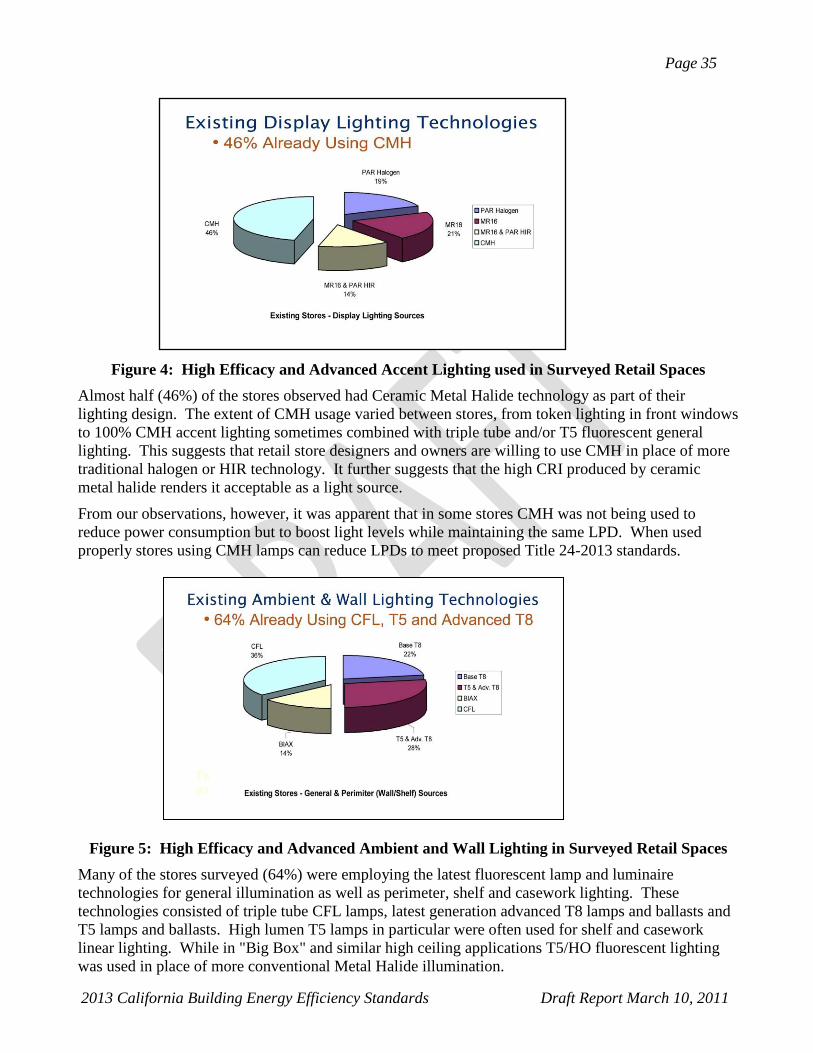
Figure 4: High Efficacy and Advanced Accent Lighting used in Surveyed Retail Spaces
Almost half (46%) of the stores observed had Ceramic Metal Halide technology as part of their
lighting design. The extent of CMH usage varied between stores, from token lighting in front windows
to 100% CMH accent lighting sometimes combined with triple tube and/or T5 fluorescent general
lighting. This suggests that retail store designers and owners are willing to use CMH in place of more
traditional halogen or HIR technology. It further suggests that the high CRI produced by ceramic
metal halide renders it acceptable as a light source.
From our observations, however, it was apparent that in some stores CMH was not being used to
reduce power consumption but to boost light levels while maintaining the same LPD. When used
properly stores using CMH lamps can reduce LPDs to meet proposed Title 24-2013 standards.
Figure 5: High Efficacy and Advanced Ambient and Wall Lighting in Surveyed Retail Spaces
Many of the stores surveyed (64%) were employing the latest fluorescent lamp and luminaire
technologies for general illumination as well as perimeter, shelf and casework lighting. These
technologies consisted of triple tube CFL lamps, latest generation advanced T8 lamps and ballasts and
T5 lamps and ballasts. High lumen T5 lamps in particular were often used for shelf and casework
linear lighting. While in "Big Box" and similar high ceiling applications T5/HO fluorescent lighting
was used in place of more conventional Metal Halide illumination.
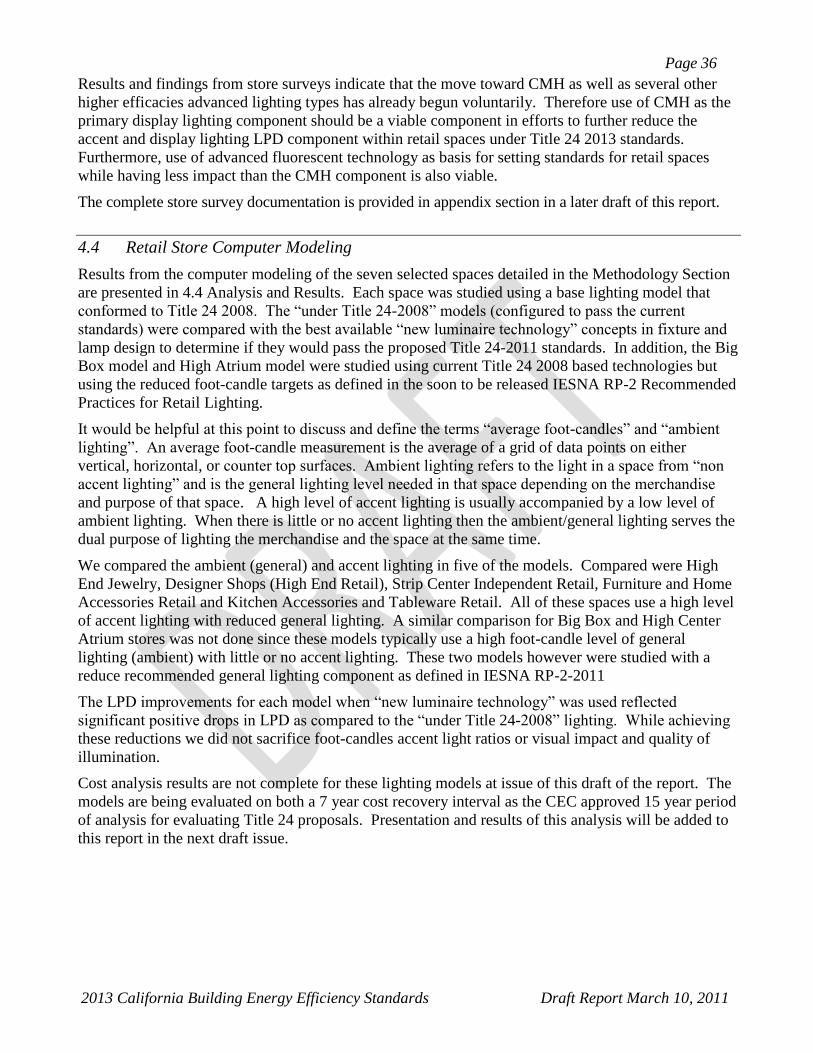
Page 36
2013 California Building Energy Efficiency Standards Draft Report March 10, 2011
Results and findings from store surveys indicate that the move toward CMH as well as several other
higher efficacies advanced lighting types has already begun voluntarily. Therefore use of CMH as the
primary display lighting component should be a viable component in efforts to further reduce the
accent and display lighting LPD component within retail spaces under Title 24 2013 standards.
Furthermore, use of advanced fluorescent technology as basis for setting standards for retail spaces
while having less impact than the CMH component is also viable.
The complete store survey documentation is provided in appendix section in a later draft of this report.
4.4 Retail Store Computer Modeling
Results from the computer modeling of the seven selected spaces detailed in the Methodology Section
are presented in 4.4 Analysis and Results. Each space was studied using a base lighting model that
conformed to Title 24 2008. The “under Title 24-2008” models (configured to pass the current
standards) were compared with the best available “new luminaire technology” concepts in fixture and
lamp design to determine if they would pass the proposed Title 24-2011 standards. In addition, the Big
Box model and High Atrium model were studied using current Title 24 2008 based technologies but
using the reduced foot-candle targets as defined in the soon to be released IESNA RP-2 Recommended
Practices for Retail Lighting.
It would be helpful at this point to discuss and define the terms “average foot-candles” and “ambient
lighting”. An average foot-candle measurement is the average of a grid of data points on either
vertical, horizontal, or counter top surfaces. Ambient lighting refers to the light in a space from “non
accent lighting” and is the general lighting level needed in that space depending on the merchandise
and purpose of that space. A high level of accent lighting is usually accompanied by a low level of
ambient lighting. When there is little or no accent lighting then the ambient/general lighting serves the
dual purpose of lighting the merchandise and the space at the same time.
We compared the ambient (general) and accent lighting in five of the models. Compared were High
End Jewelry, Designer Shops (High End Retail), Strip Center Independent Retail, Furniture and Home
Accessories Retail and Kitchen Accessories and Tableware Retail. All of these spaces use a high level
of accent lighting with reduced general lighting. A similar comparison for Big Box and High Center
Atrium stores was not done since these models typically use a high foot-candle level of general
lighting (ambient) with little or no accent lighting. These two models however were studied with a
reduce recommended general lighting component as defined in IESNA RP-2-2011
The LPD improvements for each model when “new luminaire technology” was used reflected
significant positive drops in LPD as compared to the “under Title 24-2008” lighting. While achieving
these reductions we did not sacrifice foot-candles accent light ratios or visual impact and quality of
illumination.
Cost analysis results are not complete for these lighting models at issue of this draft of the report. The
models are being evaluated on both a 7 year cost recovery interval as the CEC approved 15 year period
of analysis for evaluating Title 24 proposals. Presentation and results of this analysis will be added to
this report in the next draft issue.
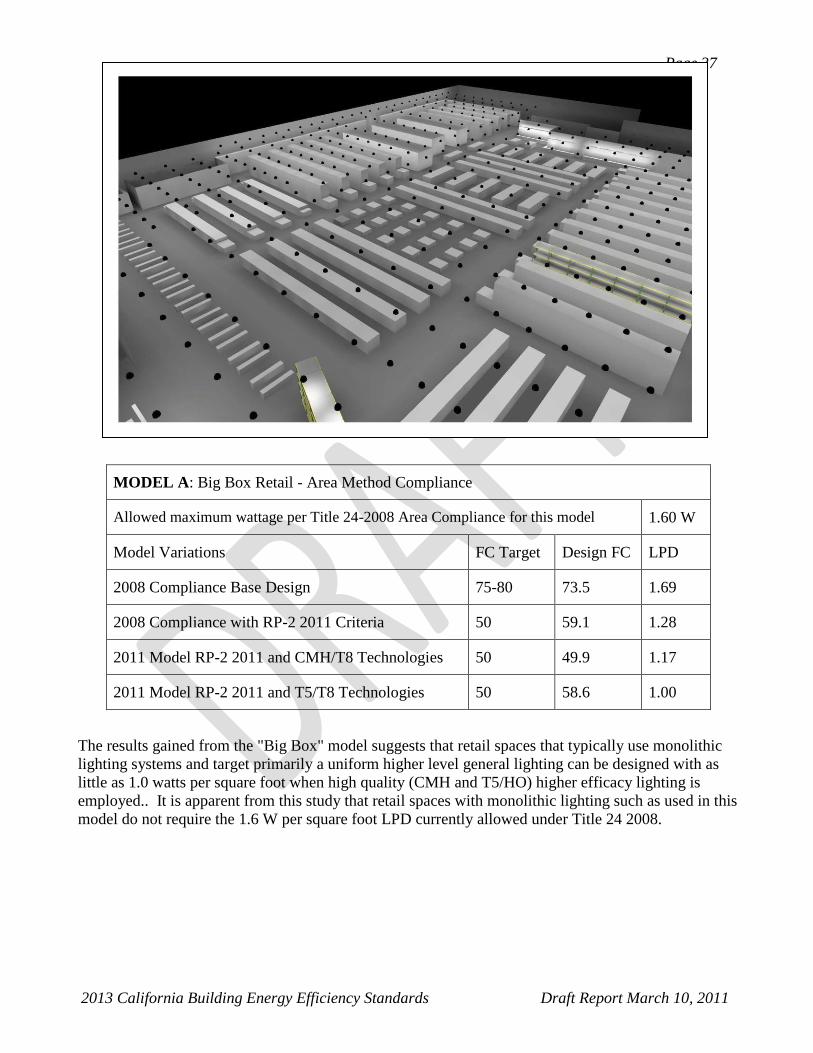
Page 37
2013 California Building Energy Efficiency Standards Draft Report March 10, 2011
MODEL A: Big Box Retail - Area Method Compliance
Allowed maximum wattage per Title 24-2008 Area Compliance for this model 1.60 W
Model Variations FC Target Design FC LPD
2008 Compliance Base Design 75-80 73.5 1.69
2008 Compliance with RP-2 2011 Criteria 50 59.1 1.28
2011 Model RP-2 2011 and CMH/T8 Technologies 50 49.9 1.17
2011 Model RP-2 2011 and T5/T8 Technologies 50 58.6 1.00
The results gained from the "Big Box" model suggests that retail spaces that typically use monolithic
lighting systems and target primarily a uniform higher level general lighting can be designed with as
little as 1.0 watts per square foot when high quality (CMH and T5/HO) higher efficacy lighting is
employed.. It is apparent from this study that retail spaces with monolithic lighting such as used in this
model do not require the 1.6 W per square foot LPD currently allowed under Title 24 2008.
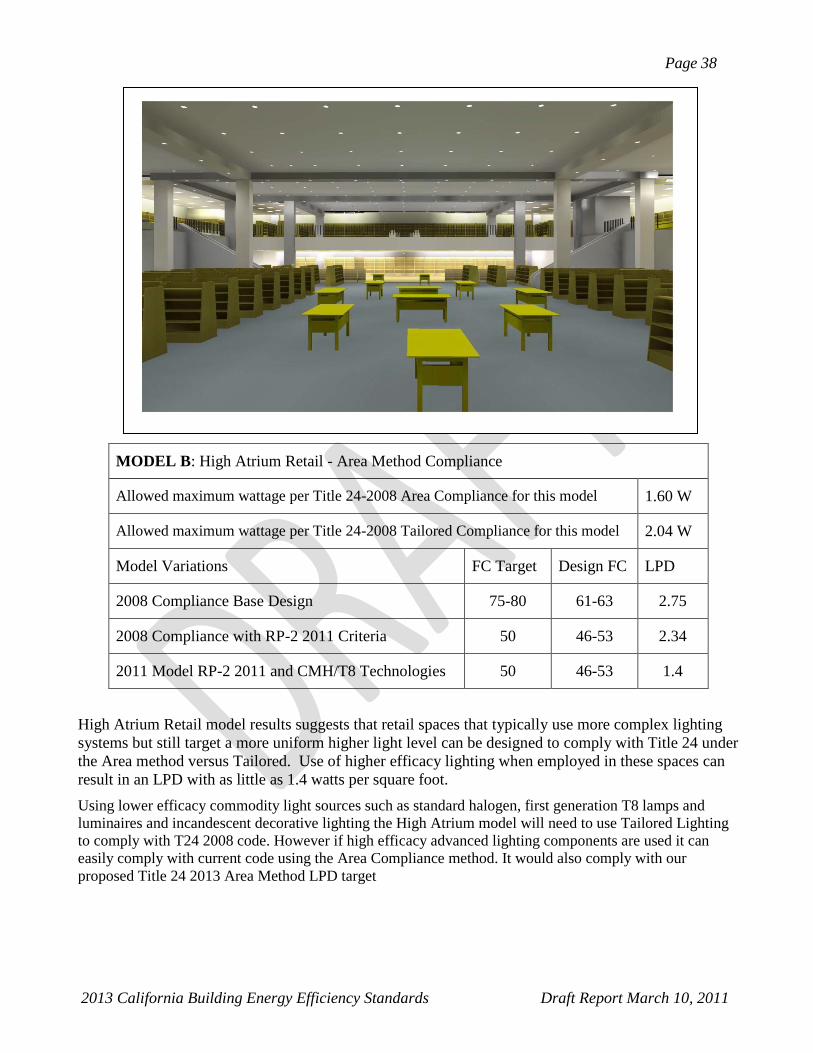
Page 38
2013 California Building Energy Efficiency Standards Draft Report March 10, 2011
MODEL B: High Atrium Retail - Area Method Compliance
Allowed maximum wattage per Title 24-2008 Area Compliance for this model 1.60 W
Allowed maximum wattage per Title 24-2008 Tailored Compliance for this model 2.04 W
Model Variations FC Target Design FC LPD
2008 Compliance Base Design 75-80 61-63 2.75
2008 Compliance with RP-2 2011 Criteria 50 46-53 2.34
2011 Model RP-2 2011 and CMH/T8 Technologies 50 46-53 1.4
High Atrium Retail model results suggests that retail spaces that typically use more complex lighting
systems but still target a more uniform higher light level can be designed to comply with Title 24 under
the Area method versus Tailored. Use of higher efficacy lighting when employed in these spaces can
result in an LPD with as little as 1.4 watts per square foot.
Using lower efficacy commodity light sources such as standard halogen, first generation T8 lamps and
luminaires and incandescent decorative lighting the High Atrium model will need to use Tailored Lighting
to comply with T24 2008 code. However if high efficacy advanced lighting components are used it can
easily comply with current code using the Area Compliance method. It would also comply with our
proposed Title 24 2013 Area Method LPD target
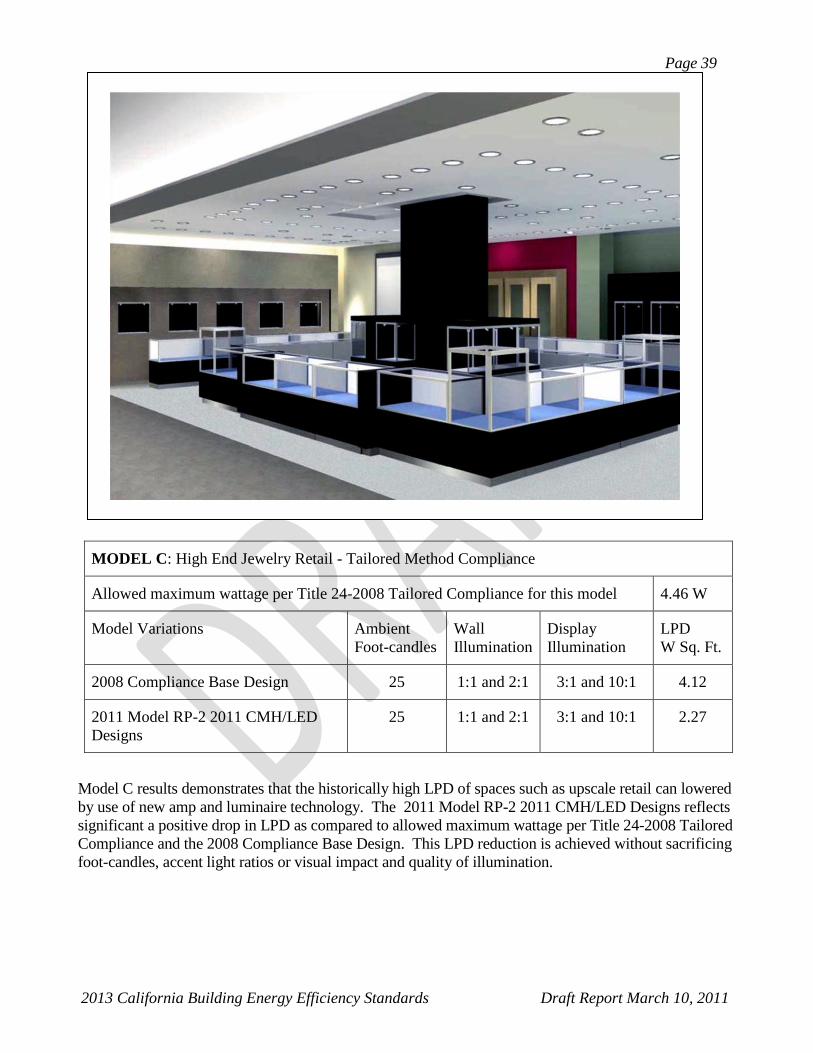
Page 39
2013 California Building Energy Efficiency Standards Draft Report March 10, 2011
MODEL C: High End Jewelry Retail - Tailored Method Compliance
Allowed maximum wattage per Title 24-2008 Tailored Compliance for this model 4.46 W
Model Variations Ambient
Foot-candles
Wall
Illumination
Display
Illumination
LPD
W Sq. Ft.
2008 Compliance Base Design 25 1:1 and 2:1 3:1 and 10:1 4.12
2011 Model RP-2 2011 CMH/LED
Designs
25 1:1 and 2:1 3:1 and 10:1 2.27
Model C results demonstrates that the historically high LPD of spaces such as upscale retail can lowered
by use of new amp and luminaire technology. The 2011 Model RP-2 2011 CMH/LED Designs reflects
significant a positive drop in LPD as compared to allowed maximum wattage per Title 24-2008 Tailored
Compliance and the 2008 Compliance Base Design. This LPD reduction is achieved without sacrificing
foot-candles, accent light ratios or visual impact and quality of illumination.
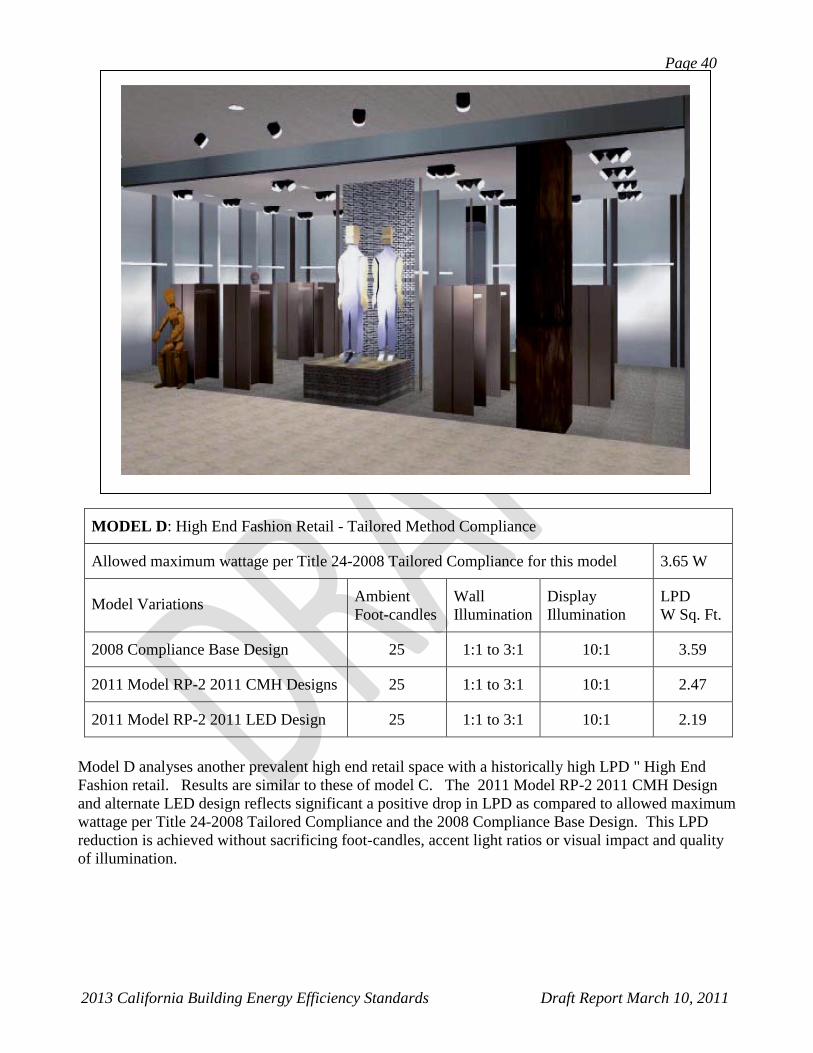
Page 40
2013 California Building Energy Efficiency Standards Draft Report March 10, 2011
MODEL D: High End Fashion Retail - Tailored Method Compliance
Allowed maximum wattage per Title 24-2008 Tailored Compliance for this model 3.65 W
Model Variations Ambient
Foot-candles
Wall
Illumination
Display
Illumination
LPD
W Sq. Ft.
2008 Compliance Base Design 25 1:1 to 3:1 10:1 3.59
2011 Model RP-2 2011 CMH Designs 25 1:1 to 3:1 10:1 2.47
2011 Model RP-2 2011 LED Design 25 1:1 to 3:1 10:1 2.19
Model D analyses another prevalent high end retail space with a historically high LPD " High End
Fashion retail. Results are similar to these of model C. The 2011 Model RP-2 2011 CMH Design
and alternate LED design reflects significant a positive drop in LPD as compared to allowed maximum
wattage per Title 24-2008 Tailored Compliance and the 2008 Compliance Base Design. This LPD
reduction is achieved without sacrificing foot-candles, accent light ratios or visual impact and quality
of illumination.
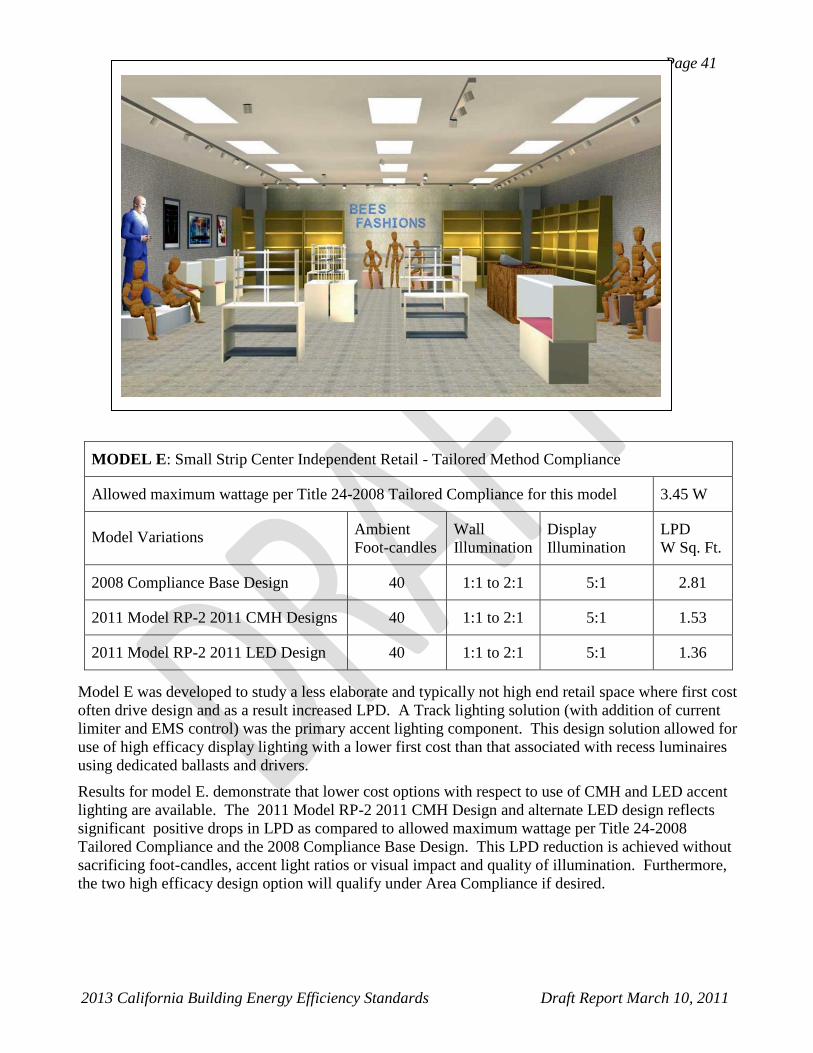
Page 41
2013 California Building Energy Efficiency Standards Draft Report March 10, 2011
MODEL E: Small Strip Center Independent Retail - Tailored Method Compliance
Allowed maximum wattage per Title 24-2008 Tailored Compliance for this model 3.45 W
Model Variations Ambient
Foot-candles
Wall
Illumination
Display
Illumination
LPD
W Sq. Ft.
2008 Compliance Base Design 40 1:1 to 2:1 5:1 2.81
2011 Model RP-2 2011 CMH Designs 40 1:1 to 2:1 5:1 1.53
2011 Model RP-2 2011 LED Design 40 1:1 to 2:1 5:1 1.36
Model E was developed to study a less elaborate and typically not high end retail space where first cost
often drive design and as a result increased LPD. A Track lighting solution (with addition of current
limiter and EMS control) was the primary accent lighting component. This design solution allowed for
use of high efficacy display lighting with a lower first cost than that associated with recess luminaires
using dedicated ballasts and drivers.
Results for model E. demonstrate that lower cost options with respect to use of CMH and LED accent
lighting are available. The 2011 Model RP-2 2011 CMH Design and alternate LED design reflects
significant positive drops in LPD as compared to allowed maximum wattage per Title 24-2008
Tailored Compliance and the 2008 Compliance Base Design. This LPD reduction is achieved without
sacrificing foot-candles, accent light ratios or visual impact and quality of illumination. Furthermore,
the two high efficacy design option will qualify under Area Compliance if desired.
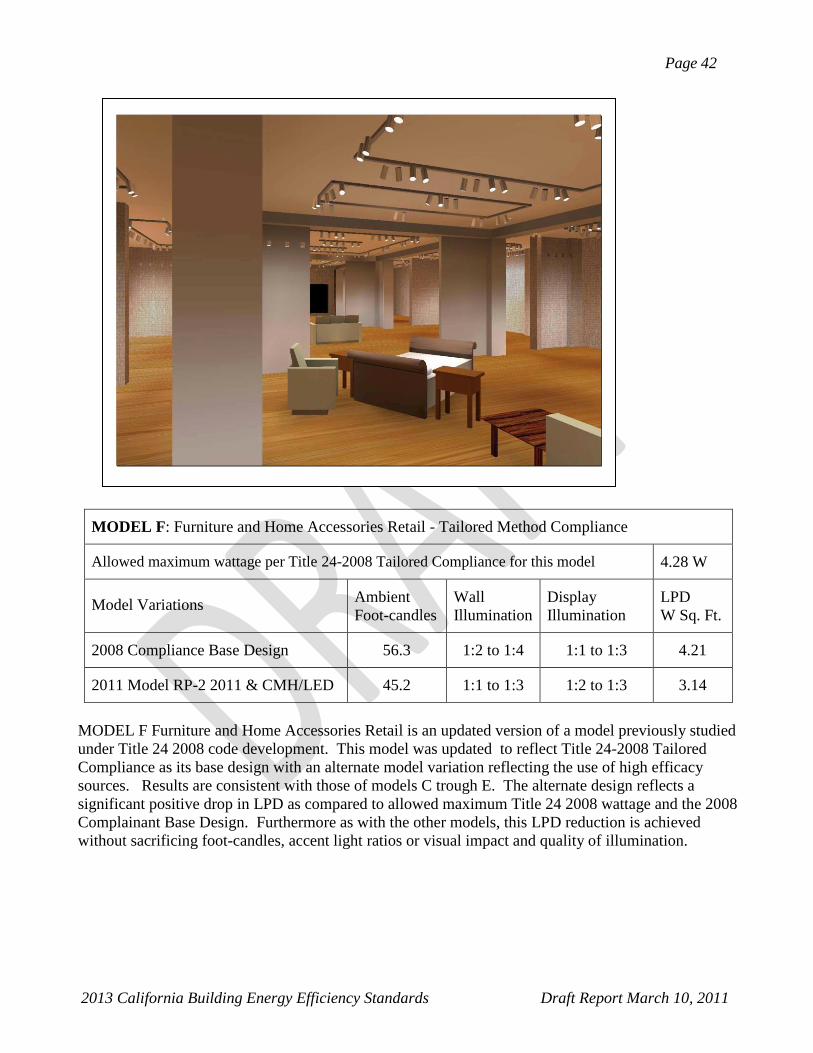
Page 42
2013 California Building Energy Efficiency Standards Draft Report March 10, 2011
MODEL F: Furniture and Home Accessories Retail - Tailored Method Compliance
Allowed maximum wattage per Title 24-2008 Tailored Compliance for this model 4.28 W
Model Variations Ambient
Foot-candles
Wall
Illumination
Display
Illumination
LPD
W Sq. Ft.
2008 Compliance Base Design 56.3 1:2 to 1:4 1:1 to 1:3 4.21
2011 Model RP-2 2011 & CMH/LED 45.2 1:1 to 1:3 1:2 to 1:3 3.14
MODEL F Furniture and Home Accessories Retail is an updated version of a model previously studied
under Title 24 2008 code development. This model was updated to reflect Title 24-2008 Tailored
Compliance as its base design with an alternate model variation reflecting the use of high efficacy
sources. Results are consistent with those of models C trough E. The alternate design reflects a
significant positive drop in LPD as compared to allowed maximum Title 24 2008 wattage and the 2008
Complainant Base Design. Furthermore as with the other models, this LPD reduction is achieved
without sacrificing foot-candles, accent light ratios or visual impact and quality of illumination.
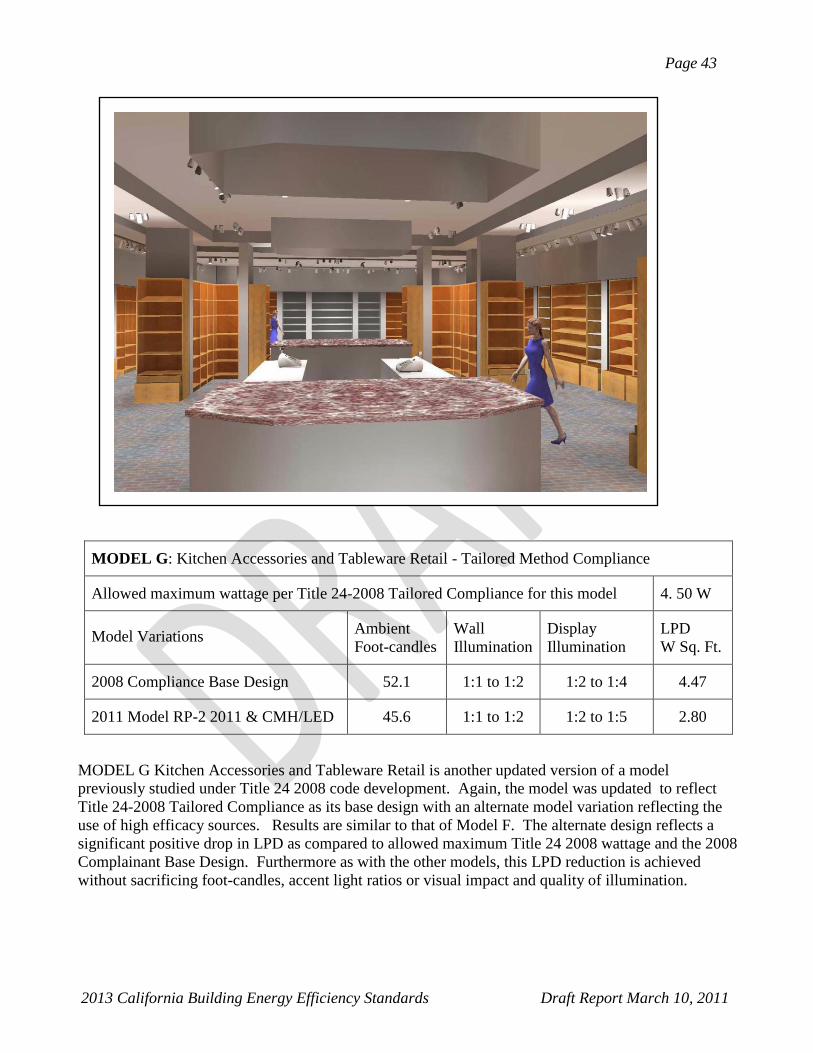
Page 43
2013 California Building Energy Efficiency Standards Draft Report March 10, 2011
MODEL G: Kitchen Accessories and Tableware Retail - Tailored Method Compliance
Allowed maximum wattage per Title 24-2008 Tailored Compliance for this model 4. 50 W
Model Variations Ambient
Foot-candles
Wall
Illumination
Display
Illumination
LPD
W Sq. Ft.
2008 Compliance Base Design 52.1 1:1 to 1:2 1:2 to 1:4 4.47
2011 Model RP-2 2011 & CMH/LED 45.6 1:1 to 1:2 1:2 to 1:5 2.80
MODEL G Kitchen Accessories and Tableware Retail is another updated version of a model
previously studied under Title 24 2008 code development. Again, the model was updated to reflect
Title 24-2008 Tailored Compliance as its base design with an alternate model variation reflecting the
use of high efficacy sources. Results are similar to that of Model F. The alternate design reflects a
significant positive drop in LPD as compared to allowed maximum Title 24 2008 wattage and the 2008
Complainant Base Design. Furthermore as with the other models, this LPD reduction is achieved
without sacrificing foot-candles, accent light ratios or visual impact and quality of illumination.
Page 44
2013 California Building Energy Efficiency Standards Draft Report March 10, 2011
4.5 New Technology Lighting Models
Models H, I, J and K document the results of studies that were undertaken to look at the improved
efficiency and performance of CMH lamps and LED lamps to provide wall and floor accent lighting in
retail environments. This was explored by use of the technology models. The effects of mounting heights
on accent and display lighting using Halogen IR versus Ceramic Metal Halide and Light Page 26
2013 California Building Energy Efficiency Standards Draft Report February 2011 Emitting Diode accent
lights were also explored by use of these same models and represented by model J. We wanted to determine
limitations, if any, of CMH and LED lamps to provide a balanced design alternate to Halogen.
LPD improvements for each model when “new luminaire technology” was used reflected significant
positive drops in LPD as compared to the “under Title 24-2008” lighting. While achieving these
reductions we did not sacrifice foot-candles accent light ratios or visual impact and quality of
illumination.
Other models, also part of this new technology evaluation, explore opportunities to reduce LPDs of
ornamental, special effects and decorative lighting by use of higher efficacy light sources. These models
identified as Models L, M, N, and O. Current Title 24 allowed LPDs for these lighting classifications were
carried over from Title 24 2005 and in some instances date back to the 2001 Title 24 compliance standards.
The allowed LPD was based primarily on incandescent for decorative lighting and cold cathode or standard
fluorescent for much of the special effects lighting. The new models presented use Halogen incandescent,
CFL, LED CMH, and advanced T8 & T5 fluorescent. The LPD improvements for each model when “new
luminaire and/or lamp technology” was used reflected significant positive drops in LPD as compared to the
base line technologies more commonly associated with the typical design application. While achieving
these reductions we did not sacrifice visual impact and quality of illumination. Details of analysis and
results for models K, L, M, N, and O can be found in 3.8 - Results of Ornamental Lighting Evaluation for
Title 24 2013 located further on within this results section of our proposal.
Cost effectiveness results for the lighting components used in models H, I and J as well as those for
models K, L, M, N, and O are found in 4.2 “Life Cycle Cost Analysis” within this Results section of the
case study.
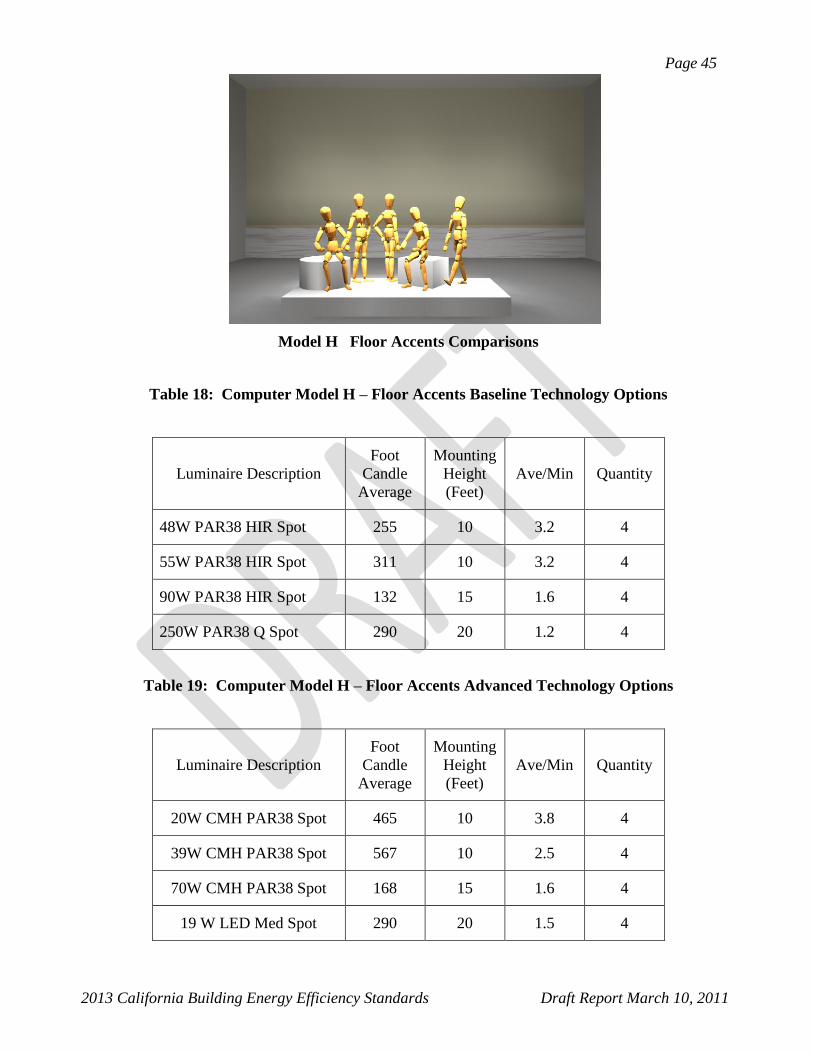
Page 45
2013 California Building Energy Efficiency Standards Draft Report March 10, 2011
Model H Floor Accents Comparisons
Table 18: Computer Model H – Floor Accents Baseline Technology Options
Luminaire Description
Foot
Candle
Average
Mounting
Height
(Feet)
Ave/Min Quantity
48W PAR38 HIR Spot 255 10 3.2 4
55W PAR38 HIR Spot 311 10 3.2 4
90W PAR38 HIR Spot 132 15 1.6 4
250W PAR38 Q Spot 290 20 1.2 4
Table 19: Computer Model H – Floor Accents Advanced Technology Options
Luminaire Description
Foot
Candle
Average
Mounting
Height
(Feet)
Ave/Min Quantity
20W CMH PAR38 Spot 465 10 3.8 4
39W CMH PAR38 Spot 567 10 2.5 4
70W CMH PAR38 Spot 168 15 1.6 4
19 W LED Med Spot 290 20 1.5 4
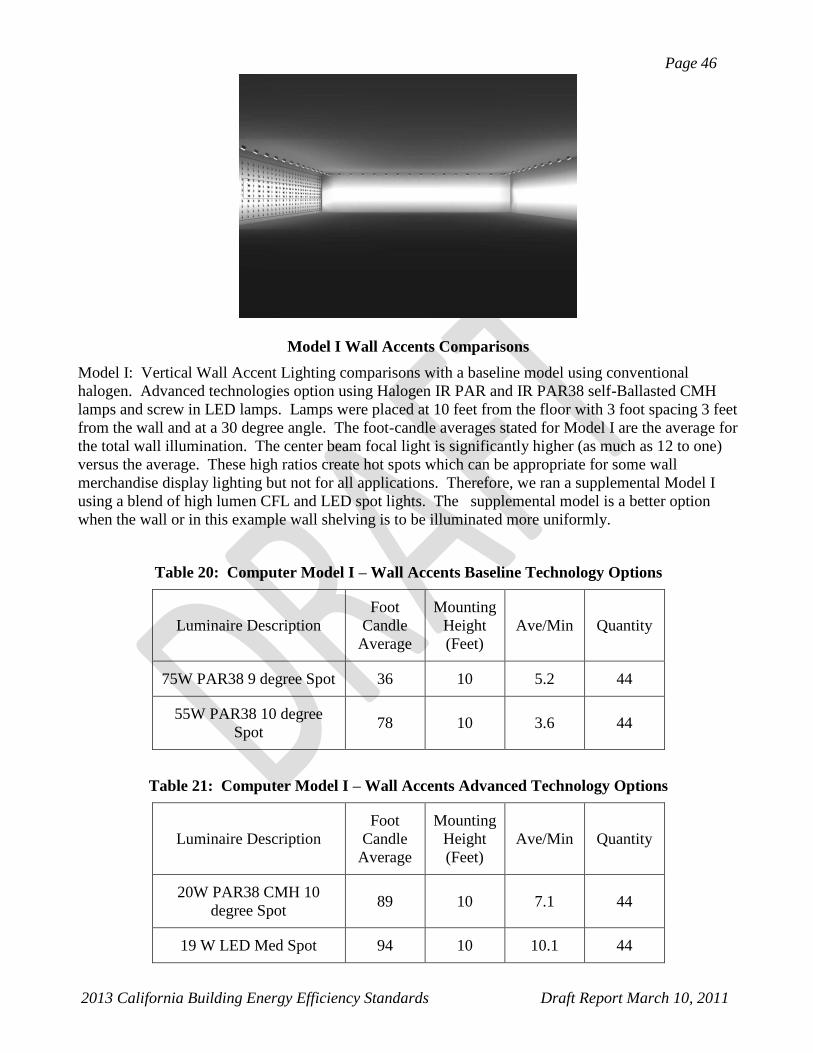
Page 46
2013 California Building Energy Efficiency Standards Draft Report March 10, 2011
Model I Wall Accents Comparisons
Model I: Vertical Wall Accent Lighting comparisons with a baseline model using conventional
halogen. Advanced technologies option using Halogen IR PAR and IR PAR38 self-Ballasted CMH
lamps and screw in LED lamps. Lamps were placed at 10 feet from the floor with 3 foot spacing 3 feet
from the wall and at a 30 degree angle. The foot-candle averages stated for Model I are the average for
the total wall illumination. The center beam focal light is significantly higher (as much as 12 to one)
versus the average. These high ratios create hot spots which can be appropriate for some wall
merchandise display lighting but not for all applications. Therefore, we ran a supplemental Model I
using a blend of high lumen CFL and LED spot lights. The supplemental model is a better option
when the wall or in this example wall shelving is to be illuminated more uniformly.
Table 20: Computer Model I – Wall Accents Baseline Technology Options
Luminaire Description
Foot
Candle
Average
Mounting
Height
(Feet)
Ave/Min Quantity
75W PAR38 9 degree Spot 36 10 5.2 44
55W PAR38 10 degree
Spot 78 10 3.6 44
Table 21: Computer Model I – Wall Accents Advanced Technology Options
Luminaire Description
Foot
Candle
Average
Mounting
Height
(Feet)
Ave/Min Quantity
20W PAR38 CMH 10
degree Spot 89 10 7.1 44
19 W LED Med Spot 94 10 10.1 44
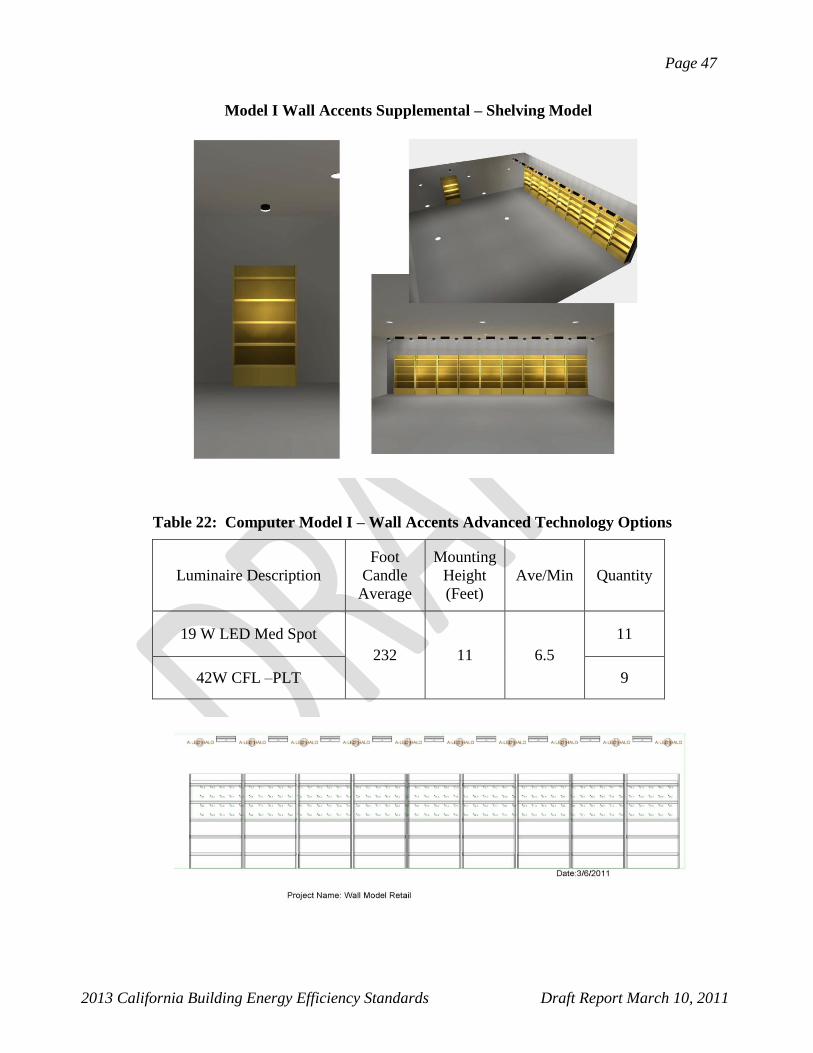
Page 47
2013 California Building Energy Efficiency Standards Draft Report March 10, 2011
Model I Wall Accents Supplemental – Shelving Model
Table 22: Computer Model I – Wall Accents Advanced Technology Options
Luminaire Description
Foot
Candle
Average
Mounting
Height
(Feet)
Ave/Min Quantity
19 W LED Med Spot
232
11
6.5
11
42W CFL –PLT 9
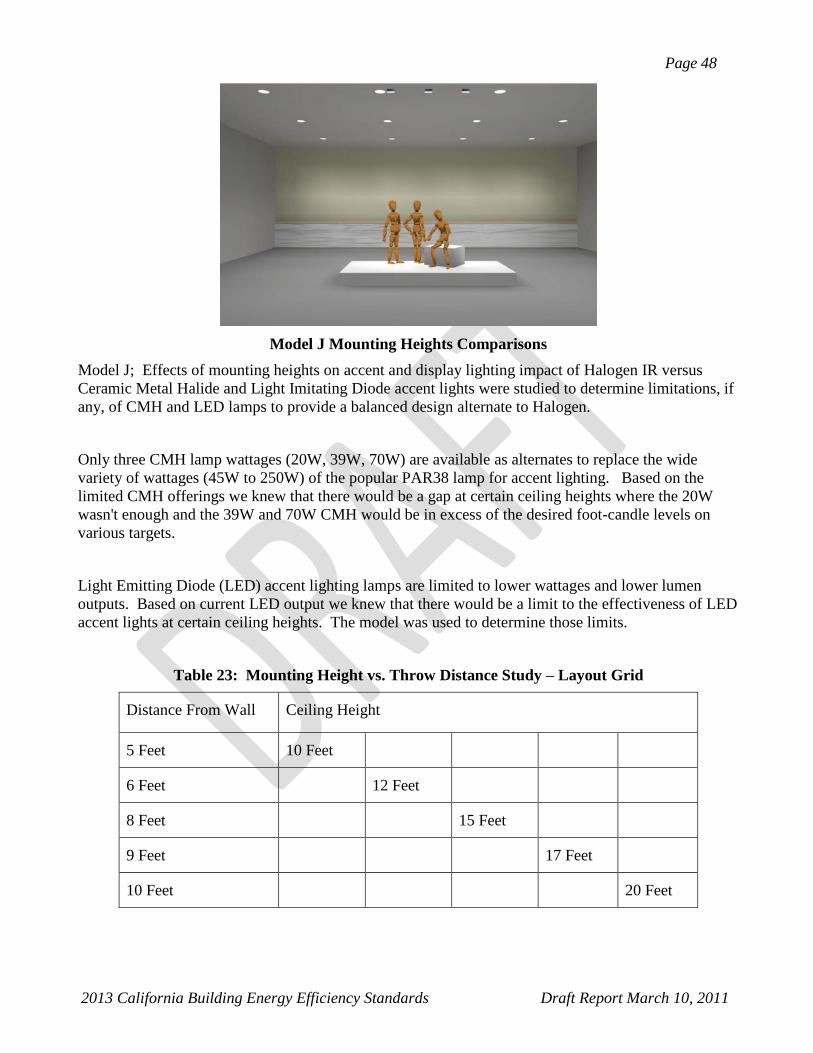
Page 48
2013 California Building Energy Efficiency Standards Draft Report March 10, 2011
Model J Mounting Heights Comparisons
Model J; Effects of mounting heights on accent and display lighting impact of Halogen IR versus
Ceramic Metal Halide and Light Imitating Diode accent lights were studied to determine limitations, if
any, of CMH and LED lamps to provide a balanced design alternate to Halogen.
Only three CMH lamp wattages (20W, 39W, 70W) are available as alternates to replace the wide
variety of wattages (45W to 250W) of the popular PAR38 lamp for accent lighting. Based on the
limited CMH offerings we knew that there would be a gap at certain ceiling heights where the 20W
wasn't enough and the 39W and 70W CMH would be in excess of the desired foot-candle levels on
various targets.
Light Emitting Diode (LED) accent lighting lamps are limited to lower wattages and lower lumen
outputs. Based on current LED output we knew that there would be a limit to the effectiveness of LED
accent lights at certain ceiling heights. The model was used to determine those limits.
Table 23: Mounting Height vs. Throw Distance Study – Layout Grid
Distance From Wall Ceiling Height
5 Feet 10 Feet
6 Feet 12 Feet
8 Feet 15 Feet
9 Feet 17 Feet
10 Feet 20 Feet
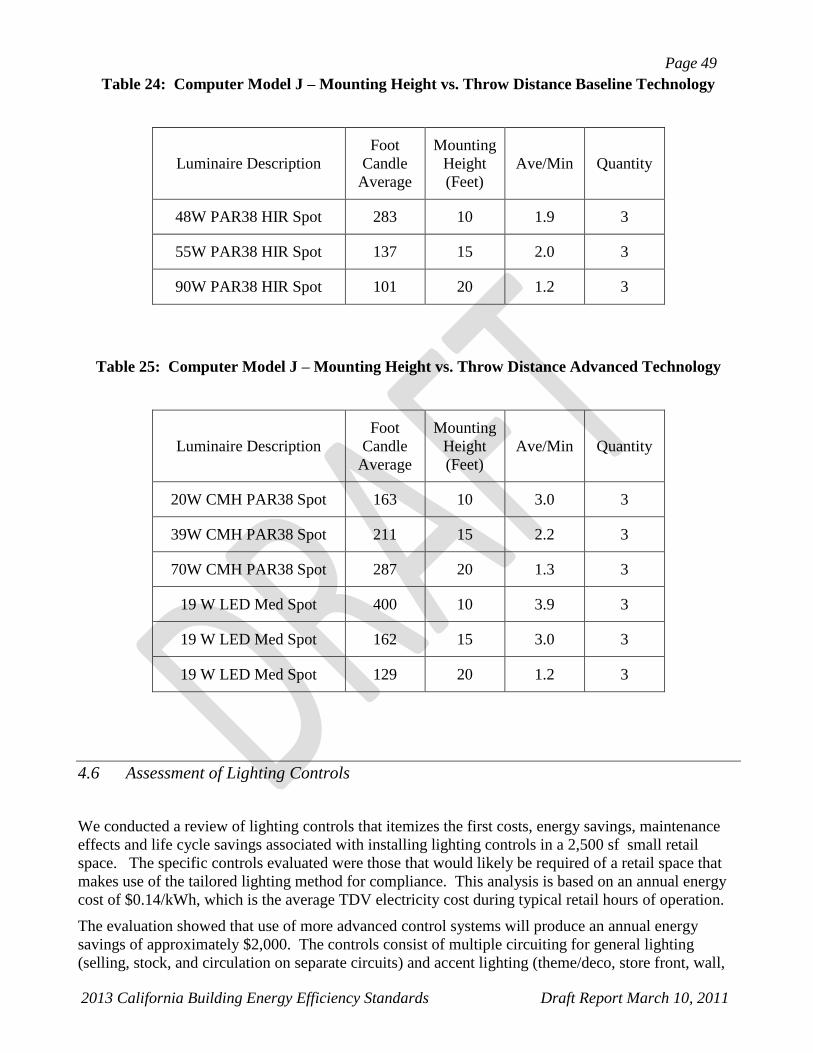
Page 49
2013 California Building Energy Efficiency Standards Draft Report March 10, 2011
Table 24: Computer Model J – Mounting Height vs. Throw Distance Baseline Technology
Luminaire Description
Foot
Candle
Average
Mounting
Height
(Feet)
Ave/Min Quantity
48W PAR38 HIR Spot 283 10 1.9 3
55W PAR38 HIR Spot 137 15 2.0 3
90W PAR38 HIR Spot 101 20 1.2 3
Table 25: Computer Model J – Mounting Height vs. Throw Distance Advanced Technology
Luminaire Description
Foot
Candle
Average
Mounting
Height
(Feet)
Ave/Min Quantity
20W CMH PAR38 Spot 163 10 3.0 3
39W CMH PAR38 Spot 211 15 2.2 3
70W CMH PAR38 Spot 287 20 1.3 3
19 W LED Med Spot 400 10 3.9 3
19 W LED Med Spot 162 15 3.0 3
19 W LED Med Spot 129 20 1.2 3
4.6 Assessment of Lighting Controls
We conducted a review of lighting controls that itemizes the first costs, energy savings, maintenance
effects and life cycle savings associated with installing lighting controls in a 2,500 sf small retail
space. The specific controls evaluated were those that would likely be required of a retail space that
makes use of the tailored lighting method for compliance. This analysis is based on an annual energy
cost of $0.14/kWh, which is the average TDV electricity cost during typical retail hours of operation.
The evaluation showed that use of more advanced control systems will produce an annual energy
savings of approximately $2,000. The controls consist of multiple circuiting for general lighting
(selling, stock, and circulation on separate circuits) and accent lighting (theme/deco, store front, wall,
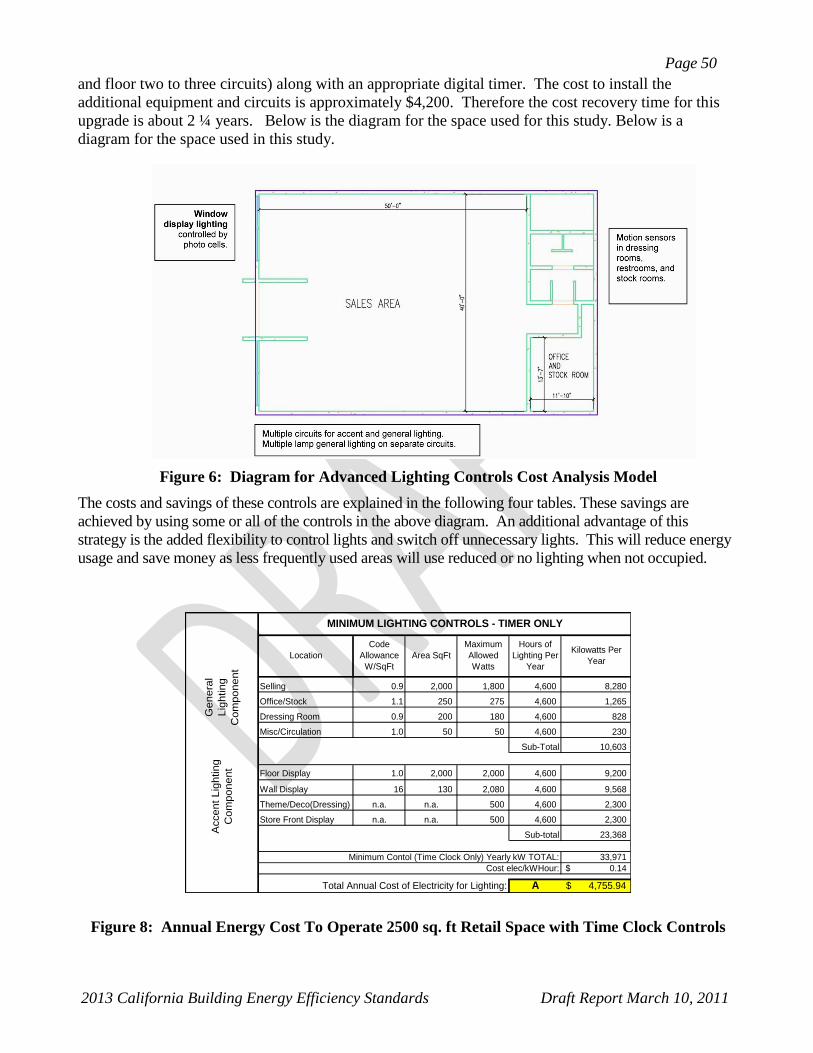
Page 50
2013 California Building Energy Efficiency Standards Draft Report March 10, 2011
and floor two to three circuits) along with an appropriate digital timer. The cost to install the
additional equipment and circuits is approximately $4,200. Therefore the cost recovery time for this
upgrade is about 2 ¼ years. Below is the diagram for the space used for this study. Below is a
diagram for the space used in this study.
Figure 6: Diagram for Advanced Lighting Controls Cost Analysis Model
The costs and savings of these controls are explained in the following four tables. These savings are
achieved by using some or all of the controls in the above diagram. An additional advantage of this
strategy is the added flexibility to control lights and switch off unnecessary lights. This will reduce energy
usage and save money as less frequently used areas will use reduced or no lighting when not occupied.
Figure 8: Annual Energy Cost To Operate 2500 sq. ft Retail Space with Time Clock Controls
Selling 0.9 2,000 1,800 4,600 8,280
Office/Stock 1.1 250 275 4,600 1,265
Dressing Room 0.9 200 180 4,600 828
Misc/Circulation 1.0 50 50 4,600 230
Sub-Total 10,603
Floor Display 1.0 2,000 2,000 4,600 9,200
Wall Display 16 130 2,080 4,600 9,568
Theme/Deco(Dressing) n.a. n.a. 500 4,600 2,300
Store Front Display n.a. n.a. 500 4,600 2,300
Sub-total 23,368
33,971
0.14$
A 4,755.94$
Acce
nt
Lig
htin
g
Co
mp
on
en
t
Area SqFt
Ge
ne
ral
Lig
htin
g
Co
mp
on
en
t
Minimum Contol (Time Clock Only) Yearly kW TOTAL:
Code
Allowance
W/SqFt
Maximum
Allowed
Watts
Hours of
Lighting Per
Year
Kilowatts Per
Year
Total Annual Cost of Electricity for Lighting:
Cost elec/kWHour:
MINIMUM LIGHTING CONTROLS - TIMER ONLY
Location
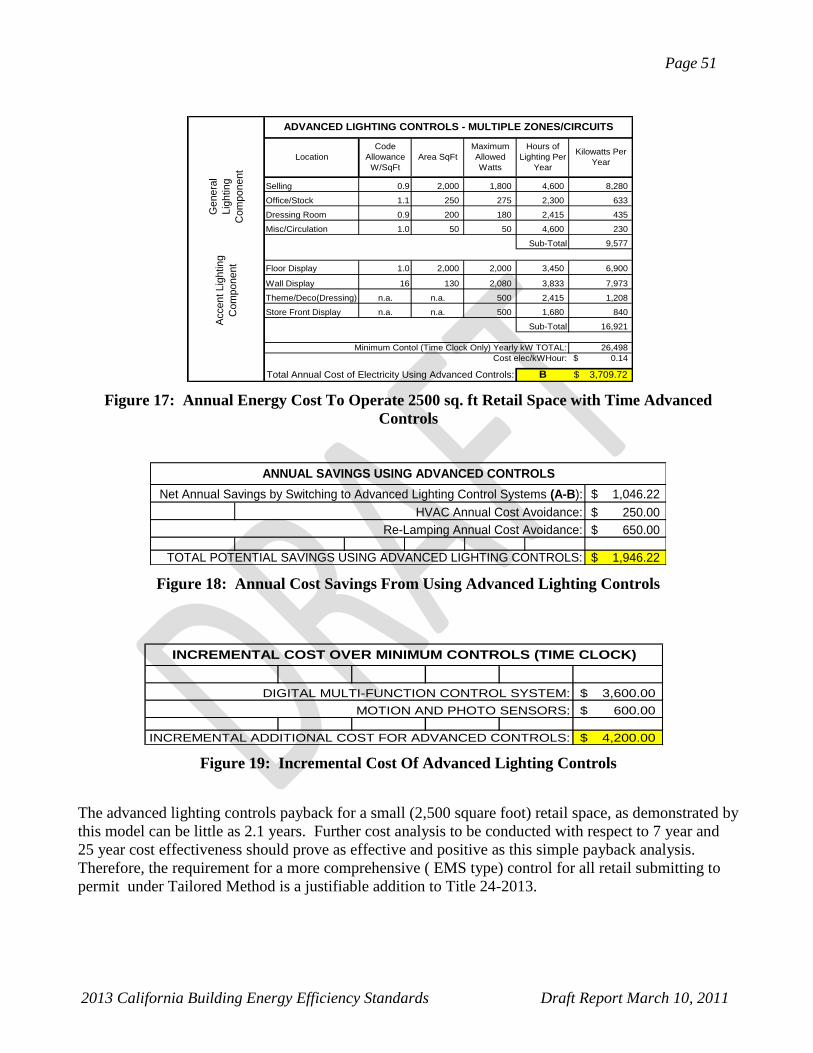
Page 51
2013 California Building Energy Efficiency Standards Draft Report March 10, 2011
Figure 17: Annual Energy Cost To Operate 2500 sq. ft Retail Space with Time Advanced
Controls
Figure 18: Annual Cost Savings From Using Advanced Lighting Controls
Figure 19: Incremental Cost Of Advanced Lighting Controls
The advanced lighting controls payback for a small (2,500 square foot) retail space, as demonstrated by
this model can be little as 2.1 years. Further cost analysis to be conducted with respect to 7 year and
25 year cost effectiveness should prove as effective and positive as this simple payback analysis.
Therefore, the requirement for a more comprehensive ( EMS type) control for all retail submitting to
permit under Tailored Method is a justifiable addition to Title 24-2013.
Selling 0.9 2,000 1,800 4,600 8,280
Office/Stock 1.1 250 275 2,300 633
Dressing Room 0.9 200 180 2,415 435
Misc/Circulation 1.0 50 50 4,600 230
Sub-Total 9,577
Floor Display 1.0 2,000 2,000 3,450 6,900
Wall Display 16 130 2,080 3,833 7,973
Theme/Deco(Dressing) n.a. n.a. 500 2,415 1,208
Store Front Display n.a. n.a. 500 1,680 840
Sub-Total 16,921
26,498
0.14$
B 3,709.72$
Location
Ge
ne
ral
Lig
htin
g
Co
mp
on
en
t
Acce
nt
Lig
htin
g
Co
mp
on
en
t
Hours of
Lighting Per
Year
Kilowatts Per
YearArea SqFt
Minimum Contol (Time Clock Only) Yearly kW TOTAL:
Code
Allowance
W/SqFt
Maximum
Allowed
Watts
Cost elec/kWHour:
Total Annual Cost of Electricity Using Advanced Controls:
ADVANCED LIGHTING CONTROLS - MULTIPLE ZONES/CIRCUITS
1,046.22$
250.00$
650.00$
1,946.22$
Re-Lamping Annual Cost Avoidance:
TOTAL POTENTIAL SAVINGS USING ADVANCED LIGHTING CONTROLS:
ANNUAL SAVINGS USING ADVANCED CONTROLS
HVAC Annual Cost Avoidance:
Net Annual Savings by Switching to Advanced Lighting Control Systems (A-B):
3,600.00$
600.00$
4,200.00$
DIGITAL MULTI-FUNCTION CONTROL SYSTEM:
MOTION AND PHOTO SENSORS:
INCREMENTAL ADDITIONAL COST FOR ADVANCED CONTROLS:
INCREMENTAL COST OVER MINIMUM CONTROLS (TIME CLOCK)
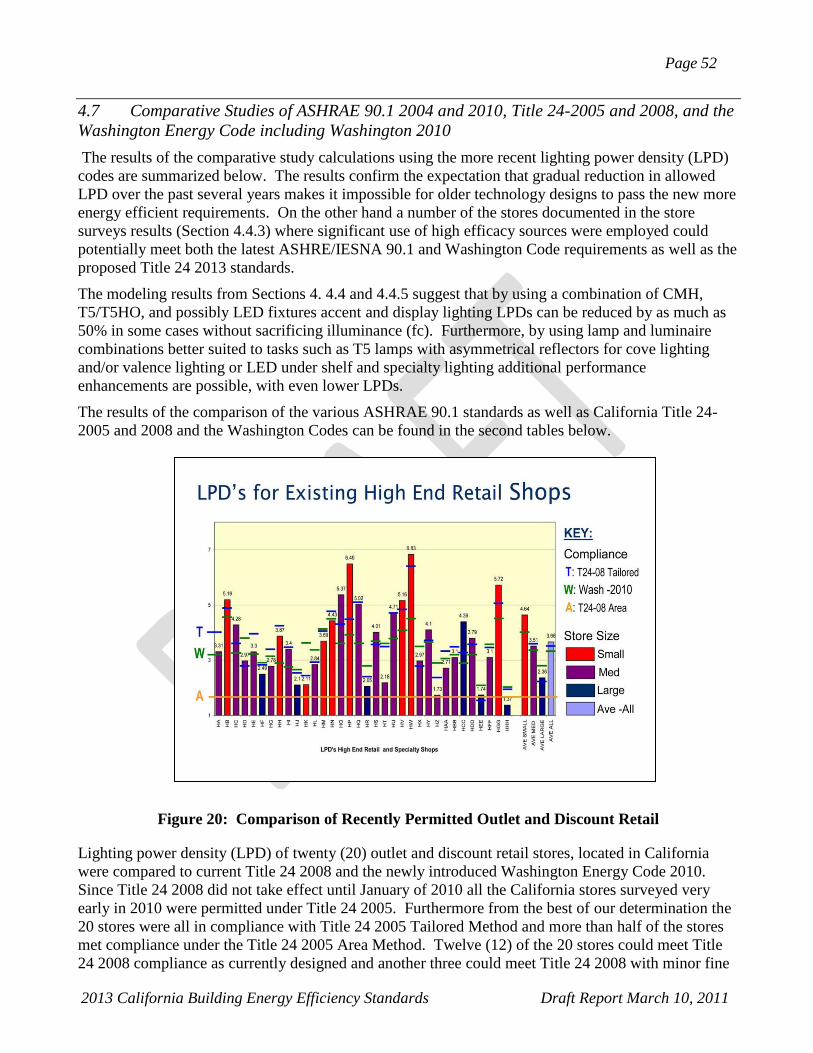
Page 52
2013 California Building Energy Efficiency Standards Draft Report March 10, 2011
4.7 Comparative Studies of ASHRAE 90.1 2004 and 2010, Title 24-2005 and 2008, and the
Washington Energy Code including Washington 2010
The results of the comparative study calculations using the more recent lighting power density (LPD)
codes are summarized below. The results confirm the expectation that gradual reduction in allowed
LPD over the past several years makes it impossible for older technology designs to pass the new more
energy efficient requirements. On the other hand a number of the stores documented in the store
surveys results (Section 4.4.3) where significant use of high efficacy sources were employed could
potentially meet both the latest ASHRE/IESNA 90.1 and Washington Code requirements as well as the
proposed Title 24 2013 standards.
The modeling results from Sections 4. 4.4 and 4.4.5 suggest that by using a combination of CMH,
T5/T5HO, and possibly LED fixtures accent and display lighting LPDs can be reduced by as much as
50% in some cases without sacrificing illuminance (fc). Furthermore, by using lamp and luminaire
combinations better suited to tasks such as T5 lamps with asymmetrical reflectors for cove lighting
and/or valence lighting or LED under shelf and specialty lighting additional performance
enhancements are possible, with even lower LPDs.
The results of the comparison of the various ASHRAE 90.1 standards as well as California Title 24-
2005 and 2008 and the Washington Codes can be found in the second tables below.
Figure 20: Comparison of Recently Permitted Outlet and Discount Retail
Lighting power density (LPD) of twenty (20) outlet and discount retail stores, located in California
were compared to current Title 24 2008 and the newly introduced Washington Energy Code 2010.
Since Title 24 2008 did not take effect until January of 2010 all the California stores surveyed very
early in 2010 were permitted under Title 24 2005. Furthermore from the best of our determination the
20 stores were all in compliance with Title 24 2005 Tailored Method and more than half of the stores
met compliance under the Title 24 2005 Area Method. Twelve (12) of the 20 stores could meet Title
24 2008 compliance as currently designed and another three could meet Title 24 2008 with minor fine
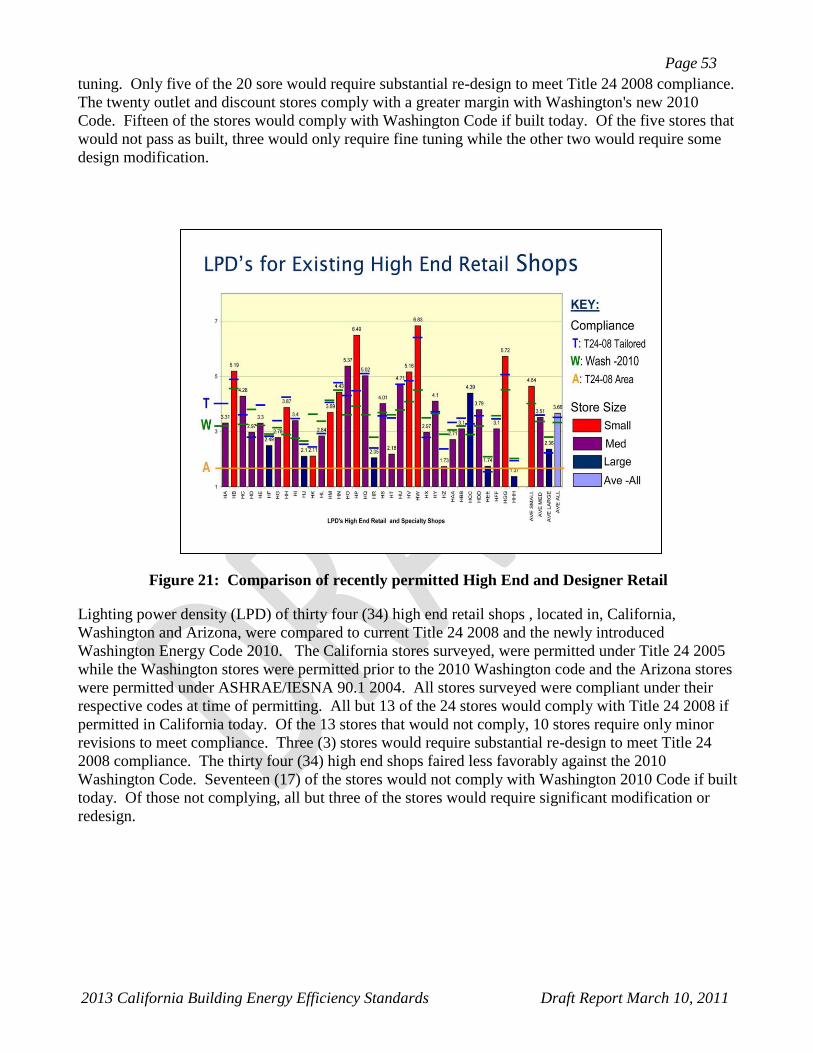
Page 53
2013 California Building Energy Efficiency Standards Draft Report March 10, 2011
tuning. Only five of the 20 sore would require substantial re-design to meet Title 24 2008 compliance.
The twenty outlet and discount stores comply with a greater margin with Washington's new 2010
Code. Fifteen of the stores would comply with Washington Code if built today. Of the five stores that
would not pass as built, three would only require fine tuning while the other two would require some
design modification.
Figure 21: Comparison of recently permitted High End and Designer Retail
Lighting power density (LPD) of thirty four (34) high end retail shops , located in, California,
Washington and Arizona, were compared to current Title 24 2008 and the newly introduced
Washington Energy Code 2010. The California stores surveyed, were permitted under Title 24 2005
while the Washington stores were permitted prior to the 2010 Washington code and the Arizona stores
were permitted under ASHRAE/IESNA 90.1 2004. All stores surveyed were compliant under their
respective codes at time of permitting. All but 13 of the 24 stores would comply with Title 24 2008 if
permitted in California today. Of the 13 stores that would not comply, 10 stores require only minor
revisions to meet compliance. Three (3) stores would require substantial re-design to meet Title 24
2008 compliance. The thirty four (34) high end shops faired less favorably against the 2010
Washington Code. Seventeen (17) of the stores would not comply with Washington 2010 Code if built
today. Of those not complying, all but three of the stores would require significant modification or
redesign.
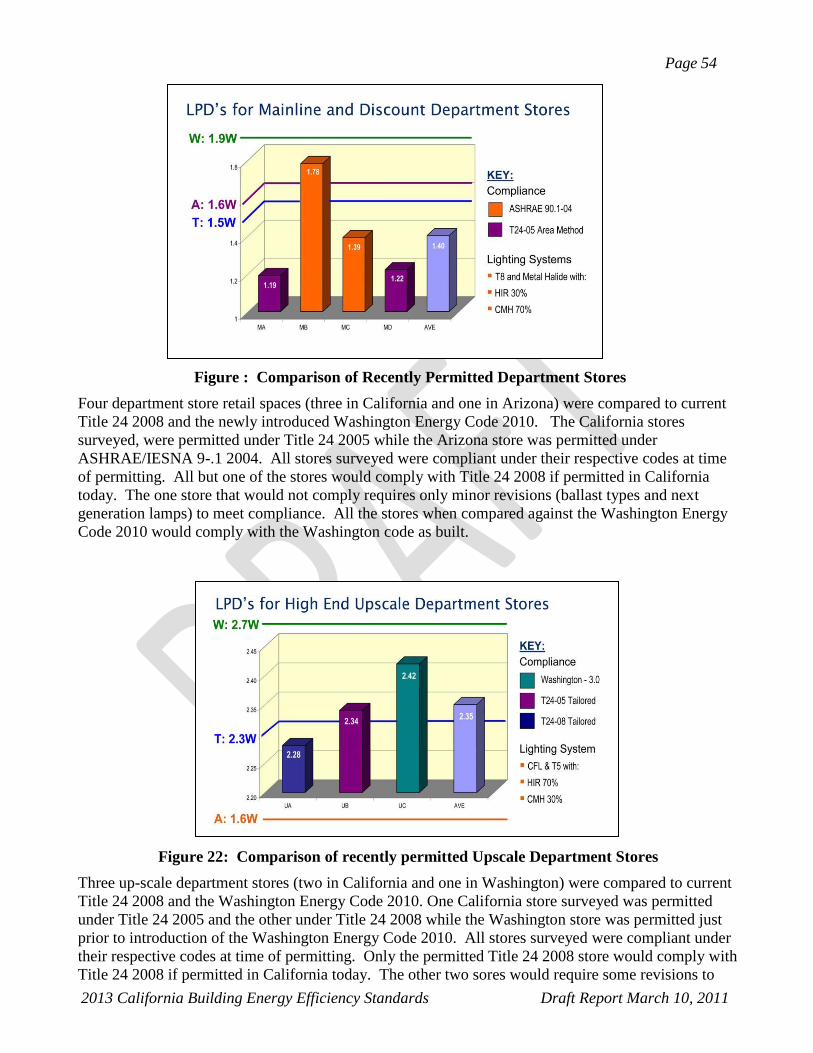
Page 54
2013 California Building Energy Efficiency Standards Draft Report March 10, 2011
Figure : Comparison of Recently Permitted Department Stores
Four department store retail spaces (three in California and one in Arizona) were compared to current
Title 24 2008 and the newly introduced Washington Energy Code 2010. The California stores
surveyed, were permitted under Title 24 2005 while the Arizona store was permitted under
ASHRAE/IESNA 9-.1 2004. All stores surveyed were compliant under their respective codes at time
of permitting. All but one of the stores would comply with Title 24 2008 if permitted in California
today. The one store that would not comply requires only minor revisions (ballast types and next
generation lamps) to meet compliance. All the stores when compared against the Washington Energy
Code 2010 would comply with the Washington code as built.
Figure 22: Comparison of recently permitted Upscale Department Stores
Three up-scale department stores (two in California and one in Washington) were compared to current
Title 24 2008 and the Washington Energy Code 2010. One California store surveyed was permitted
under Title 24 2005 and the other under Title 24 2008 while the Washington store was permitted just
prior to introduction of the Washington Energy Code 2010. All stores surveyed were compliant under
their respective codes at time of permitting. Only the permitted Title 24 2008 store would comply with
Title 24 2008 if permitted in California today. The other two sores would require some revisions to
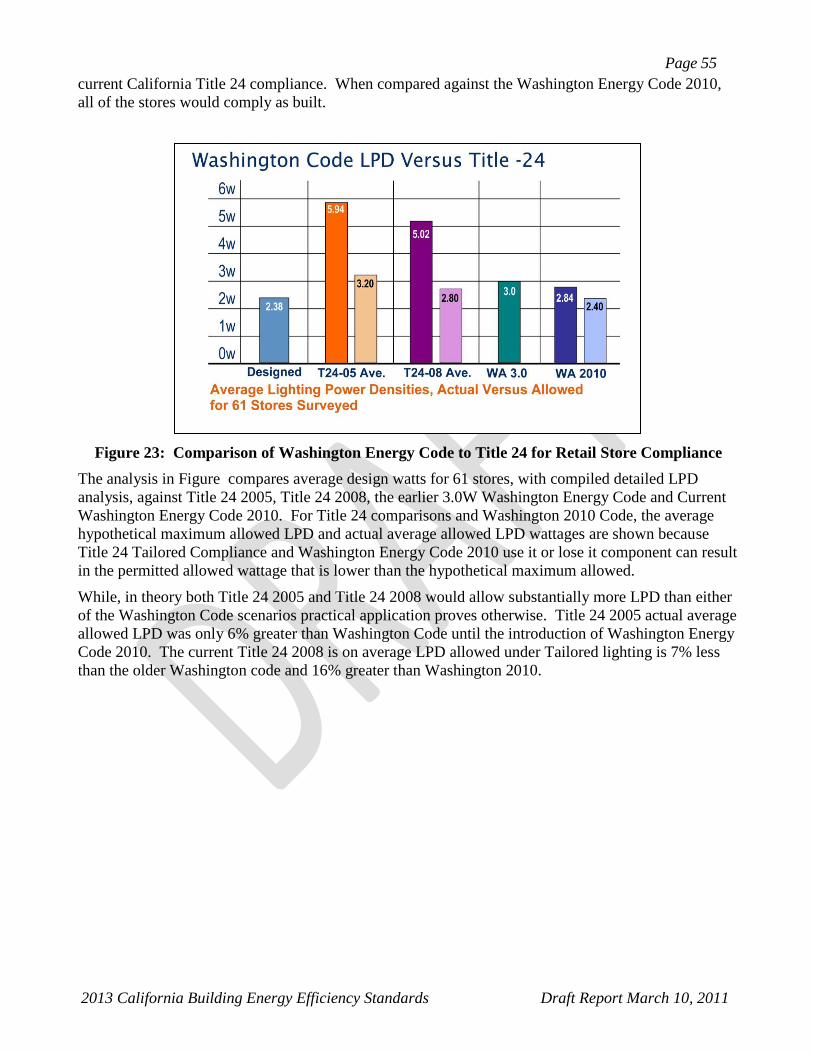
Page 55
2013 California Building Energy Efficiency Standards Draft Report March 10, 2011
current California Title 24 compliance. When compared against the Washington Energy Code 2010,
all of the stores would comply as built.
Figure 23: Comparison of Washington Energy Code to Title 24 for Retail Store Compliance
The analysis in Figure compares average design watts for 61 stores, with compiled detailed LPD
analysis, against Title 24 2005, Title 24 2008, the earlier 3.0W Washington Energy Code and Current
Washington Energy Code 2010. For Title 24 comparisons and Washington 2010 Code, the average
hypothetical maximum allowed LPD and actual average allowed LPD wattages are shown because
Title 24 Tailored Compliance and Washington Energy Code 2010 use it or lose it component can result
in the permitted allowed wattage that is lower than the hypothetical maximum allowed.
While, in theory both Title 24 2005 and Title 24 2008 would allow substantially more LPD than either
of the Washington Code scenarios practical application proves otherwise. Title 24 2005 actual average
allowed LPD was only 6% greater than Washington Code until the introduction of Washington Energy
Code 2010. The current Title 24 2008 is on average LPD allowed under Tailored lighting is 7% less
than the older Washington code and 16% greater than Washington 2010.
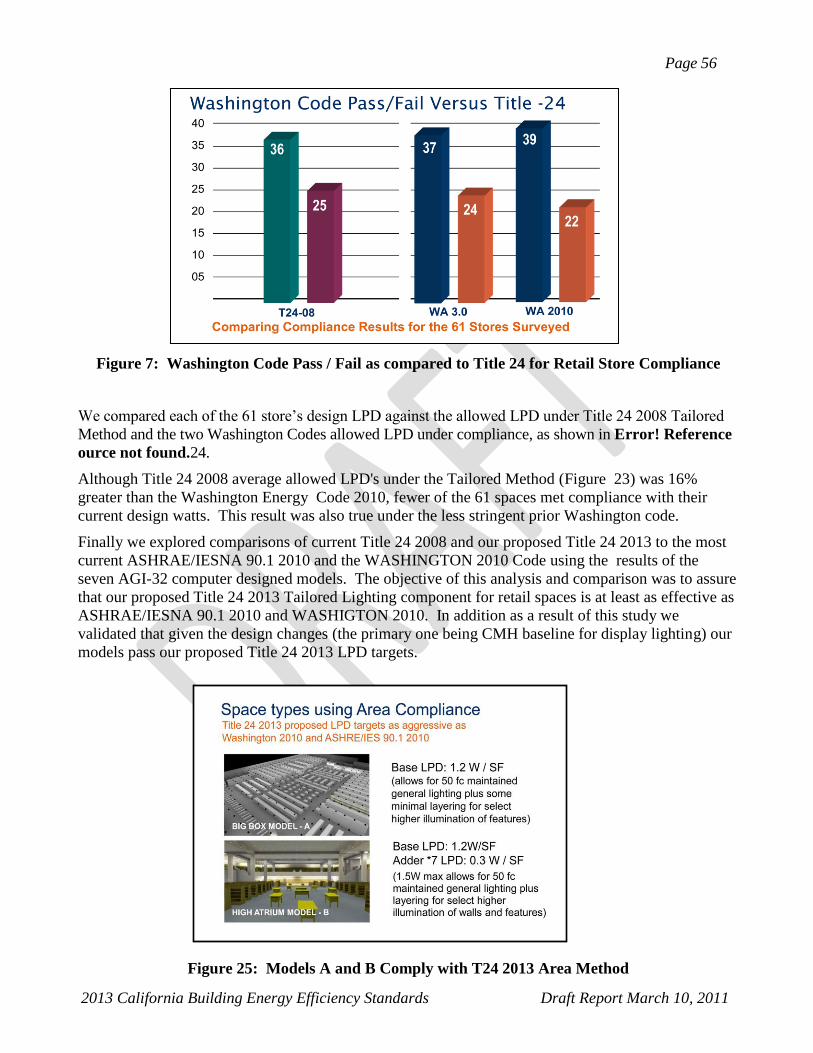
Page 56
2013 California Building Energy Efficiency Standards Draft Report March 10, 2011
Figure 7: Washington Code Pass / Fail as compared to Title 24 for Retail Store Compliance
We compared each of the 61 store‟s design LPD against the allowed LPD under Title 24 2008 Tailored
Method and the two Washington Codes allowed LPD under compliance, as shown in Error! Reference
ource not found.24.
Although Title 24 2008 average allowed LPD's under the Tailored Method (Figure 23) was 16%
greater than the Washington Energy Code 2010, fewer of the 61 spaces met compliance with their
current design watts. This result was also true under the less stringent prior Washington code.
Finally we explored comparisons of current Title 24 2008 and our proposed Title 24 2013 to the most
current ASHRAE/IESNA 90.1 2010 and the WASHINGTON 2010 Code using the results of the
seven AGI-32 computer designed models. The objective of this analysis and comparison was to assure
that our proposed Title 24 2013 Tailored Lighting component for retail spaces is at least as effective as
ASHRAE/IESNA 90.1 2010 and WASHIGTON 2010. In addition as a result of this study we
validated that given the design changes (the primary one being CMH baseline for display lighting) our
models pass our proposed Title 24 2013 LPD targets.
Figure 25: Models A and B Comply with T24 2013 Area Method
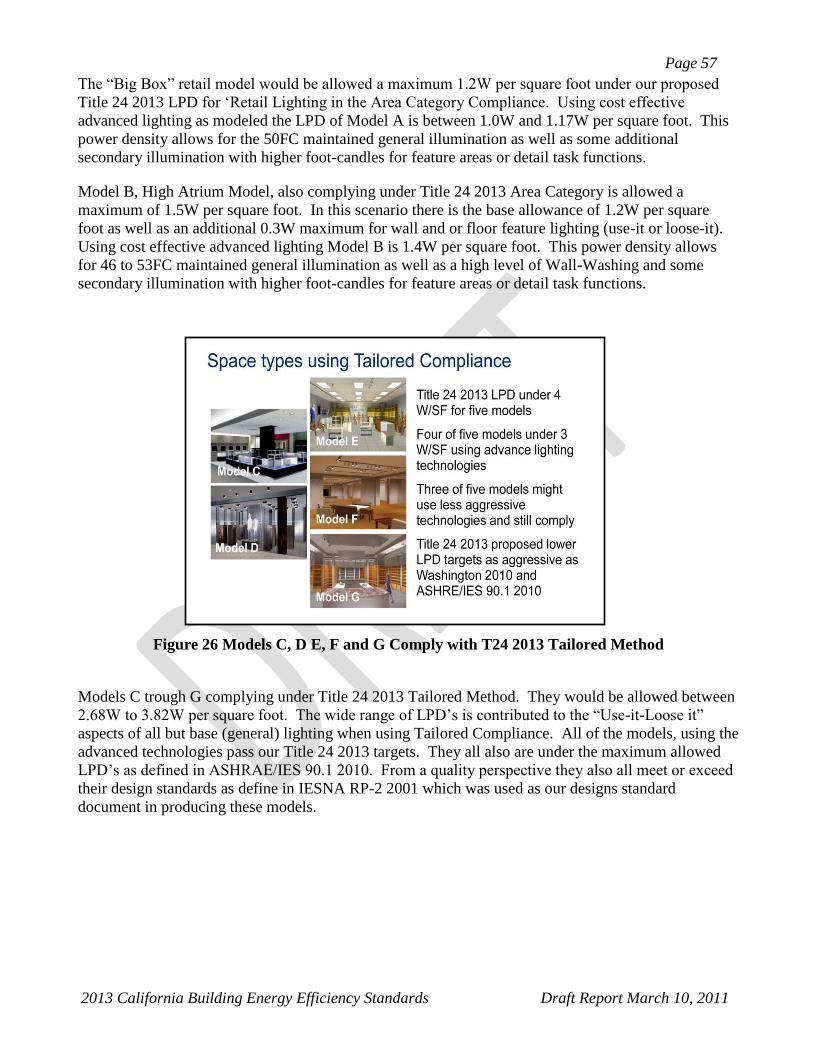
Page 57
2013 California Building Energy Efficiency Standards Draft Report March 10, 2011
The “Big Box” retail model would be allowed a maximum 1.2W per square foot under our proposed
Title 24 2013 LPD for „Retail Lighting in the Area Category Compliance. Using cost effective
advanced lighting as modeled the LPD of Model A is between 1.0W and 1.17W per square foot. This
power density allows for the 50FC maintained general illumination as well as some additional
secondary illumination with higher foot-candles for feature areas or detail task functions.
Model B, High Atrium Model, also complying under Title 24 2013 Area Category is allowed a
maximum of 1.5W per square foot. In this scenario there is the base allowance of 1.2W per square
foot as well as an additional 0.3W maximum for wall and or floor feature lighting (use-it or loose-it).
Using cost effective advanced lighting Model B is 1.4W per square foot. This power density allows
for 46 to 53FC maintained general illumination as well as a high level of Wall-Washing and some
secondary illumination with higher foot-candles for feature areas or detail task functions.
Figure 26 Models C, D E, F and G Comply with T24 2013 Tailored Method
Models C trough G complying under Title 24 2013 Tailored Method. They would be allowed between
2.68W to 3.82W per square foot. The wide range of LPD‟s is contributed to the “Use-it-Loose it”
aspects of all but base (general) lighting when using Tailored Compliance. All of the models, using the
advanced technologies pass our Title 24 2013 targets. They all also are under the maximum allowed
LPD‟s as defined in ASHRAE/IES 90.1 2010. From a quality perspective they also all meet or exceed
their design standards as define in IESNA RP-2 2001 which was used as our designs standard
document in producing these models.
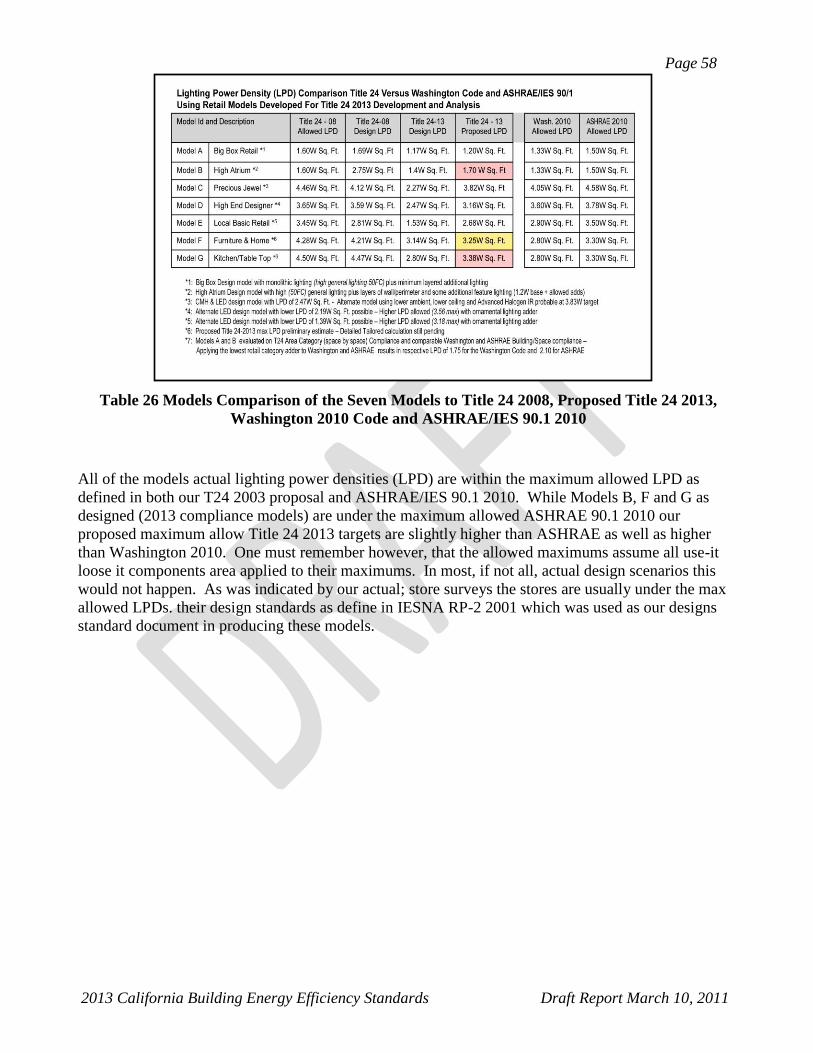
Page 58
2013 California Building Energy Efficiency Standards Draft Report March 10, 2011
Table 26 Models Comparison of the Seven Models to Title 24 2008, Proposed Title 24 2013,
Washington 2010 Code and ASHRAE/IES 90.1 2010
All of the models actual lighting power densities (LPD) are within the maximum allowed LPD as
defined in both our T24 2003 proposal and ASHRAE/IES 90.1 2010. While Models B, F and G as
designed (2013 compliance models) are under the maximum allowed ASHRAE 90.1 2010 our
proposed maximum allow Title 24 2013 targets are slightly higher than ASHRAE as well as higher
than Washington 2010. One must remember however, that the allowed maximums assume all use-it
loose it components area applied to their maximums. In most, if not all, actual design scenarios this
would not happen. As was indicated by our actual; store surveys the stores are usually under the max
allowed LPDs. their design standards as define in IESNA RP-2 2001 which was used as our designs
standard document in producing these models.
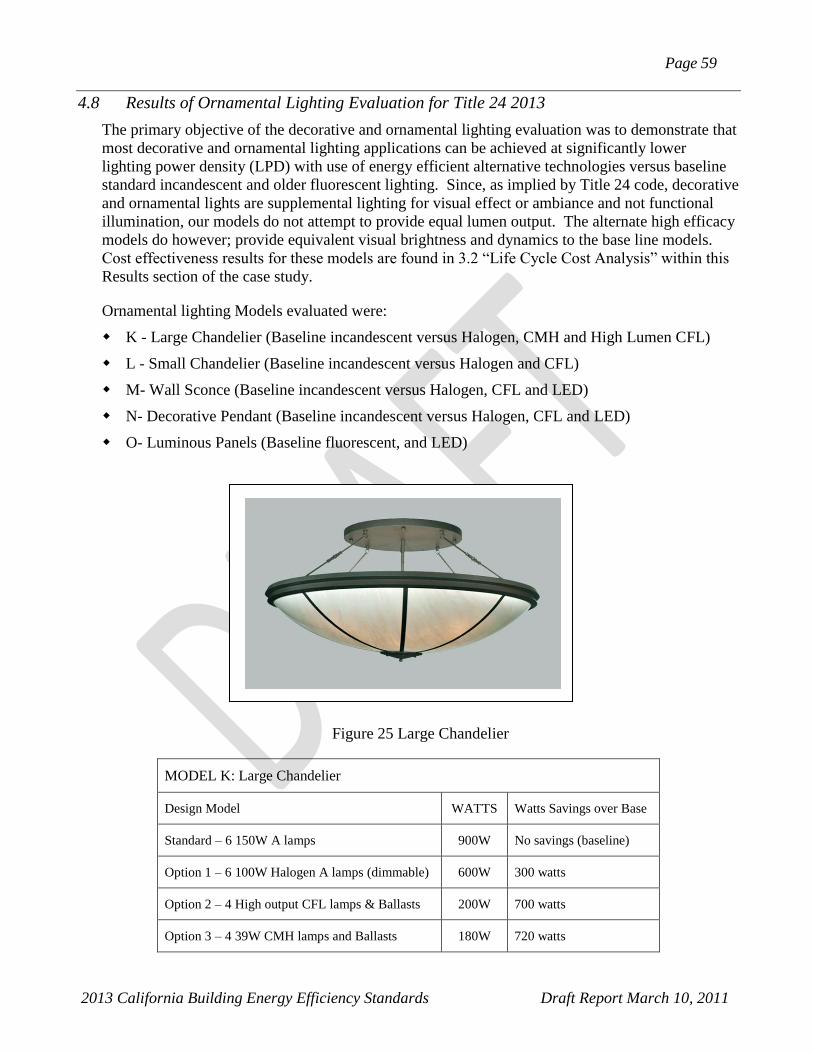
Page 59
2013 California Building Energy Efficiency Standards Draft Report March 10, 2011
4.8 Results of Ornamental Lighting Evaluation for Title 24 2013
The primary objective of the decorative and ornamental lighting evaluation was to demonstrate that
most decorative and ornamental lighting applications can be achieved at significantly lower
lighting power density (LPD) with use of energy efficient alternative technologies versus baseline
standard incandescent and older fluorescent lighting. Since, as implied by Title 24 code, decorative
and ornamental lights are supplemental lighting for visual effect or ambiance and not functional
illumination, our models do not attempt to provide equal lumen output. The alternate high efficacy
models do however; provide equivalent visual brightness and dynamics to the base line models.
Cost effectiveness results for these models are found in 3.2 “Life Cycle Cost Analysis” within this
Results section of the case study.
Ornamental lighting Models evaluated were:
K - Large Chandelier (Baseline incandescent versus Halogen, CMH and High Lumen CFL)
L - Small Chandelier (Baseline incandescent versus Halogen and CFL)
M- Wall Sconce (Baseline incandescent versus Halogen, CFL and LED)
N- Decorative Pendant (Baseline incandescent versus Halogen, CFL and LED)
O- Luminous Panels (Baseline fluorescent, and LED)
Figure 25 Large Chandelier
MODEL K: Large Chandelier
Design Model WATTS Watts Savings over Base
Standard – 6 150W A lamps 900W No savings (baseline)
Option 1 – 6 100W Halogen A lamps (dimmable) 600W 300 watts
Option 2 – 4 High output CFL lamps & Ballasts 200W 700 watts
Option 3 – 4 39W CMH lamps and Ballasts 180W 720 watts
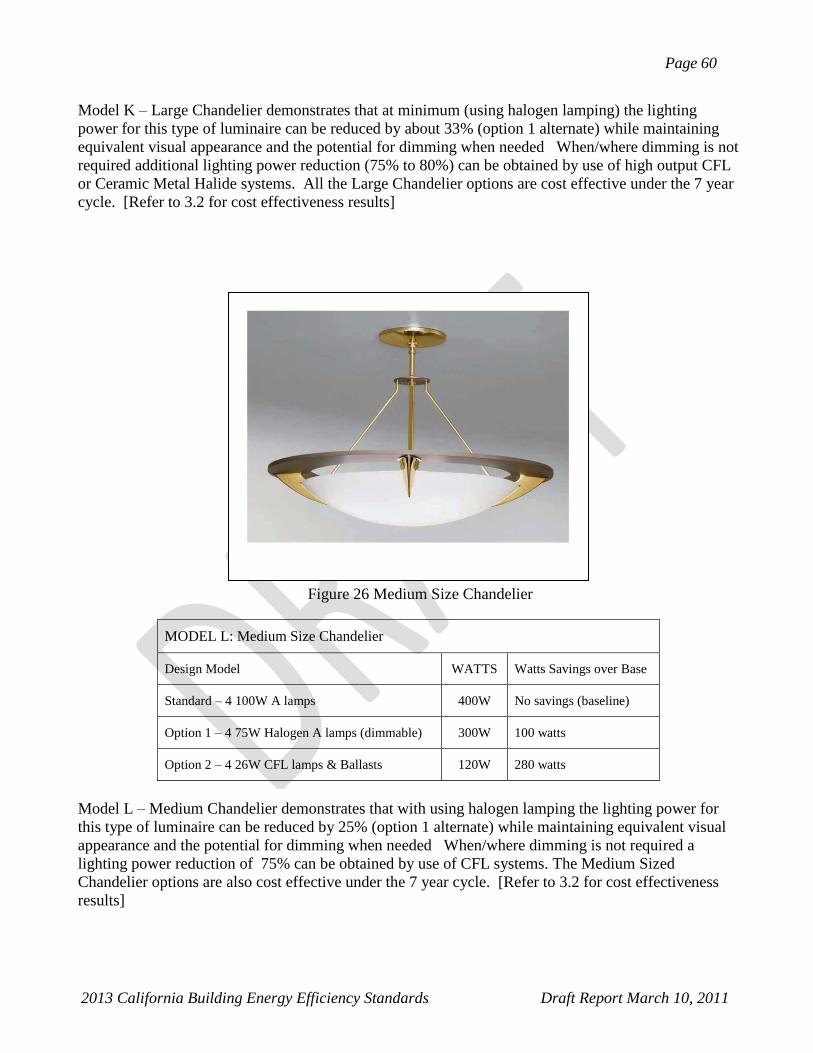
Page 60
2013 California Building Energy Efficiency Standards Draft Report March 10, 2011
Model K – Large Chandelier demonstrates that at minimum (using halogen lamping) the lighting
power for this type of luminaire can be reduced by about 33% (option 1 alternate) while maintaining
equivalent visual appearance and the potential for dimming when needed When/where dimming is not
required additional lighting power reduction (75% to 80%) can be obtained by use of high output CFL
or Ceramic Metal Halide systems. All the Large Chandelier options are cost effective under the 7 year
cycle. [Refer to 3.2 for cost effectiveness results]
Figure 26 Medium Size Chandelier
MODEL L: Medium Size Chandelier
Design Model WATTS Watts Savings over Base
Standard – 4 100W A lamps 400W No savings (baseline)
Option 1 – 4 75W Halogen A lamps (dimmable) 300W 100 watts
Option 2 – 4 26W CFL lamps & Ballasts 120W 280 watts
Model L – Medium Chandelier demonstrates that with using halogen lamping the lighting power for
this type of luminaire can be reduced by 25% (option 1 alternate) while maintaining equivalent visual
appearance and the potential for dimming when needed When/where dimming is not required a
lighting power reduction of 75% can be obtained by use of CFL systems. The Medium Sized
Chandelier options are also cost effective under the 7 year cycle. [Refer to 3.2 for cost effectiveness
results]
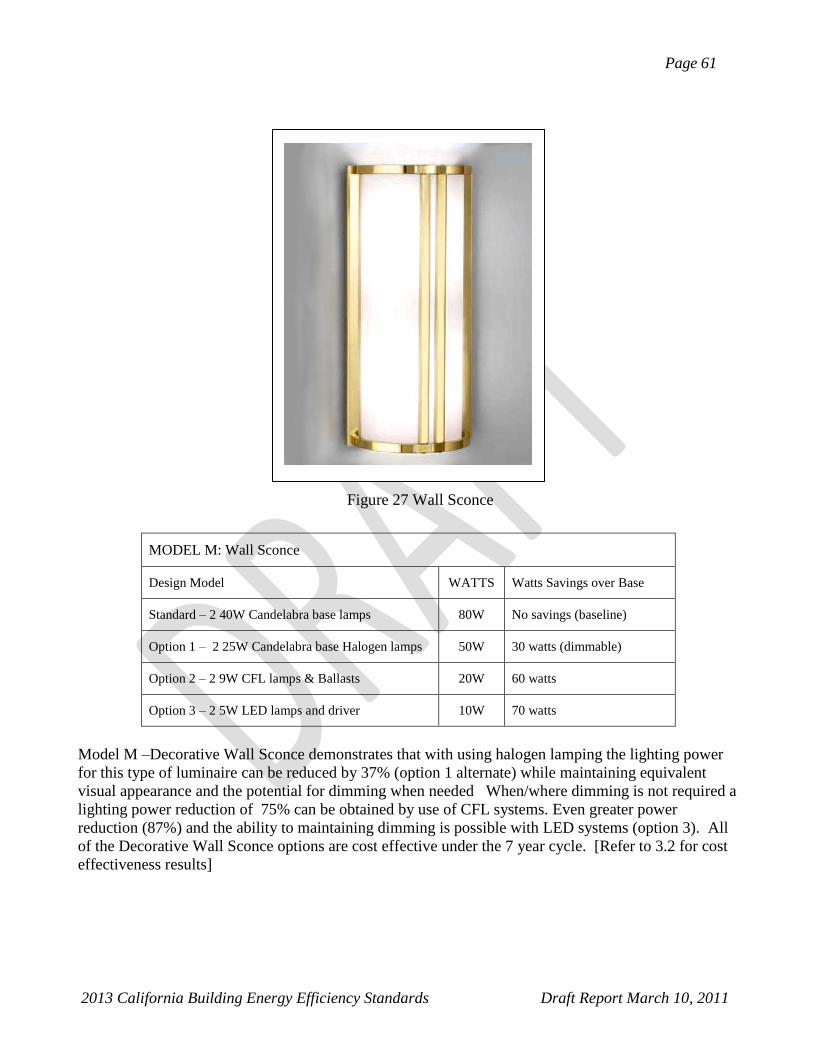
Page 61
2013 California Building Energy Efficiency Standards Draft Report March 10, 2011
Figure 27 Wall Sconce
MODEL M: Wall Sconce
Design Model WATTS Watts Savings over Base
Standard – 2 40W Candelabra base lamps 80W No savings (baseline)
Option 1 – 2 25W Candelabra base Halogen lamps 50W 30 watts (dimmable)
Option 2 – 2 9W CFL lamps & Ballasts 20W 60 watts
Option 3 – 2 5W LED lamps and driver 10W 70 watts
Model M –Decorative Wall Sconce demonstrates that with using halogen lamping the lighting power
for this type of luminaire can be reduced by 37% (option 1 alternate) while maintaining equivalent
visual appearance and the potential for dimming when needed When/where dimming is not required a
lighting power reduction of 75% can be obtained by use of CFL systems. Even greater power
reduction (87%) and the ability to maintaining dimming is possible with LED systems (option 3). All
of the Decorative Wall Sconce options are cost effective under the 7 year cycle. [Refer to 3.2 for cost
effectiveness results]
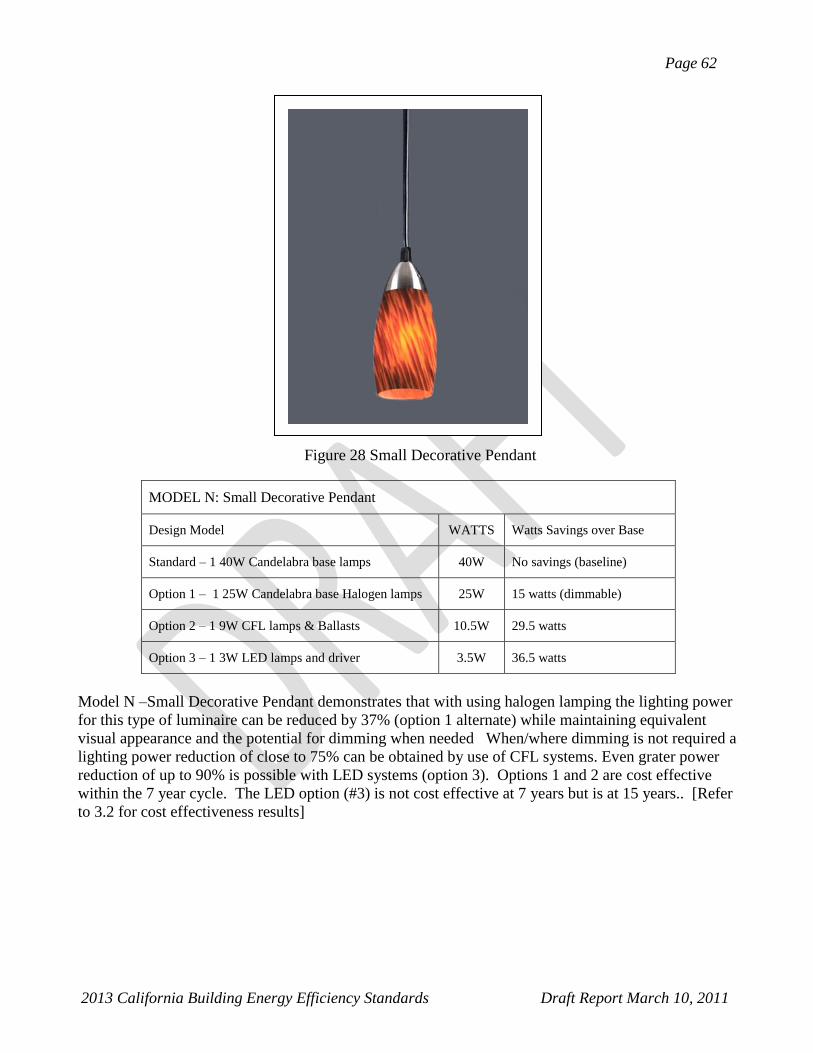
Page 62
2013 California Building Energy Efficiency Standards Draft Report March 10, 2011
Figure 28 Small Decorative Pendant
MODEL N: Small Decorative Pendant
Design Model WATTS Watts Savings over Base
Standard – 1 40W Candelabra base lamps 40W No savings (baseline)
Option 1 – 1 25W Candelabra base Halogen lamps 25W 15 watts (dimmable)
Option 2 – 1 9W CFL lamps & Ballasts 10.5W 29.5 watts
Option 3 – 1 3W LED lamps and driver 3.5W 36.5 watts
Model N –Small Decorative Pendant demonstrates that with using halogen lamping the lighting power
for this type of luminaire can be reduced by 37% (option 1 alternate) while maintaining equivalent
visual appearance and the potential for dimming when needed When/where dimming is not required a
lighting power reduction of close to 75% can be obtained by use of CFL systems. Even grater power
reduction of up to 90% is possible with LED systems (option 3). Options 1 and 2 are cost effective
within the 7 year cycle. The LED option (#3) is not cost effective at 7 years but is at 15 years.. [Refer
to 3.2 for cost effectiveness results]
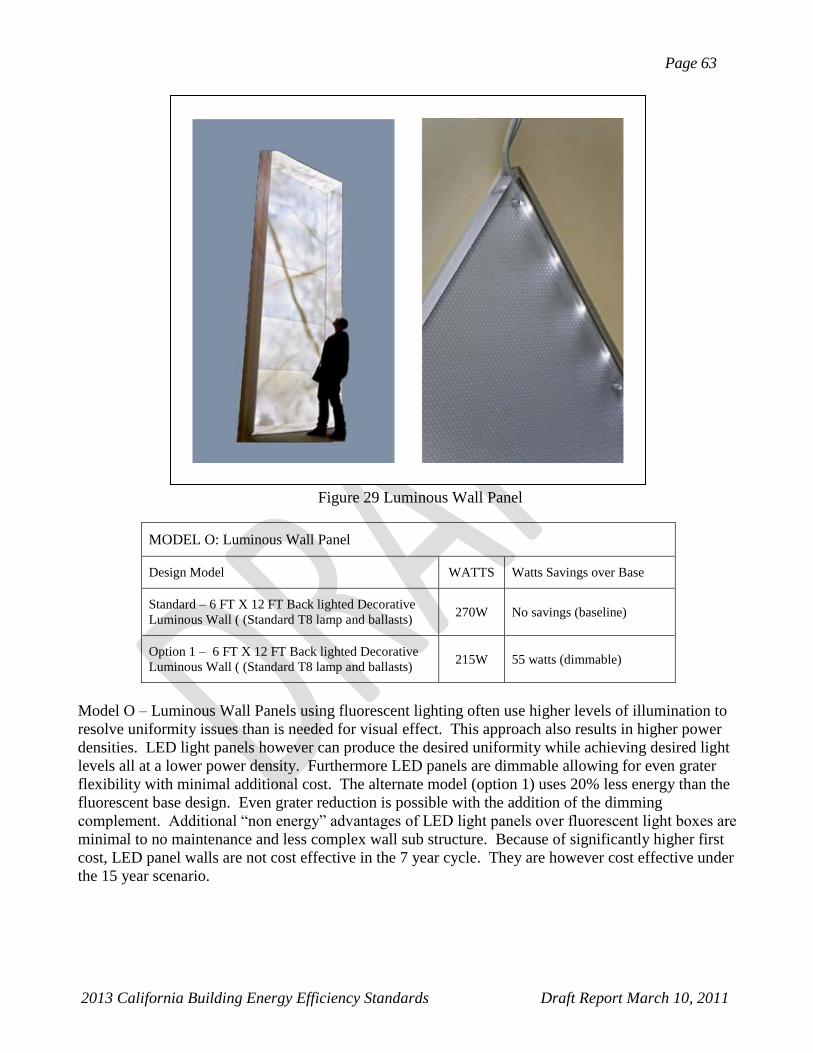
Page 63
2013 California Building Energy Efficiency Standards Draft Report March 10, 2011
Figure 29 Luminous Wall Panel
MODEL O: Luminous Wall Panel
Design Model WATTS Watts Savings over Base
Standard – 6 FT X 12 FT Back lighted Decorative
Luminous Wall ( (Standard T8 lamp and ballasts) 270W No savings (baseline)
Option 1 – 6 FT X 12 FT Back lighted Decorative
Luminous Wall ( (Standard T8 lamp and ballasts) 215W 55 watts (dimmable)
Model O – Luminous Wall Panels using fluorescent lighting often use higher levels of illumination to
resolve uniformity issues than is needed for visual effect. This approach also results in higher power
densities. LED light panels however can produce the desired uniformity while achieving desired light
levels all at a lower power density. Furthermore LED panels are dimmable allowing for even grater
flexibility with minimal additional cost. The alternate model (option 1) uses 20% less energy than the
fluorescent base design. Even grater reduction is possible with the addition of the dimming
complement. Additional “non energy” advantages of LED light panels over fluorescent light boxes are
minimal to no maintenance and less complex wall sub structure. Because of significantly higher first
cost, LED panel walls are not cost effective in the 7 year cycle. They are however cost effective under
the 15 year scenario.
Page 64
2013 California Building Energy Efficiency Standards Draft Report March 10, 2011
4.9 Conclusions and Assumptions
1) The effectiveness of Tailored Method to address special needs for higher LPDs while tightest
collator of lighting power density compliance is evident as proven from these results.
2) “Use it or lose it” provisions of the Tailored Method do work and are an effective deterrent to
casually over lighting and/or using LPDs indiscriminately.
3) Retail spaces that truly require additional lighting power can obtain them using Tailored Method
4) Tailored Compliance should remain a component of Title 24 2013.
5 Current allowed maximum LPDs as defined under Tile 24 2008 Tailored Method can be reduced
under Title 24 2013 while still maintaining the benefits for spaces requiring higher LPDs for special
conditions and unique design environments.
Page 65
2013 California Building Energy Efficiency Standards Draft Report March 10, 2011
5. Recommended Language for the Standards Document,
ACM Manuals, and the Reference Appendices
5.1 Code Change Proposals
Proposed changes to Title 24 building efficiency standards as applied to nonresidential buildings are:
1: Remove all but a few space types within (Table 146G T24-2008) from using Tailored Method.
Spaces currently allowed Tailored Method Compliance under Title 24-2008, to be disallowed under
the Proposed Title 24-2013 Tailored Compliance and moved to Area Method Compliance.
Within Area Method the spaces removed from Tailored Method will be added to the existing spaces
allowed to comply under Area Method (Table 146F24-2008). Area Method (Table 146F24-2008) will
also be updated to reflect lighting power adjustments (LPDs) generated from adding these new spaces
as well as adjustments generated because of technology improvements and IESNA design
recommended practices updates (IESNA RP_2 2011 and IESNA Handbook 10th Addition).
2: Reduce the allowed LPD for accent display and feature lighting under the Tailored Method (Table
146G T24-2008) based on use of Ceramic Metal Halide (CMH) as the primary light source for such
lighting and Light Emitting Diode (LED) an additional optional light source for several types of
display lighting. The current standards are based on primarily halogen lighting with some CMH,
mostly for higher ceilings. Use of primarily CMH versus Halogen as the light source for this
application will result in 30% to 50% LPD reductions for this category when applied to retail spaces.
Reduction within this category for other spaces is expected to be significantly less than for retail and
may not be appropriate to all space types. However even spaces where use of CMH may not be
applicable, because of the need to dim the accent display and feature lighting, using the latest
generation of HIR lamping can produce 10% reductions. LED lighting where appropriate can produce
further reductions in excess of 50% when compared to halogen lighting.
3: Reduce the allowed additional LPD for lighting "Valuable Merchandise" under Tailored Method.
Use of primarily CMH and LED versus Halogen as the light source for this application will result in
40% to 60% LPD reductions for this category when applied to retail spaces.
4: Realign and/or update the mounting height adjustment factor (TABLE 146-H T24-2008) based on
the most current high efficacy CMH, LED and IR Halogen lamp wattage range and optics. This
adjustment will allow use of low wattage (20-25W) CMH lamps, LED lamps and Halogen IR lamps in
lower ceilings while allowing adequate increased power with CMH (35/39W and 70W) applications
when and or where appropriate at higher ceilings.
5: Reduce the allowed LPD for ornamental/special effect lighting under the Tailored Method (Table
146G T24-2008) and "Chandeliers & Sconces" Area Method (Table 146F24-2008). This reduction is
based on use of newer technology candelabra and medium socket based halogen decorative lamps,
increased options for CFL lamps, and low wattage CMH and LED options for decorative lighting. Use
of these improved efficacy light sources can reduce LPDs in this category by 20% to 50%.
6: Mandate use of comprehensive lighting controls as a prerequisite to using the Tailored Lighting
Method of Title 24 compliance under the 2013 standards. Multi-tier lighting zones, multi-level
switching, demand responsive load controls, and occupancy sensors are some of the control types that
are applicable. Use of a comprehensive set of controls will assure that the added power (LPDs)
allowed under the Tailored Method will be used only when required for the specific lighting
application and will be appropriately monitored. The control mandate must include commissioning
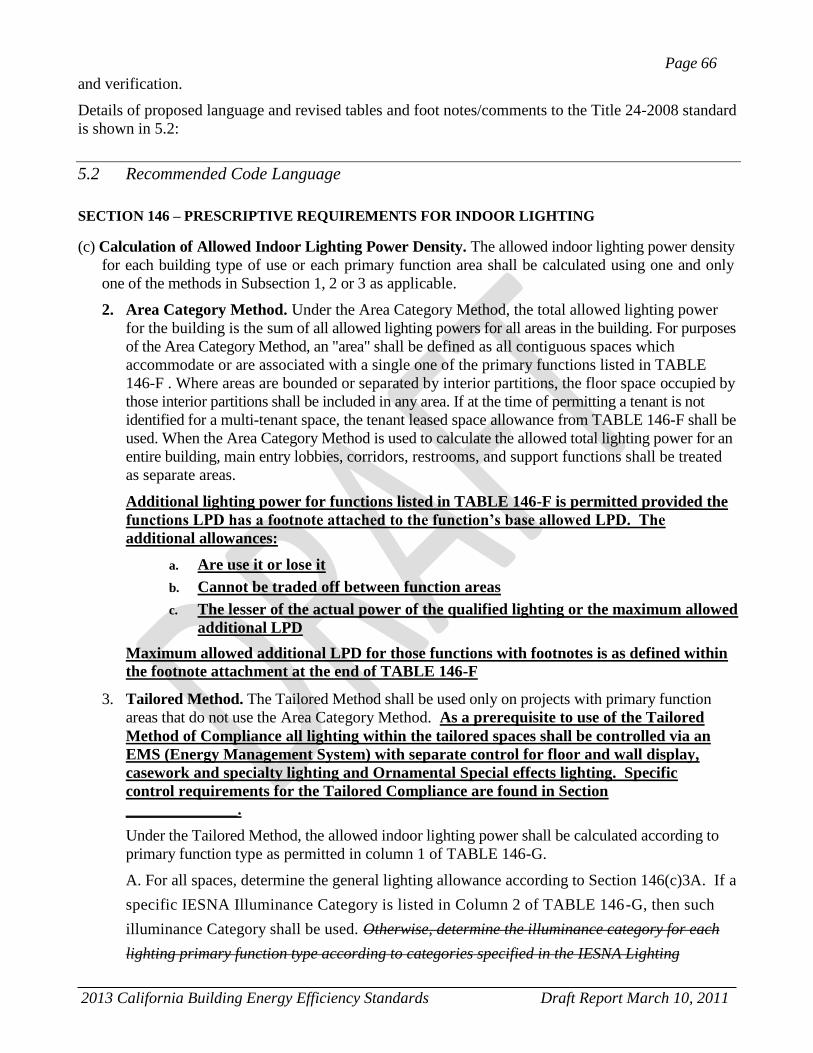
Page 66
2013 California Building Energy Efficiency Standards Draft Report March 10, 2011
and verification.
Details of proposed language and revised tables and foot notes/comments to the Title 24-2008 standard
is shown in 5.2:
5.2 Recommended Code Language
SECTION 146 – PRESCRIPTIVE REQUIREMENTS FOR INDOOR LIGHTING
(c) Calculation of Allowed Indoor Lighting Power Density. The allowed indoor lighting power density
for each building type of use or each primary function area shall be calculated using one and only
one of the methods in Subsection 1, 2 or 3 as applicable.
2. Area Category Method. Under the Area Category Method, the total allowed lighting power
for the building is the sum of all allowed lighting powers for all areas in the building. For purposes
of the Area Category Method, an "area" shall be defined as all contiguous spaces which
accommodate or are associated with a single one of the primary functions listed in TABLE
146-F . Where areas are bounded or separated by interior partitions, the floor space occupied by
those interior partitions shall be included in any area. If at the time of permitting a tenant is not
identified for a multi-tenant space, the tenant leased space allowance from TABLE 146-F shall be
used. When the Area Category Method is used to calculate the allowed total lighting power for an
entire building, main entry lobbies, corridors, restrooms, and support functions shall be treated
as separate areas.
Additional lighting power for functions listed in TABLE 146-F is permitted provided the
functions LPD has a footnote attached to the function’s base allowed LPD. The
additional allowances:
a. Are use it or lose it
b. Cannot be traded off between function areas
c. The lesser of the actual power of the qualified lighting or the maximum allowed
additional LPD
Maximum allowed additional LPD for those functions with footnotes is as defined within
the footnote attachment at the end of TABLE 146-F
3. Tailored Method. The Tailored Method shall be used only on projects with primary function
areas that do not use the Area Category Method. As a prerequisite to use of the Tailored
Method of Compliance all lighting within the tailored spaces shall be controlled via an
EMS (Energy Management System) with separate control for floor and wall display,
casework and specialty lighting and Ornamental Special effects lighting. Specific
control requirements for the Tailored Compliance are found in Section
______________.
Under the Tailored Method, the allowed indoor lighting power shall be calculated according to
primary function type as permitted in column 1 of TABLE 146-G.
A. For all spaces, determine the general lighting allowance according to Section 146(c)3A. If a
specific IESNA Illuminance Category is listed in Column 2 of TABLE 146-G, then such
illuminance Category shall be used. Otherwise, determine the illuminance category for each
lighting primary function type according to categories specified in the IESNA Lighting
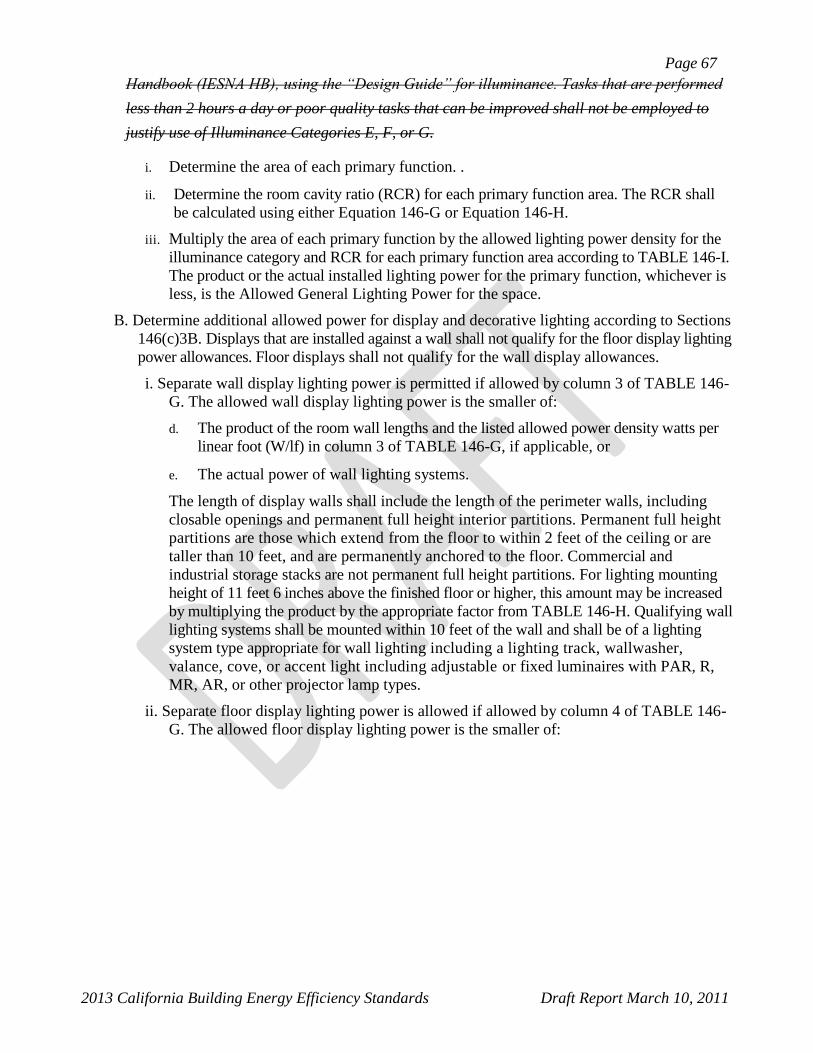
Page 67
2013 California Building Energy Efficiency Standards Draft Report March 10, 2011
Handbook (IESNA HB), using the “Design Guide” for illuminance. Tasks that are performed
less than 2 hours a day or poor quality tasks that can be improved shall not be employed to
justify use of Illuminance Categories E, F, or G.
i. Determine the area of each primary function. .
ii. Determine the room cavity ratio (RCR) for each primary function area. The RCR shall
be calculated using either Equation 146-G or Equation 146-H.
iii. Multiply the area of each primary function by the allowed lighting power density for the
illuminance category and RCR for each primary function area according to TABLE 146-I.
The product or the actual installed lighting power for the primary function, whichever is
less, is the Allowed General Lighting Power for the space.
B. Determine additional allowed power for display and decorative lighting according to Sections
146(c)3B. Displays that are installed against a wall shall not qualify for the floor display lighting
power allowances. Floor displays shall not qualify for the wall display allowances.
i. Separate wall display lighting power is permitted if allowed by column 3 of TABLE 146-
G. The allowed wall display lighting power is the smaller of:
d. The product of the room wall lengths and the listed allowed power density watts per
linear foot (W/lf) in column 3 of TABLE 146-G, if applicable, or
e. The actual power of wall lighting systems.
The length of display walls shall include the length of the perimeter walls, including
closable openings and permanent full height interior partitions. Permanent full height
partitions are those which extend from the floor to within 2 feet of the ceiling or are
taller than 10 feet, and are permanently anchored to the floor. Commercial and
industrial storage stacks are not permanent full height partitions. For lighting mounting
height of 11 feet 6 inches above the finished floor or higher, this amount may be increased
by multiplying the product by the appropriate factor from TABLE 146-H. Qualifying wall
lighting systems shall be mounted within 10 feet of the wall and shall be of a lighting
system type appropriate for wall lighting including a lighting track, wallwasher,
valance, cove, or accent light including adjustable or fixed luminaires with PAR, R,
MR, AR, or other projector lamp types.
ii. Separate floor display lighting power is allowed if allowed by column 4 of TABLE 146-
G. The allowed floor display lighting power is the smaller of:
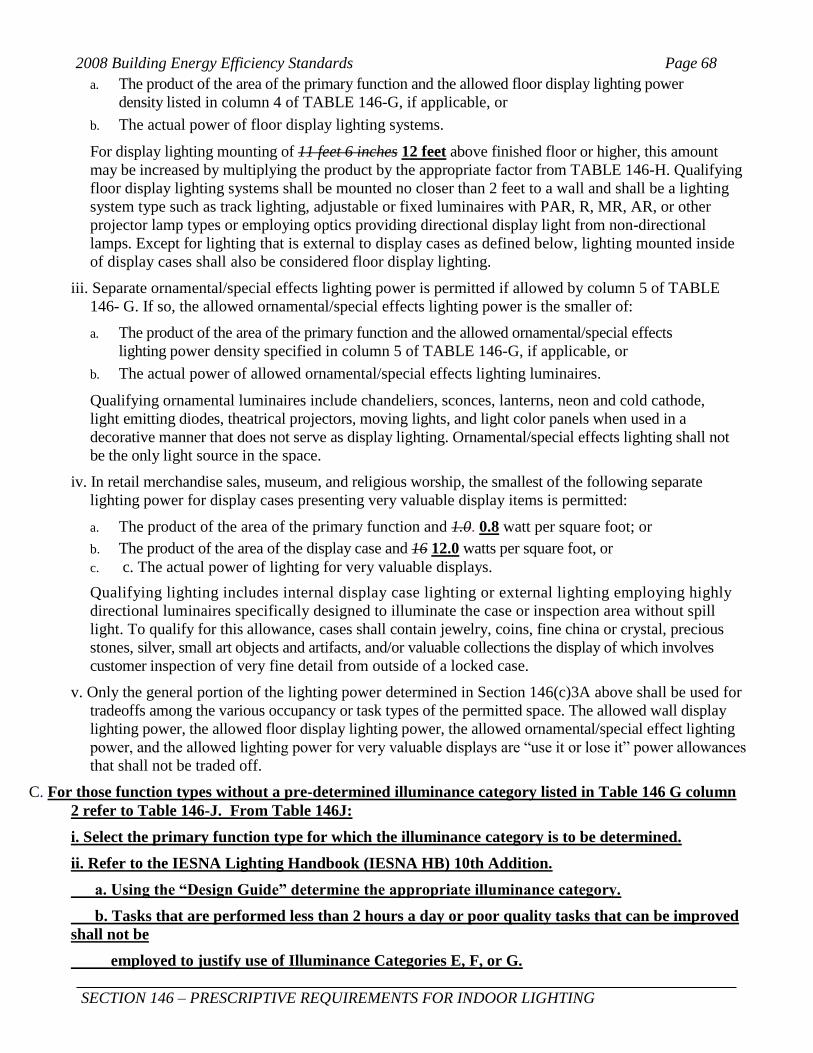
2008 Building Energy Efficiency Standards Page 68
SECTION 146 – PRESCRIPTIVE REQUIREMENTS FOR INDOOR LIGHTING
a. The product of the area of the primary function and the allowed floor display lighting power
density listed in column 4 of TABLE 146-G, if applicable, or
b. The actual power of floor display lighting systems.
For display lighting mounting of 11 feet 6 inches 12 feet above finished floor or higher, this amount
may be increased by multiplying the product by the appropriate factor from TABLE 146-H. Qualifying
floor display lighting systems shall be mounted no closer than 2 feet to a wall and shall be a lighting
system type such as track lighting, adjustable or fixed luminaires with PAR, R, MR, AR, or other
projector lamp types or employing optics providing directional display light from non-directional
lamps. Except for lighting that is external to display cases as defined below, lighting mounted inside
of display cases shall also be considered floor display lighting.
iii. Separate ornamental/special effects lighting power is permitted if allowed by column 5 of TABLE
146- G. If so, the allowed ornamental/special effects lighting power is the smaller of:
a. The product of the area of the primary function and the allowed ornamental/special effects
lighting power density specified in column 5 of TABLE 146-G, if applicable, or
b. The actual power of allowed ornamental/special effects lighting luminaires.
Qualifying ornamental luminaires include chandeliers, sconces, lanterns, neon and cold cathode,
light emitting diodes, theatrical projectors, moving lights, and light color panels when used in a
decorative manner that does not serve as display lighting. Ornamental/special effects lighting shall not
be the only light source in the space.
iv. In retail merchandise sales, museum, and religious worship, the smallest of the following separate
lighting power for display cases presenting very valuable display items is permitted:
a. The product of the area of the primary function and 1.0. 0.8 watt per square foot; or
b. The product of the area of the display case and 16 12.0 watts per square foot, or
c. c. The actual power of lighting for very valuable displays.
Qualifying lighting includes internal display case lighting or external lighting employing highly
directional luminaires specifically designed to illuminate the case or inspection area without spill
light. To qualify for this allowance, cases shall contain jewelry, coins, fine china or crystal, precious
stones, silver, small art objects and artifacts, and/or valuable collections the display of which involves
customer inspection of very fine detail from outside of a locked case.
v. Only the general portion of the lighting power determined in Section 146(c)3A above shall be used for
tradeoffs among the various occupancy or task types of the permitted space. The allowed wall display
lighting power, the allowed floor display lighting power, the allowed ornamental/special effect lighting
power, and the allowed lighting power for very valuable displays are “use it or lose it” power allowances
that shall not be traded off.
C. For those function types without a pre-determined illuminance category listed in Table 146 G column
2 refer to Table 146-J. From Table 146J:
i. Select the primary function type for which the illuminance category is to be determined.
ii. Refer to the IESNA Lighting Handbook (IESNA HB) 10th Addition.
a. Using the “Design Guide” determine the appropriate illuminance category.
b. Tasks that are performed less than 2 hours a day or poor quality tasks that can be improved
shall not be
employed to justify use of Illuminance Categories E, F, or G.
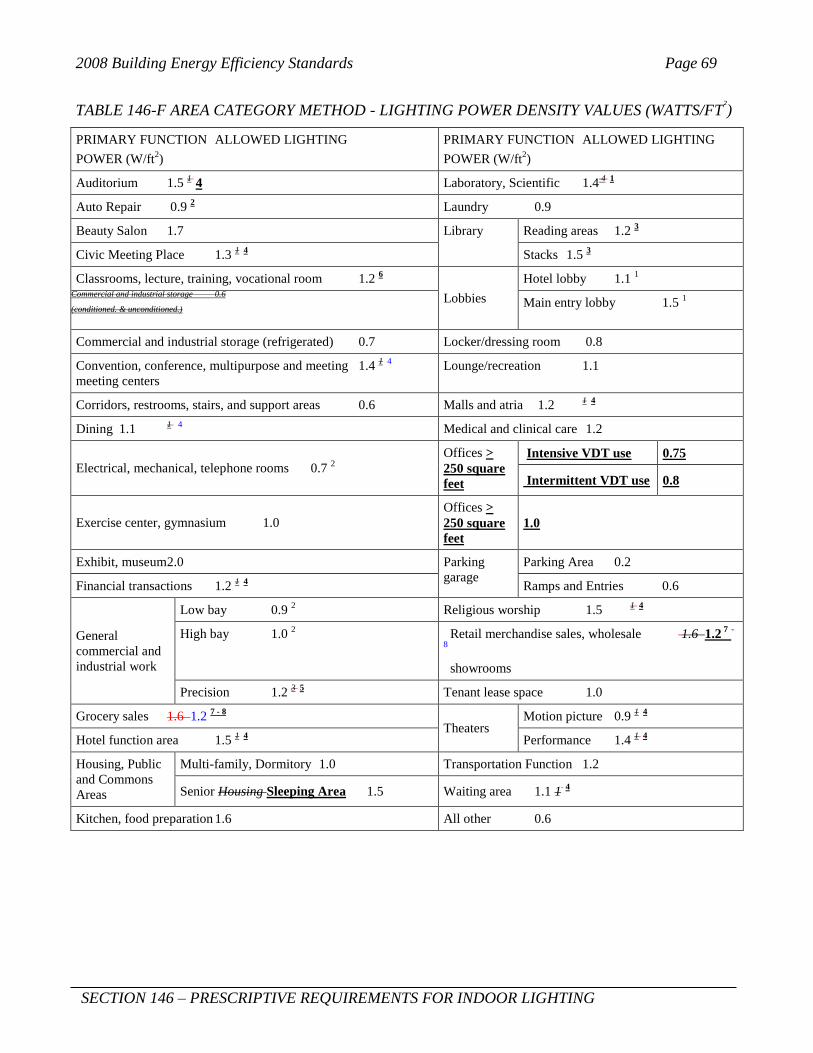
2008 Building Energy Efficiency Standards Page 69
SECTION 146 – PRESCRIPTIVE REQUIREMENTS FOR INDOOR LIGHTING
TABLE 146-F AREA CATEGORY METHOD - LIGHTING POWER DENSITY VALUES (WATTS/FT²)
PRIMARY FUNCTION ALLOWED LIGHTING
POWER (W/ft2)
PRIMARY FUNCTION ALLOWED LIGHTING
POWER (W/ft2)
Auditorium 1.5 1
4
Laboratory, Scientific 1.4 4 1
Auto Repair 0.9 2
Laundry 0.9
Beauty Salon 1.7 Library Reading areas 1.2 3
Civic Meeting Place 1.3 1 4
Stacks 1.5 3
Classrooms, lecture, training, vocational room 1.2 6
Lobbies
Hotel lobby 1.1 1
Commercial and industrial storage 0.6
(conditioned. & unconditioned.) Main entry lobby 1.5
1
Commercial and industrial storage (refrigerated) 0.7 Locker/dressing room 0.8
Convention, conference, multipurpose and meeting 1.4 1 4
meeting centers
Lounge/recreation 1.1
Corridors, restrooms, stairs, and support areas 0.6 Malls and atria 1.2 1 4
Dining 1.1 1 4
Medical and clinical care 1.2
Electrical, mechanical, telephone rooms 0.7 2
Offices >
250 square
feet
Intensive VDT use 0.75
Intermittent VDT use 0.8
Exercise center, gymnasium 1.0
Offices >
250 square
feet
1.0
Exhibit, museum 2.0 Parking
garage
Parking Area 0.2
Financial transactions 1.2 1 4
Ramps and Entries 0.6
General
commercial and
industrial work
Low bay 0.9 2
Religious worship 1.5 1 4
High bay 1.0 2
Retail merchandise sales, wholesale 1.6 1.2 7 -
8
showrooms
Precision 1.2 3 5
Tenant lease space 1.0
Grocery sales 1.6 1.2 7 - 8
Theaters
Motion picture 0.9 1 4
Hotel function area 1.5 1 4
Performance 1.4 1 4
Housing, Public
and Commons
Areas
Multi-family, Dormitory 1.0 Transportation Function 1.2
Senior Housing Sleeping Area 1.5 Waiting area 1.1 1 4
Kitchen, food preparation 1.6 All other 0.6
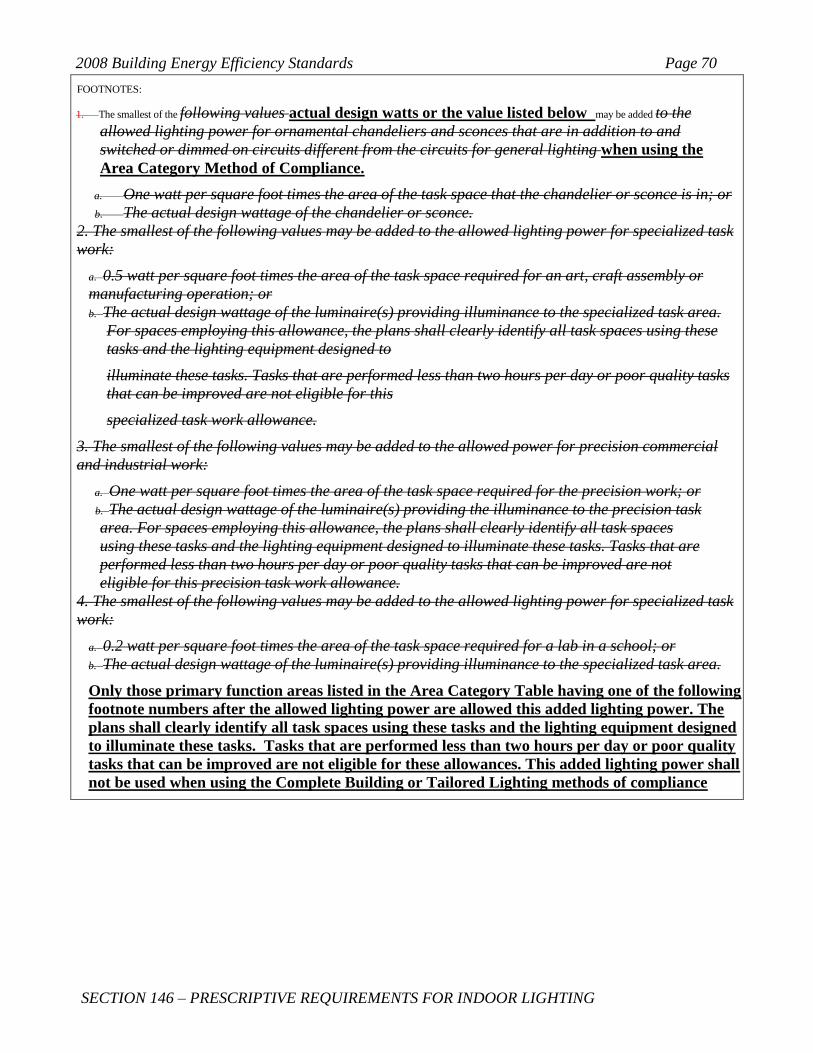
2008 Building Energy Efficiency Standards Page 70
SECTION 146 – PRESCRIPTIVE REQUIREMENTS FOR INDOOR LIGHTING
FOOTNOTES:
1. The smallest of the following values actual design watts or the value listed below may be added to the
allowed lighting power for ornamental chandeliers and sconces that are in addition to and
switched or dimmed on circuits different from the circuits for general lighting when using the
Area Category Method of Compliance.
a. One watt per square foot times the area of the task space that the chandelier or sconce is in; or
b. The actual design wattage of the chandelier or sconce.
2. The smallest of the following values may be added to the allowed lighting power for specialized task
work:
a. 0.5 watt per square foot times the area of the task space required for an art, craft assembly or
manufacturing operation; or
b. The actual design wattage of the luminaire(s) providing illuminance to the specialized task area.
For spaces employing this allowance, the plans shall clearly identify all task spaces using these
tasks and the lighting equipment designed to
illuminate these tasks. Tasks that are performed less than two hours per day or poor quality tasks
that can be improved are not eligible for this
specialized task work allowance.
3. The smallest of the following values may be added to the allowed power for precision commercial
and industrial work:
a. One watt per square foot times the area of the task space required for the precision work; or
b. The actual design wattage of the luminaire(s) providing the illuminance to the precision task
area. For spaces employing this allowance, the plans shall clearly identify all task spaces
using these tasks and the lighting equipment designed to illuminate these tasks. Tasks that are
performed less than two hours per day or poor quality tasks that can be improved are not
eligible for this precision task work allowance.
4. The smallest of the following values may be added to the allowed lighting power for specialized task
work:
a. 0.2 watt per square foot times the area of the task space required for a lab in a school; or
b. The actual design wattage of the luminaire(s) providing illuminance to the specialized task area.
Only those primary function areas listed in the Area Category Table having one of the following
footnote numbers after the allowed lighting power are allowed this added lighting power. The
plans shall clearly identify all task spaces using these tasks and the lighting equipment designed
to illuminate these tasks. Tasks that are performed less than two hours per day or poor quality
tasks that can be improved are not eligible for these allowances. This added lighting power shall
not be used when using the Complete Building or Tailored Lighting methods of compliance
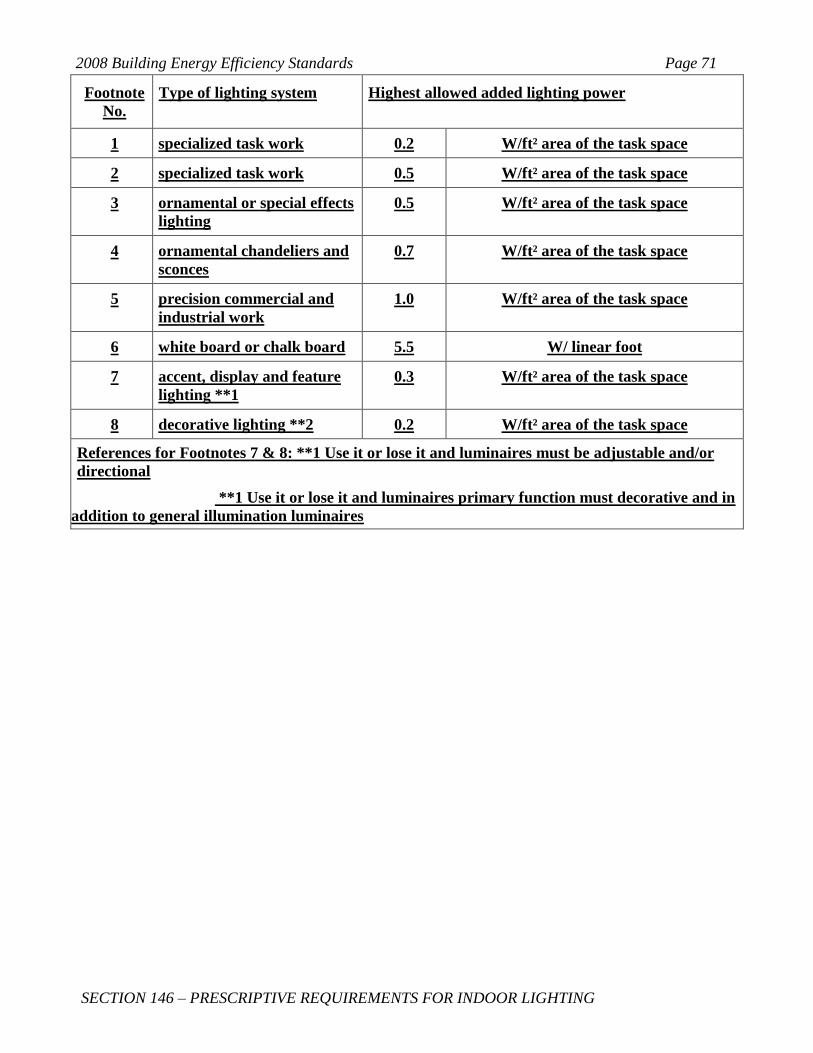
2008 Building Energy Efficiency Standards Page 71
SECTION 146 – PRESCRIPTIVE REQUIREMENTS FOR INDOOR LIGHTING
Footnote
No.
Type of lighting system Highest allowed added lighting power
1 specialized task work 0.2 W/ft² area of the task space
2 specialized task work 0.5 W/ft² area of the task space
3 ornamental or special effects
lighting
0.5 W/ft² area of the task space
4 ornamental chandeliers and
sconces
0.7 W/ft² area of the task space
5 precision commercial and
industrial work
1.0 W/ft² area of the task space
6 white board or chalk board 5.5 W/ linear foot
7 accent, display and feature
lighting **1
0.3 W/ft² area of the task space
8 decorative lighting **2 0.2 W/ft² area of the task space
References for Footnotes 7 & 8: **1 Use it or lose it and luminaires must be adjustable and/or
directional
**1 Use it or lose it and luminaires primary function must decorative and in
addition to general illumination luminaires
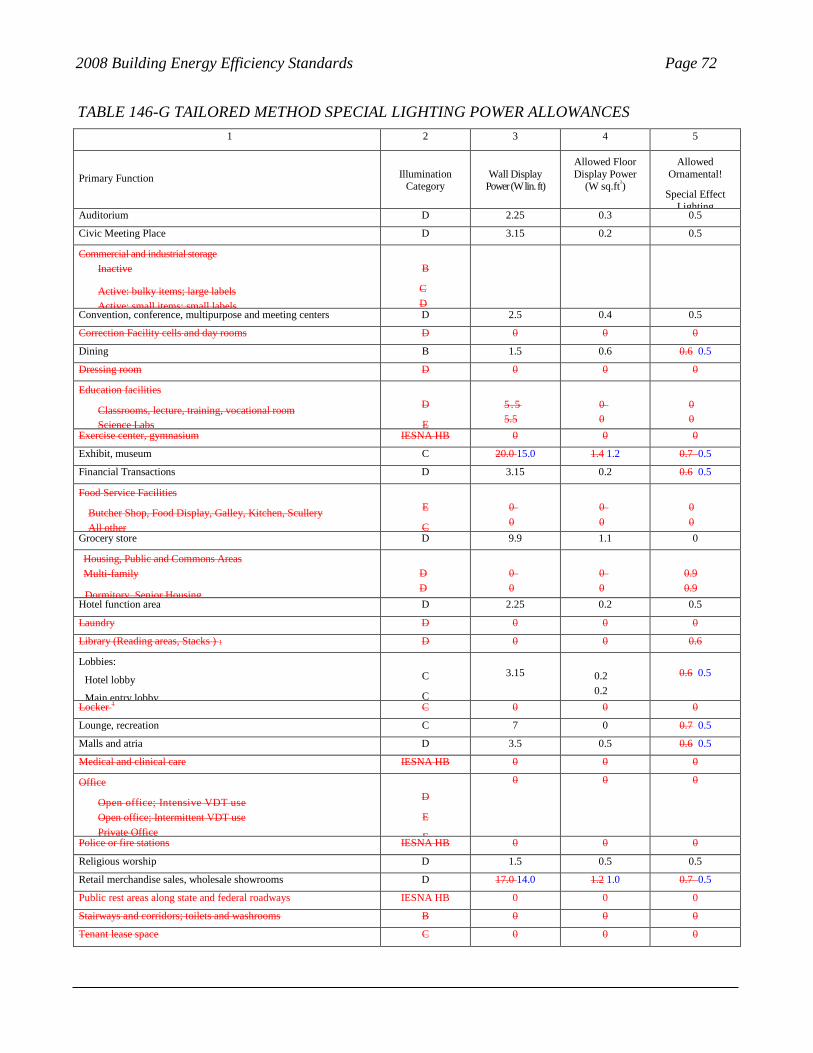
2008 Building Energy Efficiency Standards Page 72
TABLE 146-G TAILORED METHOD SPECIAL LIGHTING POWER ALLOWANCES
1 2 3 4 5
Primary Function Illumination Category
Wall Display Power (W lin. ft)
Allowed Floor
Display Power (W sq.ft²)
Allowed
Ornamental!
Special Effect
Lighting Auditorium D 2.25 0.3 0.5
Civic Meeting Place D 3.15 0.2 0.5
Commercial and industrial storage
Inactive
Active: bulky items; large labels
Active: small items; small labels
B
C
D
Convention, conference, multipurpose and meeting centers D 2.5 0.4 0.5
Correction Facility cells and day rooms D 0 0 0
Dining B 1.5 0.6 0.6 0.5
Dressing room D 0 0 0
Education facilities
Classrooms, lecture, training, vocational room
Science Labs
D
E
5 .5
5.5
0
0
0
0
Exercise center, gymnasium IESNA HB 0 0 0
Exhibit, museum C 20.0 15.0 1.4 1.2 0.7 0.5
Financial Transactions D 3.15 0.2 0.6 0.5
Food Service Facilities
Butcher Shop, Food Display, Galley, Kitchen, Scullery
All other
E
C
0
0
0
0
0
0
Grocery store D 9.9 1.1 0
Housing, Public and Commons Areas
Multi-family
Dormitory, Senior Housing
D
D
0
0
0
0
0.9
0.9
Hotel function area D 2.25 0.2 0.5
Laundry D 0 0 0
Library (Reading areas, Stacks ) 1 D 0 0 0.6
Lobbies:
Hotel lobby
Main entry lobby
C
C
3.15 0.2
0.2
0.6 0.5
Locker 1 C 0 0 0
Lounge, recreation C 7 0 0.7 0.5
Malls and atria D 3.5 0.5 0.6 0.5
Medical and clinical care IESNA HB 0 0 0
Office
Open office; Intensive VDT use
Open office; Intermittent VDT use
Private Office
D
E
E
0 0 0
Police or fire stations IESNA HB 0 0 0
Religious worship D 1.5 0.5 0.5
Retail merchandise sales, wholesale showrooms D 17.0 14.0 1.2 1.0 0.7 0.5
Public rest areas along state and federal roadways IESNA HB 0 0 0
Stairways and corridors; toilets and washrooms B 0 0 0
Tenant lease space C 0 0 0
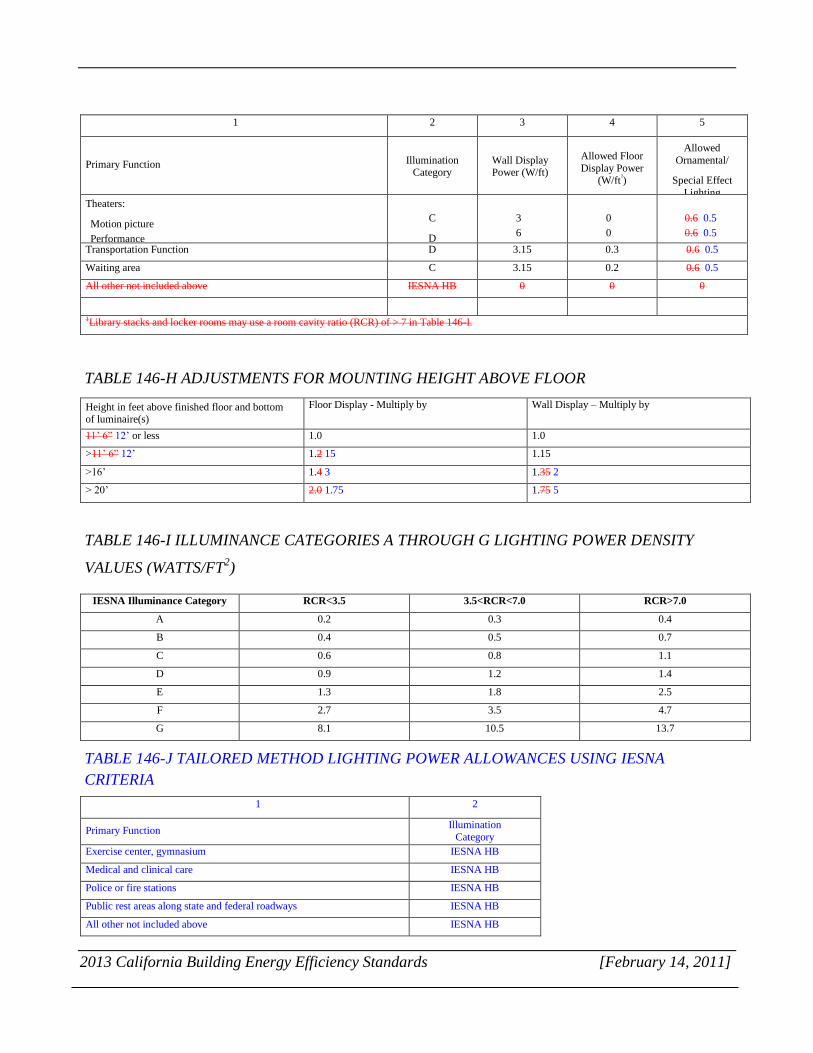
2013 California Building Energy Efficiency Standards [February 14, 2011]
1 2 3 4 5
Primary Function Illumination Category
Wall Display Power (W/ft)
Allowed Floor
Display Power (W/ft²)
Allowed
Ornamental/
Special Effect
Lighting Theaters:
Motion picture
Performance
C
D
3
6
0
0
0.6 0.5
0.6 0.5
Transportation Function D 3.15 0.3 0.6 0.5
Waiting area C 3.15 0.2 0.6 0.5
All other not included above IESNA HB 0 0 0
1Library stacks and locker rooms may use a room cavity ratio (RCR) of > 7 in Table 146-I.
TABLE 146-H ADJUSTMENTS FOR MOUNTING HEIGHT ABOVE FLOOR
Height in feet above finished floor and bottom of luminaire(s)
Floor Display - Multiply by Wall Display – Multiply by
11‟ 6” 12‟ or less 1.0 1.0
>11‟ 6” 12‟ 1.2 15 1.15
>16‟ 1.4 3 1.35 2
> 20‟ 2.0 1.75 1.75 5
TABLE 146-I ILLUMINANCE CATEGORIES A THROUGH G LIGHTING POWER DENSITY
VALUES (WATTS/FT2)
IESNA Illuminance Category RCR<3.5 3.5<RCR<7.0 RCR>7.0
A 0.2 0.3 0.4
B 0.4 0.5 0.7
C 0.6 0.8 1.1
D 0.9 1.2 1.4
E 1.3 1.8 2.5
F 2.7 3.5 4.7
G 8.1 10.5 13.7
TABLE 146-J TAILORED METHOD LIGHTING POWER ALLOWANCES USING IESNA
CRITERIA
1 2
Primary Function Illumination
Category
Exercise center, gymnasium IESNA HB
Medical and clinical care IESNA HB
Police or fire stations IESNA HB
Public rest areas along state and federal roadways IESNA HB
All other not included above IESNA HB
Page 74
2013 California Building Energy Efficiency Standards 2nd
Draft Report March 6, 2011]
6. Appendices
6.1 Appendix I--Designer, End-User and Manufacturer Interview
PG & E CASE STUDY
TITLE 24-2013 TAILORED METHOD
UPDATE & REVISIONS
Designer, End User and Manufacturer Survey Form
Prepared by Integrated Lighting Concepts November 14, 2009
[Version II revised March 15, 2010]
Introduction
I am interviewing people to understand ways that the California Title 24 building energy code can be
improved to save more energy and become easier to use. This project is funded by PG&E in support
of their Codes and Standards program.
INTERVIEW QUESTIONS
1. Are you familiar with the lighting requirements in the California Title 24 building energy
code?
Yes No
2. Do you find any parts of the lighting requirements in Title 24 confusing or contradictory? If
yes, please explain what aspects.
Yes No
What aspects? Please provide details:
Please explain how the aspects noted could be improved?
Page 75
2013 California Building Energy Efficiency Standards 2nd
Draft Report March 6, 2011]
3. Do you use current limiters with track lighting for Title 24 compliance? Yes
No
If yes, what type/types are used?
Attached to track end Current limiter sub panel Other system/type
(explain below)
____________________________________________________________________
____________________________________________________________________
____________________________________________________________________
____________________________________________________________________
____________________________________________________________________
4: Do you have any recommendations or suggestions that if included as part of Title 24 – 2011
could lower power consumption and result in energy savings? Please note recommendations and
comments below:
____________________________________________________________________
____________________________________________________________________
____________________________________________________________________
____________________________________________________________________
____________________________________________________________________
____________________________________________________________________
(add attachments as needed)
5. Accepting the premise that reducing power densities under the 2011 code version must (will)
occur rank the following measures regarding practical or feasible means for achieving LPD
reductions.
(please rate practicability or feasibility of each as follows: 5 = Excellent 4 = Very Good 3 =
Good 2 = Fair 1 = Poor 0 = Not Acceptable)
Use Ceramic Metal Halide and/or LED as the basis for most focal/feature lighting such as accent and
display lighting artwork and architectural feature wall washing.
Eliminate, or at minimum, substantially reduce most exemptions for special applications
Expand control requirements and use of controls, especially in tailored compliance
Totally eliminate (do away with) Tailored Method under 2011 standards and replace with limited
power add-ons (similar to ASHRAE/IES 90.1) - specialized spaces/needs only
Limit Retail Lighting to 3W Sq. Ft. (1.5W + 1.5W exempt display) similar to the Washington State
Energy Code
Page 76
2013 California Building Energy Efficiency Standards 2nd
Draft Report March 6, 2011]
Base new lighting wattage limitations (LPD‟s) on Metal Halide equipment on electronic ballasts and
Pulse Start or Ceramic Metal Halide lamps
Base new lighting wattage limitations (LPD‟s) on fluorescent equipment with electronic ballasts and
latest generation of T8 and or T5 lamps
Base new lighting wattage limitations (LPD‟s) on incandescent equipment with IRC MR16 lamps and
electronic transformers (low voltage incandescent) and next generation Halogen IR lamps for all other
incandescent lamps
Expand the mandate for uses of “Day-lighting” to more application types and smaller footprints
Increase stringency of base lighting power densities and add more control credits to offset the lower
LPD‟s so as to encourage higher use of automatic control of lighting
Reduce ambient lighting in spaces with abundant display lighting
Less uniformity of display lighting
Lower light levels but use color to attract customer attention
Utilize automatic controls in window displays to reduce light levels at night time
6. Have you used the tailored method within the last year? Yes No
<skip questions 7-9 if they answer NO>
<Use questions 7, 8 & 9 to fill out table - see below>
7: For which space types and/or applications do you use the Tailored Method compliance?
Retail Hospitality Museum Worship Offices
Other (Explain space type & application) ________________________________________
8: What percentage of time do you currently use the Tailored method of compliance for the
project? (% for each of the various space types)
Space Type Used Y/N % of time Why tailored?
Retail
Hospitality
Museum
Worship
Offices
Other(s) describe below
1.
Page 77
2013 California Building Energy Efficiency Standards 2nd
Draft Report March 6, 2011]
2.
3.
4.
9. Why is the tailored lighting method needed? <check all that apply>
a) Tall narrow rooms have high RCR – lot of losses in space
b) Low reflectance surfaces in space or cavities that are hard to light
c) Need for display lighting with high contrast
d) Need high light levels for design
e) Need to use incandescent or halogen lighting
f) Specialized high-resolution task
g) Need high light levels for space to stand out
g) Other (explain) ______________________________________________
10: Ceramic Metal Halide lighting is a feasible alternative to incandescent and halogen lighting
for commercial and retail applications. <check box to indicate your level of agreement>
Strongly Agree Somewhat Agree Not Sure/Don‟t Know
Somewhat Disagree Strongly Disagree
11: LED lighting will become a feasible alternative to incandescent and halogen lighting for
commercial and retail applications by 2011. <check box to indicate your level of agreement>
Strongly Agree Somewhat Agree Not Sure/Don‟t Know
Somewhat Disagree Strongly Disagree
12. What, if any, are current limitations to the feasibility of replacing incandescent or halogen lighting
with ceramic metal halide? <check all that apply>
a) Color quality
b) Beam control
c) Variety of wattages and beam spreads
d) First cost
e) Maintenance cost
f) Other (please explain) __________________________________________________
Page 78
2013 California Building Energy Efficiency Standards 2nd
Draft Report March 6, 2011]
13. What, if any, are current limitations to the feasibility of replacing incandescent or halogen lighting
with LED lighting? <check all that apply>
a) Color quality
b) Beam control
c) Variety of wattages and beam spreads
d) First cost
e) Maintenance cost
f) Other (please explain) __________________________________________________
14: If California were to set compliance standards which resulted in increased use of CMH lamps
and luminaires, how soon could luminaire and lamp manufactures respond to increased demand
(equivalent to ½ of the current halogen luminaire market) for these products in California? <check
one>
Six (6) months or less Six (7) to Nine (9) Months
Nine (10) months to One (1) year More than one (1) year to Eighteen (18) months
Nineteen (19) Months to Two (2) years More than Two (2) years
More than Three (3) years Possibly never
15: If California were to set compliance standards which resulted in increased use of LED lamps
and luminaires, how soon could luminaire and lamp manufactures respond to increased demand
(equivalent to ½ of the current halogen luminaire market) for these products in California?
Six (6) months or less Six (7) to Nine (9) Months
Nine (10) months to One (1) year More than one (1) year to Eighteen (18) months
Nineteen (19) Months to Two (2) years More than Two (2) years
More than Three (3) years Possibly never
16. What is the typical lifespan of lighting equipment used in retail? ________ Years
Other Commercial spaces? _________ Years
17: What do you believe are/is the greatest challenges/challenge and/or barriers to potential
changes in the energy code for 2011?
Page 79
2013 California Building Energy Efficiency Standards 2nd
Draft Report March 6, 2011]
_______________________________________________________________________________
_______________________________________________________________________________
_______________________________________________________________________________
_______________________________________________________________________________
_______________________________________________________________________________
_______________________________________________________________________________
_______________________________________________________________________________
_______________________________________________________________________________
_______________________________________________________________________________
_______________________________________________________________________________
_______________________________________________________________________________.
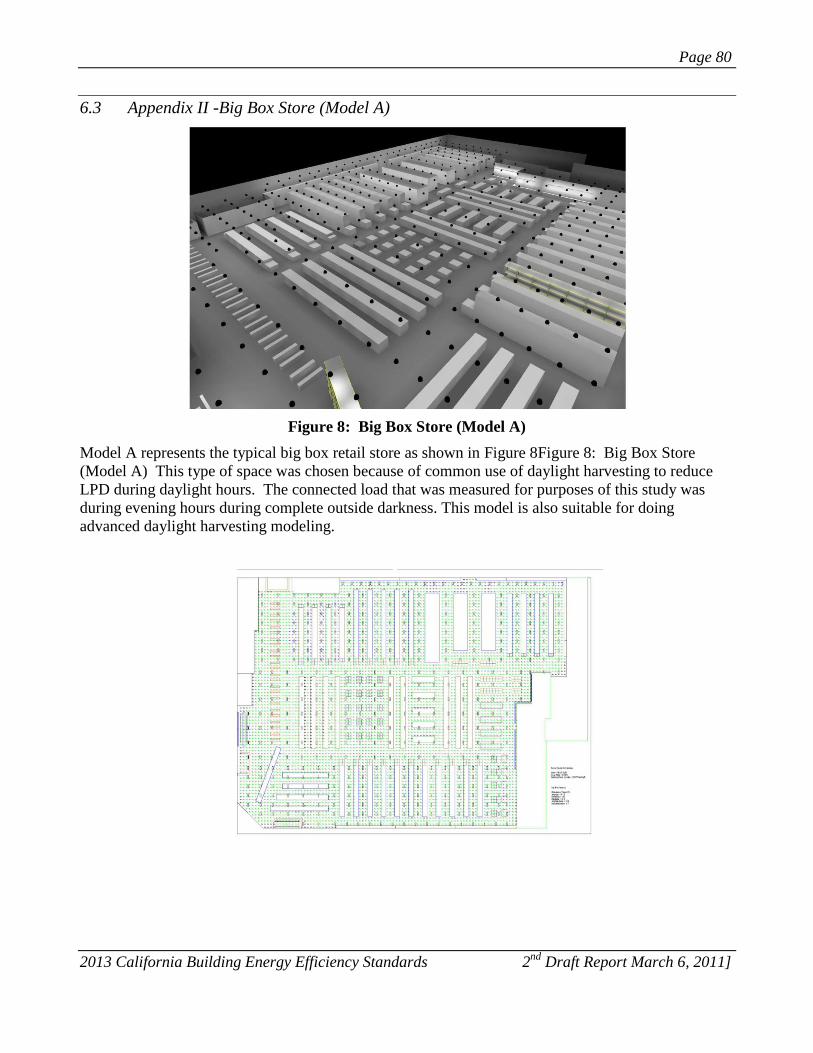
Page 80
2013 California Building Energy Efficiency Standards 2nd
Draft Report March 6, 2011]
6.3 Appendix II -Big Box Store (Model A)
Figure 8: Big Box Store (Model A)
Model A represents the typical big box retail store as shown in Figure 8Figure 8: Big Box Store
(Model A) This type of space was chosen because of common use of daylight harvesting to reduce
LPD during daylight hours. The connected load that was measured for purposes of this study was
during evening hours during complete outside darkness. This model is also suitable for doing
advanced daylight harvesting modeling.
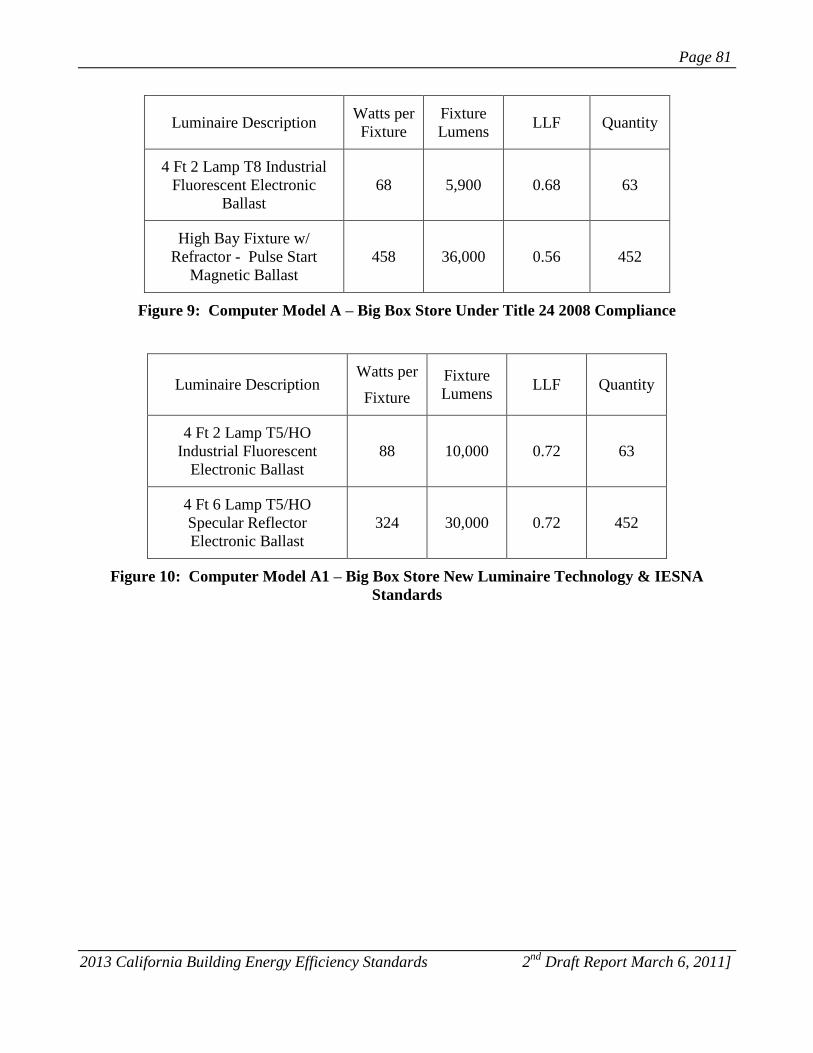
Page 81
2013 California Building Energy Efficiency Standards 2nd
Draft Report March 6, 2011]
Luminaire Description Watts per
Fixture
Fixture
Lumens LLF Quantity
4 Ft 2 Lamp T8 Industrial
Fluorescent Electronic
Ballast
68 5,900 0.68 63
High Bay Fixture w/
Refractor - Pulse Start
Magnetic Ballast
458 36,000 0.56 452
Figure 9: Computer Model A – Big Box Store Under Title 24 2008 Compliance
Luminaire Description Watts per
Fixture
Fixture
Lumens LLF Quantity
4 Ft 2 Lamp T5/HO
Industrial Fluorescent
Electronic Ballast
88 10,000 0.72 63
4 Ft 6 Lamp T5/HO
Specular Reflector
Electronic Ballast
324 30,000 0.72 452
Figure 10: Computer Model A1 – Big Box Store New Luminaire Technology & IESNA
Standards

Page 82
2013 California Building Energy Efficiency Standards 2nd
Draft Report March 6, 2011]
6.4 Appendix III High Atrium Store
Figure 11: High Center Atrium Store (Model B)
Model B represents a large store with a high center atrium. A prototype similar to a book store is
used which includes a variety of sub-area lighting design opportunities. Many other retail stores fit
this category using a center light-well to use daylighting. The higher ceilings allow the designer to
take advantage of Ceramic Metal Halide (CMH). A CMH luminaire with narrow beam optics is very
effective at ceiling heights between 15 to 25 feet.
Figure 12: High Atrium Retail
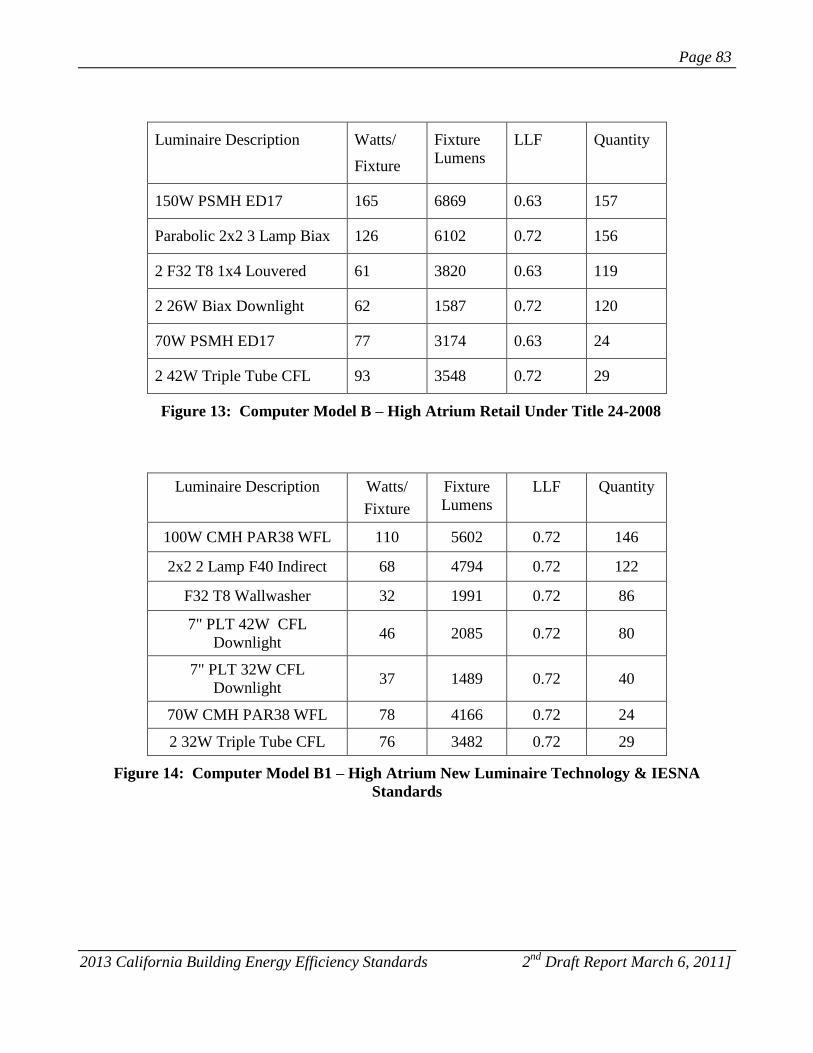
Page 83
2013 California Building Energy Efficiency Standards 2nd
Draft Report March 6, 2011]
Luminaire Description Watts/
Fixture
Fixture
Lumens
LLF Quantity
150W PSMH ED17 165 6869 0.63 157
Parabolic 2x2 3 Lamp Biax 126 6102 0.72 156
2 F32 T8 1x4 Louvered 61 3820 0.63 119
2 26W Biax Downlight 62 1587 0.72 120
70W PSMH ED17 77 3174 0.63 24
2 42W Triple Tube CFL 93 3548 0.72 29
Figure 13: Computer Model B – High Atrium Retail Under Title 24-2008
Luminaire Description Watts/
Fixture
Fixture
Lumens
LLF Quantity
100W CMH PAR38 WFL 110 5602 0.72 146
2x2 2 Lamp F40 Indirect 68 4794 0.72 122
F32 T8 Wallwasher 32 1991 0.72 86
7" PLT 42W CFL
Downlight 46 2085 0.72 80
7" PLT 32W CFL
Downlight 37 1489 0.72 40
70W CMH PAR38 WFL 78 4166 0.72 24
2 32W Triple Tube CFL 76 3482 0.72 29
Figure 14: Computer Model B1 – High Atrium New Luminaire Technology & IESNA
Standards
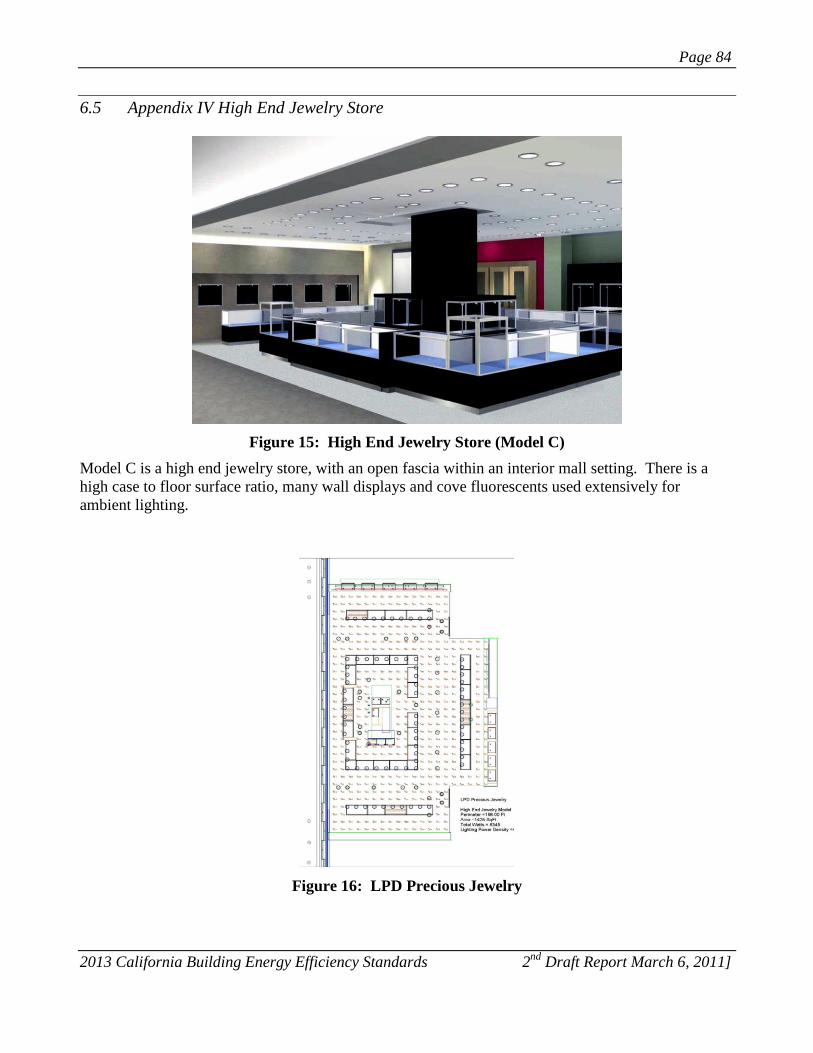
Page 84
2013 California Building Energy Efficiency Standards 2nd
Draft Report March 6, 2011]
6.5 Appendix IV High End Jewelry Store
Figure 15: High End Jewelry Store (Model C)
Model C is a high end jewelry store, with an open fascia within an interior mall setting. There is a
high case to floor surface ratio, many wall displays and cove fluorescents used extensively for
ambient lighting.
Figure 16: LPD Precious Jewelry
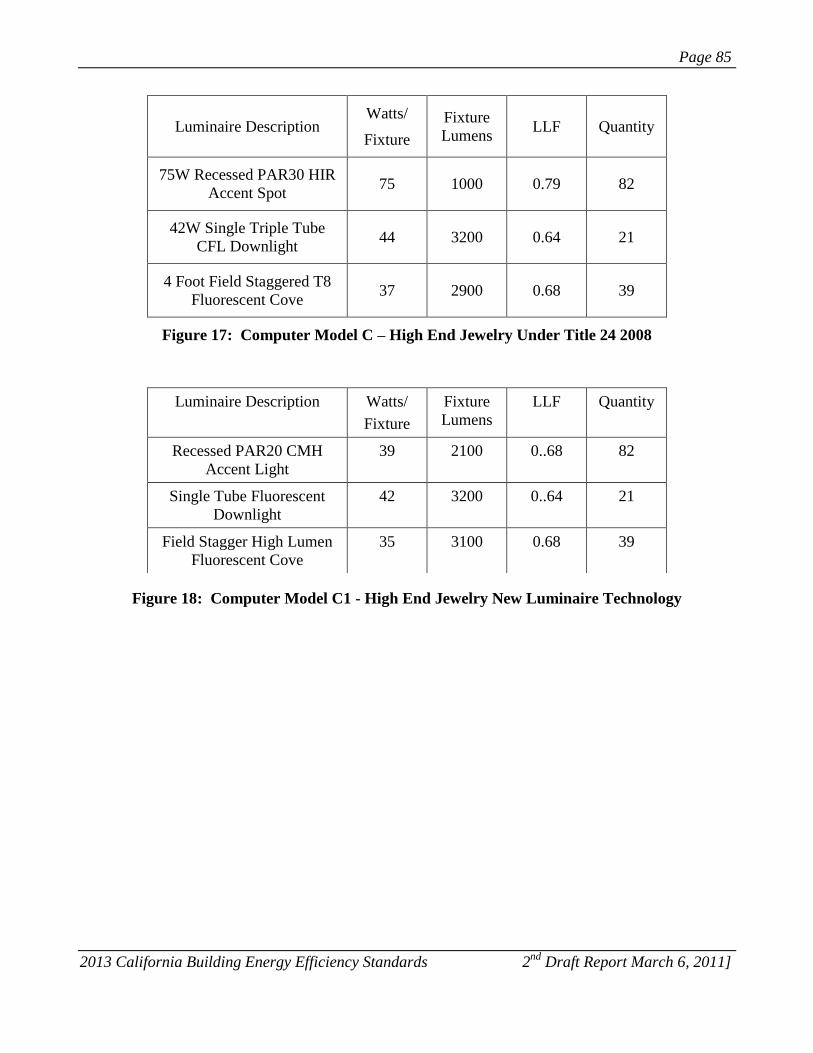
Page 85
2013 California Building Energy Efficiency Standards 2nd
Draft Report March 6, 2011]
Luminaire Description Watts/
Fixture
Fixture
Lumens LLF Quantity
75W Recessed PAR30 HIR
Accent Spot 75 1000 0.79 82
42W Single Triple Tube
CFL Downlight 44 3200 0.64 21
4 Foot Field Staggered T8
Fluorescent Cove 37 2900 0.68 39
Figure 17: Computer Model C – High End Jewelry Under Title 24 2008
Figure 18: Computer Model C1 - High End Jewelry New Luminaire Technology
Luminaire Description Watts/
Fixture
Fixture
Lumens
LLF Quantity
Recessed PAR20 CMH
Accent Light
39 2100 0..68 82
Single Tube Fluorescent
Downlight
42 3200 0..64 21
Field Stagger High Lumen
Fluorescent Cove
35 3100 0.68 39
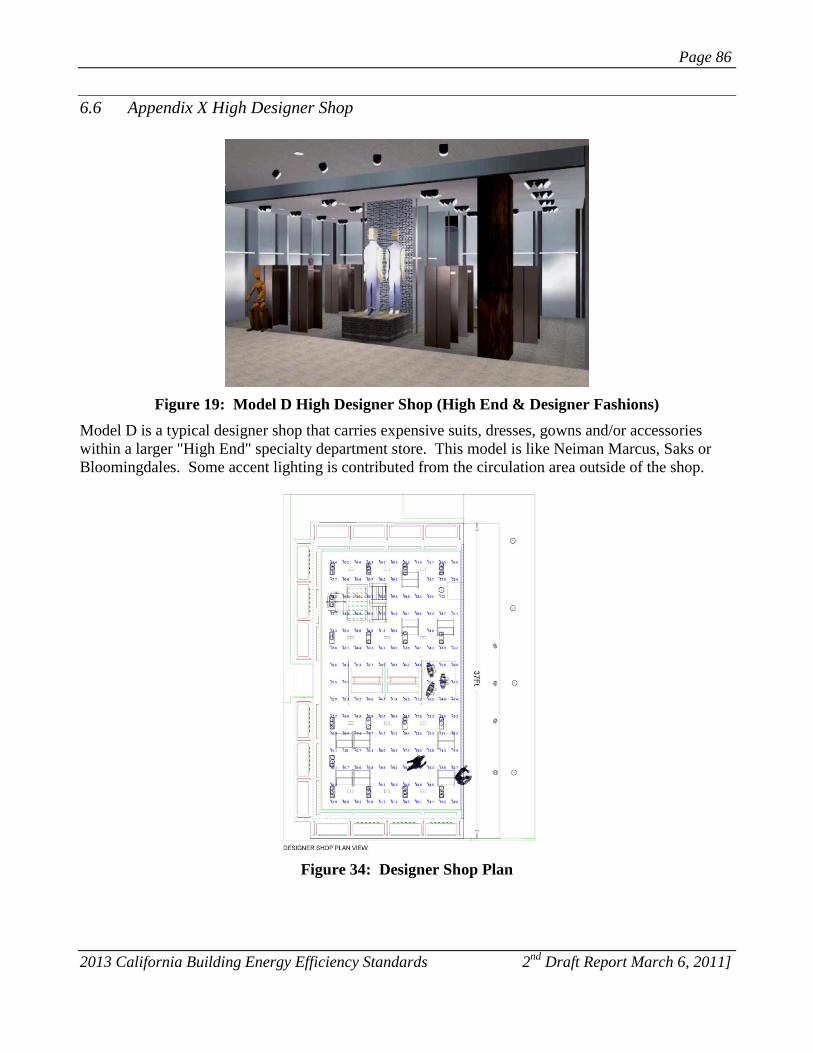
Page 86
2013 California Building Energy Efficiency Standards 2nd
Draft Report March 6, 2011]
6.6 Appendix X High Designer Shop
Figure 19: Model D High Designer Shop (High End & Designer Fashions)
Model D is a typical designer shop that carries expensive suits, dresses, gowns and/or accessories
within a larger "High End" specialty department store. This model is like Neiman Marcus, Saks or
Bloomingdales. Some accent lighting is contributed from the circulation area outside of the shop.
Figure 34: Designer Shop Plan

Page 87
2013 California Building Energy Efficiency Standards 2nd
Draft Report March 6, 2011]
Luminaire Description Watts/
Fixture
Fixture
Lumens LLF Quantity
Semi-Recessed Adjustable
Spot 60W PAR 38 Accent
Light
60 1000 0..79 59
Field Staggered Fluorescent
Cove T5 28 2900 0.68 14
Triple Tube CFL Downlight 44 3200 0.64 12
Figure 20: Computer Model D – Designer Shop Under Title 24-2008
Luminaire Description Watts/
Fixture
Fixture
Lumens LLF Quantity
20W T4 CMH Narrow Spot
Reflector Adjustable Accent
Light
25 1700 0.68 59
Field Staggered Fluorescent
Cove T5 28 2900 068 14
42W Triple Tube CFL
Downlight 44 3200 0.64 12
Figure 21: Computer Model D1 - Designer Shop New Luminaire Technology
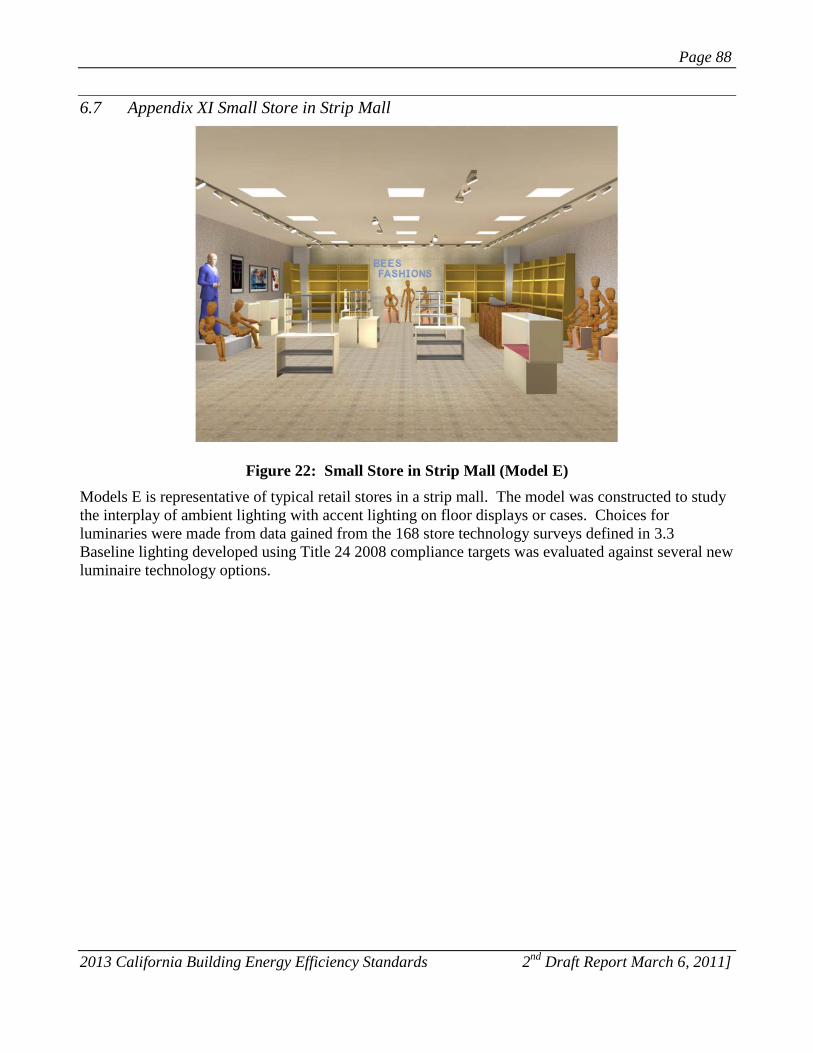
Page 88
2013 California Building Energy Efficiency Standards 2nd
Draft Report March 6, 2011]
6.7 Appendix XI Small Store in Strip Mall
Figure 22: Small Store in Strip Mall (Model E)
Models E is representative of typical retail stores in a strip mall. The model was constructed to study
the interplay of ambient lighting with accent lighting on floor displays or cases. Choices for
luminaries were made from data gained from the 168 store technology surveys defined in 3.3
Baseline lighting developed using Title 24 2008 compliance targets was evaluated against several new
luminaire technology options.
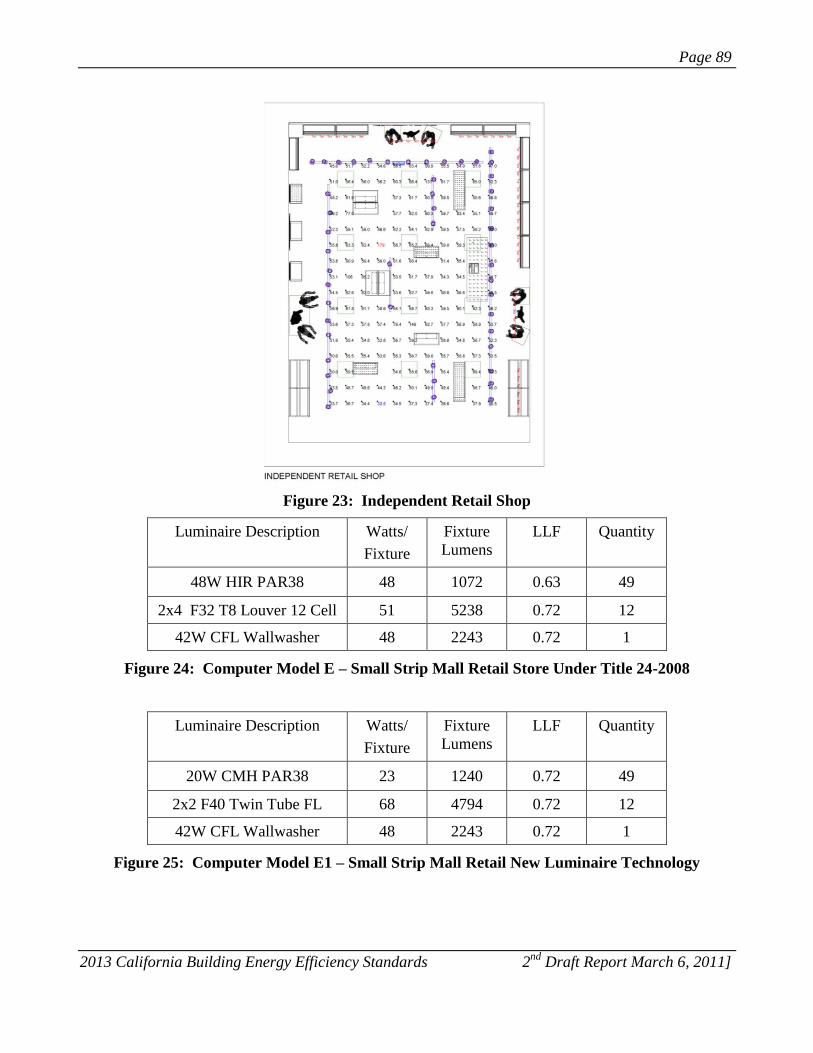
Page 89
2013 California Building Energy Efficiency Standards 2nd
Draft Report March 6, 2011]
Figure 23: Independent Retail Shop
Luminaire Description Watts/
Fixture
Fixture
Lumens
LLF Quantity
48W HIR PAR38 48 1072 0.63 49
2x4 F32 T8 Louver 12 Cell 51 5238 0.72 12
42W CFL Wallwasher 48 2243 0.72 1
Figure 24: Computer Model E – Small Strip Mall Retail Store Under Title 24-2008
Luminaire Description Watts/
Fixture
Fixture
Lumens
LLF Quantity
20W CMH PAR38 23 1240 0.72 49
2x2 F40 Twin Tube FL 68 4794 0.72 12
42W CFL Wallwasher 48 2243 0.72 1
Figure 25: Computer Model E1 – Small Strip Mall Retail New Luminaire Technology
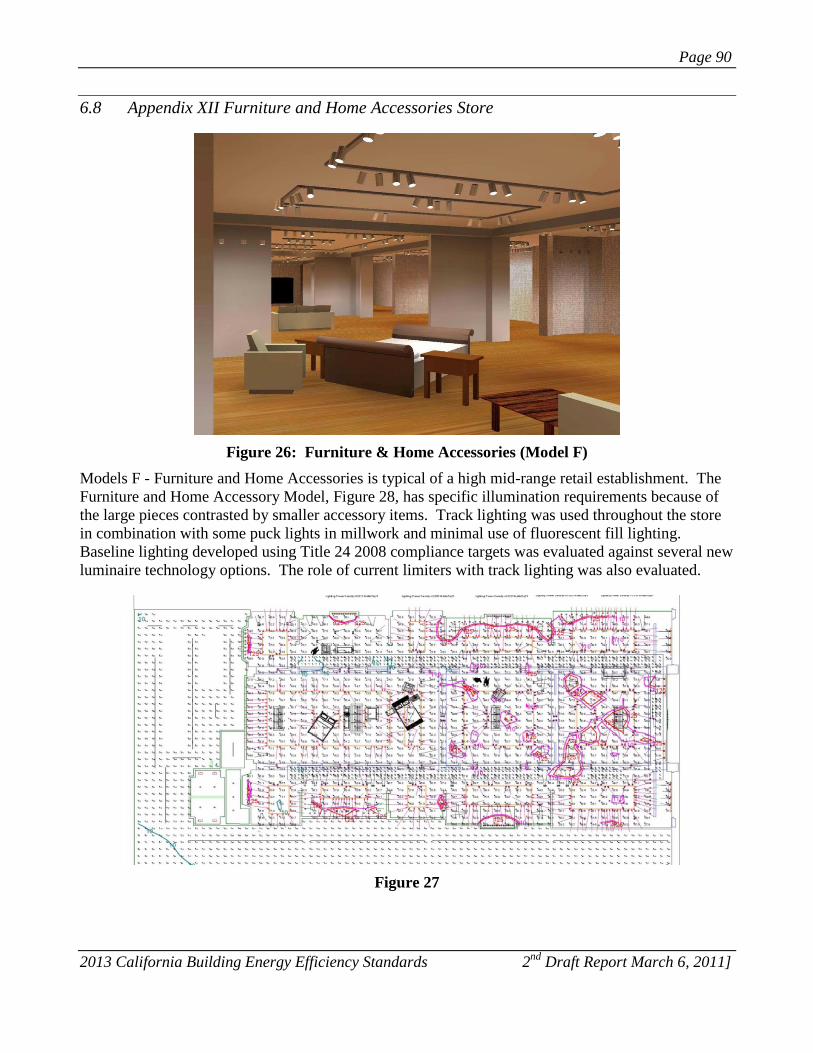
Page 90
2013 California Building Energy Efficiency Standards 2nd
Draft Report March 6, 2011]
6.8 Appendix XII Furniture and Home Accessories Store
Figure 26: Furniture & Home Accessories (Model F)
Models F - Furniture and Home Accessories is typical of a high mid-range retail establishment. The
Furniture and Home Accessory Model, Figure 28, has specific illumination requirements because of
the large pieces contrasted by smaller accessory items. Track lighting was used throughout the store
in combination with some puck lights in millwork and minimal use of fluorescent fill lighting.
Baseline lighting developed using Title 24 2008 compliance targets was evaluated against several new
luminaire technology options. The role of current limiters with track lighting was also evaluated.
Figure 27
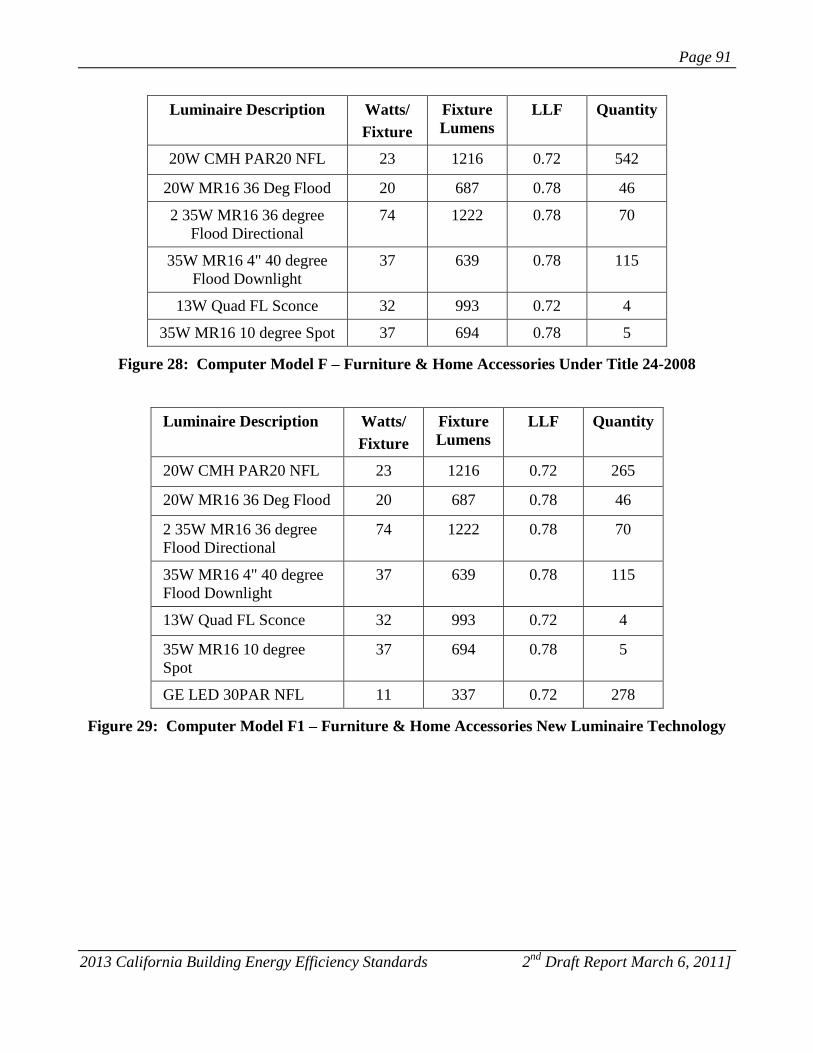
Page 91
2013 California Building Energy Efficiency Standards 2nd
Draft Report March 6, 2011]
Luminaire Description Watts/
Fixture
Fixture
Lumens
LLF Quantity
20W CMH PAR20 NFL 23 1216 0.72 542
20W MR16 36 Deg Flood 20 687 0.78 46
2 35W MR16 36 degree
Flood Directional
74 1222 0.78 70
35W MR16 4" 40 degree
Flood Downlight
37 639 0.78 115
13W Quad FL Sconce 32 993 0.72 4
35W MR16 10 degree Spot 37 694 0.78 5
Figure 28: Computer Model F – Furniture & Home Accessories Under Title 24-2008
Luminaire Description Watts/
Fixture
Fixture
Lumens
LLF Quantity
20W CMH PAR20 NFL 23 1216 0.72 265
20W MR16 36 Deg Flood 20 687 0.78 46
2 35W MR16 36 degree
Flood Directional
74 1222 0.78 70
35W MR16 4" 40 degree
Flood Downlight
37 639 0.78 115
13W Quad FL Sconce 32 993 0.72 4
35W MR16 10 degree
Spot
37 694 0.78 5
GE LED 30PAR NFL 11 337 0.72 278
Figure 29: Computer Model F1 – Furniture & Home Accessories New Luminaire Technology
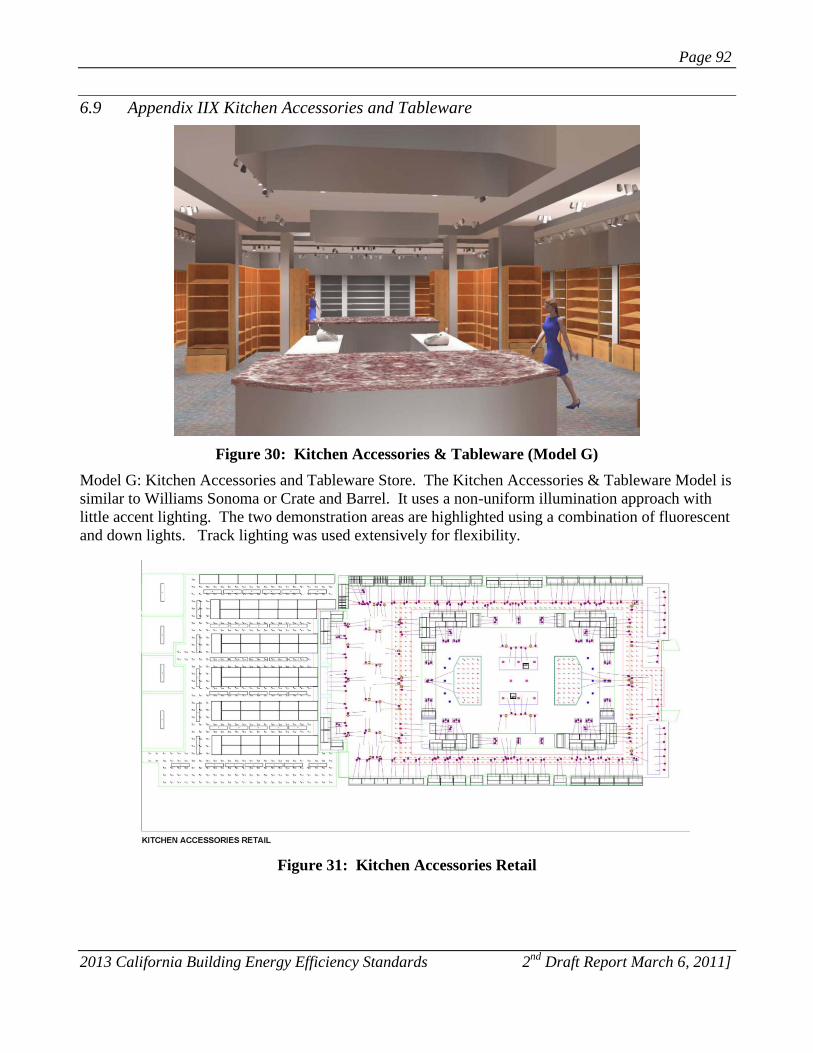
Page 92
2013 California Building Energy Efficiency Standards 2nd
Draft Report March 6, 2011]
6.9 Appendix IIX Kitchen Accessories and Tableware
Figure 30: Kitchen Accessories & Tableware (Model G)
Model G: Kitchen Accessories and Tableware Store. The Kitchen Accessories & Tableware Model is
similar to Williams Sonoma or Crate and Barrel. It uses a non-uniform illumination approach with
little accent lighting. The two demonstration areas are highlighted using a combination of fluorescent
and down lights. Track lighting was used extensively for flexibility.
Figure 31: Kitchen Accessories Retail
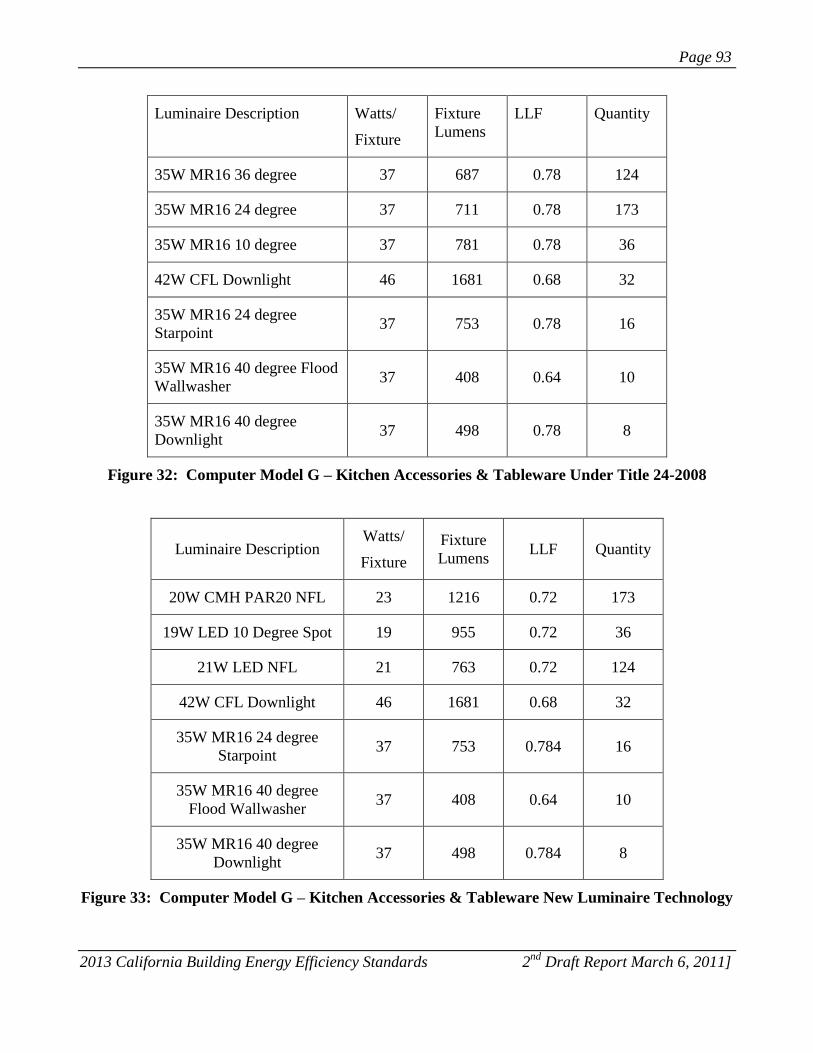
Page 93
2013 California Building Energy Efficiency Standards 2nd
Draft Report March 6, 2011]
Luminaire Description Watts/
Fixture
Fixture
Lumens
LLF Quantity
35W MR16 36 degree 37 687 0.78 124
35W MR16 24 degree 37 711 0.78 173
35W MR16 10 degree 37 781 0.78 36
42W CFL Downlight 46 1681 0.68 32
35W MR16 24 degree
Starpoint 37 753 0.78 16
35W MR16 40 degree Flood
Wallwasher 37 408 0.64 10
35W MR16 40 degree
Downlight 37 498 0.78 8
Figure 32: Computer Model G – Kitchen Accessories & Tableware Under Title 24-2008
Luminaire Description Watts/
Fixture
Fixture
Lumens LLF Quantity
20W CMH PAR20 NFL 23 1216 0.72 173
19W LED 10 Degree Spot 19 955 0.72 36
21W LED NFL 21 763 0.72 124
42W CFL Downlight 46 1681 0.68 32
35W MR16 24 degree
Starpoint 37 753 0.784 16
35W MR16 40 degree
Flood Wallwasher 37 408 0.64 10
35W MR16 40 degree
Downlight 37 498 0.784 8
Figure 33: Computer Model G – Kitchen Accessories & Tableware New Luminaire Technology
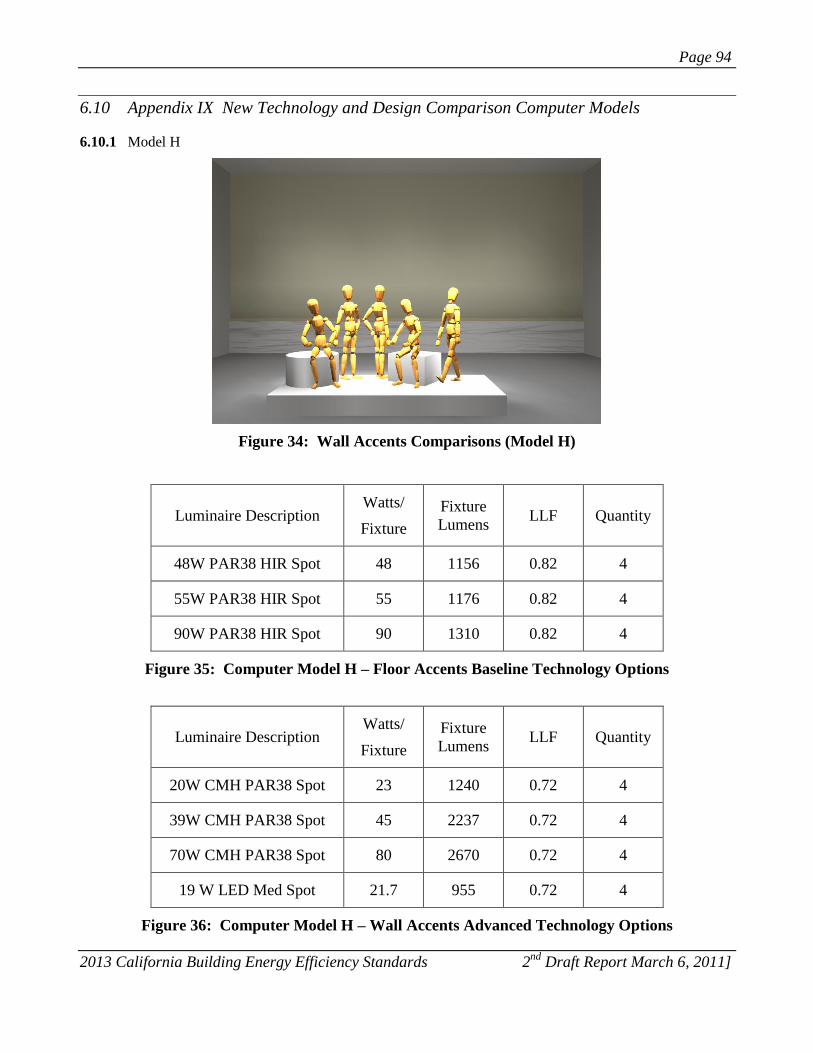
Page 94
2013 California Building Energy Efficiency Standards 2nd
Draft Report March 6, 2011]
6.10 Appendix IX New Technology and Design Comparison Computer Models
6.10.1 Model H
Figure 34: Wall Accents Comparisons (Model H)
Luminaire Description Watts/
Fixture
Fixture
Lumens LLF Quantity
48W PAR38 HIR Spot 48 1156 0.82 4
55W PAR38 HIR Spot 55 1176 0.82 4
90W PAR38 HIR Spot 90 1310 0.82 4
Figure 35: Computer Model H – Floor Accents Baseline Technology Options
Luminaire Description Watts/
Fixture
Fixture
Lumens LLF Quantity
20W CMH PAR38 Spot 23 1240 0.72 4
39W CMH PAR38 Spot 45 2237 0.72 4
70W CMH PAR38 Spot 80 2670 0.72 4
19 W LED Med Spot 21.7 955 0.72 4
Figure 36: Computer Model H – Wall Accents Advanced Technology Options
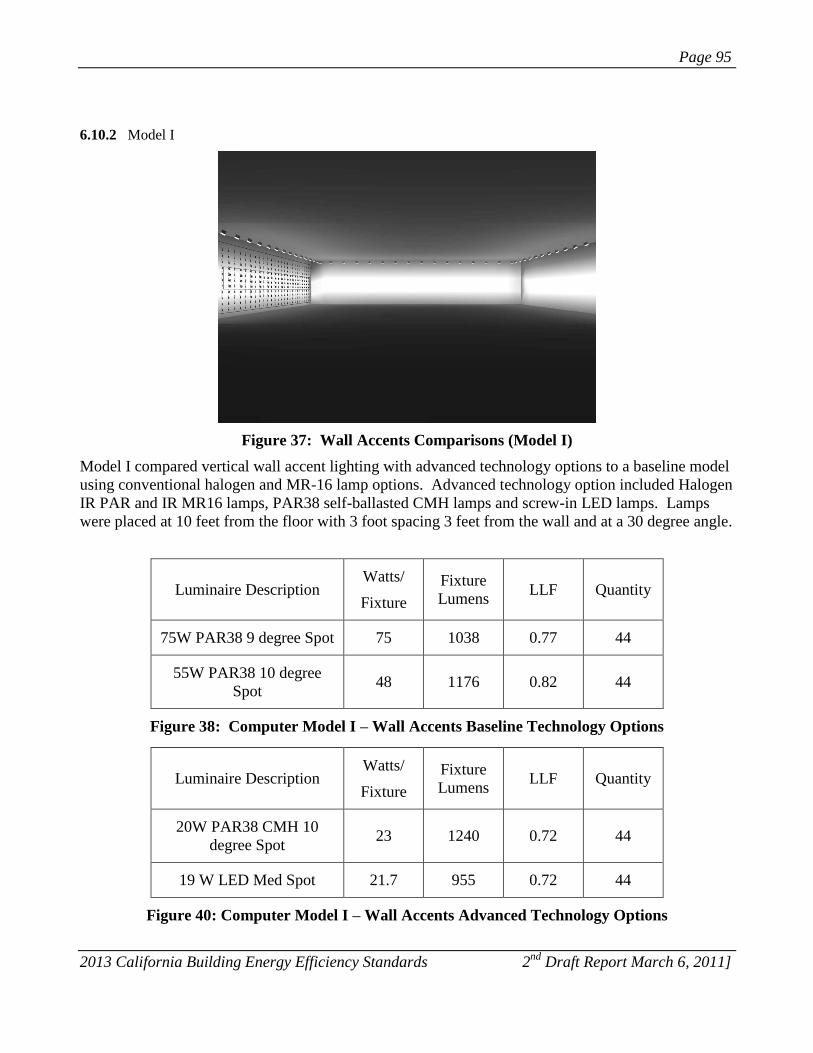
Page 95
2013 California Building Energy Efficiency Standards 2nd
Draft Report March 6, 2011]
6.10.2 Model I
Figure 37: Wall Accents Comparisons (Model I)
Model I compared vertical wall accent lighting with advanced technology options to a baseline model
using conventional halogen and MR-16 lamp options. Advanced technology option included Halogen
IR PAR and IR MR16 lamps, PAR38 self-ballasted CMH lamps and screw-in LED lamps. Lamps
were placed at 10 feet from the floor with 3 foot spacing 3 feet from the wall and at a 30 degree angle.
Luminaire Description Watts/
Fixture
Fixture
Lumens LLF Quantity
75W PAR38 9 degree Spot 75 1038 0.77 44
55W PAR38 10 degree
Spot 48 1176 0.82 44
Figure 38: Computer Model I – Wall Accents Baseline Technology Options
Luminaire Description Watts/
Fixture
Fixture
Lumens LLF Quantity
20W PAR38 CMH 10
degree Spot 23 1240 0.72 44
19 W LED Med Spot 21.7 955 0.72 44
Figure 40: Computer Model I – Wall Accents Advanced Technology Options
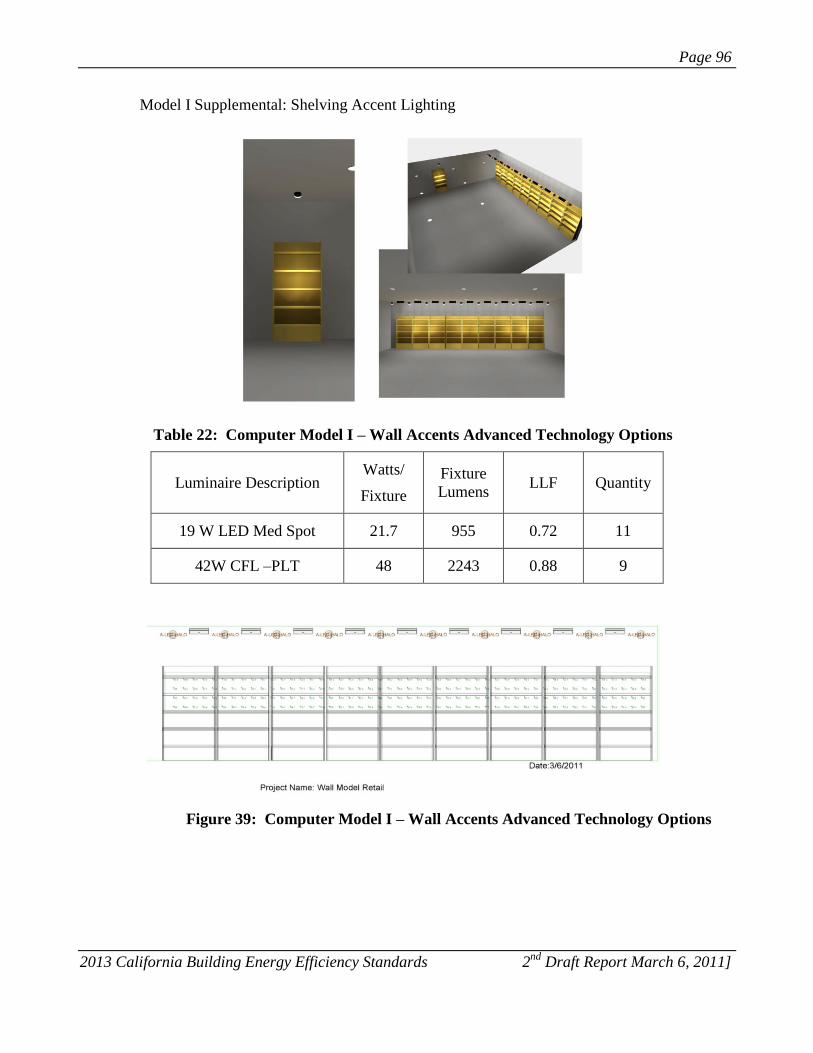
Page 96
2013 California Building Energy Efficiency Standards 2nd
Draft Report March 6, 2011]
Model I Supplemental: Shelving Accent Lighting
Table 22: Computer Model I – Wall Accents Advanced Technology Options
Luminaire Description Watts/
Fixture
Fixture
Lumens LLF Quantity
19 W LED Med Spot 21.7 955 0.72 11
42W CFL –PLT 48 2243 0.88 9
Figure 39: Computer Model I – Wall Accents Advanced Technology Options
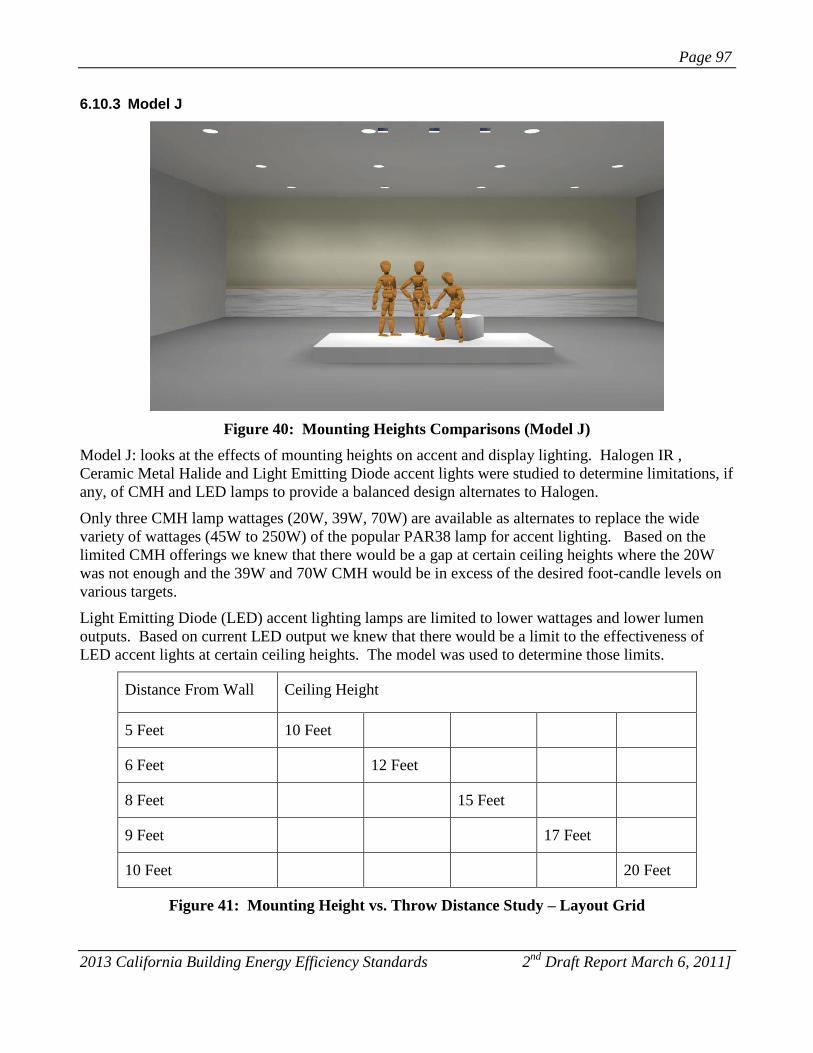
Page 97
2013 California Building Energy Efficiency Standards 2nd
Draft Report March 6, 2011]
6.10.3 Model J
Figure 40: Mounting Heights Comparisons (Model J)
Model J: looks at the effects of mounting heights on accent and display lighting. Halogen IR ,
Ceramic Metal Halide and Light Emitting Diode accent lights were studied to determine limitations, if
any, of CMH and LED lamps to provide a balanced design alternates to Halogen.
Only three CMH lamp wattages (20W, 39W, 70W) are available as alternates to replace the wide
variety of wattages (45W to 250W) of the popular PAR38 lamp for accent lighting. Based on the
limited CMH offerings we knew that there would be a gap at certain ceiling heights where the 20W
was not enough and the 39W and 70W CMH would be in excess of the desired foot-candle levels on
various targets.
Light Emitting Diode (LED) accent lighting lamps are limited to lower wattages and lower lumen
outputs. Based on current LED output we knew that there would be a limit to the effectiveness of
LED accent lights at certain ceiling heights. The model was used to determine those limits.
Distance From Wall Ceiling Height
5 Feet 10 Feet
6 Feet 12 Feet
8 Feet 15 Feet
9 Feet 17 Feet
10 Feet 20 Feet
Figure 41: Mounting Height vs. Throw Distance Study – Layout Grid
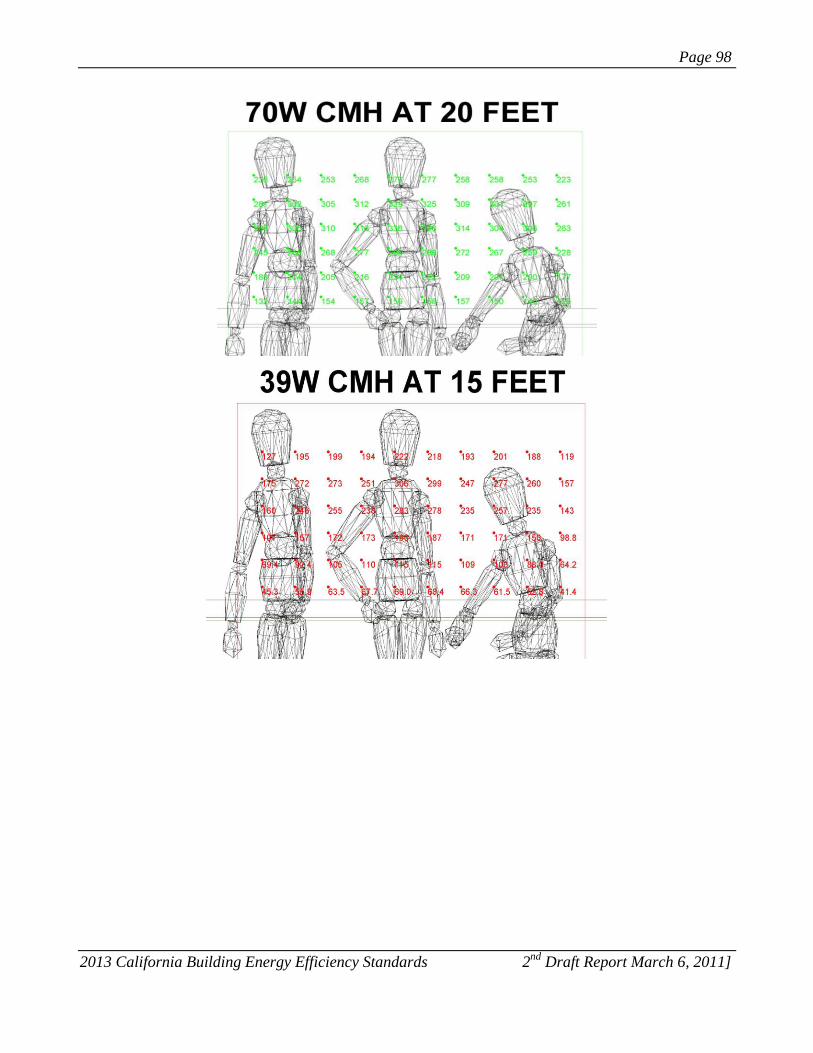
Page 98
2013 California Building Energy Efficiency Standards 2nd
Draft Report March 6, 2011]
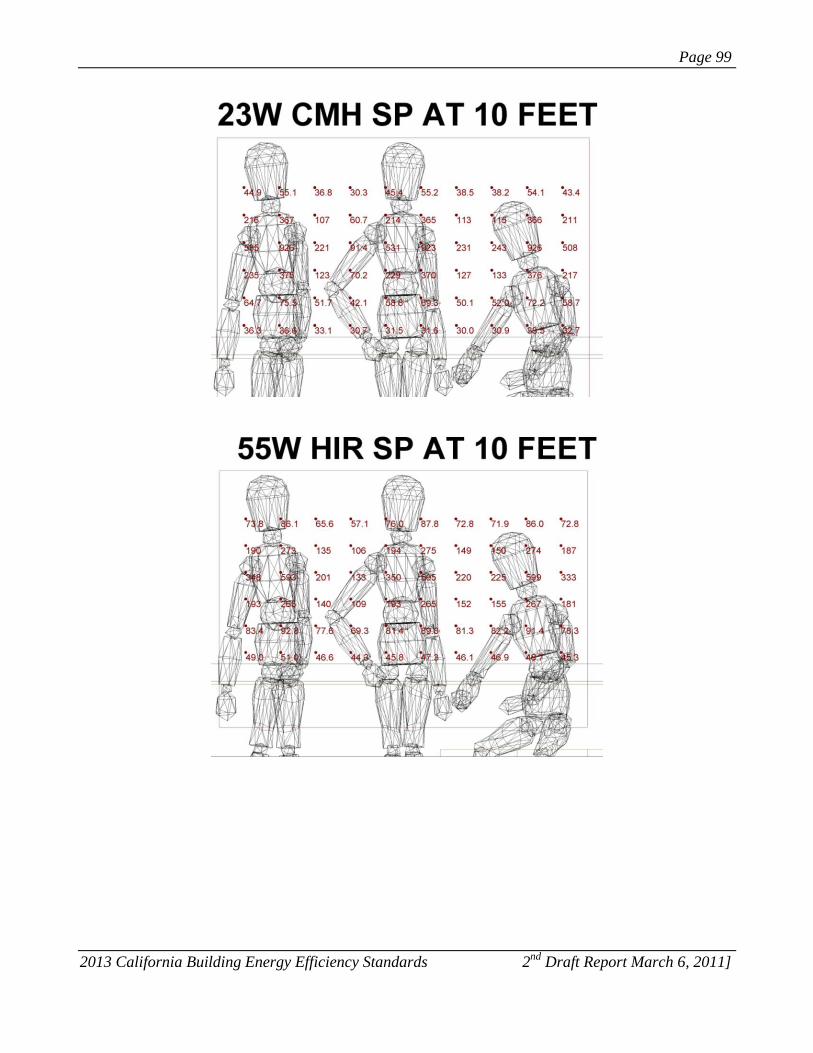
Page 99
2013 California Building Energy Efficiency Standards 2nd
Draft Report March 6, 2011]
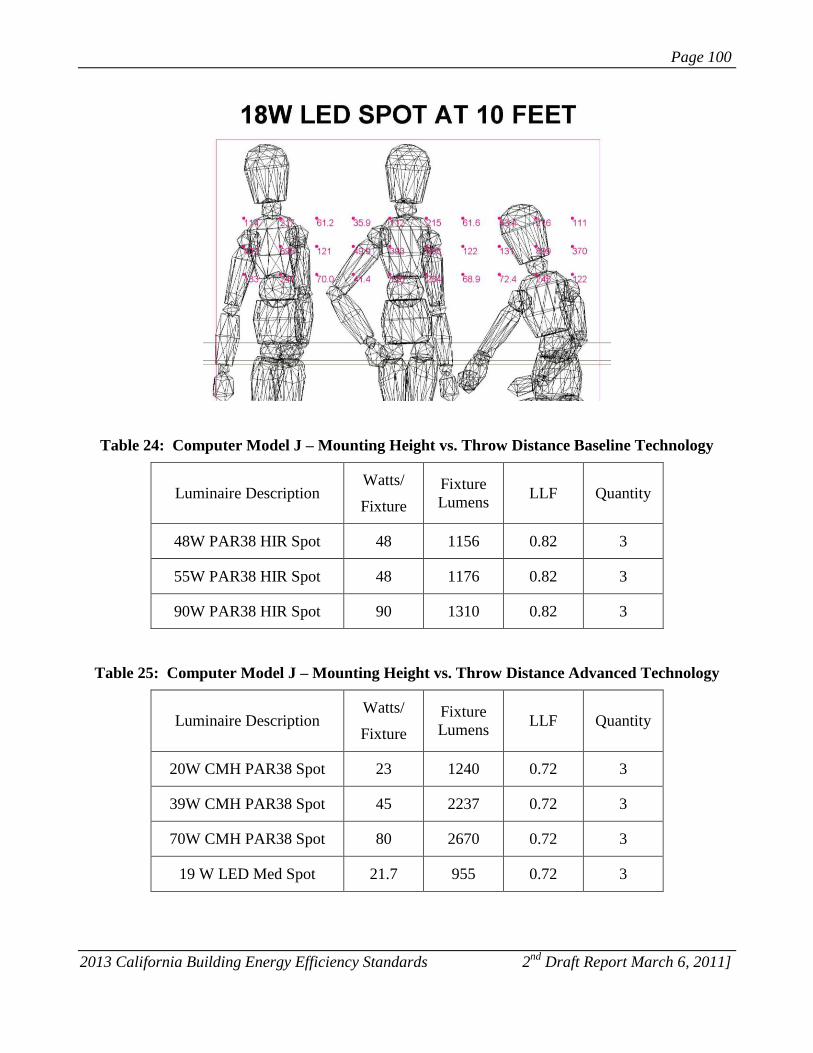
Page 100
2013 California Building Energy Efficiency Standards 2nd
Draft Report March 6, 2011]
Table 24: Computer Model J – Mounting Height vs. Throw Distance Baseline Technology
Luminaire Description Watts/
Fixture
Fixture
Lumens LLF Quantity
48W PAR38 HIR Spot 48 1156 0.82 3
55W PAR38 HIR Spot 48 1176 0.82 3
90W PAR38 HIR Spot 90 1310 0.82 3
Table 25: Computer Model J – Mounting Height vs. Throw Distance Advanced Technology
Luminaire Description Watts/
Fixture
Fixture
Lumens LLF Quantity
20W CMH PAR38 Spot 23 1240 0.72 3
39W CMH PAR38 Spot 45 2237 0.72 3
70W CMH PAR38 Spot 80 2670 0.72 3
19 W LED Med Spot 21.7 955 0.72 3