Draft - Leeds Left Shift Blueprint
122
Building healthier communities Draft - Leeds Left Shift Blueprint January 2021
Transcript of Draft - Leeds Left Shift Blueprint

Building healthier communities
Draft - Leeds Left Shift Blueprint January 2021
Building healthier communities
Left Shift Blueprint - Contents
No Section Page
1.0 Introduction 3 - 4
2.0 Background 5 - 7
3.0 Our Strategic Ambitions 8 - 10
4.0 How we will get there 11 – 13
4.1 – Maternity 14
4.2 – Children’s Mental Health and Wellbeing 15
4.3 – Children and Young People with Special Educational Needs
16
4.4 – Children with Long Term Conditions 17
4.5 – Healthy population 18
4.6 - Mental Health 19
4.7 – Learning Disabilities and Autism 20
4.8 – Long Term Conditions 21
No Section Page
4.9 – Cancer 22
4.10 – Frailty 23
4.11 – End of Life 24
5.0 Building the Leeds Way 25
6.0 Impact on Enablers 26
7.0 How we will make the change happen 27
8.0 Holding ourselves to account 28
9.0 Next Steps 29
App 1 Current performance against strategic indicators 30 - 49
App 2 Interface between strategic ambitions and programmes 50
App 3 Programme Priorities 51 - 65
App 4 Current performance against programme measures 66 - 122
2
Building healthier communities
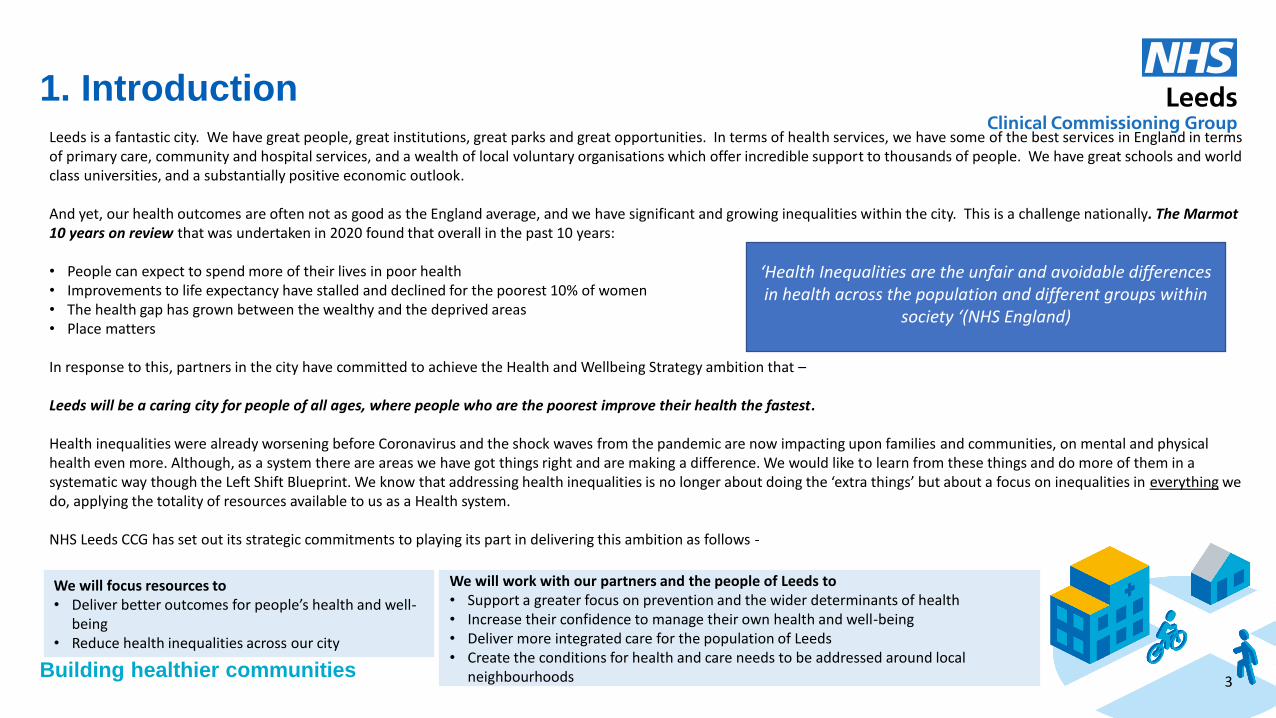
1. Introduction Leeds is a fantastic city. We have great people, great institutions, great parks and great opportunities. In terms of health services, we have some of the best services in England in terms of primary care, community and hospital services, and a wealth of local voluntary organisations which offer incredible support to thousands of people. We have great schools and world class universities, and a substantially positive economic outlook. And yet, our health outcomes are often not as good as the England average, and we have significant and growing inequalities within the city. This is a challenge nationally. The Marmot 10 years on review that was undertaken in 2020 found that overall in the past 10 years: • People can expect to spend more of their lives in poor health • Improvements to life expectancy have stalled and declined for the poorest 10% of women • The health gap has grown between the wealthy and the deprived areas • Place matters In response to this, partners in the city have committed to achieve the Health and Wellbeing Strategy ambition that – Leeds will be a caring city for people of all ages, where people who are the poorest improve their health the fastest. Health inequalities were already worsening before Coronavirus and the shock waves from the pandemic are now impacting upon families and communities, on mental and physical health even more. Although, as a system there are areas we have got things right and are making a difference. We would like to learn from these things and do more of them in a systematic way though the Left Shift Blueprint. We know that addressing health inequalities is no longer about doing the ‘extra things’ but about a focus on inequalities in everything we do, applying the totality of resources available to us as a Health system. NHS Leeds CCG has set out its strategic commitments to playing its part in delivering this ambition as follows -
3
‘Health Inequalities are the unfair and avoidable differences in health across the population and different groups within
society ‘(NHS England)
We will focus resources to • Deliver better outcomes for people’s health and well-
being • Reduce health inequalities across our city
We will work with our partners and the people of Leeds to • Support a greater focus on prevention and the wider determinants of health • Increase their confidence to manage their own health and well-being • Deliver more integrated care for the population of Leeds • Create the conditions for health and care needs to be addressed around local
neighbourhoods
Building healthier communities
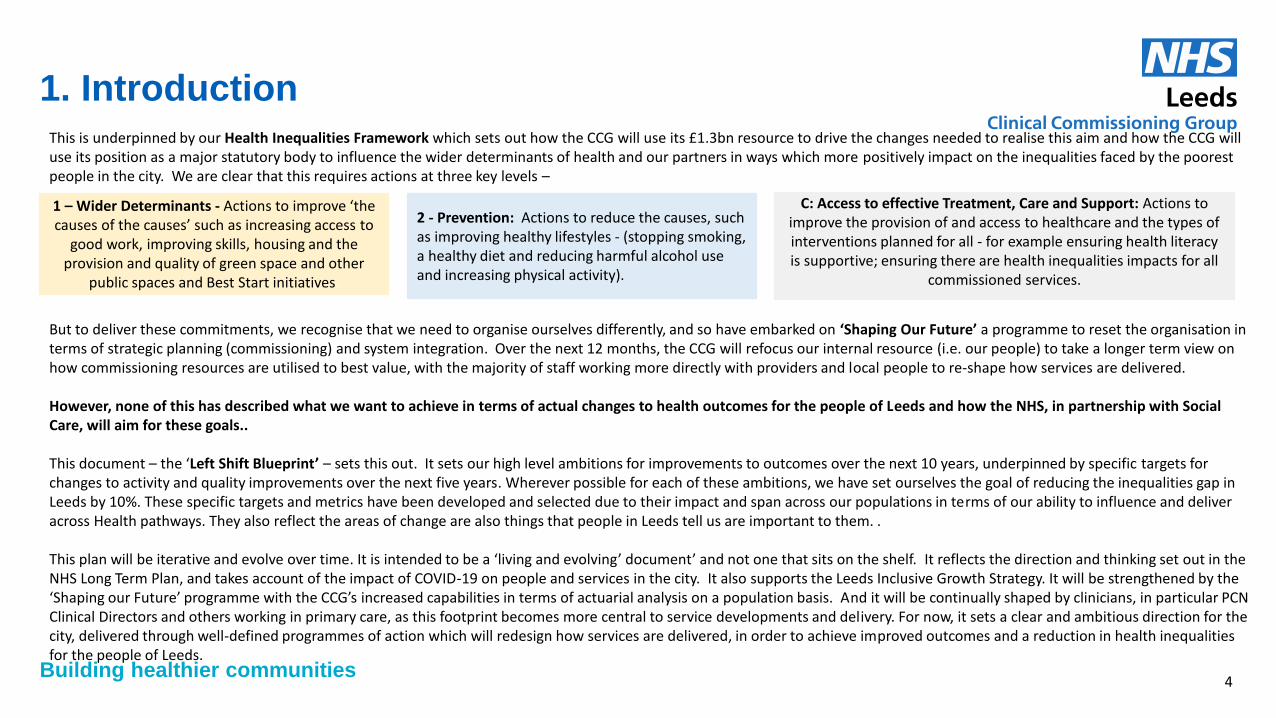
1. Introduction This is underpinned by our Health Inequalities Framework which sets out how the CCG will use its £1.3bn resource to drive the changes needed to realise this aim and how the CCG will use its position as a major statutory body to influence the wider determinants of health and our partners in ways which more positively impact on the inequalities faced by the poorest people in the city. We are clear that this requires actions at three key levels – But to deliver these commitments, we recognise that we need to organise ourselves differently, and so have embarked on ‘Shaping Our Future’ a programme to reset the organisation in terms of strategic planning (commissioning) and system integration. Over the next 12 months, the CCG will refocus our internal resource (i.e. our people) to take a longer term view on how commissioning resources are utilised to best value, with the majority of staff working more directly with providers and local people to re-shape how services are delivered. However, none of this has described what we want to achieve in terms of actual changes to health outcomes for the people of Leeds and how the NHS, in partnership with Social Care, will aim for these goals.. This document – the ‘Left Shift Blueprint’ – sets this out. It sets our high level ambitions for improvements to outcomes over the next 10 years, underpinned by specific targets for changes to activity and quality improvements over the next five years. Wherever possible for each of these ambitions, we have set ourselves the goal of reducing the inequalities gap in Leeds by 10%. These specific targets and metrics have been developed and selected due to their impact and span across our populations in terms of our ability to influence and deliver across Health pathways. They also reflect the areas of change are also things that people in Leeds tell us are important to them. . This plan will be iterative and evolve over time. It is intended to be a ‘living and evolving’ document’ and not one that sits on the shelf. It reflects the direction and thinking set out in the NHS Long Term Plan, and takes account of the impact of COVID-19 on people and services in the city. It also supports the Leeds Inclusive Growth Strategy. It will be strengthened by the ‘Shaping our Future’ programme with the CCG’s increased capabilities in terms of actuarial analysis on a population basis. And it will be continually shaped by clinicians, in particular PCN Clinical Directors and others working in primary care, as this footprint becomes more central to service developments and delivery. For now, it sets a clear and ambitious direction for the city, delivered through well-defined programmes of action which will redesign how services are delivered, in order to achieve improved outcomes and a reduction in health inequalities for the people of Leeds.
1 – Wider Determinants - Actions to improve ‘the causes of the causes’ such as increasing access to
good work, improving skills, housing and the provision and quality of green space and other
public spaces and Best Start initiatives.
2 - Prevention: Actions to reduce the causes, such as improving healthy lifestyles - (stopping smoking, a healthy diet and reducing harmful alcohol use and increasing physical activity).
C: Access to effective Treatment, Care and Support: Actions to
improve the provision of and access to healthcare and the types of interventions planned for all - for example ensuring health literacy is supportive; ensuring there are health inequalities impacts for all
commissioned services.
4
Building healthier communities
2. Background Why the Left Shift? Four ‘principles’ to define the left shift have been developed: 1. The population’s health overall will move from being more sick and dependent on
services, to living, ageing and dying well. We will have a much clearer focus on specified outcomes. For example, we know that improving outcomes in childhood is essential for better education, health and economic outcomes for a whole population.
2. For the population’s health to improve equitably and for us to reduce health inequalities, we will need to ensure services are focused better on the needs people who are socially economically disadvantaged ; inclusion groups and those at higher risk of poor health – so we will have specific goals across all relating to reducing inequalities.
3. In order to achieve this we will invest more resources in prevention and personalised proactive care – often (but not always*) resulting in more activity and care taking place in community settings including people’s homes – so we will have clear targets to measure how these activity levels will change.
4. People will be equal partners in their care, we will have clear measures to ensure high quality, personalised services are delivered focusing on what matter to people, .
(*We say not always, as sometimes, for people with a complex physical or mental health condition, the most proactive approach is to have access to specialist care as quickly as possible, which may be delivered from hospital.)
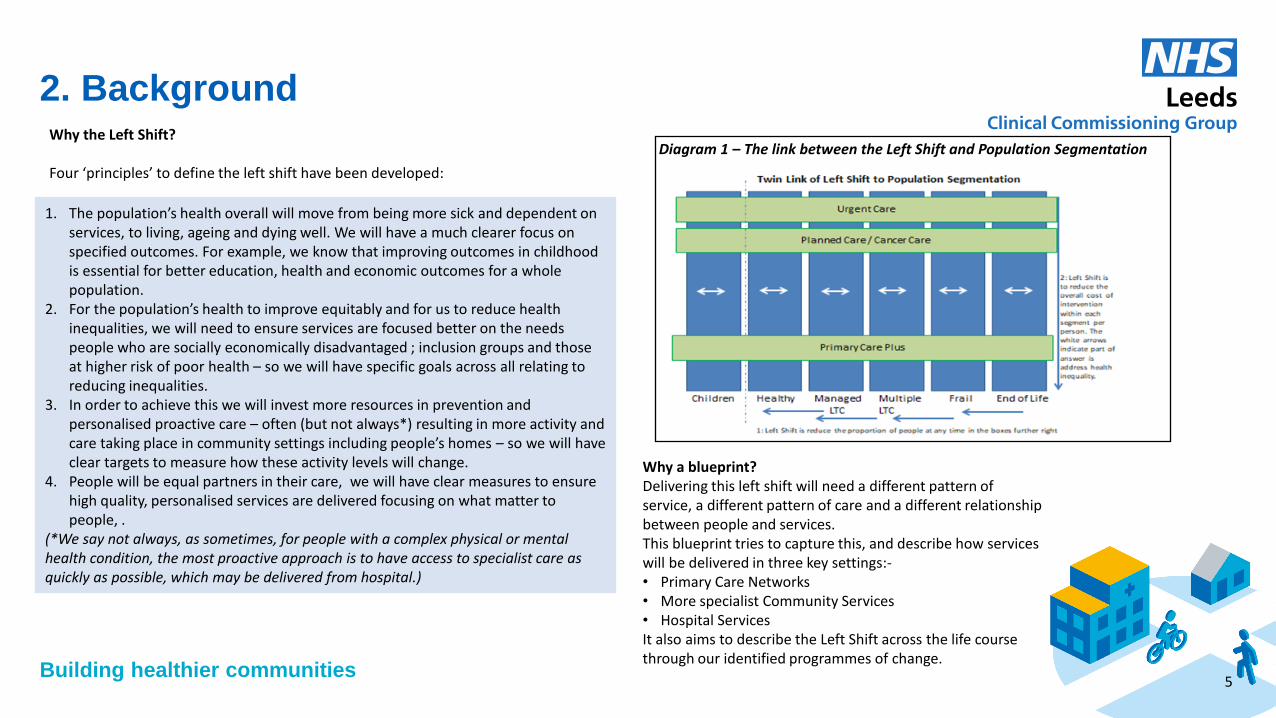
Why a blueprint? Delivering this left shift will need a different pattern of service, a different pattern of care and a different relationship between people and services. This blueprint tries to capture this, and describe how services will be delivered in three key settings:- • Primary Care Networks • More specialist Community Services • Hospital Services It also aims to describe the Left Shift across the life course through our identified programmes of change. 5
Diagram 1 – The link between the Left Shift and Population Segmentation
Building healthier communities
2. Background
How does this fit in with existing strategies for health improvement and service change? The city has a well-recognised Health and Wellbeing Strategy which sets the agenda for partners to come together to improve health and wellbeing in its widest sense. This is underpinned by the Leeds Health and Care Plan which sets out the key transformation initiatives to be delivered by health and care partners, and also feeds into the work of the West Yorkshire and Harrogate Integrated Care System. The Left Shift Blueprint sets out the CCG’s contribution to this, and how it will utilise our resources to engineer improvement in health outcomes and reduction in inequalities. The Left Shift Blueprint also reads across to Building the Leeds Way and is actively aligned with the Hospitals of the Future programme to re-build Leeds General Infirmary which requires a new model of care. It is also aligned to the city’s Economic Growth strategy (Inclusive Growth) particularly in relation to increasing opportunities for local people in employment both directly in the NHS as the workforce changes, but also more indirectly through social value principles being embedded in procurement plans, e.g. for estates or technology developments. There are also strong links to supporting the city’s plans around climate change. What is the structure of the Blueprint? The blueprint starts with setting out our strategic ambitions, with specific goals for improved outcomes, changes in activity and improvements to people’s experience of care. These have been termed our strategic indicators.
6
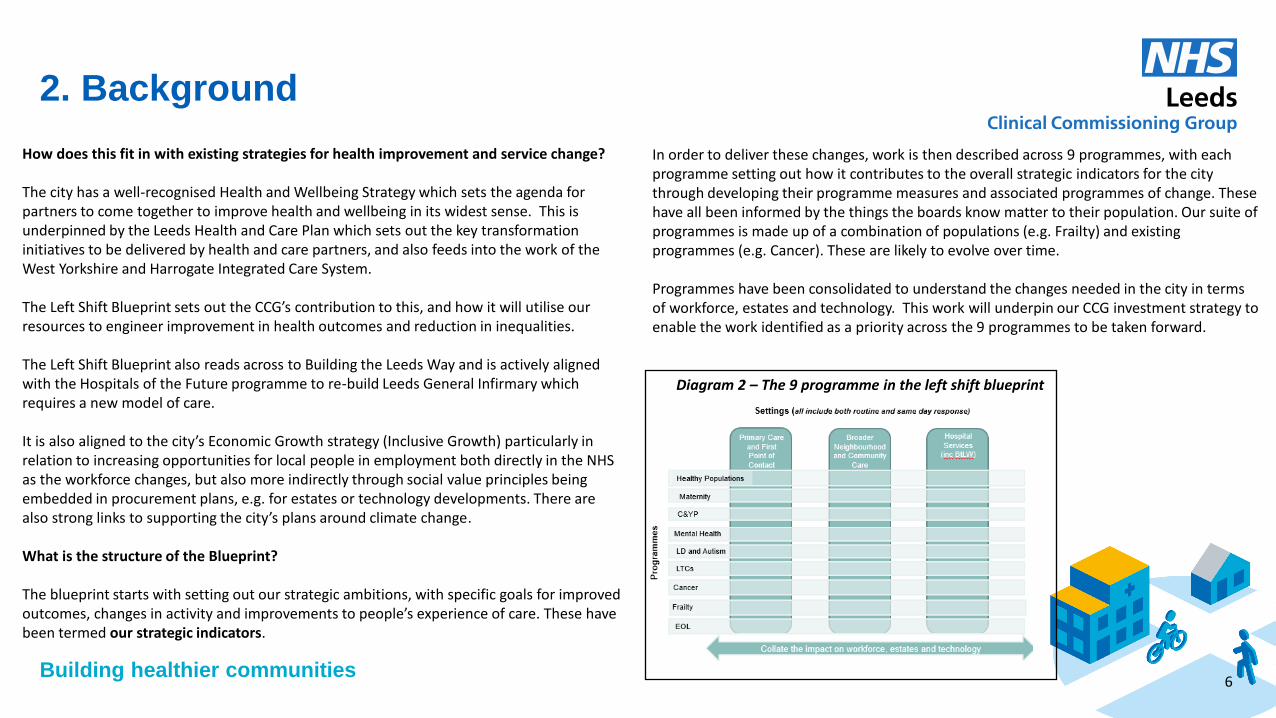
In order to deliver these changes, work is then described across 9 programmes, with each programme setting out how it contributes to the overall strategic indicators for the city through developing their programme measures and associated programmes of change. These have all been informed by the things the boards know matter to their population. Our suite of programmes is made up of a combination of populations (e.g. Frailty) and existing programmes (e.g. Cancer). These are likely to evolve over time. Programmes have been consolidated to understand the changes needed in the city in terms of workforce, estates and technology. This work will underpin our CCG investment strategy to enable the work identified as a priority across the 9 programmes to be taken forward.
Diagram 2 – The 9 programme in the left shift blueprint
Building healthier communities
2. Background
7
Personalised Care Our four principles to describe the left shift refer to personalised care. Personalised care means that ‘people have choice and control over the way their care is planned and delivered, based on what matters to them and their individual strengths, needs and preferences’. Achieving this requires a whole-system approach, integrating resources and services around the person including health, social care, community-based and wider services. At the core of personalised care is the ethos of ‘working with people’. It values the expertise and knowledge that people bring about their own health and care and by listening to what is important them, they can be supported to have meaningful and fulfilling lives.
How have system people and partners been involved in the development of the blueprint? It is essential that in everything we do we start with people. We work with people rather than doing things to them, maximising the assets, strengths and skills of Leeds citizens, carers and workforce. The work outlined in each of our programmes has been developed through engaging with people and we are committed to continually checking there is a strong correlation between the Left Shift Blueprint and the things that as a system people are telling us. There is commitment to continue to work closely with people to shape the Left Shift Blueprint and focus groups and interviews are being planned for 2021 to do this.
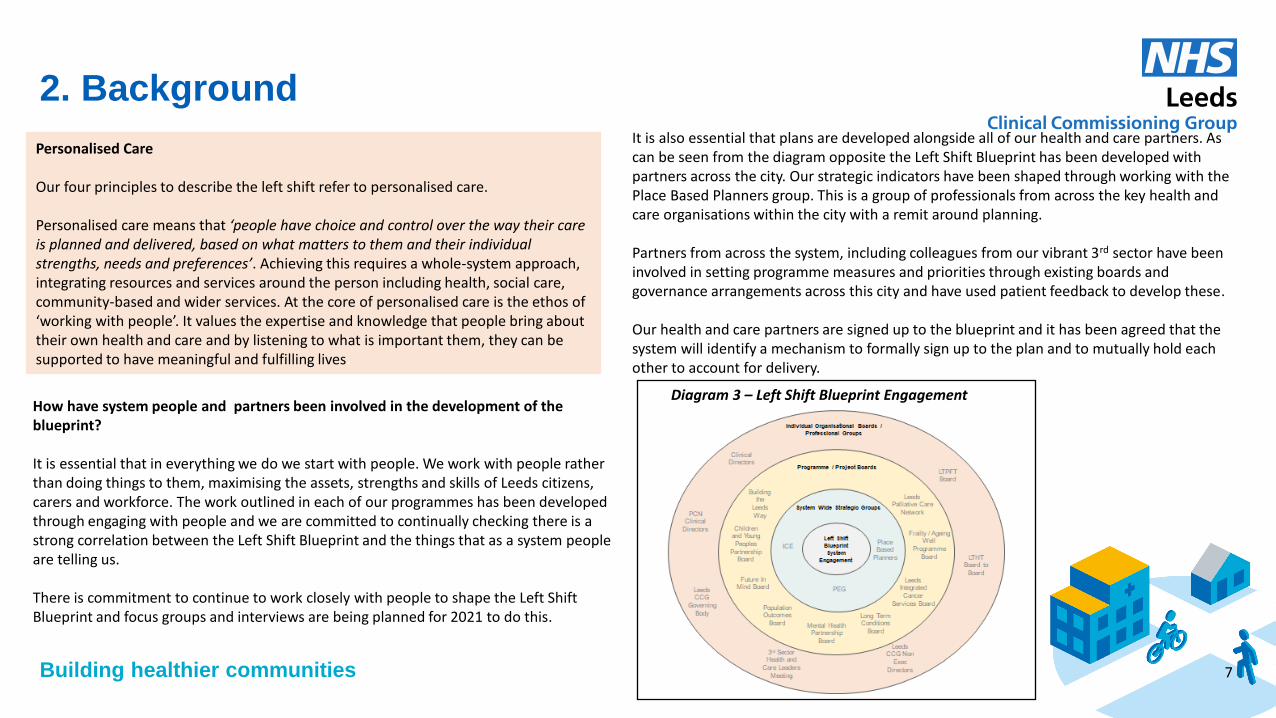
It is also essential that plans are developed alongside all of our health and care partners. As can be seen from the diagram opposite the Left Shift Blueprint has been developed with partners across the city. Our strategic indicators have been shaped through working with the Place Based Planners group. This is a group of professionals from across the key health and care organisations within the city with a remit around planning. Partners from across the system, including colleagues from our vibrant 3rd sector have been involved in setting programme measures and priorities through existing boards and governance arrangements across this city and have used patient feedback to develop these. Our health and care partners are signed up to the blueprint and it has been agreed that the system will identify a mechanism to formally sign up to the plan and to mutually hold each other to account for delivery.
Diagram 3 – Left Shift Blueprint Engagement

Building healthier communities
3. Our Strategic Ambitions
Our strategic ambitions have been set out through three types of Strategic Indicator:
It is proposed that for each of these strategic indicators, our ambition is to:- • Be as good as if not better than the England average • Where measurement allows – we will commit to reducing health inequalities between Leeds and deprived Leeds by 10% Whilst setting out our ambitions is important that as a system we are developing a culture of continuous improvement. If we meet our target of being better than the England average or reducing heath inequalities by 10% we must not stop improving the care we deliver to the population of Leeds. It is clear that purely targeting NHS resources towards meeting these strategic ambitions will not alone mean that they will be achieved. It will only be through galvanising the system around achieving them through our boards, groups, communities and harnessing our collective effort that they will be met.
1 – Health Outcome Ambitions - These are longer term indicators that we are looking at over a 10 year period.
2 – System Activity Metrics: These indicators will provide a more immediate view of impact and will be measured through the Leeds Data Model.
3 – Quality Experience Measures: These indicators should again provide a more immediate view of progress. They should provide us with a view not only of a persons experience of individual services but also of their experience as they move between services in the system.
These indicators provide the overarching framework that makes up ambition. The aim is that they: • Provide clarity on how we will know if we have met our strategic commitments. • Describe a ‘common language’ and direction for our individual programmes of work indicating the ‘bigger picture’ we are asking them to
contribute towards. • Support the CCG in prioritising our scarce resources – not only financial but also workforce. • Reflect the life-course. • Are measurable – many of them already being used to gauge the success of strategies and plans across the city. • Provide us with a balance between indicators that describe the short term shifts we have made in addition to the longer term improvements.
8
Building healthier communities
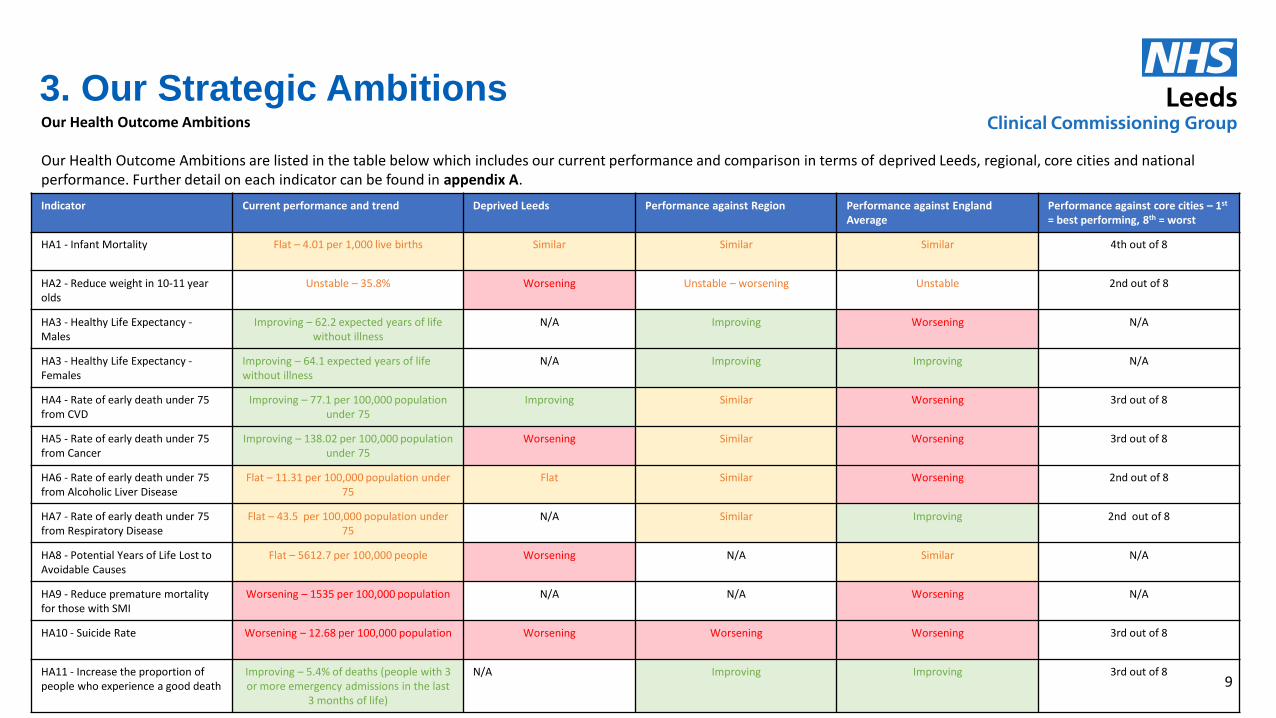
3. Our Strategic Ambitions Our Health Outcome Ambitions Our Health Outcome Ambitions are listed in the table below which includes our current performance and comparison in terms of deprived Leeds, regional, core cities and national performance. Further detail on each indicator can be found in appendix A.
Indicator Current performance and trend Deprived Leeds Performance against Region Performance against England Average
Performance against core cities – 1st = best performing, 8th = worst
HA1 - Infant Mortality Flat – 4.01 per 1,000 live births Similar Similar Similar 4th out of 8
HA2 - Reduce weight in 10-11 year olds
Unstable – 35.8% Worsening Unstable – worsening Unstable 2nd out of 8
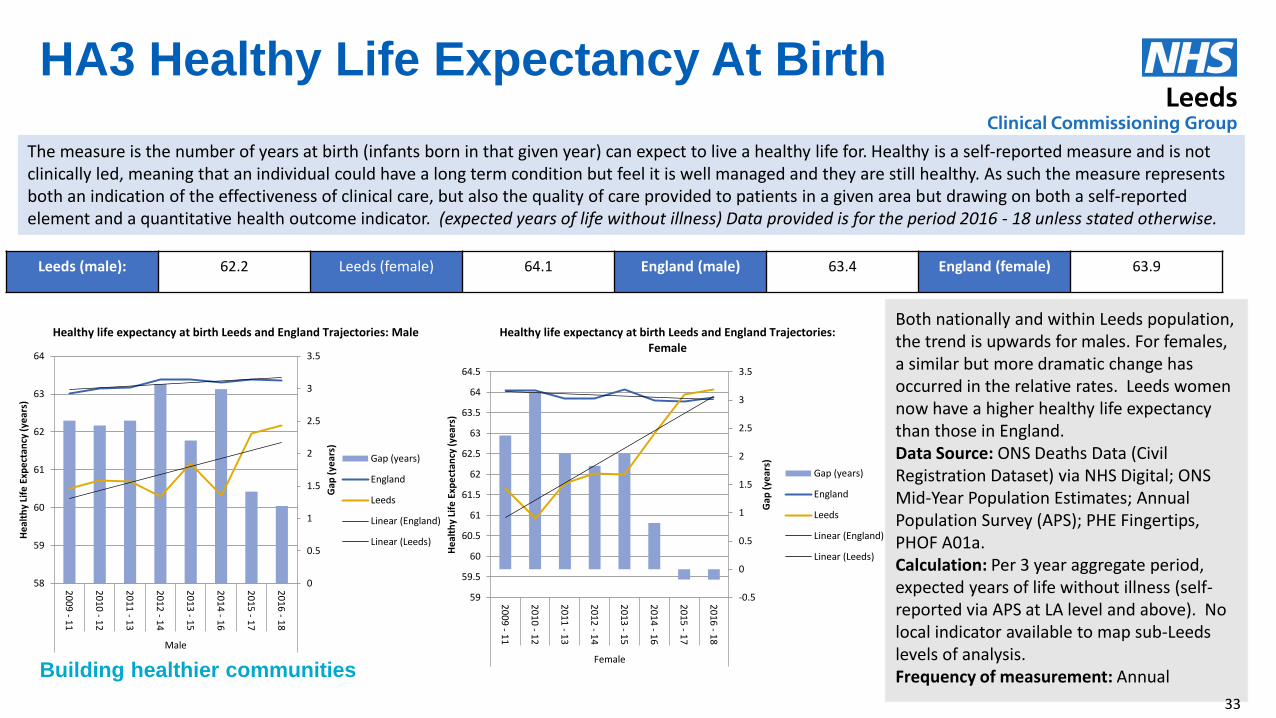
HA3 - Healthy Life Expectancy - Males
Improving – 62.2 expected years of life without illness
N/A Improving Worsening N/A
HA3 - Healthy Life Expectancy - Females
Improving – 64.1 expected years of life without illness
N/A Improving Improving N/A
HA4 - Rate of early death under 75 from CVD
Improving – 77.1 per 100,000 population under 75
Improving Similar Worsening 3rd out of 8
HA5 - Rate of early death under 75 from Cancer
Improving – 138.02 per 100,000 population under 75
Worsening Similar Worsening 3rd out of 8
HA6 - Rate of early death under 75 from Alcoholic Liver Disease
Flat – 11.31 per 100,000 population under 75
Flat Similar Worsening 2nd out of 8
HA7 - Rate of early death under 75 from Respiratory Disease
Flat – 43.5 per 100,000 population under 75
N/A Similar Improving 2nd out of 8
HA8 - Potential Years of Life Lost to Avoidable Causes
Flat – 5612.7 per 100,000 people Worsening N/A Similar N/A
HA9 - Reduce premature mortality for those with SMI
Worsening – 1535 per 100,000 population N/A N/A Worsening N/A
HA10 - Suicide Rate
Worsening – 12.68 per 100,000 population Worsening
Worsening
Worsening
3rd out of 8
HA11 - Increase the proportion of people who experience a good death
Improving – 5.4% of deaths (people with 3 or more emergency admissions in the last
3 months of life)
N/A Improving Improving 3rd out of 8 9
Building healthier communities
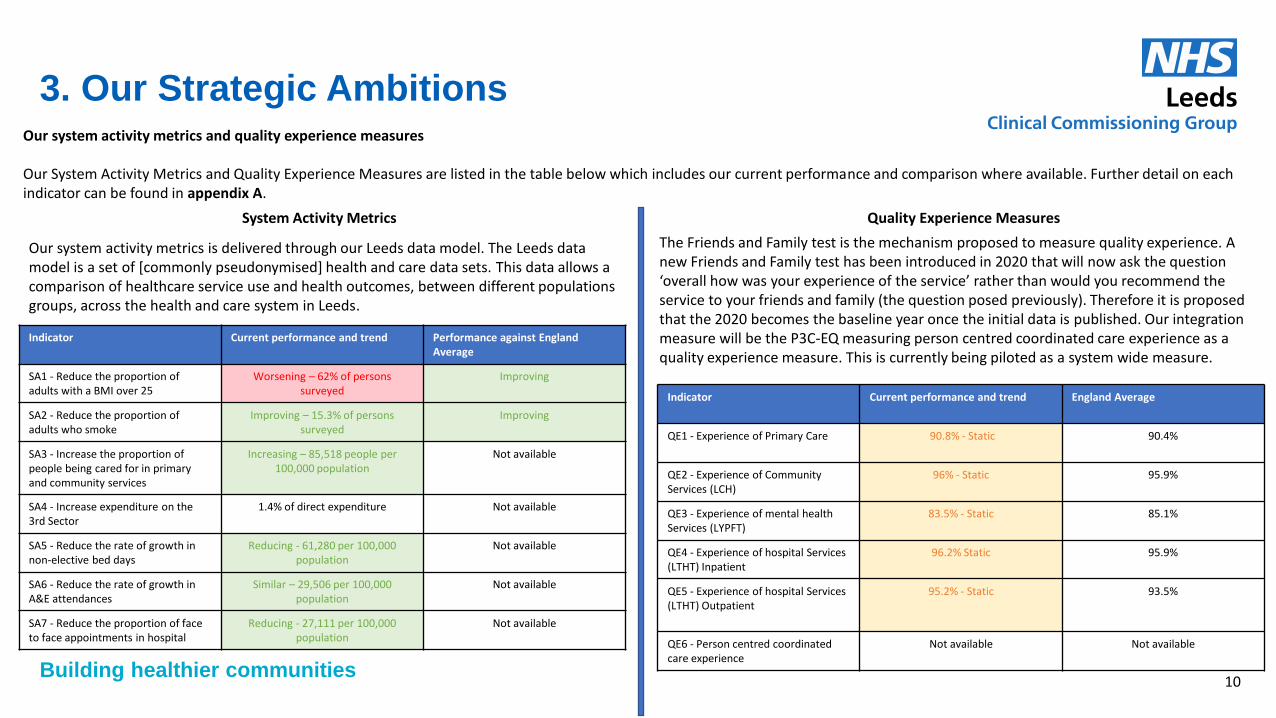
3. Our Strategic Ambitions Our system activity metrics and quality experience measures Our System Activity Metrics and Quality Experience Measures are listed in the table below which includes our current performance and comparison where available. Further detail on each indicator can be found in appendix A.
System Activity Metrics Quality Experience Measures
Indicator Current performance and trend Performance against England Average
SA1 - Reduce the proportion of adults with a BMI over 25
Worsening – 62% of persons surveyed
Improving
SA2 - Reduce the proportion of adults who smoke
Improving – 15.3% of persons surveyed
Improving
SA3 - Increase the proportion of people being cared for in primary and community services
Increasing – 85,518 people per 100,000 population
Not available
SA4 - Increase expenditure on the 3rd Sector
1.4% of direct expenditure Not available
SA5 - Reduce the rate of growth in non-elective bed days
Reducing - 61,280 per 100,000 population
Not available
SA6 - Reduce the rate of growth in A&E attendances
Similar – 29,506 per 100,000 population
Not available
SA7 - Reduce the proportion of face to face appointments in hospital
Reducing - 27,111 per 100,000 population
Not available
Indicator Current performance and trend England Average
QE1 - Experience of Primary Care 90.8% - Static 90.4%
QE2 - Experience of Community Services (LCH)
96% - Static 95.9%
QE3 - Experience of mental health Services (LYPFT)
83.5% - Static 85.1%
QE4 - Experience of hospital Services (LTHT) Inpatient
96.2% Static 95.9%
QE5 - Experience of hospital Services (LTHT) Outpatient
95.2% - Static 93.5%
QE6 - Person centred coordinated care experience
Not available Not available
The Friends and Family test is the mechanism proposed to measure quality experience. A new Friends and Family test has been introduced in 2020 that will now ask the question ‘overall how was your experience of the service’ rather than would you recommend the service to your friends and family (the question posed previously). Therefore it is proposed that the 2020 becomes the baseline year once the initial data is published. Our integration measure will be the P3C-EQ measuring person centred coordinated care experience as a quality experience measure. This is currently being piloted as a system wide measure.
Our system activity metrics is delivered through our Leeds data model. The Leeds data model is a set of [commonly pseudonymised] health and care data sets. This data allows a comparison of healthcare service use and health outcomes, between different populations groups, across the health and care system in Leeds.
10
Building healthier communities
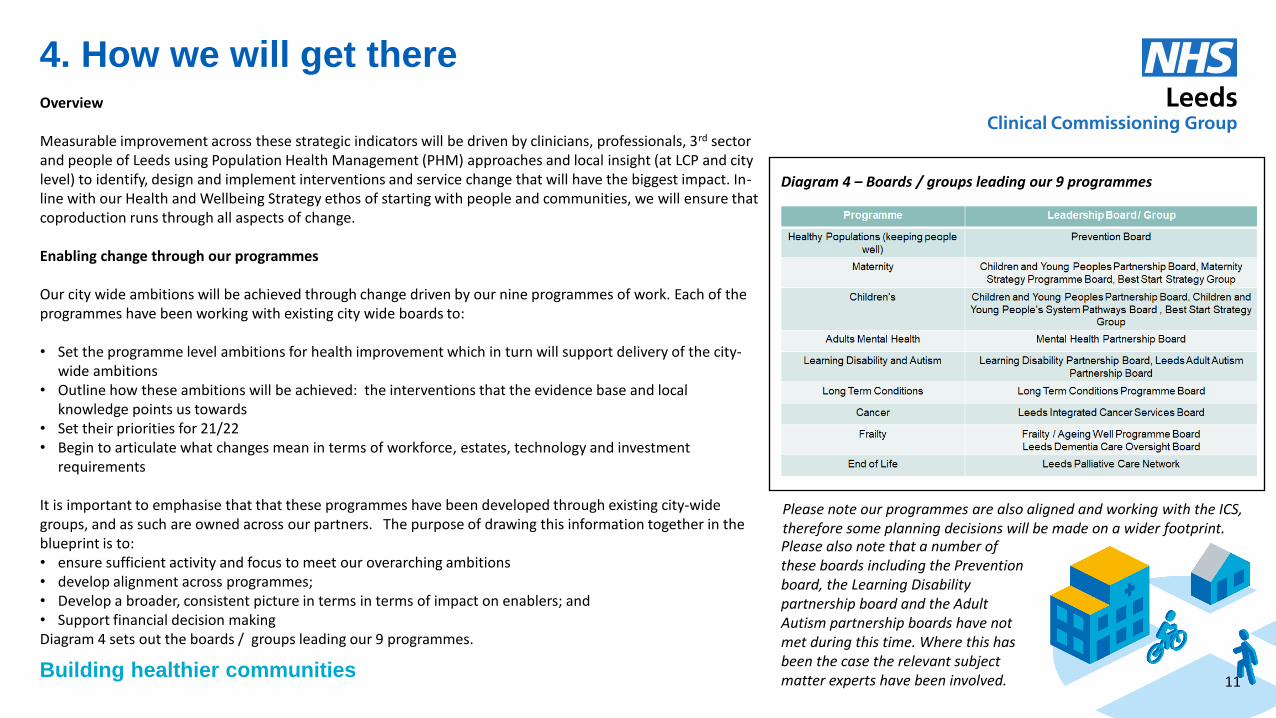
4. How we will get there Overview Measurable improvement across these strategic indicators will be driven by clinicians, professionals, 3rd sector and people of Leeds using Population Health Management (PHM) approaches and local insight (at LCP and city level) to identify, design and implement interventions and service change that will have the biggest impact. In-line with our Health and Wellbeing Strategy ethos of starting with people and communities, we will ensure that coproduction runs through all aspects of change. Enabling change through our programmes Our city wide ambitions will be achieved through change driven by our nine programmes of work. Each of the programmes have been working with existing city wide boards to: • Set the programme level ambitions for health improvement which in turn will support delivery of the city-
wide ambitions • Outline how these ambitions will be achieved: the interventions that the evidence base and local
knowledge points us towards • Set their priorities for 21/22 • Begin to articulate what changes mean in terms of workforce, estates, technology and investment
requirements It is important to emphasise that that these programmes have been developed through existing city-wide groups, and as such are owned across our partners. The purpose of drawing this information together in the blueprint is to: • ensure sufficient activity and focus to meet our overarching ambitions • develop alignment across programmes; • Develop a broader, consistent picture in terms in terms of impact on enablers; and • Support financial decision making Diagram 4 sets out the boards / groups leading our 9 programmes.
Diagram 4 – Boards / groups leading our 9 programmes
Please note our programmes are also aligned and working with the ICS, therefore some planning decisions will be made on a wider footprint.
11
Please also note that a number of these boards including the Prevention board, the Learning Disability partnership board and the Adult Autism partnership boards have not met during this time. Where this has been the case the relevant subject matter experts have been involved.
Building healthier communities
4. How we will get there – Maternity and Children &Young People
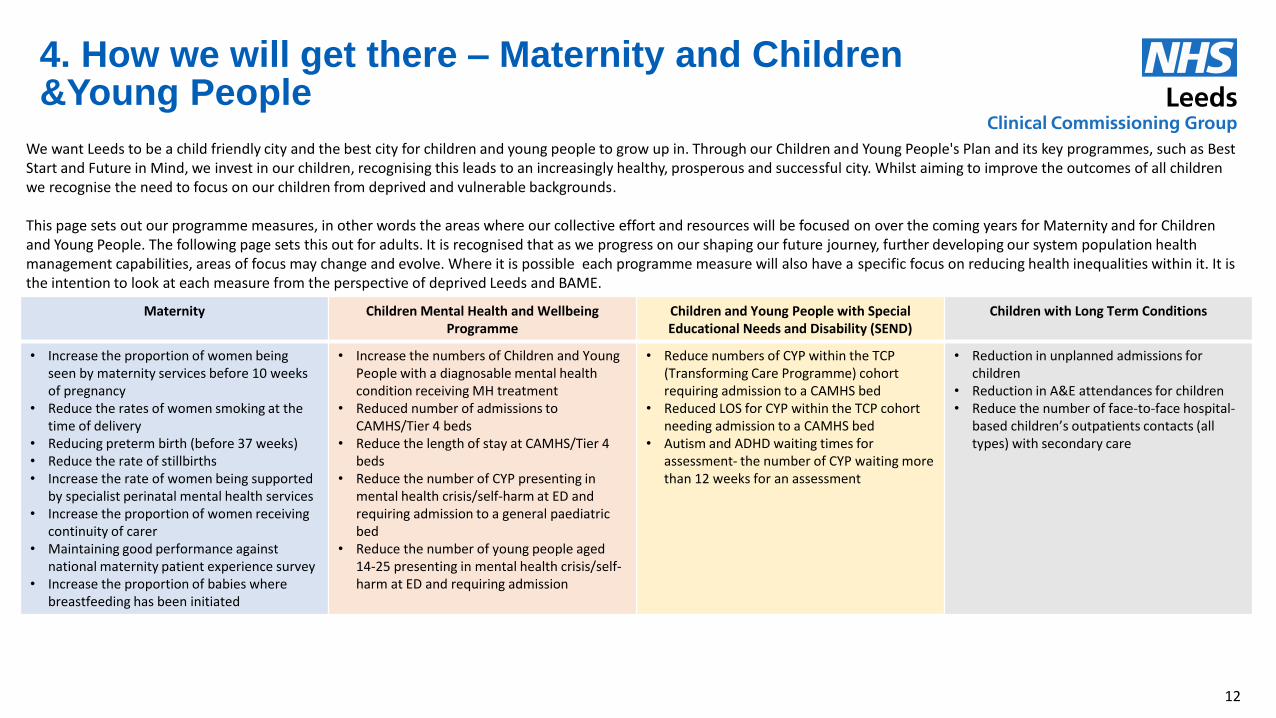
We want Leeds to be a child friendly city and the best city for children and young people to grow up in. Through our Children and Young People's Plan and its key programmes, such as Best Start and Future in Mind, we invest in our children, recognising this leads to an increasingly healthy, prosperous and successful city. Whilst aiming to improve the outcomes of all children we recognise the need to focus on our children from deprived and vulnerable backgrounds. This page sets out our programme measures, in other words the areas where our collective effort and resources will be focused on over the coming years for Maternity and for Children and Young People. The following page sets this out for adults. It is recognised that as we progress on our shaping our future journey, further developing our system population health management capabilities, areas of focus may change and evolve. Where it is possible each programme measure will also have a specific focus on reducing health inequalities within it. It is the intention to look at each measure from the perspective of deprived Leeds and BAME. The link between the strategic indicators and the focus of our programmes can be found in appendix B. Further information on programme priority areas of change for 21/22 and how they relate to both programme measures and strategic indicators can be found in appendix C and the latest performance against programme measures can be found in appendix D.
Maternity Children Mental Health and Wellbeing Programme
Children and Young People with Special Educational Needs and Disability (SEND)
Children with Long Term Conditions
• Increase the proportion of women being seen by maternity services before 10 weeks of pregnancy
• Reduce the rates of women smoking at the time of delivery
• Reducing preterm birth (before 37 weeks) • Reduce the rate of stillbirths • Increase the rate of women being supported
by specialist perinatal mental health services • Increase the proportion of women receiving
continuity of carer • Maintaining good performance against
national maternity patient experience survey • Increase the proportion of babies where
breastfeeding has been initiated
• Increase the numbers of Children and Young People with a diagnosable mental health condition receiving MH treatment
• Reduced number of admissions to CAMHS/Tier 4 beds
• Reduce the length of stay at CAMHS/Tier 4 beds
• Reduce the number of CYP presenting in mental health crisis/self-harm at ED and requiring admission to a general paediatric bed
• Reduce the number of young people aged 14-25 presenting in mental health crisis/self-harm at ED and requiring admission
• Reduce numbers of CYP within the TCP (Transforming Care Programme) cohort requiring admission to a CAMHS bed
• Reduced LOS for CYP within the TCP cohort needing admission to a CAMHS bed
• Autism and ADHD waiting times for assessment- the number of CYP waiting more than 12 weeks for an assessment
• Reduction in unplanned admissions for children
• Reduction in A&E attendances for children • Reduce the number of face-to-face hospital-
based children’s outpatients contacts (all types) with secondary care
12

Building healthier communities
4. How we will get there – Adults
Healthy Population Long Term Conditions Adults Mental Health
• Increase proportion of people on the SMI primary care register having health checks completed (from MH programme)
• Increase the proportion of people with a learning disability receiving an annual health check (LD and autism programme)
• Increase the proportion of patients identified at risk of developing a long-term condition who have been referred for management of risk factors (Long Term Conditions Programme)
• Increase Cervical screening / Breast Screening and Bowel Screening (Cancer Programme)
• Increase the proportion of people identified at risk of developing a long-term condition who have been offered support via a shared decision making discussion and subsequently referred for supported management of modifiable risk factors
• People with one or more LTC are enabled to take an active role in managing their condition and treatment by utilising programmes of rehabilitation, structured education, patient self management tools and therapy/medicines adherence
• Patients with a LTC, will be supported to reduce complications and the development of additional long-term conditions through shared agreed goals including medication and lifestyle therapy treatment optimisation
• Reduce the rate of growth in avoidable non-elective bed days and A&E attendances for patients with a primary diagnosis of a Long Term Condition reducing disruption to peoples life's
• An increase in proportion of long-term conditions contacts or care carried out in primary care/community setting
• Professionals working well together across the system focused on the needs of people
• Reduce the admission rates as a result of self-harm • Increase the numbers of people entering IAPT
treatment as a proportion of the prevalent population with anxiety and depression
• Improve the % of people completing IAPT treatment moving to recovery
• Reduce rate of ‘detained on admission’ for BAME groups to the same levels as White British
• Reduce waiting times for mental health services including timely access to a MH Crisis Assessment and Early Intervention into Psychosis. Other related measures are being developed.
• Length of Stay on working age adult acute inpatient wards.
• Increase the number of people on the SMI register having health checks completed
Learning Disabilities and Autism
Cancer Frailty Population End of Life Population
• Reduce the reliance on inpatient placements for people with learning disability and autism
• Improve personalisation by increasing the uptake of Personal Health Budgets to offer citizens greater choice and control.
• Increase the proportion of cancers diagnosed at stage 1 or 2
• Reduce the rate of emergency diagnoses of cancer
• Achievement of 28 day faster diagnosis standard
• To improve the one (and five year) survival from Cancer
• Increase the Time people living with frailty or at the end of life spend at their place of residence
• Reduce the Number of serious falls per 100,000 population • Increase the percentage of population cohort who have had a medication review • Increase the number of carers identified on primary care systems, and evidence of
health check or review in their own right as carers • Increase the Proportion of people living with frailty and people living with dementia
who have had a Collaborative Care and Support Plan review and advance care plan in place.
• Increase the % of patients who died with an EPaCCs record
• Increase the numbers of patients able to achieve the wishes set out in their advanced care plans
• More carers will be well supported during the last phase of their loved one’s life and services will be put in place to ensure that symptoms and pain are well managed.
13
Building healthier communities
4.1 Maternity
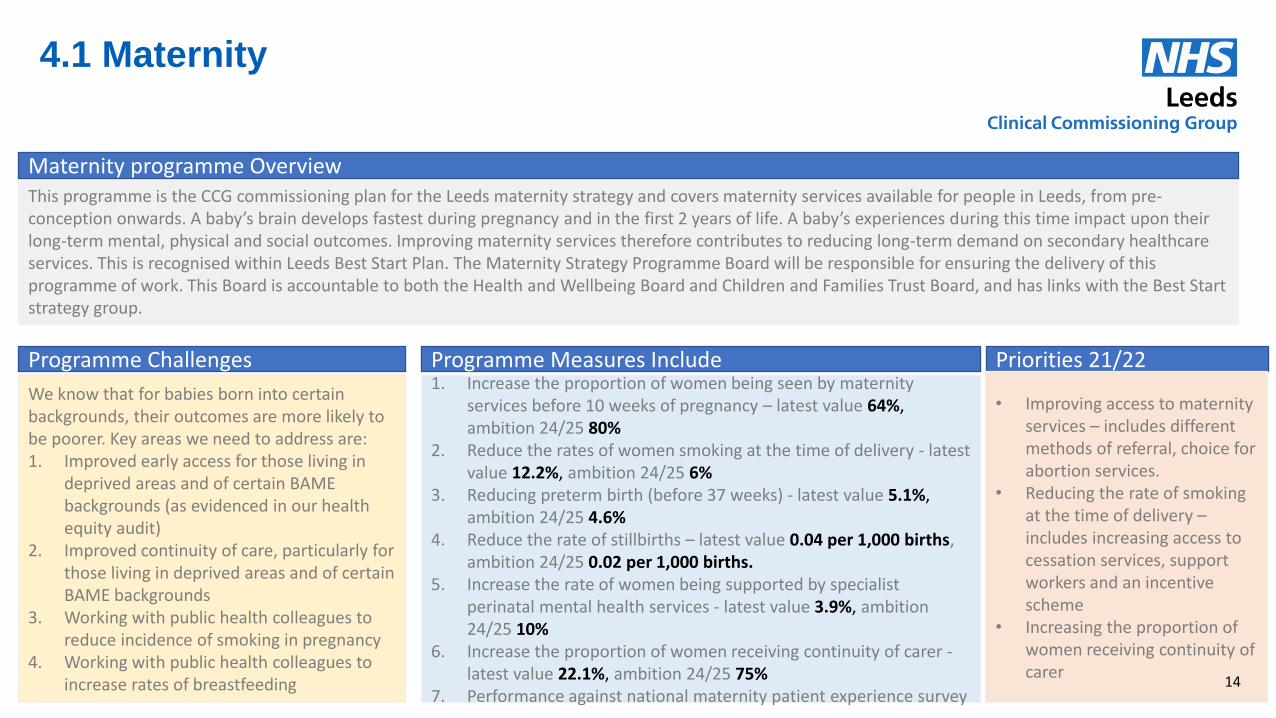
This programme is the CCG commissioning plan for the Leeds maternity strategy and covers maternity services available for people in Leeds, from pre-conception onwards. A baby’s brain develops fastest during pregnancy and in the first 2 years of life. A baby’s experiences during this time impact upon their long-term mental, physical and social outcomes. Improving maternity services therefore contributes to reducing long-term demand on secondary healthcare services. This is recognised within Leeds Best Start Plan. The Maternity Strategy Programme Board will be responsible for ensuring the delivery of this programme of work. This Board is accountable to both the Health and Wellbeing Board and Children and Families Trust Board, and has links with the Best Start strategy group.
Maternity programme Overview
Programme Challenges
We know that for babies born into certain backgrounds, their outcomes are more likely to be poorer. Key areas we need to address are: 1. Improved early access for those living in
deprived areas and of certain BAME backgrounds (as evidenced in our health equity audit)
2. Improved continuity of care, particularly for those living in deprived areas and of certain BAME backgrounds
3. Working with public health colleagues to reduce incidence of smoking in pregnancy
4. Working with public health colleagues to increase rates of breastfeeding
Programme Measures Include
1. Increase the proportion of women being seen by maternity
services before 10 weeks of pregnancy – latest value 64%, ambition 24/25 80%
2. Reduce the rates of women smoking at the time of delivery - latest value 12.2%, ambition 24/25 6%
3. Reducing preterm birth (before 37 weeks) - latest value 5.1%, ambition 24/25 4.6%
4. Reduce the rate of stillbirths – latest value 0.04 per 1,000 births, ambition 24/25 0.02 per 1,000 births.
5. Increase the rate of women being supported by specialist perinatal mental health services - latest value 3.9%, ambition 24/25 10%
6. Increase the proportion of women receiving continuity of carer - latest value 22.1%, ambition 24/25 75%
7. Performance against national maternity patient experience survey
Priorities 21/22 • Improving access to maternity
services – includes different methods of referral, choice for abortion services.
• Reducing the rate of smoking at the time of delivery – includes increasing access to cessation services, support workers and an incentive scheme
• Increasing the proportion of women receiving continuity of carer
14
Building healthier communities
4.2 Children’s MH and Wellbeing
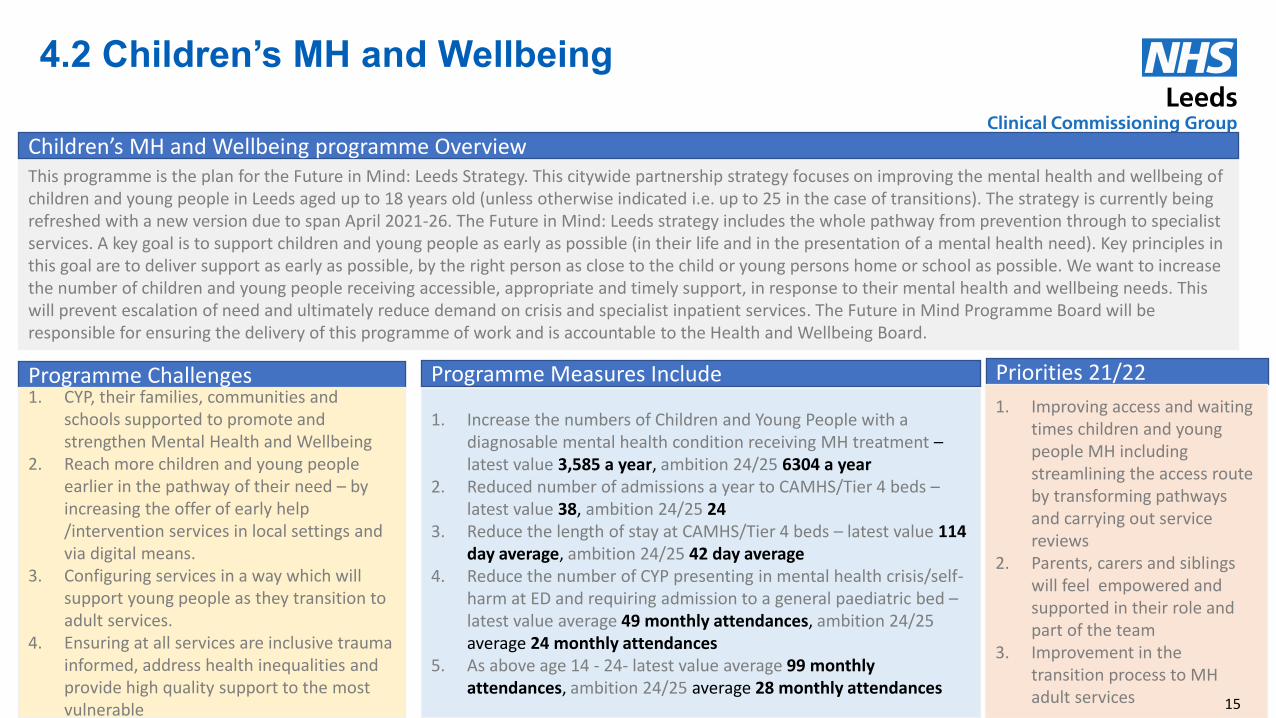
This programme is the plan for the Future in Mind: Leeds Strategy. This citywide partnership strategy focuses on improving the mental health and wellbeing of children and young people in Leeds aged up to 18 years old (unless otherwise indicated i.e. up to 25 in the case of transitions). The strategy is currently being refreshed with a new version due to span April 2021-26. The Future in Mind: Leeds strategy includes the whole pathway from prevention through to specialist services. A key goal is to support children and young people as early as possible (in their life and in the presentation of a mental health need). Key principles in this goal are to deliver support as early as possible, by the right person as close to the child or young persons home or school as possible. We want to increase the number of children and young people receiving accessible, appropriate and timely support, in response to their mental health and wellbeing needs. This will prevent escalation of need and ultimately reduce demand on crisis and specialist inpatient services. The Future in Mind Programme Board will be responsible for ensuring the delivery of this programme of work and is accountable to the Health and Wellbeing Board.
Children’s MH and Wellbeing programme Overview
Programme Challenges 1. CYP, their families, communities and
schools supported to promote and strengthen Mental Health and Wellbeing
2. Reach more children and young people earlier in the pathway of their need – by increasing the offer of early help /intervention services in local settings and via digital means.
3. Configuring services in a way which will support young people as they transition to adult services.
4. Ensuring at all services are inclusive trauma informed, address health inequalities and provide high quality support to the most vulnerable
Programme Measures Include
1. Increase the numbers of Children and Young People with a diagnosable mental health condition receiving MH treatment – latest value 3,585 a year, ambition 24/25 6304 a year
2. Reduced number of admissions a year to CAMHS/Tier 4 beds – latest value 38, ambition 24/25 24
3. Reduce the length of stay at CAMHS/Tier 4 beds – latest value 114 day average, ambition 24/25 42 day average
4. Reduce the number of CYP presenting in mental health crisis/self-harm at ED and requiring admission to a general paediatric bed – latest value average 49 monthly attendances, ambition 24/25 average 24 monthly attendances
5. As above age 14 - 24- latest value average 99 monthly attendances, ambition 24/25 average 28 monthly attendances
Priorities 21/22
1. Improving access and waiting times children and young people MH including streamlining the access route by transforming pathways and carrying out service reviews
2. Parents, carers and siblings will feel empowered and supported in their role and part of the team
3. Improvement in the transition process to MH adult services
15
Building healthier communities
4.4 Children and Young People with Special Educational Need or Disability (SEND)
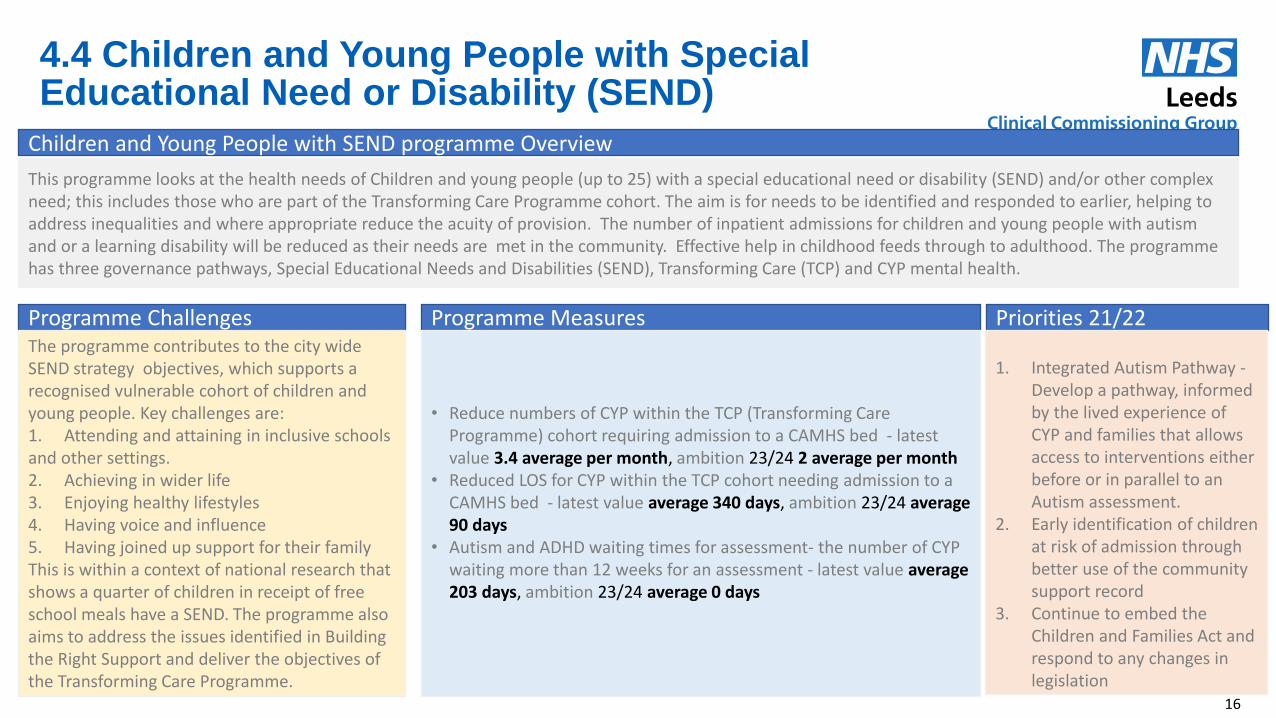
This programme looks at the health needs of Children and young people (up to 25) with a special educational need or disability (SEND) and/or other complex need; this includes those who are part of the Transforming Care Programme cohort. The aim is for needs to be identified and responded to earlier, helping to address inequalities and where appropriate reduce the acuity of provision. The number of inpatient admissions for children and young people with autism and or a learning disability will be reduced as their needs are met in the community. Effective help in childhood feeds through to adulthood. The programme has three governance pathways, Special Educational Needs and Disabilities (SEND), Transforming Care (TCP) and CYP mental health.
Children and Young People with SEND programme Overview
Programme Challenges The programme contributes to the city wide SEND strategy objectives, which supports a recognised vulnerable cohort of children and young people. Key challenges are: 1. Attending and attaining in inclusive schools and other settings. 2. Achieving in wider life 3. Enjoying healthy lifestyles 4. Having voice and influence 5. Having joined up support for their family This is within a context of national research that shows a quarter of children in receipt of free school meals have a SEND. The programme also aims to address the issues identified in Building the Right Support and deliver the objectives of the Transforming Care Programme.
Programme Measures
• Reduce numbers of CYP within the TCP (Transforming Care Programme) cohort requiring admission to a CAMHS bed - latest value 3.4 average per month, ambition 23/24 2 average per month
• Reduced LOS for CYP within the TCP cohort needing admission to a CAMHS bed - latest value average 340 days, ambition 23/24 average 90 days
• Autism and ADHD waiting times for assessment- the number of CYP waiting more than 12 weeks for an assessment - latest value average 203 days, ambition 23/24 average 0 days
Priorities 21/22
1. Integrated Autism Pathway - Develop a pathway, informed by the lived experience of CYP and families that allows access to interventions either before or in parallel to an Autism assessment.
2. Early identification of children at risk of admission through better use of the community support record
3. Continue to embed the Children and Families Act and respond to any changes in legislation
16
Building healthier communities
4.3 Children with Long Term Conditions
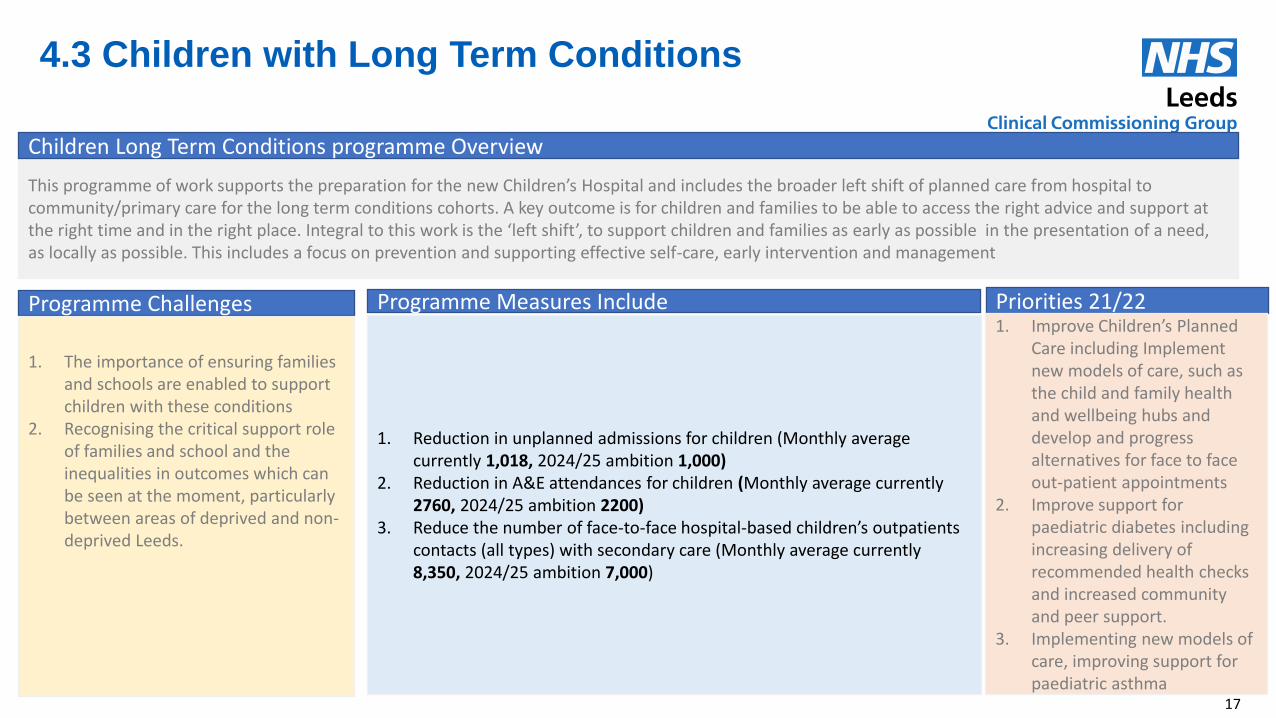
This programme of work supports the preparation for the new Children’s Hospital and includes the broader left shift of planned care from hospital to community/primary care for the long term conditions cohorts. A key outcome is for children and families to be able to access the right advice and support at the right time and in the right place. Integral to this work is the ‘left shift’, to support children and families as early as possible in the presentation of a need, as locally as possible. This includes a focus on prevention and supporting effective self-care, early intervention and management
Children Long Term Conditions programme Overview
Programme Challenges
1. The importance of ensuring families and schools are enabled to support children with these conditions
2. Recognising the critical support role of families and school and the inequalities in outcomes which can be seen at the moment, particularly between areas of deprived and non-deprived Leeds.
Programme Measures Include
1. Reduction in unplanned admissions for children (Monthly average
currently 1,018, 2024/25 ambition 1,000) 2. Reduction in A&E attendances for children (Monthly average currently
2760, 2024/25 ambition 2200) 3. Reduce the number of face-to-face hospital-based children’s outpatients
contacts (all types) with secondary care (Monthly average currently 8,350, 2024/25 ambition 7,000)
Priorities 21/22
1. Improve Children’s Planned Care including Implement new models of care, such as the child and family health and wellbeing hubs and develop and progress alternatives for face to face out-patient appointments
2. Improve support for paediatric diabetes including increasing delivery of recommended health checks and increased community and peer support.
3. Implementing new models of care, improving support for paediatric asthma
17
Building healthier communities
4.5.Healthy Population
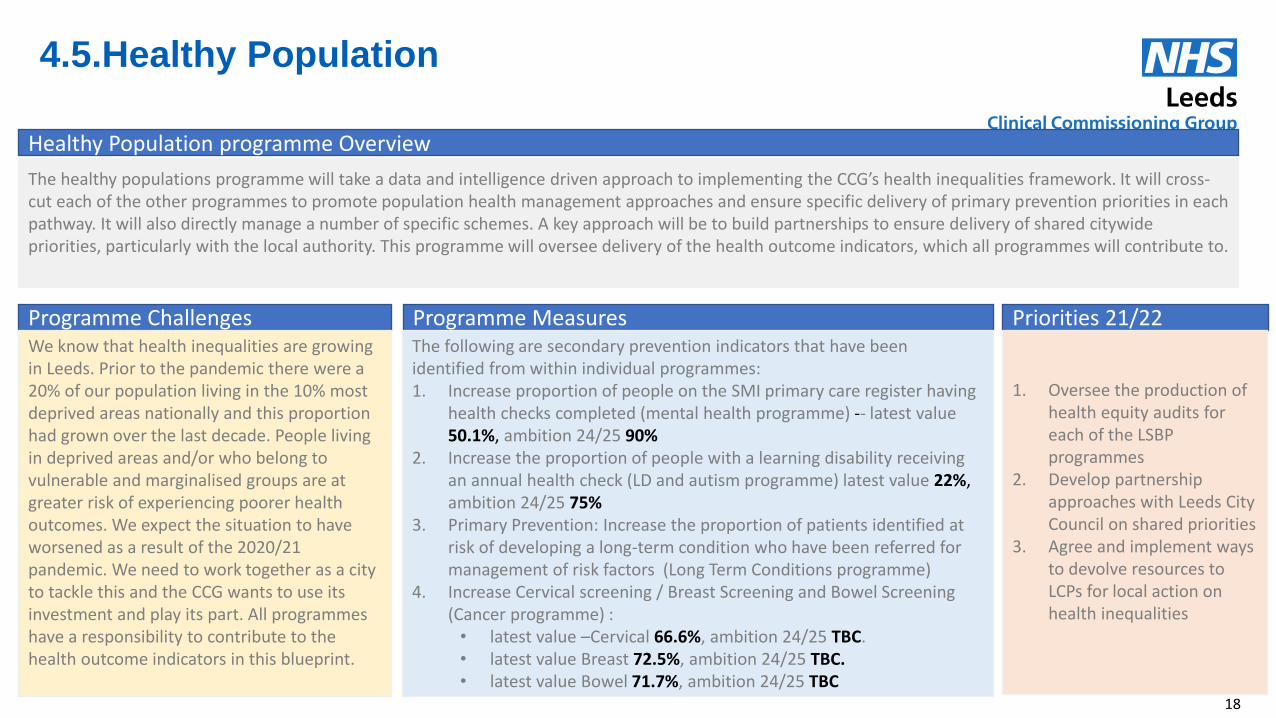
The healthy populations programme will take a data and intelligence driven approach to implementing the CCG’s health inequalities framework. It will cross-cut each of the other programmes to promote population health management approaches and ensure specific delivery of primary prevention priorities in each pathway. It will also directly manage a number of specific schemes. A key approach will be to build partnerships to ensure delivery of shared citywide priorities, particularly with the local authority. This programme will oversee delivery of the health outcome indicators, which all programmes will contribute to.
Healthy Population programme Overview
Programme Challenges We know that health inequalities are growing in Leeds. Prior to the pandemic there were a 20% of our population living in the 10% most deprived areas nationally and this proportion had grown over the last decade. People living in deprived areas and/or who belong to vulnerable and marginalised groups are at greater risk of experiencing poorer health outcomes. We expect the situation to have worsened as a result of the 2020/21 pandemic. We need to work together as a city to tackle this and the CCG wants to use its investment and play its part. All programmes have a responsibility to contribute to the health outcome indicators in this blueprint.
Programme Measures
The following are secondary prevention indicators that have been identified from within individual programmes: 1. Increase proportion of people on the SMI primary care register having
health checks completed (mental health programme) -- latest value 50.1%, ambition 24/25 90%
2. Increase the proportion of people with a learning disability receiving an annual health check (LD and autism programme) latest value 22%, ambition 24/25 75%
3. Primary Prevention: Increase the proportion of patients identified at risk of developing a long-term condition who have been referred for management of risk factors (Long Term Conditions programme)
4. Increase Cervical screening / Breast Screening and Bowel Screening (Cancer programme) : • latest value –Cervical 66.6%, ambition 24/25 TBC. • latest value Breast 72.5%, ambition 24/25 TBC. • latest value Bowel 71.7%, ambition 24/25 TBC
Priorities 21/22
1. Oversee the production of health equity audits for each of the LSBP programmes
2. Develop partnership approaches with Leeds City Council on shared priorities
3. Agree and implement ways to devolve resources to LCPs for local action on health inequalities
18

Building healthier communities
4.6 Mental Health
This programme focuses on achieving an increased focus on early intervention and prevention to ensure that more people with mental health problems, and learning disabilities receive effective, person-centred, community-based help and treatment earlier. This will be targeted to at risk groups, and successful achievement will result in less people requiring more intensive support and reduced health inequalities. This programme will be overseen by the Mental Health Partnership Board and is integrated within the All Age Mental Health Strategy. Detailed delivery plans will be overseen by the Mental Health Strategy Delivery Group.
Mental Health programme Overview
Programme Challenges Challenges that the programme is aiming to address include: 1. Improving access to early intervention and
prevention support in the community 2. Reducing Health inequalities for people
with Serious Mental Illness (SMI) 3. Reducing Health inequalities for other
groups, including but not restricted to people from BAME groups and Older People
4. Ensuring that where possible people receive care closer to home, improved quality and responsiveness of mental health crisis provision
Programme Measures Include
1. Increase the numbers of people entering IAPT treatment as a proportion of the prevalent population with anxiety and depression -- latest value 18.1%, ambition 24/25 25%
2. Reduce rate of ‘detained on admission’ for BAME groups to the same levels as White British - latest value 1.2 people per 1,000 BAME population ambition 24/25 0.8 people per 1,000 BAME population
3. Improve timely access to a MH Crisis Assessment % of people assessed within 4 hours of contacting the service - latest value 17%, ambition 24/25 90%
4. % of people starting Early Intervention Into Psychosis treatment within 2 weeks latest value 51.4%, ambition 24/25 60%
5. Understanding how our mental health services work for people through our I statements
6. Increase proportion of people on SMI primary care register having health checks completed – latest value 50.1%, ambition 24/25 90%
Priorities 21/22
1. Improving our acute MH pathway for adults – improving quality and capacity – particularly important as people are presenting more acutely unwell due to the impact of Covid-19.
2. Improving access to early intervention and preventative support
3. Improving the Mental Health Crisis Pathway – starting with considering the model for the first point of contact.
19
Building healthier communities
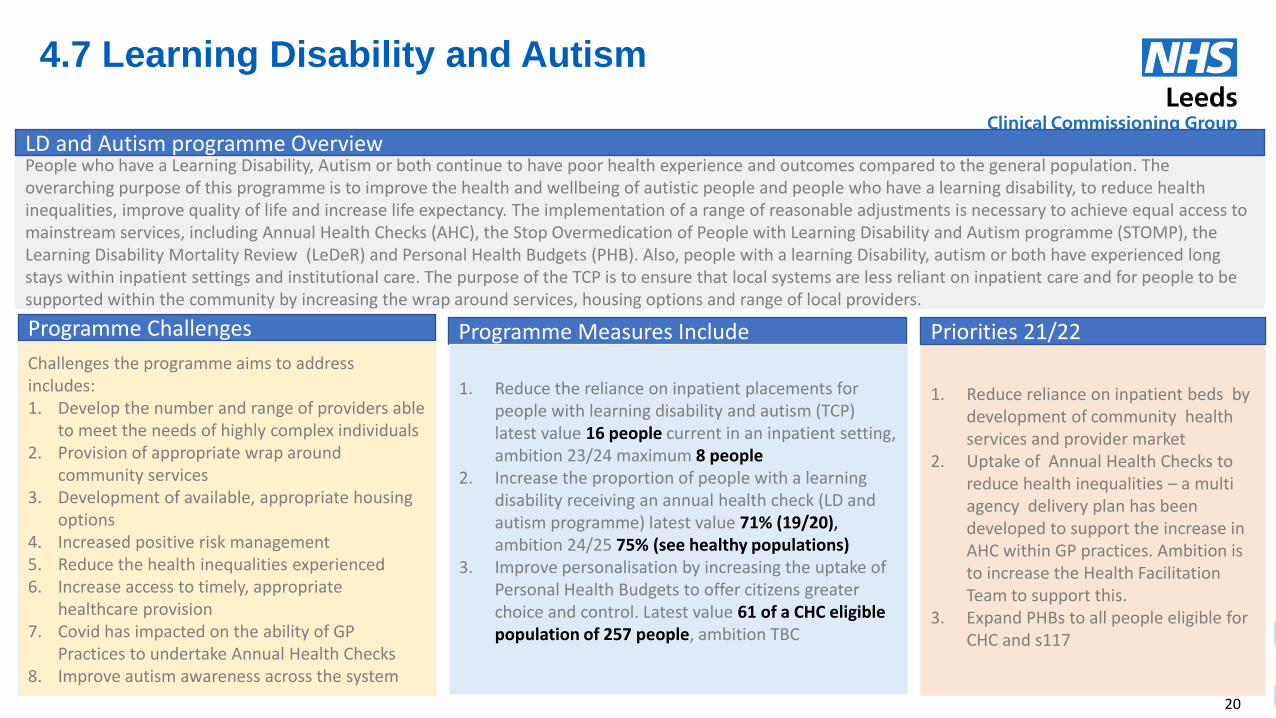
4.7 Learning Disability and Autism
People who have a Learning Disability, Autism or both continue to have poor health experience and outcomes compared to the general population. The overarching purpose of this programme is to improve the health and wellbeing of autistic people and people who have a learning disability, to reduce health inequalities, improve quality of life and increase life expectancy. The implementation of a range of reasonable adjustments is necessary to achieve equal access to mainstream services, including Annual Health Checks (AHC), the Stop Overmedication of People with Learning Disability and Autism programme (STOMP), the Learning Disability Mortality Review (LeDeR) and Personal Health Budgets (PHB). Also, people with a learning Disability, autism or both have experienced long stays within inpatient settings and institutional care. The purpose of the TCP is to ensure that local systems are less reliant on inpatient care and for people to be supported within the community by increasing the wrap around services, housing options and range of local providers.
LD and Autism programme Overview
Programme Challenges
Challenges the programme aims to address includes: 1. Develop the number and range of providers able
to meet the needs of highly complex individuals 2. Provision of appropriate wrap around
community services 3. Development of available, appropriate housing
options 4. Increased positive risk management 5. Reduce the health inequalities experienced 6. Increase access to timely, appropriate
healthcare provision 7. Covid has impacted on the ability of GP
Practices to undertake Annual Health Checks 8. Improve autism awareness across the system
Programme Measures Include
1. Reduce the reliance on inpatient placements for people with learning disability and autism (TCP) latest value 16 people current in an inpatient setting, ambition 23/24 maximum 8 people
2. Increase the proportion of people with a learning disability receiving an annual health check (LD and autism programme) latest value 71% (19/20), ambition 24/25 75% (see healthy populations)
3. Improve personalisation by increasing the uptake of Personal Health Budgets to offer citizens greater choice and control. Latest value 61 of a CHC eligible population of 257 people, ambition TBC
1. Reduce reliance on inpatient beds by development of community health services and provider market
2. Uptake of Annual Health Checks to reduce health inequalities – a multi agency delivery plan has been developed to support the increase in AHC within GP practices. Ambition is to increase the Health Facilitation Team to support this.
3. Expand PHBs to all people eligible for CHC and s117
Priorities 21/22
20
Building healthier communities
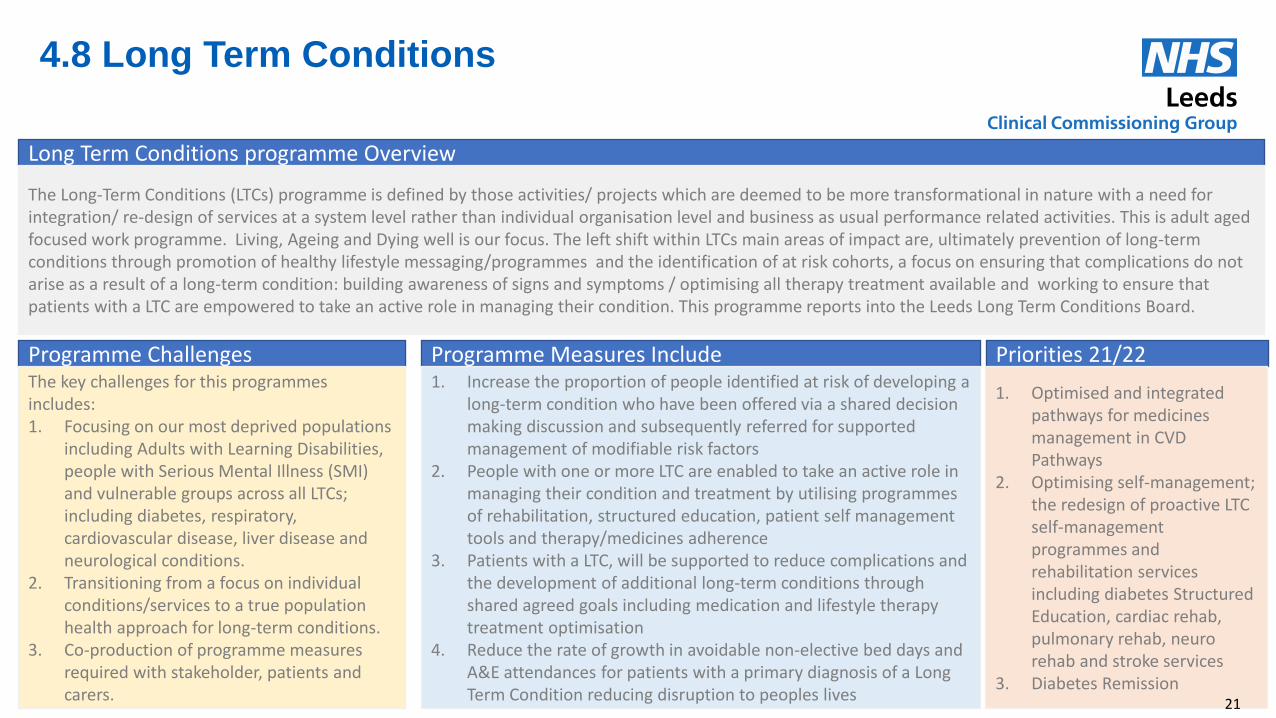
4.8 Long Term Conditions
Long Term Conditions programme Overview
Programme Challenges The key challenges for this programmes includes: 1. Focusing on our most deprived populations
including Adults with Learning Disabilities, people with Serious Mental Illness (SMI) and vulnerable groups across all LTCs; including diabetes, respiratory, cardiovascular disease, liver disease and neurological conditions.
2. Transitioning from a focus on individual conditions/services to a true population health approach for long-term conditions.
3. Co-production of programme measures required with stakeholder, patients and carers.
Programme Measures Include 1. Increase the proportion of people identified at risk of developing a
long-term condition who have been offered via a shared decision making discussion and subsequently referred for supported management of modifiable risk factors
2. People with one or more LTC are enabled to take an active role in managing their condition and treatment by utilising programmes of rehabilitation, structured education, patient self management tools and therapy/medicines adherence
3. Patients with a LTC, will be supported to reduce complications and the development of additional long-term conditions through shared agreed goals including medication and lifestyle therapy treatment optimisation
4. Reduce the rate of growth in avoidable non-elective bed days and A&E attendances for patients with a primary diagnosis of a Long Term Condition reducing disruption to peoples lives
Priorities 21/22
1. Optimised and integrated pathways for medicines management in CVD Pathways
2. Optimising self-management; the redesign of proactive LTC self-management programmes and rehabilitation services including diabetes Structured Education, cardiac rehab, pulmonary rehab, neuro rehab and stroke services
3. Diabetes Remission
The Long-Term Conditions (LTCs) programme is defined by those activities/ projects which are deemed to be more transformational in nature with a need for integration/ re-design of services at a system level rather than individual organisation level and business as usual performance related activities. This is adult aged focused work programme. Living, Ageing and Dying well is our focus. The left shift within LTCs main areas of impact are, ultimately prevention of long-term conditions through promotion of healthy lifestyle messaging/programmes and the identification of at risk cohorts, a focus on ensuring that complications do not arise as a result of a long-term condition: building awareness of signs and symptoms / optimising all therapy treatment available and working to ensure that patients with a LTC are empowered to take an active role in managing their condition. This programme reports into the Leeds Long Term Conditions Board.
21

Building healthier communities
4.9 Cancer
Cancer programme Overview
Programme Challenges
Our aim statement is “ to deliver the best cancer outcomes for the people of Leeds” . We have specific challenges: • High incidence rates • Achieving increased screening uptake rates
especially in our most deprived populations • A focus on earlier staging & addressing high
rate of emergency cancer presentations. There is a national target of 75% stage 1 & 2 by 2028
• We will maintain a focus on these ambitions acknowledging the current constraints of a cancer system trying to manage the impact of Covid-19.
Programme Measures Include
1. Increase the proportion of cancers diagnosed at stage 1 or 2 - –latest value Leeds 49.5%, ambition 2028 75%
2. Reduce the rate of emergency diagnoses of cancer –latest value Leeds 21.9% ambition 24/25 TBC
3. Achievement of 28 day faster diagnosis standard - latest value Leeds 74.4% ambition 24/25 TBC
4. To improve the one (and five year) survival from Cancer - latest value Leeds for 1 year 73.3% ambition 24/25 TBC
5. National Cancer Patient experience survey – patients rating of care, Leeds score 8.9 (out of 10), national average 8.8, ambition 24/25 TBC
Priorities 21/22 1. Continued focus on
increasing screening uptake of 3 x national screening programmes with health inequalities focus
2. Innovative projects to drive earlier diagnosis of cancer / create additional capacity to deal with covid-19 backlog & support front end screening/ triage and diagnostic processes
3. Expansion / broadened scope of Community Cancer Support Service
The Leeds Cancer Programme, established in 2017 with funding from Macmillan, has enabled partners across Leeds to be part of a system wide/ integrated programme of work with shared outcomes and ambitions. The programme is defined by those activities/ projects which are deemed to be more transformational in nature with a need for integration/ re-design of services at a system level rather than individual organisation level and business as usual performance related activities. This is an all ages programme however it should be noted that all work to date has focused on adults. The left shift within cancer reflects 2 main areas of impact, ultimately prevention of cancers through promotion of healthy lifestyle messaging and secondly a shift to earlier staging of cancer diagnoses achieved through several strands of work: building awareness of signs and symptoms of cancer across communities, driving improvements in screening uptake and the implementation of innovative tests/ triage and assessment processes during referral or pre-referral. This programme reports into the Leeds Integrated Cancer Services (LICS) programme board.
22
Building healthier communities
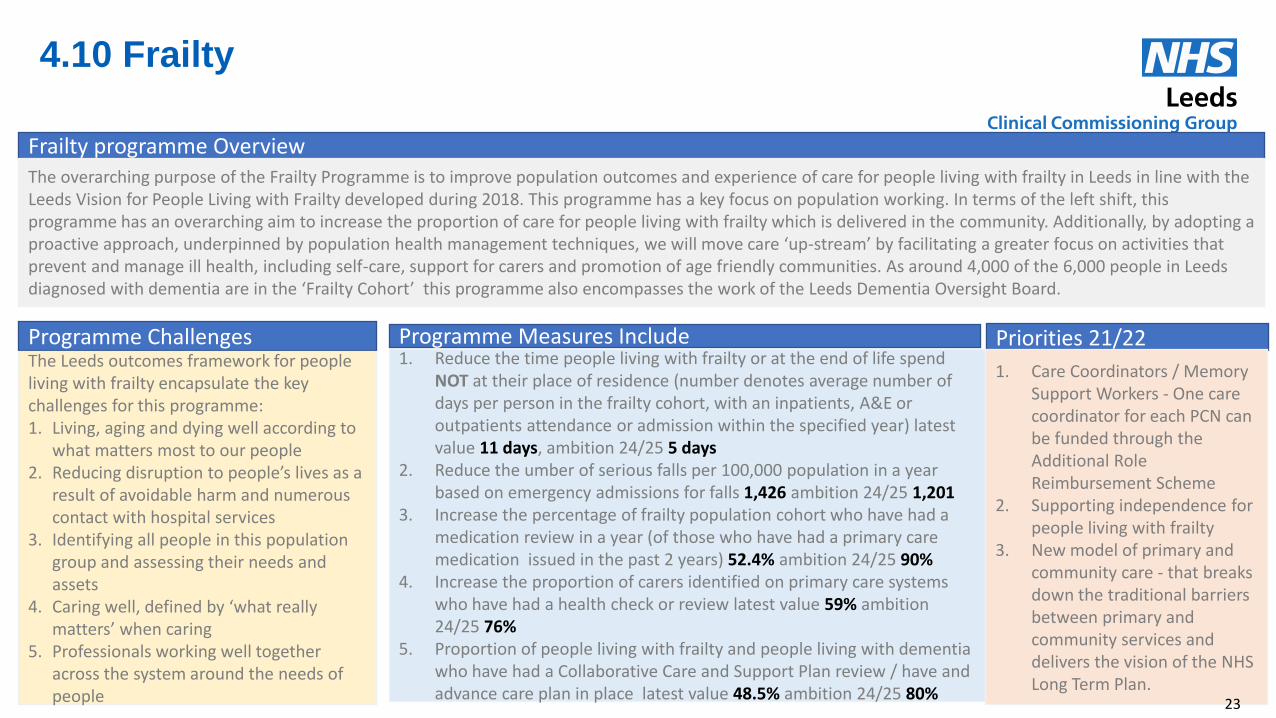
4.10 Frailty
Frailty programme Overview
Programme Challenges The Leeds outcomes framework for people living with frailty encapsulate the key challenges for this programme: 1. Living, aging and dying well according to
what matters most to our people 2. Reducing disruption to people’s lives as a
result of avoidable harm and numerous contact with hospital services
3. Identifying all people in this population group and assessing their needs and assets
4. Caring well, defined by ‘what really matters’ when caring
5. Professionals working well together across the system around the needs of people
Programme Measures Include 1. Reduce the time people living with frailty or at the end of life spend
NOT at their place of residence (number denotes average number of days per person in the frailty cohort, with an inpatients, A&E or outpatients attendance or admission within the specified year) latest value 11 days, ambition 24/25 5 days
2. Reduce the umber of serious falls per 100,000 population in a year based on emergency admissions for falls 1,426 ambition 24/25 1,201
3. Increase the percentage of frailty population cohort who have had a medication review in a year (of those who have had a primary care medication issued in the past 2 years) 52.4% ambition 24/25 90%
4. Increase the proportion of carers identified on primary care systems who have had a health check or review latest value 59% ambition 24/25 76%
5. Proportion of people living with frailty and people living with dementia who have had a Collaborative Care and Support Plan review / have and advance care plan in place latest value 48.5% ambition 24/25 80%
Priorities 21/22
1. Care Coordinators / Memory Support Workers - One care coordinator for each PCN can be funded through the Additional Role Reimbursement Scheme
2. Supporting independence for people living with frailty
3. New model of primary and community care - that breaks down the traditional barriers between primary and community services and delivers the vision of the NHS Long Term Plan.
The overarching purpose of the Frailty Programme is to improve population outcomes and experience of care for people living with frailty in Leeds in line with the Leeds Vision for People Living with Frailty developed during 2018. This programme has a key focus on population working. In terms of the left shift, this programme has an overarching aim to increase the proportion of care for people living with frailty which is delivered in the community. Additionally, by adopting a proactive approach, underpinned by population health management techniques, we will move care ‘up-stream’ by facilitating a greater focus on activities that prevent and manage ill health, including self-care, support for carers and promotion of age friendly communities. As around 4,000 of the 6,000 people in Leeds diagnosed with dementia are in the ‘Frailty Cohort’ this programme also encompasses the work of the Leeds Dementia Oversight Board.
23
Building healthier communities
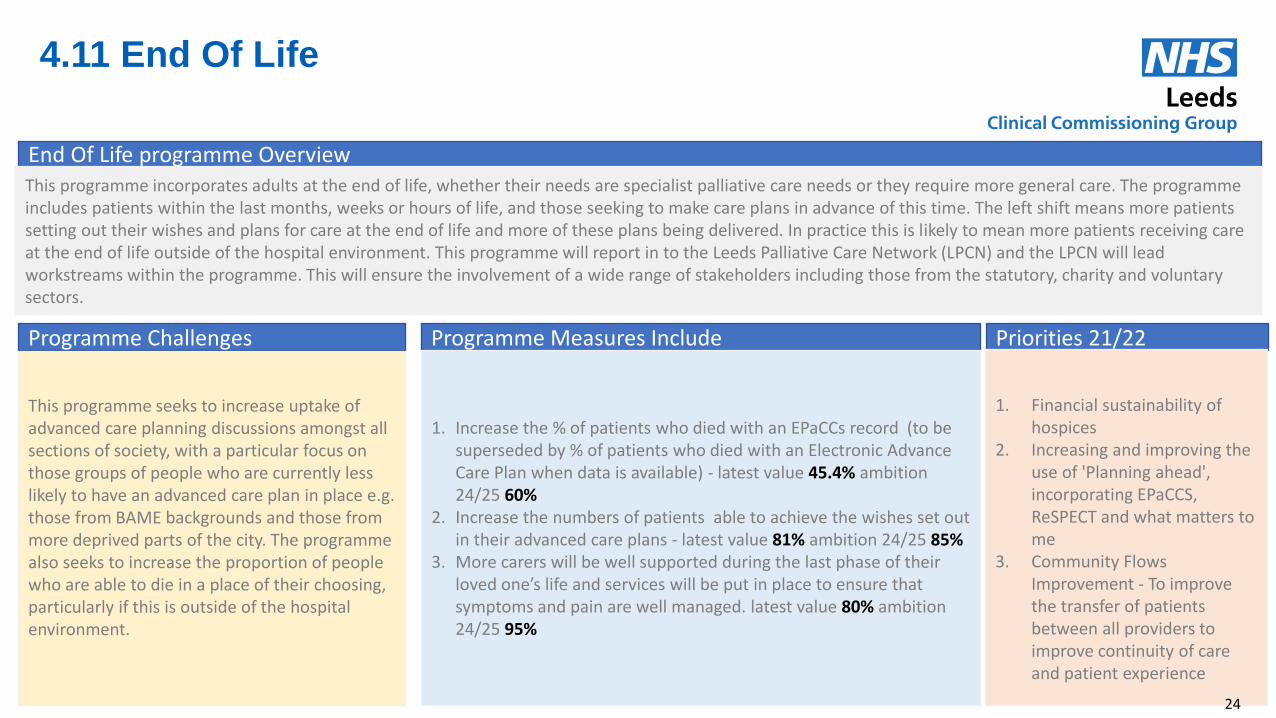
4.11 End Of Life
End Of Life programme Overview
Programme Challenges
This programme seeks to increase uptake of advanced care planning discussions amongst all sections of society, with a particular focus on those groups of people who are currently less likely to have an advanced care plan in place e.g. those from BAME backgrounds and those from more deprived parts of the city. The programme also seeks to increase the proportion of people who are able to die in a place of their choosing, particularly if this is outside of the hospital environment.
Programme Measures Include Priorities 21/22
1. Financial sustainability of
hospices 2. Increasing and improving the
use of 'Planning ahead', incorporating EPaCCS, ReSPECT and what matters to me
3. Community Flows Improvement - To improve the transfer of patients between all providers to improve continuity of care and patient experience
This programme incorporates adults at the end of life, whether their needs are specialist palliative care needs or they require more general care. The programme includes patients within the last months, weeks or hours of life, and those seeking to make care plans in advance of this time. The left shift means more patients setting out their wishes and plans for care at the end of life and more of these plans being delivered. In practice this is likely to mean more patients receiving care at the end of life outside of the hospital environment. This programme will report in to the Leeds Palliative Care Network (LPCN) and the LPCN will lead workstreams within the programme. This will ensure the involvement of a wide range of stakeholders including those from the statutory, charity and voluntary sectors.
1. Increase the % of patients who died with an EPaCCs record (to be superseded by % of patients who died with an Electronic Advance Care Plan when data is available) - latest value 45.4% ambition 24/25 60%
2. Increase the numbers of patients able to achieve the wishes set out in their advanced care plans - latest value 81% ambition 24/25 85%
3. More carers will be well supported during the last phase of their loved one’s life and services will be put in place to ensure that symptoms and pain are well managed. latest value 80% ambition 24/25 95%
24
Building healthier communities
5.0 Building the Leeds Way
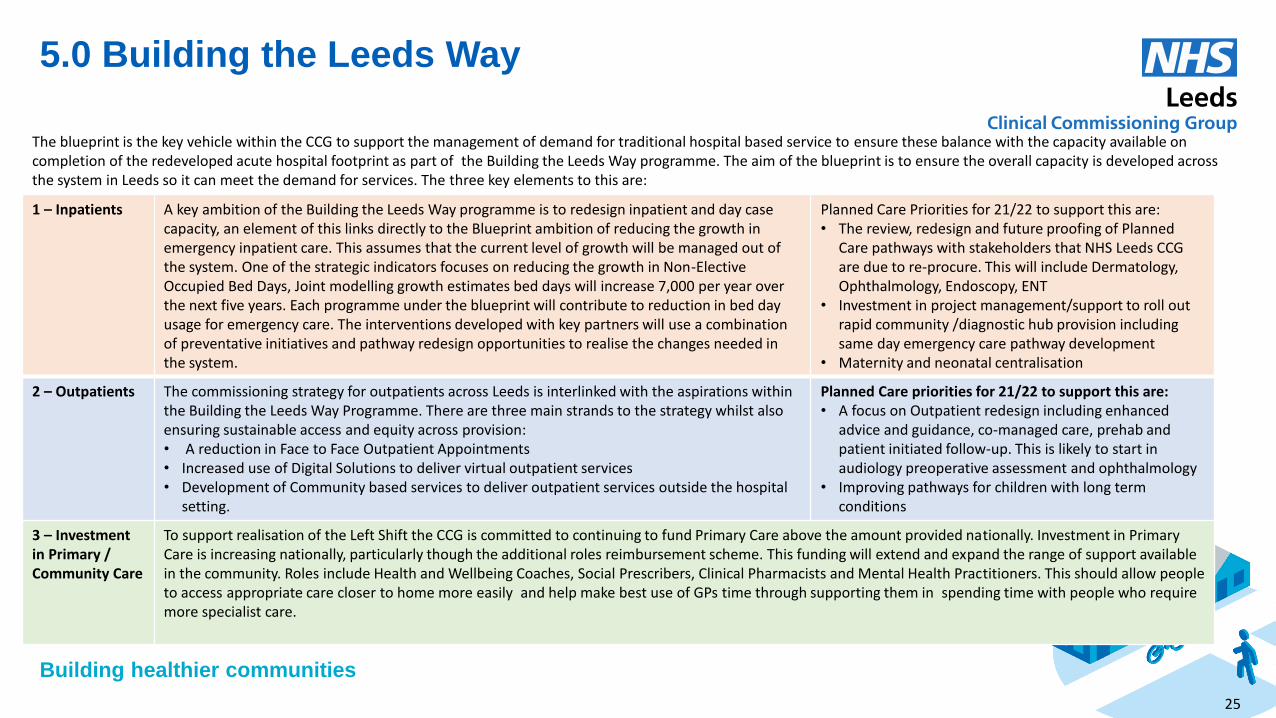
The blueprint is the key vehicle within the CCG to support the management of demand for traditional hospital based service to ensure these balance with the capacity available on completion of the redeveloped acute hospital footprint as part of the Building the Leeds Way programme. The aim of the blueprint is to ensure the overall capacity is developed across the system in Leeds so it can meet the demand for services. The three key elements to this are:
25
1 – Inpatients A key ambition of the Building the Leeds Way programme is to redesign inpatient and day case capacity, an element of this links directly to the Blueprint ambition of reducing the growth in emergency inpatient care. This assumes that the current level of growth will be managed out of the system. One of the strategic indicators focuses on reducing the growth in Non-Elective Occupied Bed Days, Joint modelling growth estimates bed days will increase 7,000 per year over the next five years. Each programme under the blueprint will contribute to reduction in bed day usage for emergency care. The interventions developed with key partners will use a combination of preventative initiatives and pathway redesign opportunities to realise the changes needed in the system.
Planned Care Priorities for 21/22 to support this are: • The review, redesign and future proofing of Planned
Care pathways with stakeholders that NHS Leeds CCG are due to re-procure. This will include Dermatology, Ophthalmology, Endoscopy, ENT
• Investment in project management/support to roll out rapid community /diagnostic hub provision including same day emergency care pathway development
• Maternity and neonatal centralisation
2 – Outpatients The commissioning strategy for outpatients across Leeds is interlinked with the aspirations within the Building the Leeds Way Programme. There are three main strands to the strategy whilst also ensuring sustainable access and equity across provision: • A reduction in Face to Face Outpatient Appointments • Increased use of Digital Solutions to deliver virtual outpatient services • Development of Community based services to deliver outpatient services outside the hospital
setting.
Planned Care priorities for 21/22 to support this are: • A focus on Outpatient redesign including enhanced
advice and guidance, co-managed care, prehab and patient initiated follow-up. This is likely to start in audiology preoperative assessment and ophthalmology
• Improving pathways for children with long term conditions
3 – Investment in Primary / Community Care
To support realisation of the Left Shift the CCG is committed to continuing to fund Primary Care above the amount provided nationally. Investment in Primary Care is increasing nationally, particularly though the additional roles reimbursement scheme. This funding will extend and expand the range of support available in the community. Roles include Health and Wellbeing Coaches, Social Prescribers, Clinical Pharmacists and Mental Health Practitioners. This should allow people to access appropriate care closer to home more easily and help make best use of GPs time through supporting them in spending time with people who require more specialist care.
Building healthier communities
6.0 Impact on key enablers
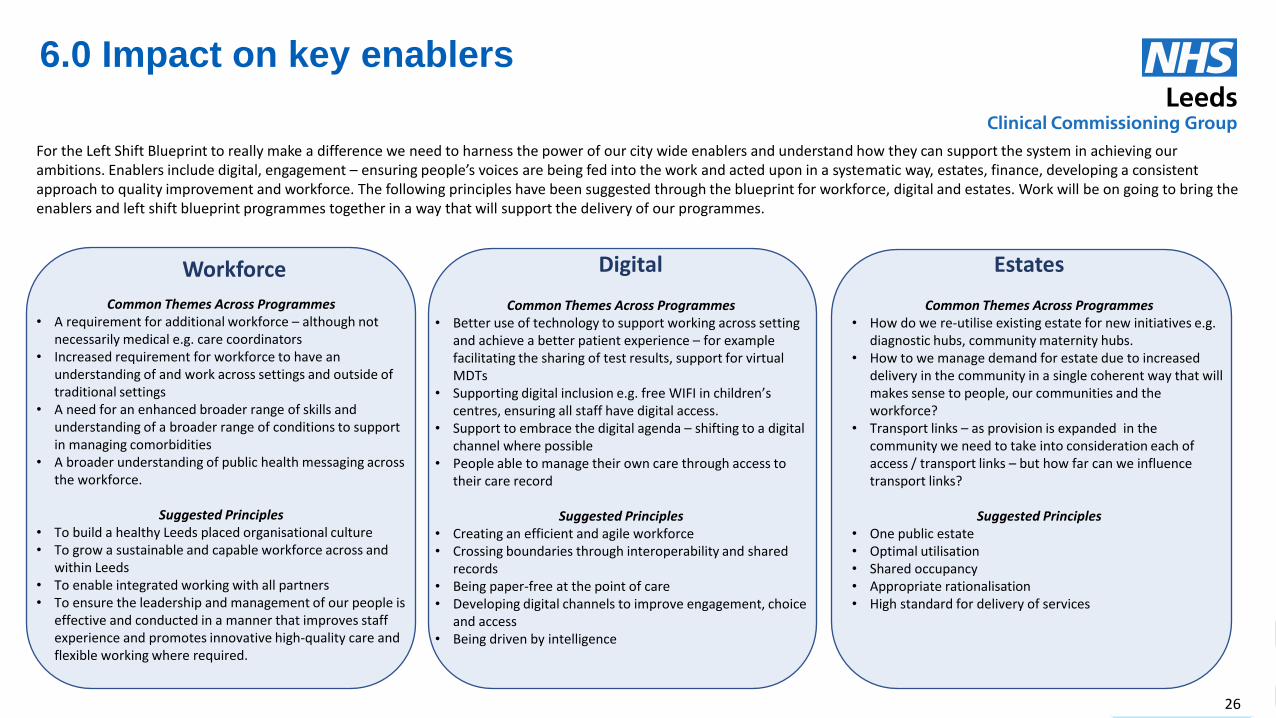
For the Left Shift Blueprint to really make a difference we need to harness the power of our city wide enablers and understand how they can support the system in achieving our ambitions. Enablers include digital, engagement – ensuring people’s voices are being fed into the work and acted upon in a systematic way, estates, finance, developing a consistent approach to quality improvement and workforce. The following principles have been suggested through the blueprint for workforce, digital and estates. Work will be on going to bring the enablers and left shift blueprint programmes together in a way that will support the delivery of our programmes.
Workforce Digital Estates
Common Themes Across Programmes • A requirement for additional workforce – although not
necessarily medical e.g. care coordinators • Increased requirement for workforce to have an
understanding of and work across settings and outside of traditional settings
• A need for an enhanced broader range of skills and understanding of a broader range of conditions to support in managing comorbidities
• A broader understanding of public health messaging across the workforce.
Suggested Principles
• To build a healthy Leeds placed organisational culture • To grow a sustainable and capable workforce across and
within Leeds • To enable integrated working with all partners • To ensure the leadership and management of our people is
effective and conducted in a manner that improves staff experience and promotes innovative high-quality care and flexible working where required.
Common Themes Across Programmes • Better use of technology to support working across setting
and achieve a better patient experience – for example facilitating the sharing of test results, support for virtual MDTs
• Supporting digital inclusion e.g. free WIFI in children’s centres, ensuring all staff have digital access.
• Support to embrace the digital agenda – shifting to a digital channel where possible
• People able to manage their own care through access to their care record
Suggested Principles
• Creating an efficient and agile workforce • Crossing boundaries through interoperability and shared
records • Being paper-free at the point of care • Developing digital channels to improve engagement, choice
and access • Being driven by intelligence
Common Themes Across Programmes • How do we re-utilise existing estate for new initiatives e.g.
diagnostic hubs, community maternity hubs. • How to we manage demand for estate due to increased
delivery in the community in a single coherent way that will makes sense to people, our communities and the workforce?
• Transport links – as provision is expanded in the community we need to take into consideration each of access / transport links – but how far can we influence transport links?
Suggested Principles
• One public estate • Optimal utilisation • Shared occupancy • Appropriate rationalisation • High standard for delivery of services
26
Building healthier communities
7.0 How we will make the change happen
Diagram 5 – Aligning the way we work
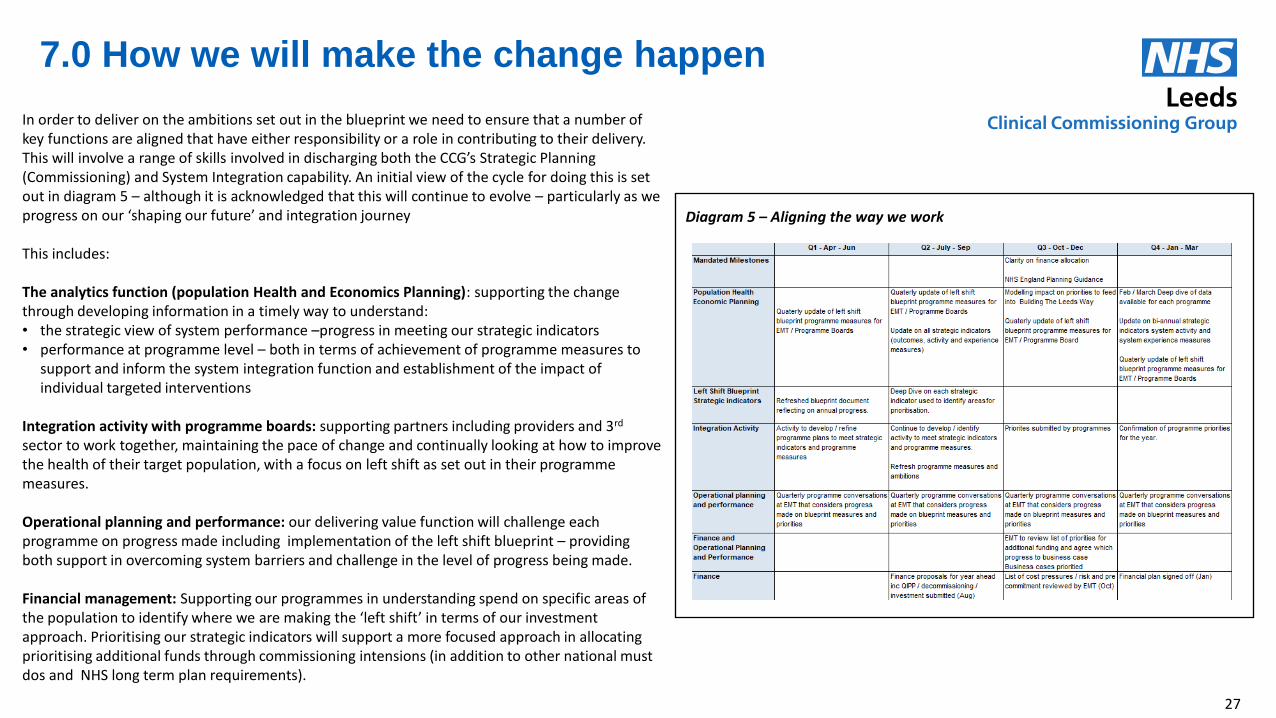
In order to deliver on the ambitions set out in the blueprint we need to ensure that a number of key functions are aligned that have either responsibility or a role in contributing to their delivery. This will involve a range of skills involved in discharging both the CCG’s Strategic Planning (Commissioning) and System Integration capability. An initial view of the cycle for doing this is set out in diagram 5 – although it is acknowledged that this will continue to evolve – particularly as we progress on our ‘shaping our future’ and integration journey This includes: The analytics function (population Health and Economics Planning): supporting the change through developing information in a timely way to understand: • the strategic view of system performance –progress in meeting our strategic indicators • performance at programme level – both in terms of achievement of programme measures to
support and inform the system integration function and establishment of the impact of individual targeted interventions
Integration activity with programme boards: supporting partners including providers and 3rd sector to work together, maintaining the pace of change and continually looking at how to improve the health of their target population, with a focus on left shift as set out in their programme measures. Operational planning and performance: our delivering value function will challenge each programme on progress made including implementation of the left shift blueprint – providing both support in overcoming system barriers and challenge in the level of progress being made. Financial management: Supporting our programmes in understanding spend on specific areas of the population to identify where we are making the ‘left shift’ in terms of our investment approach. Prioritising our strategic indicators will support a more focused approach in allocating prioritising additional funds through commissioning intensions (in addition to other national must dos and NHS long term plan requirements).
27
Building healthier communities
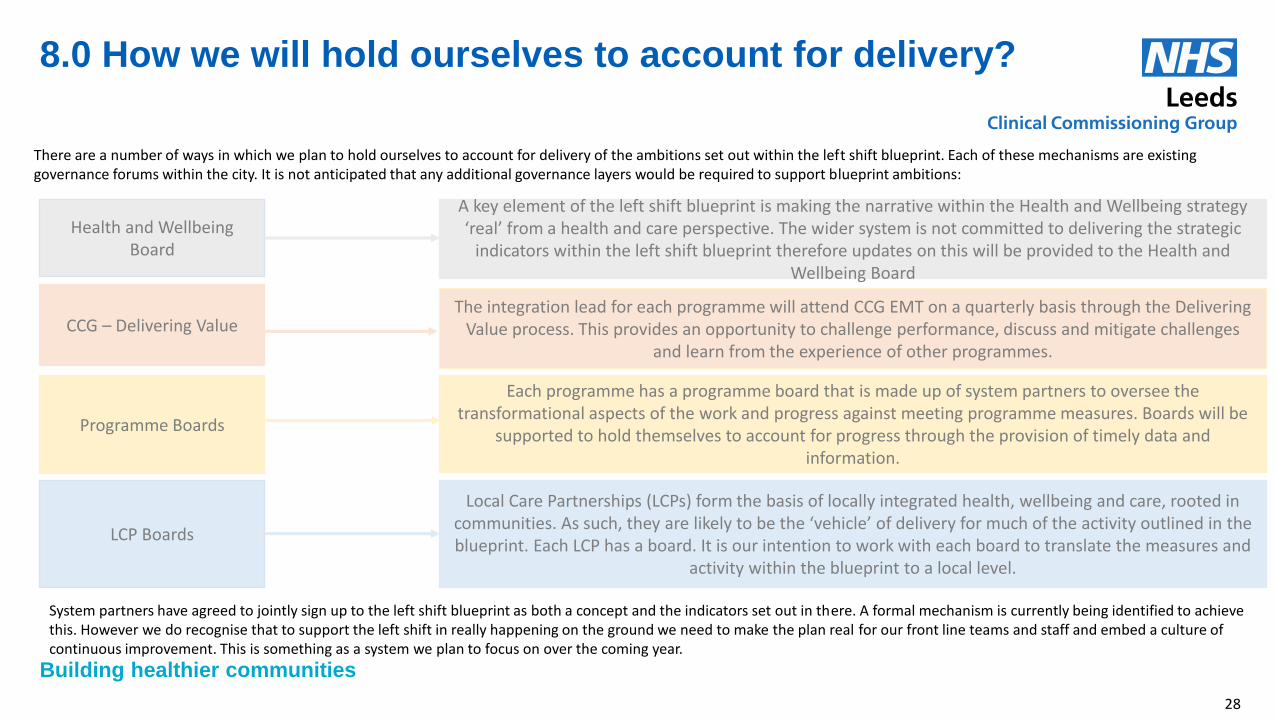
8.0 How we will hold ourselves to account for delivery?
Local Care Partnerships (LCPs) form the basis of locally integrated health, wellbeing and care, rooted in communities. As such, they are likely to be the ‘vehicle’ of delivery for much of the activity outlined in the blueprint. Each LCP has a board. It is our intention to work with each board to translate the measures and
activity within the blueprint to a local level.
Each programme has a programme board that is made up of system partners to oversee the transformational aspects of the work and progress against meeting programme measures. Boards will be
supported to hold themselves to account for progress through the provision of timely data and information.
The integration lead for each programme will attend CCG EMT on a quarterly basis through the Delivering Value process. This provides an opportunity to challenge performance, discuss and mitigate challenges
and learn from the experience of other programmes.
A key element of the left shift blueprint is making the narrative within the Health and Wellbeing strategy ‘real’ from a health and care perspective. The wider system is not committed to delivering the strategic
indicators within the left shift blueprint therefore updates on this will be provided to the Health and Wellbeing Board
System partners have agreed to jointly sign up to the left shift blueprint as both a concept and the indicators set out in there. A formal mechanism is currently being identified to achieve this. However we do recognise that to support the left shift in really happening on the ground we need to make the plan real for our front line teams and staff and embed a culture of continuous improvement. This is something as a system we plan to focus on over the coming year.
LCP Boards
Programme Boards
CCG – Delivering Value
Health and Wellbeing Board
There are a number of ways in which we plan to hold ourselves to account for delivery of the ambitions set out within the left shift blueprint. Each of these mechanisms are existing governance forums within the city. It is not anticipated that any additional governance layers would be required to support blueprint ambitions:
28
Building healthier communities
9.0 Next steps
The development of the blueprint document is just the start of our integration journey. The focus over the coming years now needs to be on delivery, making a real change to the people living in our communities and addressing the health inequalities that currently exist across the city. The following next steps will be taken to look to move the left shift blueprint from being a plan and a concept into becoming a reality and taking us some way towards achieving our system wide vision of being ‘ a healthy and caring city for all ages where people who are the poorest improve their health the fastest’.
No Proposed next step
1 Development of an MOU to symbolise system commitment to delivery of the blueprint and support partners in holding each other to account.
2 Work with each programme boards to understand the support required for them to implement the change as set out in their programmes and for them to make a real difference for the population that they cover
3 Engage LCPs and PCNs to support them in leading the blueprint at a local level and making the change real on the ground
4 Fully engage and embed the key citywide enablers within the programmes including: workforce, estates, digital, OD, finance, communications
5 Set out the pivotal role that business intelligence will have in delivering the plan and developing a single version of the truth, particularly through further developing the Leeds data model and agree a plan to put the necessary changes in place
6 Develop an OD plan for the system focusing on: raising awareness amongst boards key system partners on the blueprint and influencers and agreeing how it can be ‘translated’ in a meaningful way to front line staff and teams.
7 Establish which strategic indicators as a system we need to have an increased focus on. This will be a key element of the refreshed commissioning cycle
29
Building healthier communities
Appendix A – Current performance against our strategic indicators.
30
Building healthier communities
HA1 Infant Mortality Rate per 1,000 births
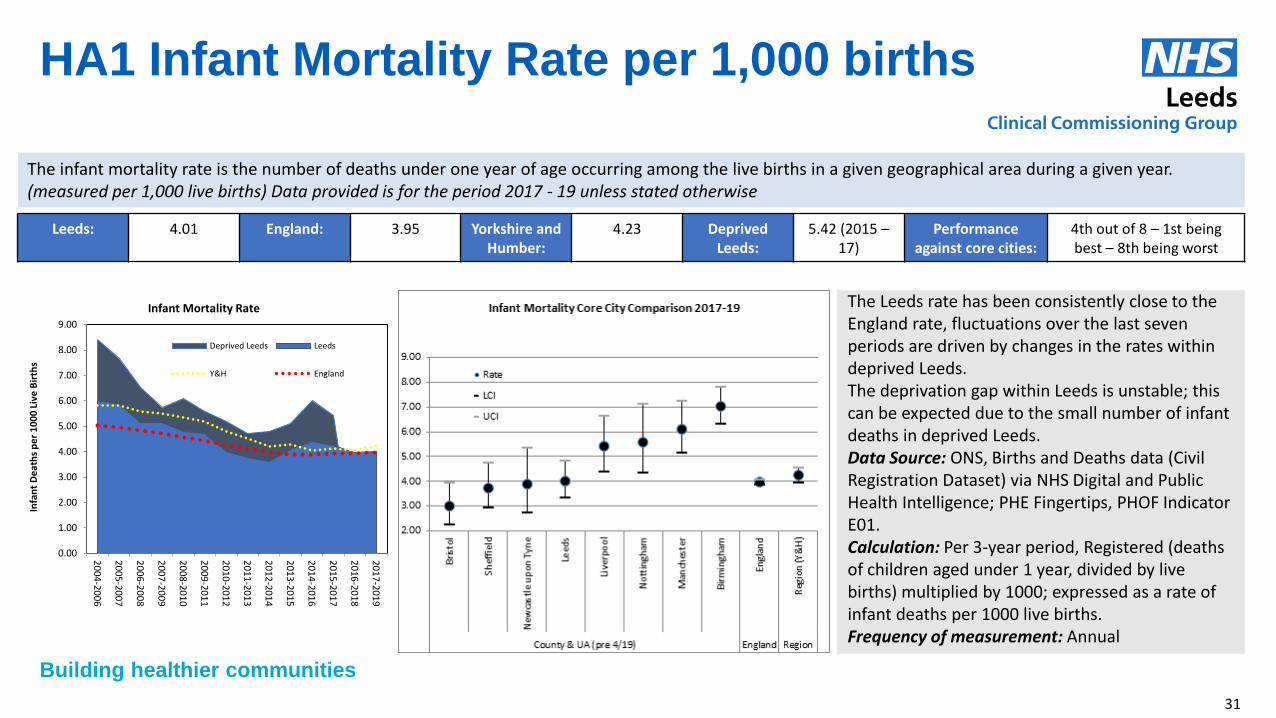
The infant mortality rate is the number of deaths under one year of age occurring among the live births in a given geographical area during a given year. (measured per 1,000 live births) Data provided is for the period 2017 - 19 unless stated otherwise
Leeds: 4.01 England: 3.95 Yorkshire and Humber:
4.23 Deprived Leeds:
5.42 (2015 – 17)
Performance against core cities:
4th out of 8 – 1st being best – 8th being worst
0.00
1.00
2.00
3.00
4.00
5.00
6.00
7.00
8.00
9.00
20
04-20
06
20
05-20
07
20
06-20
08
20
07-20
09
20
08-20
10
20
09-20
11
20
10-20
12
20
11-20
13
20
12-20
14
20
13-20
15
20
14-20
16
20
15-20
17
20
16-20
18
20
17-20
19
Infa
nt
De
ath
s p
er
10
00
Liv
e B
irth
s
Infant Mortality Rate
Deprived Leeds Leeds
Y&H England
The Leeds rate has been consistently close to the England rate, fluctuations over the last seven periods are driven by changes in the rates within deprived Leeds. The deprivation gap within Leeds is unstable; this can be expected due to the small number of infant deaths in deprived Leeds. Data Source: ONS, Births and Deaths data (Civil Registration Dataset) via NHS Digital and Public Health Intelligence; PHE Fingertips, PHOF Indicator E01. Calculation: Per 3-year period, Registered (deaths of children aged under 1 year, divided by live births) multiplied by 1000; expressed as a rate of infant deaths per 1000 live births. Frequency of measurement: Annual
31
Building healthier communities
HA2 Obesity % Excess Weight 10 – 11 year olds
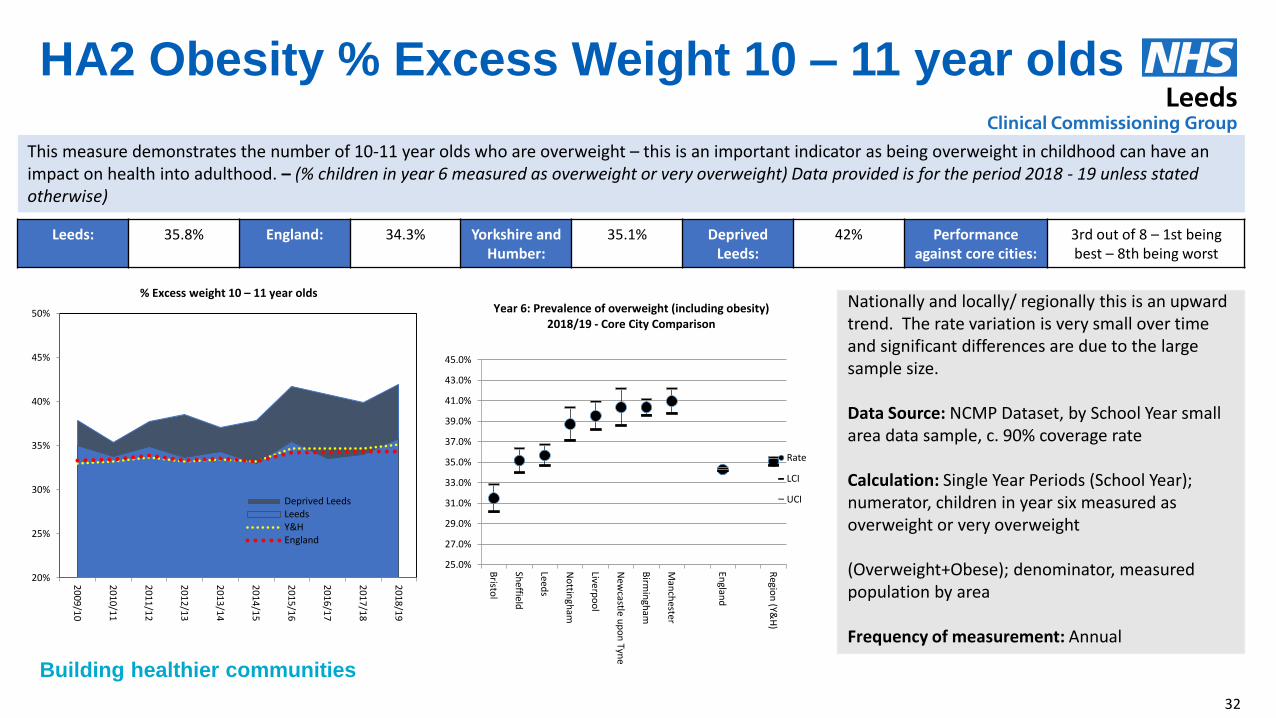
This measure demonstrates the number of 10-11 year olds who are overweight – this is an important indicator as being overweight in childhood can have an impact on health into adulthood. – (% children in year 6 measured as overweight or very overweight) Data provided is for the period 2018 - 19 unless stated otherwise)
Leeds: 35.8% England: 34.3% Yorkshire and Humber:
35.1% Deprived Leeds:
42% Performance against core cities:
3rd out of 8 – 1st being best – 8th being worst
20%
25%
30%
35%
40%
45%
50%
20
09/1
0
20
10/1
1
20
11/1
2
20
12/1
3
20
13/1
4
20
14/1
5
20
15/1
6
20
16/1
7
20
17/1
8
20
18/1
9
% Excess weight 10 – 11 year olds
Deprived LeedsLeedsY&HEngland
25.0%
27.0%
29.0%
31.0%
33.0%
35.0%
37.0%
39.0%
41.0%
43.0%
45.0%
Bristo
l
Sheffield
Leeds
No
ttingh
am
Liverp
oo
l
New
castle up
on
Tyne
Birm
ingh
am
Man
chester
Englan
d
Regio
n (Y&
H)
Year 6: Prevalence of overweight (including obesity) 2018/19 - Core City Comparison
Rate
LCI
UCI
Nationally and locally/ regionally this is an upward trend. The rate variation is very small over time and significant differences are due to the large sample size. Data Source: NCMP Dataset, by School Year small area data sample, c. 90% coverage rate Calculation: Single Year Periods (School Year); numerator, children in year six measured as overweight or very overweight (Overweight+Obese); denominator, measured population by area Frequency of measurement: Annual
32
Building healthier communities
HA3 Healthy Life Expectancy At Birth
The measure is the number of years at birth (infants born in that given year) can expect to live a healthy life for. Healthy is a self-reported measure and is not clinically led, meaning that an individual could have a long term condition but feel it is well managed and they are still healthy. As such the measure represents both an indication of the effectiveness of clinical care, but also the quality of care provided to patients in a given area but drawing on both a self-reported element and a quantitative health outcome indicator. (expected years of life without illness) Data provided is for the period 2016 - 18 unless stated otherwise.
Leeds (male): 62.2 Leeds (female) 64.1 England (male) 63.4 England (female) 63.9 Both nationally and within Leeds population, the trend is upwards for males. For females, a similar but more dramatic change has occurred in the relative rates. Leeds women now have a higher healthy life expectancy than those in England. Data Source: ONS Deaths Data (Civil Registration Dataset) via NHS Digital; ONS Mid-Year Population Estimates; Annual Population Survey (APS); PHE Fingertips, PHOF A01a. Calculation: Per 3 year aggregate period, expected years of life without illness (self-reported via APS at LA level and above). No local indicator available to map sub-Leeds levels of analysis. Frequency of measurement: Annual
0
0.5
1
1.5
2
2.5
3
3.5
58
59
60
61
62
63
64
20
09 - 1
1
20
10 - 1
2
20
11 - 1
3
20
12 - 1
4
20
13 - 1
5
20
14 - 1
6
20
15 - 1
7
20
16 - 1
8
Male
Gap
(ye
ars)
He
alth
y Li
fe E
xpe
ctan
cy (
year
s)
Healthy life expectancy at birth Leeds and England Trajectories: Male
Gap (years)
England
Leeds
Linear (England)
Linear (Leeds)
-0.5
0
0.5
1
1.5
2
2.5
3
3.5
59
59.5
60
60.5
61
61.5
62
62.5
63
63.5
64
64.5
20
09 - 1
1
20
10 - 1
2
20
11 - 1
3
20
12 - 1
4
20
13 - 1
5
20
14 - 1
6
20
15 - 1
7
20
16 - 1
8
Female
Gap
(ye
ars)
He
alth
y Li
fe E
xpe
ctan
cy (
year
s)
Healthy life expectancy at birth Leeds and England Trajectories: Female
Gap (years)
England
Leeds
Linear (England)
Linear (Leeds)
33
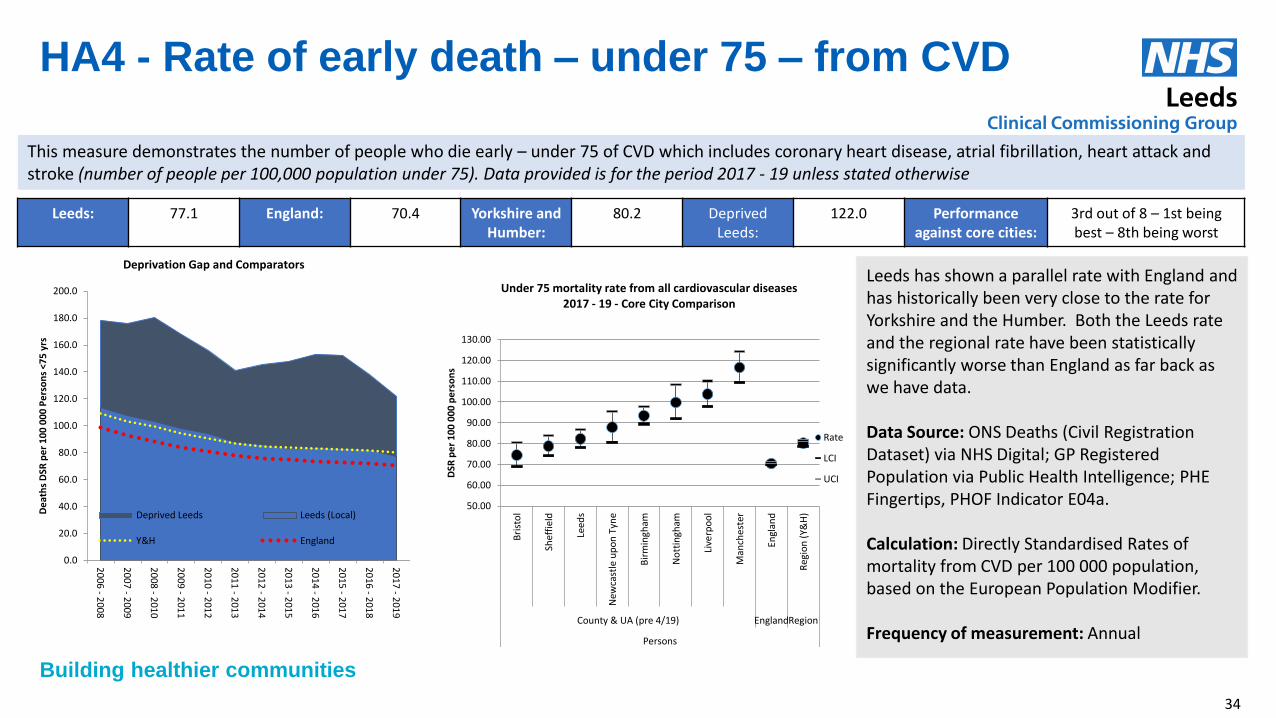
Building healthier communities
HA4 - Rate of early death – under 75 – from CVD
This measure demonstrates the number of people who die early – under 75 of CVD which includes coronary heart disease, atrial fibrillation, heart attack and stroke (number of people per 100,000 population under 75). Data provided is for the period 2017 - 19 unless stated otherwise
Leeds has shown a parallel rate with England and has historically been very close to the rate for Yorkshire and the Humber. Both the Leeds rate and the regional rate have been statistically significantly worse than England as far back as we have data. Data Source: ONS Deaths (Civil Registration Dataset) via NHS Digital; GP Registered Population via Public Health Intelligence; PHE Fingertips, PHOF Indicator E04a. Calculation: Directly Standardised Rates of mortality from CVD per 100 000 population, based on the European Population Modifier. Frequency of measurement: Annual
Leeds: 77.1 England: 70.4 Yorkshire and Humber:
80.2 Deprived Leeds:
122.0 Performance against core cities:
3rd out of 8 – 1st being best – 8th being worst
50.00
60.00
70.00
80.00
90.00
100.00
110.00
120.00
130.00
Bri
sto
l
Shef
fiel
d
Leed
s
New
cast
le u
po
n T
yne
Bir
min
gham
No
ttin
gham
Live
rpo
ol
Man
ches
ter
Engl
and
Reg
ion
(Y&
H)
County & UA (pre 4/19) EnglandRegion
Persons
DSR
pe
r 1
00
00
0 p
ers
on
s
Under 75 mortality rate from all cardiovascular diseases 2017 - 19 - Core City Comparison
Rate
LCI
UCI
0.0
20.0
40.0
60.0
80.0
100.0
120.0
140.0
160.0
180.0
200.0
20
06 - 2
008
20
07 - 2
009
20
08 - 2
010
20
09 - 2
011
20
10 - 2
012
20
11 - 2
013
20
12 - 2
014
20
13 - 2
015
20
14 - 2
016
20
15 - 2
017
20
16 - 2
018
20
17 - 2
019
De
ath
s D
SR p
er
10
0 0
00
Pe
rso
ns
<75
yrs
Deprivation Gap and Comparators
Deprived Leeds Leeds (Local)
Y&H England
34
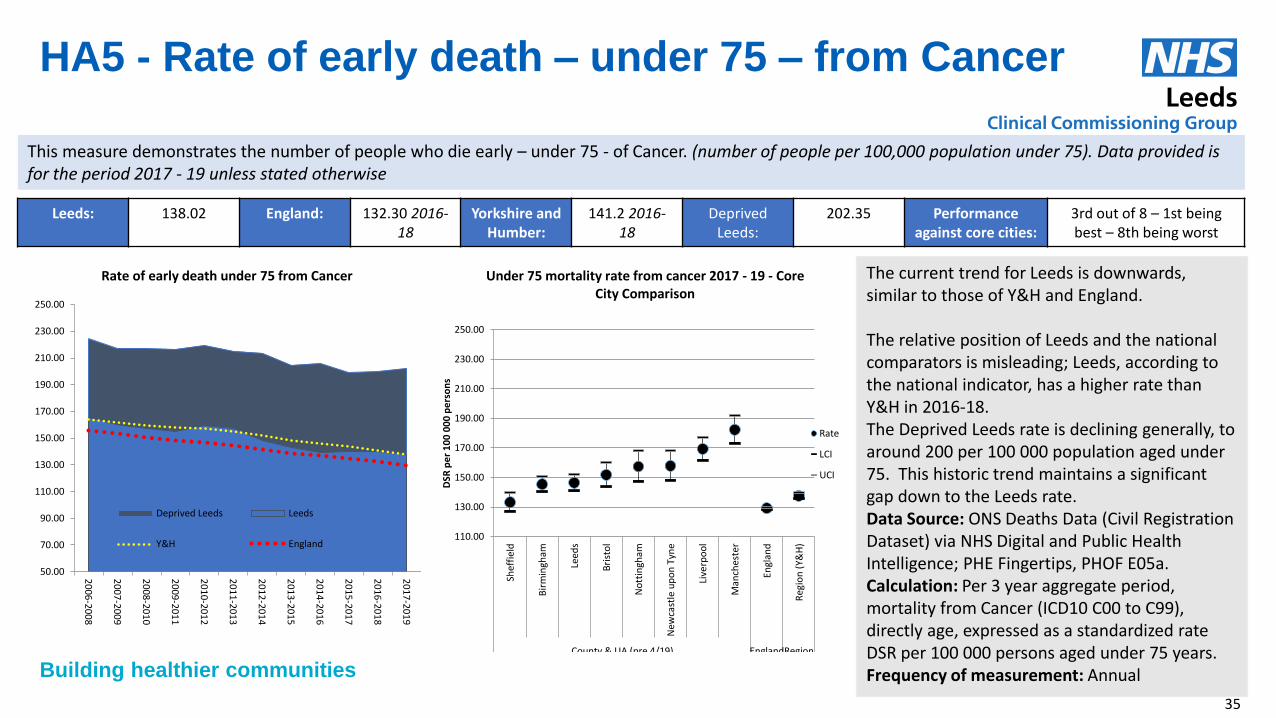
Building healthier communities
HA5 - Rate of early death – under 75 – from Cancer
This measure demonstrates the number of people who die early – under 75 - of Cancer. (number of people per 100,000 population under 75). Data provided is for the period 2017 - 19 unless stated otherwise
The current trend for Leeds is downwards, similar to those of Y&H and England. The relative position of Leeds and the national comparators is misleading; Leeds, according to the national indicator, has a higher rate than Y&H in 2016-18. The Deprived Leeds rate is declining generally, to around 200 per 100 000 population aged under 75. This historic trend maintains a significant gap down to the Leeds rate. Data Source: ONS Deaths Data (Civil Registration Dataset) via NHS Digital and Public Health Intelligence; PHE Fingertips, PHOF E05a. Calculation: Per 3 year aggregate period, mortality from Cancer (ICD10 C00 to C99), directly age, expressed as a standardized rate DSR per 100 000 persons aged under 75 years. Frequency of measurement: Annual
Leeds: 138.02 England: 132.30 2016-18
Yorkshire and Humber:
141.2 2016-18
Deprived Leeds:
202.35 Performance against core cities:
3rd out of 8 – 1st being best – 8th being worst
50.00
70.00
90.00
110.00
130.00
150.00
170.00
190.00
210.00
230.00
250.00
20
06-20
08
20
07-20
09
20
08-20
10
20
09-20
11
20
10-20
12
20
11-20
13
20
12-20
14
20
13-20
15
20
14-20
16
20
15-20
17
20
16-20
18
20
17-20
19
Rate of early death under 75 from Cancer
Deprived Leeds Leeds
Y&H England110.00
130.00
150.00
170.00
190.00
210.00
230.00
250.00
Shef
fiel
d
Bir
min
gham
Leed
s
Bri
sto
l
No
ttin
gham
New
cast
le u
po
n T
yne
Live
rpo
ol
Man
ches
ter
Engl
and
Reg
ion
(Y&
H)
County & UA (pre 4/19) EnglandRegion
Persons
DSR
pe
r 1
00
00
0 p
ers
on
s
Under 75 mortality rate from cancer 2017 - 19 - Core City Comparison
Rate
LCI
UCI
35
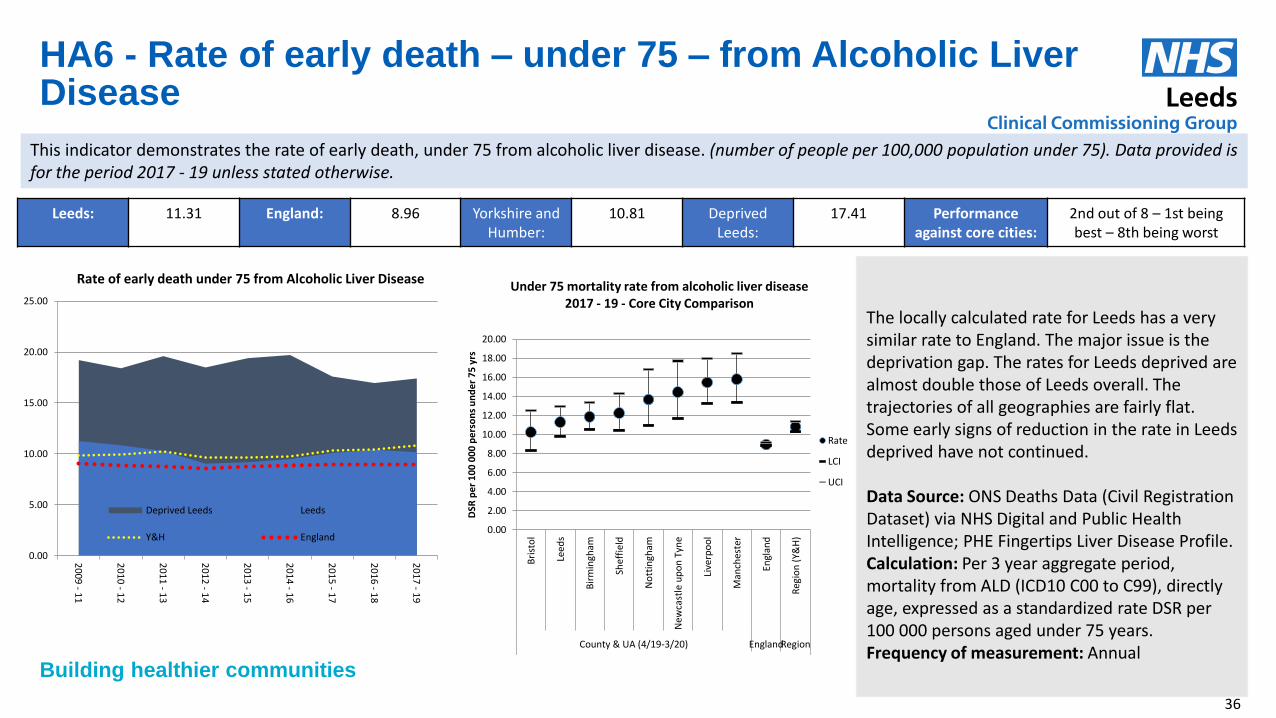
Building healthier communities
HA6 - Rate of early death – under 75 – from Alcoholic Liver Disease
This indicator demonstrates the rate of early death, under 75 from alcoholic liver disease. (number of people per 100,000 population under 75). Data provided is for the period 2017 - 19 unless stated otherwise.
The locally calculated rate for Leeds has a very similar rate to England. The major issue is the deprivation gap. The rates for Leeds deprived are almost double those of Leeds overall. The trajectories of all geographies are fairly flat. Some early signs of reduction in the rate in Leeds deprived have not continued. Data Source: ONS Deaths Data (Civil Registration Dataset) via NHS Digital and Public Health Intelligence; PHE Fingertips Liver Disease Profile. Calculation: Per 3 year aggregate period, mortality from ALD (ICD10 C00 to C99), directly age, expressed as a standardized rate DSR per 100 000 persons aged under 75 years. Frequency of measurement: Annual
Leeds: 11.31 England: 8.96 Yorkshire and Humber:
10.81 Deprived Leeds:
17.41 Performance against core cities:
2nd out of 8 – 1st being best – 8th being worst
0.00
5.00
10.00
15.00
20.00
25.00
20
09 - 1
1
20
10 - 1
2
20
11 - 1
3
20
12 - 1
4
20
13 - 1
5
20
14 - 1
6
20
15 - 1
7
20
16 - 1
8
20
17 - 1
9
Rate of early death under 75 from Alcoholic Liver Disease
Deprived Leeds Leeds
Y&H England0.00
2.00
4.00
6.00
8.00
10.00
12.00
14.00
16.00
18.00
20.00
Bri
sto
l
Leed
s
Bir
min
gham
Shef
fiel
d
No
ttin
gham
New
cast
le u
po
n T
yne
Live
rpo
ol
Man
ches
ter
Engl
and
Reg
ion
(Y&
H)
County & UA (4/19-3/20) EnglandRegion
Persons
DSR
pe
r 1
00
00
0 p
ers
on
s u
nd
er
75
yrs
Under 75 mortality rate from alcoholic liver disease 2017 - 19 - Core City Comparison
Rate
LCI
UCI
36
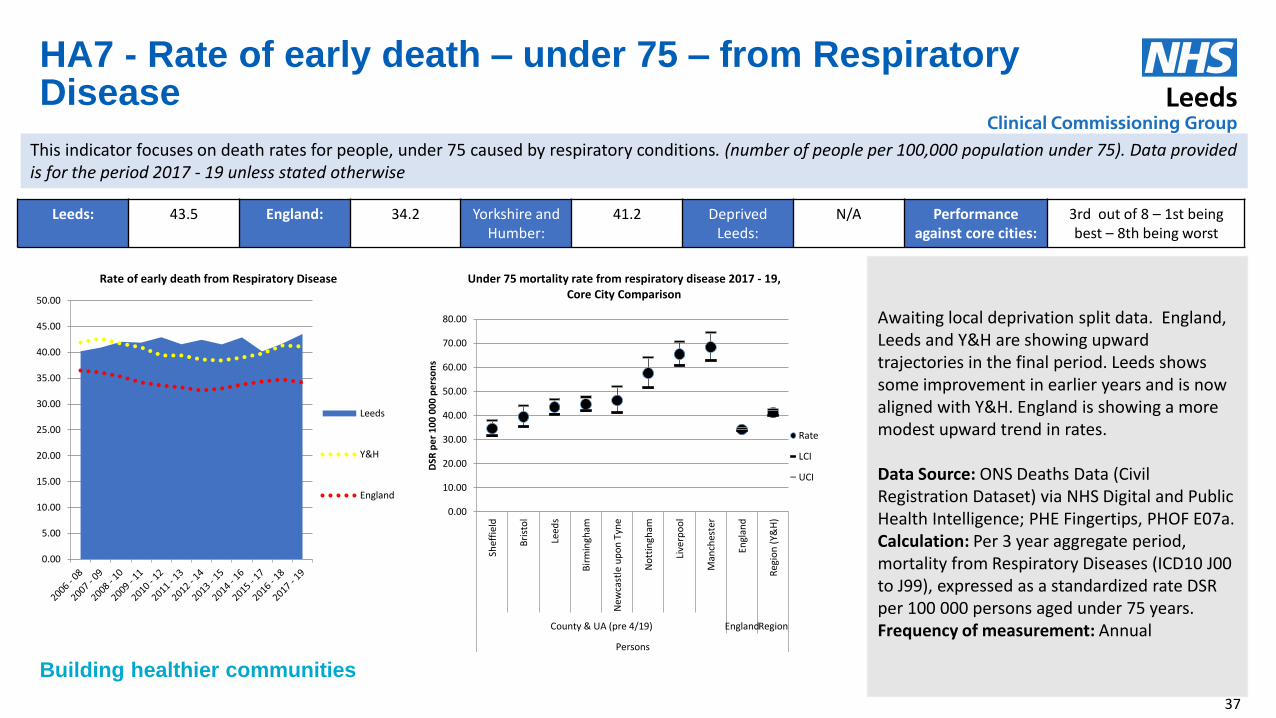
Building healthier communities
HA7 - Rate of early death – under 75 – from Respiratory Disease
This indicator focuses on death rates for people, under 75 caused by respiratory conditions. (number of people per 100,000 population under 75). Data provided is for the period 2017 - 19 unless stated otherwise
Leeds: 43.5 England: 34.2 Yorkshire and Humber:
41.2 Deprived Leeds:
N/A Performance against core cities:
3rd out of 8 – 1st being best – 8th being worst
Awaiting local deprivation split data. England, Leeds and Y&H are showing upward trajectories in the final period. Leeds shows some improvement in earlier years and is now aligned with Y&H. England is showing a more modest upward trend in rates. Data Source: ONS Deaths Data (Civil Registration Dataset) via NHS Digital and Public Health Intelligence; PHE Fingertips, PHOF E07a. Calculation: Per 3 year aggregate period, mortality from Respiratory Diseases (ICD10 J00 to J99), expressed as a standardized rate DSR per 100 000 persons aged under 75 years. Frequency of measurement: Annual
0.00
5.00
10.00
15.00
20.00
25.00
30.00
35.00
40.00
45.00
50.00
Rate of early death from Respiratory Disease
Leeds
Y&H
England
0.00
10.00
20.00
30.00
40.00
50.00
60.00
70.00
80.00
Shef
fiel
d
Bri
sto
l
Leed
s
Bir
min
gham
New
cast
le u
po
n T
yne
No
ttin
gham
Live
rpo
ol
Man
ches
ter
Engl
and
Reg
ion
(Y&
H)
County & UA (pre 4/19) EnglandRegion
Persons
DSR
pe
r 1
00
00
0 p
ers
on
s
Under 75 mortality rate from respiratory disease 2017 - 19, Core City Comparison
Rate
LCI
UCI
37
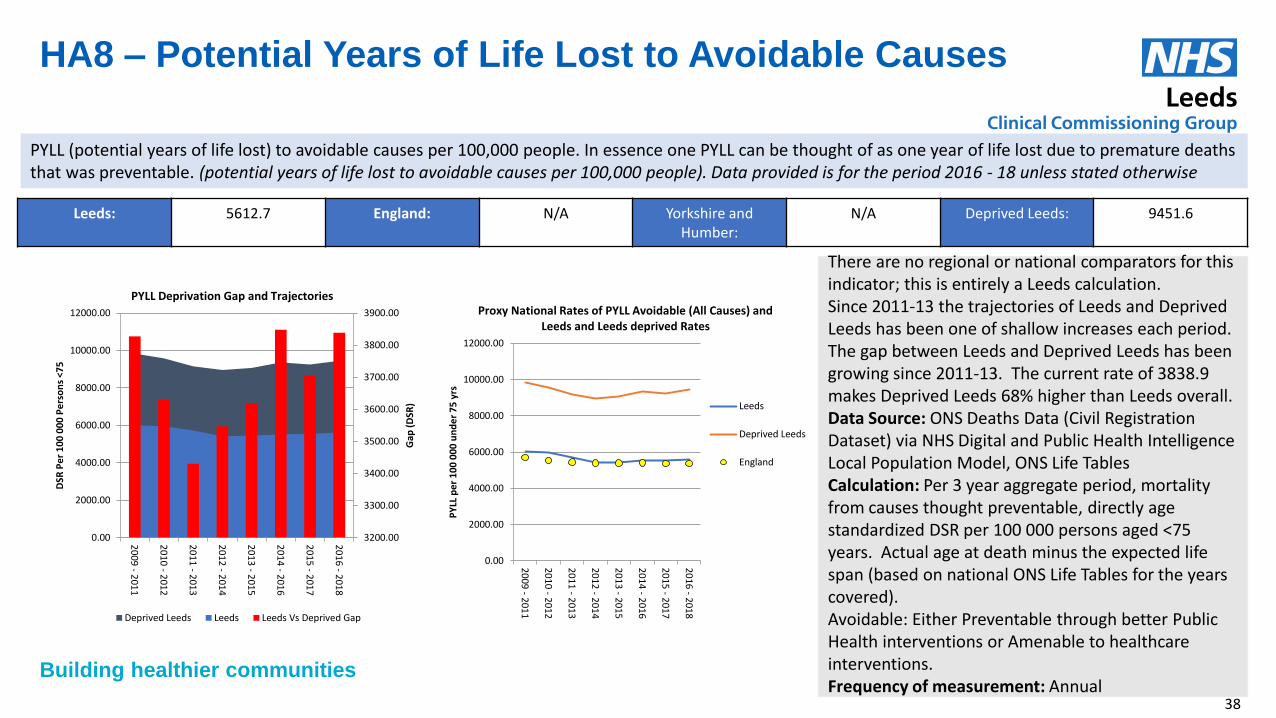
Building healthier communities
HA8 – Potential Years of Life Lost to Avoidable Causes
PYLL (potential years of life lost) to avoidable causes per 100,000 people. In essence one PYLL can be thought of as one year of life lost due to premature deaths that was preventable. (potential years of life lost to avoidable causes per 100,000 people). Data provided is for the period 2016 - 18 unless stated otherwise
Leeds: 5612.7 England: N/A Yorkshire and Humber:
N/A Deprived Leeds: 9451.6
There are no regional or national comparators for this indicator; this is entirely a Leeds calculation. Since 2011-13 the trajectories of Leeds and Deprived Leeds has been one of shallow increases each period. The gap between Leeds and Deprived Leeds has been growing since 2011-13. The current rate of 3838.9 makes Deprived Leeds 68% higher than Leeds overall. Data Source: ONS Deaths Data (Civil Registration Dataset) via NHS Digital and Public Health Intelligence Local Population Model, ONS Life Tables Calculation: Per 3 year aggregate period, mortality from causes thought preventable, directly age standardized DSR per 100 000 persons aged <75 years. Actual age at death minus the expected life span (based on national ONS Life Tables for the years covered). Avoidable: Either Preventable through better Public Health interventions or Amenable to healthcare interventions. Frequency of measurement: Annual
3200.00
3300.00
3400.00
3500.00
3600.00
3700.00
3800.00
3900.00
0.00
2000.00
4000.00
6000.00
8000.00
10000.00
12000.00
20
09 - 2
011
20
10 - 2
012
20
11 - 2
013
20
12 - 2
014
20
13 - 2
015
20
14 - 2
016
20
15 - 2
017
20
16 - 2
018
Gap
(D
SR)
DSR
Pe
r 1
00
00
0 P
ers
on
s <7
5
PYLL Deprivation Gap and Trajectories
Deprived Leeds Leeds Leeds Vs Deprived Gap
0.00
2000.00
4000.00
6000.00
8000.00
10000.00
12000.00
20
09 - 2
011
20
10 - 2
012
20
11 - 2
013
20
12 - 2
014
20
13 - 2
015
20
14 - 2
016
20
15 - 2
017
20
16 - 2
018
PY
LL p
er
10
0 0
00
un
de
r 7
5 y
rs
Proxy National Rates of PYLL Avoidable (All Causes) and Leeds and Leeds deprived Rates
Leeds
Deprived Leeds
England
38
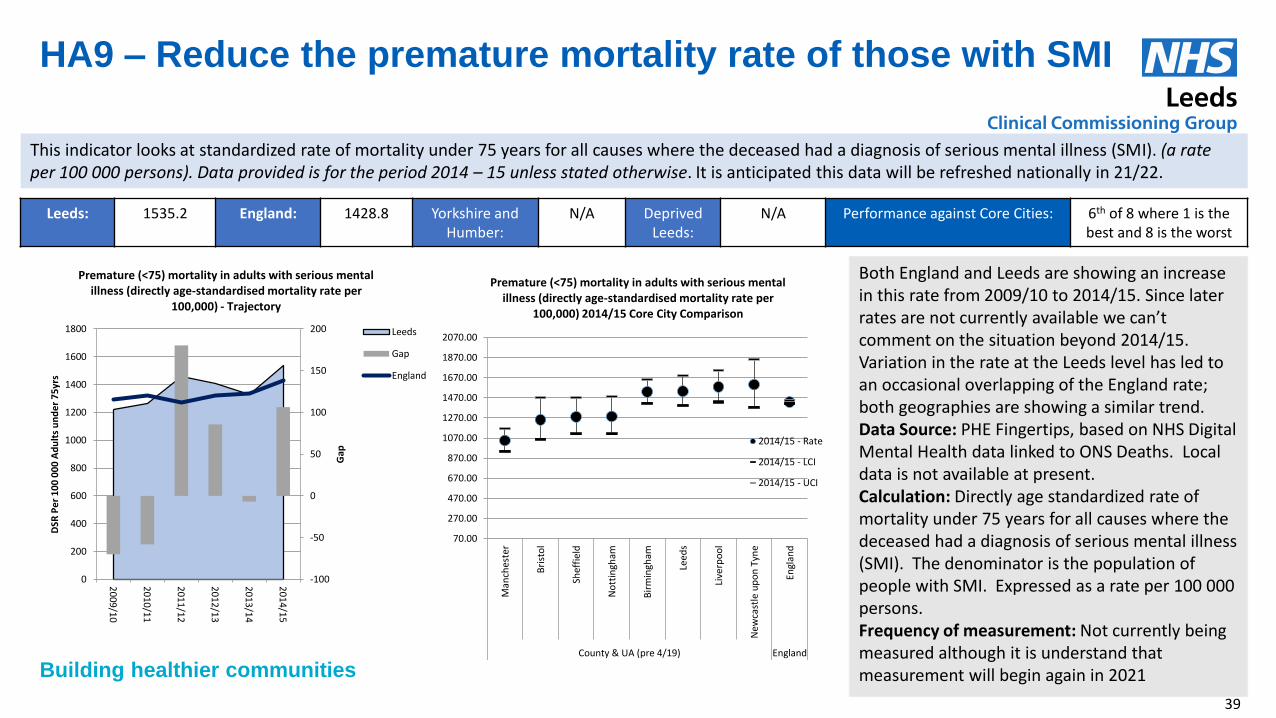
Building healthier communities
HA9 – Reduce the premature mortality rate of those with SMI
This indicator looks at standardized rate of mortality under 75 years for all causes where the deceased had a diagnosis of serious mental illness (SMI). (a rate per 100 000 persons). Data provided is for the period 2014 – 15 unless stated otherwise. It is anticipated this data will be refreshed nationally in 21/22.
Leeds: 1535.2 England: 1428.8 Yorkshire and Humber:
N/A Deprived Leeds:
N/A Performance against Core Cities: 6th of 8 where 1 is the best and 8 is the worst
Both England and Leeds are showing an increase in this rate from 2009/10 to 2014/15. Since later rates are not currently available we can’t comment on the situation beyond 2014/15. Variation in the rate at the Leeds level has led to an occasional overlapping of the England rate; both geographies are showing a similar trend. Data Source: PHE Fingertips, based on NHS Digital Mental Health data linked to ONS Deaths. Local data is not available at present. Calculation: Directly age standardized rate of mortality under 75 years for all causes where the deceased had a diagnosis of serious mental illness (SMI). The denominator is the population of people with SMI. Expressed as a rate per 100 000 persons. Frequency of measurement: Not currently being measured although it is understand that measurement will begin again in 2021
-100
-50
0
50
100
150
200
0
200
400
600
800
1000
1200
1400
1600
1800
20
09/1
0
20
10/1
1
20
11/1
2
20
12/1
3
20
13/1
4
20
14/1
5
Gap
DSR
Pe
r 1
00
00
0 A
du
lts
un
de
r 7
5yr
s
Premature (<75) mortality in adults with serious mental illness (directly age-standardised mortality rate per
100,000) - Trajectory
Leeds
Gap
England
70.00
270.00
470.00
670.00
870.00
1070.00
1270.00
1470.00
1670.00
1870.00
2070.00
Man
ches
ter
Bri
sto
l
Shef
fiel
d
No
ttin
gham
Bir
min
gham
Leed
s
Live
rpo
ol
New
cast
le u
po
n T
yne
Engl
and
County & UA (pre 4/19) England
Premature (<75) mortality in adults with serious mental illness (directly age-standardised mortality rate per
100,000) 2014/15 Core City Comparison
2014/15 - Rate
2014/15 - LCI
2014/15 - UCI
39
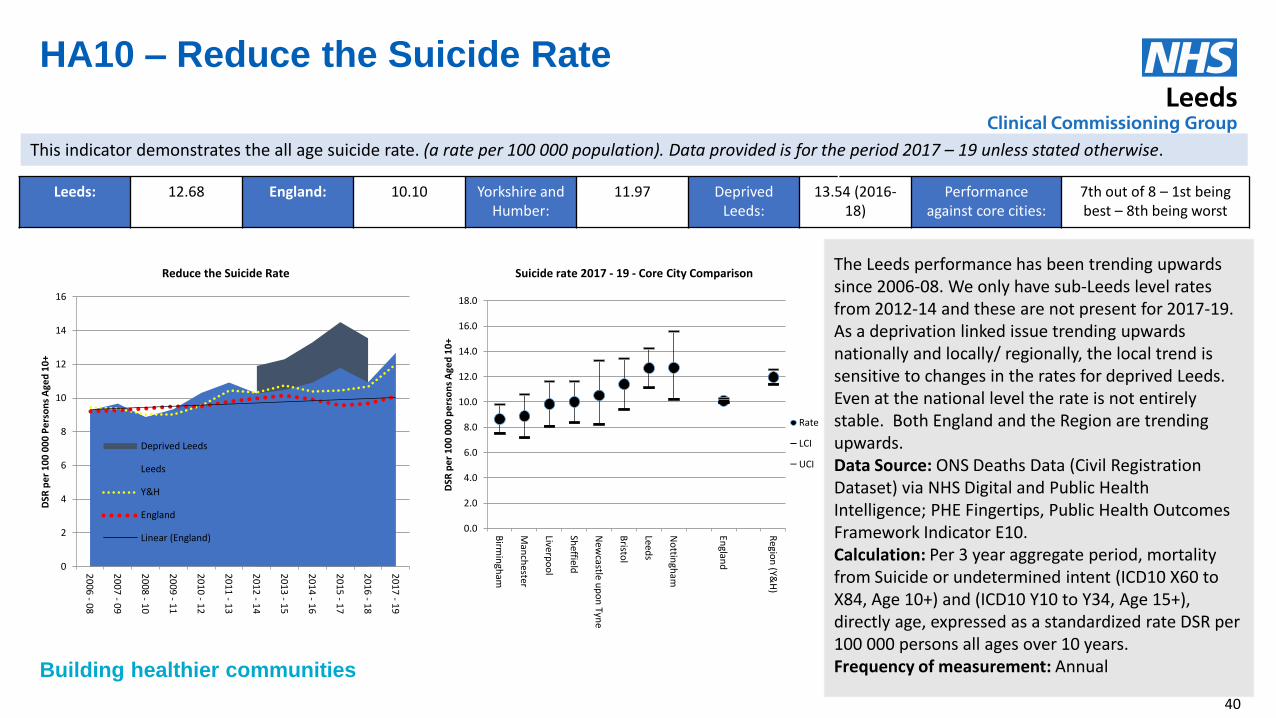
Building healthier communities
HA10 – Reduce the Suicide Rate
This indicator demonstrates the all age suicide rate. (a rate per 100 000 population). Data provided is for the period 2017 – 19 unless stated otherwise.
Leeds: 12.68 England: 10.10 Yorkshire and Humber:
11.97 Deprived Leeds:
13.54 (2016-18)
Performance against core cities:
7th out of 8 – 1st being best – 8th being worst
T The Leeds performance has been trending upwards since 2006-08. We only have sub-Leeds level rates from 2012-14 and these are not present for 2017-19. As a deprivation linked issue trending upwards nationally and locally/ regionally, the local trend is sensitive to changes in the rates for deprived Leeds. Even at the national level the rate is not entirely stable. Both England and the Region are trending upwards. Data Source: ONS Deaths Data (Civil Registration Dataset) via NHS Digital and Public Health Intelligence; PHE Fingertips, Public Health Outcomes Framework Indicator E10. Calculation: Per 3 year aggregate period, mortality from Suicide or undetermined intent (ICD10 X60 to X84, Age 10+) and (ICD10 Y10 to Y34, Age 15+), directly age, expressed as a standardized rate DSR per 100 000 persons all ages over 10 years. Frequency of measurement: Annual
0
2
4
6
8
10
12
14
16
20
06 - 0
8
20
07 - 0
9
20
08 - 1
0
20
09 - 1
1
20
10 - 1
2
20
11 - 1
3
20
12 - 1
4
20
13 - 1
5
20
14 - 1
6
20
15 - 1
7
20
16 - 1
8
20
17 - 1
9
DSR
pe
r 1
00
00
0 P
ers
on
s A
ged
10
+
Reduce the Suicide Rate
Deprived Leeds
Leeds
Y&H
England
Linear (England)0.0
2.0
4.0
6.0
8.0
10.0
12.0
14.0
16.0
18.0
Birm
ingh
am
Man
chester
Liverp
oo
l
Sheffield
New
castle up
on
Tyne
Bristo
l
Leeds
No
ttingh
am
Englan
d
Regio
n (Y&
H)
DSR
pe
r 1
00
00
0 p
ers
on
s A
ged
10
+
Suicide rate 2017 - 19 - Core City Comparison
Rate
LCI
UCI
40
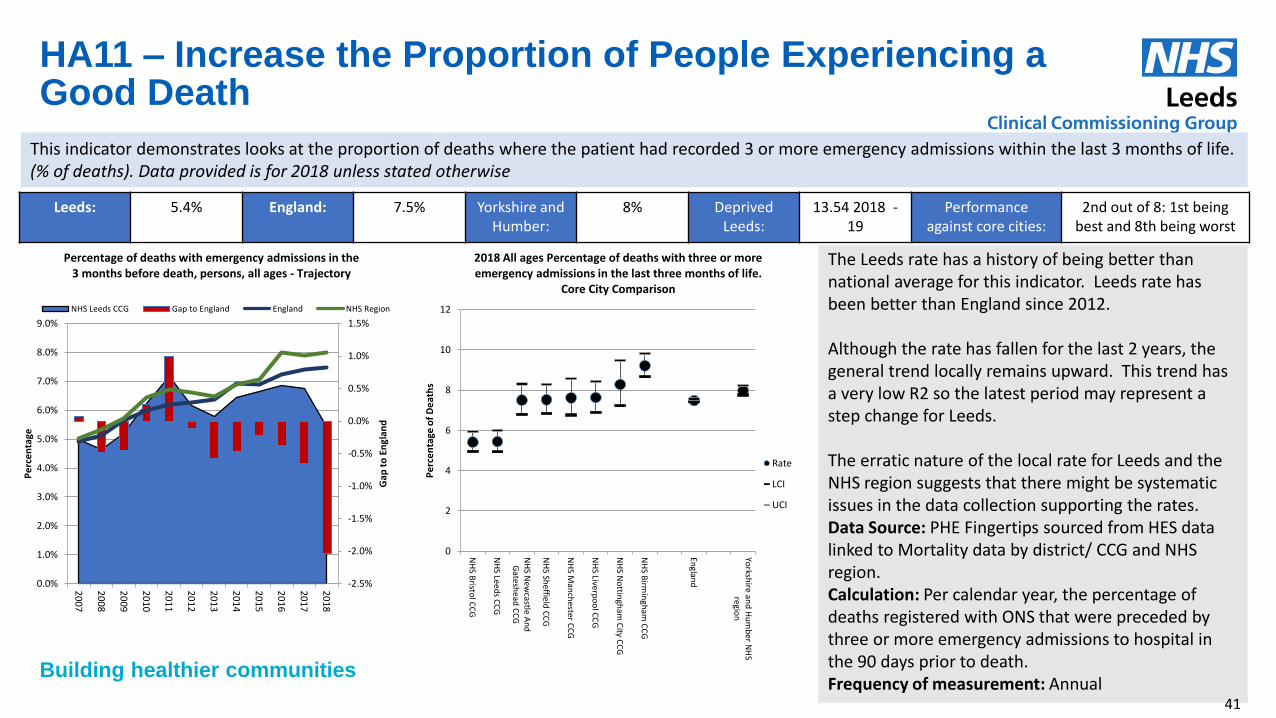
Building healthier communities
HA11 – Increase the Proportion of People Experiencing a Good Death
This indicator demonstrates looks at the proportion of deaths where the patient had recorded 3 or more emergency admissions within the last 3 months of life. (% of deaths). Data provided is for 2018 unless stated otherwise
The Leeds rate has a history of being better than national average for this indicator. Leeds rate has been better than England since 2012. Although the rate has fallen for the last 2 years, the general trend locally remains upward. This trend has a very low R2 so the latest period may represent a step change for Leeds. The erratic nature of the local rate for Leeds and the NHS region suggests that there might be systematic issues in the data collection supporting the rates. Data Source: PHE Fingertips sourced from HES data linked to Mortality data by district/ CCG and NHS region. Calculation: Per calendar year, the percentage of deaths registered with ONS that were preceded by three or more emergency admissions to hospital in the 90 days prior to death. Frequency of measurement: Annual
Leeds: 5.4% England: 7.5% Yorkshire and Humber:
8% Deprived Leeds:
13.54 2018 -19
Performance against core cities:
2nd out of 8: 1st being best and 8th being worst
0
2
4
6
8
10
12
NH
S Bristo
l CC
G
NH
S Leed
s CC
G
NH
S New
castle An
dG
ateshead
CC
G
NH
S She
ffield
CC
G
NH
S Man
chester C
CG
NH
S Liverpo
ol C
CG
NH
S No
ttingh
am C
ity CC
G
NH
S Birm
ingh
am C
CG
Englan
d
Yorksh
ire and
Hu
mb
er NH
Sregio
n
Pe
rce
nta
ge o
f D
eat
hs
2018 All ages Percentage of deaths with three or more emergency admissions in the last three months of life.
Core City Comparison
Rate
LCI
UCI
-2.5%
-2.0%
-1.5%
-1.0%
-0.5%
0.0%
0.5%
1.0%
1.5%
0.0%
1.0%
2.0%
3.0%
4.0%
5.0%
6.0%
7.0%
8.0%
9.0%
20
07
20
08
20
09
20
10
20
11
20
12
20
13
20
14
20
15
20
16
20
17
20
18
Gap
to
En
glan
d
Pe
rce
nta
ge
Percentage of deaths with emergency admissions in the 3 months before death, persons, all ages - Trajectory
NHS Leeds CCG Gap to England England NHS Region
41

Building healthier communities
SA1 – Excess Weight in Adults
The excess weight in adults indicator looks at the proportion of adults with a BMI over 25. (%of people surveyed aged 18 and over who have a BMI of 25 or over). Data provided is for 2018 / 19 unless stated otherwise
There are no smooth or regular trajectories for this indicator; the regional and even the national level indicator varies from year to year. The England trend is generally upwards with a strong R2 value of 0.899, from which we can take the general trend as true. The Leeds trend is much less certain R2 = 0.0058, but is also generally upwards, though possibly at a lower rate than England. Data Source: PHE Fingertips, sourced from the Active Lives survey by Sports England. Local splits based on GP Audit data managed by Public Health Intelligence. Denominator is persons 18 or over based on ONS Mid-Year Estimates for national data comparisons and on GP registered populations for the Local deprivation split analysis. Calculation: Crude percentage of people surveyed aged 18 and over who have a BMI of 25 or over. Frequency of measurement: Annual
Leeds: 62% England: 62.3% Yorkshire and Humber:
65.4% Deprived Leeds:
N/A Performance against core cities:
6th out of 8 – 1st being best – 8th being worst
-1.0%
-0.5%
0.0%
0.5%
1.0%
1.5%
2.0%
2.5%
3.0%
3.5%
58.0%
59.0%
60.0%
61.0%
62.0%
63.0%
64.0%
65.0%
66.0%
20
15/1
6
20
16/1
7
20
17/1
8
20
18/1
9
Gap
to
En
glan
d
Pe
rce
nta
ge o
f A
du
lts
wit
h B
MI>
25
Percentage of adults (aged 18+) classified as overweight or obese - Trajectory
Leeds Gap to EnglandEngland Y&H RegionLinear (Leeds) Linear (England)
50.00
55.00
60.00
65.00
70.00
75.00
Bri
sto
l
No
ttin
gham
New
cast
le u
po
n T
yne
Man
ches
ter
Bir
min
gham
Leed
s
Shef
fiel
d
Live
rpo
ol
Engl
and
York
shir
e an
d t
he
Hu
mb
erre
gio
n
County & UA (pre 4/19) EnglandRegion
Pe
rce
nta
ge
Core City Comparison - Percentage of adults (aged 18+) classified as overweight or obese - 2018/19
Rate
LCI
UCI
42

Building healthier communities
SA2 – Adults Over 18 who Smoke
This indicator focuses the number of adults over 18 than smoke. (% of persons surveyed aged 18 and over with smoking status submitted who reported themselves as smokers). Data provided is for 2019 unless stated otherwise
Leeds has similar rates and the same performance trend as the Y&H Region. England has a lower but parallel rate. The Leeds trend is very marginally steeper than that of England reflected in the decline in the gap to England shown in the bar-chart component. Deprived Leeds has a similar trend though starting at a much higher level (based on local GP Audit Data). Data Source: ONS Mid-Year estimates of population, Annual Population Survey (APS), GP Audit data from Public Health Intelligence Leeds, PHOF Indicator C18. Calculation: Per calendar year, the proportion of persons surveyed aged 18 and over with smoking status submitted who reported themselves as smokers. Expressed as a percentage. Frequency of measurement: Annual
Leeds: 15.3% England: 13.9% Yorkshire and Humber:
15.7% Deprived Leeds:
30.1% Performance against core cities:
5th out of 8 – 1st being best – 8th being worst
10.00
12.00
14.00
16.00
18.00
20.00
22.00
24.00
26.00
New
cast
le u
po
n T
yne
Shef
fiel
d
Live
rpo
ol
Bir
min
gham
Leed
s
Bri
sto
l
Man
ches
ter
No
ttin
gham
Engl
and
York
shir
e an
d t
he
Hu
mb
erre
gio
n
County & UA (pre 4/19) EnglandRegion
Pe
rce
nta
ge
Smoking Prevalence in adults (18+) - current smokers (APS) - 2019
Rate
LCI
UCI
0.0%
0.5%
1.0%
1.5%
2.0%
2.5%
3.0%
3.5%
4.0%
4.5%
5.0%
0
0.05
0.1
0.15
0.2
0.25
0.3
0.35
20
11
20
12
20
13
20
14
20
15
20
16
20
17
20
18
20
19
Gap
to
En
glan
d
Pe
rce
nta
ge
Smoking Prevalence in adults (18+) - current smokers (APS) - Trajectory
Local Data - Deprived Leeds Leeds
Gap to England England
Y&H Region
43
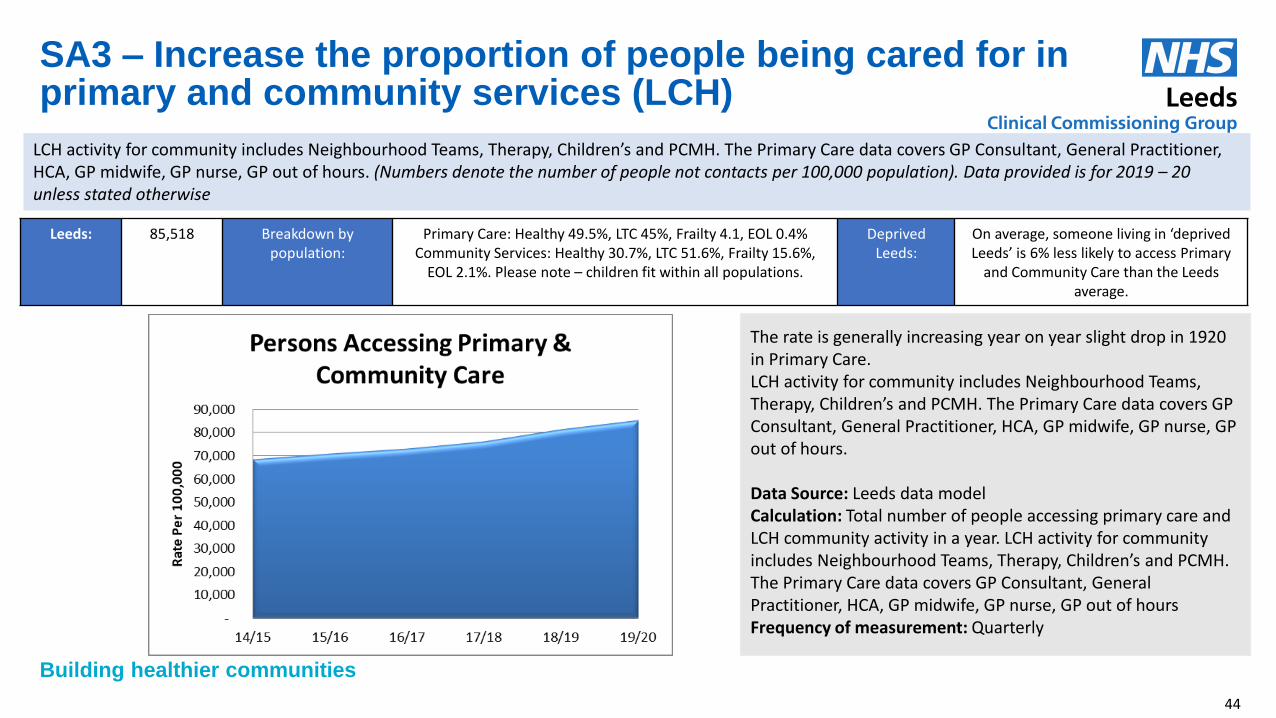
Building healthier communities
SA3 – Increase the proportion of people being cared for in primary and community services (LCH)
LCH activity for community includes Neighbourhood Teams, Therapy, Children’s and PCMH. The Primary Care data covers GP Consultant, General Practitioner, HCA, GP midwife, GP nurse, GP out of hours. (Numbers denote the number of people not contacts per 100,000 population). Data provided is for 2019 – 20 unless stated otherwise
The rate is generally increasing year on year slight drop in 1920 in Primary Care. LCH activity for community includes Neighbourhood Teams, Therapy, Children’s and PCMH. The Primary Care data covers GP Consultant, General Practitioner, HCA, GP midwife, GP nurse, GP out of hours. Data Source: Leeds data model Calculation: Total number of people accessing primary care and LCH community activity in a year. LCH activity for community includes Neighbourhood Teams, Therapy, Children’s and PCMH. The Primary Care data covers GP Consultant, General Practitioner, HCA, GP midwife, GP nurse, GP out of hours Frequency of measurement: Quarterly
Leeds: 85,518 Breakdown by population:
Primary Care: Healthy 49.5%, LTC 45%, Frailty 4.1, EOL 0.4% Community Services: Healthy 30.7%, LTC 51.6%, Frailty 15.6%,
EOL 2.1%. Please note – children fit within all populations.
Deprived Leeds:
On average, someone living in ‘deprived Leeds’ is 6% less likely to access Primary
and Community Care than the Leeds average.
44
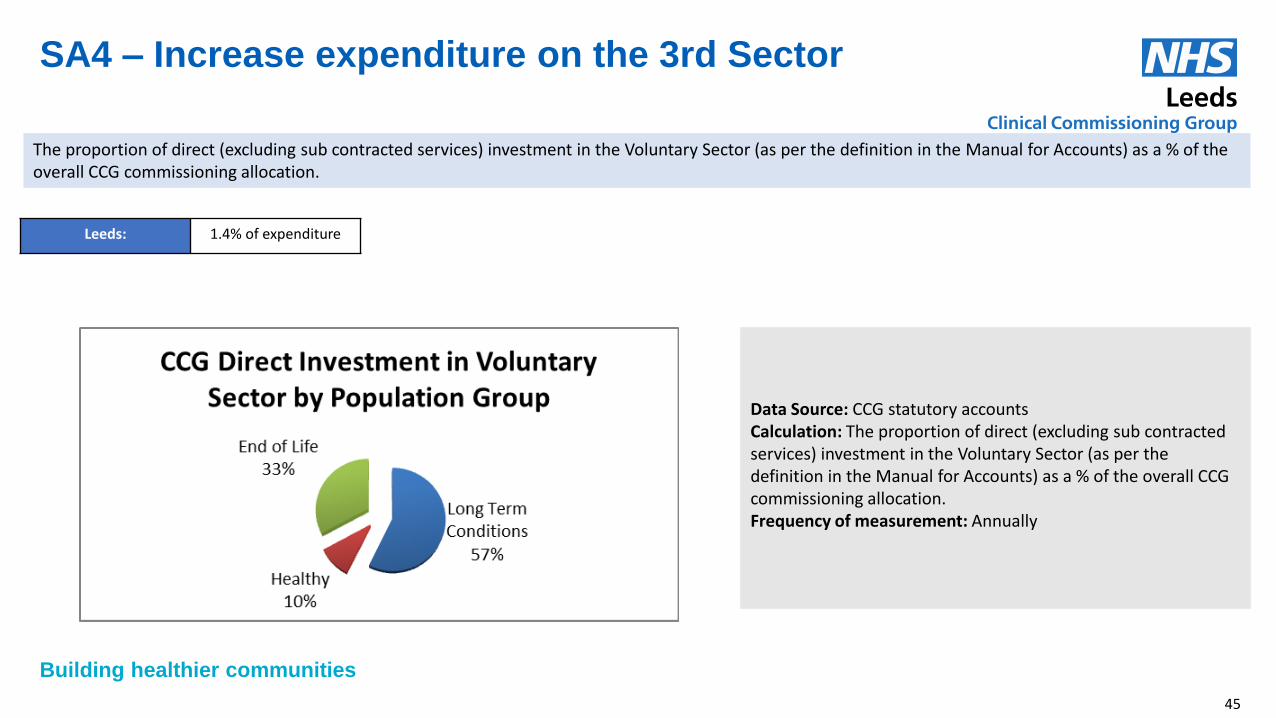
Building healthier communities
SA4 – Increase expenditure on the 3rd Sector
The proportion of direct (excluding sub contracted services) investment in the Voluntary Sector (as per the definition in the Manual for Accounts) as a % of the overall CCG commissioning allocation.
Data Source: CCG statutory accounts Calculation: The proportion of direct (excluding sub contracted services) investment in the Voluntary Sector (as per the definition in the Manual for Accounts) as a % of the overall CCG commissioning allocation. Frequency of measurement: Annually
Leeds: 1.4% of expenditure
45
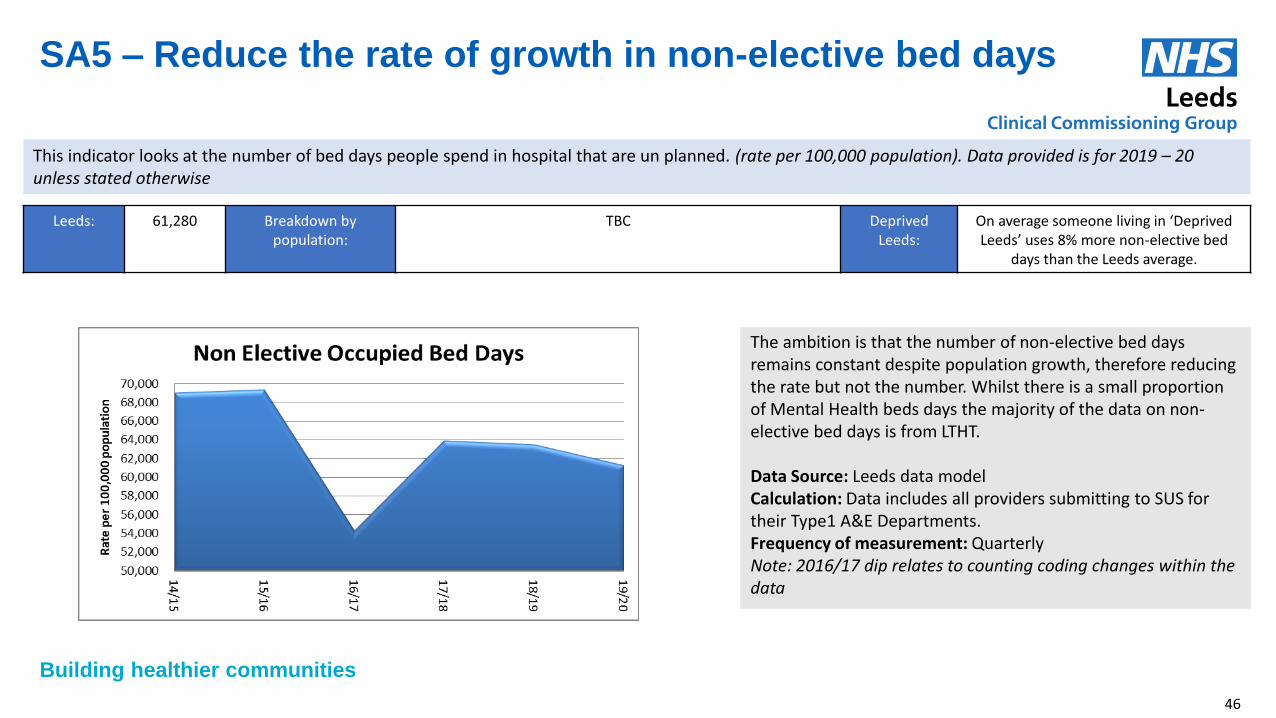
Building healthier communities
SA5 – Reduce the rate of growth in non-elective bed days
This indicator looks at the number of bed days people spend in hospital that are un planned. (rate per 100,000 population). Data provided is for 2019 – 20 unless stated otherwise
The ambition is that the number of non-elective bed days remains constant despite population growth, therefore reducing the rate but not the number. Whilst there is a small proportion of Mental Health beds days the majority of the data on non-elective bed days is from LTHT. Data Source: Leeds data model Calculation: Data includes all providers submitting to SUS for their Type1 A&E Departments. Frequency of measurement: Quarterly Note: 2016/17 dip relates to counting coding changes within the data
Leeds: 61,280 Breakdown by population:
TBC Deprived Leeds:
On average someone living in ‘Deprived Leeds’ uses 8% more non-elective bed
days than the Leeds average.
46
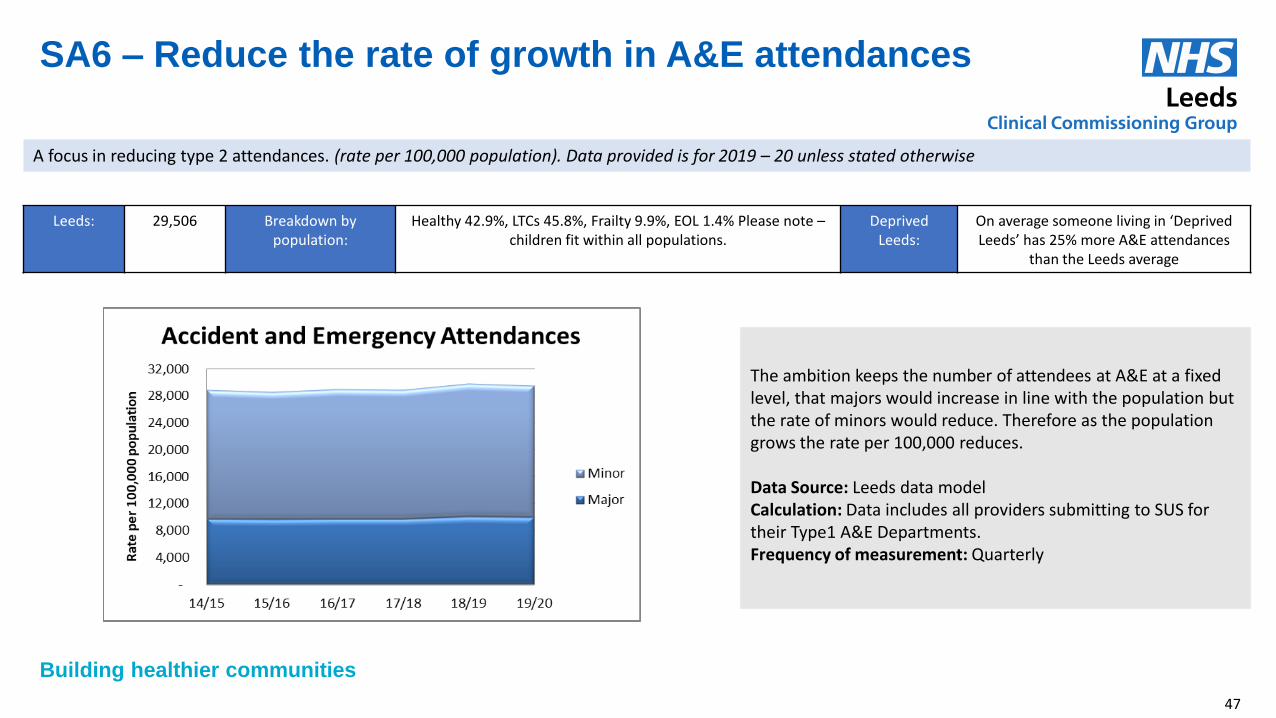
Building healthier communities
SA6 – Reduce the rate of growth in A&E attendances
A focus in reducing type 2 attendances. (rate per 100,000 population). Data provided is for 2019 – 20 unless stated otherwise
The ambition keeps the number of attendees at A&E at a fixed level, that majors would increase in line with the population but the rate of minors would reduce. Therefore as the population grows the rate per 100,000 reduces. Data Source: Leeds data model Calculation: Data includes all providers submitting to SUS for their Type1 A&E Departments. Frequency of measurement: Quarterly
Leeds: 29,506 Breakdown by population:
Healthy 42.9%, LTCs 45.8%, Frailty 9.9%, EOL 1.4% Please note – children fit within all populations.
Deprived Leeds:
On average someone living in ‘Deprived Leeds’ has 25% more A&E attendances
than the Leeds average
47
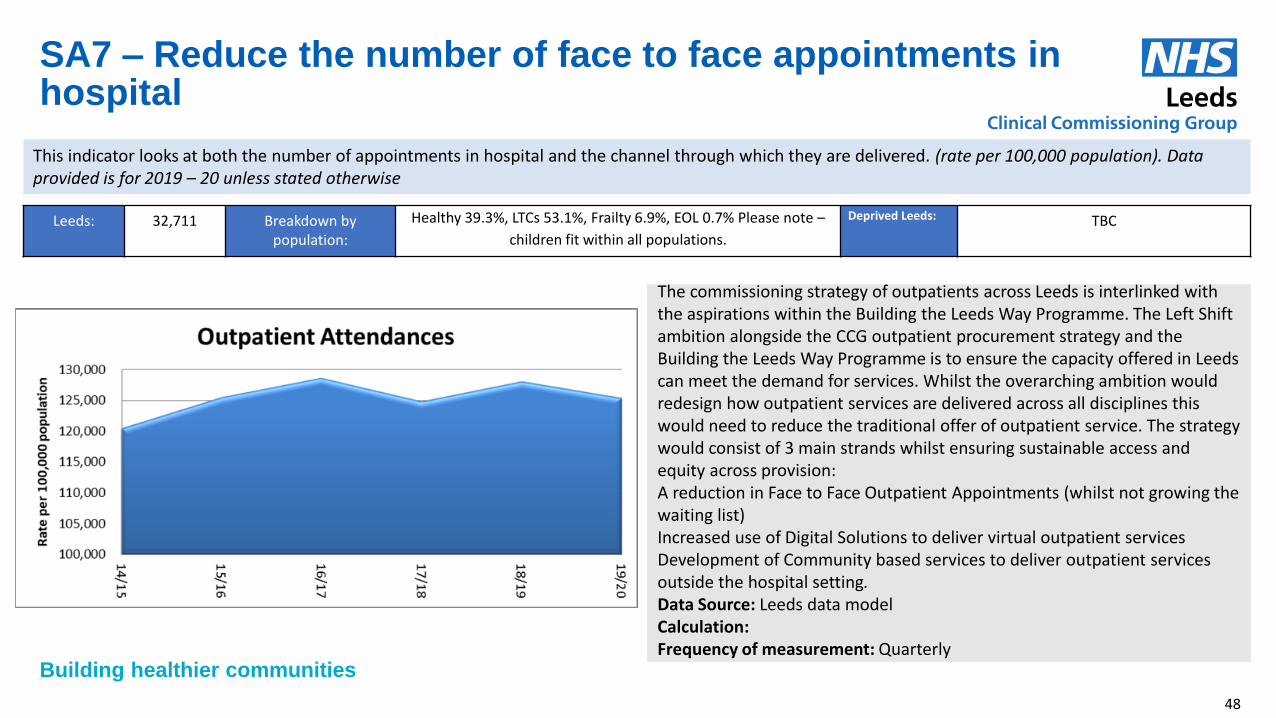
Building healthier communities
SA7 – Reduce the number of face to face appointments in hospital
This indicator looks at both the number of appointments in hospital and the channel through which they are delivered. (rate per 100,000 population). Data provided is for 2019 – 20 unless stated otherwise
The commissioning strategy of outpatients across Leeds is interlinked with the aspirations within the Building the Leeds Way Programme. The Left Shift ambition alongside the CCG outpatient procurement strategy and the Building the Leeds Way Programme is to ensure the capacity offered in Leeds can meet the demand for services. Whilst the overarching ambition would redesign how outpatient services are delivered across all disciplines this would need to reduce the traditional offer of outpatient service. The strategy would consist of 3 main strands whilst ensuring sustainable access and equity across provision: A reduction in Face to Face Outpatient Appointments (whilst not growing the waiting list) Increased use of Digital Solutions to deliver virtual outpatient services Development of Community based services to deliver outpatient services outside the hospital setting. Data Source: Leeds data model Calculation: Frequency of measurement: Quarterly
Leeds: 32,711 Breakdown by population:
Healthy 39.3%, LTCs 53.1%, Frailty 6.9%, EOL 0.7% Please note –
children fit within all populations.
Deprived Leeds: TBC
48
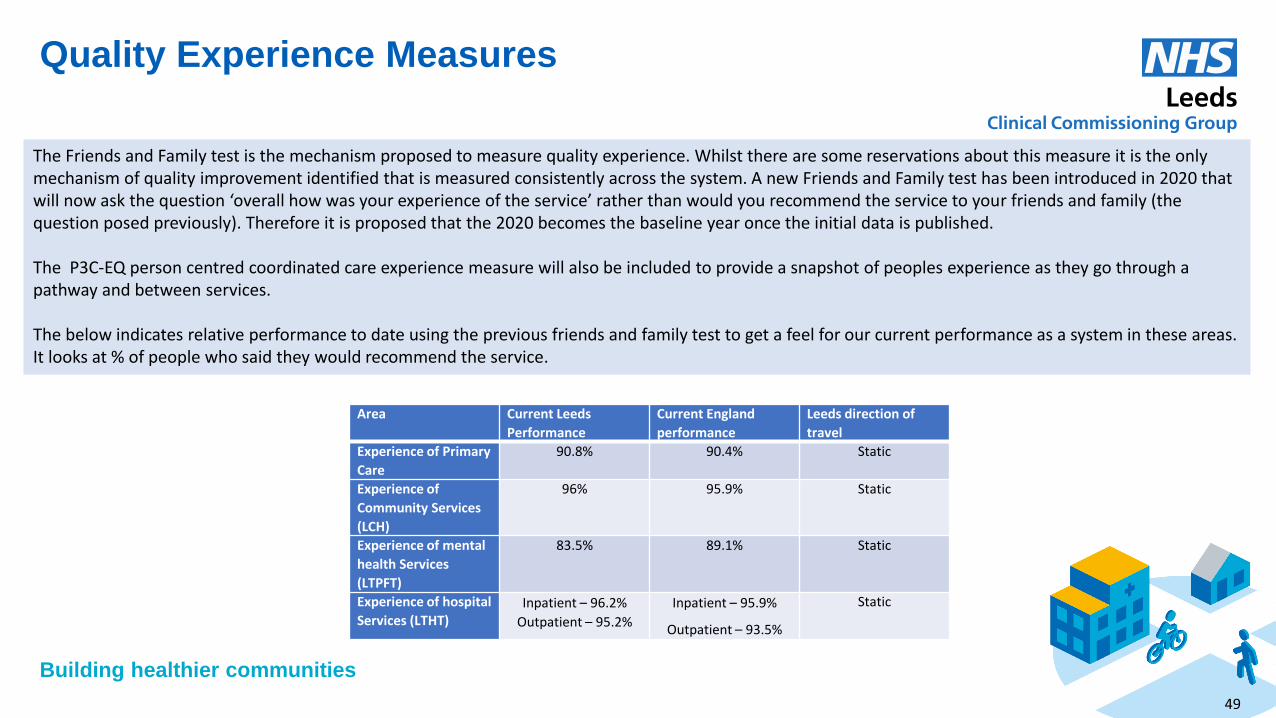
Building healthier communities
Quality Experience Measures
The Friends and Family test is the mechanism proposed to measure quality experience. Whilst there are some reservations about this measure it is the only mechanism of quality improvement identified that is measured consistently across the system. A new Friends and Family test has been introduced in 2020 that will now ask the question ‘overall how was your experience of the service’ rather than would you recommend the service to your friends and family (the question posed previously). Therefore it is proposed that the 2020 becomes the baseline year once the initial data is published. The P3C-EQ person centred coordinated care experience measure will also be included to provide a snapshot of peoples experience as they go through a pathway and between services. The below indicates relative performance to date using the previous friends and family test to get a feel for our current performance as a system in these areas. It looks at % of people who said they would recommend the service.
Area Current Leeds
Performance
Current England
performance
Leeds direction of
travel
Experience of Primary
Care
90.8% 90.4% Static
Experience of
Community Services
(LCH)
96% 95.9% Static
Experience of mental
health Services
(LTPFT)
83.5% 89.1% Static
Experience of hospital
Services (LTHT) Inpatient – 96.2%
Outpatient – 95.2%
Inpatient – 95.9%
Outpatient – 93.5%
Static
49
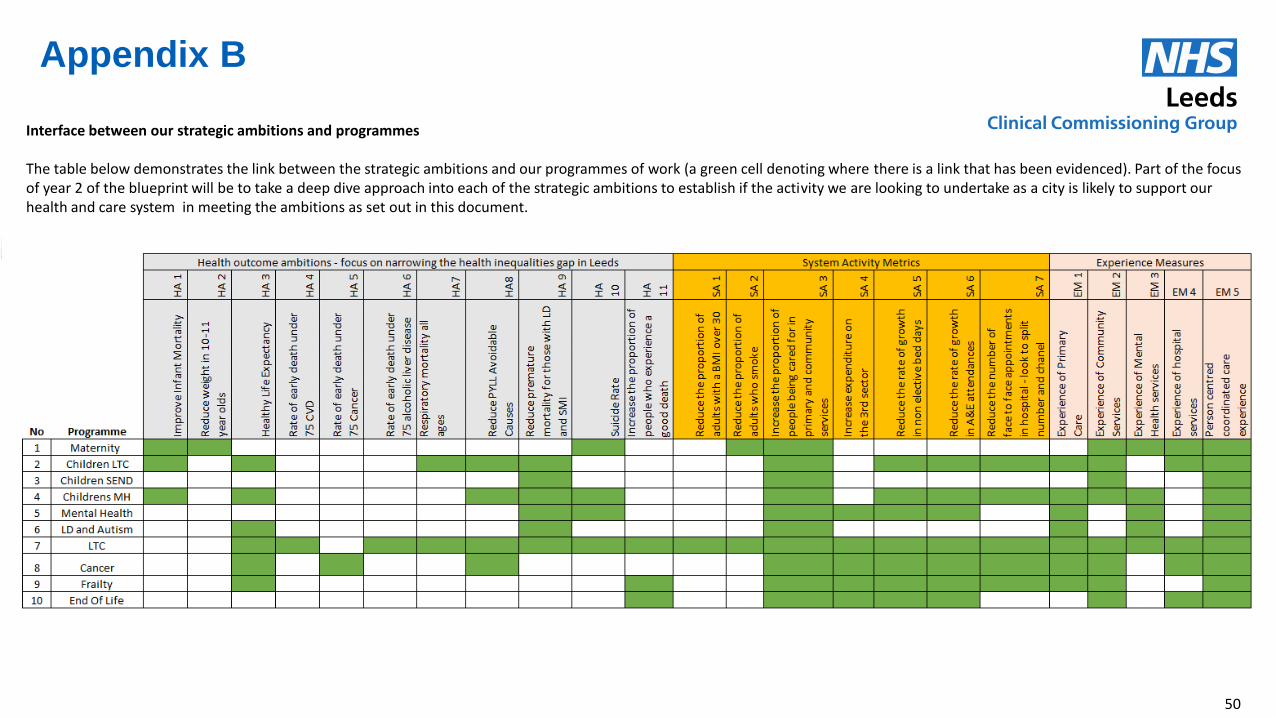
Building healthier communities
Appendix B
Interface between our strategic ambitions and programmes The table below demonstrates the link between the strategic ambitions and our programmes of work (a green cell denoting where there is a link that has been evidenced). Part of the focus of year 2 of the blueprint will be to take a deep dive approach into each of the strategic ambitions to establish if the activity we are looking to undertake as a city is likely to support our health and care system in meeting the ambitions as set out in this document.
50

Building healthier communities
Appendix C – Programme Priorities
No Programme and initiative
Detail Who Impact Setting
1 Maternity - Improving access to maternity services
• Agree and implement pathways for self-referral into maternity services
• Agree and implement choice offer for abortion services.
• Targeted communications campaign to increase awareness of these
• Additional midwives to increase capacity for booking appointments, reducing waiting times and improving access.
• An additional BaME specialist midwife to lead specialist pathway work.
• All pregnant women, particularly young parents, those from particular BAME backgrounds, and those in areas of deprivation.
• These populations which currently are less likely to access maternity services before 10 weeks of pregnancy.
Short Term • Numbers of people using new methods of self-referral
to maternity services • Improved public knowledge of available routes to
access maternity services. Medium Term • Increase the proportion of women being seen by
maternity services (and termination services) before 10 weeks of pregnancy and reduce inequality
Long Term • HA1 - Improve infant mortality • HA2 - Reduce weight in 10/11 year olds • SA2 - Reduce the proportion of adults who smoke • Activity and experience measures
Community
2 Maternity - Reducing the rate of smoking at the time of delivery
• Targeted actions to increase planned pregnancies • Increase access to smoking cessation services • Implement smoking cessation maternity support
workers • Roll-out of training on smoking cessation including
Children's Centres, 0-19 service and voluntary sector services.
• implement an incentive scheme targeted at the most vulnerable families.
• Recruit additional specialist maternity support workers
• Women from more deprived areas of the city, and those living with mental health issues, are more likely to smoke during pregnancy.
• Women from the poorest backgrounds and mothers from Black, Asian and Minority Ethnic (BaME) groups as they are at higher risk of their baby dying in the womb, or soon after birth
Short Term • More staff receive smoking cessation training • Improved number of smoking cessation incentives
being delivered. Medium Term • Reduce the rates of women smoking at the time of
delivery • Reducing preterm birth - between 20 - 37 weeks • Reduce the rate of stillbirths Long term • HA1 - Improve infant mortality • SA2 - Reduce the proportion of adults who smoke • Activity and quality experience metrics
Community and hospital
51
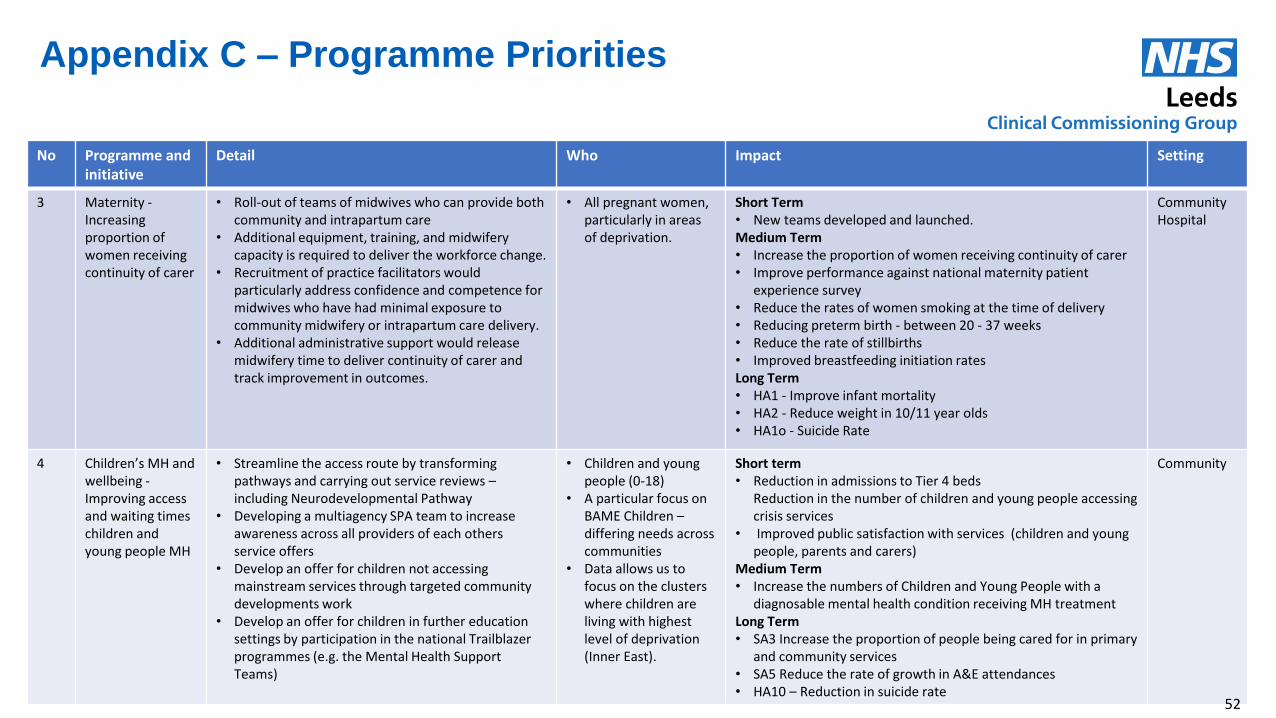
Building healthier communities
Appendix C – Programme Priorities
No Programme and initiative
Detail Who Impact Setting
3 Maternity - Increasing proportion of women receiving continuity of carer
• Roll-out of teams of midwives who can provide both community and intrapartum care
• Additional equipment, training, and midwifery capacity is required to deliver the workforce change.
• Recruitment of practice facilitators would particularly address confidence and competence for midwives who have had minimal exposure to community midwifery or intrapartum care delivery.
• Additional administrative support would release midwifery time to deliver continuity of carer and track improvement in outcomes.
• All pregnant women, particularly in areas of deprivation.
Short Term • New teams developed and launched. Medium Term • Increase the proportion of women receiving continuity of carer • Improve performance against national maternity patient
experience survey • Reduce the rates of women smoking at the time of delivery • Reducing preterm birth - between 20 - 37 weeks • Reduce the rate of stillbirths • Improved breastfeeding initiation rates Long Term • HA1 - Improve infant mortality • HA2 - Reduce weight in 10/11 year olds • HA1o - Suicide Rate
Community Hospital
4 Children’s MH and wellbeing - Improving access and waiting times children and young people MH
• Streamline the access route by transforming pathways and carrying out service reviews – including Neurodevelopmental Pathway
• Developing a multiagency SPA team to increase awareness across all providers of each others service offers
• Develop an offer for children not accessing mainstream services through targeted community developments work
• Develop an offer for children in further education settings by participation in the national Trailblazer programmes (e.g. the Mental Health Support Teams)
• Children and young people (0-18)
• A particular focus on BAME Children – differing needs across communities
• Data allows us to focus on the clusters where children are living with highest level of deprivation (Inner East).
Short term • Reduction in admissions to Tier 4 beds
Reduction in the number of children and young people accessing crisis services
• Improved public satisfaction with services (children and young people, parents and carers)
Medium Term • Increase the numbers of Children and Young People with a
diagnosable mental health condition receiving MH treatment Long Term • SA3 Increase the proportion of people being cared for in primary
and community services • SA5 Reduce the rate of growth in A&E attendances • HA10 – Reduction in suicide rate
Community
52
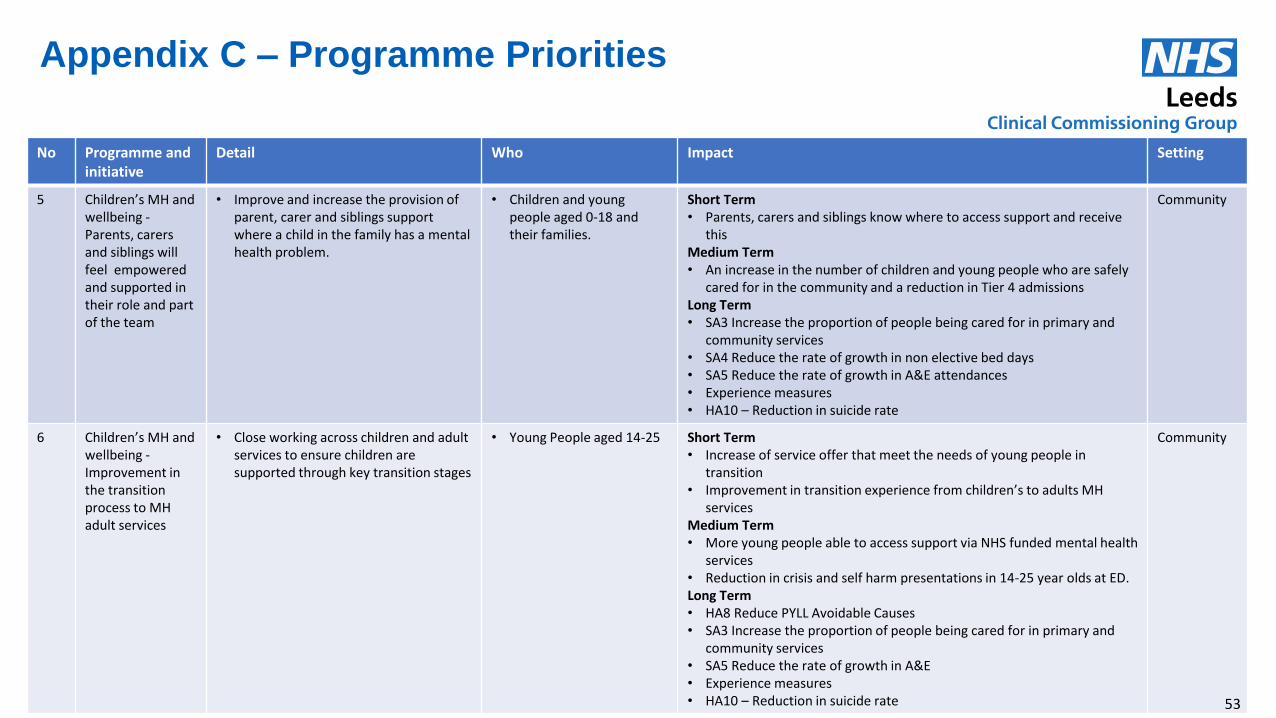
Building healthier communities
Appendix C – Programme Priorities
No Programme and initiative
Detail Who Impact Setting
5 Children’s MH and wellbeing - Parents, carers and siblings will feel empowered and supported in their role and part of the team
• Improve and increase the provision of parent, carer and siblings support where a child in the family has a mental health problem.
• Children and young people aged 0-18 and their families.
Short Term • Parents, carers and siblings know where to access support and receive
this Medium Term • An increase in the number of children and young people who are safely
cared for in the community and a reduction in Tier 4 admissions Long Term • SA3 Increase the proportion of people being cared for in primary and
community services • SA4 Reduce the rate of growth in non elective bed days • SA5 Reduce the rate of growth in A&E attendances • Experience measures • HA10 – Reduction in suicide rate
Community
6 Children’s MH and wellbeing - Improvement in the transition process to MH adult services
• Close working across children and adult services to ensure children are supported through key transition stages
• Young People aged 14-25 Short Term • Increase of service offer that meet the needs of young people in
transition • Improvement in transition experience from children’s to adults MH
services Medium Term • More young people able to access support via NHS funded mental health
services • Reduction in crisis and self harm presentations in 14-25 year olds at ED. Long Term • HA8 Reduce PYLL Avoidable Causes • SA3 Increase the proportion of people being cared for in primary and
community services • SA5 Reduce the rate of growth in A&E • Experience measures • HA10 – Reduction in suicide rate
Community
53
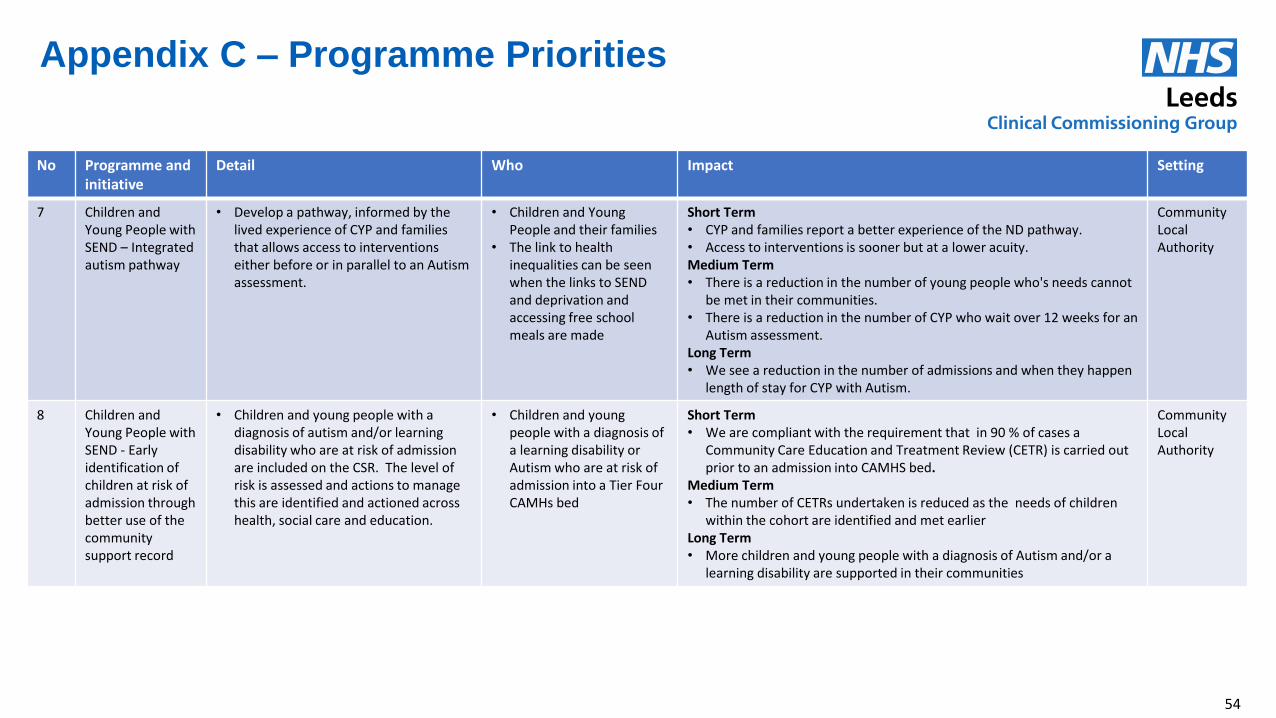
Building healthier communities
Appendix C – Programme Priorities
No Programme and initiative
Detail Who Impact Setting
7 Children and Young People with SEND – Integrated autism pathway
• Develop a pathway, informed by the lived experience of CYP and families that allows access to interventions either before or in parallel to an Autism assessment.
• Children and Young People and their families
• The link to health inequalities can be seen when the links to SEND and deprivation and accessing free school meals are made
Short Term • CYP and families report a better experience of the ND pathway. • Access to interventions is sooner but at a lower acuity. Medium Term • There is a reduction in the number of young people who's needs cannot
be met in their communities. • There is a reduction in the number of CYP who wait over 12 weeks for an
Autism assessment. Long Term • We see a reduction in the number of admissions and when they happen
length of stay for CYP with Autism.
Community Local Authority
8 Children and Young People with SEND - Early identification of children at risk of admission through better use of the community support record
• Children and young people with a diagnosis of autism and/or learning disability who are at risk of admission are included on the CSR. The level of risk is assessed and actions to manage this are identified and actioned across health, social care and education.
• Children and young people with a diagnosis of a learning disability or Autism who are at risk of admission into a Tier Four CAMHs bed
Short Term • We are compliant with the requirement that in 90 % of cases a
Community Care Education and Treatment Review (CETR) is carried out prior to an admission into CAMHS bed.
Medium Term • The number of CETRs undertaken is reduced as the needs of children
within the cohort are identified and met earlier Long Term • More children and young people with a diagnosis of Autism and/or a
learning disability are supported in their communities
Community Local Authority
54
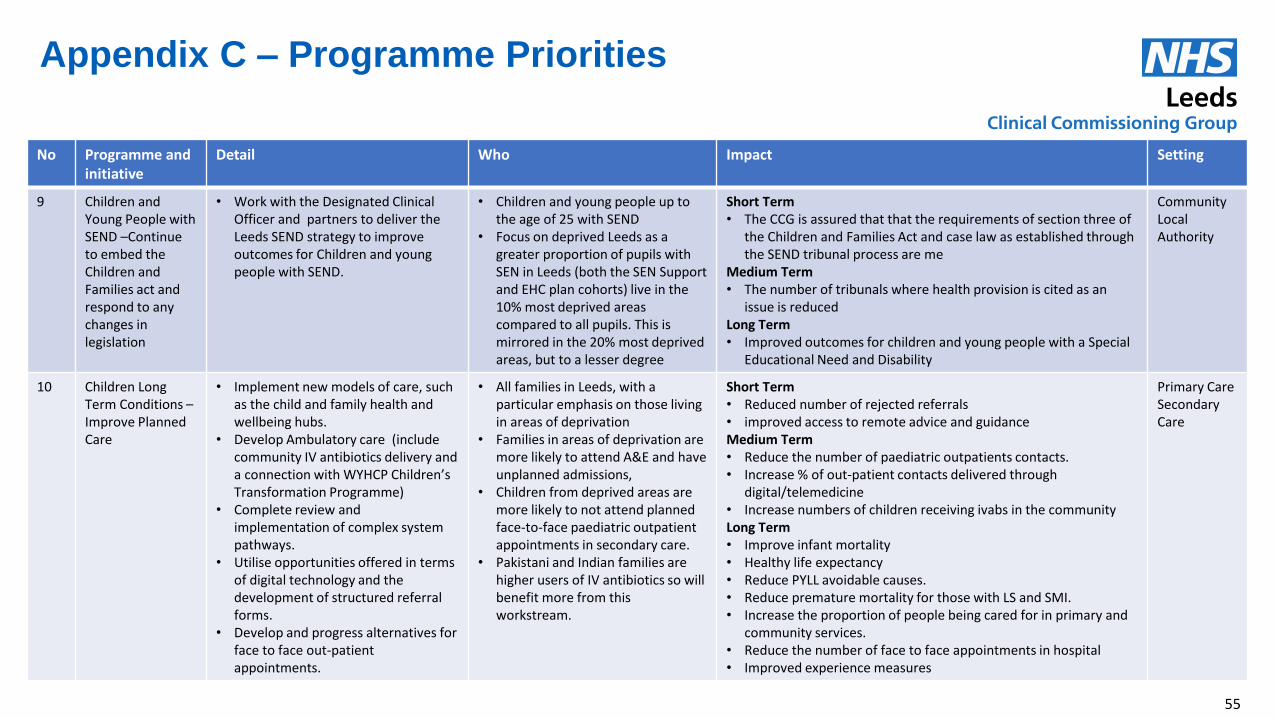
Building healthier communities
Appendix C – Programme Priorities
No Programme and initiative
Detail Who Impact Setting
9 Children and Young People with SEND –Continue to embed the Children and Families act and respond to any changes in legislation
• Work with the Designated Clinical Officer and partners to deliver the Leeds SEND strategy to improve outcomes for Children and young people with SEND.
• Children and young people up to the age of 25 with SEND
• Focus on deprived Leeds as a greater proportion of pupils with SEN in Leeds (both the SEN Support and EHC plan cohorts) live in the 10% most deprived areas compared to all pupils. This is mirrored in the 20% most deprived areas, but to a lesser degree
Short Term • The CCG is assured that that the requirements of section three of
the Children and Families Act and case law as established through the SEND tribunal process are me
Medium Term • The number of tribunals where health provision is cited as an
issue is reduced Long Term • Improved outcomes for children and young people with a Special
Educational Need and Disability
Community Local Authority
10 Children Long Term Conditions – Improve Planned Care
• Implement new models of care, such as the child and family health and wellbeing hubs.
• Develop Ambulatory care (include community IV antibiotics delivery and a connection with WYHCP Children’s Transformation Programme)
• Complete review and implementation of complex system pathways.
• Utilise opportunities offered in terms of digital technology and the development of structured referral forms.
• Develop and progress alternatives for face to face out-patient appointments.
• All families in Leeds, with a particular emphasis on those living in areas of deprivation
• Families in areas of deprivation are more likely to attend A&E and have unplanned admissions,
• Children from deprived areas are more likely to not attend planned face-to-face paediatric outpatient appointments in secondary care.
• Pakistani and Indian families are higher users of IV antibiotics so will benefit more from this workstream.
Short Term • Reduced number of rejected referrals • improved access to remote advice and guidance Medium Term • Reduce the number of paediatric outpatients contacts. • Increase % of out-patient contacts delivered through
digital/telemedicine • Increase numbers of children receiving ivabs in the community Long Term • Improve infant mortality • Healthy life expectancy • Reduce PYLL avoidable causes. • Reduce premature mortality for those with LS and SMI. • Increase the proportion of people being cared for in primary and
community services. • Reduce the number of face to face appointments in hospital • Improved experience measures
Primary Care Secondary Care
55
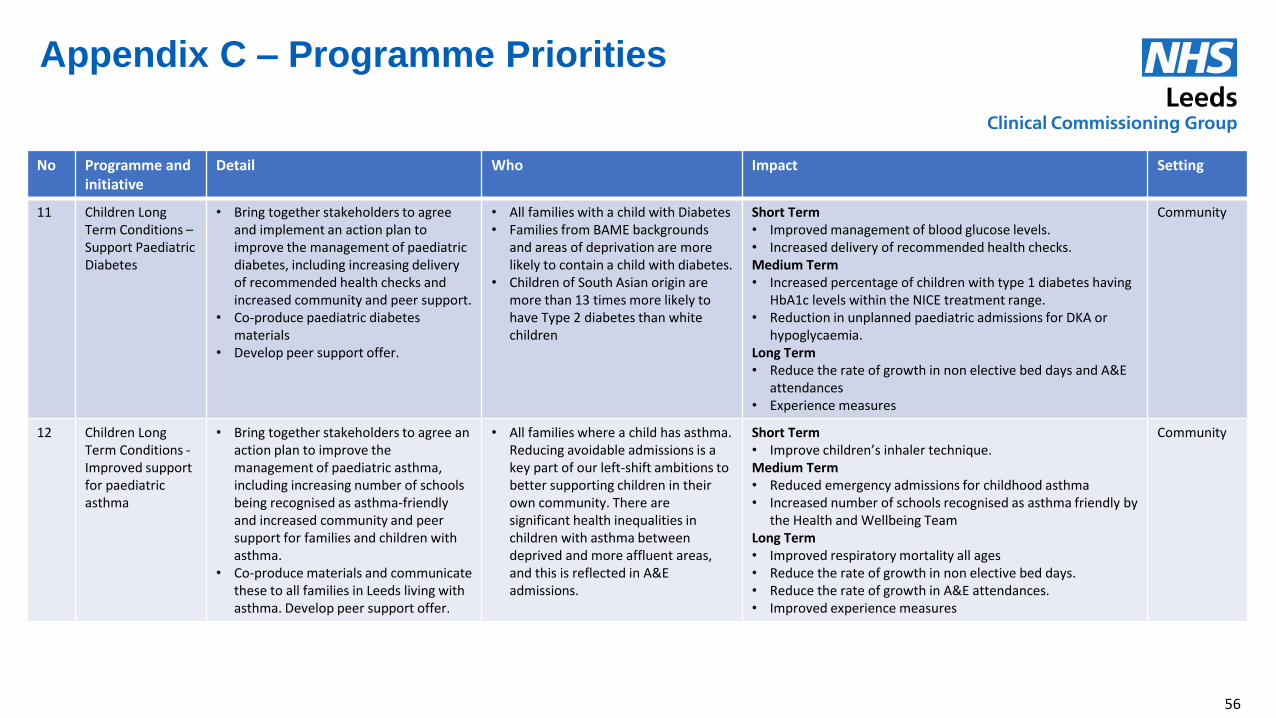
Building healthier communities
Appendix C – Programme Priorities
No Programme and initiative
Detail Who Impact Setting
11 Children Long Term Conditions – Support Paediatric Diabetes
• Bring together stakeholders to agree and implement an action plan to improve the management of paediatric diabetes, including increasing delivery of recommended health checks and increased community and peer support.
• Co-produce paediatric diabetes materials
• Develop peer support offer.
• All families with a child with Diabetes • Families from BAME backgrounds
and areas of deprivation are more likely to contain a child with diabetes.
• Children of South Asian origin are more than 13 times more likely to have Type 2 diabetes than white children
Short Term • Improved management of blood glucose levels. • Increased delivery of recommended health checks. Medium Term • Increased percentage of children with type 1 diabetes having
HbA1c levels within the NICE treatment range. • Reduction in unplanned paediatric admissions for DKA or
hypoglycaemia. Long Term • Reduce the rate of growth in non elective bed days and A&E
attendances • Experience measures
Community
12 Children Long Term Conditions - Improved support for paediatric asthma
• Bring together stakeholders to agree an action plan to improve the management of paediatric asthma, including increasing number of schools being recognised as asthma-friendly and increased community and peer support for families and children with asthma.
• Co-produce materials and communicate these to all families in Leeds living with asthma. Develop peer support offer.
• All families where a child has asthma. Reducing avoidable admissions is a key part of our left-shift ambitions to better supporting children in their own community. There are significant health inequalities in children with asthma between deprived and more affluent areas, and this is reflected in A&E admissions.
Short Term • Improve children’s inhaler technique. Medium Term • Reduced emergency admissions for childhood asthma • Increased number of schools recognised as asthma friendly by
the Health and Wellbeing Team Long Term • Improved respiratory mortality all ages • Reduce the rate of growth in non elective bed days. • Reduce the rate of growth in A&E attendances. • Improved experience measures
Community
56
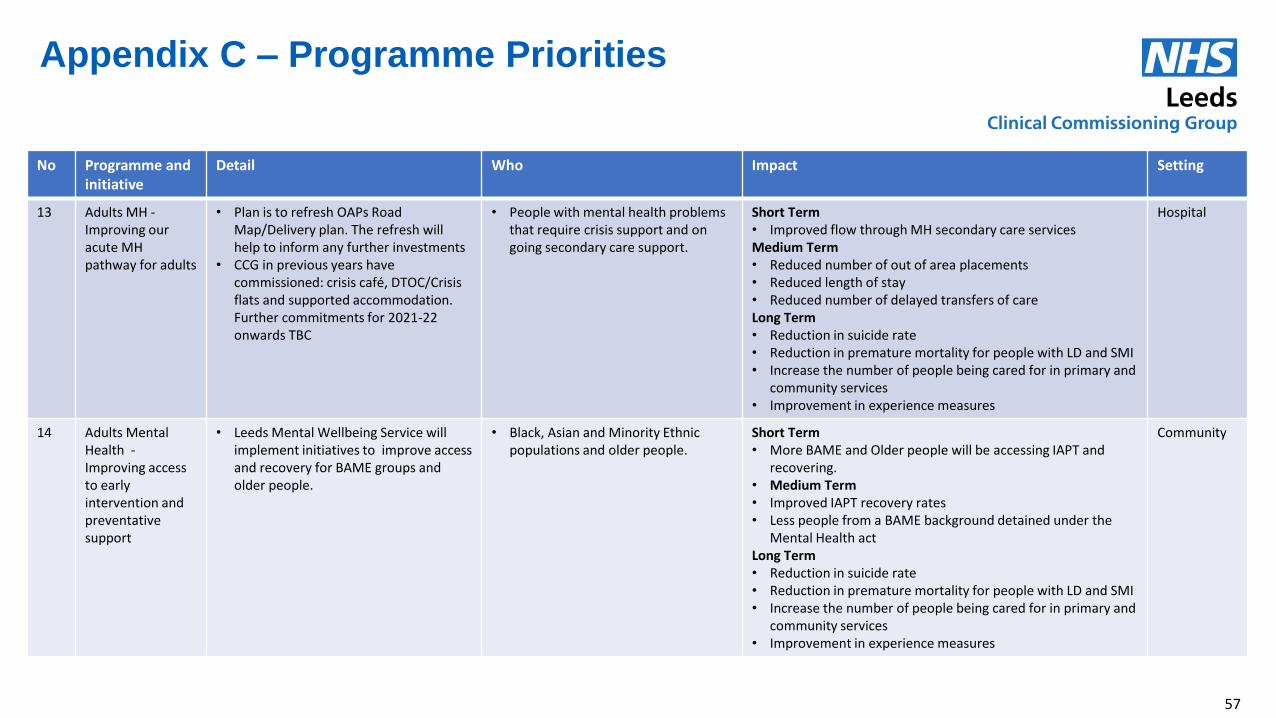
Building healthier communities
Appendix C – Programme Priorities
No Programme and initiative
Detail Who Impact Setting
13 Adults MH - Improving our acute MH pathway for adults
• Plan is to refresh OAPs Road Map/Delivery plan. The refresh will help to inform any further investments
• CCG in previous years have commissioned: crisis café, DTOC/Crisis flats and supported accommodation. Further commitments for 2021-22 onwards TBC
• People with mental health problems that require crisis support and on going secondary care support.
Short Term • Improved flow through MH secondary care services Medium Term • Reduced number of out of area placements • Reduced length of stay • Reduced number of delayed transfers of care Long Term • Reduction in suicide rate • Reduction in premature mortality for people with LD and SMI • Increase the number of people being cared for in primary and
community services • Improvement in experience measures
Hospital
14 Adults Mental Health - Improving access to early intervention and preventative support
• Leeds Mental Wellbeing Service will implement initiatives to improve access and recovery for BAME groups and older people.
• Black, Asian and Minority Ethnic populations and older people.
Short Term • More BAME and Older people will be accessing IAPT and
recovering. • Medium Term • Improved IAPT recovery rates • Less people from a BAME background detained under the
Mental Health act Long Term • Reduction in suicide rate • Reduction in premature mortality for people with LD and SMI • Increase the number of people being cared for in primary and
community services • Improvement in experience measures
Community
57
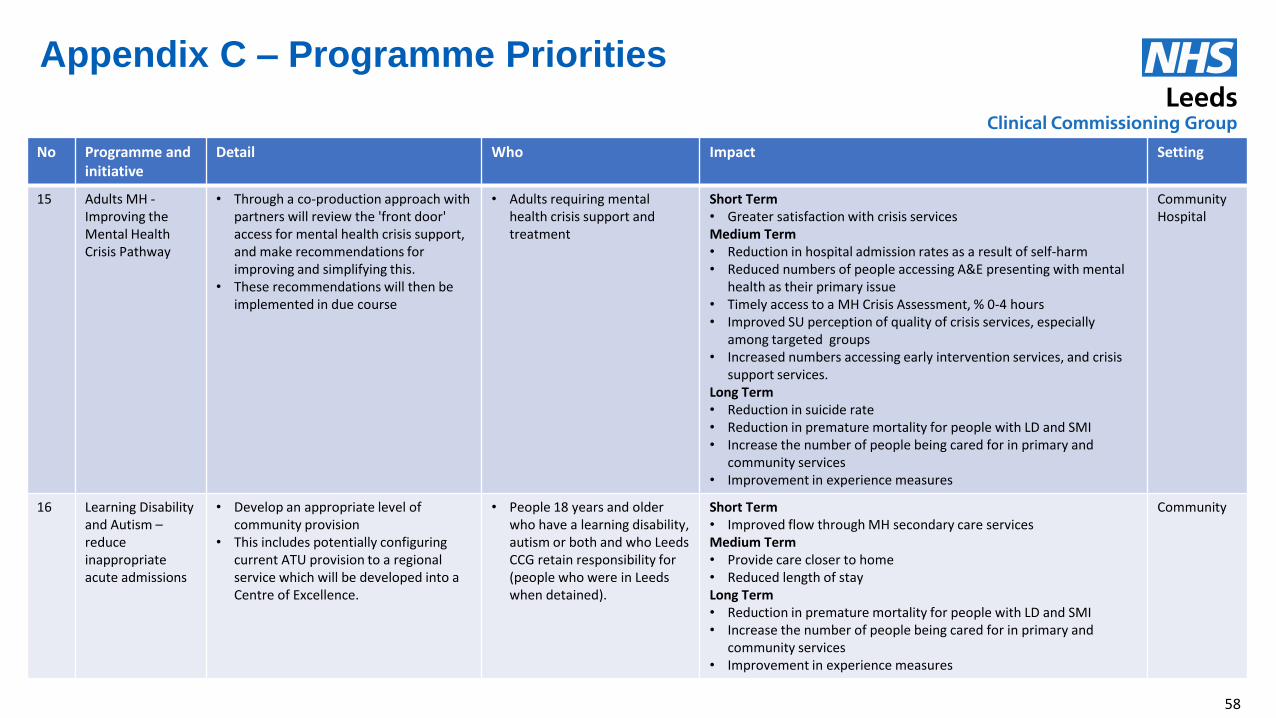
Building healthier communities
Appendix C – Programme Priorities
No Programme and initiative
Detail Who Impact Setting
15 Adults MH - Improving the Mental Health Crisis Pathway
• Through a co-production approach with partners will review the 'front door' access for mental health crisis support, and make recommendations for improving and simplifying this.
• These recommendations will then be implemented in due course
• Adults requiring mental health crisis support and treatment
Short Term • Greater satisfaction with crisis services Medium Term • Reduction in hospital admission rates as a result of self-harm • Reduced numbers of people accessing A&E presenting with mental
health as their primary issue • Timely access to a MH Crisis Assessment, % 0-4 hours • Improved SU perception of quality of crisis services, especially
among targeted groups • Increased numbers accessing early intervention services, and crisis
support services. Long Term • Reduction in suicide rate • Reduction in premature mortality for people with LD and SMI • Increase the number of people being cared for in primary and
community services • Improvement in experience measures
Community Hospital
16 Learning Disability and Autism – reduce inappropriate acute admissions
• Develop an appropriate level of community provision
• This includes potentially configuring current ATU provision to a regional service which will be developed into a Centre of Excellence.
• People 18 years and older who have a learning disability, autism or both and who Leeds CCG retain responsibility for (people who were in Leeds when detained).
Short Term • Improved flow through MH secondary care services Medium Term • Provide care closer to home • Reduced length of stay Long Term • Reduction in premature mortality for people with LD and SMI • Increase the number of people being cared for in primary and
community services • Improvement in experience measures
Community
58
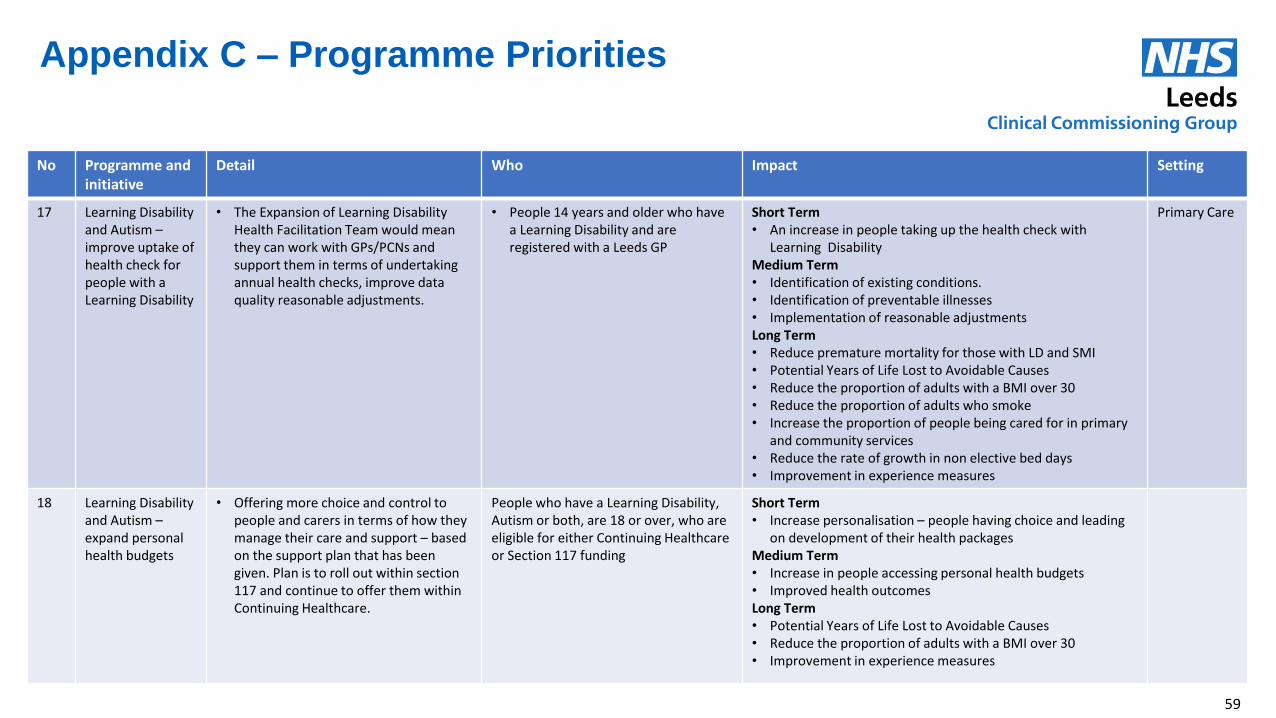
Building healthier communities
Appendix C – Programme Priorities
No Programme and initiative
Detail Who Impact Setting
17 Learning Disability and Autism – improve uptake of health check for people with a Learning Disability
• The Expansion of Learning Disability Health Facilitation Team would mean they can work with GPs/PCNs and support them in terms of undertaking annual health checks, improve data quality reasonable adjustments.
• People 14 years and older who have a Learning Disability and are registered with a Leeds GP
Short Term • An increase in people taking up the health check with
Learning Disability Medium Term • Identification of existing conditions. • Identification of preventable illnesses • Implementation of reasonable adjustments Long Term • Reduce premature mortality for those with LD and SMI • Potential Years of Life Lost to Avoidable Causes • Reduce the proportion of adults with a BMI over 30 • Reduce the proportion of adults who smoke • Increase the proportion of people being cared for in primary
and community services • Reduce the rate of growth in non elective bed days • Improvement in experience measures
Primary Care
18 Learning Disability and Autism – expand personal health budgets
• Offering more choice and control to people and carers in terms of how they manage their care and support – based on the support plan that has been given. Plan is to roll out within section 117 and continue to offer them within Continuing Healthcare.
People who have a Learning Disability, Autism or both, are 18 or over, who are eligible for either Continuing Healthcare or Section 117 funding
Short Term • Increase personalisation – people having choice and leading
on development of their health packages Medium Term • Increase in people accessing personal health budgets • Improved health outcomes Long Term • Potential Years of Life Lost to Avoidable Causes • Reduce the proportion of adults with a BMI over 30 • Improvement in experience measures
59
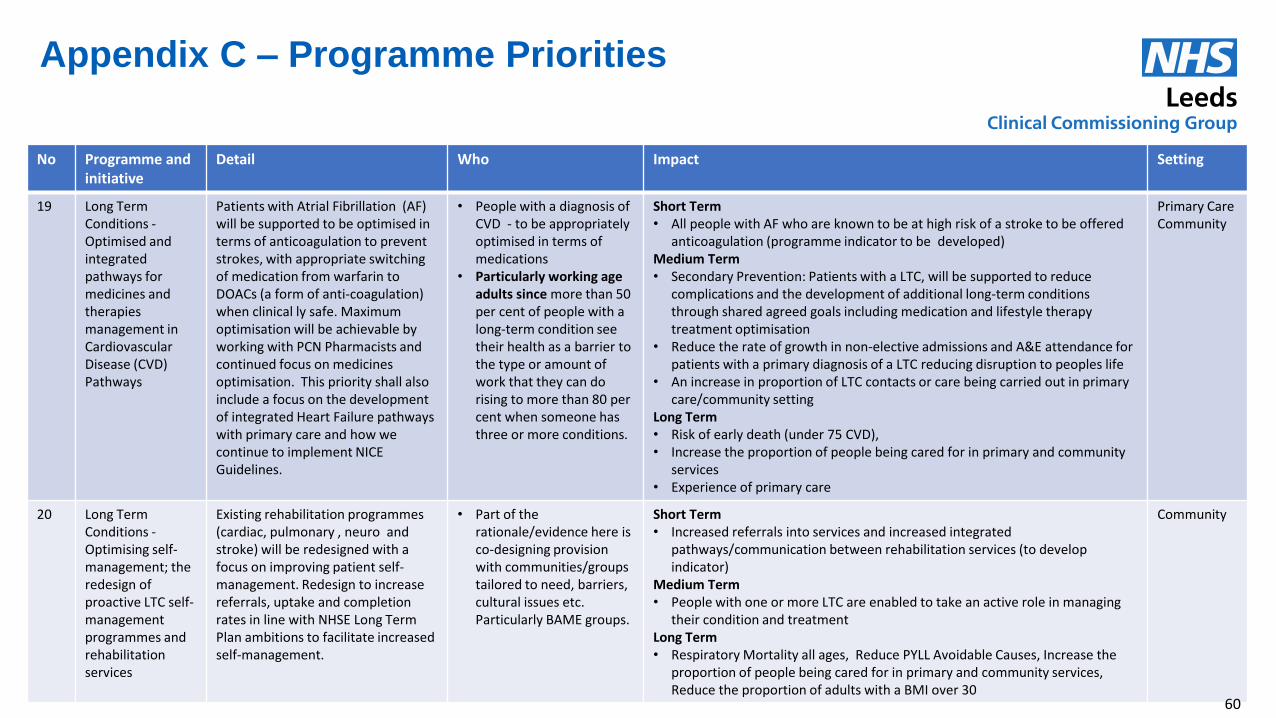
Building healthier communities
No Programme and initiative
Detail Who Impact Setting
19 Long Term Conditions - Optimised and integrated pathways for medicines and therapies management in Cardiovascular Disease (CVD) Pathways
Patients with Atrial Fibrillation (AF) will be supported to be optimised in terms of anticoagulation to prevent strokes, with appropriate switching of medication from warfarin to DOACs (a form of anti-coagulation) when clinical ly safe. Maximum optimisation will be achievable by working with PCN Pharmacists and continued focus on medicines optimisation. This priority shall also include a focus on the development of integrated Heart Failure pathways with primary care and how we continue to implement NICE Guidelines.
• People with a diagnosis of CVD - to be appropriately optimised in terms of medications
• Particularly working age adults since more than 50 per cent of people with a long-term condition see their health as a barrier to the type or amount of work that they can do rising to more than 80 per cent when someone has three or more conditions.
Short Term • All people with AF who are known to be at high risk of a stroke to be offered
anticoagulation (programme indicator to be developed) Medium Term • Secondary Prevention: Patients with a LTC, will be supported to reduce
complications and the development of additional long-term conditions through shared agreed goals including medication and lifestyle therapy treatment optimisation
• Reduce the rate of growth in non-elective admissions and A&E attendance for patients with a primary diagnosis of a LTC reducing disruption to peoples life
• An increase in proportion of LTC contacts or care being carried out in primary care/community setting
Long Term • Risk of early death (under 75 CVD), • Increase the proportion of people being cared for in primary and community
services • Experience of primary care
Primary Care Community
20 Long Term Conditions - Optimising self-management; the redesign of proactive LTC self-management programmes and rehabilitation services
Existing rehabilitation programmes (cardiac, pulmonary , neuro and stroke) will be redesigned with a focus on improving patient self-management. Redesign to increase referrals, uptake and completion rates in line with NHSE Long Term Plan ambitions to facilitate increased self-management.
• Part of the rationale/evidence here is co-designing provision with communities/groups tailored to need, barriers, cultural issues etc. Particularly BAME groups.
Short Term • Increased referrals into services and increased integrated
pathways/communication between rehabilitation services (to develop indicator)
Medium Term • People with one or more LTC are enabled to take an active role in managing
their condition and treatment Long Term • Respiratory Mortality all ages, Reduce PYLL Avoidable Causes, Increase the
proportion of people being cared for in primary and community services, Reduce the proportion of adults with a BMI over 30
Community
Appendix C – Programme Priorities
60
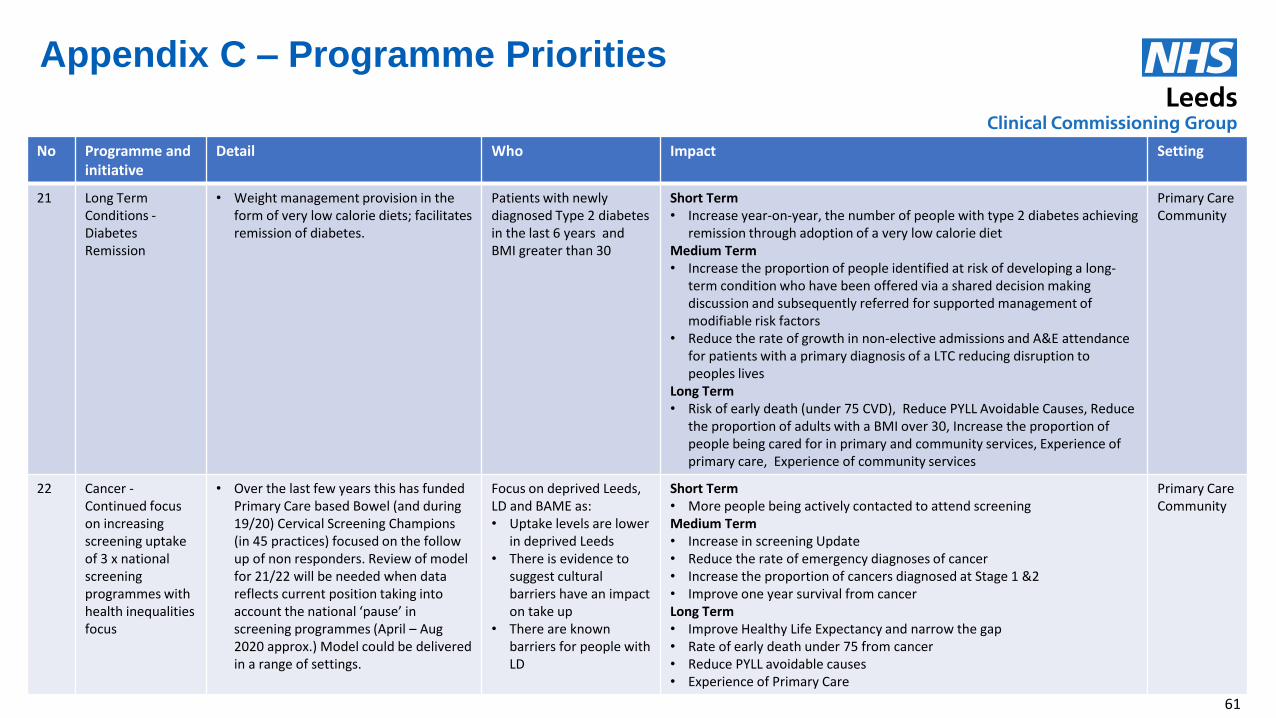
Building healthier communities
Appendix C – Programme Priorities
No Programme and initiative
Detail Who Impact Setting
21 Long Term Conditions - Diabetes Remission
• Weight management provision in the form of very low calorie diets; facilitates remission of diabetes.
Patients with newly diagnosed Type 2 diabetes in the last 6 years and BMI greater than 30
Short Term • Increase year-on-year, the number of people with type 2 diabetes achieving
remission through adoption of a very low calorie diet Medium Term • Increase the proportion of people identified at risk of developing a long-
term condition who have been offered via a shared decision making discussion and subsequently referred for supported management of modifiable risk factors
• Reduce the rate of growth in non-elective admissions and A&E attendance for patients with a primary diagnosis of a LTC reducing disruption to peoples lives
Long Term • Risk of early death (under 75 CVD), Reduce PYLL Avoidable Causes, Reduce
the proportion of adults with a BMI over 30, Increase the proportion of people being cared for in primary and community services, Experience of primary care, Experience of community services
Primary Care Community
22 Cancer - Continued focus on increasing screening uptake of 3 x national screening programmes with health inequalities focus
• Over the last few years this has funded Primary Care based Bowel (and during 19/20) Cervical Screening Champions (in 45 practices) focused on the follow up of non responders. Review of model for 21/22 will be needed when data reflects current position taking into account the national ‘pause’ in screening programmes (April – Aug 2020 approx.) Model could be delivered in a range of settings.
Focus on deprived Leeds, LD and BAME as: • Uptake levels are lower
in deprived Leeds • There is evidence to
suggest cultural barriers have an impact on take up
• There are known barriers for people with LD
Short Term • More people being actively contacted to attend screening Medium Term • Increase in screening Update • Reduce the rate of emergency diagnoses of cancer • Increase the proportion of cancers diagnosed at Stage 1 &2 • Improve one year survival from cancer Long Term • Improve Healthy Life Expectancy and narrow the gap • Rate of early death under 75 from cancer • Reduce PYLL avoidable causes • Experience of Primary Care
Primary Care Community
61
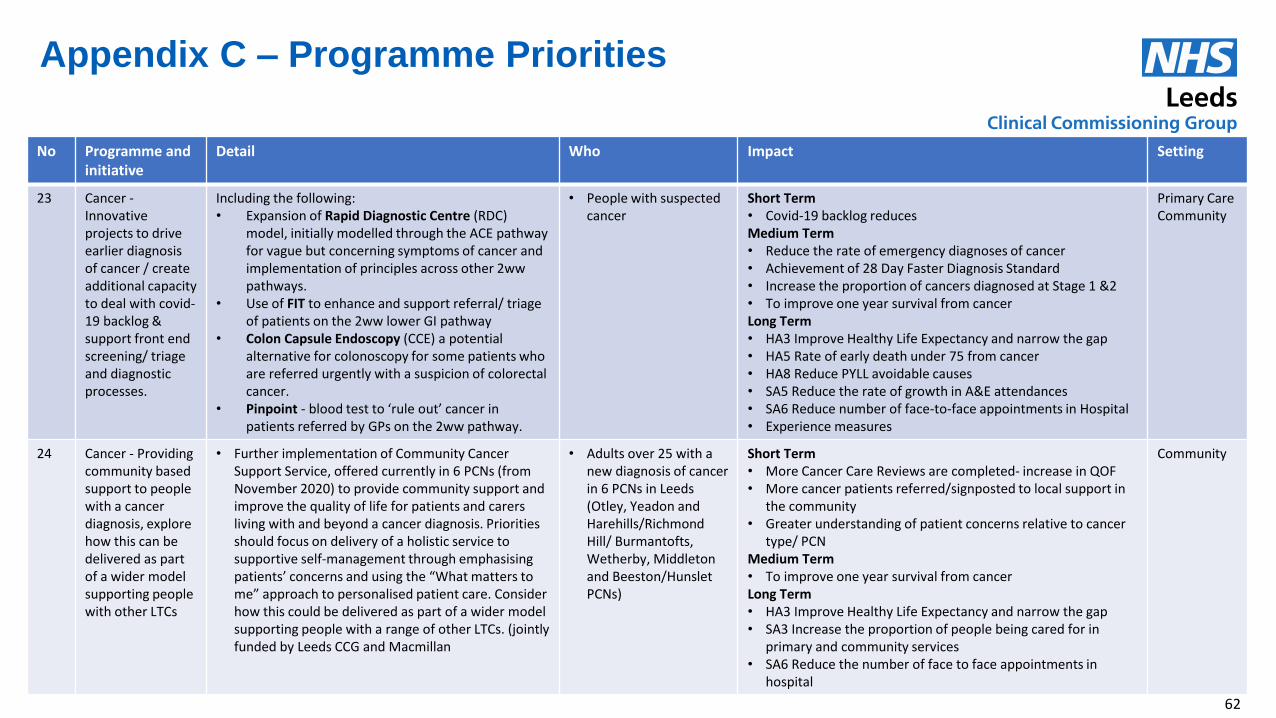
Building healthier communities
Appendix C – Programme Priorities
No Programme and initiative
Detail Who Impact Setting
23 Cancer - Innovative projects to drive earlier diagnosis of cancer / create additional capacity to deal with covid-19 backlog & support front end screening/ triage and diagnostic processes.
Including the following: • Expansion of Rapid Diagnostic Centre (RDC)
model, initially modelled through the ACE pathway for vague but concerning symptoms of cancer and implementation of principles across other 2ww pathways.
• Use of FIT to enhance and support referral/ triage of patients on the 2ww lower GI pathway
• Colon Capsule Endoscopy (CCE) a potential alternative for colonoscopy for some patients who are referred urgently with a suspicion of colorectal cancer.
• Pinpoint - blood test to ‘rule out’ cancer in patients referred by GPs on the 2ww pathway.
• People with suspected cancer
Short Term • Covid-19 backlog reduces Medium Term • Reduce the rate of emergency diagnoses of cancer • Achievement of 28 Day Faster Diagnosis Standard • Increase the proportion of cancers diagnosed at Stage 1 &2 • To improve one year survival from cancer Long Term • HA3 Improve Healthy Life Expectancy and narrow the gap • HA5 Rate of early death under 75 from cancer • HA8 Reduce PYLL avoidable causes • SA5 Reduce the rate of growth in A&E attendances • SA6 Reduce number of face-to-face appointments in Hospital • Experience measures
Primary Care Community
24 Cancer - Providing community based support to people with a cancer diagnosis, explore how this can be delivered as part of a wider model supporting people with other LTCs
• Further implementation of Community Cancer Support Service, offered currently in 6 PCNs (from November 2020) to provide community support and improve the quality of life for patients and carers living with and beyond a cancer diagnosis. Priorities should focus on delivery of a holistic service to supportive self-management through emphasising patients’ concerns and using the “What matters to me” approach to personalised patient care. Consider how this could be delivered as part of a wider model supporting people with a range of other LTCs. (jointly funded by Leeds CCG and Macmillan
• Adults over 25 with a new diagnosis of cancer in 6 PCNs in Leeds (Otley, Yeadon and Harehills/Richmond Hill/ Burmantofts, Wetherby, Middleton and Beeston/Hunslet PCNs)
Short Term • More Cancer Care Reviews are completed- increase in QOF • More cancer patients referred/signposted to local support in
the community • Greater understanding of patient concerns relative to cancer
type/ PCN Medium Term • To improve one year survival from cancer Long Term • HA3 Improve Healthy Life Expectancy and narrow the gap • SA3 Increase the proportion of people being cared for in
primary and community services • SA6 Reduce the number of face to face appointments in
hospital
Community
62
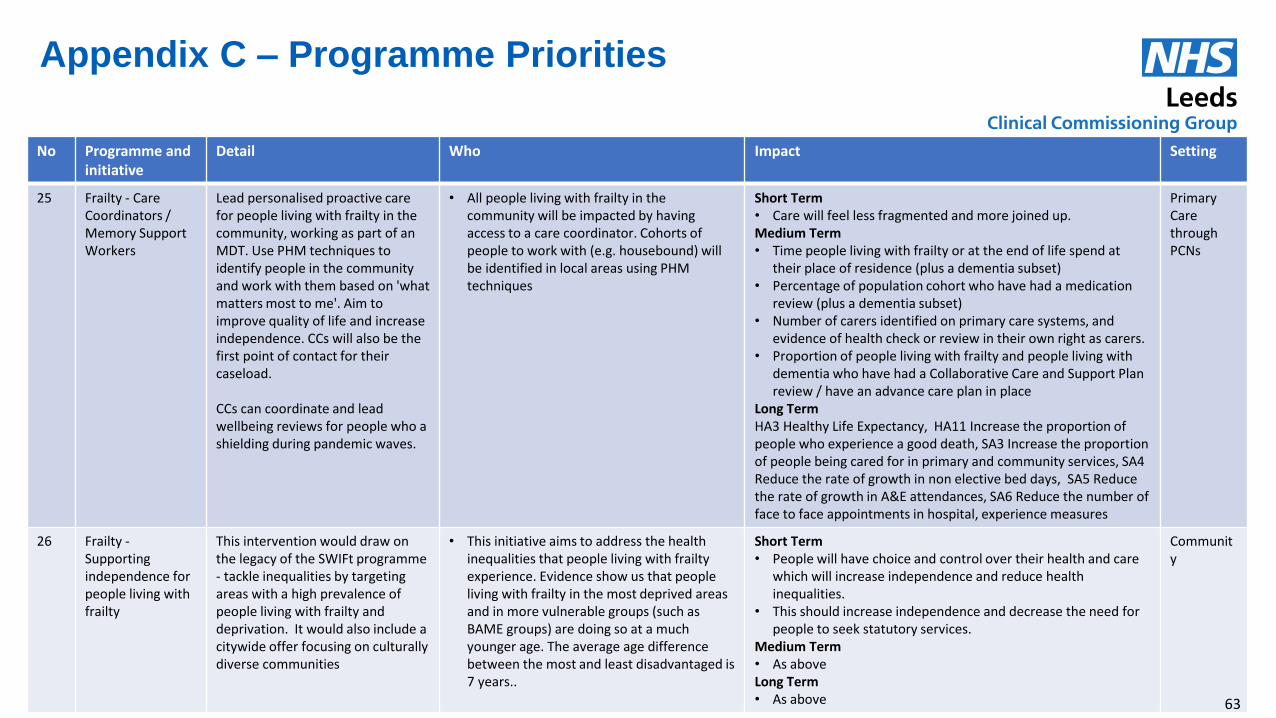
Building healthier communities
Appendix C – Programme Priorities
No Programme and initiative
Detail Who Impact Setting
25 Frailty - Care Coordinators / Memory Support Workers
Lead personalised proactive care for people living with frailty in the community, working as part of an MDT. Use PHM techniques to identify people in the community and work with them based on 'what matters most to me'. Aim to improve quality of life and increase independence. CCs will also be the first point of contact for their caseload. CCs can coordinate and lead wellbeing reviews for people who a shielding during pandemic waves.
• All people living with frailty in the community will be impacted by having access to a care coordinator. Cohorts of people to work with (e.g. housebound) will be identified in local areas using PHM techniques
Short Term • Care will feel less fragmented and more joined up. Medium Term • Time people living with frailty or at the end of life spend at
their place of residence (plus a dementia subset) • Percentage of population cohort who have had a medication
review (plus a dementia subset) • Number of carers identified on primary care systems, and
evidence of health check or review in their own right as carers. • Proportion of people living with frailty and people living with
dementia who have had a Collaborative Care and Support Plan review / have an advance care plan in place
Long Term HA3 Healthy Life Expectancy, HA11 Increase the proportion of people who experience a good death, SA3 Increase the proportion of people being cared for in primary and community services, SA4 Reduce the rate of growth in non elective bed days, SA5 Reduce the rate of growth in A&E attendances, SA6 Reduce the number of face to face appointments in hospital, experience measures
Primary Care through PCNs
26 Frailty - Supporting independence for people living with frailty
This intervention would draw on the legacy of the SWIFt programme - tackle inequalities by targeting areas with a high prevalence of people living with frailty and deprivation. It would also include a citywide offer focusing on culturally diverse communities
• This initiative aims to address the health inequalities that people living with frailty experience. Evidence show us that people living with frailty in the most deprived areas and in more vulnerable groups (such as BAME groups) are doing so at a much younger age. The average age difference between the most and least disadvantaged is 7 years..
Short Term • People will have choice and control over their health and care
which will increase independence and reduce health inequalities.
• This should increase independence and decrease the need for people to seek statutory services.
Medium Term • As above Long Term • As above
Community
63
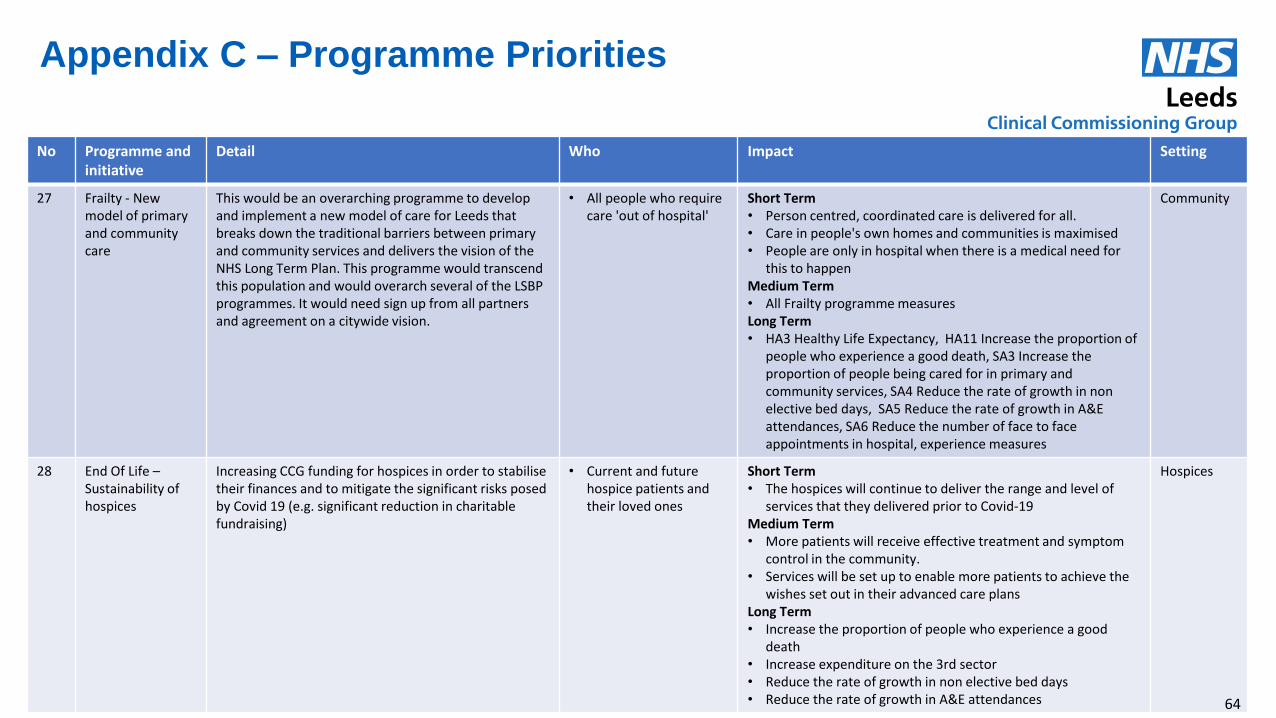
Building healthier communities
Appendix C – Programme Priorities
No Programme and initiative
Detail Who Impact Setting
27 Frailty - New model of primary and community care
This would be an overarching programme to develop and implement a new model of care for Leeds that breaks down the traditional barriers between primary and community services and delivers the vision of the NHS Long Term Plan. This programme would transcend this population and would overarch several of the LSBP programmes. It would need sign up from all partners and agreement on a citywide vision.
• All people who require care 'out of hospital'
Short Term • Person centred, coordinated care is delivered for all. • Care in people's own homes and communities is maximised • People are only in hospital when there is a medical need for
this to happen Medium Term • All Frailty programme measures Long Term • HA3 Healthy Life Expectancy, HA11 Increase the proportion of
people who experience a good death, SA3 Increase the proportion of people being cared for in primary and community services, SA4 Reduce the rate of growth in non elective bed days, SA5 Reduce the rate of growth in A&E attendances, SA6 Reduce the number of face to face appointments in hospital, experience measures
Community
28 End Of Life – Sustainability of hospices
Increasing CCG funding for hospices in order to stabilise their finances and to mitigate the significant risks posed by Covid 19 (e.g. significant reduction in charitable fundraising)
• Current and future hospice patients and their loved ones
Short Term • The hospices will continue to deliver the range and level of
services that they delivered prior to Covid-19 Medium Term • More patients will receive effective treatment and symptom
control in the community. • Services will be set up to enable more patients to achieve the
wishes set out in their advanced care plans Long Term • Increase the proportion of people who experience a good
death • Increase expenditure on the 3rd sector • Reduce the rate of growth in non elective bed days • Reduce the rate of growth in A&E attendances
Hospices
64
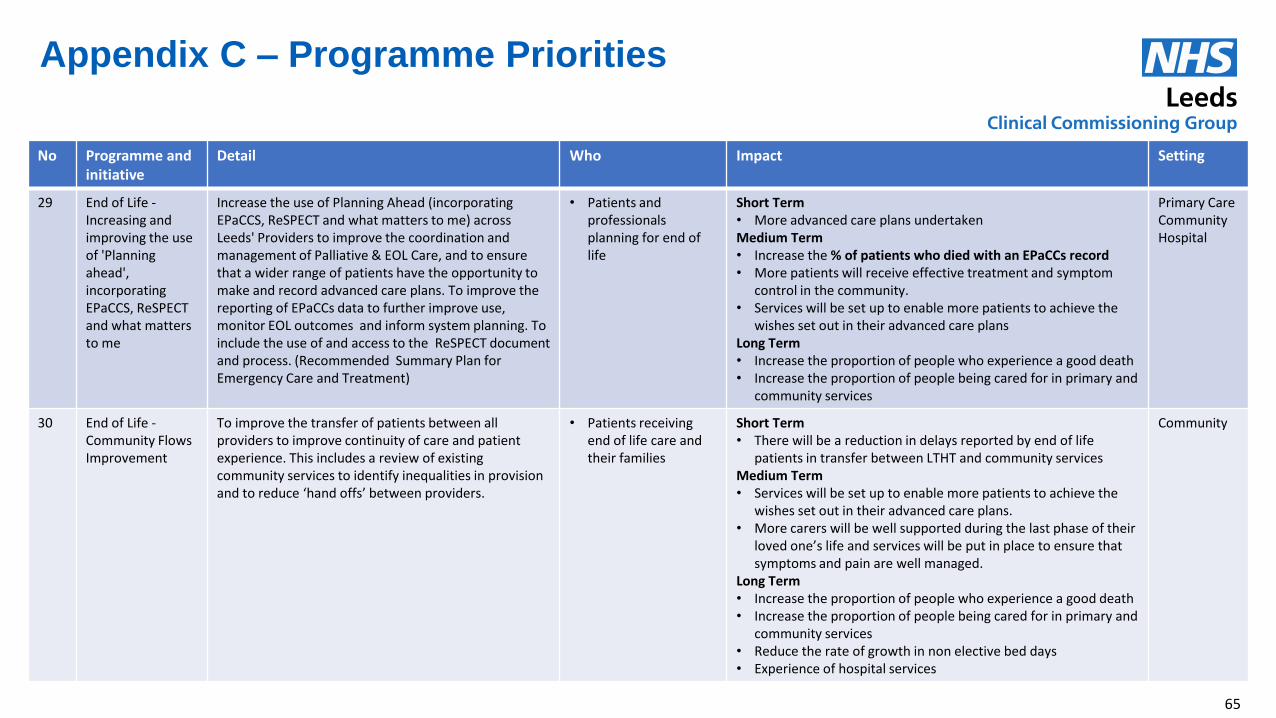
Building healthier communities
No Programme and initiative
Detail Who Impact Setting
29 End of Life - Increasing and improving the use of 'Planning ahead', incorporating EPaCCS, ReSPECT and what matters to me
Increase the use of Planning Ahead (incorporating EPaCCS, ReSPECT and what matters to me) across Leeds' Providers to improve the coordination and management of Palliative & EOL Care, and to ensure that a wider range of patients have the opportunity to make and record advanced care plans. To improve the reporting of EPaCCs data to further improve use, monitor EOL outcomes and inform system planning. To include the use of and access to the ReSPECT document and process. (Recommended Summary Plan for Emergency Care and Treatment)
• Patients and professionals planning for end of life
Short Term • More advanced care plans undertaken Medium Term • Increase the % of patients who died with an EPaCCs record • More patients will receive effective treatment and symptom
control in the community. • Services will be set up to enable more patients to achieve the
wishes set out in their advanced care plans Long Term • Increase the proportion of people who experience a good death • Increase the proportion of people being cared for in primary and
community services
Primary Care Community Hospital
30 End of Life - Community Flows Improvement
To improve the transfer of patients between all providers to improve continuity of care and patient experience. This includes a review of existing community services to identify inequalities in provision and to reduce ‘hand offs’ between providers.
• Patients receiving end of life care and their families
Short Term • There will be a reduction in delays reported by end of life
patients in transfer between LTHT and community services Medium Term • Services will be set up to enable more patients to achieve the
wishes set out in their advanced care plans. • More carers will be well supported during the last phase of their
loved one’s life and services will be put in place to ensure that symptoms and pain are well managed.
Long Term • Increase the proportion of people who experience a good death • Increase the proportion of people being cared for in primary and
community services • Reduce the rate of growth in non elective bed days • Experience of hospital services
Community
Appendix C – Programme Priorities
65
Building healthier communities
Appendix D – Deep Dive into Programme Measures
66
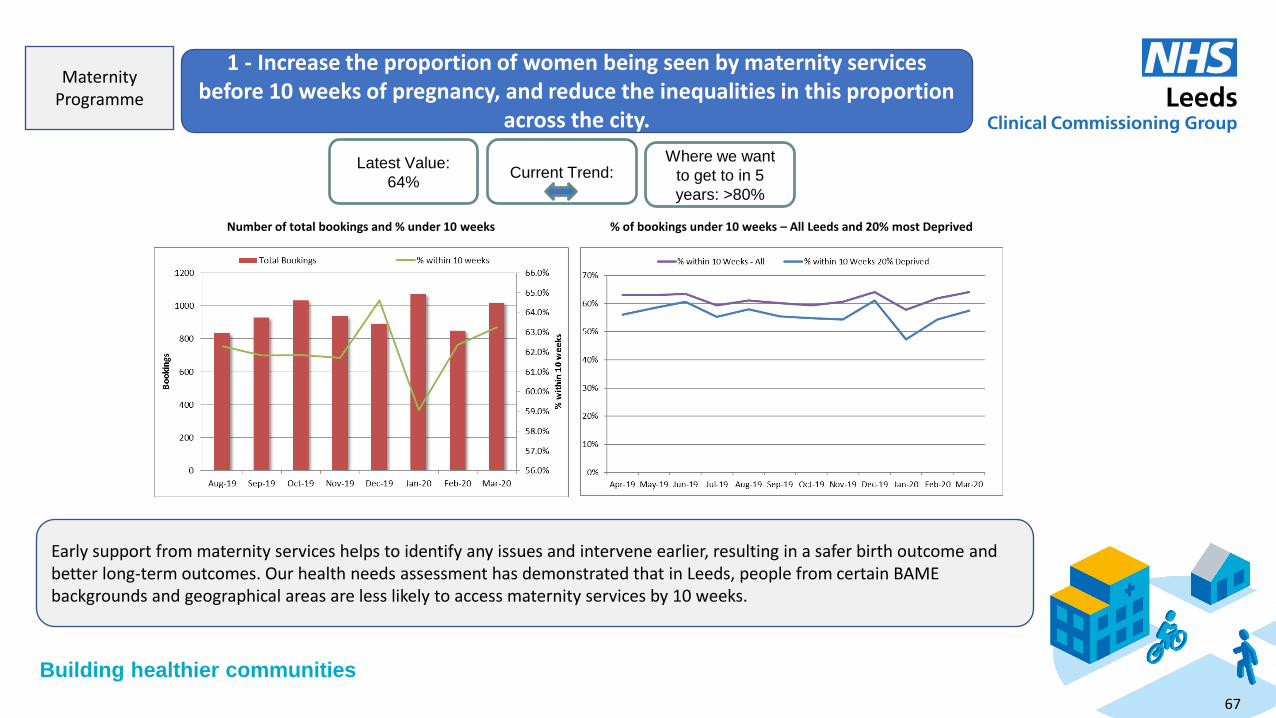
Building healthier communities
1 - Increase the proportion of women being seen by maternity services before 10 weeks of pregnancy, and reduce the inequalities in this proportion
across the city.
Insert latest graph – if possible reflecting England, Leeds and Deprived
Leeds
Early support from maternity services helps to identify any issues and intervene earlier, resulting in a safer birth outcome and better long-term outcomes. Our health needs assessment has demonstrated that in Leeds, people from certain BAME backgrounds and geographical areas are less likely to access maternity services by 10 weeks.
Number of total bookings and % under 10 weeks % of bookings under 10 weeks – All Leeds and 20% most Deprived
Latest Value:
64% Current Trend:
Where we want
to get to in 5
years: >80%
Maternity Programme
67
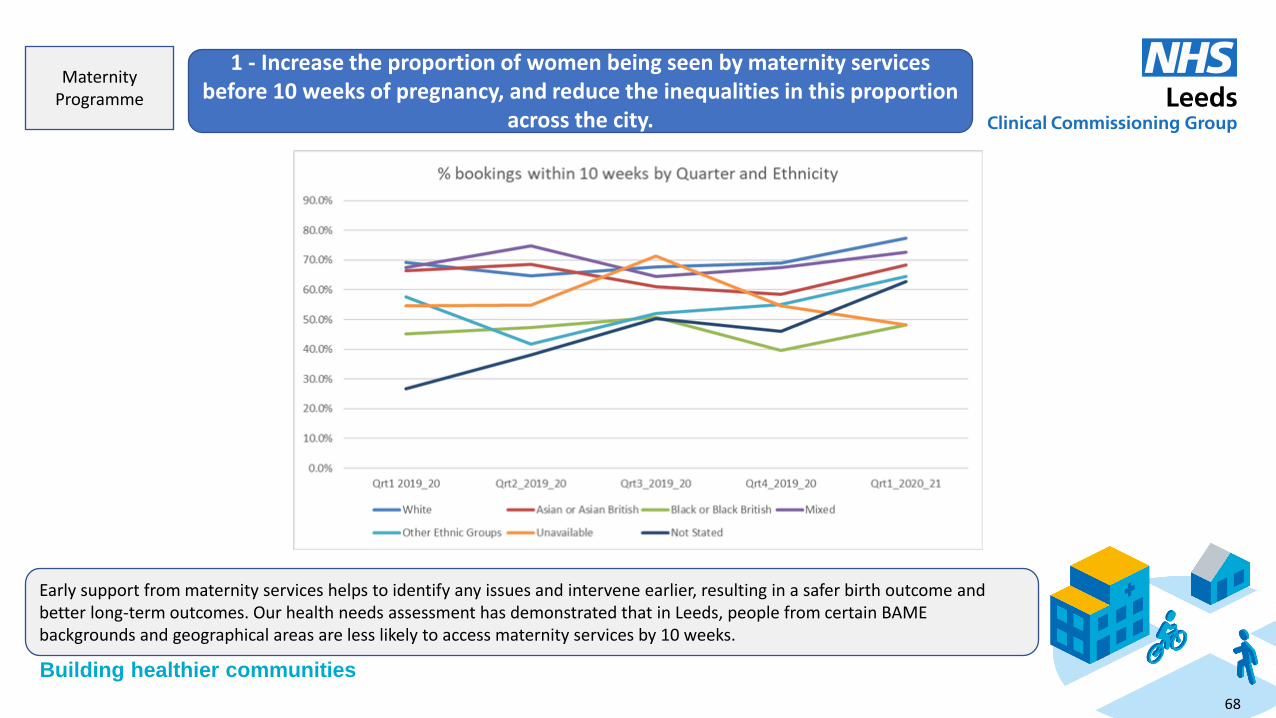
Building healthier communities
1 - Increase the proportion of women being seen by maternity services before 10 weeks of pregnancy, and reduce the inequalities in this proportion
across the city.
Early support from maternity services helps to identify any issues and intervene earlier, resulting in a safer birth outcome and better long-term outcomes. Our health needs assessment has demonstrated that in Leeds, people from certain BAME backgrounds and geographical areas are less likely to access maternity services by 10 weeks.
Maternity Programme
68
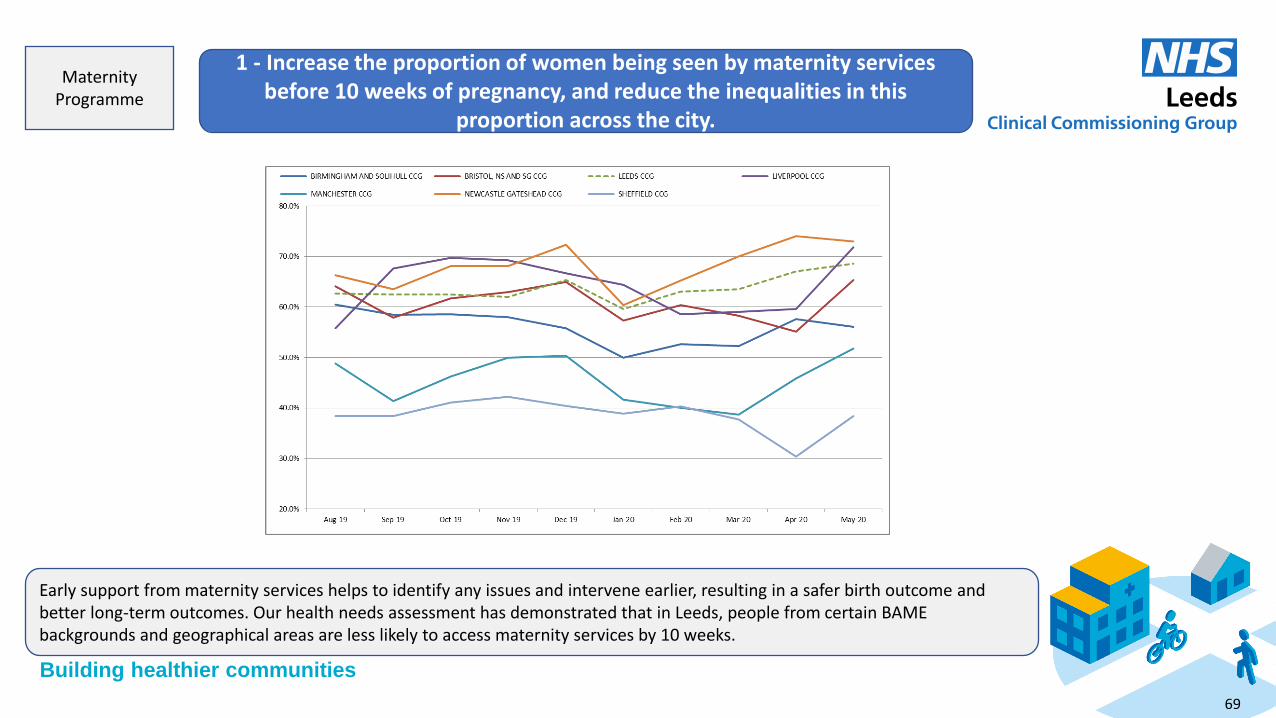
Building healthier communities
1 - Increase the proportion of women being seen by maternity services before 10 weeks of pregnancy, and reduce the inequalities in this
proportion across the city.
Early support from maternity services helps to identify any issues and intervene earlier, resulting in a safer birth outcome and better long-term outcomes. Our health needs assessment has demonstrated that in Leeds, people from certain BAME backgrounds and geographical areas are less likely to access maternity services by 10 weeks.
Maternity Programme
69
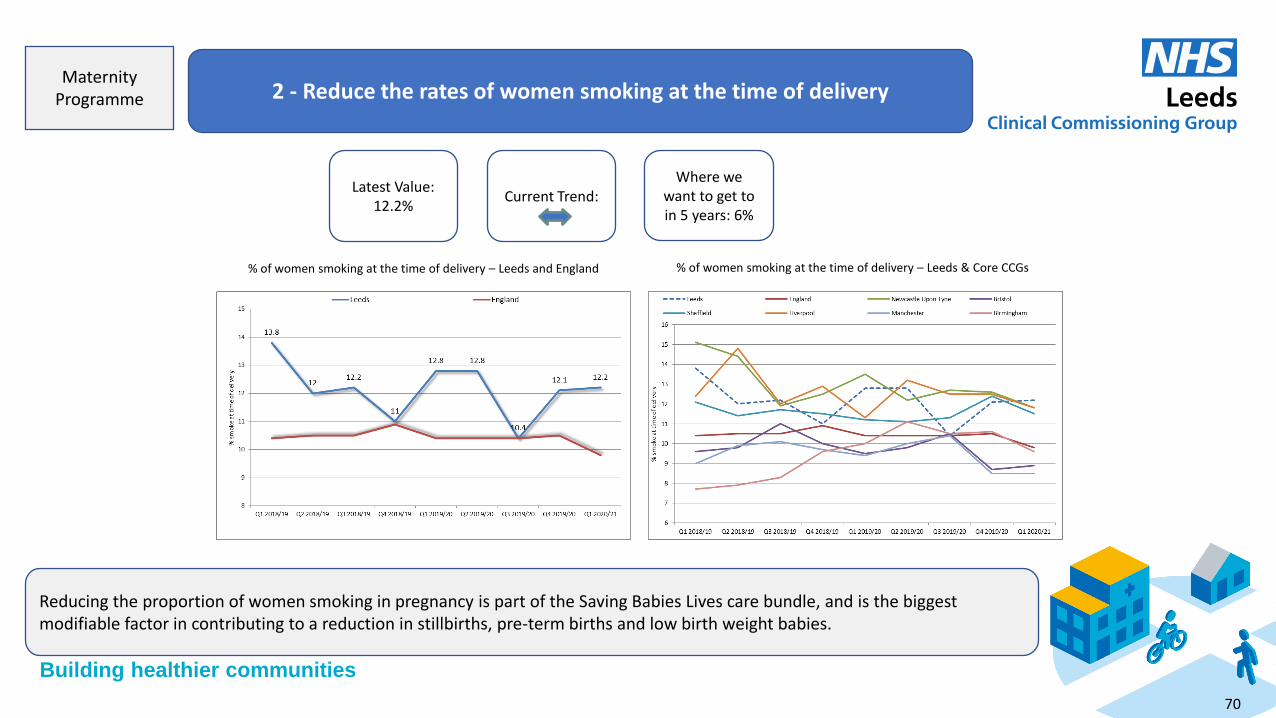
Building healthier communities
2 - Reduce the rates of women smoking at the time of delivery
Reducing the proportion of women smoking in pregnancy is part of the Saving Babies Lives care bundle, and is the biggest modifiable factor in contributing to a reduction in stillbirths, pre-term births and low birth weight babies.
Latest Value: 12.2%
Current Trend: Where we
want to get to in 5 years: 6%
% of women smoking at the time of delivery – Leeds and England % of women smoking at the time of delivery – Leeds & Core CCGs
Maternity Programme
70
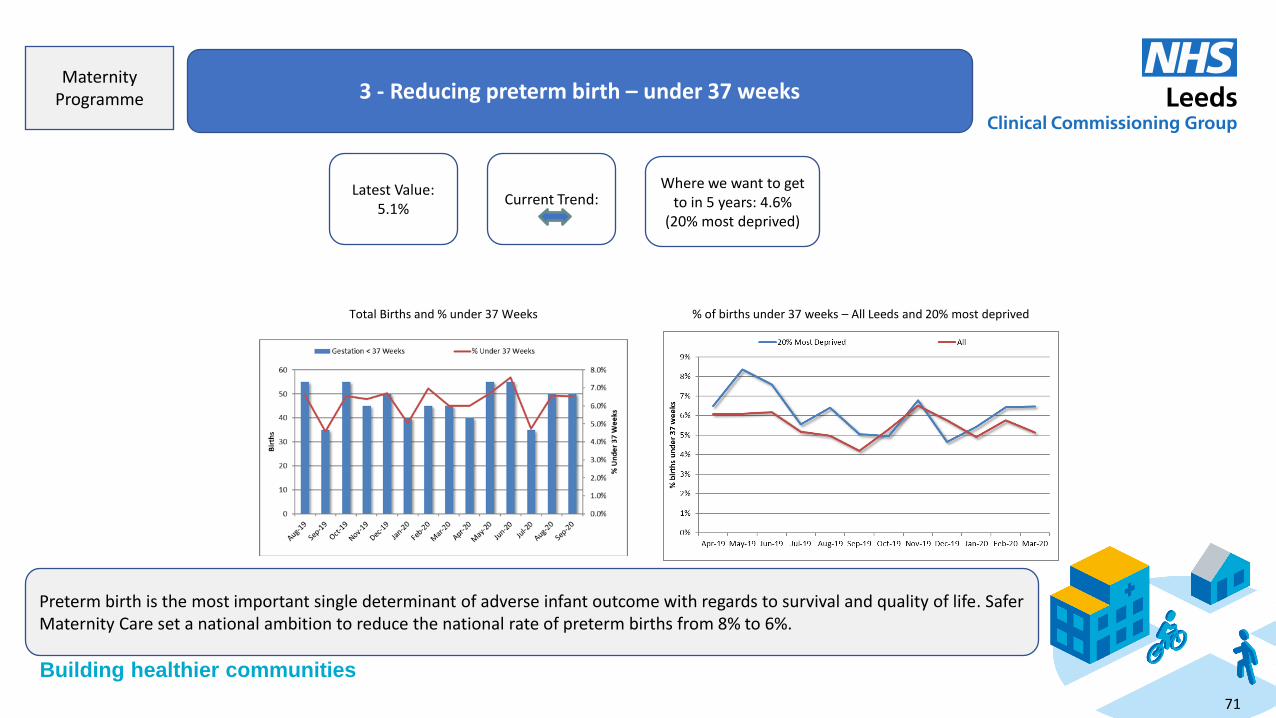
Building healthier communities
3 - Reducing preterm birth – under 37 weeks
Preterm birth is the most important single determinant of adverse infant outcome with regards to survival and quality of life. Safer Maternity Care set a national ambition to reduce the national rate of preterm births from 8% to 6%.
Latest Value: 5.1%
Current Trend: Where we want to get
to in 5 years: 4.6% (20% most deprived)
Total Births and % under 37 Weeks % of births under 37 weeks – All Leeds and 20% most deprived
Maternity Programme
71
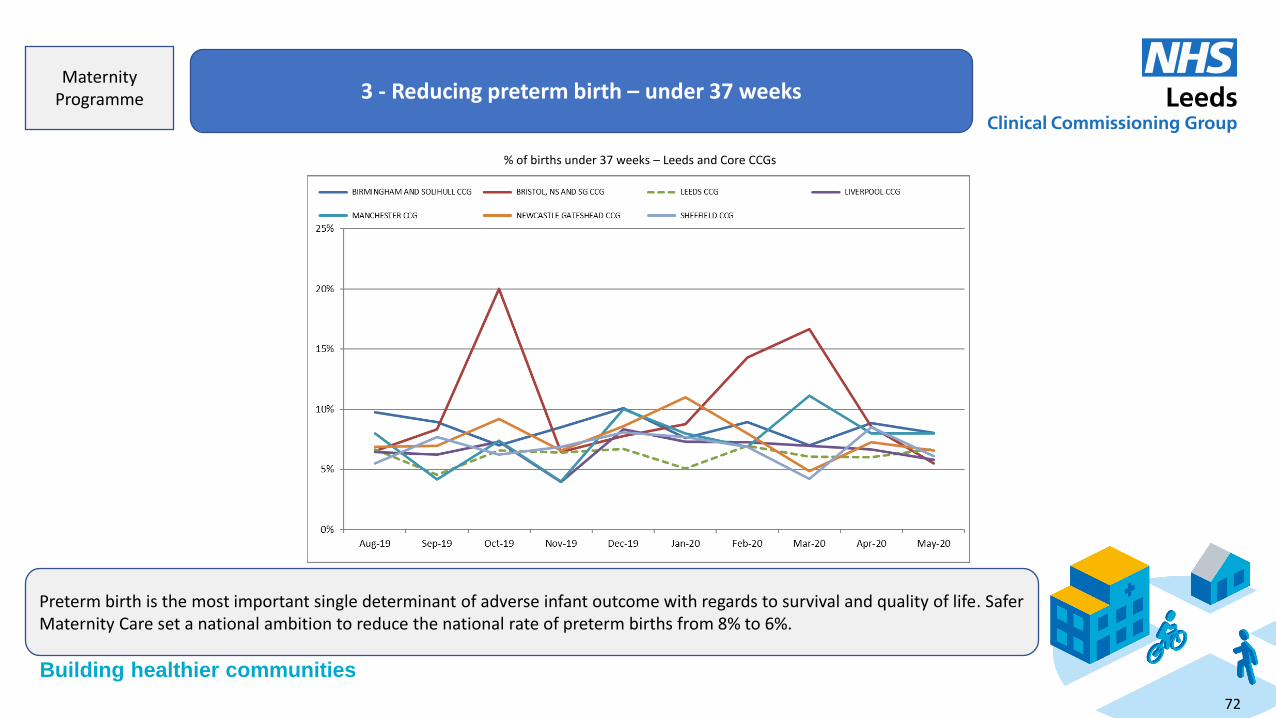
Building healthier communities
3 - Reducing preterm birth – under 37 weeks
Preterm birth is the most important single determinant of adverse infant outcome with regards to survival and quality of life. Safer Maternity Care set a national ambition to reduce the national rate of preterm births from 8% to 6%.
% of births under 37 weeks – Leeds and Core CCGs
Maternity Programme
72

Building healthier communities
4 - Reduce the rate of stillbirths
In line with the long-term plan, we are aiming to reduce stillbirths, neonatal deaths and intrapartum brain injuries by 50% by March 2025. We know that more can be done to prevent these tragedies and want to build on the progress that we have already made. Women from the poorest backgrounds and mothers from Black, Asian and Minority Ethnic (BaME) groups are at higher risk of their baby dying in the womb, or soon after birth and so need specific targeted support.
Still Births per 1000 births – All Leeds and 20% most deprived Percentage of Still Births by year
Maternity Programme
73
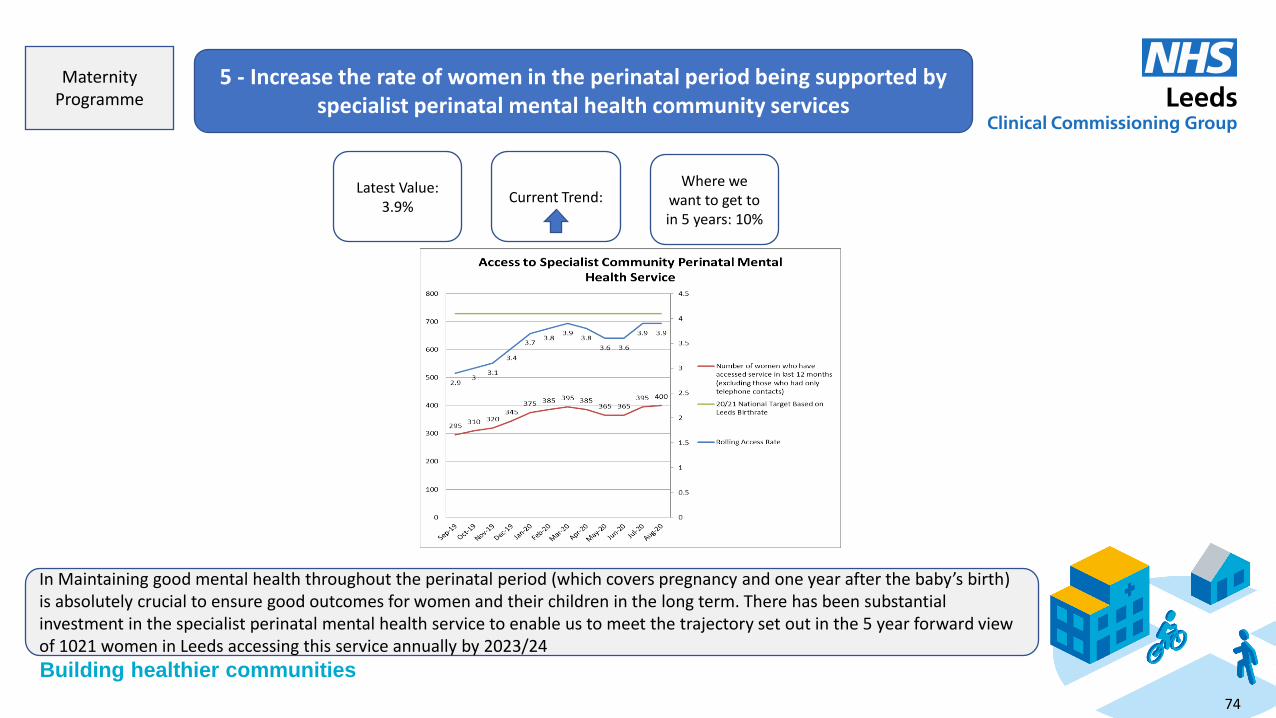
Building healthier communities
5 - Increase the rate of women in the perinatal period being supported by
specialist perinatal mental health community services
In Maintaining good mental health throughout the perinatal period (which covers pregnancy and one year after the baby’s birth) is absolutely crucial to ensure good outcomes for women and their children in the long term. There has been substantial investment in the specialist perinatal mental health service to enable us to meet the trajectory set out in the 5 year forward view of 1021 women in Leeds accessing this service annually by 2023/24
Latest Value: 3.9%
Current Trend: Where we
want to get to in 5 years: 10%
Maternity Programme
74
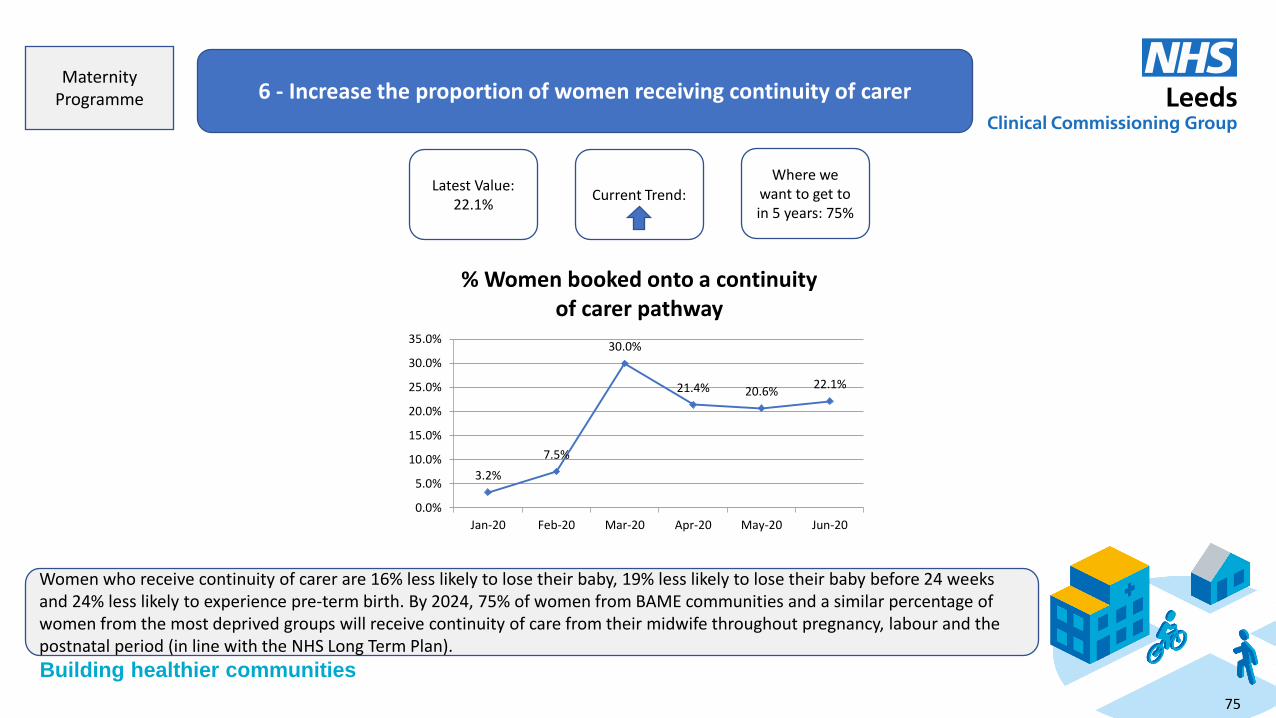
Building healthier communities
6 - Increase the proportion of women receiving continuity of carer
Women who receive continuity of carer are 16% less likely to lose their baby, 19% less likely to lose their baby before 24 weeks and 24% less likely to experience pre-term birth. By 2024, 75% of women from BAME communities and a similar percentage of women from the most deprived groups will receive continuity of care from their midwife throughout pregnancy, labour and the postnatal period (in line with the NHS Long Term Plan).
Latest Value: 22.1%
Current Trend:
Where we want to get to in 5 years: 75%
3.2%
7.5%
30.0%
21.4% 20.6% 22.1%
0.0%
5.0%
10.0%
15.0%
20.0%
25.0%
30.0%
35.0%
Jan-20 Feb-20 Mar-20 Apr-20 May-20 Jun-20
% Women booked onto a continuity of carer pathway
Maternity Programme
75
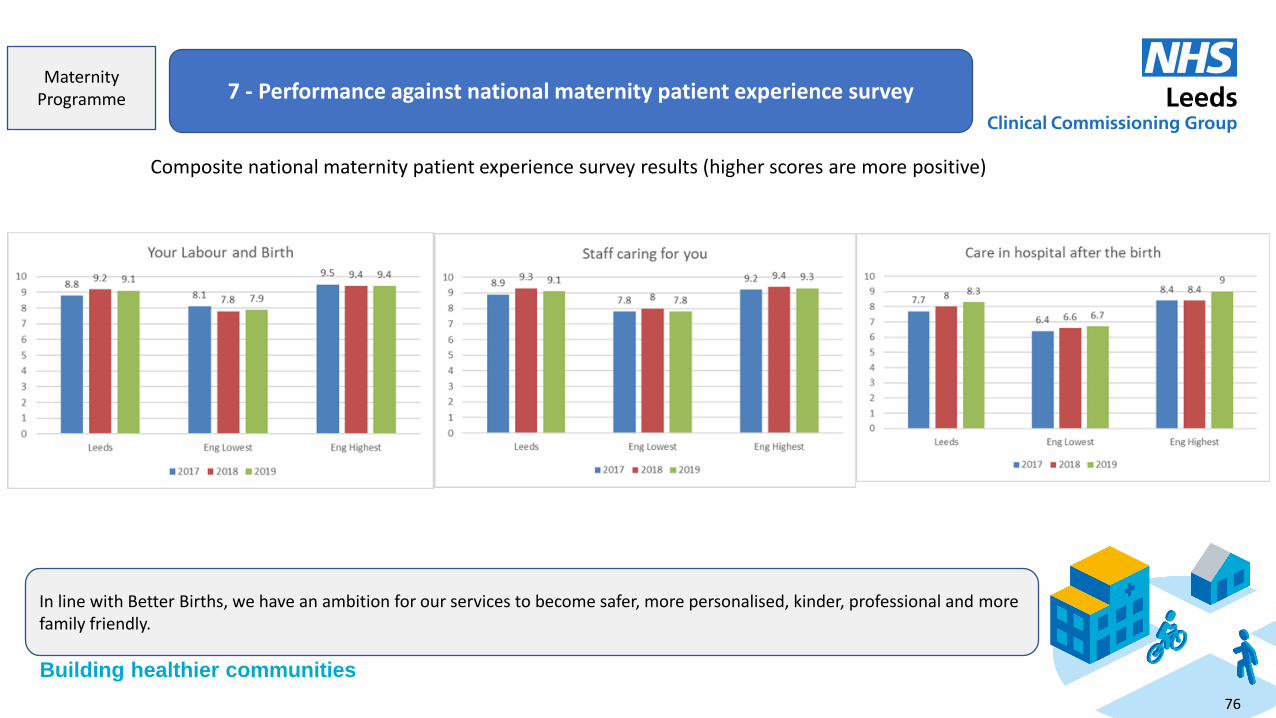
Building healthier communities
7 - Performance against national maternity patient experience survey
In line with Better Births, we have an ambition for our services to become safer, more personalised, kinder, professional and more family friendly.
Composite national maternity patient experience survey results (higher scores are more positive)
Maternity Programme
76
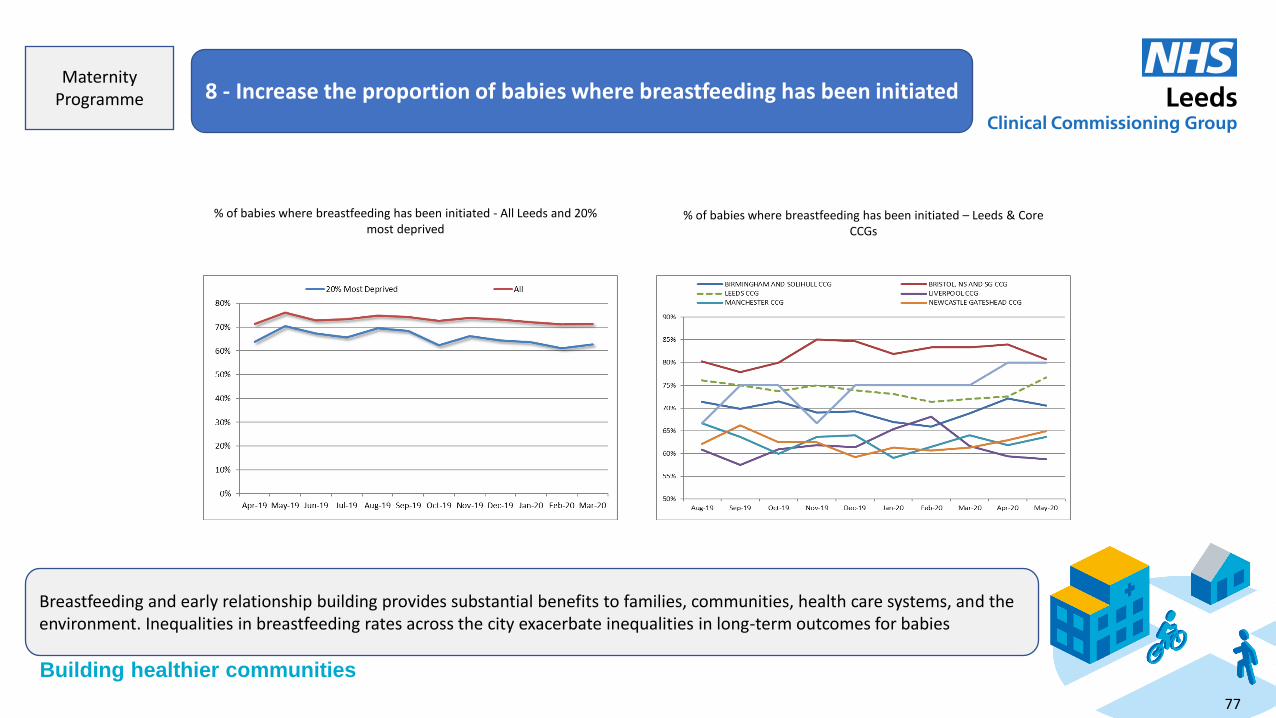
Building healthier communities
8 - Increase the proportion of babies where breastfeeding has been initiated
Breastfeeding and early relationship building provides substantial benefits to families, communities, health care systems, and the environment. Inequalities in breastfeeding rates across the city exacerbate inequalities in long-term outcomes for babies
% of babies where breastfeeding has been initiated - All Leeds and 20% most deprived
% of babies where breastfeeding has been initiated – Leeds & Core CCGs
Maternity Programme
77

Building healthier communities
1 - Increase the numbers of Children and Young People with a diagnosable
mental health condition receiving MH treatment
C&YP Mental Health
Programme
Latest Value: 3585
(19/20 Baseline)
Current Trend:
We need increased support in the community to respond to need promptly and prevent escalation, including increasing investment. The national access standard set by NHS England is that 35% of children and young people with a diagnosable mental health condition will receive MH treatment by 2020/21. In addition NHS England LTP target for 345,000 additional CYP (age 0-25) to have access to NHS funded and school/college based mental health teams by 2023/24 (note inclusion of 0-5 and 18-25 cohorts).This is a national standard that allows us to demonstrate access. Service improvement programmes and increased investment will influence this trajectory. Locally, we know that Children and Young People from BAME communities are under-represented in children and young peoples mental health services. We need to work to reduce this health inequality as part of this increase in access, and baseline data is currently being identified for this specific cohort group. In addition, there is an expectation that 95% children and young people with eating disorders will begin treatment within 1 week for urgent cases and 4 weeks for non-urgent cases.
Additional investment
required: Yes
Impact of COVID: • Surge in referrals to MindMate Spa anticipated Sept –
Dec 2020 • Sharp increase in urgent referrals to Eating Disorder
Services
78

Building healthier communities
2 - Reduced number of admissions to CAMHS/Tier 4 beds C&YP Mental
Health Programme
Latest Value: 38
(Total number of admissions 2019/20)
Current Trend:
Where we want to get to in 5 years: 19
(Half the number of admissions)
In order to demonstrate that we have effective and responsive community based support in place for children and young people to support their mental health at an earlier point (avoiding crisis) we would expect to see a reduction in the number of children and young people who ultimately require an admission to an inpatient ward. Additional investment is required in community services to ensure that the support offer is holistic and robust enough to ensure as many children and young people as possible are safely and appropriately cared for in the community to prevent admission, with admission only being used when absolutely necessary and appropriate. TCP cohort form part of this admissions data
Additional investment required: Yes
79
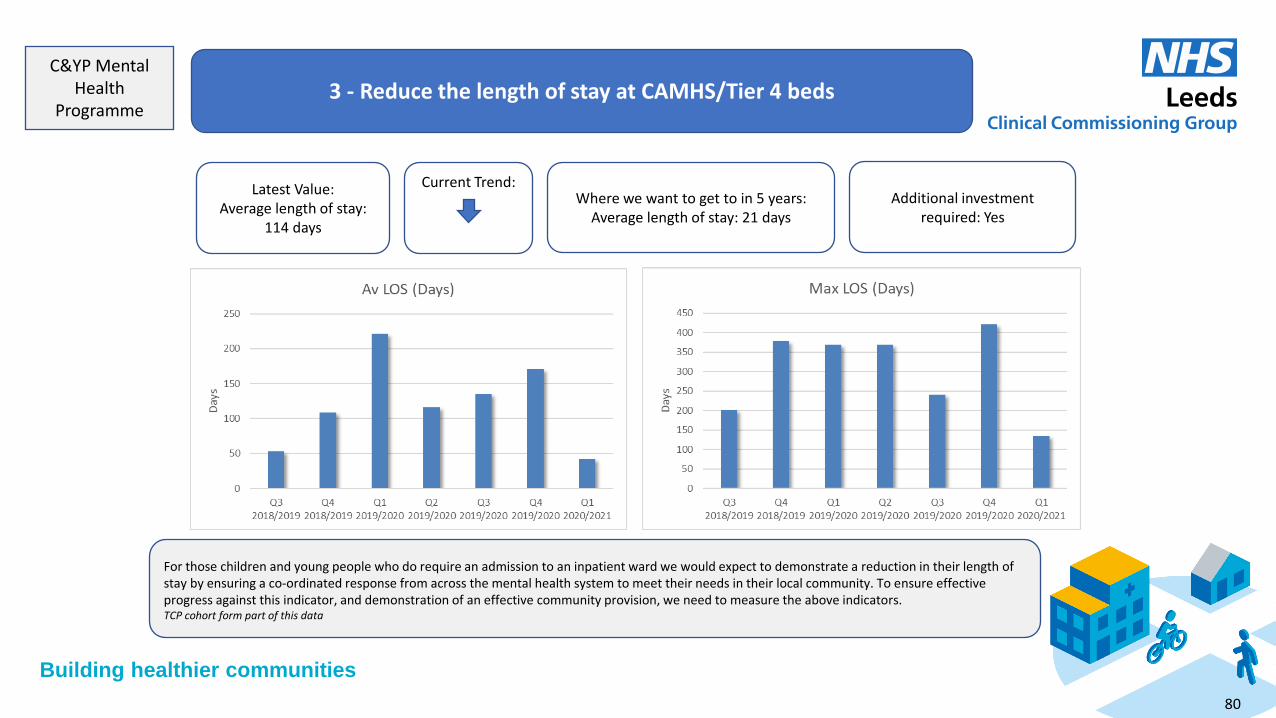
Building healthier communities
3 - Reduce the length of stay at CAMHS/Tier 4 beds C&YP Mental
Health Programme
Latest Value: Average length of stay:
114 days
Current Trend:
For those children and young people who do require an admission to an inpatient ward we would expect to demonstrate a reduction in their length of stay by ensuring a co-ordinated response from across the mental health system to meet their needs in their local community. To ensure effective progress against this indicator, and demonstration of an effective community provision, we need to measure the above indicators. TCP cohort form part of this data
Where we want to get to in 5 years: Average length of stay: 21 days
Additional investment required: Yes
80
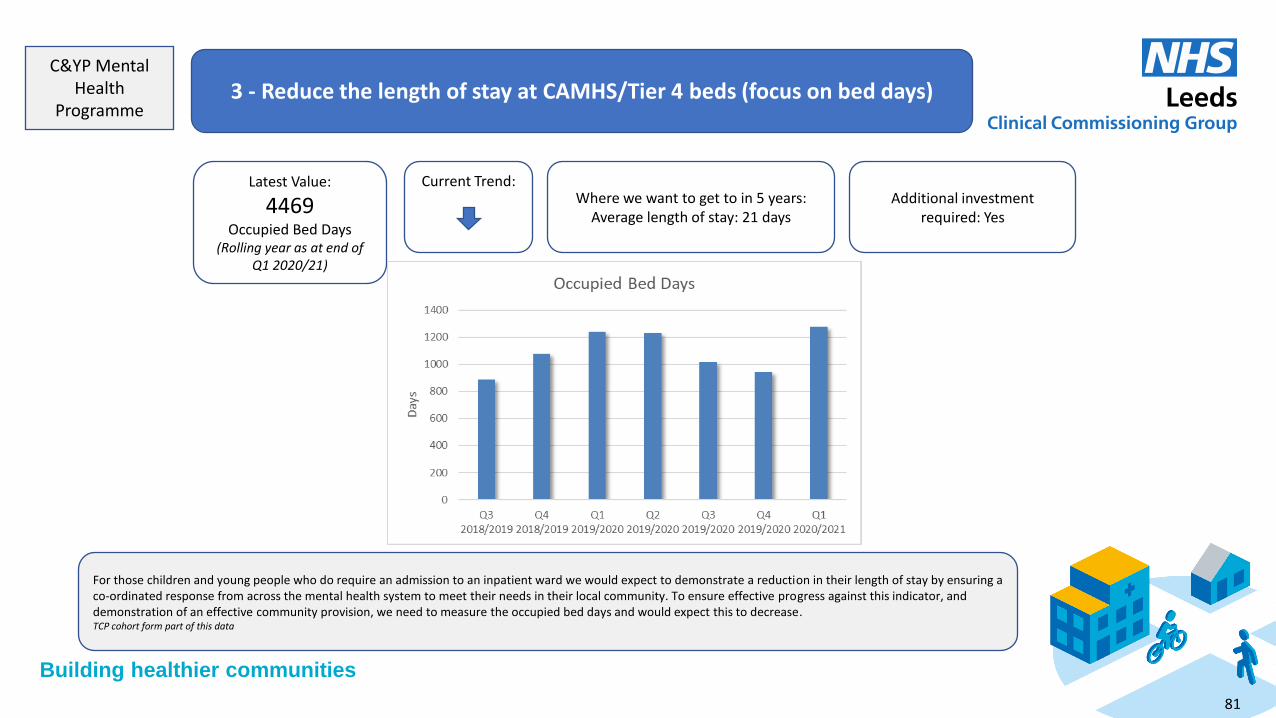
Building healthier communities
3 - Reduce the length of stay at CAMHS/Tier 4 beds (focus on bed days) C&YP Mental
Health Programme
Latest Value:
4469 Occupied Bed Days
(Rolling year as at end of Q1 2020/21)
Current Trend:
For those children and young people who do require an admission to an inpatient ward we would expect to demonstrate a reduction in their length of stay by ensuring a co-ordinated response from across the mental health system to meet their needs in their local community. To ensure effective progress against this indicator, and demonstration of an effective community provision, we need to measure the occupied bed days and would expect this to decrease. TCP cohort form part of this data
Where we want to get to in 5 years: Average length of stay: 21 days
Additional investment required: Yes
81

Building healthier communities
4 - Reduce the number of CYP presenting in mental health crisis/self-harm at ED and requiring admission to a general paediatric bed
C&YP Mental Health
Programme
Latest Value:
49 Average monthly
attendances 2019-20
27 Average monthly admissions
2019-20
Current Trend: Attendances Admissions
Within the NHS Long Term Plan the ambition states that there will be 100% coverage of 24/7 age-appropriate mental health crisis care provision for children and young people. In response to this we will ensure that children and young people (0-18) will have access to the crisis support they need at the times they need it and in the most appropriate setting. We want to be able to demonstrate a shift from children and young people presenting at ED as they have been supported more appropriately within their local community. This also supports the strategic ambitions around reducing suicide rates and reducing the number of people presenting in crisis. This indicator measures admissions to general paediatric beds in LTHT, we would expect a reduction in these type of admissions as the CAMHS Tier 4 bed capacity improves, and capacity to support children, young people and their families in the community improves.
Additional investment required: Yes
Impact of COVID: Increased level of risk
presentations
82
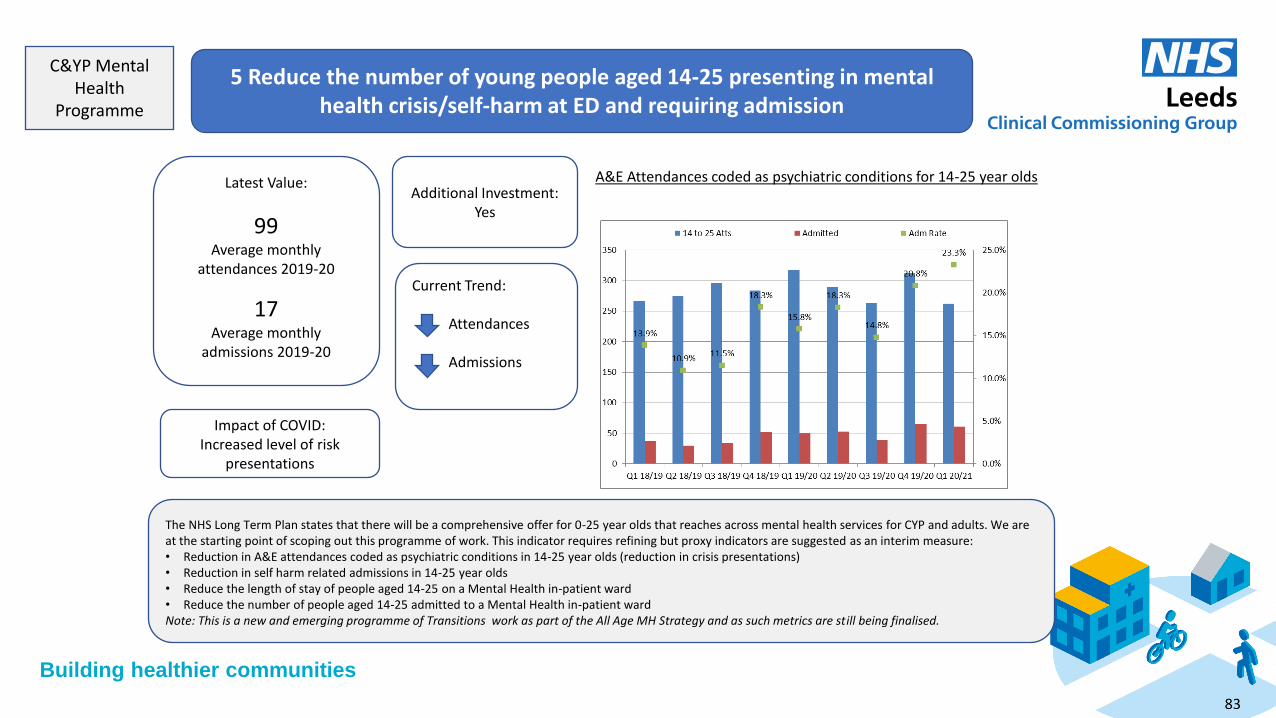
Building healthier communities
5 Reduce the number of young people aged 14-25 presenting in mental health crisis/self-harm at ED and requiring admission
C&YP Mental Health
Programme
Additional Investment: Yes
The NHS Long Term Plan states that there will be a comprehensive offer for 0-25 year olds that reaches across mental health services for CYP and adults. We are at the starting point of scoping out this programme of work. This indicator requires refining but proxy indicators are suggested as an interim measure: • Reduction in A&E attendances coded as psychiatric conditions in 14-25 year olds (reduction in crisis presentations) • Reduction in self harm related admissions in 14-25 year olds • Reduce the length of stay of people aged 14-25 on a Mental Health in-patient ward • Reduce the number of people aged 14-25 admitted to a Mental Health in-patient ward Note: This is a new and emerging programme of Transitions work as part of the All Age MH Strategy and as such metrics are still being finalised.
A&E Attendances coded as psychiatric conditions for 14-25 year olds Latest Value:
99 Average monthly
attendances 2019-20
17 Average monthly
admissions 2019-20
Impact of COVID: Increased level of risk
presentations
Current Trend: Attendances Admissions
83
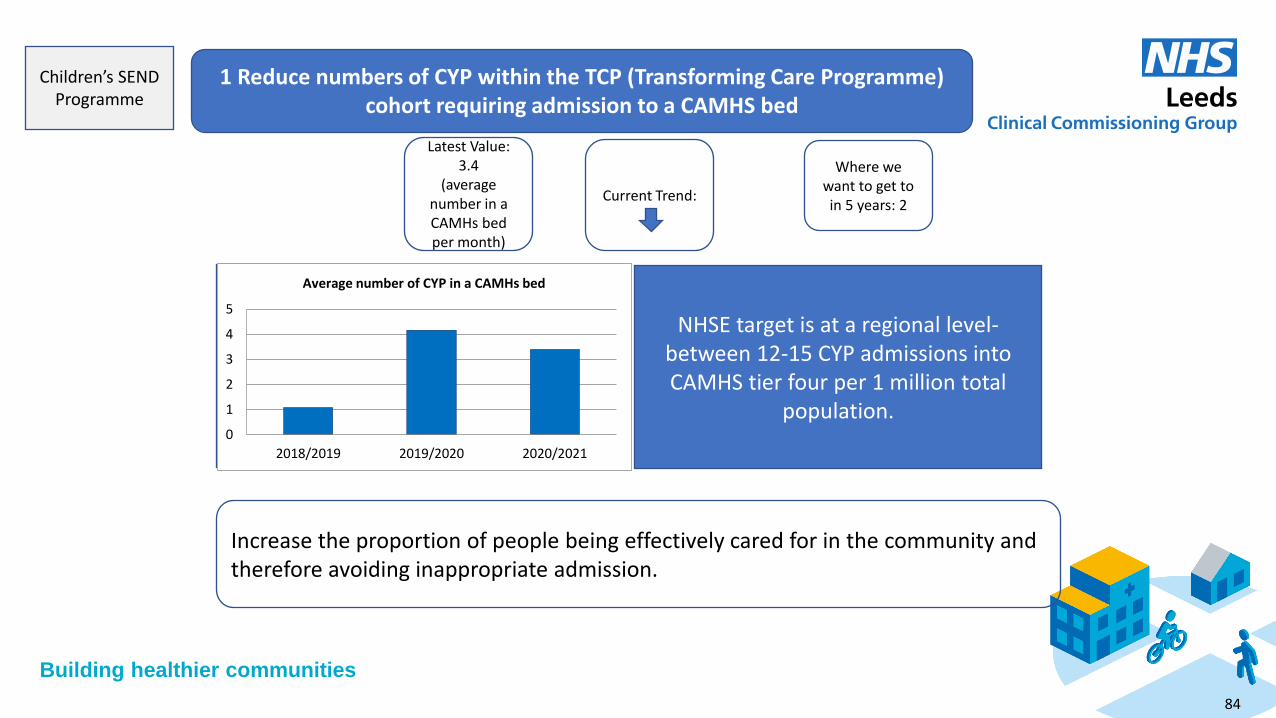
Building healthier communities
1 Reduce numbers of CYP within the TCP (Transforming Care Programme) cohort requiring admission to a CAMHS bed
Children’s SEND Programme
Current Trend:
Where we want to get to in 5 years: 2
NHSE target is at a regional level- between 12-15 CYP admissions into CAMHS tier four per 1 million total
population.
Increase the proportion of people being effectively cared for in the community and therefore avoiding inappropriate admission.
0
1
2
3
4
5
2018/2019 2019/2020 2020/2021
Average number of CYP in a CAMHs bed
Latest Value: 3.4
(average number in a CAMHs bed per month)
84
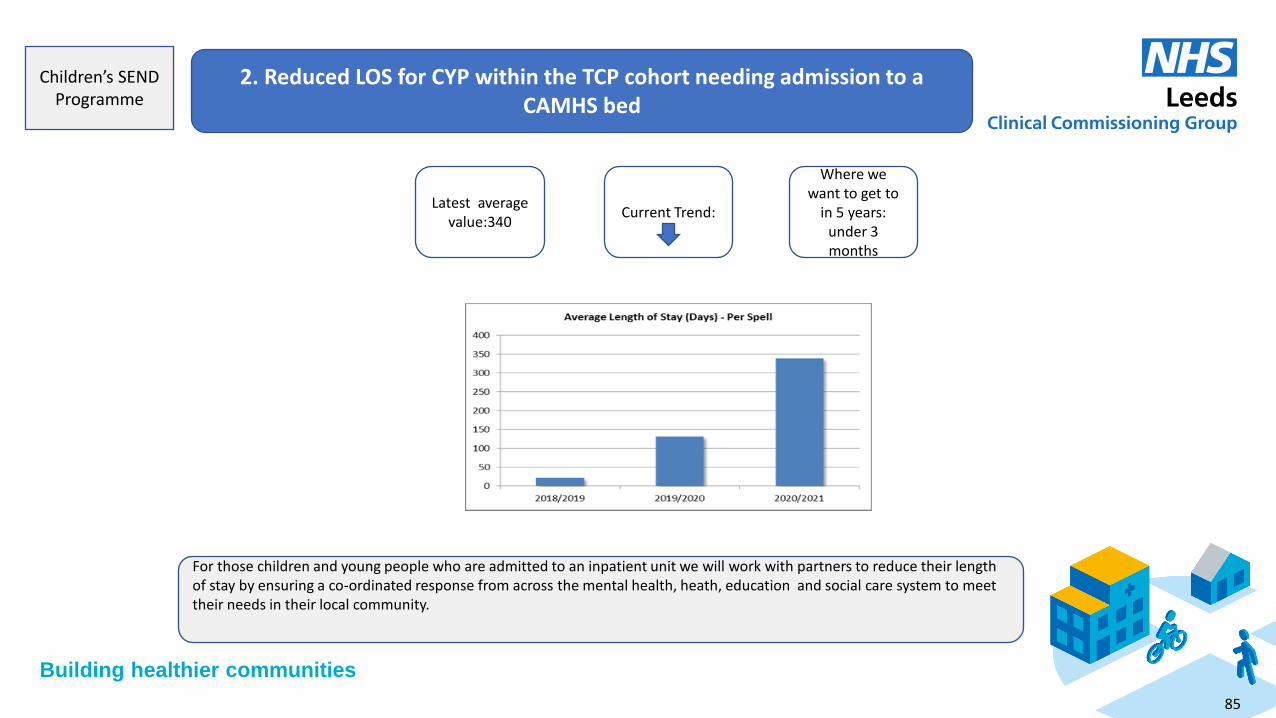
Building healthier communities
2. Reduced LOS for CYP within the TCP cohort needing admission to a
CAMHS bed
Children’s SEND Programme
Latest average value:340
Current Trend:
Where we want to get to
in 5 years: under 3 months
For those children and young people who are admitted to an inpatient unit we will work with partners to reduce their length of stay by ensuring a co-ordinated response from across the mental health, heath, education and social care system to meet their needs in their local community.
85
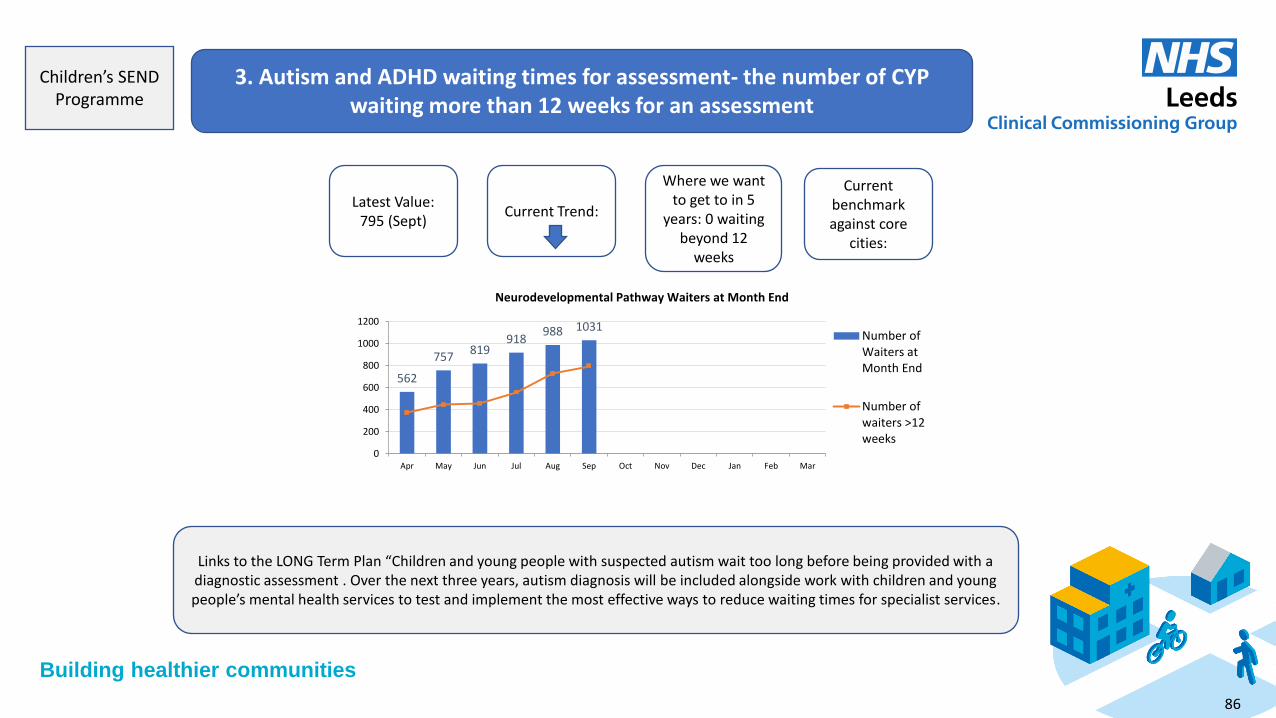
Building healthier communities
3. Autism and ADHD waiting times for assessment- the number of CYP
waiting more than 12 weeks for an assessment
Children’s SEND Programme
Latest Value: 795 (Sept)
Current Trend:
Where we want to get to in 5
years: 0 waiting beyond 12
weeks
Current benchmark against core
cities:
Links to the LONG Term Plan “Children and young people with suspected autism wait too long before being provided with a diagnostic assessment . Over the next three years, autism diagnosis will be included alongside work with children and young people’s mental health services to test and implement the most effective ways to reduce waiting times for specialist services.
562
757 819
918 988 1031
0
200
400
600
800
1000
1200
Apr May Jun Jul Aug Sep Oct Nov Dec Jan Feb Mar
Neurodevelopmental Pathway Waiters at Month End
Number ofWaiters atMonth End
Number ofwaiters >12weeks
86

Building healthier communities
1. Reduction in Unplanned Admissions for 0-17 Year olds
Children’s Long Term Conditions
Programme
Links to the NHS Long Term Plan ambition of ensuring that children and young people are able to access high quality services as close to home as possible.
Latest Value: 1018 Unplanned Admissions
to LTHT in February 2021 for under 18-year-olds
Current trend:
87
0
200
400
600
800
1000
1200
1400
1600
1800
2000
Non Elective Admissions - 0 to 17 Year Olds
Where we want to get to in 5 years: average 1,000 a
month
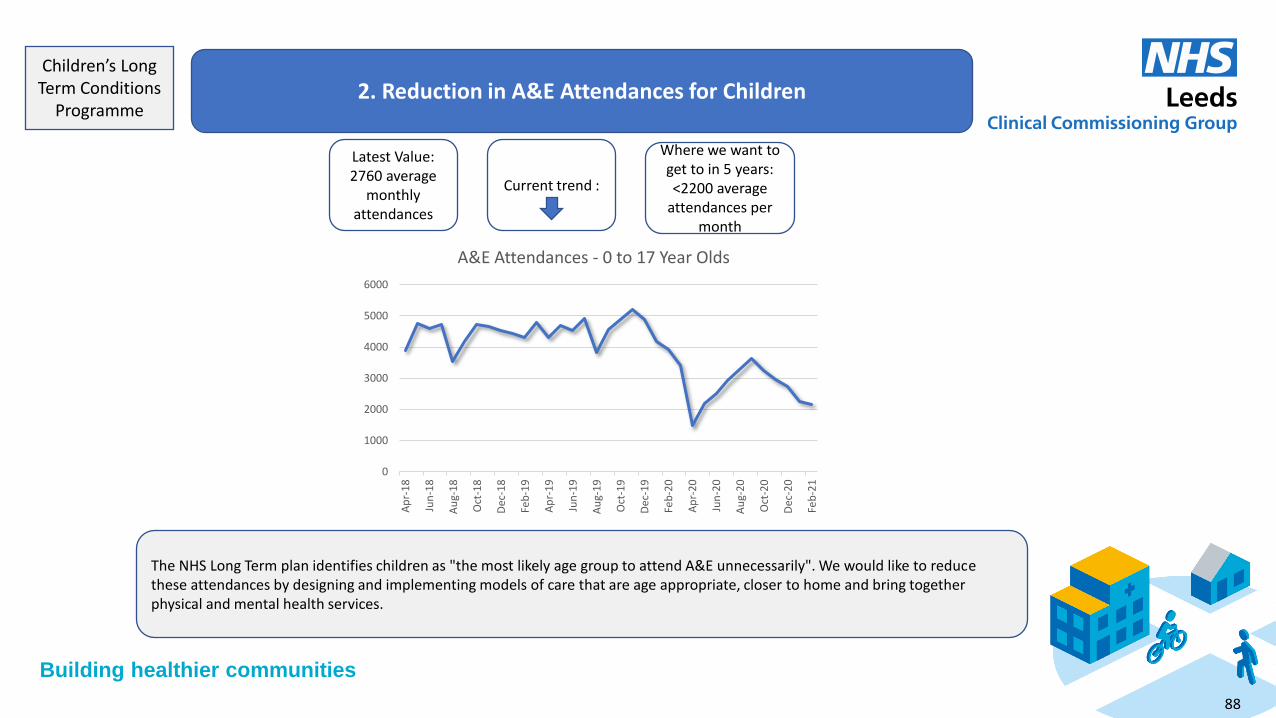
Building healthier communities
2. Reduction in A&E Attendances for Children
Children’s Long
Term Conditions Programme
Latest Value: 2760 average
monthly attendances
Current trend :
Where we want to get to in 5 years: <2200 average
attendances per month
The NHS Long Term plan identifies children as "the most likely age group to attend A&E unnecessarily". We would like to reduce these attendances by designing and implementing models of care that are age appropriate, closer to home and bring together physical and mental health services.
88
0
1000
2000
3000
4000
5000
6000
Ap
r-1
8
Jun
-18
Au
g-1
8
Oct
-18
Dec
-18
Feb
-19
Ap
r-1
9
Jun
-19
Au
g-1
9
Oct
-19
Dec
-19
Feb
-20
Ap
r-2
0
Jun
-20
Au
g-2
0
Oct
-20
Dec
-20
Feb
-21
A&E Attendances - 0 to 17 Year Olds

Building healthier communities
3. Reduce the number of face-to-face hospital-based children’s outpatients contacts (all types) with secondary care
This is important to demonstrate the move towards more children and families accessing care within their communities, and contributes to the left-shift. Workshops have identified a potential over-reliance on secondary care for conditions that could be managed in primary care, and through peer support, such as fever, asthma and constipation.
1st, follow-up and Total Outpatient Attendances - All Specialities Age 0 to 17
Children’s Long
Term Conditions Programme
89
0
2000
4000
6000
8000
10000
12000
14000
160000 to 17 All Specialties 1st Outpatient 0 to 17 All Specialties Follow Up Outpatient Total
Latest Value: 8,350 December 2020
Current trend:
Where we want to get to in 5 years:
average 7,000 per month
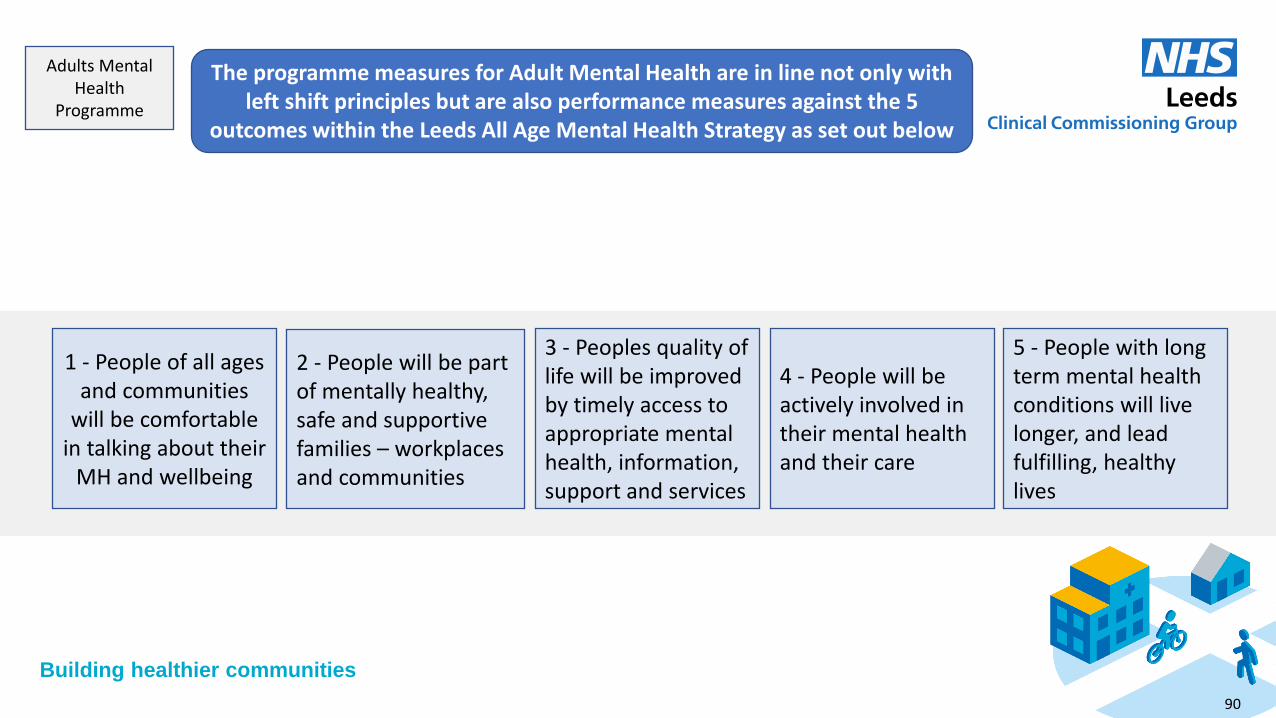
Building healthier communities
The programme measures for Adult Mental Health are in line not only with left shift principles but are also performance measures against the 5
outcomes within the Leeds All Age Mental Health Strategy as set out below
Adults Mental
Health Programme
1 - People of all ages
and communities will be comfortable
in talking about their MH and wellbeing
2 - People will be part of mentally healthy, safe and supportive families – workplaces and communities
3 - Peoples quality of life will be improved by timely access to appropriate mental health, information, support and services
4 - People will be actively involved in their mental health and their care
5 - People with long term mental health conditions will live longer, and lead fulfilling, healthy lives
90
Building healthier communities
1 - Increase the proportion of people in Leeds who feel comfortable talking about their mental health and wellbeing.
Adults Mental
Health Programme
To support understanding of our performance against the five outcomes within the All Age Mental Health Strategy an annual survey of our population will be
undertaken. The first survey is anticipated for October. Using this tool we should then be able to measure trends year on year.
This measure is important as one of the principles of the Left Shift is focusing on prevention and an element of this is
supporting people to be comfortable in talking about their mental health and wellbeing. It also aligns with the first outcome of the mental health strategy ‘people of all ages and communities will be comfortable in talking about their MH and
wellbeing’. .
91
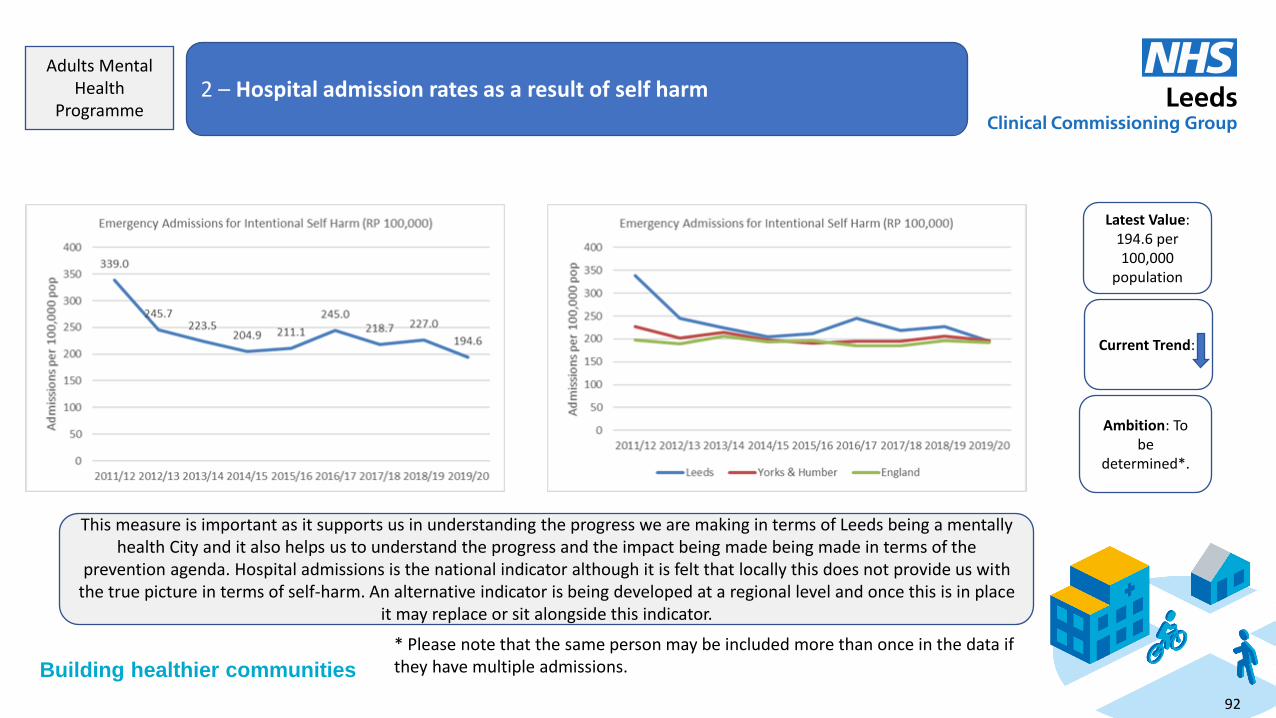
Building healthier communities
2 – Hospital admission rates as a result of self harm
Adults Mental
Health Programme
This measure is important as it supports us in understanding the progress we are making in terms of Leeds being a mentally health City and it also helps us to understand the progress and the impact being made being made in terms of the
prevention agenda. Hospital admissions is the national indicator although it is felt that locally this does not provide us with the true picture in terms of self-harm. An alternative indicator is being developed at a regional level and once this is in place
it may replace or sit alongside this indicator.
Latest Value: 194.6 per 100,000
population
Current Trend:
Ambition: To be
determined*.
92
* Please note that the same person may be included more than once in the data if they have multiple admissions.
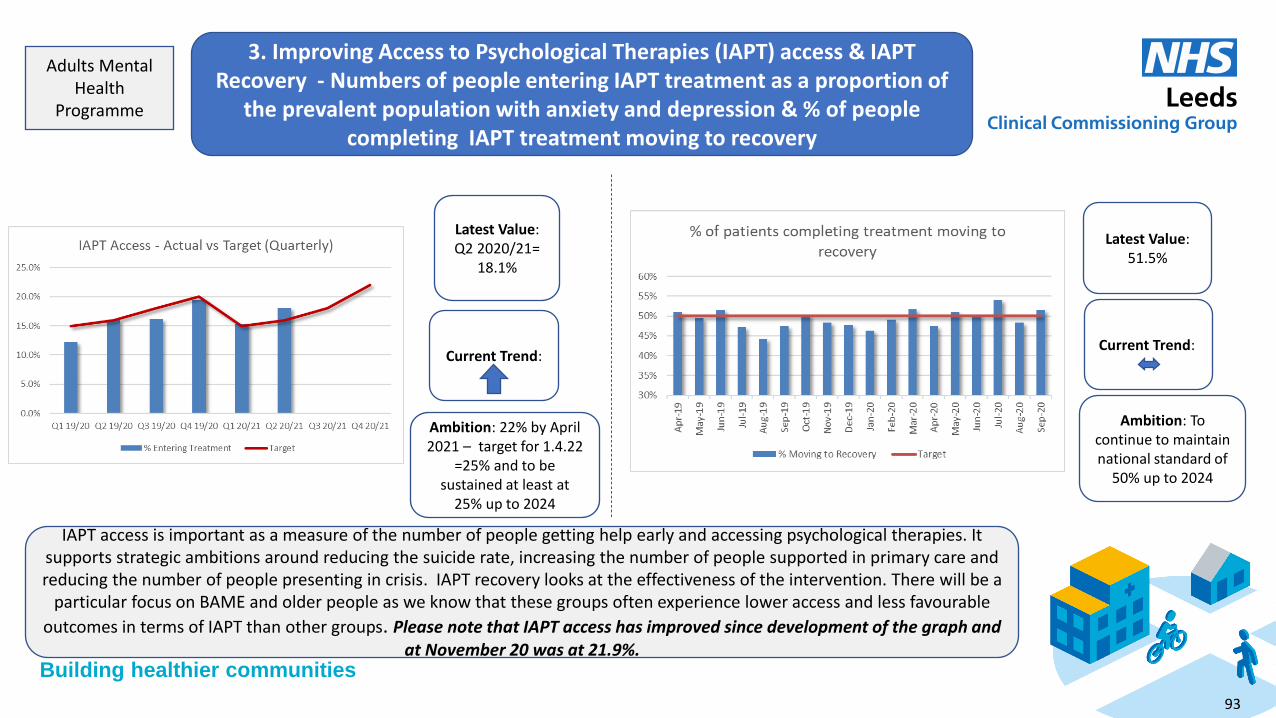
Building healthier communities
3. Improving Access to Psychological Therapies (IAPT) access & IAPT Recovery - Numbers of people entering IAPT treatment as a proportion of
the prevalent population with anxiety and depression & % of people completing IAPT treatment moving to recovery
.
Adults Mental
Health Programme
Latest Value: Q2 2020/21=
18.1%
Current Trend:
Ambition: 22% by April 2021 – target for 1.4.22
=25% and to be sustained at least at
25% up to 2024
IAPT access is important as a measure of the number of people getting help early and accessing psychological therapies. It supports strategic ambitions around reducing the suicide rate, increasing the number of people supported in primary care and reducing the number of people presenting in crisis. IAPT recovery looks at the effectiveness of the intervention. There will be a
particular focus on BAME and older people as we know that these groups often experience lower access and less favourable
outcomes in terms of IAPT than other groups. Please note that IAPT access has improved since development of the graph and at November 20 was at 21.9%.
Latest Value: 51.5%
Current Trend:
Ambition: To continue to maintain national standard of
50% up to 2024
93
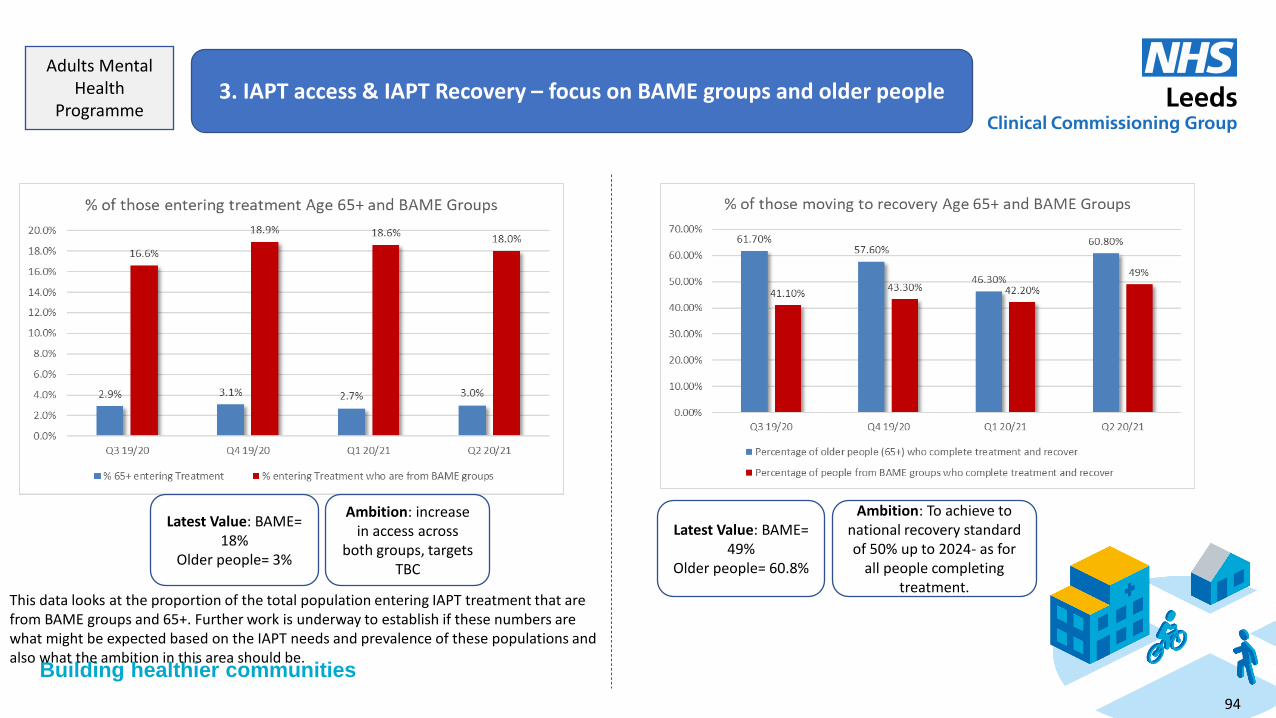
Building healthier communities
3. IAPT access & IAPT Recovery – focus on BAME groups and older people
Adults Mental
Health Programme
Latest Value: BAME= 18%
Older people= 3%
Ambition: increase in access across
both groups, targets TBC
Latest Value: BAME= 49%
Older people= 60.8%
Ambition: To achieve to national recovery standard of 50% up to 2024- as for
all people completing treatment.
This data looks at the proportion of the total population entering IAPT treatment that are from BAME groups and 65+. Further work is underway to establish if these numbers are what might be expected based on the IAPT needs and prevalence of these populations and also what the ambition in this area should be.
94

Building healthier communities
4. To reduce over representation of BAME groups detained on admission to the same levels as White British
Adults Mental
Health Programme
Local intelligence has identified that people from minority ethnic groups are more at risk of being detained on admission. Reducing this risk has been identified as a key priority in the Leeds Mental Health Strategy and supports strategic ambitions on tackling health inequalities. Based on most recently available data, this increased risk is x 3 for people from a Black ethnic
background as highlighted in the above table/graph. This requires a specific focus within the broader target.
Jan 18 to Dec 19 % RP 1000 Pop Risk Ratio
White British 538 61.77% 0.8 1
All others (Excl Not Known and Not Stated) 333 38.23% 1.2 1.5
Total Known 871 100.00% 0.9 1.125
0
Caribbean, African and Any other Black background 122 14.0% 2.7 3.375
Mixed 30 3.4% 1.4 1.75
Asian 90 10.3% 1.3 1.625
Detained on Admission
Rate of admission per 1,000 population by top level ethnic group
Current Trend:
Ambition: To reduce over representation of BAME groups detained
on admission to the same levels as White
British
Latest Value:
White British 0.8/1,000 BAME 1.2/1,000
95
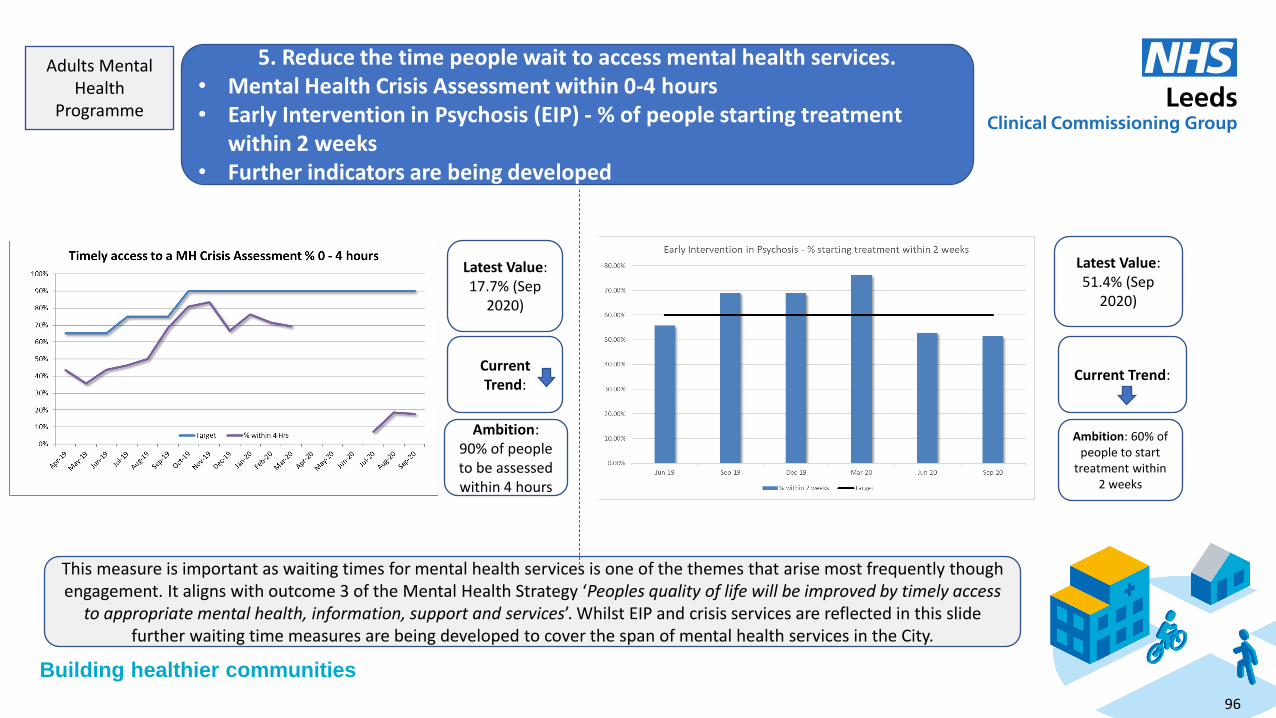
Building healthier communities
5. Reduce the time people wait to access mental health services. • Mental Health Crisis Assessment within 0-4 hours • Early Intervention in Psychosis (EIP) - % of people starting treatment
within 2 weeks • Further indicators are being developed
Adults Mental
Health Programme
This measure is important as waiting times for mental health services is one of the themes that arise most frequently though engagement. It aligns with outcome 3 of the Mental Health Strategy ‘Peoples quality of life will be improved by timely access
to appropriate mental health, information, support and services’. Whilst EIP and crisis services are reflected in this slide further waiting time measures are being developed to cover the span of mental health services in the City.
Latest Value: 17.7% (Sep
2020)
Current Trend:
Ambition: 90% of people to be assessed within 4 hours
Latest Value: 51.4% (Sep
2020)
Current Trend:
Ambition: 60% of people to start
treatment within 2 weeks
96
Building healthier communities
6. Measure of effectiveness community care
Adults Mental
Health Programme
This measure aligns well with the left shift principle ’investing more resources in prevention and personalised proactive care – often (but not always) resulting in more activity and care taking place in community settings’. There is a significant
Community Mental Health Transformation initiative underway which is one of the programmes priorities so it also aligns with this.
The exact nature if this measure is in development. It could potentially align
with the forthcoming measure of community mental health care that is being developed with the 21 / 22 NHS operational planning guidance.
97
Building healthier communities
7. Length of Stay on working age adult acute inpatient wards – ambition to be determined but likely to be in line with the forthcoming national indicator
of 36 days.
Adults Mental
Health Programme
This indicator aligns with outcome 3 of the All Age Mental Health Strategy – ensuring timely access to mental health acute services when needed but once somebody is ready to be discharged having the infrastructure in the community to support them in doing that. In this way this indicator is a system wide one focusing on how a range of services work in an integrated
way to support discharge. It also links strongly with the principle of care in the least restrictive environment.
The data for this measure requires further scoping and is in development.
98
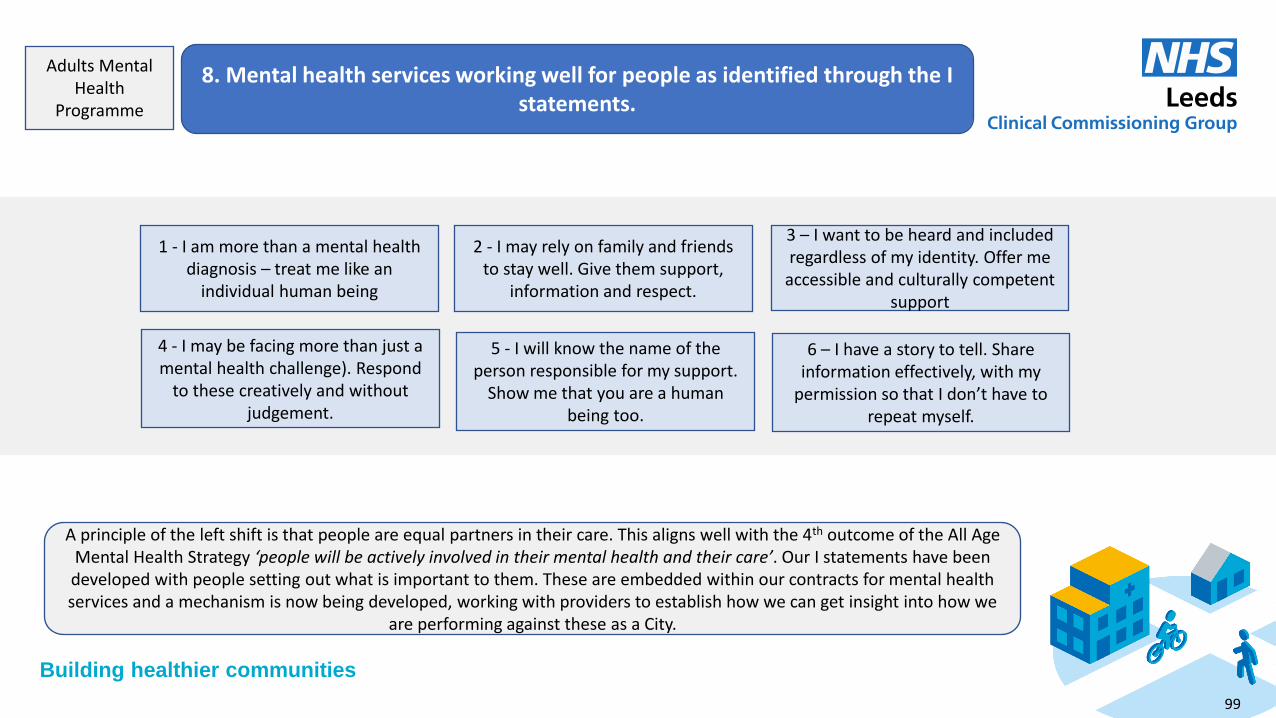
Building healthier communities
8. Mental health services working well for people as identified through the I statements.
Adults Mental
Health Programme
A principle of the left shift is that people are equal partners in their care. This aligns well with the 4th outcome of the All Age
Mental Health Strategy ‘people will be actively involved in their mental health and their care’. Our I statements have been developed with people setting out what is important to them. These are embedded within our contracts for mental health services and a mechanism is now being developed, working with providers to establish how we can get insight into how we
are performing against these as a City.
1 - I am more than a mental health diagnosis – treat me like an
individual human being
2 - I may rely on family and friends to stay well. Give them support,
information and respect.
3 – I want to be heard and included regardless of my identity. Offer me
accessible and culturally competent support
4 - I may be facing more than just a mental health challenge). Respond
to these creatively and without judgement.
5 - I will know the name of the person responsible for my support.
Show me that you are a human being too.
6 – I have a story to tell. Share information effectively, with my
permission so that I don’t have to repeat myself.
99
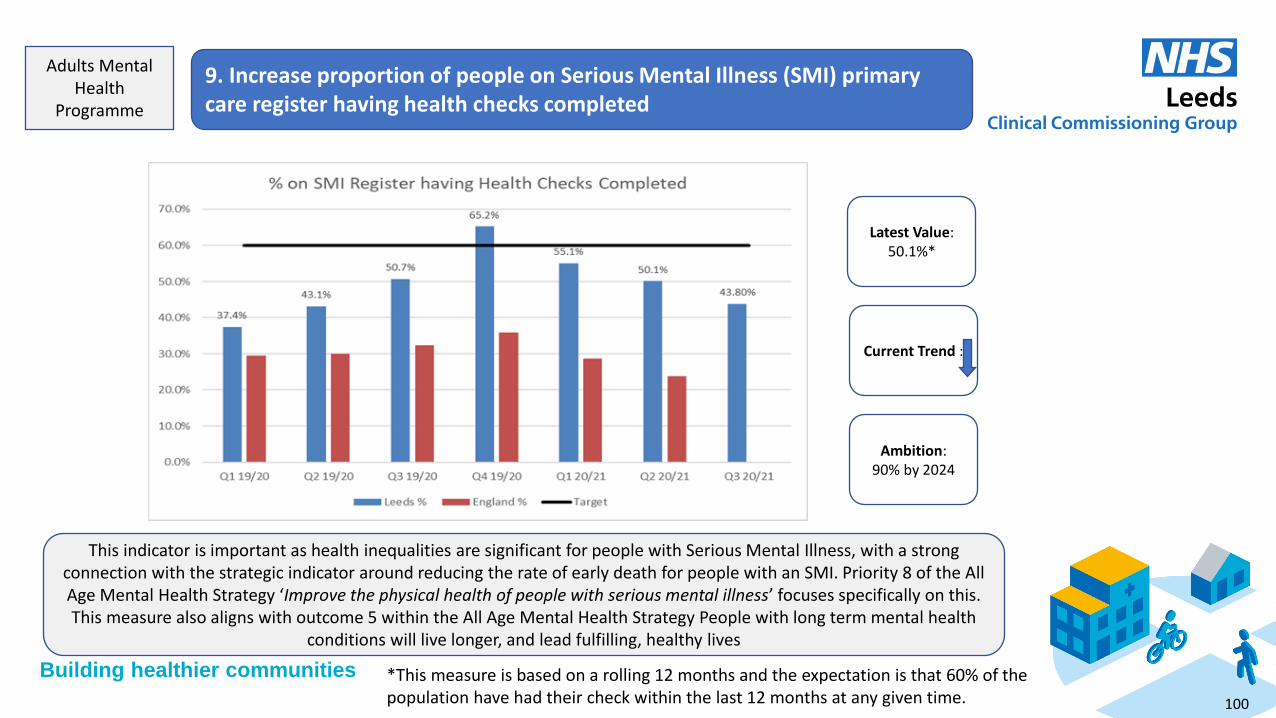
Building healthier communities
9. Increase proportion of people on Serious Mental Illness (SMI) primary care register having health checks completed
Adults Mental
Health Programme
Latest Value: 50.1%*
Current Trend :
Ambition: 90% by 2024
This indicator is important as health inequalities are significant for people with Serious Mental Illness, with a strong connection with the strategic indicator around reducing the rate of early death for people with an SMI. Priority 8 of the All Age Mental Health Strategy ‘Improve the physical health of people with serious mental illness’ focuses specifically on this. This measure also aligns with outcome 5 within the All Age Mental Health Strategy People with long term mental health
conditions will live longer, and lead fulfilling, healthy lives
100
*This measure is based on a rolling 12 months and the expectation is that 60% of the population have had their check within the last 12 months at any given time.

Building healthier communities
1. Increase the proportion of people with a learning disability receiving an annual health check
Learning
Disabilities and Autism
Programme
Baseline 2019/20 71%*
Current Trend :
Ambition Achieve 75% by 2024/25
This indicator is important as people who have a learning disability are at higher risk of poorer physical and mental health outcomes. This supports strategic ambitions on reducing health inequalities. Covid had a negative impact upon the ability of GP practices to achieve pre covid results as a physical examination is required as part of the health check and many of the client group were shielding during Q1. GP practices have been provided information to support the implementation of health check going forward. NHSE expectation is to achieve Annual Health Checks for 75% of the eligible population by 2023/24.
101
* Please note the LD target is to do a set number of health checks in the year and a target has been set each quarter has been set each quarter to do that. Q3 data is un validated but it is believed that at the end of Q3 20/21 72.2% of the checks required to meet our target had been undertaken.
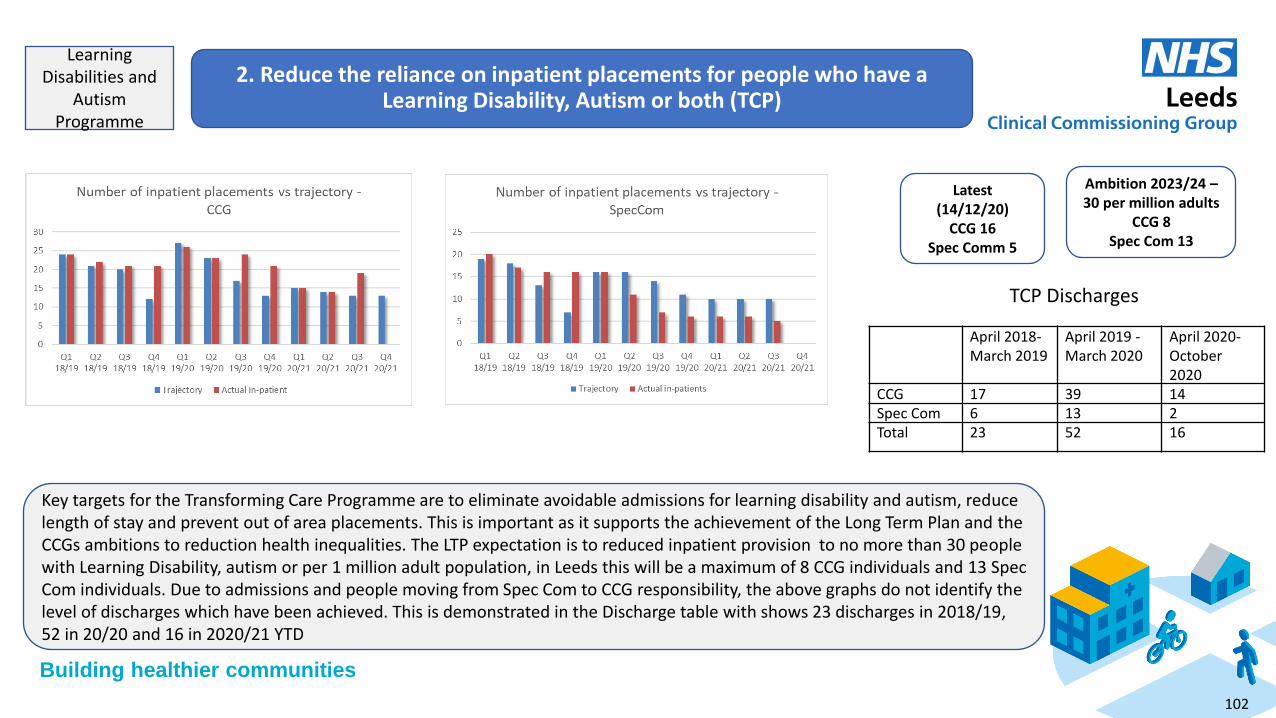
Building healthier communities
2. Reduce the reliance on inpatient placements for people who have a Learning Disability, Autism or both (TCP)
Learning
Disabilities and Autism
Programme
April 2018-March 2019
April 2019 - March 2020
April 2020- October 2020
CCG 17 39 14 Spec Com 6 13 2 Total 23 52 16
TCP Discharges
Latest (14/12/20)
CCG 16 Spec Comm 5
Ambition 2023/24 – 30 per million adults
CCG 8 Spec Com 13
Key targets for the Transforming Care Programme are to eliminate avoidable admissions for learning disability and autism, reduce length of stay and prevent out of area placements. This is important as it supports the achievement of the Long Term Plan and the CCGs ambitions to reduction health inequalities. The LTP expectation is to reduced inpatient provision to no more than 30 people with Learning Disability, autism or per 1 million adult population, in Leeds this will be a maximum of 8 CCG individuals and 13 Spec Com individuals. Due to admissions and people moving from Spec Com to CCG responsibility, the above graphs do not identify the level of discharges which have been achieved. This is demonstrated in the Discharge table with shows 23 discharges in 2018/19, 52 in 20/20 and 16 in 2020/21 YTD
102

Building healthier communities
1. Primary Prevention: Increase the proportion of people identified at risk of developing a long-term condition who have been offered via a shared
decision making discussion management of modifiable risk factors (including behaviour change and lifestyle management)
Long Term Conditions Programme
The identification of patients at risk of developing a LTC is essential to allow the offer/uptake of education/an intervention to avoid/delay the development of a LTC.
Latest Value: 1001 Checks
Current Trend
Where we want to get to in 5 years:
50% of those eligible to have a check
Latest Value: 99 accepted
Current Trend :
Where we want to get to in 5 years: Minimum of 40% of people at risk of
diabetes per annum referred
The above two indicators demonstrate the identification of people at risk of developing a LTC via the NHS Health Check programme, and onward referral into one example lifestyle programme (NDPP) to support the modification of risk factors. Additional indicators require development within the programme for tracking referrals into other Healthy Living services within the city and a measure for outcomes achieved; i.e. completion of programmes once referred. 103
NHS Health Check indicator also under development with a 60% uptake target for target groups most likely to benefit e.g. (BAME, smoker, deprived Leeds)
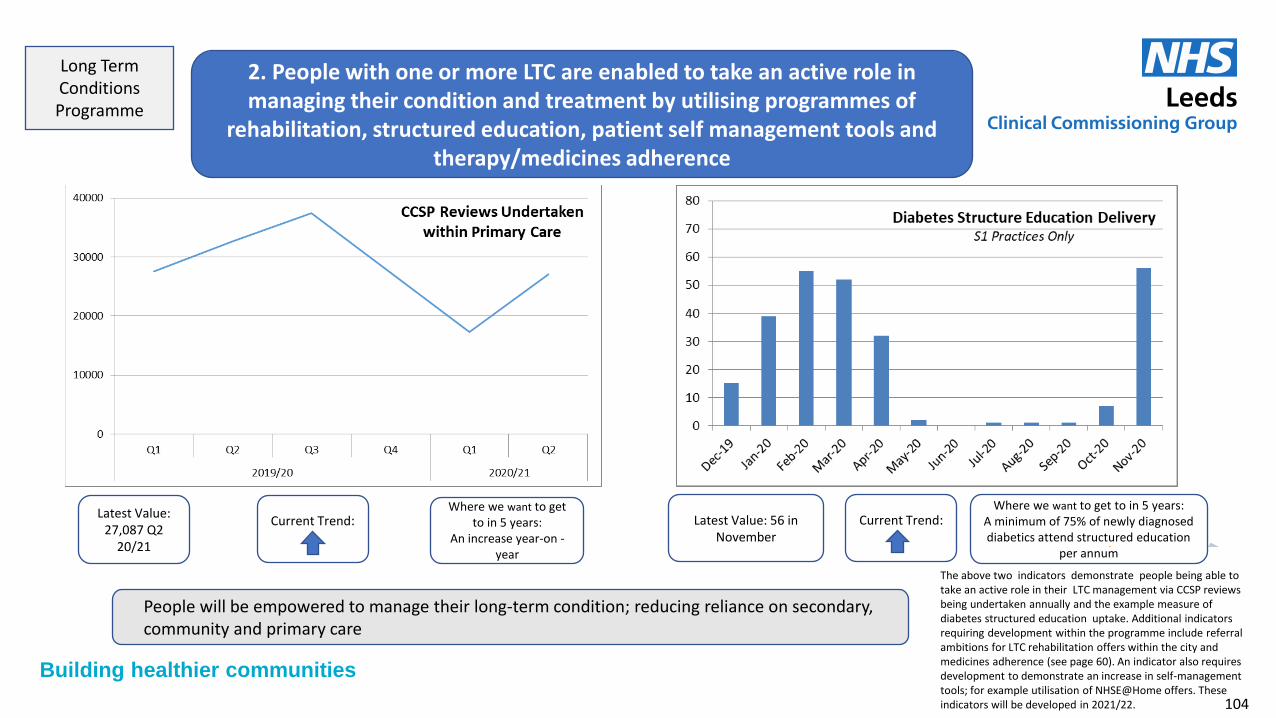
Building healthier communities
2. People with one or more LTC are enabled to take an active role in managing their condition and treatment by utilising programmes of
rehabilitation, structured education, patient self management tools and therapy/medicines adherence
Long Term Conditions Programme
The above two indicators demonstrate people being able to take an active role in their LTC management via CCSP reviews being undertaken annually and the example measure of diabetes structured education uptake. Additional indicators requiring development within the programme include referral ambitions for LTC rehabilitation offers within the city and medicines adherence (see page 60). An indicator also requires development to demonstrate an increase in self-management tools; for example utilisation of NHSE@Home offers. These indicators will be developed in 2021/22.
People will be empowered to manage their long-term condition; reducing reliance on secondary, community and primary care
Latest Value: 27,087 Q2
20/21
Current Trend:
Where we want to get to in 5 years:
An increase year-on -year
Latest Value: 56 in November
Current Trend:
Where we want to get to in 5 years: A minimum of 75% of newly diagnosed diabetics attend structured education
per annum
104
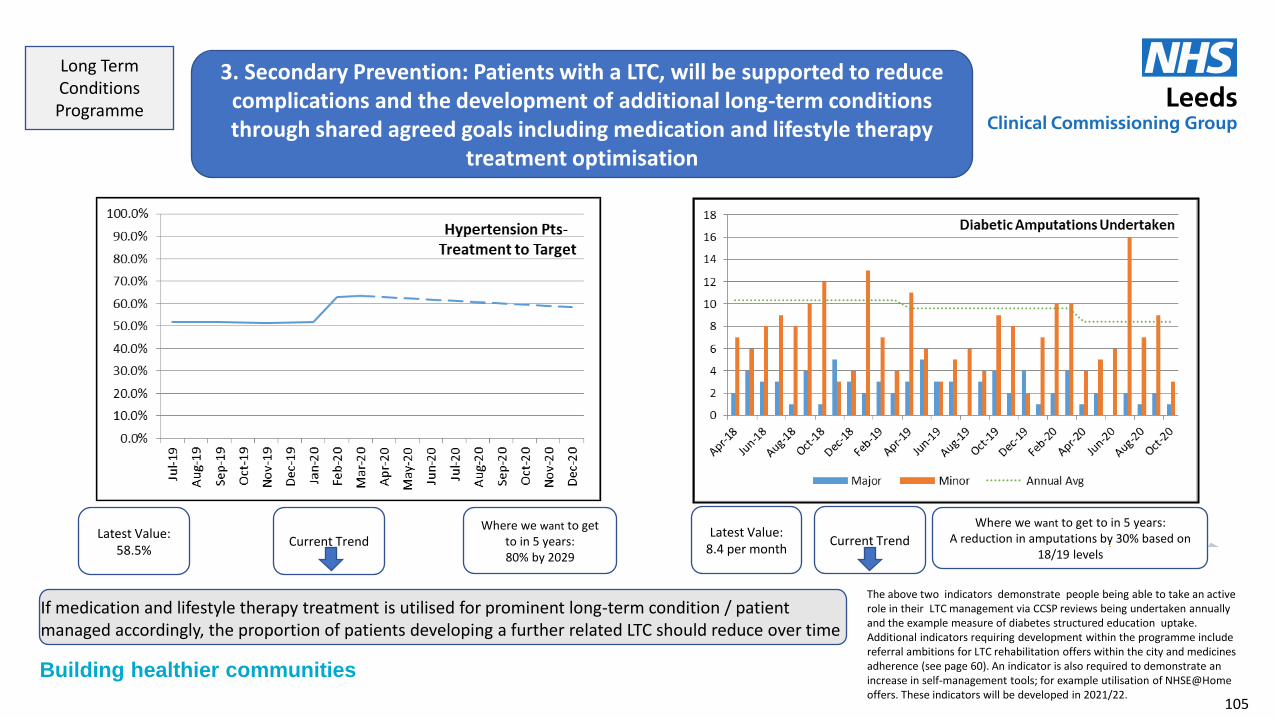
Building healthier communities
3. Secondary Prevention: Patients with a LTC, will be supported to reduce complications and the development of additional long-term conditions through shared agreed goals including medication and lifestyle therapy
treatment optimisation
Long Term Conditions Programme
If medication and lifestyle therapy treatment is utilised for prominent long-term condition / patient managed accordingly, the proportion of patients developing a further related LTC should reduce over time
Latest Value: 58.5%
Current Trend Where we want to get
to in 5 years: 80% by 2029
Latest Value: 8.4 per month
Current Trend
Where we want to get to in 5 years: A reduction in amputations by 30% based on
18/19 levels
105
The above two indicators demonstrate people being able to take an active role in their LTC management via CCSP reviews being undertaken annually and the example measure of diabetes structured education uptake. Additional indicators requiring development within the programme include referral ambitions for LTC rehabilitation offers within the city and medicines adherence (see page 60). An indicator is also required to demonstrate an increase in self-management tools; for example utilisation of NHSE@Home offers. These indicators will be developed in 2021/22.

Building healthier communities
4. Reduce the rate of growth in avoidable non-elective bed days and A&E attendances for patients with a primary diagnosis of a Long Term Condition
reducing disruption to peoples lives
Long Term Conditions Programme
Reducing the number of non-elective bed days and A&E attendances will reduce patient harm, disability and unwarranted cost
Latest Value: 2074 per
month Current Trend
Where we want to get to in 5 years:
Ambition not yet agreed
Latest Value: 3274 bed days across
402 spells (8.1 per spell)
Current Trend
Where we want to get to in 5 years:
Ambition not yet agreed
106
Ambition targets to be agreed in 2021/22 as we reset /and continually assess the impacts of Covid-19. Our strategy for alternative solutions including virtual wards, digital, Same Day Response and diagnostic hubs will inform our rate of ambition.
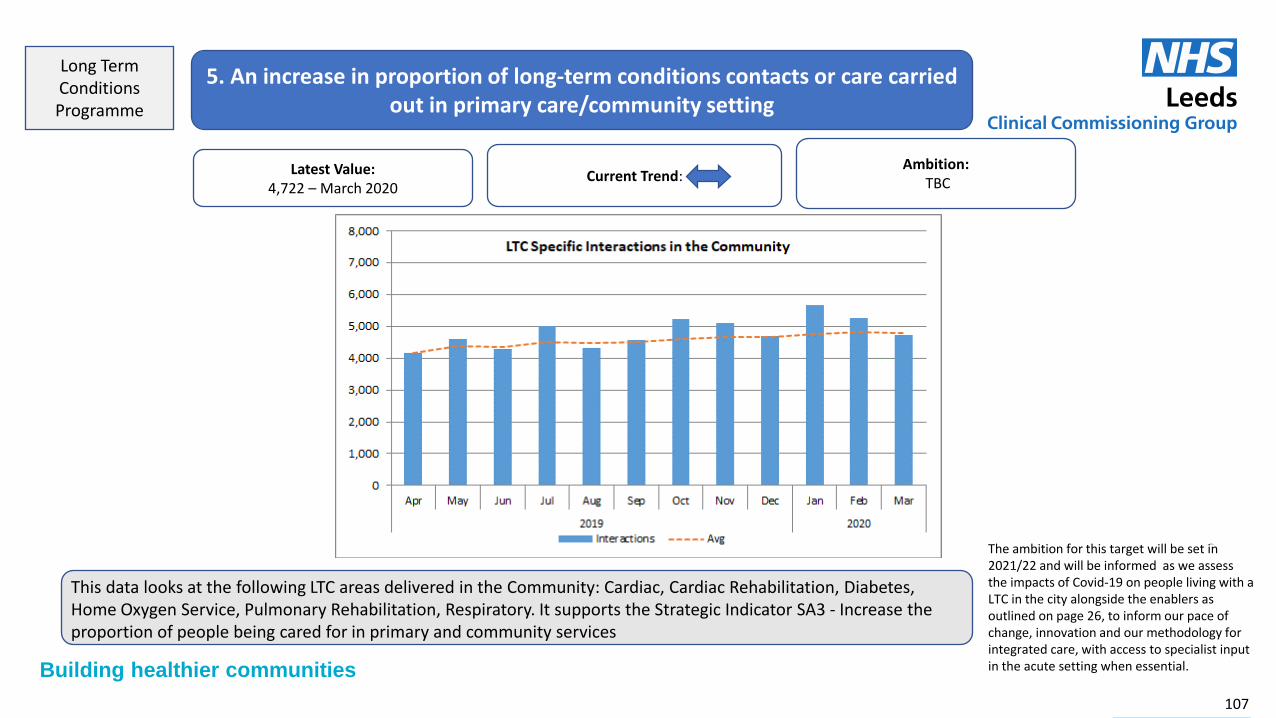
Building healthier communities
5. An increase in proportion of long-term conditions contacts or care carried out in primary care/community setting
Long Term Conditions Programme
This data looks at the following LTC areas delivered in the Community: Cardiac, Cardiac Rehabilitation, Diabetes, Home Oxygen Service, Pulmonary Rehabilitation, Respiratory. It supports the Strategic Indicator SA3 - Increase the proportion of people being cared for in primary and community services
107
Latest Value: 4,722 – March 2020
Current Trend: Ambition:
TBC
The ambition for this target will be set in 2021/22 and will be informed as we assess the impacts of Covid-19 on people living with a LTC in the city alongside the enablers as outlined on page 26, to inform our pace of change, innovation and our methodology for integrated care, with access to specialist input in the acute setting when essential.
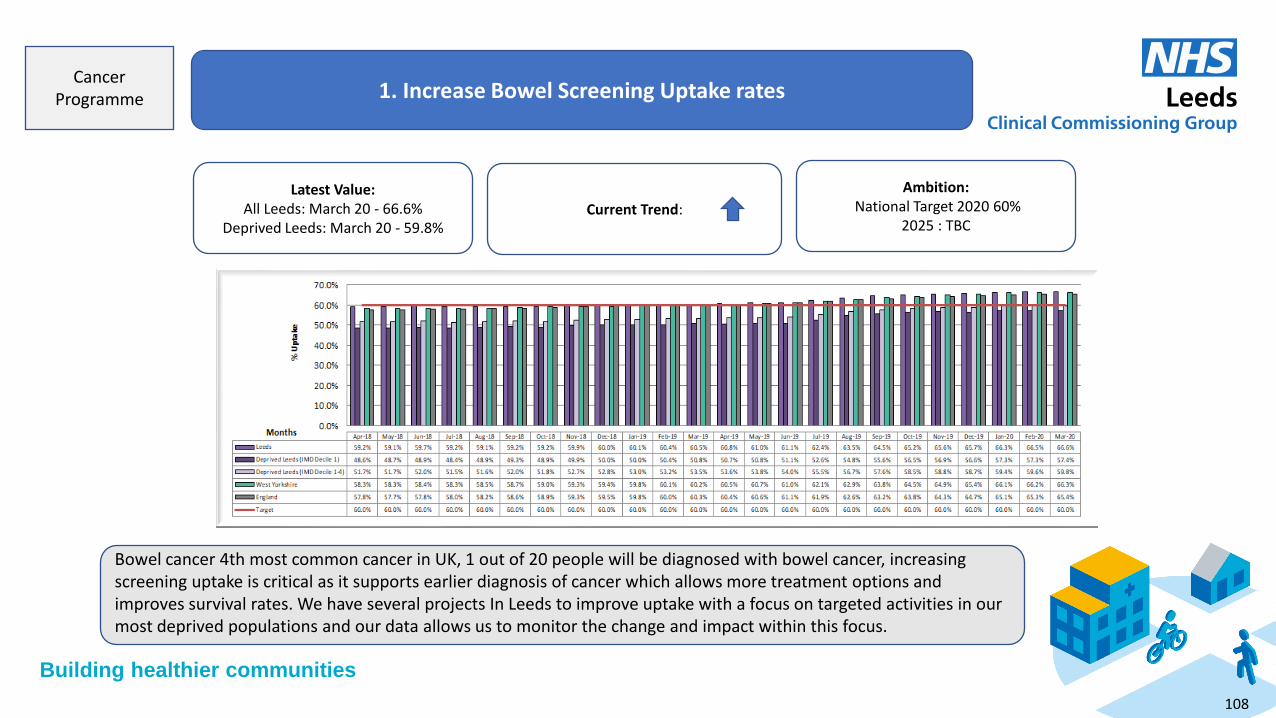
Building healthier communities
1. Increase Bowel Screening Uptake rates
Cancer
Programme
Bowel cancer 4th most common cancer in UK, 1 out of 20 people will be diagnosed with bowel cancer, increasing screening uptake is critical as it supports earlier diagnosis of cancer which allows more treatment options and improves survival rates. We have several projects In Leeds to improve uptake with a focus on targeted activities in our most deprived populations and our data allows us to monitor the change and impact within this focus.
Latest Value: All Leeds: March 20 - 66.6%
Deprived Leeds: March 20 - 59.8% Current Trend:
Ambition: National Target 2020 60%
2025 : TBC
108
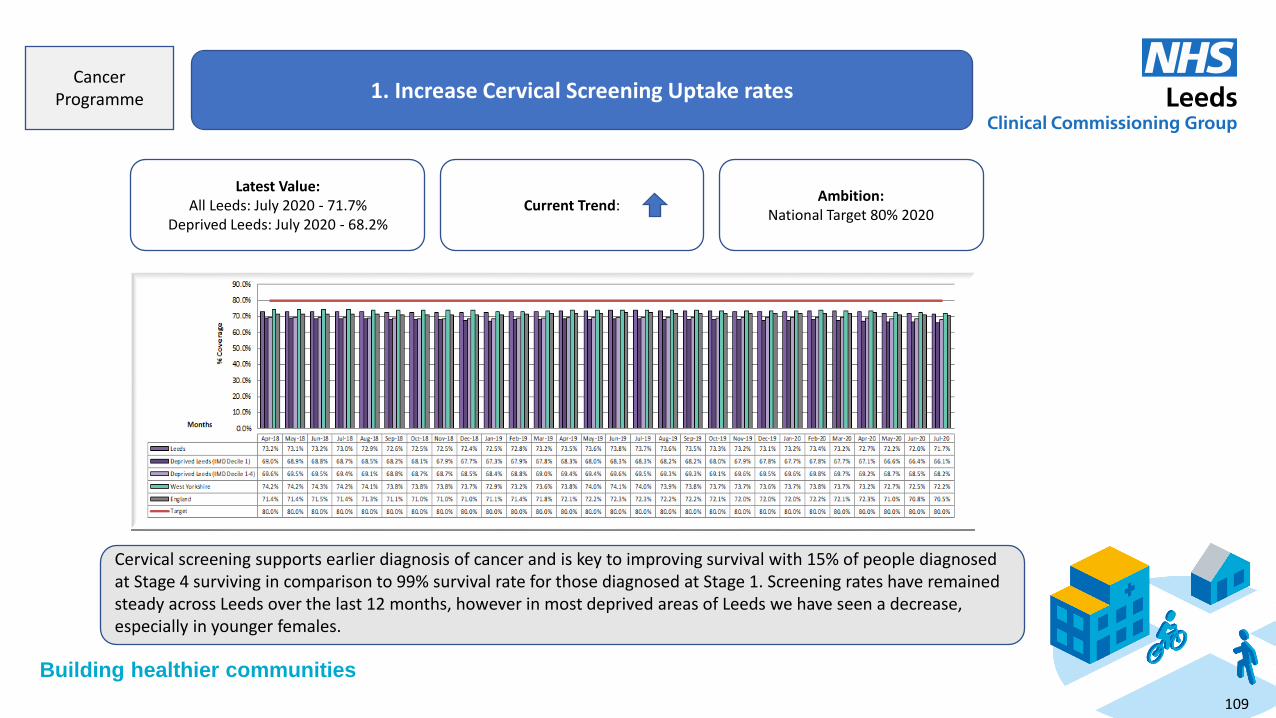
Building healthier communities
1. Increase Cervical Screening Uptake rates
Cancer
Programme
Cervical screening supports earlier diagnosis of cancer and is key to improving survival with 15% of people diagnosed at Stage 4 surviving in comparison to 99% survival rate for those diagnosed at Stage 1. Screening rates have remained steady across Leeds over the last 12 months, however in most deprived areas of Leeds we have seen a decrease, especially in younger females.
Latest Value: All Leeds: July 2020 - 71.7%
Deprived Leeds: July 2020 - 68.2% Current Trend:
Ambition: National Target 80% 2020
109
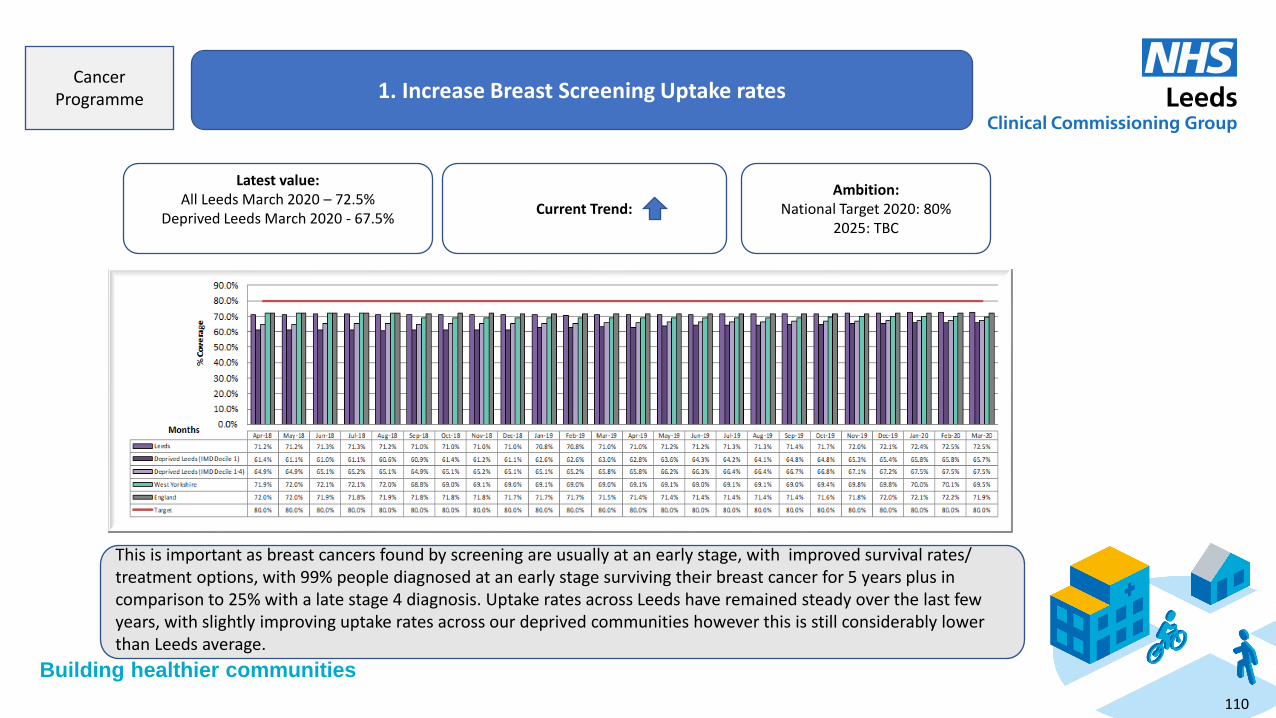
Building healthier communities
1. Increase Breast Screening Uptake rates
Cancer
Programme
This is important as breast cancers found by screening are usually at an early stage, with improved survival rates/ treatment options, with 99% people diagnosed at an early stage surviving their breast cancer for 5 years plus in comparison to 25% with a late stage 4 diagnosis. Uptake rates across Leeds have remained steady over the last few years, with slightly improving uptake rates across our deprived communities however this is still considerably lower than Leeds average.
Latest value: All Leeds March 2020 – 72.5%
Deprived Leeds March 2020 - 67.5%
Current Trend: Ambition:
National Target 2020: 80% 2025: TBC
110
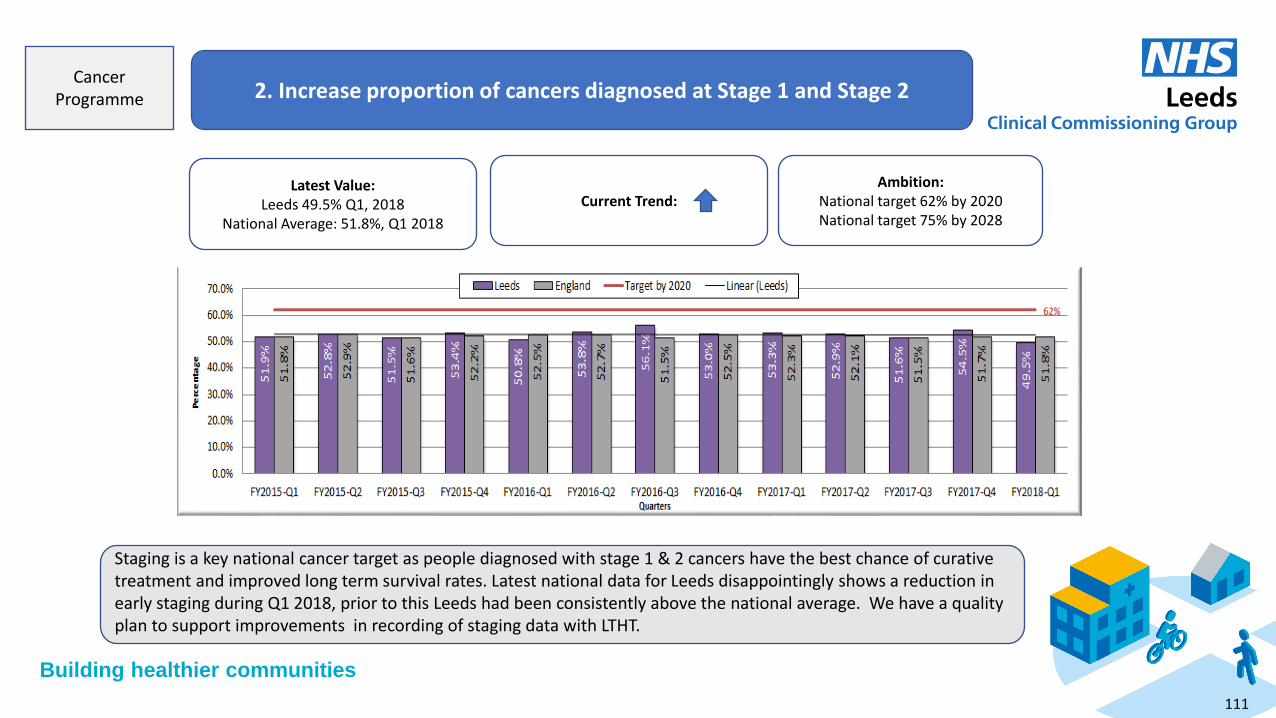
Building healthier communities
2. Increase proportion of cancers diagnosed at Stage 1 and Stage 2
Cancer
Programme
Staging is a key national cancer target as people diagnosed with stage 1 & 2 cancers have the best chance of curative treatment and improved long term survival rates. Latest national data for Leeds disappointingly shows a reduction in early staging during Q1 2018, prior to this Leeds had been consistently above the national average. We have a quality plan to support improvements in recording of staging data with LTHT.
Latest Value: Leeds 49.5% Q1, 2018
National Average: 51.8%, Q1 2018
Current Trend: Ambition:
National target 62% by 2020 National target 75% by 2028
111
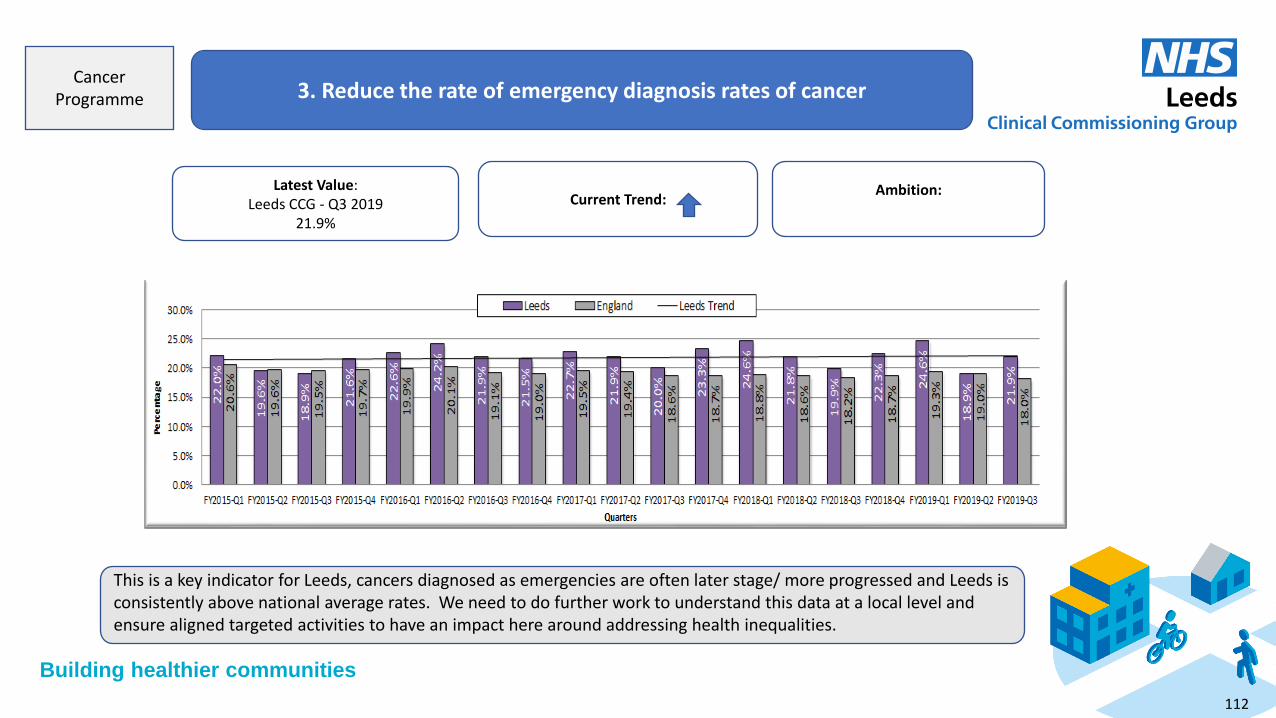
Building healthier communities
3. Reduce the rate of emergency diagnosis rates of cancer
Cancer
Programme
This is a key indicator for Leeds, cancers diagnosed as emergencies are often later stage/ more progressed and Leeds is consistently above national average rates. We need to do further work to understand this data at a local level and ensure aligned targeted activities to have an impact here around addressing health inequalities.
Latest Value: Leeds CCG - Q3 2019
21.9%
Current Trend: Ambition:
112
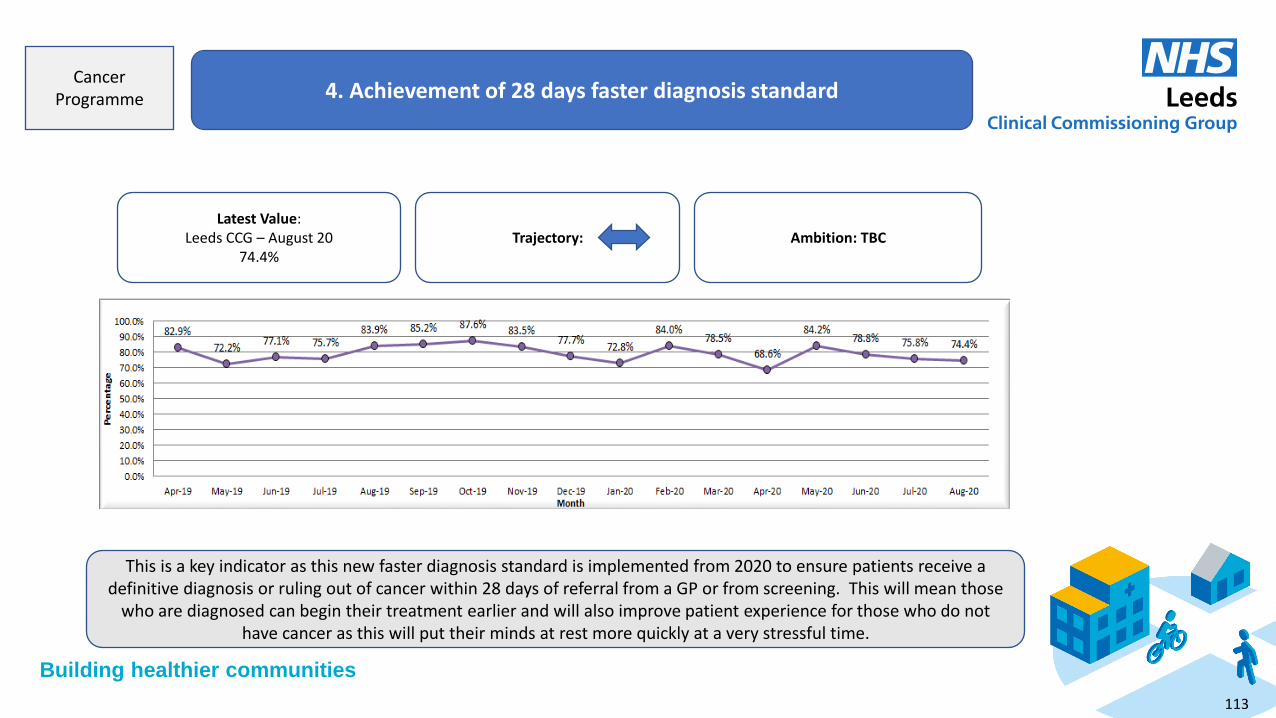
Building healthier communities
4. Achievement of 28 days faster diagnosis standard
Cancer
Programme
This is a key indicator as this new faster diagnosis standard is implemented from 2020 to ensure patients receive a definitive diagnosis or ruling out of cancer within 28 days of referral from a GP or from screening. This will mean those
who are diagnosed can begin their treatment earlier and will also improve patient experience for those who do not have cancer as this will put their minds at rest more quickly at a very stressful time.
Latest Value: Leeds CCG – August 20
74.4% Trajectory: Ambition: TBC
113

Building healthier communities
5. To improve 1 year survival rates of cancer
Cancer
Programme
We would expect to see steady improvement in survival data as we implement a range of actions to drive earlier staging. We will focus on 1 year survival data due to the time lag (2016 for 1 year survival and 2012 for 5 year survival
data) as a proxy indicator of improvement. We are also able to break this down by cancer type if required.
Latest Value: Leeds 2016 - 73.3%
Trajectory: Ambition: TBC
64
.4%
64
.9%
65
.6%
66
.4%
67
.0%
67
.4%
68
.2%
68
.8%
69
.3%
70
.0%
70
.5%
71
.1%
71
.7%
72
.3%
72
.7%
73
.3%
63
.8%
64
.5%
65
.2%
65
.7%
66
.4%
66
.8%
67
.5%
68
.1%
68
.6%
69
.1%
69
.8%
70
.4%
70
.9%
71
.5%
72
.0%
72
.6%
62
.0%
62
.8%
63
.6%
64
.4%
65
.2%
65
.9%
66
.6%
67
.3%
68
.0%
68
.7%
69
.4%
70
.2%
70
.9%
71
.5%
72
.2%
72
.8%
0.0%
10.0%
20.0%
30.0%
40.0%
50.0%
60.0%
70.0%
80.0%
2001 2002 2003 2004 2005 2006 2007 2008 2009 2010 2011 2012 2013 2014 2015 2016
Pe
rce
nta
ge
Years
Leeds West Yorkshire England
114
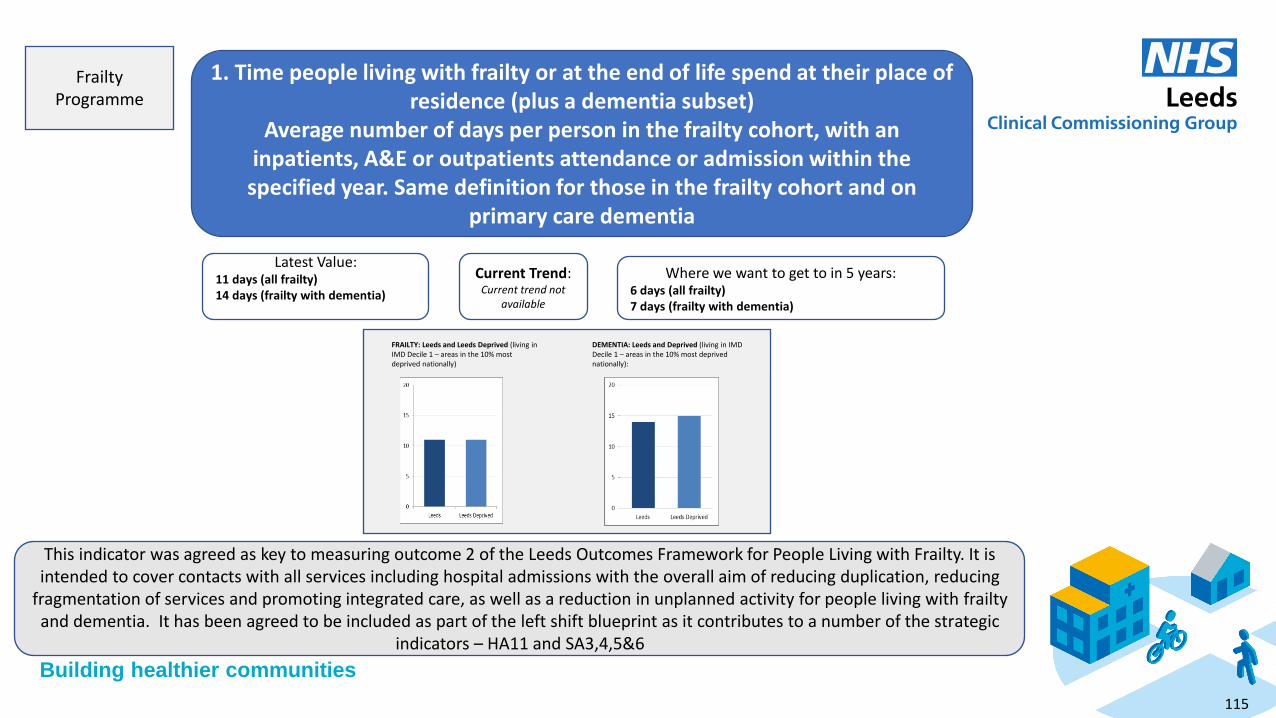
Building healthier communities
1. Time people living with frailty or at the end of life spend at their place of residence (plus a dementia subset)
Average number of days per person in the frailty cohort, with an inpatients, A&E or outpatients attendance or admission within the
specified year. Same definition for those in the frailty cohort and on primary care dementia
Frailty
Programme
This indicator was agreed as key to measuring outcome 2 of the Leeds Outcomes Framework for People Living with Frailty. It is intended to cover contacts with all services including hospital admissions with the overall aim of reducing duplication, reducing
fragmentation of services and promoting integrated care, as well as a reduction in unplanned activity for people living with frailty and dementia. It has been agreed to be included as part of the left shift blueprint as it contributes to a number of the strategic
indicators – HA11 and SA3,4,5&6
Latest Value: 11 days (all frailty) 14 days (frailty with dementia)
Current Trend: Current trend not
available
Where we want to get to in 5 years: 6 days (all frailty) 7 days (frailty with dementia)
FRAILTY: Leeds and Leeds Deprived (living in IMD Decile 1 – areas in the 10% most deprived nationally)
DEMENTIA: Leeds and Deprived (living in IMD Decile 1 – areas in the 10% most deprived nationally):
115

Building healthier communities
2. Number of serious falls per 100,000 population (plus a dementia subset) Emergency admissions for falls injuries in the frailty cohort recorded in Secondary Uses Service (SUS), age standardised per 100,000 Same definition for those in the frailty cohort and on primary care dementia register
Frailty
Programme
This indicator was agreed as key to measuring outcome 2 of the Leeds Outcomes Framework for People Living with Frailty. It is
intended as a benchmark for people living with frailty and dementia optimising their independence, being supported to manage their levels of frailty and as a key indicator to promote a reduction in emergency activity for people living with frailty and
dementia . It has been agreed to be included as part of the left shift blueprint as it contributes to a number of the strategic indicators – HA3 and SA4&5
Latest Value (DSR per 100,000): 2018-19
1,426 (all frailty) 1,635 (dementia only)
Current Trend :
Where we want to get to in 5 years: 15%
reduction on 2018-19 rates
Current benchmark against core cities:
Sheffield is best performing core city
at 30% less than Leeds
FRAILTY: Leeds and Leeds Deprived (living in IMD Decile 1 – areas in the 10% most deprived nationally): 1,387 DSR per 100,000
DEMENTIA: Leeds and Leeds Deprived (living in IMD Decile 1 – areas in the 10% most deprived nationally): 1,240 DSR per 100,000
116
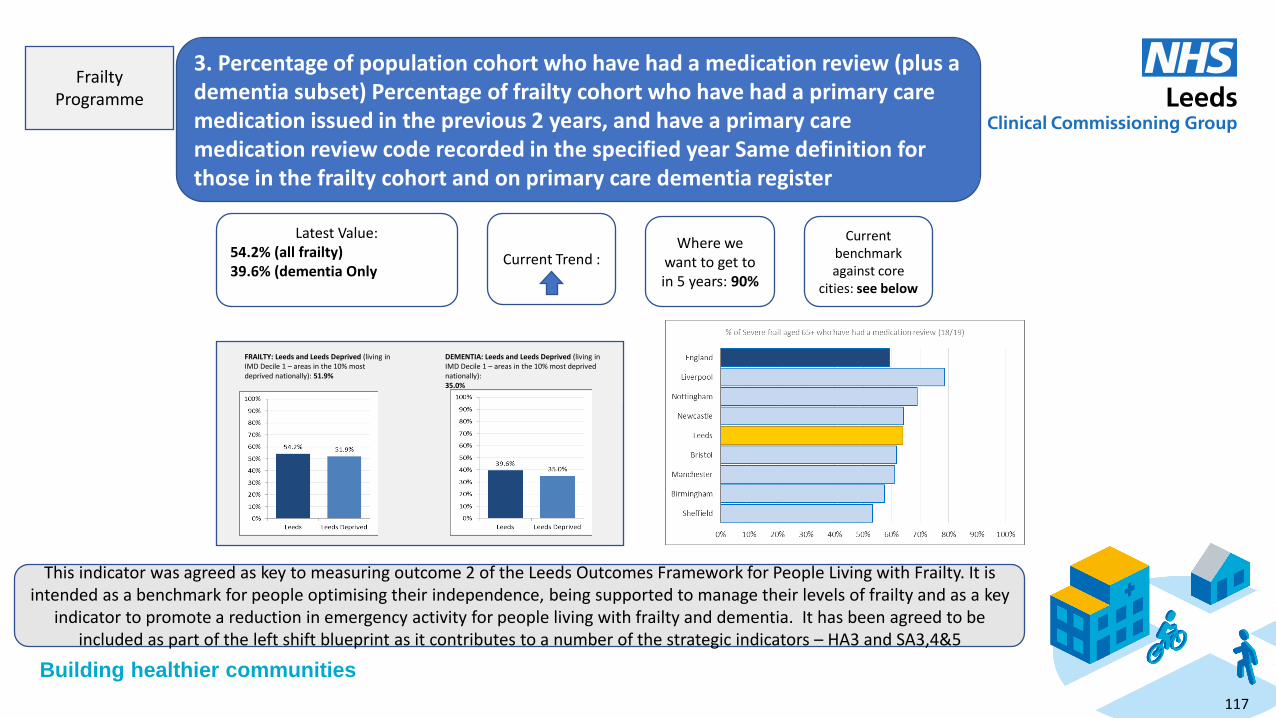
Building healthier communities
3. Percentage of population cohort who have had a medication review (plus a dementia subset) Percentage of frailty cohort who have had a primary care medication issued in the previous 2 years, and have a primary care medication review code recorded in the specified year Same definition for those in the frailty cohort and on primary care dementia register
Frailty
Programme
Latest Value: 54.2% (all frailty) 39.6% (dementia Only
Current Trend : Where we
want to get to in 5 years: 90%
Current benchmark against core
cities: see below
FRAILTY: Leeds and Leeds Deprived (living in IMD Decile 1 – areas in the 10% most deprived nationally): 51.9%
DEMENTIA: Leeds and Leeds Deprived (living in IMD Decile 1 – areas in the 10% most deprived nationally): 35.0%
This indicator was agreed as key to measuring outcome 2 of the Leeds Outcomes Framework for People Living with Frailty. It is
intended as a benchmark for people optimising their independence, being supported to manage their levels of frailty and as a key indicator to promote a reduction in emergency activity for people living with frailty and dementia. It has been agreed to be
included as part of the left shift blueprint as it contributes to a number of the strategic indicators – HA3 and SA3,4&5
117

Building healthier communities
4. Number of carers identified on primary care systems, and evidence of health check or review in their own right as carers. Number of Carers recorded in GP clinical systems with carers assessment recorded with BP & BMI or CCSP/Annual review recorded
Frailty
Programme
This indicator was agreed as key to measuring outcome 4 of the Leeds Outcomes Framework for People Living with Frailty. It is intended as a recognition of the huge contribution that carers make in supporting people living with frailty and dementia and promoting their needs. It has been agreed to be included as part of the left shift blueprint as it contributes to a number of the strategic indicators – HA3, SA3,4,5&7 and EM1&2
Latest Value: (July 2020) 59.9%
Current Trend : Where we
want to get to in 5 years: 75%
2018-19
118

Building healthier communities
5. Proportion of people living with frailty and people living with dementia who have had a Collaborative Care and Support Plan review / have and advance care plan in place i. Percentage of frailty cohort who have had a primary care CCSP appointment code recorded in the specified year ii. Same definition for those in the frailty cohort and on primary care dementia register iii. Percentage of those in the frailty cohort and on primary care dementia register who have had primary care dementia care plan code recorded in the specified year
Frailty
Programme
This indicator was agreed as key to measuring outcome 1 of the Leeds Outcomes Framework for People Living with Frailty. It is intended as a benchmark for people optimising their independence, being supported to manage their levels
of frailty and as a key indicator to promote proactive, personalised care. It has been agreed to be included as part of the left shift blueprint as it contributes to a number of the strategic indicators – HA11 and SA3,4,5,6&7
Latest Values: i. 48.5% ii. 30.7% iii. 39.2%
Current Trend:
Where we want to get to in 5 years:
i. 80% ii. 60% iii. 70%
Measure i Measure ii Measure iii
119
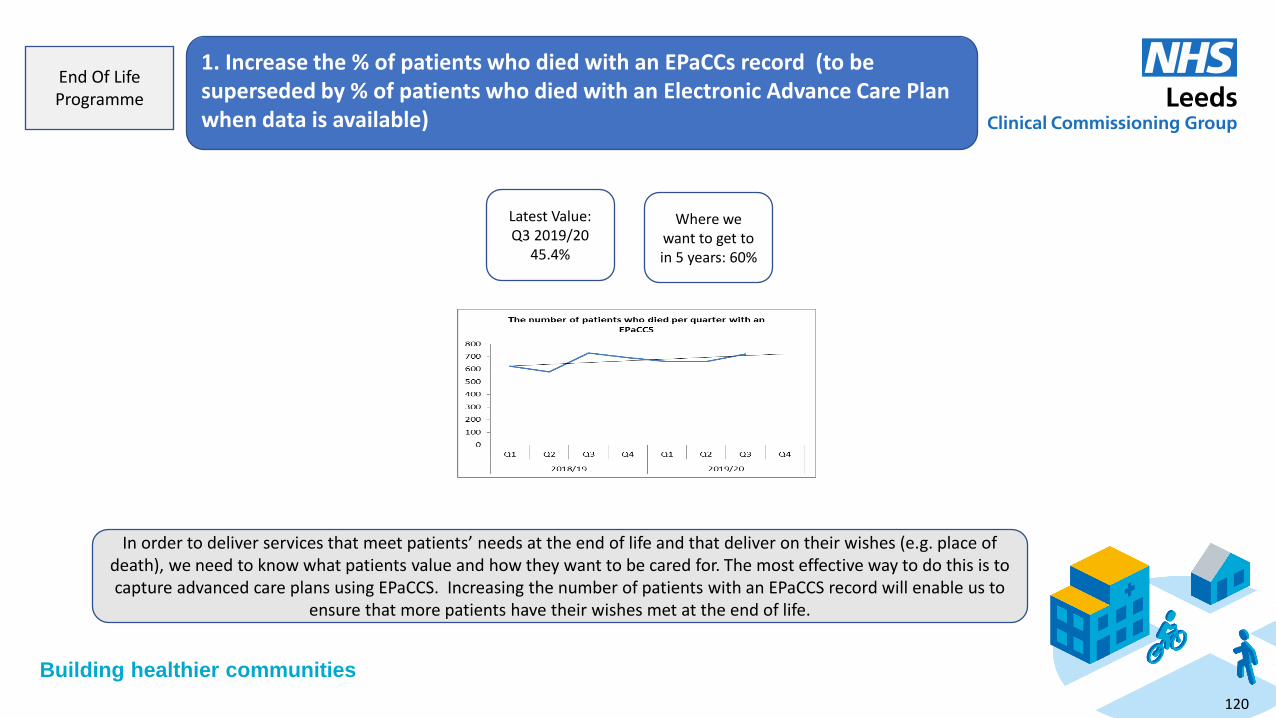
Building healthier communities
1. Increase the % of patients who died with an EPaCCs record (to be superseded by % of patients who died with an Electronic Advance Care Plan when data is available)
End Of Life Programme
In order to deliver services that meet patients’ needs at the end of life and that deliver on their wishes (e.g. place of death), we need to know what patients value and how they want to be cared for. The most effective way to do this is to capture advanced care plans using EPaCCS. Increasing the number of patients with an EPaCCS record will enable us to
ensure that more patients have their wishes met at the end of life.
Latest Value: Q3 2019/20
45.4%
Where we want to get to in 5 years: 60%
120
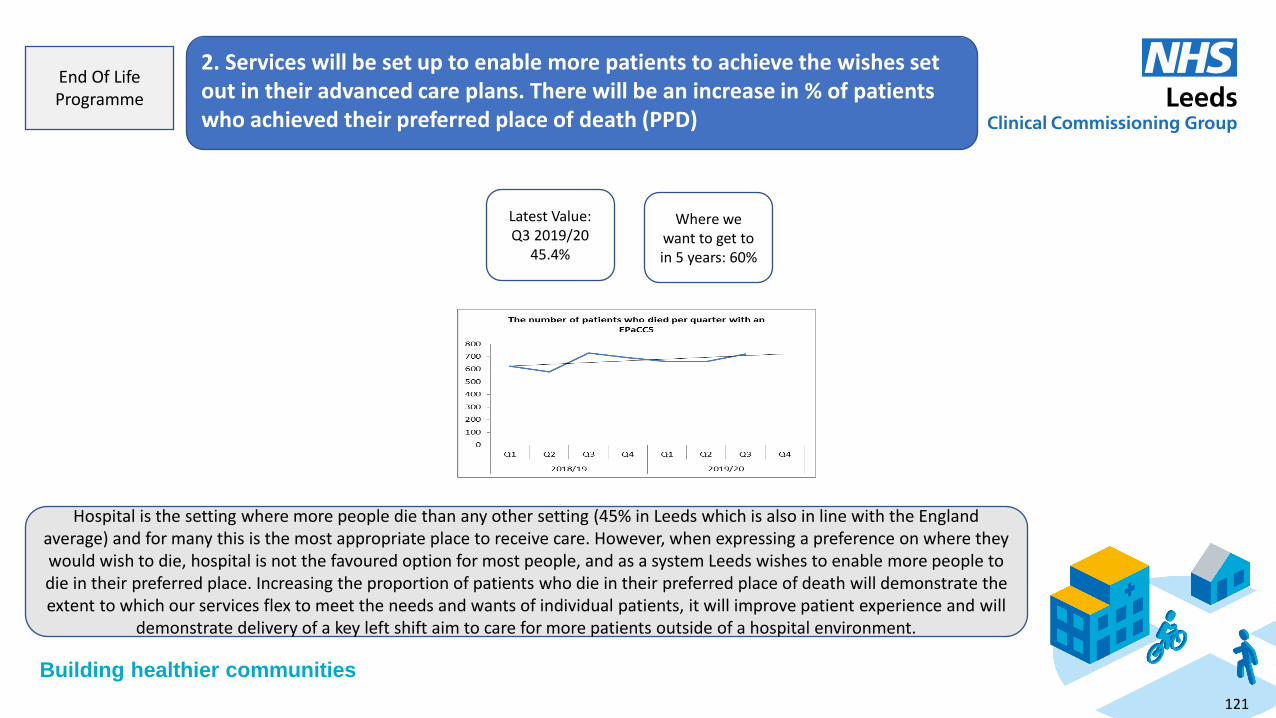
Building healthier communities
2. Services will be set up to enable more patients to achieve the wishes set out in their advanced care plans. There will be an increase in % of patients who achieved their preferred place of death (PPD)
End Of Life Programme
Hospital is the setting where more people die than any other setting (45% in Leeds which is also in line with the England average) and for many this is the most appropriate place to receive care. However, when expressing a preference on where they would wish to die, hospital is not the favoured option for most people, and as a system Leeds wishes to enable more people to die in their preferred place. Increasing the proportion of patients who die in their preferred place of death will demonstrate the extent to which our services flex to meet the needs and wants of individual patients, it will improve patient experience and will
demonstrate delivery of a key left shift aim to care for more patients outside of a hospital environment.
Latest Value: Q3 2019/20
45.4%
Where we want to get to in 5 years: 60%
121
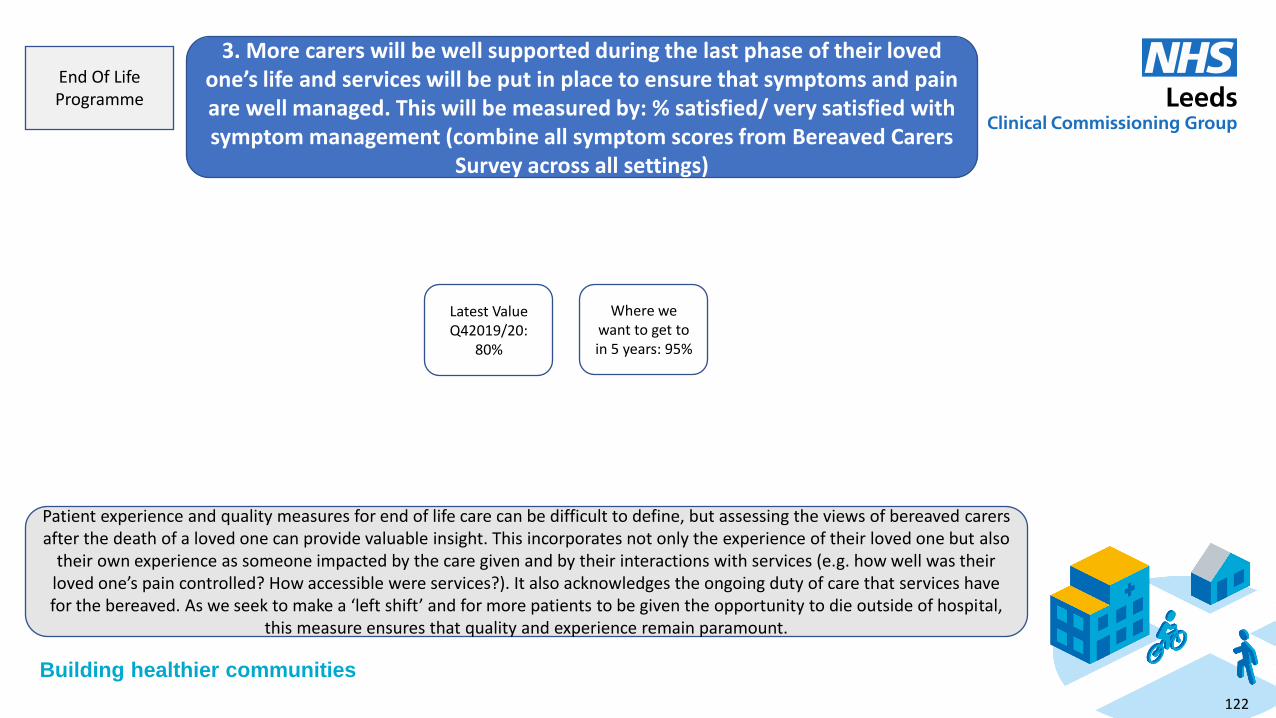
Building healthier communities
3. More carers will be well supported during the last phase of their loved
one’s life and services will be put in place to ensure that symptoms and pain are well managed. This will be measured by: % satisfied/ very satisfied with symptom management (combine all symptom scores from Bereaved Carers
Survey across all settings)
End Of Life Programme
Patient experience and quality measures for end of life care can be difficult to define, but assessing the views of bereaved carers after the death of a loved one can provide valuable insight. This incorporates not only the experience of their loved one but also
their own experience as someone impacted by the care given and by their interactions with services (e.g. how well was their loved one’s pain controlled? How accessible were services?). It also acknowledges the ongoing duty of care that services have for the bereaved. As we seek to make a ‘left shift’ and for more patients to be given the opportunity to die outside of hospital,
this measure ensures that quality and experience remain paramount.
Latest Value Q42019/20:
80%
Where we want to get to in 5 years: 95%
122