
DRAFT ENERGY SCAVENGING COMBINING PIEZOELECTRIC …kmmossi/downloads/ENERGY... · This process is...
7
1 Copyright © 2010 by ASME Proceedings of the ASME 2010 Conference on Smart Materials, Adaptive Structures and Intelligent Systems SMASIS2010 September 28 – October 1, 2010, Philadelphia, Pennsylvania, USA SMASIS2010-3689 DRAFT ENERGY SCAVENGING COMBINING PIEZOELECTRIC AND PYROELECTRIC EFFECTS Ugur Erturun Rachel Waxman Christopher Green Matthew Lee Richeson Karla Mossi Department of Mechanical Engineering, Virginia Commonwealth University, Richmond, VA, USA ABSTRACT The piezoelectric effect is well known and used for vibration energy harvesting applications. The pyroelectric effect is also used to generate electrical power if there is an environment that has cyclic temperature changes. In this study, increasing generated electrical power by use of a combination of piezoelectric and pyroelectric effects is investigated. As a sample case it is aimed to utilize this piezoelectric and pyroelectric effect for a new sensor application. The results of the tests indicate that energy from vibrations and heat can have a significant interaction depending on the frequencies at which each effect occurs. In some cases, energy from vibrations and energy from heat can be detrimental when combined. Therefore both parameters have to be tuned properly to optimize scavenging energy. It was determined that at the best tested parameters the rate of charge increases by approximately 12%. INTRODUCTION Renewable and alternative energy sources have been moved to the forefront of research and development to reduce the world’s dependence on petroleum products. Efforts are being made to design systems that capture energy being lost to the ambient environment. Energy can be reclaimed through a process and stored for later use to recharge a battery or power a device. This process is referred to as energy scavenging with the general idea being the extraction of energy that would otherwise be wasted. Energy sources that are frequently squandered include solar, wind, water, indoor lighting, vibrations, acoustic noise, and temperature gradients. Others include the energy generated by humans from everyday activities such as walking, driving, or sleeping [1]. Harvesting these phenomena can be accomplished through the use of piezoelectric and pyroelectric materials such as lead ziconate titanate (PZT), lead magnesium niobate-lead titanate (PMN- PT), and polyvinylidene fluoride (PVDF). Piezoelectric Energy Conversion Piezoelectricity describes the phenomenon of generating an electric charge in a material when subjecting it to mechanical stress (direct effect), and conversely, generating a mechanical strain in response to an applied electric field (converse effect). The effects are practically linear as the electric field and mechanical strain are proportional. This characteristic allows a material to be used as a sensor and an actuator [2]. The equations that describe the behavior of piezoelectric materials are given usually by their constitutive equations in tensor notation, which can be written as: jk ijk j ij i T d E D (1) And kl E ijkl k jk ij T s E di S (2) Where T is stress, E is electric field, D is displacement, S is strain, s is compliance, d is strain constant, and ε is permittivity. Several studies have investigated the possibility of harvesting energy through the use of piezoelectric materials (which are also pyroelectric) [3], [4], [5], [6]. Goldfarb and Umeda measured the power and calculated the efficiency of an output produced by a piezoelectric Unimorph, which consists of a layer of piezoelectric material bonded to a piece of metal [7], [8]. Though the efficiency obtained was quite low, their work demonstrated the possibility of using a piezoelectric device to harvest mechanical energy. Antaki et al. explored the
Transcript of DRAFT ENERGY SCAVENGING COMBINING PIEZOELECTRIC …kmmossi/downloads/ENERGY... · This process is...
1 Copyright © 2010 by ASME
Proceedings of the ASME 2010 Conference on Smart Materials, Adaptive Structures and Intelligent Systems
SMASIS2010 September 28 – October 1, 2010, Philadelphia, Pennsylvania, USA
SMASIS2010-3689 DRAFT
ENERGY SCAVENGING COMBINING PIEZOELECTRIC AND PYROELECTRIC EFFECTS
Ugur Erturun Rachel Waxman Christopher Green Matthew Lee Richeson Karla Mossi
Department of Mechanical Engineering, Virginia Commonwealth University, Richmond, VA, USA
ABSTRACT
The piezoelectric effect is well known and used for
vibration energy harvesting applications. The pyroelectric effect
is also used to generate electrical power if there is an
environment that has cyclic temperature changes. In this study,
increasing generated electrical power by use of a combination
of piezoelectric and pyroelectric effects is investigated. As a
sample case it is aimed to utilize this piezoelectric and
pyroelectric effect for a new sensor application. The results of
the tests indicate that energy from vibrations and heat can have
a significant interaction depending on the frequencies at which
each effect occurs. In some cases, energy from vibrations and
energy from heat can be detrimental when combined.
Therefore both parameters have to be tuned properly to
optimize scavenging energy. It was determined that at the best
tested parameters the rate of charge increases by approximately
12%.
INTRODUCTION
Renewable and alternative energy sources have been
moved to the forefront of research and development to reduce
the world’s dependence on petroleum products. Efforts are
being made to design systems that capture energy being lost to
the ambient environment. Energy can be reclaimed through a
process and stored for later use to recharge a battery or power a
device. This process is referred to as energy scavenging with
the general idea being the extraction of energy that would
otherwise be wasted. Energy sources that are frequently
squandered include solar, wind, water, indoor lighting,
vibrations, acoustic noise, and temperature gradients. Others
include the energy generated by humans from everyday
activities such as walking, driving, or sleeping [1]. Harvesting
these phenomena can be accomplished through the use of
piezoelectric and pyroelectric materials such as lead ziconate
titanate (PZT), lead magnesium niobate-lead titanate (PMN-
PT), and polyvinylidene fluoride (PVDF).
Piezoelectric Energy Conversion
Piezoelectricity describes the phenomenon of generating an
electric charge in a material when subjecting it to mechanical
stress (direct effect), and conversely, generating a mechanical
strain in response to an applied electric field (converse effect).
The effects are practically linear as the electric field and
mechanical strain are proportional. This characteristic allows a
material to be used as a sensor and an actuator [2]. The
equations that describe the behavior of piezoelectric materials
are given usually by their constitutive equations in tensor
notation, which can be written as:
j ki j kji ji TdED (1)
And
k lE
i j k lkj ki j TsEd iS (2)
Where T is stress, E is electric field, D is displacement, S is
strain, s is compliance, d is strain constant, and ε is permittivity.
Several studies have investigated the possibility of
harvesting energy through the use of piezoelectric materials
(which are also pyroelectric) [3], [4], [5], [6]. Goldfarb and
Umeda measured the power and calculated the efficiency of an
output produced by a piezoelectric Unimorph, which consists
of a layer of piezoelectric material bonded to a piece of metal
[7], [8]. Though the efficiency obtained was quite low, their
work demonstrated the possibility of using a piezoelectric
device to harvest mechanical energy. Antaki et al. explored the

2 Copyright © 2010 by ASME
feasibility of extracting energy from ambulation to provide
supplemental power to operate artificial organs. Their study
measured energy utilized when walking or jogging by the use
of piezoelectric stacks [4].
Roundy et al. explored the possibility of scavenging low-
level vibrations as a power source for wireless sensor nodes.
The optimized model produced energy densities of 250 W/cm3
from a vibration source input magnitude of 2.5 m/s2 at 120 Hz.
The model was verified experimentally demonstrating a power
density of 70 W/cm3 [9].
Sodano, Lloyd, and Inman compared the ability of three
types of strain-type actuators, a Macro-Fiber Composite (MFC)
actuator, the Quick Pack IDE model QP10ni, and the Quick
Pack model QP10n to convert mechanical strain into electrical
energy by exciting them while attached to an aluminum beam.
An important concept from this study is that impedance
matching between the transducer and the circuit is critical when
optimizing for power [10].
Pyroelectric Energy Conversion
Thermoelectric power generation is based on Seebeck
effect, which was discovered in 1821. When a temperature
difference exists between the two points of the open circuit that
is made up of two heterogeneous semiconductors, thermal
electromotive force is produced, which is in direct proportion to
the temperature difference between the two points.
Commercially available thermoelectric generator modules
(TGM) can provide on the order of 10mW/cm2 [11]. This level
of performance comes with difficulty because of the need of
bulky heat sinks to maximize the gradient. Pyroelectric
materials are an alternative because of their ease of use [12]. Pyroelectricity is based on a pronounced temperature
dependence of the electric displacement field in a ferroelectric
material. The pyroelectric effect has not been considered for
thermal power generation so far perhaps because the electric
current generated by pyroelectric effect is proportional to the
time derivative of temperature.
Olsen et al. designed a cyclic pyroelectric conversion
device using a pump, a cooling system, and a heat exchanger. A
DC voltage source and a series of circuits were used to drive a
Lead Zirconate plate doped with T4+
and Sn4+
. The circuit
mimicked the behavior of an Ericsson cycle yielding an energy
density of 100mJ/cm3 [13]. In another study PZT cells of
60µm-100µm were fabricated by Cuadras et al. Poling fields of
5V/µm and 7V/µm were used for each. The samples were
heated with a halogen lamp and a hair dryer. It was concluded
that the samples with the larger thicknesses had the greater
energy densities [14].
Sebald et al. analyzed pyroelectric behavior in terms of
thermodynamic cycles with energy harvesting circuitry. An
electro-thermal coupling factor was defined and it was
concluded that that efficiencies from 0.02% and 0.05%of the
Carnot cycle could be reached using (111) PMN-0.25PT and a
Synchronized Switch on Inductor (SSHI) circuit [15]. In a later
study by the same group, which compared thermoelectric and
pyroelectric energy harvesting, it was concluded that
pyroelectric energy harvesters were more efficient and easier to
implement than traditional thermoelectric materials [16].
Sebald et al. conducted another study the same year and
concluded that using an Ericsson based thermodynamic cycle
produced 100 times more energy than the linear pyroelectric
effect. Materials with high electro-caloric activity were needed
for top performance. Energy densities of 186mJ/cm3 were
reported [17].
Energy Harvesting Circuitry
The type of circuitry used to harvest energy is determined
by the desired output to the load, which frequently needs to be
rectified, filtered, and regulated. The output signal from the
transducer can be modeled as an AC source in parallel with a
capacitor. To convert this signal into a useful one, an AC-DC
converter is used to rectify the noisy AC signal. The output
from this converter is then sent to a DC-DC converter where it
is regulated to the desired voltage. Capacitors are used to aid in
filtering. Step down buck converters have been receiving
widespread use because of their efficiency [18]. They consist of
a diode in series with an inductor all in parallel with a capacitor
with the switching of the rectified signal being accomplished
by a MOSFET [19].
Because of the wide range of energy harvesting circuits
available, in this study the circuitry is kept constant. Since the
main objective of this study is not to optimize circuitry but to
characterize the contributions of the pyroelectric and
piezoelectric effect on PZT5A, a commercially available
circuitry is utilized. Details of the experimental setup are
described in the following section.
EXPERIMENTAL SETUP
In this study, it has been hypothesized that by utilizing both
piezoelectric and pyroelectric effects simultaneously, it may be
possible to harvest more energy than by utilizing only one
effect at a time. To test this, an experimental setup was
designed. A PZT sample with dimensions 28.1mm x 28.4mm x
0.375mm was obtained and taped to an aluminum substrate of
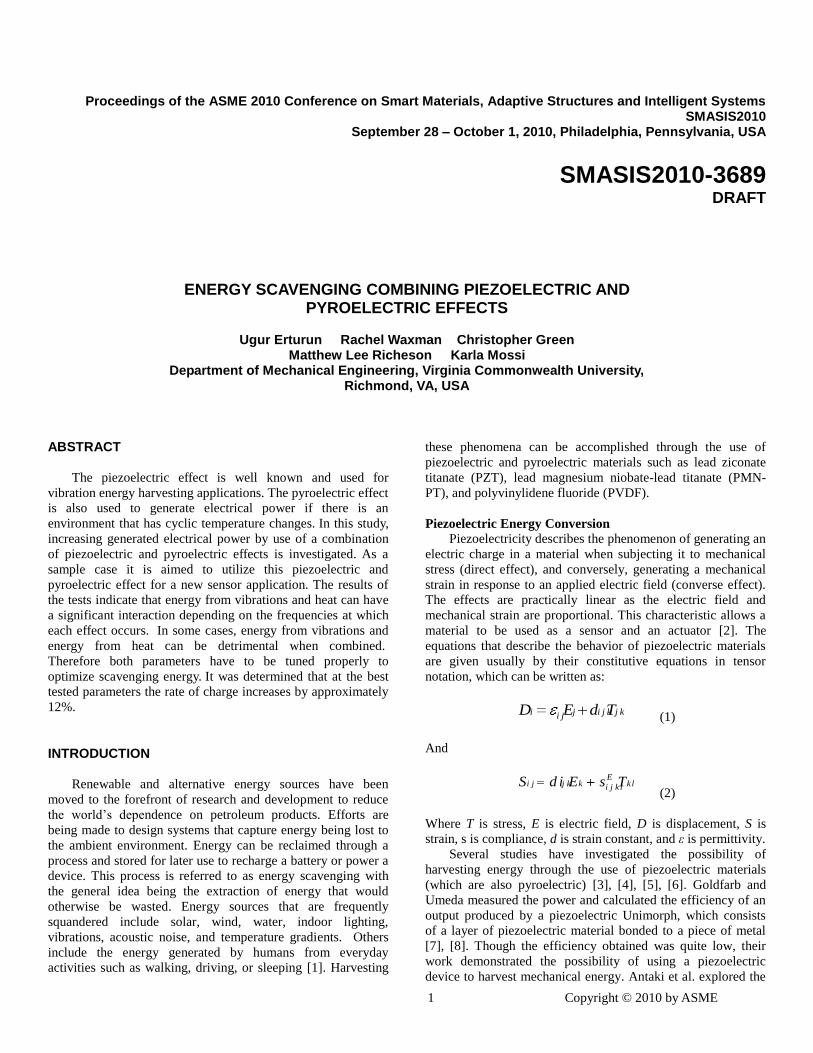
dimensions 50mm x 150mm x 0.275mm. An M-8503-P1 Macro
Fiber Composite (MFC) shown in Figure 1, a commercially
available piezoelectric actuator from Smart Material
Corporation was taped to the opposite side of the aluminum and
was used to provide the vibration input to the PZT sample [20].
It was necessary to power the MFC using a Trek PZD2000
High Voltage Amplifier, which was connected to a HP 33120A
Function Generator.
To provide the fluctuating temperature input to the PZT
sample, a 125W infrared heating lamp was used as the heat
source. A 27.94 cm diameter steel disc was constructed and a
45º sector of the disc was cut away. This disc was fixed to a
variable speed DC electrical motor and positioned so that the
disc came between the infrared lamp and the test sample. As
the disc spun, the test sample was subjected to heat from the
lamp for 1/8 of the disc’s spin period. It was positioned in such
3 Copyright © 2010 by ASME
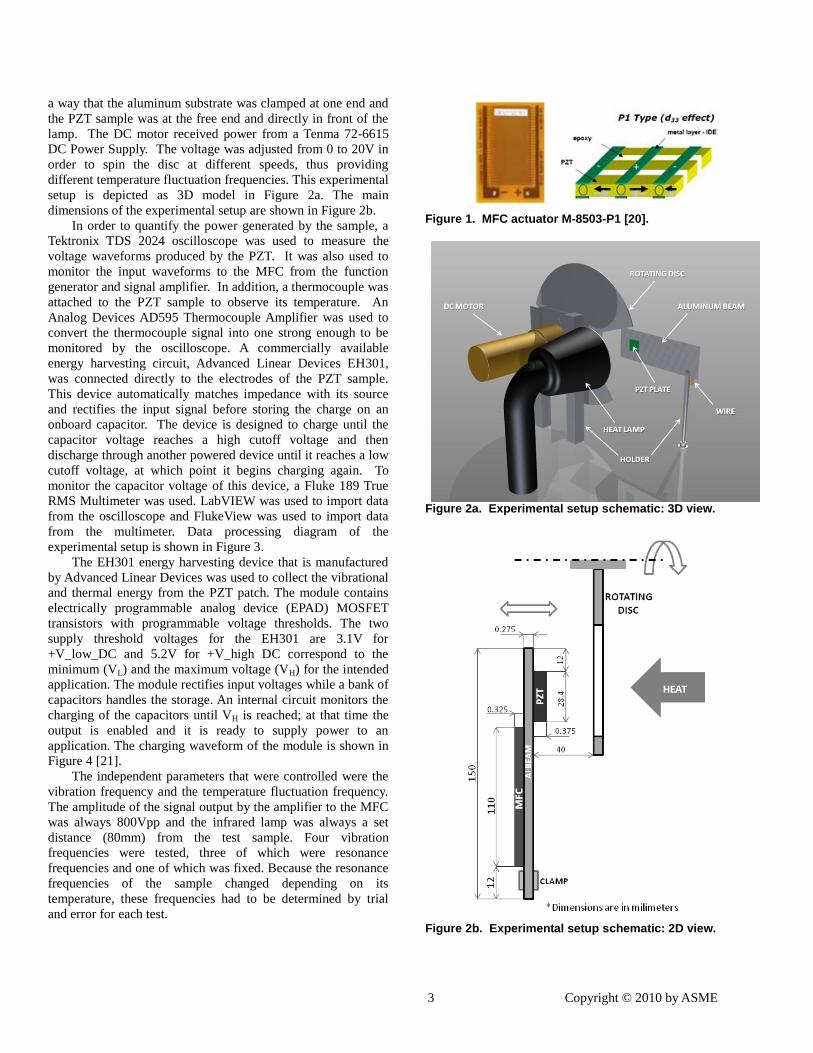
a way that the aluminum substrate was clamped at one end and
the PZT sample was at the free end and directly in front of the
lamp. The DC motor received power from a Tenma 72-6615
DC Power Supply. The voltage was adjusted from 0 to 20V in
order to spin the disc at different speeds, thus providing
different temperature fluctuation frequencies. This experimental
setup is depicted as 3D model in Figure 2a. The main
dimensions of the experimental setup are shown in Figure 2b.
In order to quantify the power generated by the sample, a
Tektronix TDS 2024 oscilloscope was used to measure the
voltage waveforms produced by the PZT. It was also used to
monitor the input waveforms to the MFC from the function
generator and signal amplifier. In addition, a thermocouple was
attached to the PZT sample to observe its temperature. An
Analog Devices AD595 Thermocouple Amplifier was used to
convert the thermocouple signal into one strong enough to be
monitored by the oscilloscope. A commercially available
energy harvesting circuit, Advanced Linear Devices EH301,
was connected directly to the electrodes of the PZT sample.
This device automatically matches impedance with its source
and rectifies the input signal before storing the charge on an
onboard capacitor. The device is designed to charge until the
capacitor voltage reaches a high cutoff voltage and then
discharge through another powered device until it reaches a low
cutoff voltage, at which point it begins charging again. To
monitor the capacitor voltage of this device, a Fluke 189 True
RMS Multimeter was used. LabVIEW was used to import data
from the oscilloscope and FlukeView was used to import data
from the multimeter. Data processing diagram of the
experimental setup is shown in Figure 3.
The EH301 energy harvesting device that is manufactured
by Advanced Linear Devices was used to collect the vibrational
and thermal energy from the PZT patch. The module contains
electrically programmable analog device (EPAD) MOSFET
transistors with programmable voltage thresholds. The two
supply threshold voltages for the EH301 are 3.1V for
+V_low_DC and 5.2V for +V_high DC correspond to the
minimum (VL) and the maximum voltage (VH) for the intended
application. The module rectifies input voltages while a bank of
capacitors handles the storage. An internal circuit monitors the
charging of the capacitors until VH is reached; at that time the
output is enabled and it is ready to supply power to an
application. The charging waveform of the module is shown in
Figure 4 [21].
The independent parameters that were controlled were the
vibration frequency and the temperature fluctuation frequency.
The amplitude of the signal output by the amplifier to the MFC
was always 800Vpp and the infrared lamp was always a set
distance (80mm) from the test sample. Four vibration
frequencies were tested, three of which were resonance
frequencies and one of which was fixed. Because the resonance
frequencies of the sample changed depending on its
temperature, these frequencies had to be determined by trial
and error for each test.
Figure 1. MFC actuator M-8503-P1 [20].
Figure 2a. Experimental setup schematic: 3D view.
Figure 2b. Experimental setup schematic: 2D view.

4 Copyright © 2010 by ASME
time(s)
0 5 10 15 20 25
Tem
per
atu
re (
oC
)
36
38
40
42
44
46
48
smoothed data
experimental data
time(s)
0 1 2 3 4 5
Tem
per
atu
re (
oC
)
38.0
38.5
39.0
39.5
40.0
40.5
41.0
41.5
42.0smoothed data
experimental data
time(s)
0.0 0.5 1.0 1.5 2.0
Tem
per
atu
re (
oC
)
39.0
39.5
40.0
40.5
41.0
41.5
42.0
smoothed data
experimental data
Figure 3. Data processing schematic of the setup.
Figure 4. EH301 Charging Wave Form [21].
The resonant frequencies were chosen to be approximately
40Hz, 600Hz, and 900Hz, and the fixed frequency was 500Hz.
The temperature fluctuation frequencies were approximately
0.1Hz, 0.5Hz, and 1Hz. Tests were conducted for every
combination of these frequencies, including 0Hz, to test the
independent contributions of vibration and temperature
fluctuations alone. For each test, waveforms were collected by
the oscilloscope. The primary measure of power generated was
the amount of power harvested by the energy harvesting circuit.
Before each test the capacitor on the circuit was shorted. It was
then allowed to charge for 30min. The amount of energy
harvested on the 1mF capacitor could then be easily calculated
by 2(1/ 2)E CV where C is the capacitance and V is the
measured voltage at 30min. Average power could then be
calculated by dividing this number by 1800sec.
RESULTS AND DISCUSSION
The first step of the results consists of measuring
temperature profiles as the disk rotates at different speeds. The
trends observed in Figures 5a through 5c of temperature versus
time show the signals are quite noisy, and to help characterize
waveform shape a smoothed version of the data is also shown.
Note that the temperature profile with the most scatter is Figure
5c, that is when the frequency of the plate rotating is
approximately 1Hz and the plate is rotating relatively quickly.
In this case, the samples do not have enough time to cool
completely between each cycle and the temperature gradients
are small (approximately a ΔT of 1.7ºC, which is four times
smaller than the 0.1Hz case).
Figure 5. Temperature profiles at (a) 0.1Hz, (b) 0.5Hz (c) 1Hz.
For the case of only providing heat energy to the sample, a
typical one-cycle profile is measured as shown in Figure 6 at
the three different frequencies tested. The maximum amount of
voltage harvested is similar in all cases except for the 1Hz case,
which is slightly smaller. The difference is in the area under
each curve. This translates to lower total energy that can be
harvested. In addition, it is important to note that the values of
voltage in the cooling phase reach values below those measured
at the initial time. These changes are possible due to the
different slopes of the temperature profiles when heating and
cooling.
(a)
(b)
(c)

5 Copyright © 2010 by ASME
Heat Only
Normalized Time (s)
0.0 0.2 0.4 0.6 0.8 1.0 1.2
Volt
age
(mV
)
-800
-600
-400
-200
0
200
400
600
800
0.1 Hz
0.5 Hz
1 Hz
Figure 6. Energy Scavenged through the application of periodic light bursts at different rates.
Using the setup described in the experimental section, a
periodic vibration is applied to the beam at different
frequencies. In this case the light is turned off, effectively
showing voltage profiles when only vibration is present in the
system, as shown in Figure 7. The frequencies shown are
sample values chosen due to their higher output and quality of
the signal.
Vibration Only
Normalized Time (s)
0.0 0.2 0.4 0.6 0.8 1.0 1.2
Vo
ltag
e (m
V)
-400
-300
-200
-100
0
100
200
300
400
500
46Hz
500Hz
910Hz
Figure 7. Vibration only Voltage waveforms at different frequencies.
The results shown in Figures 6 and 7 are typical for
vibration only and heat only cases. Discussions on power and
energy calculations are described later in this section.
When heat and vibration are combined, each one at
different setting, the results for each case are different and are
described separately. For the case of heat at 0.5Hz and
vibration levels of 43, 500, and 620Hz, the typical output
waveform of measured voltage is shown in Figure 8.
For instance in the case of applied heat at 0.5Hz and
vibrations at 620Hz, the experimental data and smoothed data
are displayed in Figure 8. It is hypothesized that the apparent
noise is energy coming from applying the cycling heat signal
simultaneously with the applied vibrations.
time (s)
0.0 0.5 1.0 1.5 2.0V
olt
age
(mV
)
-800
-600
-400
-200
0
200
400
600
800
smoothed
experimental
Figure 8. Vibration at 620Hz and heat at 0.5Hz voltage waveform for experimental data and smoothed data.
To better quantify the effect of heat and vibrations, other
frequency spots that are interesting to observe is when the heat
is at 1Hz and the vibrations are at 43Hz as shown in Figure 9.
In this figure, when the experimental and smoothed data are
plotted, a sinusoidal waveform is clearly visible riding the
smoothed total data. The sinusoidal waveform riding on the
larger waveform seems to show a relatively regular pattern in
time, namely a frequency of 43Hz.This is the same frequency
the heat is applied to the sample. The larger waveform,
smoothed, shows a frequency of 1Hz. These results seemed to
indicate that the vibrations and heat together can provide a
better contribution to overall power. 2D Graph 8
time (s)
0.0 0.2 0.4 0.6 0.8 1.0
Volt
age(
mV
)
-800
-600
-400
-200
0
200
400
600
800
smoothed
experimental
Figure 9. Heat and Vibrations (Heat at 1Hz and Vibrations at 43Hz).
6 Copyright © 2010 by ASME
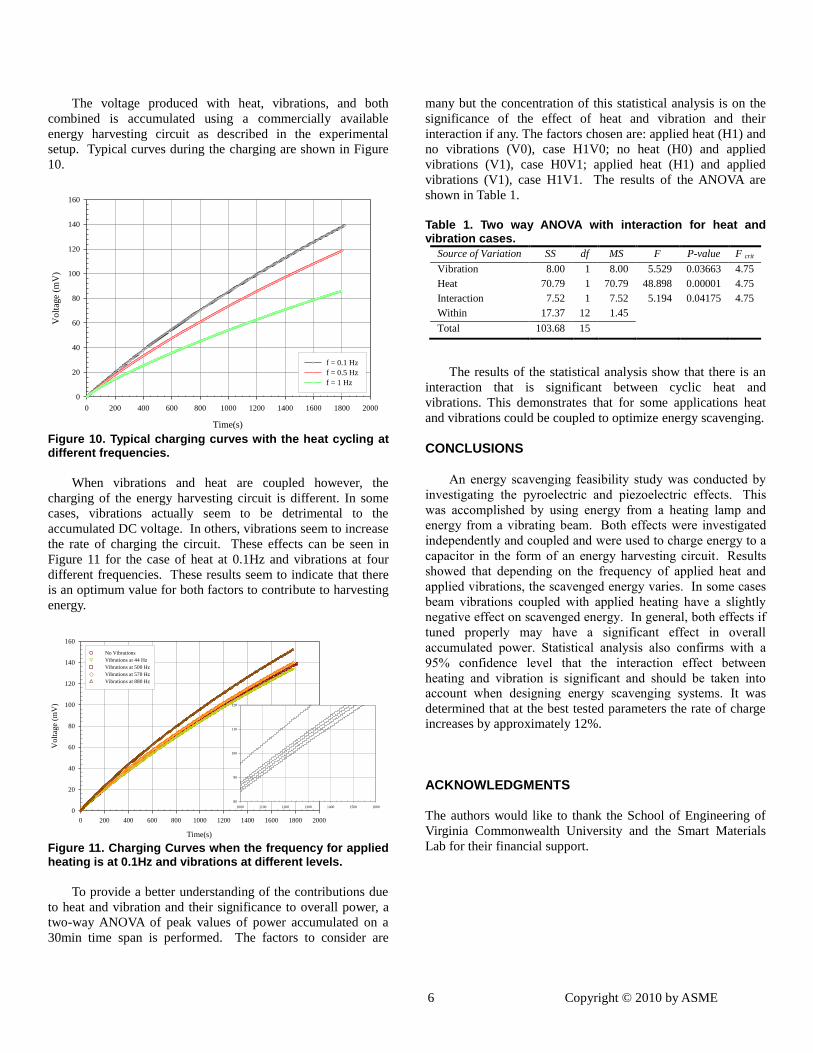
The voltage produced with heat, vibrations, and both
combined is accumulated using a commercially available
energy harvesting circuit as described in the experimental
setup. Typical curves during the charging are shown in Figure
10.
Time(s)
0 200 400 600 800 1000 1200 1400 1600 1800 2000
Volt
age
(mV
)
0
20
40
60
80
100
120
140
160
f = 0.1 Hz
f = 0.5 Hz
f = 1 Hz
Figure 10. Typical charging curves with the heat cycling at different frequencies.
When vibrations and heat are coupled however, the
charging of the energy harvesting circuit is different. In some
cases, vibrations actually seem to be detrimental to the
accumulated DC voltage. In others, vibrations seem to increase
the rate of charging the circuit. These effects can be seen in
Figure 11 for the case of heat at 0.1Hz and vibrations at four
different frequencies. These results seem to indicate that there
is an optimum value for both factors to contribute to harvesting
energy.
Time(s)
0 200 400 600 800 1000 1200 1400 1600 1800 2000
Vo
ltag
e (m
V)
0
20
40
60
80
100
120
140
160
No Vibrations
Vibrations at 44 Hz
Vibrations at 500 Hz
Vibrations at 570 Hz
Vibrations at 880 Hz
1000 1100 1200 1300 1400 1500 1600
80
90
100
110
120
Figure 11. Charging Curves when the frequency for applied heating is at 0.1Hz and vibrations at different levels.
To provide a better understanding of the contributions due
to heat and vibration and their significance to overall power, a
two-way ANOVA of peak values of power accumulated on a
30min time span is performed. The factors to consider are
many but the concentration of this statistical analysis is on the
significance of the effect of heat and vibration and their
interaction if any. The factors chosen are: applied heat (H1) and
no vibrations (V0), case H1V0; no heat (H0) and applied
vibrations (V1), case H0V1; applied heat (H1) and applied
vibrations (V1), case H1V1. The results of the ANOVA are
shown in Table 1.
Table 1. Two way ANOVA with interaction for heat and vibration cases.
Source of Variation SS df MS F P-value F crit
Vibration 8.00 1 8.00 5.529 0.03663 4.75
Heat 70.79 1 70.79 48.898 0.00001 4.75
Interaction 7.52 1 7.52 5.194 0.04175 4.75
Within 17.37 12 1.45
Total 103.68 15
The results of the statistical analysis show that there is an
interaction that is significant between cyclic heat and
vibrations. This demonstrates that for some applications heat
and vibrations could be coupled to optimize energy scavenging.
CONCLUSIONS
An energy scavenging feasibility study was conducted by
investigating the pyroelectric and piezoelectric effects. This
was accomplished by using energy from a heating lamp and
energy from a vibrating beam. Both effects were investigated
independently and coupled and were used to charge energy to a
capacitor in the form of an energy harvesting circuit. Results
showed that depending on the frequency of applied heat and
applied vibrations, the scavenged energy varies. In some cases
beam vibrations coupled with applied heating have a slightly
negative effect on scavenged energy. In general, both effects if
tuned properly may have a significant effect in overall
accumulated power. Statistical analysis also confirms with a
95% confidence level that the interaction effect between
heating and vibration is significant and should be taken into account when designing energy scavenging systems. It was
determined that at the best tested parameters the rate of charge
increases by approximately 12%.
ACKNOWLEDGMENTS
The authors would like to thank the School of Engineering of
Virginia Commonwealth University and the Smart Materials
Lab for their financial support.

7 Copyright © 2010 by ASME
REFERENCES
[1] IEEE Standard Definitions of Piezoelectric Terms (1986).
ANSI/IEEE 180-1986 IEEE, New York.
[2] Jaffe, B., Cook W.R., and Jaffe, H. (1971). Piezoelectric
Ceramics, Academic Press LTD, London.
[3] Piezoelectric Ceramics: Principles and Applications (2002).
APC International, Ltd, Mackeyville, PA.
[4] Antaki, J., Bertocci, G., Green E.C., Nadeem A., Rintoul, T.,
Kormos, R.L., and Griffith, B. (1995). “A Gait Powered
Autologous Battery Charging System For Artificial Organs”,
ASAIO Journal, (41): M588-M595.
[5] Bryant, R. G. (1996). “LaRC™-SI: a soluble aromatic
polyimide”, High Performance Polymers, (8) 607-615.
[6] Fay, J. A., and Golomb, D. S. (2002). “Energy and the
Environment”, Oxford University Press.
[7] Goldfarb, M., and Jones, L.D. (1999). "On the Efficiency of
Electric Power Generation with Piezoelectric Ceramic”,
Journal of Dynamic Systems, Measurement, and Control. Vol.
121: 566-571.
[8] Umeda, M., Nakamura, K., and Ueda, S. (1996). “Analysis
of the Transformation of Mechanical Energy to Electrical
Energy Using Piezoelectric Vibrator”, Japanese Journal of
Applied Physics – Part 1 Regular Papers and Short Notes. Vol.
35, N.5 pt. B: 3267-3274.
[9] Roundy, S., Wright, P., Rabaey, J. (2004). “Energy
Scavenging For Wireless Sensor Networks”, Kluwer Academic
Publishers.
[10] Sodano, H.A., Inman, D.J. and Park, G., (2005).
Comparison of Piezoelectric Energy Harvesting Devices for
Recharging Batteries, Journal of Intelligent Material Systems
and Structures, v 16, n 10, p 799-807.
[11] Rowe, D.S. (1983). Modern Thermoelectrics, Prentice
Hall p. 1-10.
[12] Sebald, G., Guyomar, D., Agbossou, A. (2009). “Smart
Materials and Structures” v 18, n 12, p 125006 (7 pp.)
[13] Olsen, R.B., Bruno, D.A., Briscoe, J.M. (1985).
"Pyroelectric conversion cycles", Journal of Applied Physics,
vol.58, no.12, pp.4709-4716.
[14] Cuadras, A., Gasulla, M., Ghisla, A., and Ferrari, V.,
(2006). “Energy harvesting from PZT pyroelectric cells”,
Instrumentation and Measurement Technology Conference,
pp.1688 – 1672.
[15] Sebald, G., Lefeuvre, E.,Guyomar, D., (2008).
“Pyroelectric Energy Conversion: Optimization principles”,
IEEE Transactions on Ultrasonics, Ferroelectrics, and
Frequency Control, v 55, n 3, p 538-551.
[16] Sebald, G., Guyomar, D., Agbossou, A. (2009). “On
Thermoelectric and Pyroelectric Energy Harvesting”, Smart
Materials and Structures, v 18, n 12, p 125006 (7 pp.).
[17] Khodayari, A., Pruvost, S., Sebald, G., Guyomar, D.,
Mohammadi, S. (2009). “Nonlinear Pyroelectric Energy
Harvesting From Relaxor Single Crystals”, IEEE Transactions
on Ultrasonics, Ferroelectrics and Frequency Control, v 56, n
4, p 693-9.
[18] Rashid M.H., (2001). Power electronics handbook,
Academic Press, pp. 539–562.
[19] Ottman, G.K., Hofmann, H.F., Bhatt, A.C., and Lesieutre,
G.A. (2002). “Adaptive Piezoelectric Energy Harvesting
Circuit for Wireless Remote Power Supply”, IEEE
Transactions on Power Electronics, v 17, n 5, p 669-76.
[20] MFC-brochure, Smart Material Corp., www.smart-
material.com, 2010.
[21] EH300/EH301 EPAD Energy Harvesting Modules
Brochure, Advanced Linear Devices, Inc., www.aldinc.com,
2010.