DRAFT DECISION AusNet Services transmission ... - Draft decision...RPP revenue and pricing...
23
1-0 Attachment 1 – Maximum allowed revenue | Draft decision: AusNet Serices transmission determination 2017–22 DRAFT DECISION AusNet Services transmission determination 2017−18 to 2021−22 Attachment 1 – Maximum allowed revenue July 2016
Transcript of DRAFT DECISION AusNet Services transmission ... - Draft decision...RPP revenue and pricing...

1-0 Attachment 1 – Maximum allowed revenue | Draft decision: AusNet Serices transmission determination
2017–22
DRAFT DECISION
AusNet Services transmission
determination
2017−18 to 2021−22
Attachment 1 – Maximum
allowed revenue
July 2016
1-1 Attachment 1 – Maximum allowed revenue | Draft decision: AusNet Serices transmission determination
2017–22
© Commonwealth of Australia 2016
This work is copyright. In addition to any use permitted under the Copyright Act 1968, all
material contained within this work is provided under a Creative Commons Attributions 3.0
Australia licence, with the exception of:
the Commonwealth Coat of Arms
the ACCC and AER logos
any illustration, diagram, photograph or graphic over which the Australian Competition and
Consumer Commission does not hold copyright, but which may be part of or contained
within this publication. The details of the relevant licence conditions are available on the
Creative Commons website, as is the full legal code for the CC BY 3.0 AU licence.
Requests and inquiries concerning reproduction and rights should be addressed to the:
Director, Corporate Communications
Australian Competition and Consumer Commission
GPO Box 4141, Canberra ACT 2601
Inquiries about this publication should be addressed to:
Australian Energy Regulator
GPO Box 520
Melbourne Vic 3001
Tel: 1300 585 165
Email: [email protected]
AER reference: 53444

1-2 Attachment 1 – Maximum allowed revenue | Draft decision: AusNet Serices transmission determination
2017–22
Note
This attachment forms part of the AER's draft decision on AusNet Services’ revenue
proposal 2017–22. It should be read with other parts of the draft decision.
The draft decision includes the following documents:
Overview
Attachment 1 – maximum allowed revenue
Attachment 2 – regulatory asset base
Attachment 3 – rate of return
Attachment 4 – value of imputation credits
Attachment 5 – regulatory depreciation
Attachment 6 – capital expenditure
Attachment 7 – operating expenditure
Attachment 8 – corporate income tax
Attachment 9 – efficiency benefit sharing scheme
Attachment 10 – capital expenditure sharing scheme
Attachment 11 – service target performance incentive scheme
Attachment 12 – pricing methodology
Attachment 13 – pass through events
Attachment 14 – negotiated services

1-3 Attachment 1 – Maximum allowed revenue | Draft decision: AusNet Serices transmission determination
2017–22
Contents
Note ...............................................................................................................1-2
Contents .......................................................................................................1-3
Shortened forms ..........................................................................................1-4
1 Maximum allowed revenue ...................................................................1-6
1.1 Draft decision ..................................................................................1-6
1.2 AusNet Services’ proposal ............................................................1-7
1.3 AER’s assessment approach .........................................................1-8
1.3.1 The building block approach........................................................ 1-8
1.3.2 The building block costs ............................................................ 1-11
1.3.3 Annual revenue adjustment process ......................................... 1-11
1.3.4 Average transmission charges .................................................. 1-13
1.4 Reasons for draft decision ........................................................... 1-14
1.4.1 X factor, annual expected MAR and estimated total revenue cap1-15
1.4.2 Shared assets ........................................................................... 1-17
1.4.3 Indicative transmission charges and impact on electricity bills ... 1-19
1-4 Attachment 1 – Maximum allowed revenue | Draft decision: AusNet Serices transmission determination
2017–22
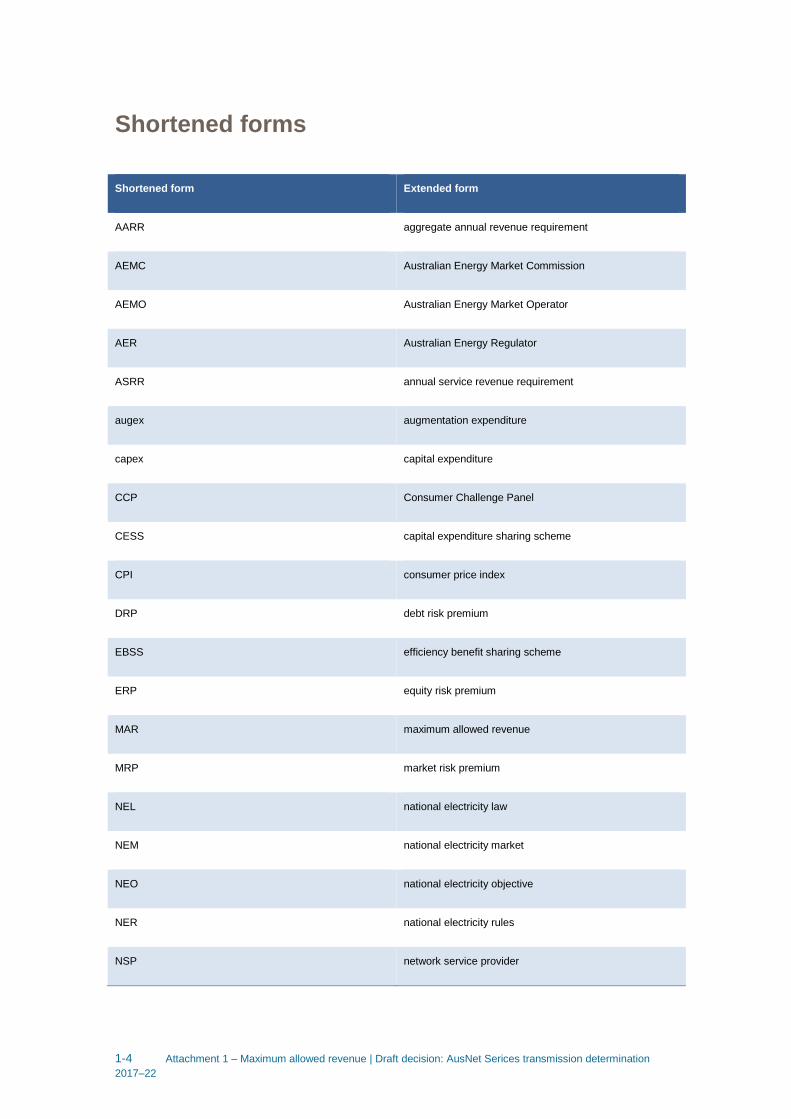
Shortened forms
Shortened form Extended form
AARR aggregate annual revenue requirement
AEMC Australian Energy Market Commission
AEMO Australian Energy Market Operator
AER Australian Energy Regulator
ASRR annual service revenue requirement
augex augmentation expenditure
capex capital expenditure
CCP Consumer Challenge Panel
CESS capital expenditure sharing scheme
CPI consumer price index
DRP debt risk premium
EBSS efficiency benefit sharing scheme
ERP equity risk premium
MAR maximum allowed revenue
MRP market risk premium
NEL national electricity law
NEM national electricity market
NEO national electricity objective
NER national electricity rules
NSP network service provider

1-5 Attachment 1 – Maximum allowed revenue | Draft decision: AusNet Serices transmission determination
2017–22
Shortened form Extended form
NTSC negotiated transmission service criteria
opex operating expenditure
PPI partial performance indicators
PTRM post-tax revenue model
RAB regulatory asset base
RBA Reserve Bank of Australia
repex replacement expenditure
RFM roll forward model
RIN regulatory information notice
RPP revenue and pricing principles
SLCAPM Sharpe-Lintner capital asset pricing model
STPIS service target performance incentive scheme
TNSP transmission network service provider
TUoS transmission use of system
WACC weighted average cost of capital

1-6 Attachment 1 – Maximum allowed revenue | Draft decision: AusNet Serices transmission determination
2017–22
1 Maximum allowed revenue
This attachment sets out the AER's draft decision on the maximum allowed revenue
(MAR) for the provision of prescribed transmission services for each year of AusNet
Services’ 2017–22 regulatory control period. Specifically, the attachment addresses:1
the estimated total revenue cap, which is the sum of the annual expected MAR
the annual building block revenue requirement
the annual expected MAR
the X factor.
We determine the TNSP's annual building block revenue requirement using a building
block approach. We determine the X factors by smoothing the annual building block
revenue requirement over the regulatory control period. The X factor is used in the
CPI–X methodology to determine the annual expected MAR (smoothed).
1.1 Draft decision
We do not accept AusNet Services’ proposed annual building block revenue
requirement, annual expected MAR and total revenue cap. For the reasons discussed
in the attachments to this draft determination, our decisions on AusNet Services’
proposed building block costs have a consequential impact on its annual building block
revenue requirement. We have calculated the X factor and the annual expected MAR
(smoothed) to reflect our draft decision on AusNet Services’ annual building block
revenue requirement.
We determine a total annual building block revenue requirement for AusNet Services
of $2694.3 million ($ nominal) for the 2017–22 regulatory control period. This is a
reduction of $463.3 million ($ nominal) or 14.7 per cent to AusNet Services’ proposal
and reflects the impact of our draft decisions on the various building block costs.
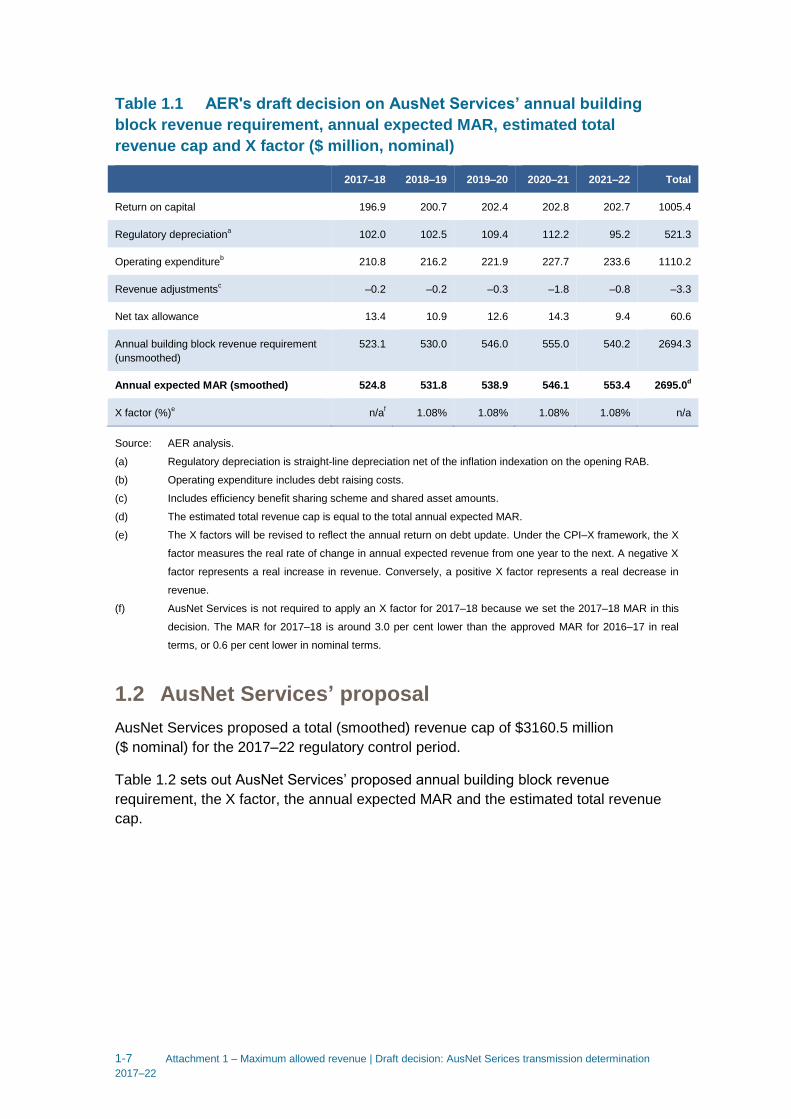
As a result of our smoothing of the annual building block revenue requirement, our
draft decision on the annual expected MAR and X factor for each regulatory year of the
2017–22 regulatory control period is set out in Table 1.1. Our draft decision is to
approve an estimated total revenue cap of $2695.0 million ($ nominal) for AusNet
Services for the 2017–22 regulatory control period. Our approved X factor for 2018–19
to 2021–22 is 1.08 per cent per annum.2
Table 1.1 sets out our draft decision on AusNet Services’ annual building block
revenue requirement, the X factor, the annual expected MAR and the estimated total
revenue cap for the 2017–22 regulatory control period.
1 NER, cll. 6A.4.2(a)(1)–(3), 6A.5.3(c) and 6A.6.8.
2 AusNet Services is not required to apply an X factor for 2017–18 because we set the 2017–18 MAR in this
decision.
1-7 Attachment 1 – Maximum allowed revenue | Draft decision: AusNet Serices transmission determination
2017–22
Table 1.1 AER's draft decision on AusNet Services’ annual building
block revenue requirement, annual expected MAR, estimated total
revenue cap and X factor ($ million, nominal)
2017–18 2018–19 2019–20 2020–21 2021–22 Total
Return on capital 196.9 200.7 202.4 202.8 202.7 1005.4
Regulatory depreciationa 102.0 102.5 109.4 112.2 95.2 521.3
Operating expenditureb
210.8 216.2 221.9 227.7 233.6 1110.2
Revenue adjustmentsc –0.2 –0.2 –0.3 –1.8 –0.8 –3.3
Net tax allowance 13.4 10.9 12.6 14.3 9.4 60.6
Annual building block revenue requirement
(unsmoothed)
523.1 530.0 546.0 555.0 540.2 2694.3
Annual expected MAR (smoothed) 524.8 531.8 538.9 546.1 553.4 2695.0d
X factor (%)e n/a
f 1.08% 1.08% 1.08% 1.08% n/a
Source: AER analysis.
(a) Regulatory depreciation is straight-line depreciation net of the inflation indexation on the opening RAB.
(b) Operating expenditure includes debt raising costs.
(c) Includes efficiency benefit sharing scheme and shared asset amounts.
(d) The estimated total revenue cap is equal to the total annual expected MAR.
(e) The X factors will be revised to reflect the annual return on debt update. Under the CPI–X framework, the X
factor measures the real rate of change in annual expected revenue from one year to the next. A negative X
factor represents a real increase in revenue. Conversely, a positive X factor represents a real decrease in
revenue.
(f) AusNet Services is not required to apply an X factor for 2017–18 because we set the 2017–18 MAR in this
decision. The MAR for 2017–18 is around 3.0 per cent lower than the approved MAR for 2016–17 in real
terms, or 0.6 per cent lower in nominal terms.
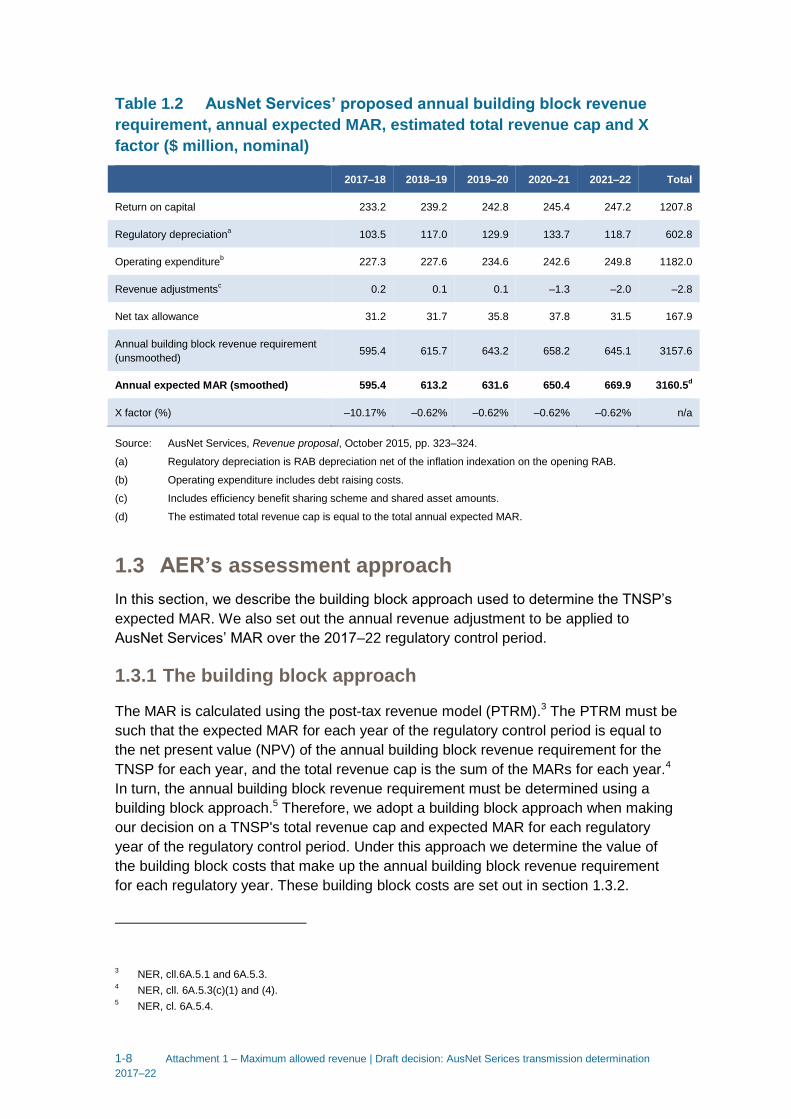
1.2 AusNet Services’ proposal
AusNet Services proposed a total (smoothed) revenue cap of $3160.5 million
($ nominal) for the 2017–22 regulatory control period.
Table 1.2 sets out AusNet Services’ proposed annual building block revenue
requirement, the X factor, the annual expected MAR and the estimated total revenue
cap.
1-8 Attachment 1 – Maximum allowed revenue | Draft decision: AusNet Serices transmission determination
2017–22
Table 1.2 AusNet Services’ proposed annual building block revenue
requirement, annual expected MAR, estimated total revenue cap and X
factor ($ million, nominal)
2017–18 2018–19 2019–20 2020–21 2021–22 Total
Return on capital 233.2 239.2 242.8 245.4 247.2 1207.8
Regulatory depreciationa 103.5 117.0 129.9 133.7 118.7 602.8
Operating expenditureb
227.3 227.6 234.6 242.6 249.8 1182.0
Revenue adjustmentsc
0.2 0.1 0.1 –1.3 –2.0 –2.8
Net tax allowance 31.2 31.7 35.8 37.8 31.5 167.9
Annual building block revenue requirement
(unsmoothed) 595.4 615.7 643.2 658.2 645.1 3157.6
Annual expected MAR (smoothed) 595.4 613.2 631.6 650.4 669.9 3160.5d
X factor (%) –10.17% –0.62% –0.62% –0.62% –0.62% n/a
Source: AusNet Services, Revenue proposal, October 2015, pp. 323–324.
(a) Regulatory depreciation is RAB depreciation net of the inflation indexation on the opening RAB.
(b) Operating expenditure includes debt raising costs.
(c) Includes efficiency benefit sharing scheme and shared asset amounts.
(d) The estimated total revenue cap is equal to the total annual expected MAR.
1.3 AER’s assessment approach
In this section, we describe the building block approach used to determine the TNSP’s
expected MAR. We also set out the annual revenue adjustment to be applied to
AusNet Services’ MAR over the 2017–22 regulatory control period.
1.3.1 The building block approach
The MAR is calculated using the post-tax revenue model (PTRM).3 The PTRM must be
such that the expected MAR for each year of the regulatory control period is equal to
the net present value (NPV) of the annual building block revenue requirement for the
TNSP for each year, and the total revenue cap is the sum of the MARs for each year.4
In turn, the annual building block revenue requirement must be determined using a
building block approach.5 Therefore, we adopt a building block approach when making
our decision on a TNSP's total revenue cap and expected MAR for each regulatory
year of the regulatory control period. Under this approach we determine the value of
the building block costs that make up the annual building block revenue requirement
for each regulatory year. These building block costs are set out in section 1.3.2.
3 NER, cll.6A.5.1 and 6A.5.3.
4 NER, cll. 6A.5.3(c)(1) and (4).
5 NER, cl. 6A.5.4.
1-9 Attachment 1 – Maximum allowed revenue | Draft decision: AusNet Serices transmission determination
2017–22
We developed the PTRM, which brings together the various building block costs and
calculates the annual building block revenue requirement for each year of the
regulatory control period.6 The PTRM also calculates the X factors required under the
CPI–X methodology which is used to escalate the MAR for each year (other than the
first year) of the regulatory control period.7 Using the X factors and annual building
block revenue requirement, the annual expected MAR (smoothed) is forecast for each
year of the regulatory control period. A TNSP’s revenue proposal must be prepared
using our PTRM.8
The annual building block revenue requirement can be lumpy over the regulatory
control period. To minimise price shocks, revenues are smoothed within a regulatory
control period while maintaining the principle of cost recovery under the building block
approach. Smoothing requires diverting some of the cost recovery to adjacent years
within the regulatory control period so that the NPV of the annual expected MAR
(smoothed revenues) is equal to the NPV of the annual building block revenue
requirement (unsmoothed revenues). That is, a smoothed profile of the expected MAR
is determined for the regulatory control period under the CPI–X methodology.
The expected MAR for the first year is generally set equal to the annual building block
revenue requirement for the first year of the regulatory control period. It may be
appropriate to set the expected MAR for the first year to align with the MAR from the
last year of the previous regulatory control period to avoid any large revenue variation
between periods (or P0):9
MAR1 = AR1 or MARL
where:
MAR1 = the maximum allowed revenue for year 1 of the next regulatory
control period
AR1 = the annual building block revenue requirement for year 1 of the next
regulatory control period
MARL ~ the maximum allowed revenue for the last year of the previous
regulatory control period.
To enable the formula for the annual revenue adjustment process (discussed below in
section 1.3.3) to operate correctly, we will refer to the MAR determined in this decision
using the building block costs as the allowed revenue (AR). This is because the
expected MAR determined using the building block costs do not incorporate
6 NER, cl. 6A.5.
7 NER, cll. 6A.5.3 and 6A.6.8.
8 NER, cl. 6A.5.1(a).
9 The MAR for year 1 of the next regulatory control period may include adjustment for the performance incentive that
applied during the previous regulatory control period, and under or over recovery adjustments from previous
regulatory years.

1-10 Attachment 1 – Maximum allowed revenue | Draft decision: AusNet Serices transmission determination
2017–22
performance incentive scheme revenue adjustments and pass through amounts that
may apply to each regulatory year.
In this determination we first calculate annual building block revenue requirements for
each year of the 2017–22 regulatory control period. To do this we consider the various
costs facing the TNSP and the trade-offs and interactions between these costs, service
quality and across years. This reflects the AER's holistic assessment of the TNSP's
proposal.
We understand the trade-offs that occur between building block costs and test the
sensitivity of these costs to their various driver elements. These trade-offs are
discussed in the interrelationships section of the various attachments to this draft
decision and are reflected in the calculations made in the PTRM developed by the
AER.10 Such understanding allows the AER to exercise judgement in determining the
final inputs into the PTRM and the annual building block revenue requirements that
result from this modelling.
Having determined the total annual building block revenue requirement for the
2017–22 regulatory control period, the annual building block revenue requirements for
each regulatory year are smoothed across that period to reduce revenue variations
between years and to come up with the expected MAR for each year. This is done
through the determination of the X factors.11 The X factors must equalise (in NPV
terms) the total expected revenue cap to be earned by the TNSP with the total building
block revenue requirement for the 2017–22 regulatory control period.12 The X factor
must minimise, as far as reasonably possible, the variance between the expected MAR
and annual building block revenue requirement for the last regulatory year of the
period.13 We therefore consider a divergence of up to 3 per cent between the expected
MAR and annual building block revenue requirement for the last year of the regulatory
control period is reasonable, if this can promote smoother price changes over the
regulatory control period.
The building block costs (and the elements that drive those costs) used to determine
the unsmoothed annual building block revenue requirements are set out below.
10
There are trade-offs that are not modelled in the PTRM but are reflected in the inputs to the PTRM. For example,
service quality is not explicitly modelled in the PTRM, but the trade-offs between service quality and price are
reflected in the forecast capex and opex inputs to the model. Other trade-offs are obvious from the calculations in
the PTRM. For example, while someone may expect a lower regulatory asset base to also lower revenues, the
PTRM shows that this will not occur if the reduction in the regulatory asset base is due solely to an increase in the
depreciation rate. In such circumstances, revenues increase as the increased depreciation allowance more than
offsets the reduction in the return on capital caused by the lower regulatory asset base. 11
NER, cl. 6A.6.8(a). 12
NER, cl. 6A.6.8(c)(1). 13
NER, cl. 6A.6.8(c)(2).
1-11 Attachment 1 – Maximum allowed revenue | Draft decision: AusNet Serices transmission determination
2017–22
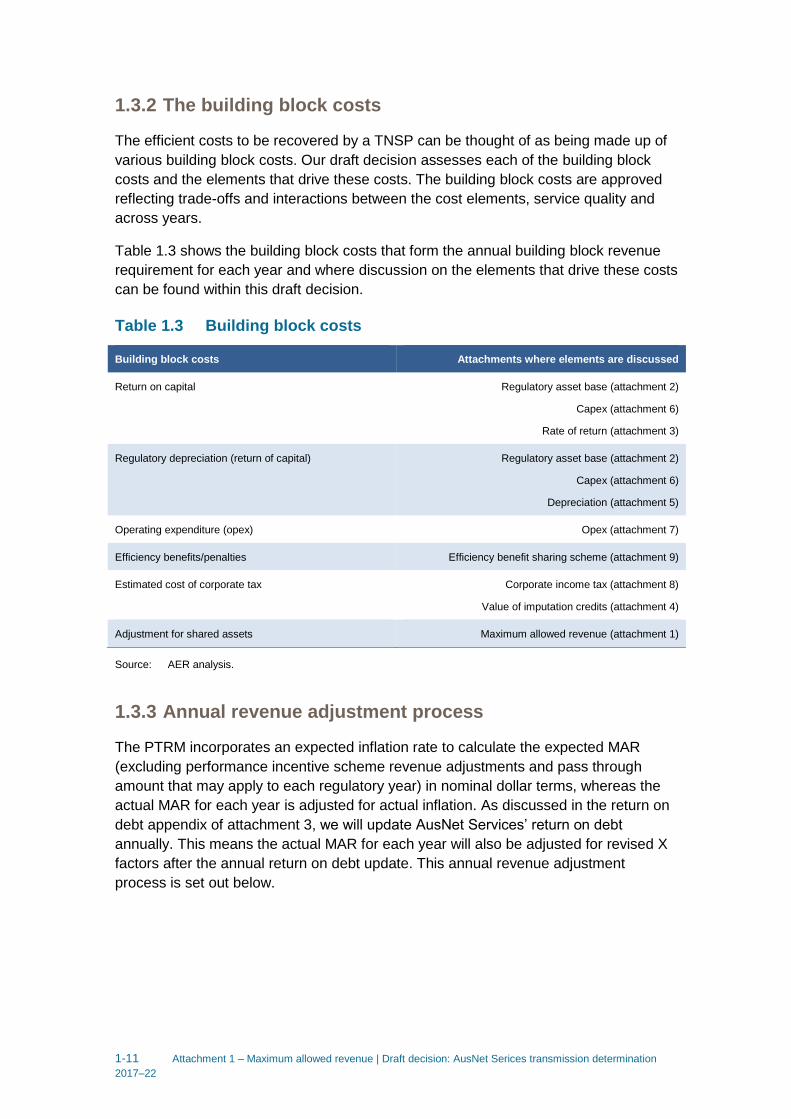
1.3.2 The building block costs
The efficient costs to be recovered by a TNSP can be thought of as being made up of
various building block costs. Our draft decision assesses each of the building block
costs and the elements that drive these costs. The building block costs are approved
reflecting trade-offs and interactions between the cost elements, service quality and
across years.
Table 1.3 shows the building block costs that form the annual building block revenue
requirement for each year and where discussion on the elements that drive these costs
can be found within this draft decision.
Table 1.3 Building block costs
Building block costs Attachments where elements are discussed
Return on capital Regulatory asset base (attachment 2)
Capex (attachment 6)
Rate of return (attachment 3)
Regulatory depreciation (return of capital) Regulatory asset base (attachment 2)
Capex (attachment 6)
Depreciation (attachment 5)
Operating expenditure (opex) Opex (attachment 7)
Efficiency benefits/penalties Efficiency benefit sharing scheme (attachment 9)
Estimated cost of corporate tax Corporate income tax (attachment 8)
Value of imputation credits (attachment 4)
Adjustment for shared assets Maximum allowed revenue (attachment 1)
Source: AER analysis.
1.3.3 Annual revenue adjustment process
The PTRM incorporates an expected inflation rate to calculate the expected MAR
(excluding performance incentive scheme revenue adjustments and pass through
amount that may apply to each regulatory year) in nominal dollar terms, whereas the
actual MAR for each year is adjusted for actual inflation. As discussed in the return on
debt appendix of attachment 3, we will update AusNet Services’ return on debt
annually. This means the actual MAR for each year will also be adjusted for revised X
factors after the annual return on debt update. This annual revenue adjustment
process is set out below.

1-12 Attachment 1 – Maximum allowed revenue | Draft decision: AusNet Serices transmission determination
2017–22
The MAR for the subsequent year of the regulatory control period requires an annual
adjustment based on the previous year’s allowed revenue.14 That is, the subsequent
year’s allowed revenue is determined by adjusting the previous year’s allowed revenue
for actual inflation and the X factor determined after the annual return on debt update:
ARt = AR𝑡−1 × (1 + ∆CPI) × (1 − X𝑡)
where:
AR = the allowed revenue
t = time period/financial year (for t = 2 (2018–19), 3 (2019–20),
4 (2020–21), 5 (2021–22))
∆CPI = the annual percentage change in the ABS Consumer price
index all groups, weighted average of eight capital cities
from September in year t – 2 to September in year t – 1
X = the smoothing factor determined in accordance with the
PTRM as approved in the AER's final decision, and
annually revised for the return on debt update in
accordance with the formula specified in the return on debt
appendix calculated for the relevant year.
The MAR is determined annually in accordance with the NER by adding to (or
deducting from) the allowed revenue:
the service target performance incentive scheme revenue increment (or revenue
decrement)15
any approved pass through amounts.16
Table 1.4 sets out the timing of the annual calculation of the AR and performance
incentive:
MARt = (allowed revenue) + (performance incentive) + (pass
through)
=
AR𝑡 + ((AR𝑡−2 ×3
12) + (AR𝑡−1 ×
9
12)) × S𝑐𝑡 + P𝑡
14
In the case of making the annual adjustment for year 2, the previous year's AR would be the same as the approved
smoothed revenue for year 1 as contained in the PTRM. 15
NER, cl. 6A.7.4. 16
NER, cll. 6A.7.2 and 6A.7.3.

1-13 Attachment 1 – Maximum allowed revenue | Draft decision: AusNet Serices transmission determination
2017–22
where:
MAR = the maximum allowed revenue
AR = the allowed revenue
S = the revenue increment or decrement determined in
accordance with the service target performance incentive
scheme
P = the pass through amount (positive or negative) that the
AER has determined in accordance with clauses 6A.7.2
and 6A.7.3 of the NER
t = time period/financial year (for t = 2 (2018–19), 3 (2019–20),
4 (2020–21), 5 (2021–22))
ct = time period/calendar year (for t = 2 (2017), 3 (2018), 4
(2019), 5 (2020)).
Under the NER, a TNSP may also adjust the MAR for under or over-recovery
amounts.17 That is, the revenue amounts recovered higher or lower than the approved
MAR for each year would be included in the subsequent year's MAR. In the case of an
under-recovery, the amount would be added to the future year's MAR. In the case of
an over-recovery, the amount would be subtracted from the future year's MAR.
Table 1.4 Timing of the calculation of allowed revenues and the
performance incentive for AusNet Services
t Allowed revenue (financial year) ct Performance incentive (calendar year)
2 1 April 2018– 31 March 2019 2 1 January 2017– 31 December 2017
3 1 April 2019– 31 March 2020 3 1 January 2018– 31 December 2018
4 1 April 2020– 31 March 2021 4 1 January 2019– 31 December 2019
5 1 April 2021– 31 March 2022 5 1 January 2020– 31 December 2020
Note: The performance incentive for 1 January 2016–31 December 2016 is to be applied to the AR determined for
2017–18 (AR1).
1.3.4 Average transmission charges
The NER does not require an estimate of transmission charges for a revenue
determination of a TNSP. Nonetheless, we typically provide some indicative
transmission charges (and the resulting impact on annual electricity bills) flowing from
17
NER, cll 6A.23.3(c)(2)(iii) and 6A.24.4(c).

1-14 Attachment 1 – Maximum allowed revenue | Draft decision: AusNet Serices transmission determination
2017–22
the revenue determination as discussed in section 1.4.3. Although we assess AusNet
Services’ proposed pricing methodology as part of this determination, actual
transmission charges established at particular connection points are not determined by
us. AusNet Services establishes the transmission charges in accordance with its
approved pricing methodology and the NER.18
1.4 Reasons for draft decision
We determine a total annual building block revenue requirement of $2694.3 million
($ nominal) for AusNet Services for the 2017–22 regulatory control period. This
compares to AusNet Services’ proposed total annual building block revenue
requirement of $3157.6 million ($ nominal) for this period.
Figure 1.1 shows the building block components from our determination that make up
the annual building block revenue requirement for AusNet Services, and the
corresponding components from its proposal.
Figure 1.1 AER's draft decision and AusNet Services’ proposed annual
building block revenue requirement ($ million, nominal)
Source: AER analysis.
The most significant changes to AusNet Services' proposal include:
18
NER, cl. 6A.24.1(d).
-100
0
100
200
300
400
500
600
700
Pro
po
sed
AER
Pro
po
sed
AER
Pro
po
sed
AER
Pro
po
sed
AER
Pro
po
sed
AER
2017–18 2018–19 2019–20 2020–21 2021–22
Revenues($m,
nominal)
Return on capital Opex Depreciation Adjustments Tax

1-15 Attachment 1 – Maximum allowed revenue | Draft decision: AusNet Serices transmission determination
2017–22
a reduction in the return on capital allowance of 16.8 per cent (attachments 2 and
3)
a reduction in the regulatory depreciation allowance of 13.5 per cent (attachment 5)
a reduction in the capex allowance of 23.7 per cent (attachment 6)
a reduction in the opex allowance of 6.1 per cent (attachment 7)
a reduction in the cost of corporate income tax allowance of 63.9 per cent
(attachment 8).
1.4.1 X factor, annual expected MAR and estimated total
revenue cap
For this draft decision, we determine an X factor for AusNet Services of 1.08 per cent
per annum for the four years of the regulatory control period from 2018–19 to
2021–22.19 The NPV of the annual building block revenue requirement is
$2256.8 million ($ nominal) as at 1 April 2017. Based on this NPV and applying the
CPI–X method, we determine that the annual expected MAR (smoothed) for AusNet
Services increases from $524.8 million in 2017–18 to $553.4 million in 2021–22
($ nominal). The resulting estimated total revenue cap for AusNet Services is
$2695.0 million for the 2017–22 regulatory control period.
Figure 1.2 shows our draft decision on AusNet Services’ annual expected MAR
(smoothed revenue) and the annual building block revenue requirement (unsmoothed
revenue) for the 2017–22 regulatory control period.
19
AusNet Services is not required to apply an X factor for 2017–18 because we set the 2017–18 MAR in this
decision.
1-16 Attachment 1 – Maximum allowed revenue | Draft decision: AusNet Serices transmission determination
2017–22
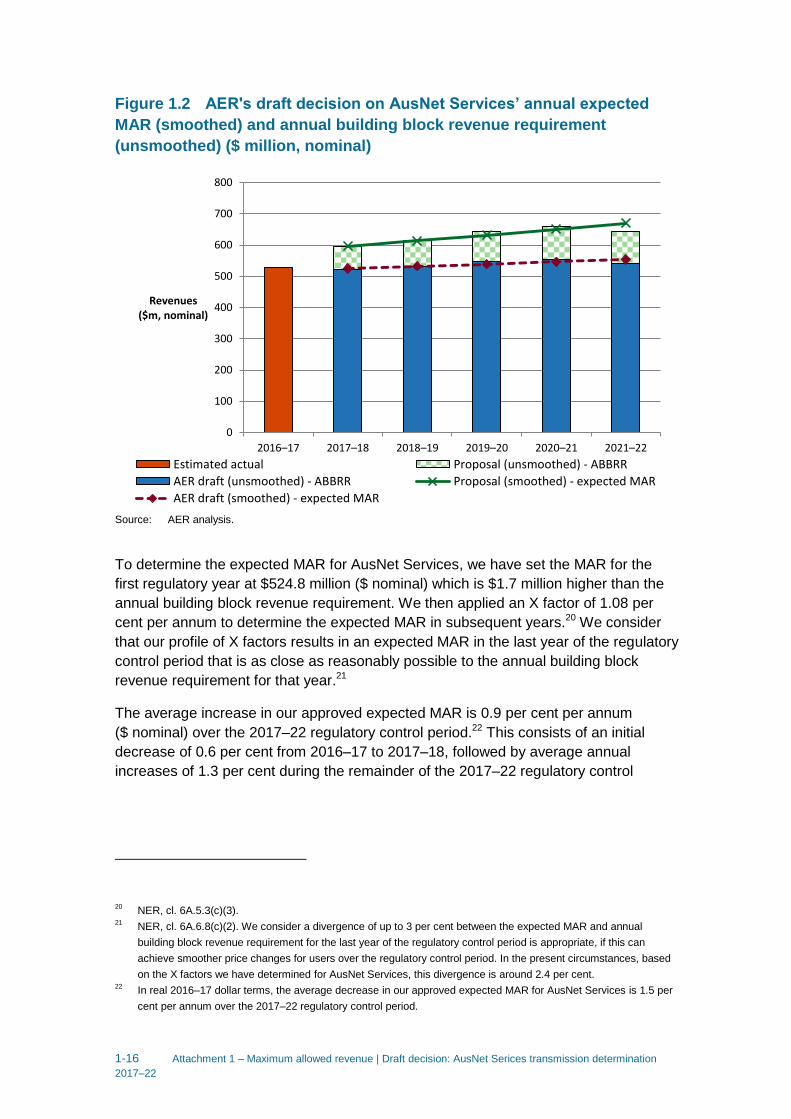
Figure 1.2 AER's draft decision on AusNet Services’ annual expected
MAR (smoothed) and annual building block revenue requirement
(unsmoothed) ($ million, nominal)
Source: AER analysis.
To determine the expected MAR for AusNet Services, we have set the MAR for the
first regulatory year at $524.8 million ($ nominal) which is $1.7 million higher than the
annual building block revenue requirement. We then applied an X factor of 1.08 per
cent per annum to determine the expected MAR in subsequent years.20 We consider
that our profile of X factors results in an expected MAR in the last year of the regulatory
control period that is as close as reasonably possible to the annual building block
revenue requirement for that year.21
The average increase in our approved expected MAR is 0.9 per cent per annum
($ nominal) over the 2017–22 regulatory control period.22 This consists of an initial
decrease of 0.6 per cent from 2016–17 to 2017–18, followed by average annual
increases of 1.3 per cent during the remainder of the 2017–22 regulatory control
20
NER, cl. 6A.5.3(c)(3). 21
NER, cl. 6A.6.8(c)(2). We consider a divergence of up to 3 per cent between the expected MAR and annual
building block revenue requirement for the last year of the regulatory control period is appropriate, if this can
achieve smoother price changes for users over the regulatory control period. In the present circumstances, based
on the X factors we have determined for AusNet Services, this divergence is around 2.4 per cent. 22
In real 2016–17 dollar terms, the average decrease in our approved expected MAR for AusNet Services is 1.5 per
cent per annum over the 2017–22 regulatory control period.
0
100
200
300
400
500
600
700
800
2016–17 2017–18 2018–19 2019–20 2020–21 2021–22
Revenues($m, nominal)
Estimated actual Proposal (unsmoothed) - ABBRR
AER draft (unsmoothed) - ABBRR Proposal (smoothed) - expected MAR
AER draft (smoothed) - expected MAR

1-17 Attachment 1 – Maximum allowed revenue | Draft decision: AusNet Serices transmission determination
2017–22
period.23 Our draft decision results in a decrease of 8.0 per cent in real terms ($2016–
17) to AusNet Services’ average annual allowed revenue relative to that in the 2014–
17 regulatory control period. This decrease is primarily because of a lower rate of
return and capex applied in this draft decision for the 2017–22 regulatory control period
than were approved in the 2014–17 determination.
Figure 1.3 compares our draft decision building blocks for AusNet Services’ 2017–22
regulatory control period with AusNet Services’ proposed revenue requirement for the
same period, and the approved revenue for the 2014–17 regulatory control period.
Figure 1.3 Annual average of AER's draft decision building blocks
compared to AusNet Services’ proposed revenue requirement and
approved revenue for 2014–17 ($ million, 2016–17)
Source: AER analysis.
1.4.2 Shared assets
Service providers, such as AusNet Services, may use assets to provide both
prescribed transmission services we regulate and unregulated services. These assets
are called 'shared assets'.24 Of the unregulated revenues a service provider earns from
23
In real 2016–17 dollar terms, this consists an initial decrease of 3.0 per cent from 2016–17 to 2017–18, followed by
subsequent average annual decreases of 1.1per cent during the remainder of the 2017–22 regulatory control
period. 24
NER, cl. 6A.5.5.
-100
0
100
200
300
400
500
600
700
Allowed average2014–17
Proposed average2017–22
Draft decision average2017–22
$millions,real
2016–17
Corporate tax
Revenue adjustments
Regulatory depreciation
Opex
Return on capital

1-18 Attachment 1 – Maximum allowed revenue | Draft decision: AusNet Serices transmission determination
2017–22
shared assets, 10 per cent will be used to reduce the service provider's prices for
prescribed transmission services.25
Shared asset revenue reductions are subject to a materiality threshold. Unregulated
use of shared assets is material when a service provider's unregulated revenues from
shared assets in a specific regulatory year are expected to be greater than 1 per cent
of its MAR for that regulatory year.26
AusNet Services submitted its shared asset unregulated revenues are forecast to be
between 2.5 to 3.0 per cent of its proposed total revenues in each year of the 2017–22
regulatory control period.27 AusNet Services therefore proposed reductions in its total
revenues for each year of that period.
We consider AusNet Services’ forecasts are reasonable, based on its reporting of
historical shared assets revenue and our assessment of this revenue source for other
service providers.28 However, AusNet Services’ forecast unregulated revenues must
now be compared to the regulated revenues we determine, rather than those proposed
by AusNet Services. Our draft decision sets lower expected MARs than AusNet
Services’ proposal, so we estimate that the unregulated revenues will be between 2.8
and 3.2 per cent of its expected MARs in each year of the 2017–22 regulatory control
period. We are satisfied that AusNet Services’ shared asset unregulated revenues
meet the materiality threshold in each year of the 2017–22 regulatory control period.
For this draft decision, we therefore apply a shared asset revenue adjustment as
shown in Table 1.5, consistent with the proposal from AusNet Services. The shared
asset revenue adjustment is a total reduction of $8.7 million ($ nominal) across the
2017–22 regulatory control period.
Table 1.5 AER's draft decision on AusNet Services’ shared asset
revenue adjustment ($million, nominal)
2017–18 2018–19 2019–20 2020–21 2021–22 Total
AusNet Services’ proposed shared asset
revenue adjustment –1.5 –1.6 –1.7 –1.8 –2.0 –8.7
AER draft decision shared asset revenue
adjustment –1.5 –1.6 –1.7 –1.8 –2.0 –8.7
Source: AusNet Services, Revenue proposal, October 2015, p. 151.
25
AER, Shared asset guideline, November 2013. 26
AER, Shared asset guideline, November 2013, p. 8. 27
AusNet Services, Revenue proposal, p. 150. 28
This was undertaken when we developed our shared asset guideline, during the 2013 calendar year, as part of our
Better Regulation work program.
1-19 Attachment 1 – Maximum allowed revenue | Draft decision: AusNet Serices transmission determination
2017–22
1.4.3 Indicative transmission charges and impact on electricity
bills
Our draft decision on AusNet Services' expected MAR ultimately affects the annual
electricity bills paid by customers in Victoria. There are several steps required to
translate our revenue decision into indicative transmission charges, and then to
estimate bill impact.
Since we regulate AusNet Services' prescribed transmission services under a revenue
cap, changes in the consumption of electricity will affect the transmission charges
ultimately paid by consumers. We estimate the indicative effect of our draft decision on
forecast average transmission charges in Victoria by:
taking AusNet Services' annual expected MAR determined in this draft decision,29
and
dividing it by the forecast annual energy delivered in Victoria.30
Based on this approach, we estimate that this draft decision will result in a modest
increase in annual average transmission charges from 2016–17 to 2021–22.31 Figure
1.4 shows the indicative average transmission charges resulting from this draft
decision compared with the average transmission charges from 2014 to 2017 in
nominal dollar terms. The average transmission charges are forecast to increase from
around $12.1 per MWh in 2016–17 to $12.3 per MWh in 2021–22.
29
This excludes the Murraylink portion of MAR allocated to Victorian customers. Historically, Murraylink’s MAR is
about 2.5 per cent of AusNet Services’ MAR. Murraylink’s reset for its next regulatory control period commences
from 1 July 2018. 30
AEMO, National electricity forecasting report for the national electricity market - Update, December 2015, table 3,
Medium; AEMO, Forecasting Dynamic Interface, available at: http://forecasting.aemo.com.au/. 31
On average, the draft decision transmission revenues will increase by 0.9 per cent ($ nominal) per annum from
2016–17 to 2021–22. The forecast energy delivered in Victoria will increase by an average of 0.6 per cent per
annum across that period. As a result, the indicative transmission charge will increase by 0.4 per cent ($ nominal)
per annum from 2016–17 to 2021–22.

1-20 Attachment 1 – Maximum allowed revenue | Draft decision: AusNet Serices transmission determination
2017–22
Figure 1.4 Indicative transmission price path from 2014–15 to 2021–22
for Victoria ($/MWh, nominal)
Source: AER analysis.
We then estimate the indicative impact of transmission charges on electricity bills. In
Victoria, transmission charges represent approximately 5 per cent on average of a
typical residential customer's annual electricity bill.32 This small percentage largely
explains the relatively modest average annual electricity bill impacts arising from our
draft decision. We expect that our draft decision will result in the transmission
component of the average residential customer's annual electricity bill in Victoria
remaining generally constant over the 2017–22 regulatory control period.
The transmission component of the average residential customer's annual electricity
bill in 2021–22 is expected to be only about $1 above the 2016–17 level. By
comparison, had we accepted AusNet Services’ proposal, the expected transmission
component of the average annual residential electricity bill in 2021–22 would increase
approximately $16 ($ nominal) or 1.2 per cent above the 2016–17 level.
Our estimated potential impact is based on the typical annual electricity usage of
4000 kWh per annum for a residential customer in Victoria.33 Customers with different
usage will experience different changes. We also note that there are other factors,
such as distribution network costs, wholesale and retail costs, which affect overall
electricity bills.
32
AusNet Services, Reset RIN – Table 7.6.1, October 2015. 33
ESCV, Energy Retailers Comparative Performance Report — Pricing 2014–15, January 2016, p. XIII.
0.0
2.0
4.0
6.0
8.0
10.0
12.0
14.0
16.0
$/MWh(nominal)
Actual Allowed Proposal Preliminary decision

1-21 Attachment 1 – Maximum allowed revenue | Draft decision: AusNet Serices transmission determination
2017–22
Similarly, for small business customers in Victoria—for which transmission charges
represent approximately 4 per cent of a typical annual electricity bill—we have
estimated the impact of our draft decision for two customer categories:34
Small business (flat)—representing small business customers on a flat tariff using
12 000 kWh per annum
Small business (TOU)—representing small business customers on a time-of-use
tariff using 40 000 kWh per annum.
We expect our draft decision will result in the transmission component of the average
small business (flat) customer's annual electricity bill in 2021–22 to be about $3
($ nominal) or 0.1 per cent above the 2016–17 level. By comparison, had we accepted
AusNet Services' proposal, the expected transmission component of the average
annual small business (flat) electricity bill in 2021–22 would increase approximately
$31 ($ nominal) or 0.9 per cent above the 2016–17 level. Likewise, the transmission
component of the average small business (TOU) customer's annual electricity bill in
2021–22 is expected to be about $8 ($ nominal) or 0.1 per cent above the 2016–17
level as a result of our draft decision. By comparison, had we accepted AusNet
Services' proposal, the expected transmission component of the average annual small
business (TOU) electricity bill in 2021–22 would increase approximately $76
($ nominal) or 0.9 per cent above the 2016–17 level.
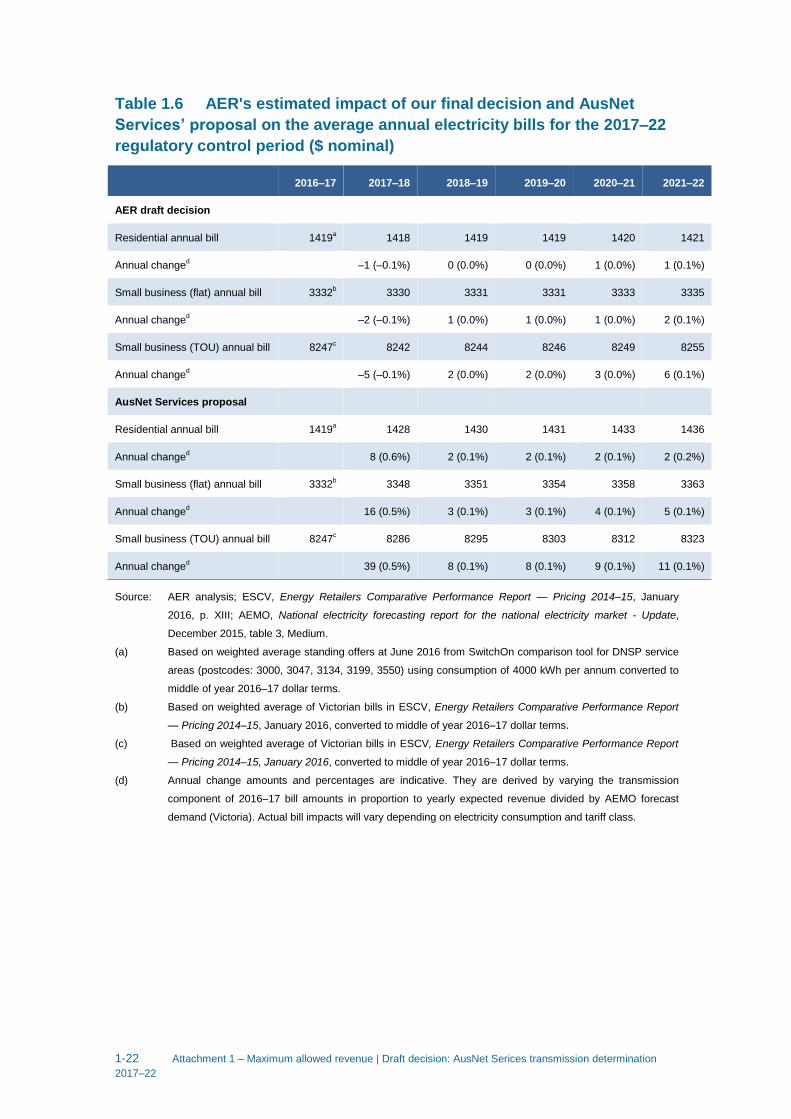
Table 1.6 shows our estimated impact of this draft decision over the 2017–22
regulatory control period compared with AusNet Services' proposal on the average
annual electricity bills for residential and small business customers in Victoria.
34
AusNet Services, Reset RIN – Table 7.6.1, October 2015.
1-22 Attachment 1 – Maximum allowed revenue | Draft decision: AusNet Serices transmission determination
2017–22
Table 1.6 AER's estimated impact of our final decision and AusNet
Services’ proposal on the average annual electricity bills for the 2017–22
regulatory control period ($ nominal)
2016–17 2017–18 2018–19 2019–20 2020–21 2021–22
AER draft decision
Residential annual bill 1419a 1418 1419 1419 1420 1421
Annual changed –1 (–0.1%) 0 (0.0%) 0 (0.0%) 1 (0.0%) 1 (0.1%)
Small business (flat) annual bill 3332b 3330 3331 3331 3333 3335
Annual changed –2 (–0.1%) 1 (0.0%) 1 (0.0%) 1 (0.0%) 2 (0.1%)
Small business (TOU) annual bill 8247c 8242 8244 8246 8249 8255
Annual changed –5 (–0.1%) 2 (0.0%) 2 (0.0%) 3 (0.0%) 6 (0.1%)
AusNet Services proposal
Residential annual bill 1419a 1428 1430 1431 1433 1436
Annual changed 8 (0.6%) 2 (0.1%) 2 (0.1%) 2 (0.1%) 2 (0.2%)
Small business (flat) annual bill 3332b 3348 3351 3354 3358 3363
Annual changed 16 (0.5%) 3 (0.1%) 3 (0.1%) 4 (0.1%) 5 (0.1%)
Small business (TOU) annual bill 8247c 8286 8295 8303 8312 8323
Annual changed 39 (0.5%) 8 (0.1%) 8 (0.1%) 9 (0.1%) 11 (0.1%)
Source: AER analysis; ESCV, Energy Retailers Comparative Performance Report — Pricing 2014–15, January
2016, p. XIII; AEMO, National electricity forecasting report for the national electricity market - Update,
December 2015, table 3, Medium.
(a) Based on weighted average standing offers at June 2016 from SwitchOn comparison tool for DNSP service
areas (postcodes: 3000, 3047, 3134, 3199, 3550) using consumption of 4000 kWh per annum converted to
middle of year 2016–17 dollar terms.
(b) Based on weighted average of Victorian bills in ESCV, Energy Retailers Comparative Performance Report
— Pricing 2014–15, January 2016, converted to middle of year 2016–17 dollar terms.
(c) Based on weighted average of Victorian bills in ESCV, Energy Retailers Comparative Performance Report
— Pricing 2014–15, January 2016, converted to middle of year 2016–17 dollar terms.
(d) Annual change amounts and percentages are indicative. They are derived by varying the transmission
component of 2016–17 bill amounts in proportion to yearly expected revenue divided by AEMO forecast
demand (Victoria). Actual bill impacts will vary depending on electricity consumption and tariff class.