DRAFT CONTENT FOR 2018-2028 CONSULTATION … · that enhance the well-being of Maori and the wider...
30
Doc #117889855 DRAFT CONTENT FOR 2018-2028 CONSULTATION DOCUMENT COMMUNITY AND SERVICES ............................................................................................................................. 2 Community partnerships ............................................................................................................................... 2 Governance ................................................................................................................................................... 3 Iwi Maori participation .................................................................................................................................. 4 Planning and reporting .................................................................................................................................. 4 WAIKATO CIVIL DEFENCE EMERGENCY MANAGEMENT GROUP ...................................................................... 6 REGIONAL HAZARDS AND EMERGENCY RESPONSE .......................................................................................... 8 Resilient development ................................................................................................................................... 8 WRC emergency response ............................................................................................................................. 9 Flood protection .......................................................................................................................................... 10 Land drainage .............................................................................................................................................. 11 River management ...................................................................................................................................... 12 Biodiversity .................................................................................................................................................. 14 Biosecurity ................................................................................................................................................... 15 Catchment planning and management ....................................................................................................... 17 Land management advisory services........................................................................................................... 18 PUBLIC TRANSPORT ......................................................................................................................................... 20 RESOURCE USE ................................................................................................................................................ 22 Consent processing and compliance ........................................................................................................... 22 Investigations and incident response .......................................................................................................... 23 Maritime services ........................................................................................................................................ 24 SCIENCE AND STRATEGY .................................................................................................................................. 25 Environmental monitoring .......................................................................................................................... 25 Environmental science and information ..................................................................................................... 26 Social and economic information ................................................................................................................ 27 Integration and infrastructure ..................................................................................................................... 28 Regional strategy and development ........................................................................................................... 29 Resource management policy ..................................................................................................................... 29
Transcript of DRAFT CONTENT FOR 2018-2028 CONSULTATION … · that enhance the well-being of Maori and the wider...

Doc #117889855
DRAFT CONTENT FOR 2018-2028 CONSULTATION DOCUMENT
COMMUNITY AND SERVICES ............................................................................................................................. 2
Community partnerships ............................................................................................................................... 2
Governance ................................................................................................................................................... 3
Iwi Maori participation .................................................................................................................................. 4
Planning and reporting .................................................................................................................................. 4
WAIKATO CIVIL DEFENCE EMERGENCY MANAGEMENT GROUP ...................................................................... 6
REGIONAL HAZARDS AND EMERGENCY RESPONSE .......................................................................................... 8
Resilient development ................................................................................................................................... 8
WRC emergency response ............................................................................................................................. 9
Flood protection .......................................................................................................................................... 10
Land drainage .............................................................................................................................................. 11
River management ...................................................................................................................................... 12
Biodiversity .................................................................................................................................................. 14
Biosecurity ................................................................................................................................................... 15
Catchment planning and management ....................................................................................................... 17
Land management advisory services........................................................................................................... 18
PUBLIC TRANSPORT ......................................................................................................................................... 20
RESOURCE USE ................................................................................................................................................ 22
Consent processing and compliance ........................................................................................................... 22
Investigations and incident response .......................................................................................................... 23
Maritime services ........................................................................................................................................ 24
SCIENCE AND STRATEGY .................................................................................................................................. 25
Environmental monitoring .......................................................................................................................... 25
Environmental science and information ..................................................................................................... 26
Social and economic information ................................................................................................................ 27
Integration and infrastructure ..................................................................................................................... 28
Regional strategy and development ........................................................................................................... 29
Resource management policy ..................................................................................................................... 29
Doc # 11788985 Page 2
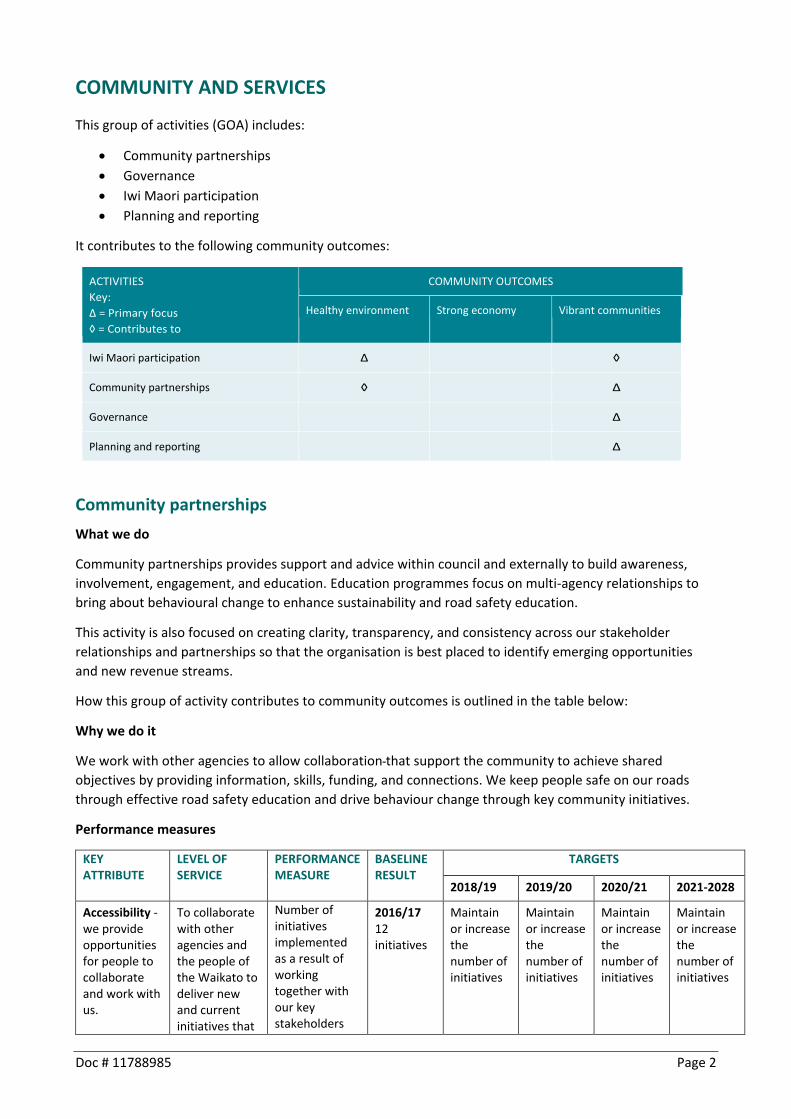
COMMUNITY AND SERVICES
This group of activities (GOA) includes:
Community partnerships
Governance
Iwi Maori participation
Planning and reporting
It contributes to the following community outcomes:
ACTIVITIES
Key:
∆ = Primary focus
◊ = Contributes to
COMMUNITY OUTCOMES
Healthy environment Strong economy Vibrant communities
Iwi Maori participation ∆ ◊
Community partnerships ◊ ∆
Governance ∆
Planning and reporting ∆
Community partnerships
What we do
Community partnerships provides support and advice within council and externally to build awareness,
involvement, engagement, and education. Education programmes focus on multi-agency relationships to
bring about behavioural change to enhance sustainability and road safety education.
This activity is also focused on creating clarity, transparency, and consistency across our stakeholder
relationships and partnerships so that the organisation is best placed to identify emerging opportunities
and new revenue streams.
How this group of activity contributes to community outcomes is outlined in the table below:
Why we do it
We work with other agencies to allow collaboration that support the community to achieve shared
objectives by providing information, skills, funding, and connections. We keep people safe on our roads
through effective road safety education and drive behaviour change through key community initiatives.
Performance measures
KEY ATTRIBUTE
LEVEL OF SERVICE
PERFORMANCE MEASURE
BASELINE RESULT
TARGETS
2018/19 2019/20 2020/21 2021-2028
Accessibility - we provide opportunities for people to collaborate and work with us.
To collaborate with other agencies and the people of the Waikato to deliver new and current initiatives that
Number of initiatives implemented as a result of working together with our key stakeholders
2016/17 12 initiatives
Maintain or increase the number of initiatives
Maintain or increase the number of initiatives
Maintain or increase the number of initiatives
Maintain or increase the number of initiatives

Doc # 11788985 Page 3
KEY ATTRIBUTE
LEVEL OF SERVICE
PERFORMANCE MEASURE
BASELINE RESULT
TARGETS
2018/19 2019/20 2020/21 2021-2028
achieve economic, environmental and social outcomes.
and partners to achieve mutually beneficial outcomes.
Governance What we do
The governance activity supports the chairman and councillors in their roles, ensures council processes
such as triennial elections and meetings are run correctly, and decision making processes are robust and
transparent. This includes working in partnerships and collaboratively by providing for iwi, community and
key stakeholder representation on the council’s standing subcommittees and councillor representation on
other local government, key stakeholder and community groups.
Maintaining the integrity of the council’s processes is also supported by the provision of timely and
appropriate responses to official information requests and Ombudsmen’s office enquiries.
Why we do it
This activity aims to support elected members in their roles and to make robust decisions that promote
community wellbeing and manage the region’s natural resources in a sustainable way. Good decision
making requires high quality evidence and open and transparent processes that encourage participation.
This activity also ensures the purpose and principles of local government as prescribed in the Local
Government Act 2002 are met.
Performance measures
KEY ATTRIBUTE
LEVEL OF SERVICE
PERFORMANCE MEASURES
BASELINE RESULT
TARGETS
2018/19 2019/20 2020/21 2021-2028
Accessibility - Our services are accessible for our communities in relation to accessing information that relates to council decision making.
To provide and promote governance processes that are robust and transparent for the regional community
Percentage of official information requests responded to within statutory timeframes
2016/17 100%
100% 100% 100% 100%
Percentage of council agendas that are publicly available two working days or more before the meeting
2016/17 100%
100% 100% 100% 100%

Doc # 11788985 Page 4
Iwi Maori participation
What we do
We build council’s capability and confidence to effectively partner with iwi Māori. By strengthening these
relationships we increase the ability of iwi Māori to meaningfully participate in mutually beneficial
collaborative initiatives.
Why we do it
This activity enables more effective and efficient decisions and creates more robust and lasting solutions
that enhance the well-being of Maori and the wider community.
Performance measures
KEY ATTRIBUTE
LEVEL OF SERVICE
PERFORMANCE MEASURE
BASELINE RESULT
TARGETS
2018/19 2019/20 2020/21 2021-2028
Accessibility - the ease with which Iwi/Maori can engage with council.
To support a treaty based partnership approach in our engagement with Iwi Maori
Completion of key actions identified in the Maori Partnership Approach
New measure
Number of actions completed as per schedule
Number of actions completed as per schedule
Number of actions completed as per schedule
Number of actions completed as per schedule
Planning and reporting
What we do
This activity includes the development of statutory plans and reports required by the Local Government Act
2002 to improve transparency and accountability to our community, principally our residents and
ratepayers. These include long term plans, annual plans and annual reports.
Why we do it
Readily accessible and easily understood information is provided so that communities have the opportunity
to participate in decisions about our region. We report back to the community through the annual report
which allows the community to assess whether council’s policies and services achieve their intended
objectives.
Performance measures
KEY ATTRIBUTE
LEVEL OF SERVICE
PERFORMANCE MEASURE
BASELINE RESULT
TARGETS
2018/19 2019/20 2020/21 2021-2028
Quality - Legislative documents are fit for purpose and of a high standard (audited).
To produce high quality and fit for purpose long term plans and amendments to long term plans to encourage participation
Long term plans and amendments to long term plans receive ‘unmodified’ audit opinions
2016/17 Unmodified opinion received
Unmodified opinion received
Unmodified opinion received
Unmodified opinion received
Unmodified opinion received

Doc # 11788985 Page 5
KEY ATTRIBUTE
LEVEL OF SERVICE
PERFORMANCE MEASURE
BASELINE RESULT
TARGETS
2018/19 2019/20 2020/21 2021-2028
in decision making by the regional community

Doc # 11788985 Page 6
WAIKATO CIVIL DEFENCE EMERGENCY MANAGEMENT GROUP
This GOA includes one activity – Waikato Civil Defence Emergency Management (CDEM) Group.
It contributes to the following community outcomes:
ACTIVITIES
Key:
∆ = Primary focus
◊ = Contributes to
COMMUNITY OUTCOMES
Healthy environment Strong economy Vibrant communities
Waikato CDEM Group ∆
What we do
The Waikato CDEM Group is responsible for delivering on the 4 Rs, readiness, response, reduction and
recovery. The Group Emergency Management Office (GEMO), administered by Waikato Regional Council,
coordinates all activities but takes direction from the CDEM Joint Committee, an elected body representing
all councils.
This activity includes facilitation of community, organisational and business readiness; the provision of an
appropriate emergency response and coordination capability; identification and promotion of reduction
activities that ultimately reduce the impacts on our communities from an emergency; and the coordination
of recovery efforts to ensure the best outcome for the community. In addition, the GEMO has an
operational role of coordinating regional or more complex emergencies.
Why we do it
Through strategic planning and the provision of technical advice and services, the GEMO supports
operational level planning to ensure that local CDEM organisations and the community have the capacity
and capability to respond to and recover from an emergency.
Performance measures
KEY ATTRIBUTE
LEVEL OF SERVICE PERFORMANCE MEASURES
BASELINE RESULT
TARGETS
2018/19 2019/20 2020/21
2021-2028
Accessibility: our services are easy for people to use especially in the instance of an ‘event’ occurring.
Quality: CDEM plan is accurate and compliant
To provide the community with a region-wide coordinated response from government, NGOs and community based responders in the event of a civil defence emergency to reduce the impact on people and the economy
The time taken for the Group Emergency Coordination Centre to be activated in response to a civil defence event/ emergency
2016/17 ≤30 mins during business hours
≤60 minutes after hours
≤30 mins during business hours
≤60 minutes after hours
≤30 mins during business hours
≤60 minutes after hours
≤30 mins during business hours
≤60 minutes after hours
≤30 mins during business hours
≤60 minutes after hours
The operative Group CDEM Plan is reviewed within statutory timeframes
2016/17 2016 - 2021 Group Plan
No assessment due
5 year Ministry of Civil Defence and Emergency Managem
New plan sent to MCDEM by end of 2020
2021/22 - 2023/24, 2027/28, 2028/29
No assessment due

Doc # 11788985 Page 7
KEY ATTRIBUTE
LEVEL OF SERVICE PERFORMANCE MEASURES
BASELINE RESULT
TARGETS
2018/19 2019/20 2020/21
2021-2028
ent (MCDEM) capability review or similar completed
2024/25
5 year MCDEM capability review or similar completed
2025/26
New plan sent to MCDEM by end of full year

Doc # 11788985 Page 8
REGIONAL HAZARDS AND EMERGENCY RESPONSE
This GOA includes two activities:
Resilient development
WRC emergency response
It contributes to the following community outcomes:
ACTIVITIES
Key:
∆ = Primary focus
◊ = Contributes to
COMMUNITY OUTCOMES
Healthy environment Strong economy Vibrant communities
WRC emergency response ∆
Resilient development ∆
Resilient development
What we do
Resilient development involves the collection and provision of strategic information and advice to district
councils, the Waikato Civil Defence and Emergency Management Group and landowners on a range of
hazards. The information is used to help identify the region’s areas most at risk from hazard events, and to
minimise risk and damage to people, homes, businesses, and infrastructure. This ensures communities can
prepare for or avoid hazards so that risks are reduced over time, and that sound decisions are made about
the future development of hazard prone areas.
Why we do it
The provision of natural hazard information allows communities to make better decisions on managing
existing and proposed development to minimise risk and damage to people, homes, businesses, and
infrastructure.
Performance measures
KEY ATTRIBUTES LEVELS OF SERVICE
PERFORMANCE MEASURES
BASELINE RESULTS
TARGETS
2018/19 2019/20 2020/21 2021-2028
Reliability / responsiveness WRC provides sound and timely advice to communities and our stakeholders.
To provide technical support to the Waikato CDEM Group to enable resilient Waikato communities
Percentage of agreed Waikato CDEM Group requests responded to within specified timeframes
New measure
100% 100% 100% 100%
Accessibility - our strategic data and advice is easily accessible to communities and stakeholders.
To provide hazard information to communities and stakeholders to
Provide relevant and up-to-date hazard information to communities and stakeholders via
New measure
Data updated quarterly
Data updated quarterly
Data updated quarterly
Data updated quarterly

Doc # 11788985 Page 9
KEY ATTRIBUTES LEVELS OF SERVICE
PERFORMANCE MEASURES
BASELINE RESULTS
TARGETS
2018/19 2019/20 2020/21 2021-2028
ensure they are well informed
the online hazards portal
WRC emergency response
What we do
The Waikato Regional Council emergency response activity provides strategic regional hazard information
and advice to key stakeholders, prepares for and responds to marine oil spills, flood events and other
natural hazard events. Support is provided to Waikato CDEM Group during a natural hazard event.
Why we do it
To ensure that arrangements, standards and processes for emergency response is in place and that
emergency management staff have the capability and resources to respond to an emergency event
ensuring the best outcome for the community.
Performance measures
KEY ATTRIBUTES
LEVELS OF SERVICES
PERFORMANCE MEASURES
BASELINE RESULTS
TARGETS
2018/19 2019/20 2020/21 2021-2028
Customer service - customers receive timely advise on river levels during flood events
To provide the community with timely flood event information and situation reports and to respond effectively to flood events to lessen the adverse effects
Percentage of customers satisfied with the Waikato Regional Council’s flood warning service (source: contact database survey)
2016/17 93%
90% 90% 90% 90%
Reliability/ responsiveness - support is provided to CDEM during an emergency, and we maintain the Regional Marine Oil Spill Contingency Plan to ensure we can respond during an event.
To reduce the environmental impact of marine oil spills by having a safe, coordinated and effective plan in place and maintain an effective readiness to respond
A marine oil spill plan is in place and two exercises are undertaken per year
2016/17 Plan in place and two exercises undertaken
Plan in place and two exercises undertaken
Plan in place and two exercises undertaken
Plan in place and two exercises undertaken
Plan in place and two exercises undertaken

Doc # 11788985 Page 10
FLOOD PROTECTION AND CONTROL WORKS
This GOA includes three activities:
Flood protection
Land drainage
River management
It contributes to the following community outcomes:
ACTIVITIES
Key:
∆ = Primary focus
◊ = Contributes to
COMMUNITY OUTCOMES
Healthy environment Strong economy Vibrant communities
Flood protection ◊ ∆
Land drainage ◊ ∆
River management ∆ ◊
Flood protection
What we do
The flood protection activity reduces the likelihood that flooding will impact our communities by
establishing, maintaining and renewing flood protection infrastructure such as stopbanks, floodgates and
pump stations. This infrastructure is designed to meet levels of service that are agreed with the community,
and is maintained by a programme of regular inspections, routine maintenance and in some cases major
renewals.
Why we do it
This activity’s objective is to safeguard people’s lives and property, reduce impacts on the environment,
and protect services such as water supply, power, telecommunication and transport networks that could be
damaged as a result of flooding. This enables the productive use of land, while also increasing the resilience
of our community and the services that are relied on.
Performance measures
KEY ATTRIBUTES
LEVEL OF SERVICES
PERFORMANCE MEASURES
BASELINE RESULTS
TARGETS
2018/19 2019/20 2020/21 2021-2028
Safety: Ensuring the safety of property, people and stock by actively managing and maintaining agreed flood protection schemes to the agreed
To provide the standard of flood protection agreed with communities as set out in zone plans and associated documents
Mandatory measure
Major flood protection and control works are maintained, repaired and renewed to the key standards defined in relevant planning documents (such as zone management plan, annual
2016/17 Achieved
Achieved Achieved Achieved Achieved

Doc # 11788985 Page 11
KEY ATTRIBUTES
LEVEL OF SERVICES
PERFORMANCE MEASURES
BASELINE RESULTS
TARGETS
2018/19 2019/20 2020/21 2021-2028
'annual exceedance probability' (AEP) levels.
Sustainability: Supporting the economic return of farm and urban areas within agreed schemes by ensuring they are protected from flooding and ensuring scheme land is managed in a manner that promotes its long term economic and biodiversity properties.
works* programme or long term plan)
*the two elements to this measure are described in more detail in the table rows below
Part one: Percentage of planned mandatory maintenance** actions achieved each year
*Maintenance can mean repair, renew or maintain.
2016/17 84.2%
85% 85% 85% 90%
Part two: Percentage of stopbanks maintained to above designed flood height, as agreed within each zone
2016/17 Rural: 92% Urban: n/a
Rural: 93% Urban: 93%
Rural: 93% Urban: 95%
Rural: 93% Urban: 98%
Rural: 93% Urban: 98%
Percentage of flood recovery plans*** implemented after all major events
*** The plans set out timeframes under which flood response actions are to be completed.
New measure
50% compliant
80% compliant
80% compliant
100% compliant
Land drainage
What we do
Waikato Regional Council manages a system of natural and built infrastructure to provide adequate land
drainage to support productive pastoral (and other) farming. Council has oversight of 92 land drainage
schemes which were set up based on a historic network of drains. Each scheme is fully funded under its
own targeted rate.
Why we do it
Land drainage services safeguard the economic wellbeing of the region by maintaining the drainage
network to provide land owners the ability to manage the water table on their properties, reducing surface

Doc # 11788985 Page 12
flooding resulting from rainfall events and maintaining water levels to support healthy pasture. Without
these drainage networks, these areas of land would be less productive.
Performance measures
KEY ATTRIBUTE
LEVEL OF SERVICE PERFORMANCE MEASURE
BASELINE RESULT
TARGETS
2018/19 2019/20 2020/21 2021-2028
Quality - an effective job is being done
To provide reliable water table management on land within drainage schemes for the purpose of maintaining pastoral production
Number of reported incidences where it takes more than three days to remove surface water after events with up to a 10% annual exceedance probability
2016/17 ≤5
≤5 ≤5 ≤5 ≤5
River management
What we do
The river management activity is responsible for managing rivers and streams in the Waikato region. This
activity includes erosion control, gravel management and management of vegetation, but also seeks to
achieve broader environmental outcomes such as habitat restoration and biodiversity enhancement.
Programmes are based on priority and the level of risk to people and property.
Why we do it
The main objective of river management is to maintain the stability and capacity of rivers and streams,
protect valuable soil from eroding, improve water quality by protecting waterways from sediment entry
and protect properties from flooding damage. This however also supports the rehabilitation and
preservation of our river channel and riparian environments.
Performance measures
KEY ATTRIBUTES LEVEL OF SERVICES
PERFORMANCE MEASURES
BASELINE RESULTS
TARGETS
2018/19 2019/20 2020/21 2021-2028
Customer service Responding to local government bodies, iwi, and the general public queries or issues with the rivers and surrounding land managed by the WRC.
Safety
Ensuring the safety of infrastructure,
To maintain channel capacity and stability of priority rivers and streams in each management zone.
Percentage of planned maintenance actions achieved each year
New measure
85% 85% 85% 90%
Percentage of enquiries acknowledged within two working days
New measure
95% 95% 95% 95%

Doc # 11788985 Page 13
KEY ATTRIBUTES LEVEL OF SERVICES
PERFORMANCE MEASURES
BASELINE RESULTS
TARGETS
2018/19 2019/20 2020/21 2021-2028
property, people, and biodiversity by actively managing and maintaining channel capacity and stability

Doc # 11788985 Page 14
INTEGRATED CATCHMENT MANAGEMENT
This GOA includes three activities:
Biodiversity
Biosecurity
Catchment planning and management
Land management advisory services
It contributes to the following community outcomes:
ACTIVITIES
Key:
∆ = Primary focus
◊ = Contributes to
COMMUNITY OUTCOMES
Healthy environment Strong economy Vibrant communities
Catchment planning and management ∆ ◊ ◊
Biosecurity ◊ ∆ ◊
Biodiversity ∆ ◊ ◊
Land management advisory services ◊ ∆ ◊
Biodiversity
What we do
The biodiversity activity carries out three main functions;
1. Empowering communities - We provide support, funding and advice to environmental projects driven by
community groups, iwi and members of the public.
2. Mainstreaming biodiversity – focusing on the many benefits Waikato Regional Council activities bring to
the region’s biodiversity.
3. Advancing restoration – council leads in ecosystem restoration, collaborating with other government
organisations and stakeholders to yield significant, long-term protection of vulnerable ecosystems.
Why we do it
The biodiversity activity aims to preserve, protect and enhance the Waikato region's indigenous
biodiversity.

Doc # 11788985 Page 15
Performance measures
KEY ATTRIBUTE
LEVEL OF SERVICE
PERFORMANCE MEASURES
BASELINE RESULTS
TARGETS
2018/19 2019/20 2020/21 2021/22-2028/29
Quality - the work undertaken leads to positive biodiversity outcomes.
To work in partnership with others to maintain and enhance indigenous biodiversity
Percentage of projects funded through Natural Heritage Partnership Programme that achieve milestones as per the funding agreement
2016/17
100%
100% 100% 100% 100%
Number of on the ground projects in action to protect and restore indigenous biodiversity per zone
New measure
≥2 per zone
≥2 per zone
≥2 per zone
≥2 per zone
Biosecurity
What we do
The biosecurity activity includes the exclusion, eradication or management of pests and diseases that pose
a risk to the economy, environment and cultural and social values, including human health. Council
collaborates and works in partnership with a wide range of national, regional and local
organisations/communities to deliver pest management throughout the region.
The activity is achieved through direct and biological control of animal and plant pests including community
based initiatives, providing information and advice on plant and animal pest control, monitoring of pest
animals and plants throughout the region, as well as developing strategy and rules for the protection and
enhancement of the environment.
Why we do it
This activity is a vital component in the national biosecurity system which is designed to mitigate and avoid
significant impacts of pest species. Pests and diseases can cause great environmental, social, cultural and
economic losses.
Performance measures
KEY ATTRIBUTE
LEVEL OF SERVICES
PERFORMANCE MEASURES
BASELINE RESULTS
TARGETS
2018/19 2019/20 2020/21 2021/22-2028/29
Quality: Staff provide high quality advice to the public. Pest control operations
To reduce animal pest populations in identified sites with assessed
Increasing long term trend in the number of tui in Hamilton
2016/17 Increasing trend
Increasing trend
N/A - no bird count this year
Increasing trend
Increasing trend (in the years when the biennial survey takes place)
Average rat tracking index (RTI)
2016/17 0 %
≤5% ≤5% ≤5% ≤5%

Doc # 11788985 Page 16
KEY ATTRIBUTE
LEVEL OF SERVICES
PERFORMANCE MEASURES
BASELINE RESULTS
TARGETS
2018/19 2019/20 2020/21 2021/22-2028/29
are carried out to ensure maximum impact.
biodiversity values
for all rat control operations
Average number of possums* caught for every 100 traps set for possum operations
* Possums are targeted as they have a detrimental impact on our native flora and fauna, including devastating native forests and impacting on pasture, horticulture and forestry.
2016/17 2.52%
<5% residual trap catch (RTC) for ground control
<5% RTC for ground control
<5% RTC for ground control
<5% RTC for ground control
To control low density, high threat plant pests to minimise impacts on primary industry and human health
Reducing trend in the coverage of eradication pest plants** at known sites
**Eradication pest plants are those with limited distribution or density. Eventual goal is eradication at known sites in the region, although 'zero density' is more practical to achieve. Includes African feather grass, cathedral bells, Chilean flame creeper, evergreen buckthorn, horse nettle, Chinese knotweed, lantana, Manchurian wild rice, mile-a-minute, nassella tussock, fire stemmed needle grass and Chilean needle grass, noogoora bur, purple loose strife, rhododendron ponticum, sagittaria, seaspurge, Senegal tea, spartine, variegated thistle, water poppy and white bryony.
2016/17
Reducing trend
Reducing trend
Reducing trend
Reducing trend
Reducing trend

Doc # 11788985 Page 17
Catchment planning and management
What we do
The catchment planning and management activity provides for the management of catchments throughout
the region. Key priorities for this activity include maintaining existing soil conservation schemes, promoting,
planning and implementing new catchment protection projects, aimed at improving water quality,
protecting biodiversity, managing shallow lakes, and planning for zones, catchments and harbours. These
activities are undertaken collaboratively with landowners, community groups, iwi and other agencies.
Works are delivered according to priorities established within each management zone or outcome area and
include erosion control and prevention, riparian protection through fencing and planting, lake and wetland
protection and enhancement, bush fragment protection and pest plant and animal control.
Council also undertakes zone, catchment and harbour management planning, including the development
and review of eight zone management plans.
Why we do it
Catchment management aims to achieve:
• reduced sedimentation of rivers, harbours and estuaries • more stable rivers and catchments • greater awareness of land and water sustainability • improvement and protection of the region's harbours, estuaries and shallow lakes • improvement and maintenance of water quality • improvement and protection of biodiversity • co-ordinated and integrated catchment planning. Performance measures
KEY ATTRIBUTE
LEVEL OF SERVICES
PERFORMANCE MEASURES
BASELINE RESULTS
TARGETS
2018/19 2019/20 2020/21 2021-2028
Quality - Robust planning work is undertaken and quality implementation takes place.
To maintain existing historic scheme works to ensure gains are preserved
Percentage of sampled catchment works maintained in effective condition to the standards set out in zone plans.*
* a sample of at least 10% of all catchment scheme and non-scheme works (Individual work agreements legally protected on property title outside schemes) are inspected to assess works condition every year. Works include fencing, planting and erosion control structures.
2016/17 87.8% achieved
70% 70% 70% 70%

Doc # 11788985 Page 18
KEY ATTRIBUTE
LEVEL OF SERVICES
PERFORMANCE MEASURES
BASELINE RESULTS
TARGETS
2018/19 2019/20 2020/21 2021-2028
To implement agreed plans (catchment new works) with landowners and land managers for reduced erosion, improved water quality and enhanced biodiversity
Percentage of catchment new works undertaken in priority catchments and/or at priority sites across all zones.
New measure 70% 80% 80% 80%
Land management advisory services
What we do
This activity works with others to deliver a range of non-regulatory services to support the agriculture
industry including community engagement and extension programmes aimed at building farmer awareness
of good practices and developing capability and capacity within the industry.
This includes supporting policy implementation by raising awareness of regulatory requirements. In
particular it coordinates farm environment planning within the Waikato and Waipa (Healthy Rivers)
catchments. It also works in the Hauraki catchments to prepare for the implications of Plan Change 2.
This service complements regulatory functions by engaging with the agriculture sector and ensuring that it
has the systems, capability and capacity to manage the effect of agriculture on water and soil values.
Why we do it
The aim of the service is to reduce the effects of agriculture on the environment. The primary benefit is to
the agriculture industry in helping it to meet its obligations. The wider community benefits from having
cleaner water bodies and healthier ecosystems.

Doc # 11788985 Page 19
Performance measures
KEY ATTRIBUTE
LEVEL OF SERVICE
PERFORMANCE MEASURES
BASELINE RESULTS
TARGETS
2018/19 2019/20 2020/21 2021-2028
Quality - extension programmes are appealing and provide valuable advice to farmers / landowners
To work with partners, stakeholders and community to improve soil conservation and water quality
Percentage of people (as surveyed) participating in Waikato Regional Council extension programmes who make a change in agricultural practice within 12 months of attendance
2016/17 66%
66% 66% 66% 66%
Number of farmers attending farm environment planning workshops* (Healthy Rivers)
*A total of 3000 farm environment plans must be delivered over ten years. The first set of plans must be completed by the end of 2021. Workshops to aid farmers in this process will begin in 2018/19.
New measure
200 300 400 300

Doc # 11788985 Page 20
PUBLIC TRANSPORT
This GOA includes one activity: public transport.
It contributes to the following community outcomes:
ACTIVITIES
Key:
∆ = Primary focus
◊ = Contributes to
COMMUNITY OUTCOMES
Healthy environment Strong economy Vibrant communities
Public transport ∆ ◊
What we do
Waikato Regional Council provides comprehensive public bus services within Hamilton and to satellite
towns around Hamilton. There are also a number of rural centres within the region serviced by council’s
public transport network. In addition, the council provides Total Mobility services in Hamilton, Tokoroa and
Taupo, which provides door to door transport services for people with disabilities.
Why we do it
Public transport services give the public an alternative to private vehicle travel, provide access for the
transport disadvantaged, supports urban growth objectives, reduces congestion by reducing vehicle
movements, provides rural communities with better access to essential services and enhances access to
special events.
Performance measures
KEY ATTRIBUTES
LEVEL OF SERVICE PERFORMANCE MEASURES
BASELINE RESULTS
TARGETS
2018/19 2019/20 2020/21 2021-2028
Patronage - Services are continuously refined and improved to maintain steady patronage growth over time
To provide the Waikato community with an efficient and reliable public transport system that enables an alternative to private vehicle travel and access to essential services.
Annual patronage growth exceeds background population growth for the region* * Region is defined as the Waikato region as a whole including the greater Hamilton sub region.
2016/17 Estimated population growth rate 1.7% p/a**
**Average between 2013 and 2017 - Statistics NZ.
Boarding increase of 2.5% or more annually
Boarding increase of 2.5% or more annually
Boarding increase of 2.5% or more annually
Boarding increase of 2.5% or more annually
Customer service - Customers are treated well and provided with a pleasant travel environment
Percentage of customers surveyed passengers who are 'satisfied' or better with the passenger transport service Source: customer satisfaction survey
2016/17 98%
>95% >95% >95% >95%

Doc # 11788985 Page 21
KEY ATTRIBUTES
LEVEL OF SERVICE PERFORMANCE MEASURES
BASELINE RESULTS
TARGETS
2018/19 2019/20 2020/21 2021-2028
Affordability - Services provided are cost efficient and affordable for passengers and funders.
Percentage of surveyed passengers who believe fares represent good value for money Source: customer satisfaction survey
2016/17 72%
>74% >76% >78% >80%
Service reliability/punctuality - Buses run on time in line with the public timetable.
Percentage of scheduled service trips that depart timing points* on time compared to public timetable
*A timing point is defined as a key interval along a route (it is less frequent than a bus stop). The number of timing points varies for each route.
New measure (no baseline available as technology is still being developed)
>95% scheduled service trips depart between 59 seconds before and 4 minutes and 59 seconds after the scheduled departure time
>95% scheduled service trips depart between 59 seconds before and 4 minutes and 59 seconds after the scheduled departure time
>95% scheduled service trips depart between 59 seconds before and 4 minutes and 59 seconds after the scheduled departure time
>95% scheduled service trips depart between 59 seconds before and 4 minutes and 59 seconds after the scheduled departure time
Accessibility - Services are easy to use and enable access to education, employment, healthcare and social opportunities for people with our region.
Percentage of households in Hamilton within 800m of public transport bus stop
2016/17 96%
>97% >98% >98% >98%

Doc # 11788985 Page 22
RESOURCE USE
This GOA includes three activities:
Consent processing and compliance
Investigations and incident response
Maritime services
It contributes to the following community outcomes:
ACTIVITIES
Key:
∆ = Primary focus
◊ = Contributes to
COMMUNITY OUTCOMES
Healthy environment Strong economy Vibrant communities
Consent processing and compliance ∆ ◊ ◊
Investigations and incident response ∆ ◊ ◊
Maritime services ∆
Consent processing and compliance
What we do
The consent processing and compliance activity is responsible for both the issuing of resource consents
under the Resource Management Act, which allow people to use the region’s natural resources, and
subsequent monitoring of those consents. Consents typically contain a number of conditions which make
sure the effects of the activity are appropriately controlled. These consents are monitored by council on a
prioritisation basis. Council also proactively monitors compliance with some activities that are only
permitted under the Regional Plan subject to compliance with a range of conditions.
This activity is also responsible for processing resource consent applications under the Building Act for large
dams on behalf of all North Island regional councils, and responding to identified non-compliance with
Building Act requirements as these relate to large dams within the Waikato region.
Why we do it
Implementing council’s responsibilities to issue consents and monitor both consented activity and priority
permitted activities not only enables council to meet its statutory obligations, it importantly helps protect
the Waikato’s unique environment while allowing for growth and development in a sustainable way. This
ensures that the region’s resources are managed sustainably for current as well as future generations.
Council’s dam safety responsibility ensures that potential risks to people and property are minimised, while
meeting council’s obligations under the Building Act.

Doc # 11788985 Page 23
Performance measures
KEY ATTRIBUTE
LEVEL OF SERVICE PERFORMANCE MEASURES
BASELINE RESULT
TARGETS
2018/19 2019/20 2020/21 2021-2028
Quality - best practice decision making
To efficiently and effectively deliver consenting and compliance monitoring processes under the Resource Management Act 1991 (RMA) to enable the lawful use of natural and physical resources.
Percentage of resource consents processed in accordance with RMA timeframe discount regulations
2016/17 99.9%
≥95% ≥95% ≥95% ≥95%
Percentage of highest priority (P1) consented sites monitored each year
2016/17 100%
100% 100% 100% 100%
Percentage of significant non-compliance incidents where action is taken
2016/17 100%
100% 100% 100% 100%
Investigations and incident response
What we do
Waikato Regional Council runs a 24 hour / 7 day a week response service to ensure the environment,
people or property are not seriously affected by pollution incidents or activities that are non-compliant
with environmental regulation. Council also investigates serious breaches of environmental or maritime
regulation and where significant non-compliance has been found to occur, formally investigates the
incident to enable decisions to be made on appropriate action, including enforcement.
Why we do it
This activity safeguards the community and environment against activities and incidents that could cause
damage to our air, water, soils, geothermal and coastal marine areas.
Performance measures
KEY ATTRIBUTES
LEVEL OF SERVICES
PERFORMANCE MEASURES
BASELINE RESULTS
TARGETS
2018/19 2019/20 2020/21 2021-2028
Reliability / responsiveness - incident response available 24/7
To provide a dedicated incident response service to ensure the environment, people or property are not seriously affected by pollution incidents or non-
Percentage of time the 24 hour 7 day a week response service for reporting environmental incidents is available
2016/17 100%
100% 100% 100% 100%

Doc # 11788985 Page 24
KEY ATTRIBUTES
LEVEL OF SERVICES
PERFORMANCE MEASURES
BASELINE RESULTS
TARGETS
2018/19 2019/20 2020/21 2021-2028
compliant activities
Quality - best practice investigation 24/7
To take appropriate action in response to notifications of serious non-compliance
Percentage of serious non-compliance incidents that are actioned
2016/17 100%
100% 100% 100% 100%
Maritime services
What we do
This activity is split into three workstreams namely policy and procedures, compliance with the navigation
safety bylaw and education, and operations. Operations include compliance activities, debris removal, and
inspecting and maintaining the region’s network of navigation aids.
Why we do it
Maritime Services has the delegated responsibility from Maritime NZ to ensure the region’s waterways
have an operative bylaw and navigable waterways.
Performance measures
KEY ATTRIBUTE LEVEL OF SERVICE
PERFORMANCE MEASURES
BASELINE RESULT
TARGETS
2018/19 2019/20 2020/21 2021-2022
Reliability / responsiveness - a 24 hour a day 7 day a week service is available. Failures are responded to quickly.
To maintain safe and navigable waterways in the region to protect the people using them.
Percentage of time grade 1 aids* to navigation are operational within 24 hours of failure and notified to Maritime NZ *Considered to be of primary navigational significance
2016/17 100%
100% 100% 100% 100%
Maintain a 24 hour 7 day a week response for navigational incidents** **Navigational incidents are those Waikato Regional Council has jurisdiction over, for example an oil spill or debris in a river. Incidents are reported to us from Maritime NZ or NZ Police.
2016/17 100%
100% 100% 100% 100%

Doc # 11788985 Page 25
SCIENCE AND STRATEGY
This GOA includes five activities:
Environmental monitoring
Environmental science and information
Social and economic information
Integration and infrastructure
Regional strategy and development
Resource management policy
It contributes to the following community outcomes:
ACTIVITIES
Key:
∆ = Primary focus
◊ = Contributes to
COMMUNITY OUTCOMES
Healthy
environment Strong economy Vibrant communities
Environmental information ∆ ◊ ◊
Environmental monitoring ∆
Social and economic information ◊ ∆
Resource management policy ∆ ◊
Regional strategy and development ∆ ◊
Integration and infrastructure ∆ ◊
Environmental monitoring
What we do
This activity focuses on the collection, storage, management and analysis of quality-assured data on the
current state of air, water, land, coastal resources, and ecosystems. Data is collected to support the
operation of flood warning systems, use and allocation of surface and ground freshwater resources, setting
water quality limits, identifying changes in water quantity and quality, soil, fresh water ecology, coastal
ecology and air quality. Data is used to support the setting of policies and rules and inform resource
consent decisions.
Why we do it
Environmental monitoring enables the public to understand how the environment is changing through
time. It ensures high quality and consistent data is collected, often reducing the need for the public to
undertake their own monitoring.

Doc # 11788985 Page 26
Performance measures
KEY ATTRIBUTE
LEVEL OF SERVICE PERFORMANCE MEASURES
BASELINE RESULT
TARGETS
2018/19 2019/20 2020/21 2021-2028
Quality - measure and manage accurate data
Provide high quality and timely data to key decision makers and the public
External audit of one environmental domain each year shows good quality control of data collection and analysis
2016/17
1 domain audited
1 domain audited
1 domain audited
1 domain audited
1 domain audited
During flood events the maximum contiguous period without data is 70 minutes for flood alarmed hydrology sites
New measure
<70 minutes without data
<70 minutes without data
<70 minutes without data
<70 minutes without data
Environmental science and information
What we do
This activity works closely with the environmental monitoring activity to gather, analyse and communicate
environmental information related to air, biodiversity, coasts, existing and emerging contaminants,
geothermal resource, groundwater, lakes, rivers and streams, wetlands, impacts of past and present land
use, and soil. This information provides science-based evidence to support understanding of how the
environment functions, changes, and sustains life, which underpins council’s decision making on the
allocation and sustainable management of the region’s natural resources.
Why we do it
We do this to provide current state and trends of the environment in order to provide high quality science
based information and advice about the region’s natural resources. The information is used by the
community and decision makers to gain a better understanding of the environment.
This information helps by assessing and predicting how natural resources respond to past, present and
future pressures, informs the management and mitigation of existing and potential impacts on natural
resource, informs the development and monitoring of consent process, monitors the effects of restoration
work and co-management programmes, and informs the development, implementation and review of
regional policies and plans.

Doc # 11788985 Page 27
Performance measures
KEY ATTRIBUTES
LEVEL OF SERVICE
PERFORMANCE MEASURE
BASELINE RESULT
TARGETS
2018/19 2019/20 2020/21 2021-2028
Accessibility - access to information / analysis.
Quality - there is a scientific methodology that underpins the information and analysis provided.
To provide high quality, independent and timely information on the allocation and management of natural resources to key decision makers and the community
Percentage of indicators on the changes and trends in natural resource availability are analyses and reported on as per the indicator monitoring schedule
2016/17 100%
100% 100% 100% 100%
Social and economic information
What we do
The activity supports evidence based planning and decision making by gathering, analysing and reporting
on social and economic data and information and linking this to environmental knowledge. These functions
enable council to have a better understanding of the social and economic qualities, opinions and
aspirations of our communities, which contributes to informed decision-making about the allocation of
natural resources.
The section also undertakes research and advises on best practice engagement and consultation processes
and monitors people’s understanding, awareness and attitudes in regards to the work that the council
does.
Why we do it
The collection and management of quality information on the community and economy in relation to
sustainable management of natural resources enables the council to effectively respond to emerging issues
and new challenges. This activity ensures that a rounded approach to resource management is undertaken,
it complements natural and physical science so that decisions are made in a manner that takes account of
the inter-relationships that exist between environment, economy and society/communities. This is critical
to sustaining growth and maintaining, or improving, the environmental and ecological health and the use of
resources for future generations.
Doc # 11788985 Page 28
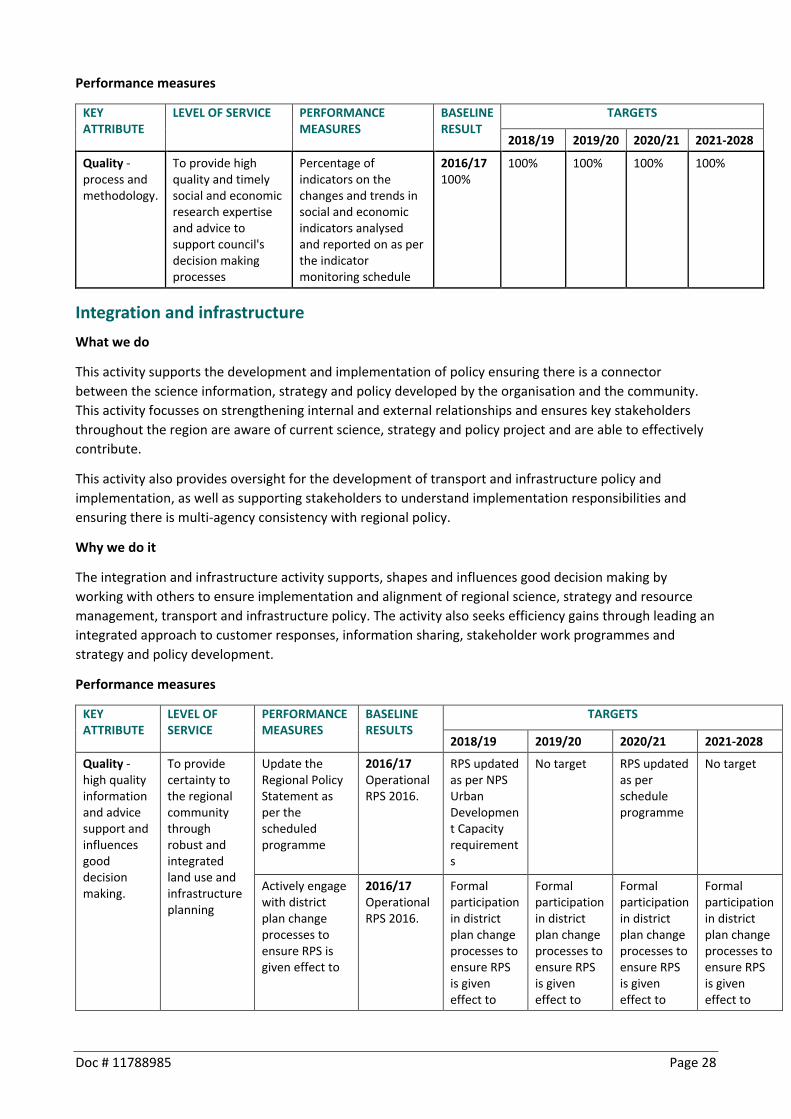
Performance measures
KEY ATTRIBUTE
LEVEL OF SERVICE PERFORMANCE MEASURES
BASELINE RESULT
TARGETS
2018/19 2019/20 2020/21 2021-2028
Quality - process and methodology.
To provide high quality and timely social and economic research expertise and advice to support council's decision making processes
Percentage of indicators on the changes and trends in social and economic indicators analysed and reported on as per the indicator monitoring schedule
2016/17 100%
100% 100% 100% 100%
Integration and infrastructure
What we do
This activity supports the development and implementation of policy ensuring there is a connector
between the science information, strategy and policy developed by the organisation and the community.
This activity focusses on strengthening internal and external relationships and ensures key stakeholders
throughout the region are aware of current science, strategy and policy project and are able to effectively
contribute.
This activity also provides oversight for the development of transport and infrastructure policy and
implementation, as well as supporting stakeholders to understand implementation responsibilities and
ensuring there is multi-agency consistency with regional policy.
Why we do it
The integration and infrastructure activity supports, shapes and influences good decision making by
working with others to ensure implementation and alignment of regional science, strategy and resource
management, transport and infrastructure policy. The activity also seeks efficiency gains through leading an
integrated approach to customer responses, information sharing, stakeholder work programmes and
strategy and policy development.
Performance measures
KEY ATTRIBUTE
LEVEL OF SERVICE
PERFORMANCE MEASURES
BASELINE RESULTS
TARGETS
2018/19 2019/20 2020/21 2021-2028
Quality - high quality information and advice support and influences good decision making.
To provide certainty to the regional community through robust and integrated land use and infrastructure planning
Update the Regional Policy Statement as per the scheduled programme
2016/17 Operational RPS 2016.
RPS updated as per NPS Urban Development Capacity requirements
No target RPS updated as per schedule programme
No target
Actively engage with district plan change processes to ensure RPS is given effect to
2016/17 Operational RPS 2016.
Formal participation in district plan change processes to ensure RPS is given effect to
Formal participation in district plan change processes to ensure RPS is given effect to
Formal participation in district plan change processes to ensure RPS is given effect to
Formal participation in district plan change processes to ensure RPS is given effect to

Doc # 11788985 Page 29
Regional strategy and development
What we do
This activity involves working together to lead the Waikato region to be more strategic and future focused.
Waikato Regional Council determines its role and priorities via its strategic direction and undertakes
strategic thinking with key regional stakeholders.
The activity supports collaborative regional and inter-regional development issues, including UNISA, the
Waikato Mayoral Forum and Waikato Means Business.
The activity is also about building relationships with and influencing other agencies including iwi, local and
central government, and the private sector to inform sector and inter-regional strategies and national
policy and regulation.
Why we do it
High quality strategic advice and information enables the direction of key issues to be influenced, the
region to be strategically positioned and the council to develop and deliver on its strategic direction.
Specifically the activity delivers on council's regional development priority.
Performance measures
KEY ATTRIBUTE LEVEL OF SERVICE PERFORMANCE MEASURE
BASELINE RESULT
TARGETS
2018/19 2019/20 2020/21 2021-2028
Quality – ensuring the work we undertake is delivering on our strategic direction priorities
To ensure that council is making progress towards its strategic direction priorities
Report annually on progress made against council’s strategic direction
2016/17 Progress reported in the WRC annual report
Progress reported in the WRC annual report
Progress reported in the WRC annual report
Progress reported in the WRC annual report
Progress reported in the WRC annual report
Resource management policy
What we do
This activity is responsible for the development and review of resource management plans and regional
policy statement under the Resource Management Act 1991. These documents ensure natural resources
are sustainably managed while enabling economic development, growth and communities to thrive.
This activity also provides future focused, effective resource management policy and planning information,
advice, analysis and solutions under other relevant legislation.
Why we do it
Resource management policies and plans are developed to deliver quality policy direction to ensure a
sustainable environment and a viable regional economy.
Credible and evidence-based policy analysis and advice is central to the successful management of scarce,
limited or competing resources, and enables our regional communities to make informed decisions about
the use of our region’s natural resources and respond to emerging challenges.
Performance measures

Doc # 11788985 Page 30
KEY ATTRIBUTE LEVEL OF SERVICE
PERFORMANCE MEASURES
BASELINE RESULT
TARGETS
2018/19 2019/20 2020/21 2021-2028
Reliability / timeliness - the process is robust, transparent and undertaken within legislative timeframes.
To provide certainty to the regional community through a robust, integrated and consistent environmental planning framework
Compliance with Resource Management Act and treaty settlement legislative planning requirements
2016/17 All legislative requirements are met
All legislative requirements are met
All legislative requirements are met
All legislative requirements are met
All legislative requirements are met
Accessibility - the community has sufficient opportunity to participate in planning processes.
To provide opportunities to be involved in planning processes
Percentage of Resource Management Act (RMA) planning documents made available for consultation that meet RMA legislative requirements
2016/17 100%
100% 100% 100% 100%
Sustainability - ensuring that natural and physical resources are managed sustainably.
To provide a Regional Policy Statement and a Regional Plan(s) that ensure natural and physical resources are managed sustainably
State of the Environment reporting is undertaken annually
New measure
Reported annually
Reported annually
Reported annually
Reported annually
Reported annually