Draft approved baseline methodology AM00xx … · For more information regarding this proposal and...
25
CDM – Meth Panel Twenty -first meeting Meeting Report Annex 4 21 June 2006 Draft approved baseline methodology AM00xx “Catalytic reduction of N 2 O inside the ammonia burner of nitric acid plants” Source This baseline methodology is based on the proposed methodology NM0143 “Baseline Methodology for the Catalytic Reduction of N 2 O inside the Ammonia Burner of Nitric Acid Plants” submitted by N serve Environmental Services GMBH with components from NM0164 ¨Baseline methodology for project ac- tivities involving secondary catalytic N 2 O abatement at an existing nitric acid plant” prepared by MGM International Ltd. For more information regarding this proposal and its consideration by the Executive Board please refer to http://cdm.unfccc.int/methodologies/PAmethodologies/approved.html. This methodology also refers to the latest version of the “Tool for the demonstration and assessment of ¨additionality” and approved methodology AM0028 “Catalytic N 2 O destruction in the tail gas of Nitric Acid Plants¨ Summary Nitric Acid (HNO 3 ) is produced through the oxidisation of ammonia (NH 3 ) on precious metal catalyst gauze in the ammonia burner of a nitric acid plant. Nitrous Oxide (N 2 O) is a by-product gas produced in the manufacture of nitric acid. Waste N 2 O from nitric acid production is typically released into the atmos- phere, as it does not have any economic value or toxicity at emission levels typical of nitric acid manufac- ture. Nitric acid plants operate on discrete production runs called “campaigns”. The start of a campaign is characterized by the installation of a new set of primary catalyst gauzes in the oxidation reactor. A set of precious metal gauzes (generally a platinum-rhodium alloy) is designed to operate either for a specific number of days or for a specific output of nitric acid. Over time the gauze decomposes and become less selective for the formation of NO. The production efficiency, therefore, drops and the formation of by- products increases. At the end of the design operating life of each gauze, the nitric acid plant is shut down and the gauze is replaced by new gauze. The period of time beginning from the installation of a new gauze pack until the subsequent plant shut down is defined as a campaign. This methodology covers project activities involving the installation of a dedicated N 2 O abatement cata- lyst inside the ammonia burner of a nitric acid plant that catalytically reduces N 2 O, once it has been formed in the Ammonia Oxidation Reactor. Baseline emissions are determined by measuring N 2 O concentration and total flow rate in the tail gas of the nitric acid plant. These measurements are for the duration of one entire campaign, and are used to de- termine a plant-specific baseline emissions factor (tN 2 O/t HNO 3 ). A permitted range for parameters that influence the level of N 2 O formation (e.g., ammonia, ammonia-air input, temperature and pressure) is es- tablished during the baseline campaign to define the permitted range for which emission reduction credits can be claimed during the crediting period. These permitted ranges must also be demonstrated to be within the specifications of the plant. During the project activity, the measurements of N 2 O and other parameters are carried out on a continu- ous basis and new emissions factors are established for each project campaign.
Transcript of Draft approved baseline methodology AM00xx … · For more information regarding this proposal and...
CDM – Meth Panel Twenty -first meeting Meeting Report Annex 4 21 June 2006
Draft approved baseline methodology AM00xx
“Catalytic reduction of N2O inside the ammonia burner of nitric acid plants”
Source This baseline methodology is based on the proposed methodology NM0143 “Baseline Methodology for the Catalytic Reduction of N2O inside the Ammonia Burner of Nitric Acid Plants” submitted by N serve Environmental Services GMBH with components from NM0164 ¨Baseline methodology for project ac-tivities involving secondary catalytic N2O abatement at an existing nitric acid plant” prepared by MGM International Ltd. For more information regarding this proposal and its consideration by the Executive Board please refer to http://cdm.unfccc.int/methodologies/PAmethodologies/approved.html. This methodology also refers to the latest version of the “Tool for the demonstration and assessment of ¨additionality” and approved methodology AM0028 “Catalytic N2O destruction in the tail gas of Nitric Acid Plants¨ Summary Nitric Acid (HNO 3) is produced through the oxidisation of ammonia (NH3) on precious metal catalyst gauze in the ammonia burner of a nitric acid plant. Nitrous Oxide (N2O) is a by-product gas produced in the manufacture of nitric acid. Waste N2O from nitric acid production is typically released into the atmos-phere, as it does not have any economic value or toxicity at emission levels typical of nitric acid manufac-ture. Nitric acid plants operate on discrete production runs called “campaigns”. The start of a campaign is characterized by the installation of a new set of primary catalyst gauzes in the oxidation reactor. A set of precious metal gauzes (generally a platinum-rhodium alloy) is designed to operate either for a specific number of days or for a specific output of nitric acid. Over time the gauze decomposes and become less selective for the formation of NO. The production efficiency, therefore, drops and the formation of by-products increases. At the end of the design operating life of each gauze, the nitric acid plant is shut down and the gauze is replaced by new gauze. The period of time beginning from the installation of a new gauze pack until the subsequent plant shut down is defined as a campaign. This methodology covers project activities involving the installation of a dedicated N2O abatement cata-lyst inside the ammonia burner of a nitric acid plant that catalytically reduces N2O, once it has been formed in the Ammonia Oxidation Reactor.
Baseline emissions are determined by measuring N2O concentration and total flow rate in the tail gas of the nitric acid plant. These measurements are for the duration of one entire campaign, and are used to de-termine a plant-specific baseline emissions factor (tN2O/t HNO3). A permitted range for parameters that influence the level of N2O formation (e.g., ammonia, ammonia-air input, temperature and pressure) is es-tablished during the baseline campaign to define the permitted range for which emission reduction credits can be claimed during the crediting period. These permitted ranges must also be demonstrated to be within the specifications of the plant.
During the project activity, the measurements of N2O and other parameters are carried out on a continu-ous basis and new emissions factors are established for each project campaign.

CDM – Meth Panel Twenty -first meeting Meeting Report Annex 4 21 June 2006 Total emission reductions for the project for a specific campaign are calculated by subtracting the project emissions factor from the baseline emissions factor and multiplying the result by the number of tonnes of nitric acid produced in the particular campaign. The methodology requires the installation of a complete N2O monitoring system that includes both a gas volume flow meter and an infrared gas analyser to determine the concentration of N2O. The total mass of N2O emissions is determined by multiplying the total volume flow by the concentration of N2O.
Statistical analysis is applied to both the baseline emissions factor and each campaign-specific project emissions factor. Only those N2O measurements taken when the plant is operating within the permitted range will be considered in the calculation of baseline emissions. The level of uncertainty determined for the N2O monitoring equipment will be deducted from the baseline emissions factor.
The project emissions factor is calculated as the ‘moving average’ of project emission factor of all the campaigns completed at that point in time. To determine the total emission reductions for a particular pro-ject campaign the project emissions factor is higher of the two values: (i) the moving average project emissions factor; and (ii) the project emission factor for that particular campaign. Also, to account for any N2O emission reductions that may occur anyway as a consequence of potential platinum deposit build up inside the plant, the moving average factor is capped at the level of the lowest campaign specific emis-sions factor observed during the first 10 campaigns.
Applicability
This Baseline Methodology is applicable to project activities that installs a secondary N2O abatement catalyst inside the ammonia burner of a nitric acid plant, underneath the precious metal gauze pack. The methodology is applicable under the following conditions apply:
• The applicability is limited to existing nitric acid production facilities installed no later than 31 December 2005.
• The project activity will not result in the shut down of any existing N2O destruction or abatement facility or equipment in the plant;
• The project activity shall not affect the level of nitric acid production
• There are currently no regulatory requirements or incentives to reduce levels of N2O emissions from nitric acid plants in the host country.
• No N2O abatement technology is currently installed in the plant. • The project activity will not increase NOX emissions. • NOX abatement catalyst installed, if any, prior to the start of the project activity is not a Non-
Selective Catalytic Reduction (NSCR) DeNOX unit. • Operation of the secondary N2O abatement catalyst installed under the project activity does not
lead to any process emissions of greenhouse gases, directly or indirectly. • Continuous real-time measurements of N2O concentration and total gas volume flow can be car-
ried out in the stack: o Prior to the installation of the secondary catalyst for one campaign, and o After the installation of the secondary catalyst throughout the chosen crediting period of the
project activity
This Baseline Methodology shall be used in conjunction with the proposed new monitoring methodology AM00XX (“Catalytic reduction of N2O inside the ammonia burner of nitric acid plants”).

CDM – Meth Panel Twenty -first meeting Meeting Report Annex 4 21 June 2006 Project Boundary
The spatial extent of the project boundary shall cover the facility and equipment for the complete nitric acid production process from the inlet to the ammonia burner to the stack. This includes all compressors, tail gas expander turbines and any NOX abatement equipment installed. The only greenhouse gas to be included is the N2O contained in the waste stream exiting the stack.
Flow diagrams of different types of nitric acid plants (high, medium and low pressure; mono and dual pressure; plant constructor) differ substantially. Therefore, a plant specific flow diagram should be pro-vided in the Project Design Document to demonstrate the project boundary of the particular nitric acid plants(s) involved in the project activity.
Table 1: Overview of emission sources included or excluded from the project boundary
Source Gas Included? Justification / Explanation CO2 Excluded CH4 Excluded
The project does not lead to any change in CO2 or CH4 emissions, and, therefore, these are not included.
Bas
elin
e
Nitric Acid Plant (Burner Inlet to Stack)
N2O Included CO2 Excluded CH4 Excluded
The project does not lead to any change in CO2 or CH4 emissions Nitric Acid Plant (Burner
Inlet to Stack) N2O Included CO2
Excluded
CH4
Excluded
Proj
ect A
ctiv
ity
Leakage emissions from production, transport, operation and decommis-sioning of the catalyst. N2O Excluded
No leakage emissions are expected.
Identification of baseline scenario
The baseline scenario shall be identified using procedure for Identification of the baseline scenario de-scribed in the approved methodology AM0028 “Catalytic N2O destruction in the tail gas of Nitric Acid Plants”.
Additionality The additionality of the project activity shall be demonstrated and assessed using the latest version of the “Tool for demonstration and assessment of additionality” agreed by the Executive Board. Because of the similarity of both approaches used to determine the baseline scenario and the additionality tool, step 1 of the “Tool for demonstration and assessment of additionality” may be omitted while assess-ing the additionality. Consistency shall be ensured between the determination of the baseline scenario and the demonstration of additionality. The baseline scenario alternative selected in the previous section shall be used when apply-ing steps 2 to 5 of the tool for demonstration and assessment of additionality. In the event of re-assessment of the baseline scenario as a consequence of new NOX regula-tions over the course of the crediting period of the proposed project activity, the re-
CDM – Meth Panel Twenty -first meeting Meeting Report Annex 4 21 June 2006 assessment of baseline scenario shall be undertaken using the same 5 step process men-tioned above. In such a case the additionality of the project too must be re-demonstrated.
Baseline Emissions
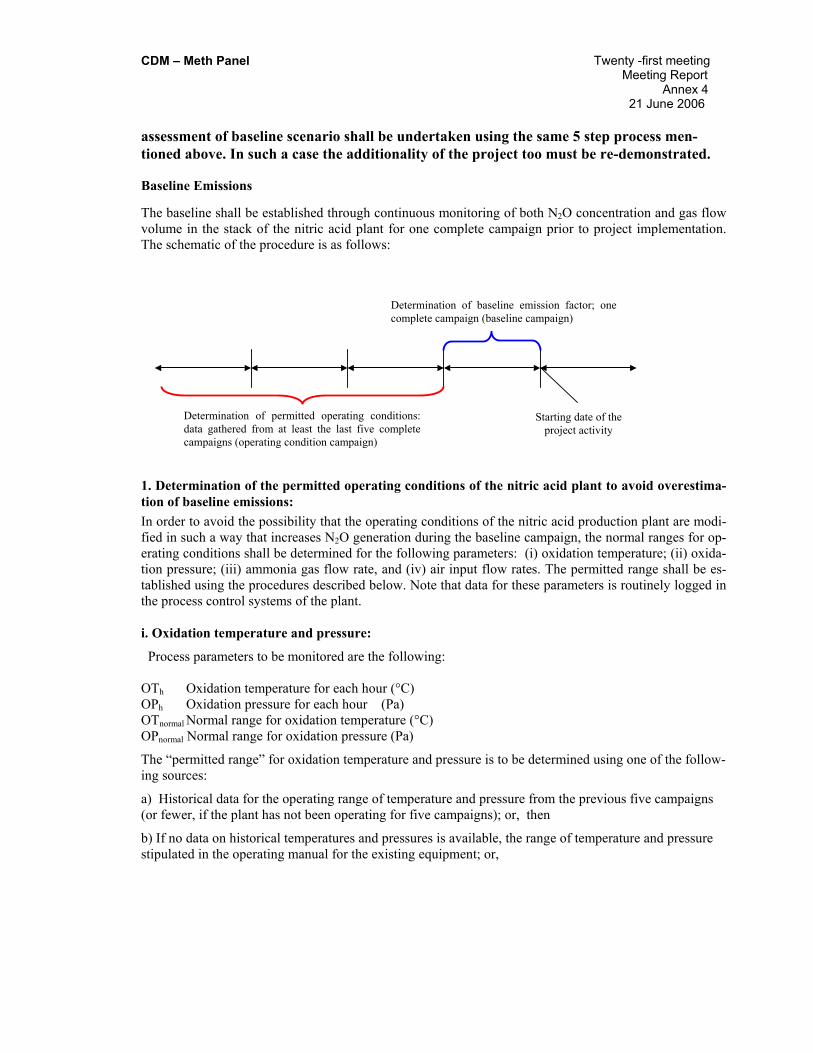
The baseline shall be established through continuous monitoring of both N2O concentration and gas flow volume in the stack of the nitric acid plant for one complete campaign prior to project implementation. The schematic of the procedure is as follows:
1. Determination of the permitted operating conditions of the nitric acid plant to avoid overestima-tion of baseline emissions: In order to avoid the possibility that the operating conditions of the nitric acid production plant are modi-fied in such a way that increases N2O generation during the baseline campaign, the normal ranges for op-erating conditions shall be determined for the following parameters: (i) oxidation temperature; (ii) oxida-tion pressure; (iii) ammonia gas flow rate, and (iv) air input flow rates. The permitted range shall be es-tablished using the procedures described below. Note that data for these parameters is routinely logged in the process control systems of the plant. i. Oxidation temperature and pressure:
Process parameters to be monitored are the following: OTh Oxidation temperature for each hour (°C) OPh Oxidation pressure for each hour (Pa) OTnormal Normal range for oxidation temperature (°C) OPnormal Normal range for oxidation pressure (Pa)
The “permitted range” for oxidation temperature and pressure is to be determined using one of the follow-ing sources:
a) Historical data for the operating range of temperature and pressure from the previous five campaigns (or fewer, if the plant has not been operating for five campaigns); or, then
b) If no data on historical temperatures and pressures is available, the range of temperature and pressure stipulated in the operating manual for the existing equipment; or,
Starting date of the project activity
Determination of baseline emission factor; onecomplete campaign (baseline campaign)
Determination of permitted operating conditions:data gathered from at least the last five completecampaigns (operating condition campaign)
CDM – Meth Panel Twenty -first meeting Meeting Report Annex 4 21 June 2006 c) If no operating manual is available or the operating manual gives insufficient information, from an ap-propriate technical literature source1.
If option a) is selected, the permitted range is determined through a statistical analysis of the historical data in which the time series data is to be interpreted as a sample for a stochastic variable. All data that falls within the upper and lower 2.5% percentiles of the sample distribution is defined as abnormal and shall be eliminated. The permitted range of operating temperature and pressure is then assigned as the historical minimum (value of parameter below which 2.5% of the observation lie) and maximum operat-ing conditions (value of parameter exceeded by 2.5% of observations).
ii. Ammonia gas flow rates and ammonia to air ratio input into the ammonia oxidation reactor (AOR):
Parameters to be monitored
AFR Ammonia gas flow rate to the AOR (tNH3/h) AFRmax Maximum ammonia gas flow rate to the AOR (tNH3/h) AIFR_ Ammonia to air ratio (%) AIFRmax_ Maximum ammonia to air ratio (%)
The upper limits for ammonia flow and ammonia to air ratio shall be determined using one of the follow-ing three options, in preferential order:
a. Historical maximum operating data for hourly ammonia gas and ammonia to air ratio for the pre-vious five campaigns (or fewer, if the plant has not been operating for five campaigns; excluding abnormal campaigns; or,
b. If no data is available, calculation of the maximum permitted ammonia gas flow rates and ammo-nia to air ratio as specified by the ammonia oxidation catalyst manufacturer or for typical catalyst loadings; or,
c. If information for (b) above is not available, based on a relevant technical literature source.
Once the permitted ranges for pressure, temperature, ammonia flow rate and ammonia to air ratio are de-termined, it must also be demonstrated that these ranges are within the specifications of the facility. If not, the baseline campaign must be reassessed. 2. Determination of baseline emission factor: measurement procedure for N2O concentration and gas volume flow
N2O concentration and gas volume flow are to be monitored throughout the baseline campaign. The monitoring system is to be installed using the European Norm 14181 (2004). This monitoring system provides separate readings for N2O concentration and gas flow volume for a defined period of time (e.g. every hour of operation, it provides an average of the measured values for the previous 60 minutes). Error readings (e.g. downtime or malfunction) and extreme values are to be automatically eliminated from the output data series by the monitoring system. Measurement results can be distorted before and after periods of downtime or malfunction of the monitor-ing system and can lead to mavericks. To eliminate such extremes and to ensure a conservative approach, the following statistical evaluation is to be applied to the complete data series of N2O concentration as well as to the data series for gas volume flow. The statistical procedure will be applied to data obtained after eliminating data measured for periods where the plant operated outside the permitted ranges:
a) Calculate the sample mean (x) b) Calculate the sample standard deviation (s)
1 (e.g. from Ullmann’s Encyclopedia of Industrial Chemistry, Fifth, completely revised edition, Volume A 17, VCH, 1991, P. 298, Table 3. or other standard reference work or literature source

CDM – Meth Panel Twenty -first meeting Meeting Report Annex 4 21 June 2006
c) Calculate the 95% confidence interval (equal to 1.96 times the standard deviation) d) Eliminate all data that lie outside the 95% confidence interval e) Calculate the new sample mean from the remaining values (volume of stack gas (VSG) and N2O
concentration of stack gas (NCSG))
The average mass of N2O emissions per hour is estimated as product of the NCSG and VSG. The N2O emissions per campaign are estimates product of N2O emission per hour and the total number of complete hours of operation of the campaign using the following equation:
BEBC = VSGBC * NCSGBC * 10-9 * OHBC (tN2O) (1) The plant specific baseline emissions factor representing the average N2O emissions per tonne of nitric acid over one full campaign is derived by dividing the total mass of N2O emissions by the total output of 100% concentrated nitric acid for that period. The overall uncertainty of the monitoring system shall also be determined and the measurement error will be expressed as a percentage (UNC). The N2O emission factor per tonne of nitric acid produced in the baseline period (EFBL) shall then be reduced by the esti-mated percentage error as follows: EFBL = (BEBC / NAPBC) (1 – UNC/100) (tN2O/tHNO3) (2)
where: Variable Definition EFBL Baseline N2O emissions factor (tN2O/tHNO3) BEBC Total N2O emissions during the baseline campaign (tN2O) NCSGBC Mean concentration of N2O in the stack gas during the baseline campaign
(mgN2O/m3) OHBC Operating hours of the baseline campaign (h) VSGBC Mean gas volume flow rate at the stack in the baseline measurement period
(m3/h) NAPBC Nitric acid production during the baseline campaign (tHNO3) UNC Overall uncertainty of the monitoring system (%), calculated as the combined
uncertainty of the applied monitoring equipment In the absence of any national or regional regulations for N2O emissions, the resulting EFBL will be used as the baseline emission factor.
NOTE: Under certain circumstances, the operating conditions during the measurement period used to de-termine baseline N2O emission factor may be outside the permitted range or limit corresponding to nor-mal operating conditions. For instance, temperature, pressure, ammonia flow rate or ammonia to air ratio may be outside the permitted condition. Any N2O baseline data that is measured during hours where the operating conditions are outside the permitted range must be eliminated from the calculation of the base-line emissions factor. If historical data and baseline data for each minute are available, values could be eliminated on a minute-by-minute basis.
The baseline campaign is not valid and must be repeated if the plant operates outside of the permitted range for more than 50% of the duration of the baseline campaign.
In order to further ensure that operating conditions during the baseline campaign are representative of normal operating conditions, statistical tests should be performed to compare the average values of the permitted operating conditions with the average values obtained during the baseline determination period.

CDM – Meth Panel Twenty -first meeting Meeting Report Annex 4 21 June 2006 If it can be concluded with 95% confidence level, in any of the tests, that the two values are different, then the baseline determination should be repeated
Impact of regulations:
Should N2O emissions regulations that apply to nitric acid plants be introduced in the host country or ju-risdiction covering the location of the project activity, such regulations shall be compared to the calcu-lated baseline factor for the project (EFBL), regardless of whether the regulatory level is expressed as: • An absolute cap on the total volume of N2O emissions for a set period; • A relative limit on N2O emissions expressed as a quantity per unit of output; or • A threshold value for specific N2O mass flow in the stack;
In this case, a corresponding plant-specific emissions factor cap (max. allowed tN2O/tHNO3) is to be de-rived from the regulatory level. If the regulatory limit is lower than the baseline factor determined for the project, the regulatory limit shall serve as the new baseline factor, that is:
if EFBL > EFreg,
then the baseline N2O emission factor shall be EFreg for all calculations.
where:
Variable Definition EFBL Baseline emissions factor (tN2O/tHNO3) EFreg Emissions level set by newly introduced policies or regulations (tN2O/tHNO3).
Such EFreg shall be determined according to the nature of the regulation (e.g. in terms of absolute emission, byproduct rate, concentration in stack gas), as de-scribed in the approved methodology AM0028.
The composition of the ammonia oxidation catalyst:
If the composition of the ammonia oxidation catalyst used for the baseline campaign and after the imple-mentation of the project are identical to that used in the campaign for setting the operating conditions (previous five campaigns), then there shall be no limitations on N2O baseline emissions.
A change in the composition of the ammonia oxidation catalyst in the baseline campaign to a composition other than that used in the previous five campaigns, is permissible without any limitation on the N2O baseline emissions if the following conditions are met
(i) The baseline catalyst composition is considered as common practice in the industry, or
(ii) The change in catalyst composition is justified by its availability, performance, relevant literature etc.
Otherwise, the baseline emission factor shall be set to the conservative IPCC default emission factor for N2O from nitric acid plants which have not installed N2O destruction measures (4.5 kg-N2O / t HNO3).
If the nitric acid plant operator has changed the composition of the ammonia oxidation catalyst in a pro-ject campaign to a composition not used in the baseline campaign, the project proponent could:
1) Repeat the baseline campaign to determine a new baseline emissions factor (tN2O/tHNO3), compare it to the previous baseline emissions factor and adopt the lower figure as EFBL, or
2) Set the baseline emissions factor to the conservative IPCC default emission factor for N2O from nitric acid plants which have not installed N2O destruction measures (4.5 kg-N2O / t HNO3).

CDM – Meth Panel Twenty -first meeting Meeting Report Annex 4 21 June 2006 Parameters to be monitored for composition of the catalyst are as follows:
GSnormal Gauze supplier for the operation condition campaigns GSBL Gauze supplier for baseline campaign GSproject Gauze supplier for the project campaign Gnormal Gauze composition for the operation condition campaigns GCBL Gauze composition for baseline campaign GCproject Gauze composition for the project campaign
Campaign Length
In order to take into account the variations in campaign length and its influence on N2O emission levels, the historic campaign lengths and the baseline campaign length are to be determined and compared to the project campaign length. Campaign length is defined as the total number of metric tonnes of nitric acid at 100% concentration produced with one set of gauzes. Historic Campaign Length
The average historic campaign length (CLnormal) defined as the average campaign length for the historic campaigns used to define operating condition (the previous five campaigns), will be used as a cap on the length of the baseline campaign.
Baseline Campaign Length (CLBL)
If CLBL ≤ CLnormal
all N2O values measured during the baseline campaign can be used for the calculation of EFBL (subject to the elimination of data that was monitored during times where the plant was operating outside of the “per-mitted range”).
If CLBL > CLnormal
N2O values that were measured beyond the length of CLnormal during the production of the quantity of ni-tric acid (i.e. the final tonnes produced) are to be eliminated from the calculation of EFBL.
Project Emissions
Over the duration of the project activity, N2O concentration and gas volume flow in the stack of the nitric acid plant as well as the temperature and pressure of ammonia gas flow and ammonia-to-air ratio, will be measured continuously.
Estimation of campaign-specific project emissions
The monitoring system is to be installed using the guidance document EN 14181 and will provide sepa-rate readings for N2O concentration and gas flow volume for a defined period of time (e.g. every hour of operation, i.e. an average of the measuring values of the past 60 minutes). Error readings (e.g. downtime or malfunction) and extreme values are automatically eliminated from the output data series by the moni-toring system. Next, the same statistical evaluation that was applied to the baseline data series is to be applied to the project data series:
a) Calculate the sample mean (x) b) Calculate the sample standard deviation (s) c) Calculate the 95% confidence interval (equal to 1.96 times the standard deviation) d) Eliminate all data that lie outside the 95% confidence interval e) Calculate the new sample mean from the remaining values

CDM – Meth Panel Twenty -first meeting Meeting Report Annex 4 21 June 2006 PEn = VSG * NCSG * 10-9 * OH (tN2O) (3)
where::
Variable Definition VSG Mean stack gas volume flow rate for the project campaign (m3/h) NCSG Mean concentration of N2O in the stack gas for the project campaign
(mgN2O/m3) PEn Total N2O emissions of the nth project campaign (tN2O) OH Is the number of hours of operation in the specific monitoring period (h) Derivation of a moving average emission factor In order to take into account possible long-term emissions trends over the duration of the project activity and to take a conservative approach a moving average emission factor shall be estimated as follows: Step1: estimate campaign specific emissions factor for each campaign during the project’s crediting pe-riod by dividing the total mass of N2O emissions during that campaign by the total production of 100% concentrated nitric acid during that same campaign. For example, for campaign n the campaign specific emission factor would be:
EFn = PEn / NAPn (tN2O/tHNO3) (4)
Step 2: estimate a moving average emissions factor be calculated at the end of a campaign n as follows:
EFma,n = (EF1 + EF2 + … + EFn) / n (tN2O/tHNO3) (5)
This process is repeated for each campaign such that a moving average, EFma,n, is established over time, becoming more representative and precise with each additional campaign.
To calculate the total emission reductions achieved in a campaign in formula (7) below, the higher of the two values EFma,n and EFn shall be applied as the emission factor relevant for the particular campaign to be used to calculate emissions reduction s (EFp). Thus:
If EFma,n > EFn then EFp = EFma,n (6) If EFma,n < EFn then EFp = EFn
Where:
Variable Definition EFn Emission factor calculated for a specific project campaign (tN2O/tHNO3) EFma,n Moving average (ma) emission factor of after nth campaigns, including the cur-
rent campaign (tN2O/tHNO3) n Number of campaigns to date EFp Emissions factor that will be applied to calculate the emissions reductions from
this specific campaign (i.e. the higher of EFx and EFn) (N2O/tHNO3)
Minimum project emission factor
A campaign-specific emissions factor shall be used to cap any potential long-term trend towards decreas-ing N2O emissions that may result from a potential built up of platinum deposits. After the first ten cam-paigns of the crediting period of the project, the lowest EFn observed during those campaigns will be
CDM – Meth Panel Twenty -first meeting Meeting Report Annex 4 21 June 2006 adopted as a minimum (EFmin). If any of the later project campaigns results in a EFn that is lower than EF-min, the calculation of the emission reductions for that particular campaign shall used EFmin and not EFn. 2
Where: Variable Definition EFmin Is equal to the lowest EFn observed during the first 10 campaigns of the project
crediting period (N2O/tHNO3) Project Campaign Length
a. Longer Project Campaign
If the length of each individual project campaign CLn is longer than or equal to the average his-toric campaign length CLnormal, then all N2O values measured during the baseline campaign can be used for the calculation of EF (subject to the elimination of data from the Ammonia/Air analysis, see above).
b. Shorter Project Campaign
If CLn < CLnormal, recalculate EFBL by eliminating those N2O values that were obtained during the production of tonnes of nitric acid beyond the CLn (i.e. the last tonnes produced) from the calcu-lation of EFn.
Leakage
No leakage calculation is required.
Emission Reductions
The emission reductions for the project activity over a specific campaign are determined by deducting the campaign-specific emission factor from the baseline emission factor and multiplying the result by the production output of 100% concentrated nitric acid over the campaign period and the GWP of N2O:
ER = (EFBL – EFP) * NAP *GWPN2O (tCO2e) (7)
Where: Variable Definition ER Emission reductions of the project for the specific campaign (tCO2e) NAP Nitric acid production for the project campaign (tHNO3). The maximum
value of NAP shall not exceed the design capacity. EFBL Baseline emissions factor (tN2O/tHNO3 ) EFP Emissions factor used to calculate the emissions from this particular cam-
paign (i.e. the higher of EFma,n and EFn)
By nameplate (design) implies the total yearly capacity (considering 365 days of operation per year) as per the documentation of the plant technology provider (such as the Operation Manual). If the plant has
2 In practice this will mean that, if the assumption that platinum deposits do have a reducing effect on N2O emis-sions is correct, then an increasing adoption of EFmin instead of EFn should be experienced as the project progresses through its crediting period.

CDM – Meth Panel Twenty -first meeting Meeting Report Annex 4 21 June 2006 been modified to increase production, and such de-bottleneck or expansion projects were completed be-fore December 2005, then the new capacity is considered nameplate, provided proper documentation of the projects is available (such as, but not limited to: properly dated engineering plans or blueprints, engi-neering, materials and/or equipment expenses, or third party construction services, etc.).

CDM – Meth Panel Twenty -first meeting Meeting Report Annex 4 21 June 2006
Draft approved monitoring methodology AM00xx
“Catalytic reduction of N2O inside the ammonia burner of nitric acid plants”
Source This monitoring methodology is based on the proposed methodology NM0143 “Baseline Methodology for the Catalytic Reduction of N2O inside the Ammonia Burner of Nitric Acid Plants” whose monitoring methodology was prepared by Nserve Environmental Services GMBH with components from NM0164 ¨Baseline methodology for project activities involving secondary catalytic N2O abatement at an existing nitric acid plant.” whose monitoring methodology was prepared by MGM International Ltd. For more information regarding this proposal and its consideration by the Executive Board please refer to http://cdm.unfccc.int/methodologies/PAmethodologies/approved.html. This methodology also refers to the latest version of the “Tool for the demonstration and assessment of additionality” and approved methodology AM0028: “Catalytic N2O destruction in the tail gas of Nitric Acid Plants”. Applicability This monitoring methodology shall be used in conjunction with the baseline methodology AM00XX, “Catalytic reduction of N2O inside the ammonia burner of nitric acid plants”. The same applicability conditions as in the baseline methodology apply.
Methodology This monitoring methodology requires the collection of historic N2O emissions baseline data and the monitoring of ammonia and air input and pressure and temperature inside the ammonia burner during one production campaign of the nitric acid plant prior to the installation of the N2O abatement catalyst, as well as the continued monitoring of the N2O emissions after the installation of the N2O abatement catalyst. The Automated Measuring System (AMS) consisting of the following shall be used for monitoring:
An automated extractive gas analyzer system that uses Non Dispersive Infrared Absorption (NDIR) (including probes, pipes and sample conditioning system) that will continuously measure the concen-tration of N2O in the stack gas of the nitric acid plant. A probe extracts the homogenously mixed gas directly from the stack or tail gas stream from the point at which it is pumped through gas lines to the analyzer, and
A gas volume flow meter that uses either pressure-differential or ultrasonic techniques to continu-
ously monitor the gas volume flow, temperature and pressure, in the stack of the nitric acid plant.
If pressure-differential technology is applied, sampling shall be carried out continuously using a multiple-point sampling tube that is optimised to the specific width and height of the stack, and the expected gas velocities in the stack.
Temperature and pressure in the stack will also be measured continuously and used to calculate the gas volume flow at the prescribed temperature and pressure. This calculation of gas volume flow at standard conditions will be carried out automatically by the AMS.
In addition, the total production of nitric acid and the number of operating hours will be recorded.

CDM – Meth Panel Twenty -first meeting Meeting Report Annex 4 21 June 2006 A plant specific emissions factor will be calculated from the monitored data, both during the baseline pe-riod and for each production campaign of the project activity. Statistical evaluation is applied in order to eliminate distortions in these emissions factors.
CDM – Meth Panel Twenty -first meeting Meeting Report Annex 4 21 June 2006
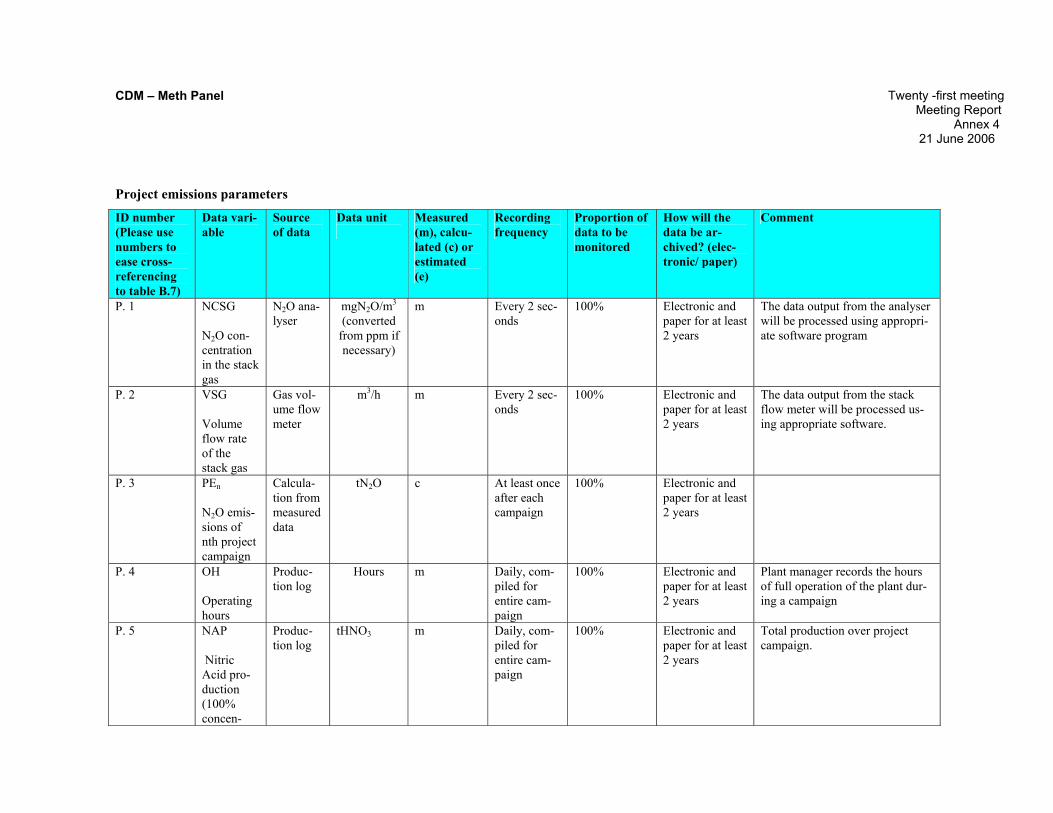
Project emissions parameters
ID number (Please use numbers to ease cross-referencing to table B.7)
Data vari-able
Source of data
Data unit
Measured (m), calcu-lated (c) or estimated (e)
Recording frequency
Proportion of data to be monitored
How will the data be ar-chived? (elec-tronic/ paper)
Comment
P. 1 NCSG N2O con-centration in the stack gas
N2O ana-lyser
mgN2O/m3
(converted from ppm if necessary)
m Every 2 sec-onds
100% Electronic and paper for at least 2 years
The data output from the analyser will be processed using appropri-ate software program
P. 2 VSG Volume flow rate of the stack gas
Gas vol-ume flow meter
m3/h m Every 2 sec-onds
100% Electronic and paper for at least 2 years
The data output from the stack flow meter will be processed us-ing appropriate software.
P. 3 PEn N2O emis-sions of nth project campaign
Calcula-tion from measured data
tN2O c At least once after each campaign
100% Electronic and paper for at least 2 years
P. 4 OH Operating hours
Produc-tion log
Hours m Daily, com-piled for entire cam-paign
100% Electronic and paper for at least 2 years
Plant manager records the hours of full operation of the plant dur-ing a campaign
P. 5 NAP Nitric Acid pro-duction (100% concen-
Produc-tion log
tHNO3 m Daily, com-piled for entire cam-paign
100% Electronic and paper for at least 2 years
Total production over project campaign.
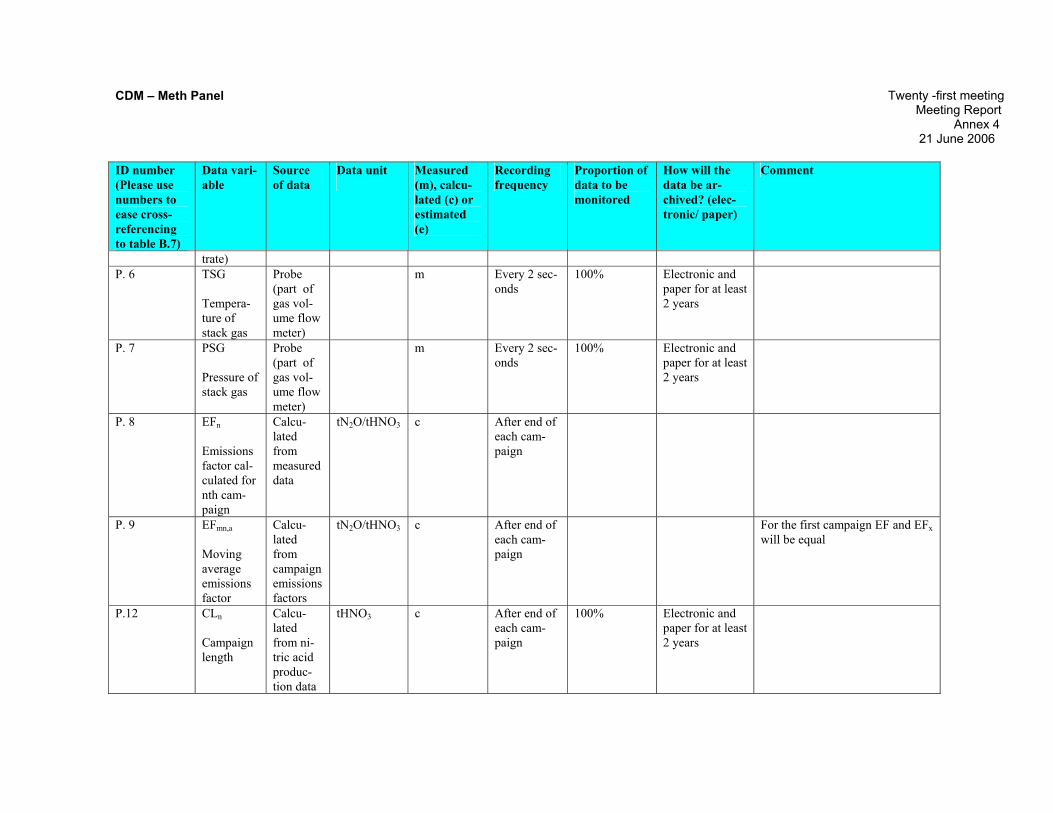
CDM – Meth Panel Twenty -first meeting Meeting Report Annex 4 21 June 2006 ID number (Please use numbers to ease cross-referencing to table B.7)
Data vari-able
Source of data
Data unit
Measured (m), calcu-lated (c) or estimated (e)
Recording frequency
Proportion of data to be monitored
How will the data be ar-chived? (elec-tronic/ paper)
Comment
trate) P. 6 TSG
Tempera-ture of stack gas
Probe (part of gas vol-ume flow meter)
m Every 2 sec-onds
100% Electronic and paper for at least 2 years
P. 7 PSG Pressure of stack gas
Probe (part of gas vol-ume flow meter)
m Every 2 sec-onds
100% Electronic and paper for at least 2 years
P. 8 EFn Emissions factor cal-culated for nth cam-paign
Calcu-lated from measured data
tN2O/tHNO3 c After end of each cam-paign
P. 9 EFmn,a Moving average emissions factor
Calcu-lated from campaign emissions factors
tN2O/tHNO3 c After end of each cam-paign
For the first campaign EF and EFx will be equal
P.12 CLn Campaign length
Calcu-lated from ni-tric acid produc-tion data
tHNO3 c After end of each cam-paign
100% Electronic and paper for at least 2 years
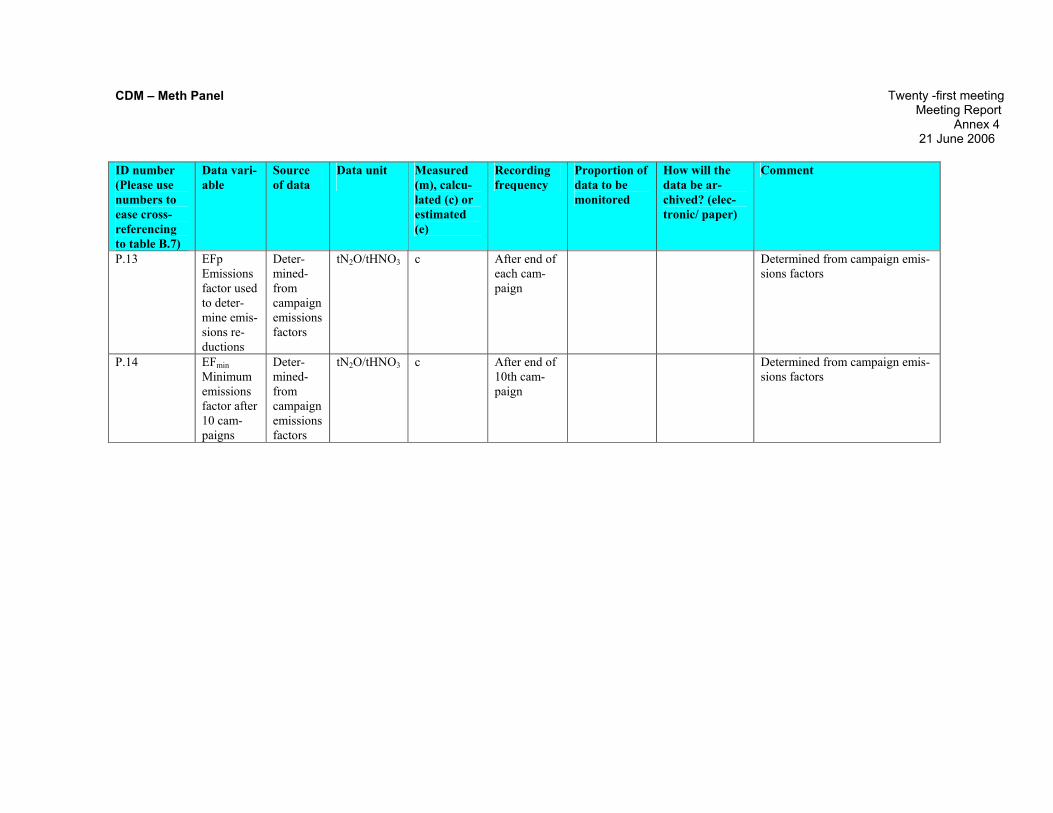
CDM – Meth Panel Twenty -first meeting Meeting Report Annex 4 21 June 2006 ID number (Please use numbers to ease cross-referencing to table B.7)
Data vari-able
Source of data
Data unit
Measured (m), calcu-lated (c) or estimated (e)
Recording frequency
Proportion of data to be monitored
How will the data be ar-chived? (elec-tronic/ paper)
Comment
P.13 EFp Emissions factor used to deter-mine emis-sions re-ductions
Deter-mined-from campaign emissions factors
tN2O/tHNO3 c After end of each cam-paign
Determined from campaign emis-sions factors
P.14 EFmin Minimum emissions factor after 10 cam-paigns
Deter-mined-from campaign emissions factors
tN2O/tHNO3 c After end of 10th cam-paign
Determined from campaign emis-sions factors
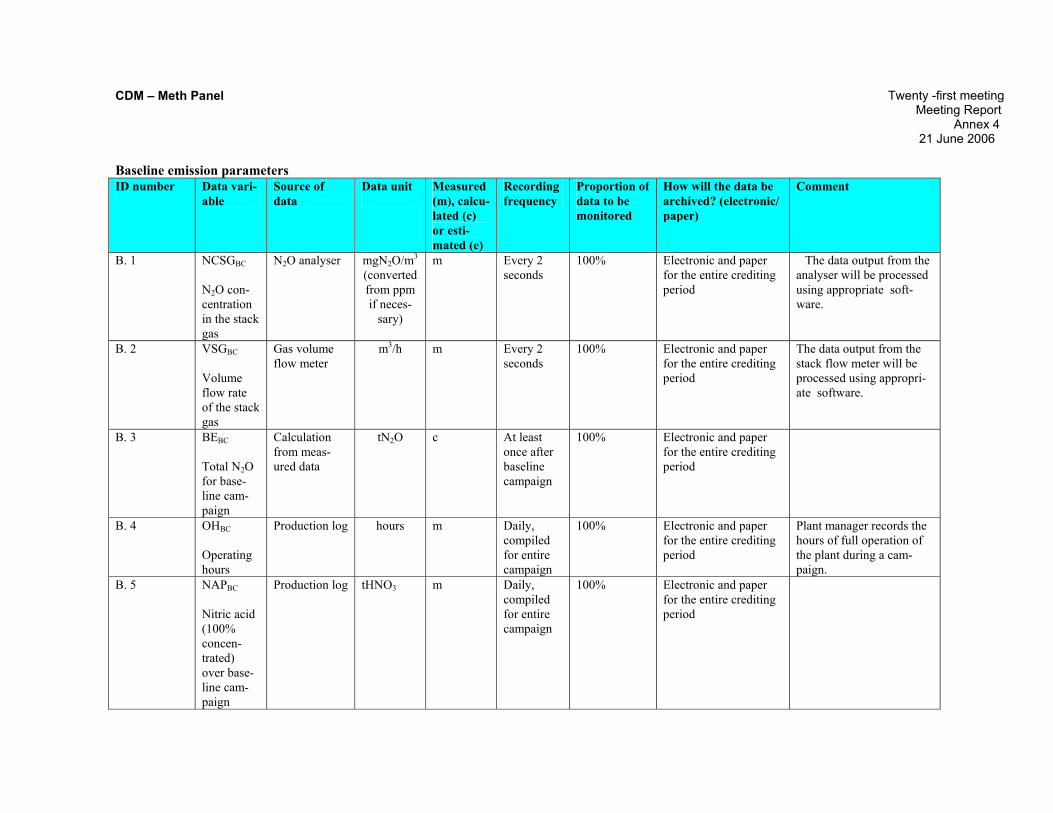
CDM – Meth Panel Twenty -first meeting Meeting Report Annex 4 21 June 2006 Baseline emission parameters ID number
Data vari-able
Source of data
Data unit
Measured (m), calcu-lated (c) or esti-mated (e)
Recording frequency
Proportion of data to be monitored
How will the data be archived? (electronic/ paper)
Comment
B. 1 NCSGBC N2O con-centration in the stack gas
N2O analyser mgN2O/m3
(converted from ppm if neces-
sary)
m Every 2 seconds
100% Electronic and paper for the entire crediting period
The data output from the analyser will be processed using appropriate soft-ware.
B. 2 VSGBC Volume flow rate of the stack gas
Gas volume flow meter
m3/h m Every 2 seconds
100% Electronic and paper for the entire crediting period
The data output from the stack flow meter will be processed using appropri-ate software.
B. 3 BEBC Total N2O for base-line cam-paign
Calculation from meas-ured data
tN2O c At least once after baseline campaign
100% Electronic and paper for the entire crediting period
B. 4 OHBC Operating hours
Production log hours m Daily, compiled for entire campaign
100% Electronic and paper for the entire crediting period
Plant manager records the hours of full operation of the plant during a cam-paign.
B. 5 NAPBC Nitric acid (100% concen-trated) over base-line cam-paign
Production log tHNO3 m Daily, compiled for entire campaign
100% Electronic and paper for the entire crediting period

CDM – Meth Panel Twenty -first meeting Meeting Report Annex 4 21 June 2006 ID number
Data vari-able
Source of data
Data unit
Measured (m), calcu-lated (c) or esti-mated (e)
Recording frequency
Proportion of data to be monitored
How will the data be archived? (electronic/ paper)
Comment
B. 6 TSG Tempera-ture of stack gas
Probe (part of gas volume flow meter)
m Every 2 seconds
100% Electronic and paper for the entire crediting period
B. 7. PSG Pressure of stack gas
Probe (part of gas volume flow meter)
m Every 2 seconds
100% Electronic and paper for the entire crediting period
B. 8 EFBL Emissions factor for baseline period
Calculated from meas-ured data
tN2O/ tHNO3
c At the end of the base-line cam-paign
Electronic and paper for the entire crediting period
B. 9 UNC Overall measure-ment un-certainty of the moni-toring sys-tem
Calculation of the combined uncertainty of the applied monitoring equipment
% c Once after monitoring system is commis-sioned
Electronic and paper for the duration of the project
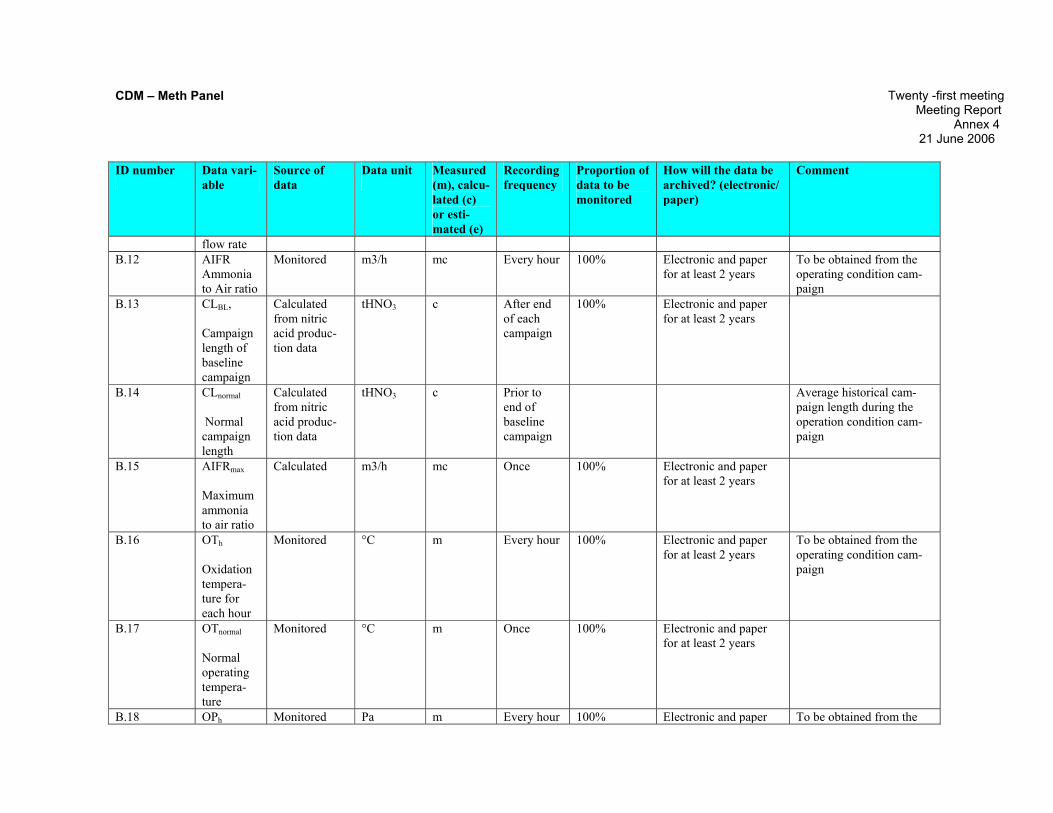
B.10 AFR Ammonia gas flow rate to the AOR
Monitored kgNH3/h m Continu-ously
100% Electronic and paper for at least 2 years
To be obtained from the operating condition cam-paign
B.11 AFRmax Maximum ammonia
Plant records kgNH3/h m Once 100% Electronic and paper for at least 2 years
CDM – Meth Panel Twenty -first meeting Meeting Report Annex 4 21 June 2006 ID number
Data vari-able
Source of data
Data unit
Measured (m), calcu-lated (c) or esti-mated (e)
Recording frequency
Proportion of data to be monitored
How will the data be archived? (electronic/ paper)
Comment
flow rate B.12 AIFR
Ammonia to Air ratio
Monitored m3/h mc Every hour 100% Electronic and paper for at least 2 years
To be obtained from the operating condition cam-paign
B.13 CLBL, Campaign length of baseline campaign
Calculated from nitric acid produc-tion data
tHNO3 c After end of each campaign
100% Electronic and paper for at least 2 years
B.14 CLnormal Normal campaign length
Calculated from nitric acid produc-tion data
tHNO3 c Prior to end of baseline campaign
Average historical cam-paign length during the operation condition cam-paign
B.15 AIFRmax Maximum ammonia to air ratio
Calculated m3/h mc Once 100% Electronic and paper for at least 2 years
B.16 OTh Oxidation tempera-ture for each hour
Monitored °C m Every hour 100% Electronic and paper for at least 2 years
To be obtained from the operating condition cam-paign
B.17 OTnormal Normal operating tempera-ture
Monitored °C m Once 100% Electronic and paper for at least 2 years
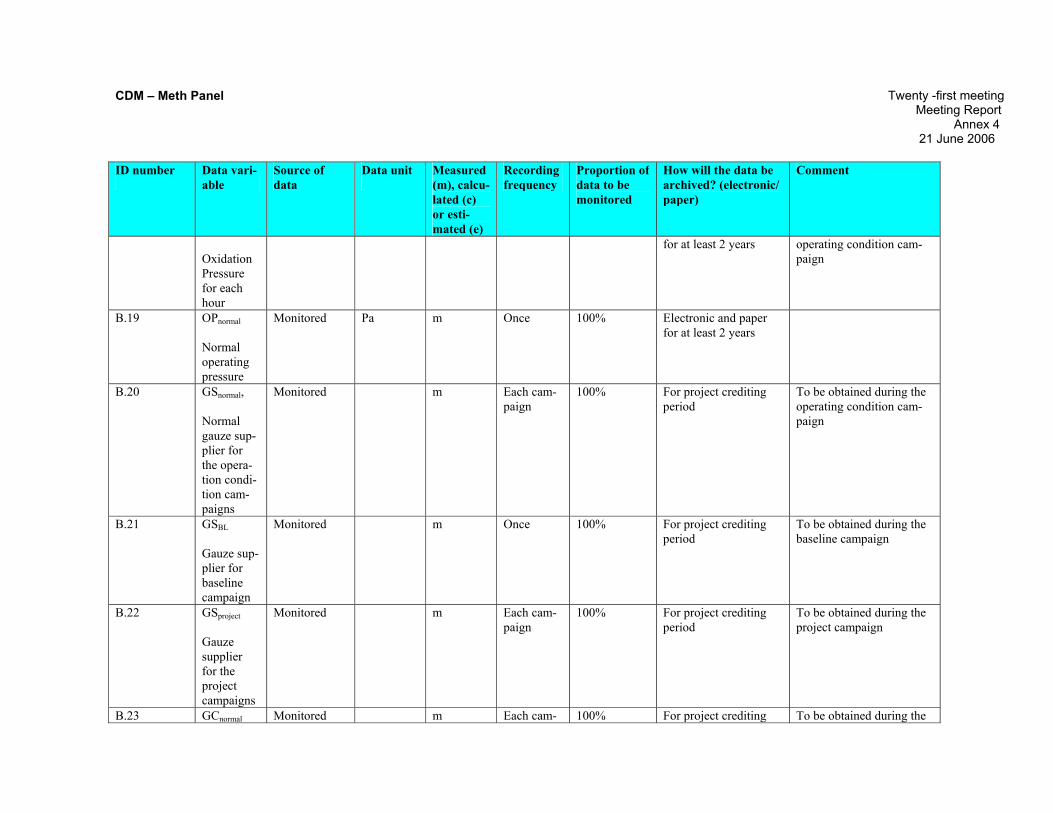
B.18 OPh Monitored Pa m Every hour 100% Electronic and paper To be obtained from the
CDM – Meth Panel Twenty -first meeting Meeting Report Annex 4 21 June 2006 ID number
Data vari-able
Source of data
Data unit
Measured (m), calcu-lated (c) or esti-mated (e)
Recording frequency
Proportion of data to be monitored
How will the data be archived? (electronic/ paper)
Comment
Oxidation Pressure for each hour
for at least 2 years operating condition cam-paign
B.19 OPnormal Normal operating pressure
Monitored Pa m Once 100% Electronic and paper for at least 2 years
B.20 GSnormal, Normal gauze sup-plier for the opera-tion condi-tion cam-paigns
Monitored m Each cam-paign
100% For project crediting period
To be obtained during the operating condition cam-paign
B.21 GSBL Gauze sup-plier for baseline campaign
Monitored m Once 100% For project crediting period
To be obtained during the baseline campaign
B.22 GSproject Gauze supplier for the project campaigns
Monitored m Each cam-paign
100% For project crediting period
To be obtained during the project campaign
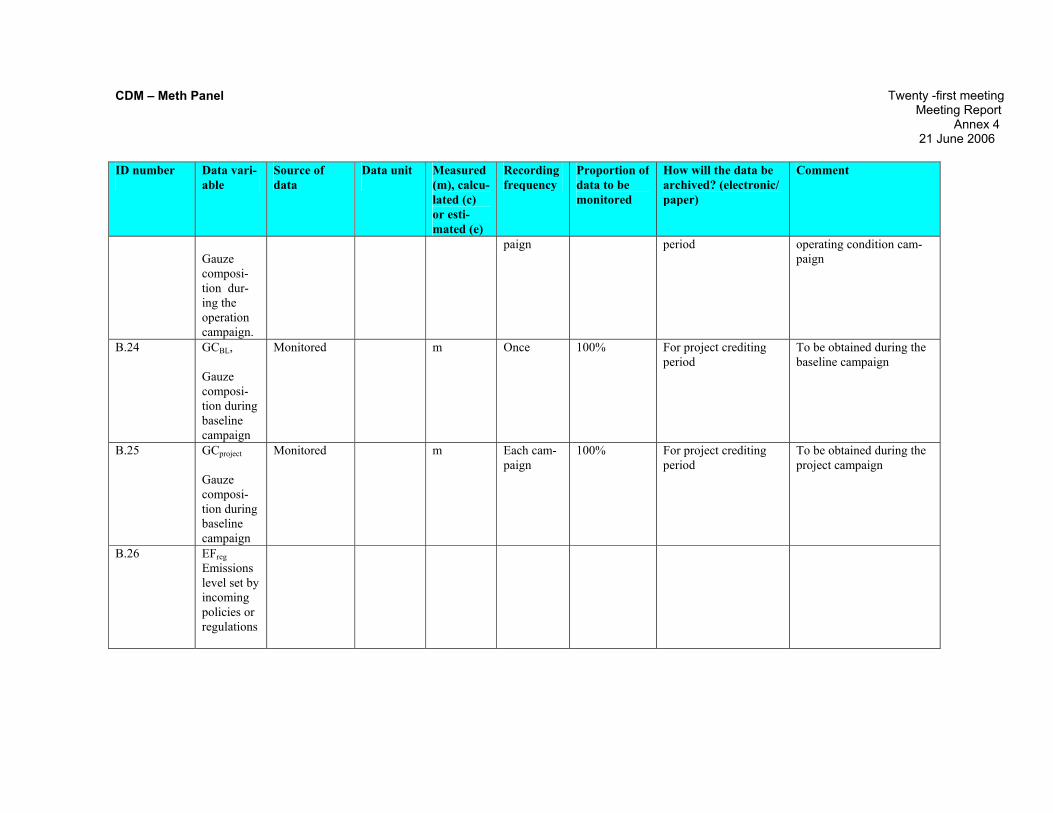
B.23 GCnormal Monitored m Each cam- 100% For project crediting To be obtained during the
CDM – Meth Panel Twenty -first meeting Meeting Report Annex 4 21 June 2006 ID number
Data vari-able
Source of data
Data unit
Measured (m), calcu-lated (c) or esti-mated (e)
Recording frequency
Proportion of data to be monitored
How will the data be archived? (electronic/ paper)
Comment
Gauze composi-tion dur-ing the operation campaign.
paign period operating condition cam-paign
B.24 GCBL, Gauze composi-tion during baseline campaign
Monitored m Once 100% For project crediting period
To be obtained during the baseline campaign
B.25 GCproject Gauze composi-tion during baseline campaign
Monitored m Each cam-paign
100% For project crediting period
To be obtained during the project campaign
B.26 EFreg Emissions level set by incoming policies or regulations

CDM – Meth Panel Twenty -first meeting Meeting Report Annex 4 21 June 2006 Data Uncertainty level of data
(High/Medium/Low) Explain QA/QC procedures planned for these data, or why such procedures are not nec-essary.
P.1; P.2; B.1; B.2; P.6; P.7; B.6; B.7
Low Regular calibrations according to vendor specifications and recognised industry standards (EN 14181). Staff will be trained in monitoring procedures and a reliable technical support infra-structure will set up.
Automated Monitor-ing System. Section B.2
Low Quality assurance tests and annual functional test for the Automated Measuring Systems (in-cluding SRM measurements) are recommended regarding the selection, installation, configura-tion and operation of the Automated Measuring Systems (cf. section B.2). Application of abil-ity tested Automated Measuring System. Calculation of Automated Measuring System uncer-tainty. Maintenance checks and regular calibrations according to vendor specifications stan-dards. It is recommended that main spare parts be kept on -site to guarantee optimum uptime performance. Weekly and monthly service and maintenance should be performed by the user following instructions during the commissioning phase. The vendor will undertake annual Ser-vice. Technical Support avoids downtimes and comprise of local back up through service agent including maintenance and re-commissioning if necessary. Moreover, full field and workshop support, hot-line technical telephone and online support. It is recommended to address Quality Control by having an independent validator on site for the calibration of the monitoring equip-ment and system during the commissioning phase.
P.4; P.5; P.8; P.9; P.10; P.11; B.4; B.5; B.8; B.9; B.10;
Low Included in evaluation by third party validator.
Measuring points. Section B.2
Low In the selection of downstream measuring points the following issues have to be considered: temperature of the gas below 300°C (N2O inert), assurance of homogeneity of the volume gas flow at the measuring points throughout the diameter in terms of velocity of flow and mass composition of gas flow, possible turbulences in the gas flow stream ( e.g. at the stack walls), if in-homogeneities exist, measuring of the gas flow has to be conducted with specific measuring equipment that minimizes uncertainties and non-homogeneities to a minimum (e.g. multiple probe measuring units that allow for a representative coverage of the gas flow across the stack diameter). It is recommended that the measuring points be placed at points with the plant with easy access behind the gas expander turbine where the gas flow streams are consistent.
Option 2 Dynamic Baseline Section B.3
Low Measurement uncertainties that could occur by applying continuous online measurement up-stream of the secondary catalyst are avoided from the beginning (Heterogeneity of gas compo-sition; Space constraints and gas leaks; Corrosion due to acidic environment; Downstream re-actions).
CDM – Meth Panel Twenty -first meeting Meeting Report Annex 4 21 June 2006 Data Uncertainty level of data
(High/Medium/Low) Explain QA/QC procedures planned for these data, or why such procedures are not nec-essary.
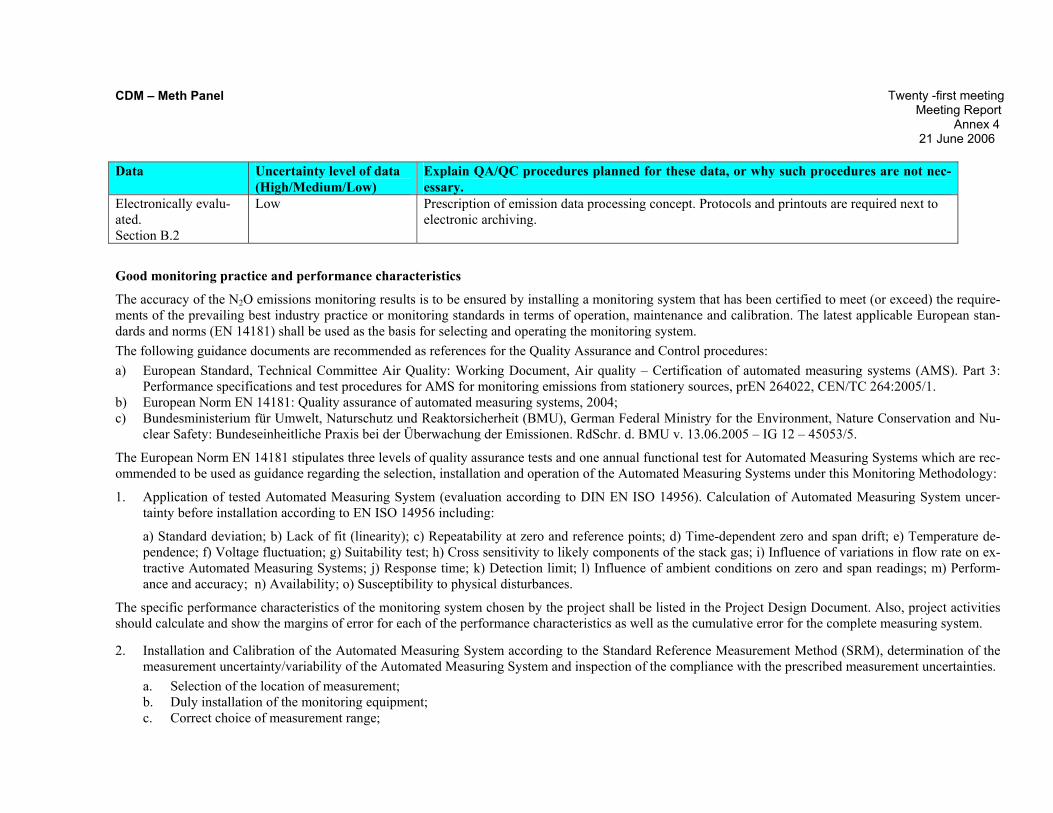
Electronically evalu-ated. Section B.2
Low Prescription of emission data processing concept. Protocols and printouts are required next to electronic archiving.
Good monitoring practice and performance characteristics
The accuracy of the N2O emissions monitoring results is to be ensured by installing a monitoring system that has been certified to meet (or exceed) the require-ments of the prevailing best industry practice or monitoring standards in terms of operation, maintenance and calibration. The latest applicable European stan-dards and norms (EN 14181) shall be used as the basis for selecting and operating the monitoring system. The following guidance documents are recommended as references for the Quality Assurance and Control procedures: a) European Standard, Technical Committee Air Quality: Working Document, Air quality – Certification of automated measuring systems (AMS). Part 3:
Performance specifications and test procedures for AMS for monitoring emissions from stationery sources, prEN 264022, CEN/TC 264:2005/1. b) European Norm EN 14181: Quality assurance of automated measuring systems, 2004; c) Bundesministerium für Umwelt, Naturschutz und Reaktorsicherheit (BMU), German Federal Ministry for the Environment, Nature Conservation and Nu-
clear Safety: Bundeseinheitliche Praxis bei der Überwachung der Emissionen. RdSchr. d. BMU v. 13.06.2005 – IG 12 – 45053/5.
The European Norm EN 14181 stipulates three levels of quality assurance tests and one annual functional test for Automated Measuring Systems which are rec-ommended to be used as guidance regarding the selection, installation and operation of the Automated Measuring Systems under this Monitoring Methodology:
1. Application of tested Automated Measuring System (evaluation according to DIN EN ISO 14956). Calculation of Automated Measuring System uncer-tainty before installation according to EN ISO 14956 including:
a) Standard deviation; b) Lack of fit (linearity); c) Repeatability at zero and reference points; d) Time-dependent zero and span drift; e) Temperature de-pendence; f) Voltage fluctuation; g) Suitability test; h) Cross sensitivity to likely components of the stack gas; i) Influence of variations in flow rate on ex-tractive Automated Measuring Systems; j) Response time; k) Detection limit; l) Influence of ambient conditions on zero and span readings; m) Perform-ance and accuracy; n) Availability; o) Susceptibility to physical disturbances.
The specific performance characteristics of the monitoring system chosen by the project shall be listed in the Project Design Document. Also, project activities should calculate and show the margins of error for each of the performance characteristics as well as the cumulative error for the complete measuring system.
2. Installation and Calibration of the Automated Measuring System according to the Standard Reference Measurement Method (SRM), determination of the measurement uncertainty/variability of the Automated Measuring System and inspection of the compliance with the prescribed measurement uncertainties. a. Selection of the location of measurement; b. Duly installation of the monitoring equipment; c. Correct choice of measurement range;
CDM – Meth Panel Twenty -first meeting Meeting Report Annex 4 21 June 2006
d. Calibration of the Automated Measuring System using the Standard-Reference-Method (SRM) as guidance; e. Calibration curve either as linear regression or as straight line from absolute zero to centre of a scatter-plot; f. Calculation of the standard deviation at the 95% confidence interval; g. Inspection every three years.
3. Continuous quality assurance through the local operator/manager (drift and accuracy of the Automated Measuring System, verification management and documentation).
a. Permanent quality assurance during the plant operation by the operating staff; b. Assurance of reliable and correct operation of the monitoring equipment (maintenance evidence); c. Regular controls: zero point, span, drift, meet schedule of manufacturer maintenance intervals;
Annual functionality test including SRM measurements to check for uncertainties in the data measured by the Automated Measuring System.
d. Annual confirmation of the calibration curve; e. Validity proof of calibration curves; f. Back-setting of excess meter of invalid calibration range.
EN 14181 prescribes which features Automated Measuring Systems need and how they are to be calibrated and maintained. The data resulting from the calibra-tion experiment determine the calibration function as well as the measurement uncertainty and play the decisive role regarding the continuous monitoring of the measured data.
Minimum requirements for electronic evaluation units
g. Evaluation unit needs to take into account registration, mean average determination, validation, and evaluation; h. The system and concept of emission data processing needs to be described; i. Protocols and out-prints are required.
Downtime of Automated Measuring System
In the event that the monitoring system is down, the lowest between the conservative IPCC (4.5 kg N2O/ton nitric acid) or the last measured value will be valid and applied for the downtime period for the baseline emission factor, and the highest measured value in the campaign will be applied for the downtime period for the campaign emission factor.
Data Sources Association Française de Normalisation (AFNOR): Official standard for measuring and quantifying N2O emissions in nitric acid plants, 2003.
CDM – Meth Panel Twenty -first meeting Meeting Report Annex 4 21 June 2006 Bundesministerium für Umwelt, Naturschutz und Reaktorsicherheit (BMU): Bundeseinheitliche Praxis bei der Überwachung der Emissionen. RdSchr. d. BMU v. 13.06.2005 – IG 12 – 45053/5. German Federal Ministry for the Environment, Nature Conservation and Nuclear Safety: Federal Standard Practice of Emis-sion Monitoring, BMU, 2005.
European Norm EN 14181: Quality assurance of automated measuring systems, 2004.
European Standard, Technical Committee Air Quality: Working Document, Air quality – Certification of automated measuring systems (AMS). Part 3: Per-formance specifications and test procedures for AMS for monitoring emissions from stationery sources, prEN 264022, CEN/TC 264:2005/1.
European Fertilizers Manufacturers Association (EFMA): Best Available Techniques for Pollution Prevention and Control in the European Fertilizer Industry (Booklet No. 2 of 8) “PRODUCTION OF NITRIC ACID”, 2000.
European Fertilizer Manufacturers (EFMA): “The European Fertilizer Manufacturers’ Position on the European Commission’s Proposal for a Directive on EU Emissions Trading”, March 2005.
GHG Protocol (www.ghgprotocol.org): “Calculating N2O Emissions from the Production of Nitric Acid” Guide to calculation worksheets, October 2001.
Intergovernmental Panel on Climate Change (IPCC): “Default Factors for N2O from Nitric Acid Production”, 2002.
Integrated Pollution Prevention and Control (IPPC): “Good Practice Guidance and Uncertainty Management in National Greenhouse Gas Inventories – N2O Emissions from Adipic Acid and Nitric Acid Production”. Author Heike Mainhardt, ICF Inc, 2000.
Ruffer, A. von: Personal communication between GIAP, JSC Research and Development Institute of Nitrogen Industry and Organic Synthetic Products, Russia, and Albrecht von Ruffer, N.serve GmbH, on Russian nitric acid plant types and related N2O emission levels, 2005.
Ruffer, A. von, Velsen-Zerweck, M. von: Personal communication between Johnson Matthey, dep. Noble Metals and Albrecht von Ruffer, Marten von Velsen-Zerweck, N.serve Environmental Services GmbH, on “Experience with measurements of N2O concentrations inside ammonia burners”, 2005.
Marzo, L. M.: “Nitric Acid Production and Abatement Technology Including Azeotropic Acid”, The International Fertilizer Society, Proceedings No. 540, 2004.
Schwefer, M., Maurer, R., Groves, M.: “Reduction of Nitrous Oxide Emissions from Nitric Acid Plants”, Proceedings of Nitrogen 2000 in Vienna, 2000.
World Business Council for Sustainable Development (WBCSD): www.ghgprotocol.org, September 18 2005