DRAFT Action Plan YR5 July 1, 2014 – June 30, 2015
113
CITY OF MEDFORD HAZARD MITIGATION PLAN CITY OF MEDFORD HAZARD MITIGATION PLAN UPDATE Draft for City of Medford Review June 2013 Metropolitan Area Planning Council
-
Upload
medford-public-schools-and-city-of-medford-ma -
Category
Documents
-
view
220 -
download
3
Transcript of DRAFT Action Plan YR5 July 1, 2014 – June 30, 2015

CITY OF MEDFORD HAZARD MITIGATION PLAN
CITY OF MEDFORD
HAZARD MITIGATION PLAN
UPDATE
\
Draft for City of Medford Review June 2013
Metropolitan Area Planning Council

CITY OF MEDFORD HAZARD MITIGATION PLAN
[This page intentionally left blank]
CITY OF MEDFORD HAZARD MITIGATION PLAN
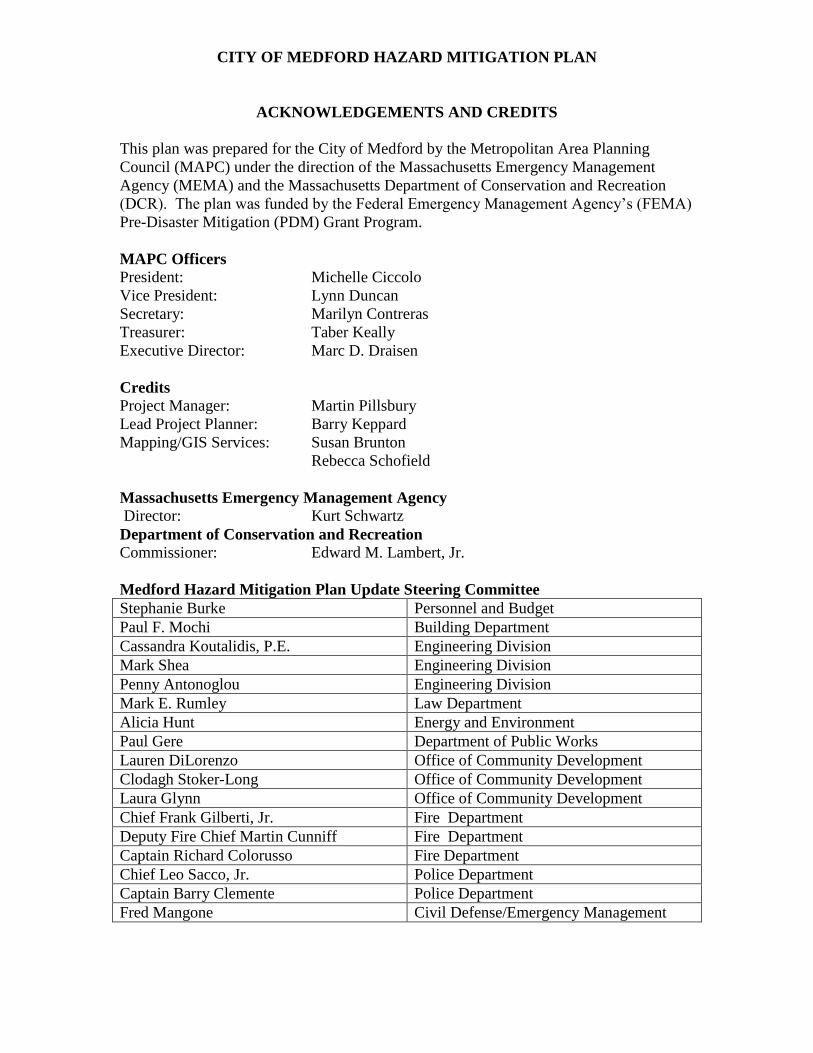
ACKNOWLEDGEMENTS AND CREDITS
This plan was prepared for the City of Medford by the Metropolitan Area Planning
Council (MAPC) under the direction of the Massachusetts Emergency Management
Agency (MEMA) and the Massachusetts Department of Conservation and Recreation
(DCR). The plan was funded by the Federal Emergency Management Agency’s (FEMA)
Pre-Disaster Mitigation (PDM) Grant Program.
MAPC Officers
President: Michelle Ciccolo
Vice President: Lynn Duncan
Secretary: Marilyn Contreras
Treasurer: Taber Keally
Executive Director: Marc D. Draisen
Credits
Project Manager: Martin Pillsbury
Lead Project Planner: Barry Keppard
Mapping/GIS Services: Susan Brunton
Rebecca Schofield
Massachusetts Emergency Management Agency
Director: Kurt Schwartz
Department of Conservation and Recreation
Commissioner: Edward M. Lambert, Jr.
Medford Hazard Mitigation Plan Update Steering Committee
Stephanie Burke Personnel and Budget
Paul F. Mochi Building Department
Cassandra Koutalidis, P.E. Engineering Division
Mark Shea Engineering Division
Penny Antonoglou Engineering Division
Mark E. Rumley Law Department
Alicia Hunt Energy and Environment
Paul Gere Department of Public Works
Lauren DiLorenzo Office of Community Development
Clodagh Stoker-Long Office of Community Development
Laura Glynn Office of Community Development
Chief Frank Gilberti, Jr. Fire Department
Deputy Fire Chief Martin Cunniff Fire Department
Captain Richard Colorusso Fire Department
Chief Leo Sacco, Jr. Police Department
Captain Barry Clemente Police Department
Fred Mangone Civil Defense/Emergency Management

CITY OF MEDFORD HAZARD MITIGATION PLAN
[This page intentionally left blank]
CITY OF MEDFORD HAZARD MITIGATION PLAN
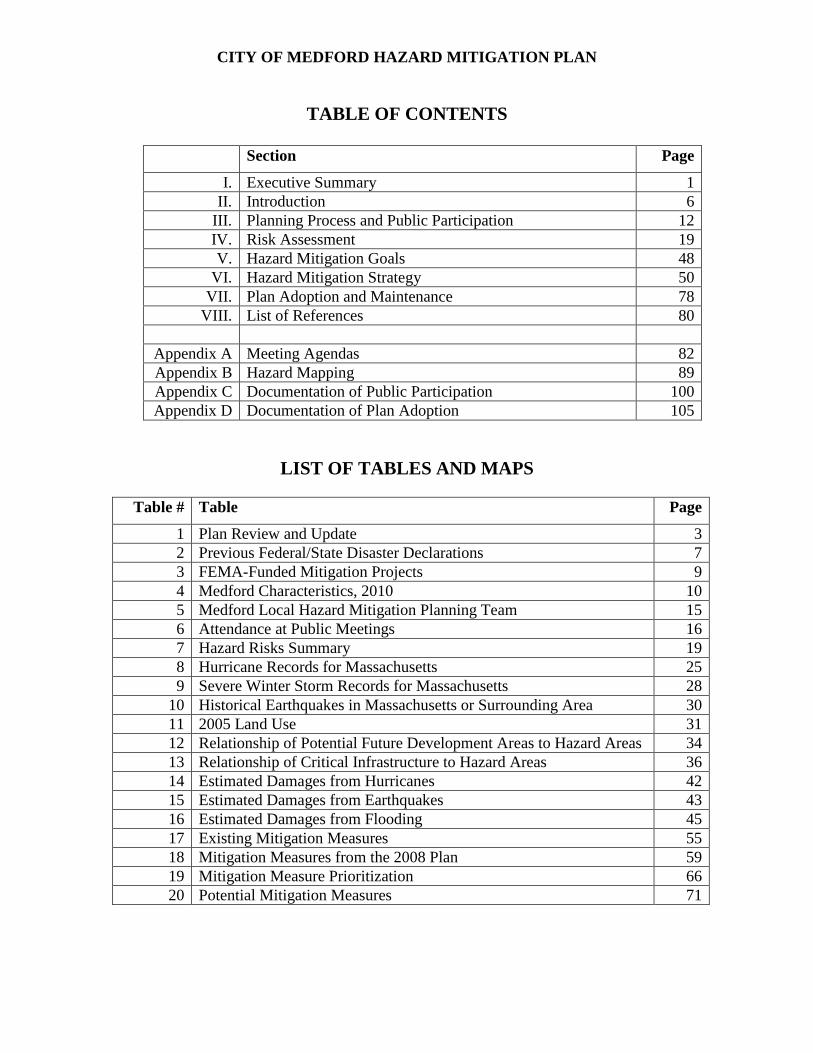
TABLE OF CONTENTS
Section Page
I. Executive Summary 1
II. Introduction 6
III. Planning Process and Public Participation 12
IV. Risk Assessment 19
V. Hazard Mitigation Goals 48
VI. Hazard Mitigation Strategy 50
VII. Plan Adoption and Maintenance 78
VIII. List of References 80
Appendix A Meeting Agendas 82
Appendix B Hazard Mapping 89
Appendix C Documentation of Public Participation 100
Appendix D Documentation of Plan Adoption 105
LIST OF TABLES AND MAPS
Table # Table Page
1 Plan Review and Update 3
2 Previous Federal/State Disaster Declarations 7
3 FEMA-Funded Mitigation Projects 9
4 Medford Characteristics, 2010 10
5 Medford Local Hazard Mitigation Planning Team 15
6 Attendance at Public Meetings 16
7 Hazard Risks Summary 19
8 Hurricane Records for Massachusetts 25
9 Severe Winter Storm Records for Massachusetts 28
10 Historical Earthquakes in Massachusetts or Surrounding Area 30
11 2005 Land Use 31
12 Relationship of Potential Future Development Areas to Hazard Areas 34
13 Relationship of Critical Infrastructure to Hazard Areas 36
14 Estimated Damages from Hurricanes 42
15 Estimated Damages from Earthquakes 43
16 Estimated Damages from Flooding 45
17 Existing Mitigation Measures 55
18 Mitigation Measures from the 2008 Plan 59
19 Mitigation Measure Prioritization 66
20 Potential Mitigation Measures 71

CITY OF MEDFORD HAZARD MITIGATION PLAN
[This page intentionally left blank]
CITY OF MEDFORD HAZARD MITIGATION PLAN
1
I. EXECUTIVE SUMMARY
Hazard Mitigation planning is a proactive effort to identify actions that can be taken to
reduce the dangers to life and property from natural hazard events. In the communities of
the Boston region of Massachusetts, hazard mitigation planning tends to focus most on
flooding, the most likely natural hazard to impact these communities. The Federal
Disaster Mitigation Act of 2000 requires all municipalities that wish to be eligible to
receive FEMA funding for hazard mitigation grants, to adopt a local multi-hazard
mitigation plan and update this plan in five year intervals.
Planning Process
Planning for the Medford Hazard Mitigation Plan update was led by the Medford Local
Hazard Mitigation Planning Committee, composed of staff from a number of different
City Departments. This committee discussed where the impacts of natural hazards most
affect the City, goals for addressing these impacts, and hazard mitigation measures that
would benefit the City.
Public participation in this planning process is important for improving awareness of the
potential impacts of natural hazards and to build support for the actions the City takes to
mitigate them. The City hosted two public meetings, the first on May 2, 2013 and the
second on June 11, 2013. The draft plan also was posted on the City’s website for public
review and comment for a ten day period following the second public meeting and
completion of the first draft of the Plan. Both meetings included a description of the
hazard mitigation planning process and an overview of the plan, and the second meeting
included a summary of the proposed mitigation actions as well as directions on how the
public could access the draft plan on the City website and make comments. The public
was given time to ask questions and comment at all public meetings. A list of those
submitting public comments can be found in Appendix C.
Preceding these meetings, a public, regional meeting of the Metro Boston Multiple
Hazard Community Planning Team was held April 13, 2012 to re-introduce participating
communities to the hazard mitigation planning process and to identify inter-community
hazard mitigation issues.
Risk Assessment
The Medford Hazard Mitigation Plan assesses the potential impacts to the City from
flooding, high winds, severe storms, brush fire, and geologic hazards. Flooding, as a
result of hurricanes, nor’easters and other severe storms, clearly presents the greatest
hazard to the City, most especially in locations where the drainage system has under
capacity infrastructure or has issues such as siltation that have limited the existing
capacity of pipes and channels. This is the case in locations such as South Medford and
areas around Meetinghouse Brook.

CITY OF MEDFORD HAZARD MITIGATION PLAN
2
The Medford Local Committee identified those areas where flooding most frequently
occurs, comprising approximately 9% of the City’s land area, and approximately 1,436
buildings worth an estimated $429,017,480.
Hazard Mitigation Goals
1. Prevent and reduce the loss of life, injury and property damages resulting from all
major natural hazards.
2. Identify and seek funding for measures to mitigate or eliminate each known
significant flood hazard area.
3. Integrate hazard mitigation planning as an integral factor in all relevant municipal
departments, committees and boards.
4. Prevent and reduce the damage to public infrastructure resulting from all hazards.
5. Encourage the business community, major institutions and non-profits to work
with the City to develop, review and implement the hazard mitigation plan.
6. Work with surrounding communities, state, regional and federal agencies to
ensure regional cooperation and solutions for hazards affecting multiple
communities.
7. Ensure that future development meets all applicable standards for preventing and
reducing the impacts of natural hazards.
8. Take maximum advantage of resources from FEMA, MEMA and other agencies
to educate City staff and the public about hazard mitigation.
Hazard Mitigation Strategy
The Medford Local Committee identified a number of mitigation measures that would
serve to reduce the City’s vulnerability to natural hazard events. Largely these are related
to maintaining the integrity of the drainage system through addressing maintenance,
reconstruction and replacements issues. There is also a strong emphasis on preventative
measures such as working with private landowners to clear catch basins and working
with utility companies to trim trees around utility lines so that both hazard mitigation and
emergency response can be handled efficiently and effectively.
Overall, the hazard mitigation strategy recognizes that mitigating hazards for Medford
will be an ongoing process as our understanding of natural hazards and the steps that can
be taken to mitigate their damages changes over time. Global climate change and the
accompanying changes to precipitation amounts and frequency and average temperatures
impact the City’s vulnerability, and local officials will need to work together across
municipal lines and with state and federal agencies in order to understand and address

CITY OF MEDFORD HAZARD MITIGATION PLAN
3
these changes. The Hazard Mitigation Strategy will be incorporated into other related
plans and policies.
Plan Review and Update Process
Table 1. Plan Review and Update
Chapter Reviews and Updates
III – Planning Process
and Public Participation
The Medford Local Committee placed an emphasis on public
participation for the update of the Hazard Mitigation Plan,
discussing strategies to enhance participation opportunities at
the first local committee meeting. During plan development,
the plan was discussed at a two public meetings hosted by
the City. The second meeting, which was a Committee of
the Whole meeting. The plan was also available on the
City’s website for public comment.
IV – Risk Assessment MAPC gathered the most recently available hazard and land
use data and met with City staff to identify changes in local
hazard areas and development trends. City staff reviewed
critical infrastructure with MAPC staff in order to create an
up-to-date list. MAPC also used the most recently available
version of HAZUS and assessed the potential impacts of
flooding using the latest data.
V - Goals The Hazard Mitigation Goals from the 2008 Plan were
reviewed and endorsed by the Local Hazard Mitigation
Committee.
VI – Existing Mitigation
Measures
The list of existing mitigation measures was updated to
reflect current mitigation activities in the City.
VII & VIII – Hazard
Mitigation Strategy
Mitigation measures from the 2008 plan were reviewed and
assessed as to whether they were completed, on-going, or
deferred. The Local Committee determined whether to carry
forward measures into the 2013 plan or delete them. The
2013 Hazard Mitigation Strategy reflects both new measures
and measures carried forward from the 2008 plan. The
Committee re-prioritized all of these measures based on
current conditions.
IX – Plan Adoption &
Maintenance
This section of the plan was updated with a new on-going
plan implementation review and five year update process
that will assist the City in incorporating hazard mitigation
issues into other City planning and regulatory review
processes and better prepare the City to update the plan in
2017.
CITY OF MEDFORD HAZARD MITIGATION PLAN
4
As indicated on Table 18, Medford has made progress on implementing mitigation
measures identified in the 2008 Hazard Mitigation Plan. While some of the measures
identified in that plan were completed, many more still require the continued study and
identification of funding resources to support construction and/or equipment purchases.
Moving forward into the next five year plan implementation period, there will be many
more opportunities to incorporate hazard mitigation into the City’s decision making
processes.

CITY OF MEDFORD HAZARD MITIGATION PLAN
5
[This page intentionally left blank]

CITY OF MEDFORD HAZARD MITIGATION PLAN
6
II. INTRODUCTION
Planning Requirements under the Federal Disaster Mitigation Act
The Federal Disaster Mitigation Act, passed in 2000, requires that after November 1
2004, all municipalities that wish to continue to be eligible to receive FEMA funding for
hazard mitigation grants, must adopt a local multi-hazard mitigation plan and update this
plan in five year intervals. This planning requirement does not affect disaster assistance
funding.
Federal hazard mitigation planning and grant programs are administered by the Federal
Emergency Management Agency (FEMA) in collaboration with the states. These
programs are administered in Massachusetts by the Massachusetts Emergency
Management Agency (MEMA) in partnership with the Department of Conservation and
Recreation (DCR). Massachusetts has taken a regional approach and has encouraged the
regional planning agencies to apply for grants to prepare plans for groups of their
member communities. The Metropolitan Area Planning Council (MAPC) received a
grant from FEMA under the Pre-Disaster Mitigation (PDM) Program to assist the City of
Medford, and seven other municipalities in the Inner Core region, to update their local
Hazard Mitigation Plans, which were first adopted in 2008 as part of a Metro-Boston
Multi Hazard Mitigation Plan. These local Hazard Mitigation Plan updates are designed
to meet the requirements of the Disaster Mitigation Act for each community.
In order to address multijurisdictional and regional issues, the participating municipalities
were afforded the opportunity to meet with their neighboring communities during plan
development. A public, regional meeting of the Metro Boston Multiple Hazard
Community Planning Team was held April 13, 2012 to re-introduce participating
communities to the hazard mitigation planning process and to identify inter-community
hazard mitigation issues.
What is a Hazard Mitigation Plan?
Natural hazard mitigation planning is the process of determining how to systematically
reduce or eliminate the loss of life and property damage resulting from natural hazards
such as floods, earthquakes, and hurricanes. Hazard mitigation means to permanently
reduce or alleviate the losses of life, injuries, and property resulting from natural hazards
through long-term strategies. These long-term strategies include planning, policy
changes, programs, projects, and other activities.
Previous Federal/State Disasters
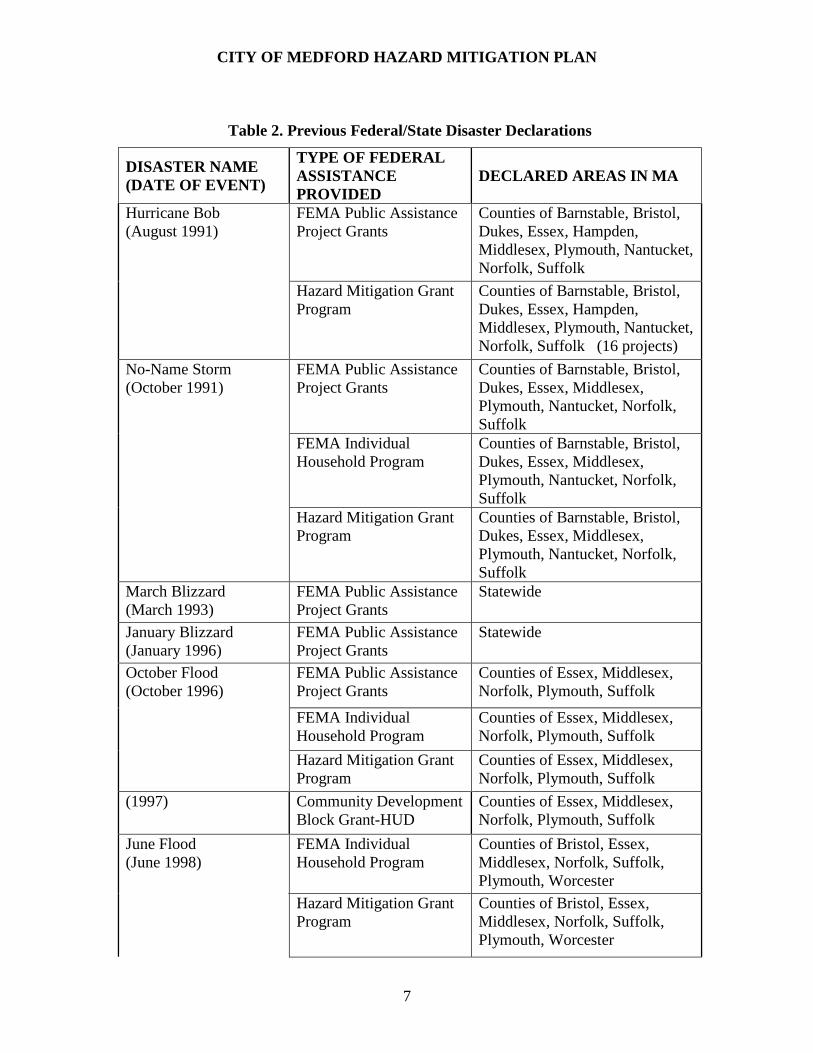
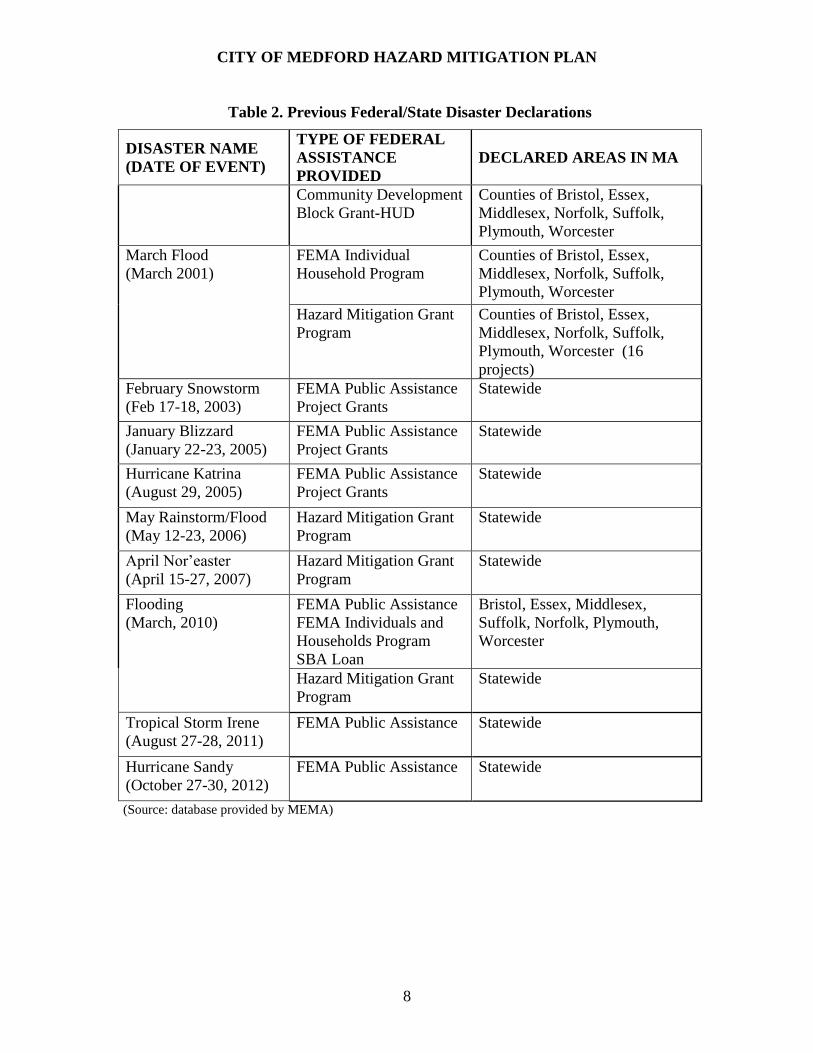
The City of Medford has experienced 16 natural hazards that triggered federal or state
disaster declarations since 1991. These are listed in Table 2. The vast majority of these
events involved flooding.
CITY OF MEDFORD HAZARD MITIGATION PLAN
7
Table 2. Previous Federal/State Disaster Declarations
DISASTER NAME
(DATE OF EVENT)
TYPE OF FEDERAL
ASSISTANCE
PROVIDED
DECLARED AREAS IN MA
Hurricane Bob
(August 1991)
FEMA Public Assistance
Project Grants
Counties of Barnstable, Bristol,
Dukes, Essex, Hampden,
Middlesex, Plymouth, Nantucket,
Norfolk, Suffolk
Hazard Mitigation Grant
Program
Counties of Barnstable, Bristol,
Dukes, Essex, Hampden,
Middlesex, Plymouth, Nantucket,
Norfolk, Suffolk (16 projects)
No-Name Storm
(October 1991)
FEMA Public Assistance
Project Grants
Counties of Barnstable, Bristol,
Dukes, Essex, Middlesex,
Plymouth, Nantucket, Norfolk,
Suffolk
FEMA Individual
Household Program
Counties of Barnstable, Bristol,
Dukes, Essex, Middlesex,
Plymouth, Nantucket, Norfolk,
Suffolk
Hazard Mitigation Grant
Program
Counties of Barnstable, Bristol,
Dukes, Essex, Middlesex,
Plymouth, Nantucket, Norfolk,
Suffolk
March Blizzard
(March 1993)
FEMA Public Assistance
Project Grants
Statewide
January Blizzard
(January 1996)
FEMA Public Assistance
Project Grants
Statewide
October Flood
(October 1996)
FEMA Public Assistance
Project Grants
Counties of Essex, Middlesex,
Norfolk, Plymouth, Suffolk
FEMA Individual
Household Program
Counties of Essex, Middlesex,
Norfolk, Plymouth, Suffolk
Hazard Mitigation Grant
Program
Counties of Essex, Middlesex,
Norfolk, Plymouth, Suffolk
(1997) Community Development
Block Grant-HUD
Counties of Essex, Middlesex,
Norfolk, Plymouth, Suffolk
June Flood
(June 1998)
FEMA Individual
Household Program
Counties of Bristol, Essex,
Middlesex, Norfolk, Suffolk,
Plymouth, Worcester
Hazard Mitigation Grant
Program
Counties of Bristol, Essex,
Middlesex, Norfolk, Suffolk,
Plymouth, Worcester
CITY OF MEDFORD HAZARD MITIGATION PLAN
8
Table 2. Previous Federal/State Disaster Declarations
DISASTER NAME
(DATE OF EVENT)
TYPE OF FEDERAL
ASSISTANCE
PROVIDED
DECLARED AREAS IN MA
Community Development
Block Grant-HUD
Counties of Bristol, Essex,
Middlesex, Norfolk, Suffolk,
Plymouth, Worcester
March Flood
(March 2001)
FEMA Individual
Household Program
Counties of Bristol, Essex,
Middlesex, Norfolk, Suffolk,
Plymouth, Worcester
Hazard Mitigation Grant
Program
Counties of Bristol, Essex,
Middlesex, Norfolk, Suffolk,
Plymouth, Worcester (16
projects)
February Snowstorm
(Feb 17-18, 2003)
FEMA Public Assistance
Project Grants
Statewide
January Blizzard
(January 22-23, 2005)
FEMA Public Assistance
Project Grants
Statewide
Hurricane Katrina
(August 29, 2005)
FEMA Public Assistance
Project Grants
Statewide
May Rainstorm/Flood
(May 12-23, 2006)
Hazard Mitigation Grant
Program
Statewide
April Nor’easter
(April 15-27, 2007)
Hazard Mitigation Grant
Program
Statewide
Flooding
(March, 2010)
FEMA Public Assistance
FEMA Individuals and
Households Program
SBA Loan
Bristol, Essex, Middlesex,
Suffolk, Norfolk, Plymouth,
Worcester
Hazard Mitigation Grant
Program
Statewide
Tropical Storm Irene
(August 27-28, 2011)
FEMA Public Assistance Statewide
Hurricane Sandy
(October 27-30, 2012)
FEMA Public Assistance Statewide
(Source: database provided by MEMA)

CITY OF MEDFORD HAZARD MITIGATION PLAN
9
FEMA Funded Mitigation Projects
Over the last 20 years the City of Medford has received funding from FEMA for one
mitigation project under the Hazard Mitigation Grant Program (HMGP). These project
totaled $718,350with $535,850 covered by FEMA grants and $182,500 by funding from
the City. The projects are summarized in Table 3 below.
Table 3. FEMA-Funded Mitigation Projects
Year
Project Title
(Funding Source) Scope of Work Total Cost
Federal
Funding
Local
Funding
2012
Wright's Pond
Dam
Improvements
Construct secondary
outlet and emergency
riprap lined spillway;
modify existing
outlet; install culvert
and pipe
$718,350 $535,850 $182,500
(Source: database provided by MEMA)
Community Profile
The City of Medford is a suburban city located on the Mystic River, approximately 5
miles north and west of the City of Boston. The City has a land area of 8.29 square miles,
and it is bordered by the Towns of Winchester and Stoneham to the north, the Cities of
Malden and Everett to the east, the City of Somerville to the south, and City of Arlington
to the west. Interstate 93 runs north to south through the central section of the City, and
State Routes 28 and 38 run north to south and State Routes 16 and 60 run east to west.
The MBTA Wellington Orange Subway line stop is located in the southeast section of the
City, and the West Medford stop of the MBTA Lowell Commuter Rail Line is located in
the northwest section. The MBTA Green Line service is planned for an extension into
Medford along the Lowell Commuter Rail corridor.
Originally the site of estates owned by Governors Cradock and Winthrop, Medford was
founded in 1630 and was incorporated as a city in 1892. The city's colonial prosperity
was based on being a tidewater seaport with shipbuilding and distilling. One early
industry was shipbuilding using lumber harvested from the Fells. Other early industries
included brick yards and quarrying Medford granite. Tufts University was founded in
1852. Fueled by its industrial prosperity, Medford grew quickly; between 1870 and 1910
the city doubled in population every 20 years. There are now many suburban
neighborhoods in Medford resulting from the rapid and dense development which
followed after the First World War
Two rivers intersect with the City, with the Mystic River running from the Mystic Lakes
along the southern portion of the City and the Malden River running along the eastern
border of the City. Medford is located entirely within the Mystic River Watershed, which
is a sub-watershed of the Boston Harbor Watershed.

CITY OF MEDFORD HAZARD MITIGATION PLAN
10
Table 4. Medford Characteristics, 2010
Population = 56,173
5.2% are under age 5
15.2% are over age 65
11.9% speak English less than “very well” (over age 5)
10.8% of households have no vehicle
3.5% live in group quarters
Number of Housing Units = 24,046
60.3% of housing units were built prior to 1940 Source: Source: U.S. Census, 2010. 2006-2010 American Community Survey
The City maintains a website at http://www.medford.org/

CITY OF MEDFORD HAZARD MITIGATION PLAN
11
[This page intentionally left blank]
CITY OF MEDFORD HAZARD MITIGATION PLAN
12
III. PLANNING PROCESS AND PUBLIC PARTICIPATION
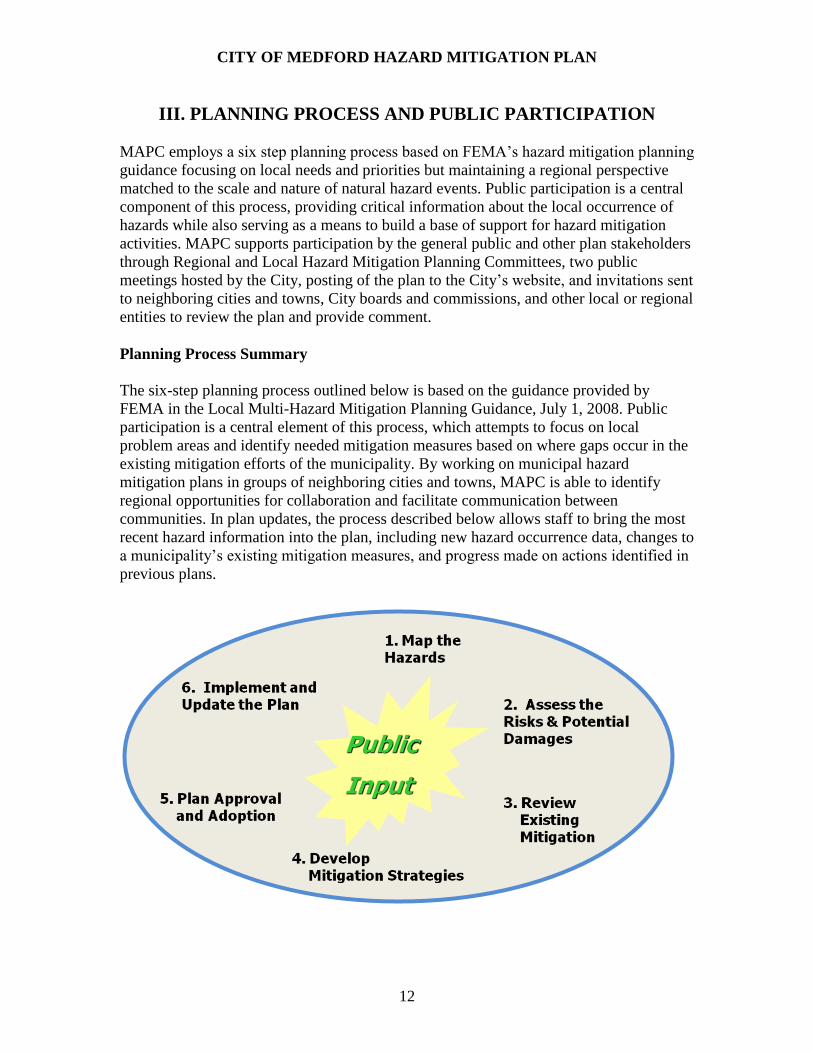
MAPC employs a six step planning process based on FEMA’s hazard mitigation planning
guidance focusing on local needs and priorities but maintaining a regional perspective
matched to the scale and nature of natural hazard events. Public participation is a central
component of this process, providing critical information about the local occurrence of
hazards while also serving as a means to build a base of support for hazard mitigation
activities. MAPC supports participation by the general public and other plan stakeholders
through Regional and Local Hazard Mitigation Planning Committees, two public
meetings hosted by the City, posting of the plan to the City’s website, and invitations sent
to neighboring cities and towns, City boards and commissions, and other local or regional
entities to review the plan and provide comment.
Planning Process Summary
The six-step planning process outlined below is based on the guidance provided by
FEMA in the Local Multi-Hazard Mitigation Planning Guidance, July 1, 2008. Public
participation is a central element of this process, which attempts to focus on local
problem areas and identify needed mitigation measures based on where gaps occur in the
existing mitigation efforts of the municipality. By working on municipal hazard
mitigation plans in groups of neighboring cities and towns, MAPC is able to identify
regional opportunities for collaboration and facilitate communication between
communities. In plan updates, the process described below allows staff to bring the most
recent hazard information into the plan, including new hazard occurrence data, changes to
a municipality’s existing mitigation measures, and progress made on actions identified in
previous plans.
CITY OF MEDFORD HAZARD MITIGATION PLAN
13
1. Map the Hazards – MAPC relies on data from a number of different federal, state, and
local sources in order to map the areas with the potential to experience natural hazards.
This mapping represents a multi-hazard assessment of the municipality and is used as
a set of base maps for the remainder of the planning process. A particularly important
source of information is the knowledge drawn from local municipal staff on where
natural hazard impacts have occurred, which is collected. These maps can be found in
Appendix B.
2. Assess the Risks & Potential Damages – Working with local staff, critical facilities,
infrastructure, vulnerable populations, and other features are mapped and contrasted
with the hazard data from the first step to identify those that might represent particular
vulnerabilities to these hazards. Land use data and development trends are also
incorporated into this analysis. In addition, MAPC develops estimates of the potential
impacts of certain hazard events on the community.
3. Review Existing Mitigation – Municipalities in the Boston Metropolitan Region have
an active history in hazard mitigation as many have adopted flood plain zoning
districts, wetlands protection programs, and other measures as well as enforcing the
State building code, which has strong provisions related to hazard resistant building
requirements. All current municipal mitigation measures must be documented.
4. Develop Mitigation Strategies – MAPC works with the local municipal staff to
identify new mitigation measures, utilizing information gathered from the hazard
identification, vulnerability assessments, and the community’s existing mitigation
efforts to determine where additional work is necessary to reduce the potential
damages from hazard events. Additional information on the development of hazard
mitigation strategies can be found in Chapter VII.
5. Plan Approval & Adoption – Once a final draft of the plan is complete it is sent to
MEMA for the state level review and, following that, to FEMA for approval.
Typically, once FEMA has approved the plan the agency issues a conditional approval
with the condition being adoption of the plan by the municipality. More information
on plan adoption can be found in Chapter IX and documentation of plan adoption can
be found in Appendix D.
6. Implement & Update the Plan – Implementation is the final and most important part of
any planning process. Hazard Mitigation Plans must also be updated on a five year
basis making preparation for the next plan update an important on-going activity.
Chapter IX includes more detailed information on plan implementation.
2008 Plan Implementation and Maintenance
The 2008 Medford Annex to the Metro Boston Regional Multi-Hazard Mitigation Plan
contained a risk assessment of identified hazards for the City and mitigation measures to
address the risk and vulnerability from these hazards. Since approval of the plan by
FEMA and local adoption, progress has been made on implementation of the measures.
CITY OF MEDFORD HAZARD MITIGATION PLAN
14
The City has advanced a number of projects for implementation, including drainage
improvements planned for Sydney Street, Cradock Avenue and Winter Brook as well as
an improvement study and project for Wright’s Pond Dam. The City has also updated
plans such as the 2011 Open Space and Recreation Plan Update to integrate concerns
about areas of flooding and adopted a Wetland Ordinance to serve as a preventative
measure for planned developments.
The City has advanced these projects in a fiscal environment that is often constrained and
where municipal staff is often conducting work in multiple roles. As such, much of the
coordination around projects that either directly or indirectly address mitigation measures
has occurred through small groups rather than through a regular convening of a local
mitigation team. In addition, the City was prepared to engage in the plan update process
from the Regional Committee meeting through to the local team and public meetings.
2013 Plan Update
Medford’s Participation in the Regional Committee
On February 28, 2010 a letter was sent notifying the communities of the first meeting of
the Metro Boston Hazard Mitigation Planning Committee and requesting that the Chief
Elected Official designate a minimum of two municipal employees and/or officials to
represent the community. The following individuals were appointed to represent
Medford on the regional committee:
Leo Sacco, Jr. Police Chief
Frank Gilberti Jr. Fire Chief
Paul Mochi Building Commissioner
Paul Gere Department of Public Works
Fred Mangone Emergency Management
In addition, Stephanie M. Burke, Director of Budget and Personnel, provided assistance
in coordinating local team meetings and information sharing throughout the update
process.
The regional committee serves as an opportunity for neighboring communities to discuss
hazard mitigation issues of shared concern. The Metro Boston Regional Committee met
on April 13, 2010 and was attended by representatives from the neighboring
municipalities of Brookline, Cambridge, Chelsea, Everett, Malden, Medford, Melrose,
and Somerville. At that meeting, the communities began the process of reviewing and
revising their 2008 Natural Hazard Mitigation Plans and were re-introduced to the
following items:
The Massachusetts State Hazard Mitigation Plan and the FEMA hazard mitigation
planning and grant process;
The concept of each community engaging staff and the public to update its current
Natural Hazard Mitigation Plan;
CITY OF MEDFORD HAZARD MITIGATION PLAN
15
FEMA plan overview and requirements and plan eligibility;
Review of the overall scope of work and plan revision schedule
Question and of Discussion of local issues, inter-community and Metro Boston
Region hazard mitigation issues and how to address.
Re-introduction to identifying and mapping municipal Critical Facilities,
municipal Areas of Concern, Inter-Community Areas of Concern, and Regional
Shared areas of Concern.
Municipal representatives were also briefed on the importance of trying to create
a diversified presence on the local Multiple Hazard Community Planning Team in
advance of local team meetings, being asked to contact major employers, business
owners, schools and non-profit organizations to participate in the process.
In addition, as the same group of MAPC staff is working on each community’s plan,
these issues of shared concern, and other issues that may arise between neighboring
communities, are discussed in greater detail in local committee meetings and resulting
actions are reflected in the identified mitigation measures, as noted in Chapter VI.
The Local Hazard Mitigation Planning Team
The Local Hazard Mitigation Planning Team is central to the planning process as it is the
primary body tasked with developing a mitigation strategy for the community. Given this
role, it is important that the committee include a diverse representation of community
stakeholders and knowledgeable municipal staff.
Given the City of Medford’s large number of stakeholders and staff whose participation
in this process was desirable, it was decided that a project steering committee would be
given oversight of the planning process and tasked with setting plan goals while smaller
working groups would used, when needed, to provide information on the impacts of
hazards on the City, existing mitigation measures, and help to develop new mitigation
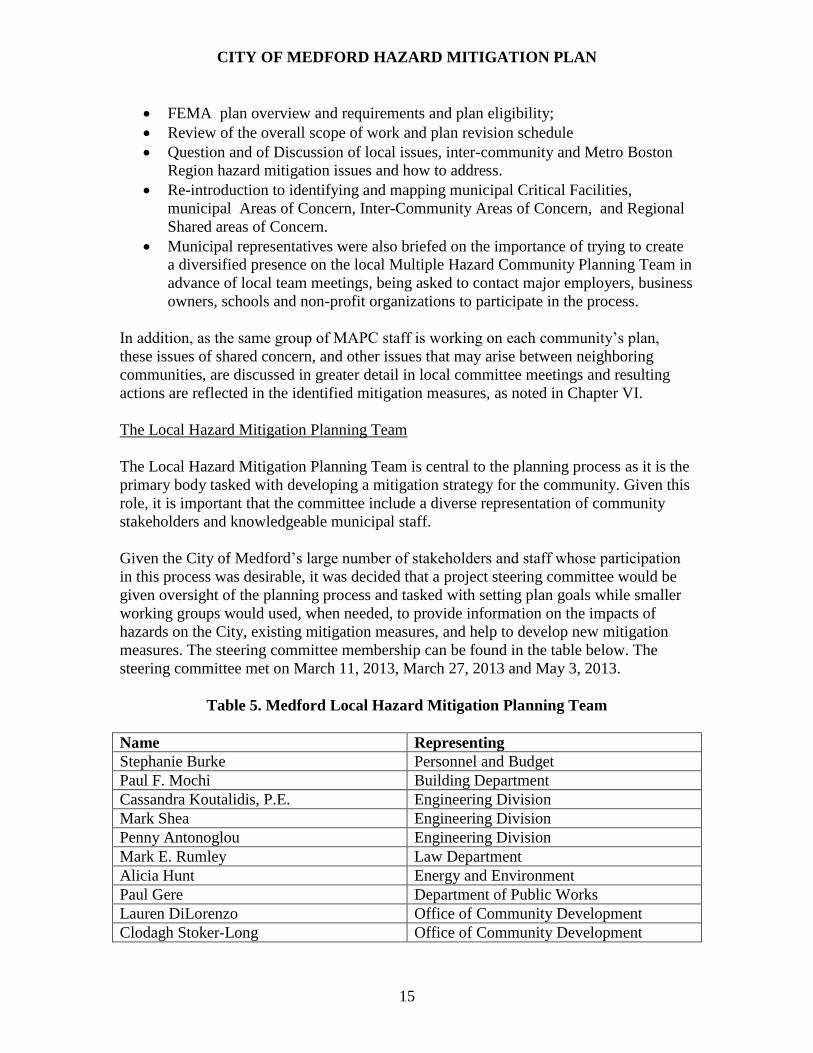
measures. The steering committee membership can be found in the table below. The
steering committee met on March 11, 2013, March 27, 2013 and May 3, 2013.
Table 5. Medford Local Hazard Mitigation Planning Team
Name Representing
Stephanie Burke Personnel and Budget
Paul F. Mochi Building Department
Cassandra Koutalidis, P.E. Engineering Division
Mark Shea Engineering Division
Penny Antonoglou Engineering Division
Mark E. Rumley Law Department
Alicia Hunt Energy and Environment
Paul Gere Department of Public Works
Lauren DiLorenzo Office of Community Development
Clodagh Stoker-Long Office of Community Development
CITY OF MEDFORD HAZARD MITIGATION PLAN
16
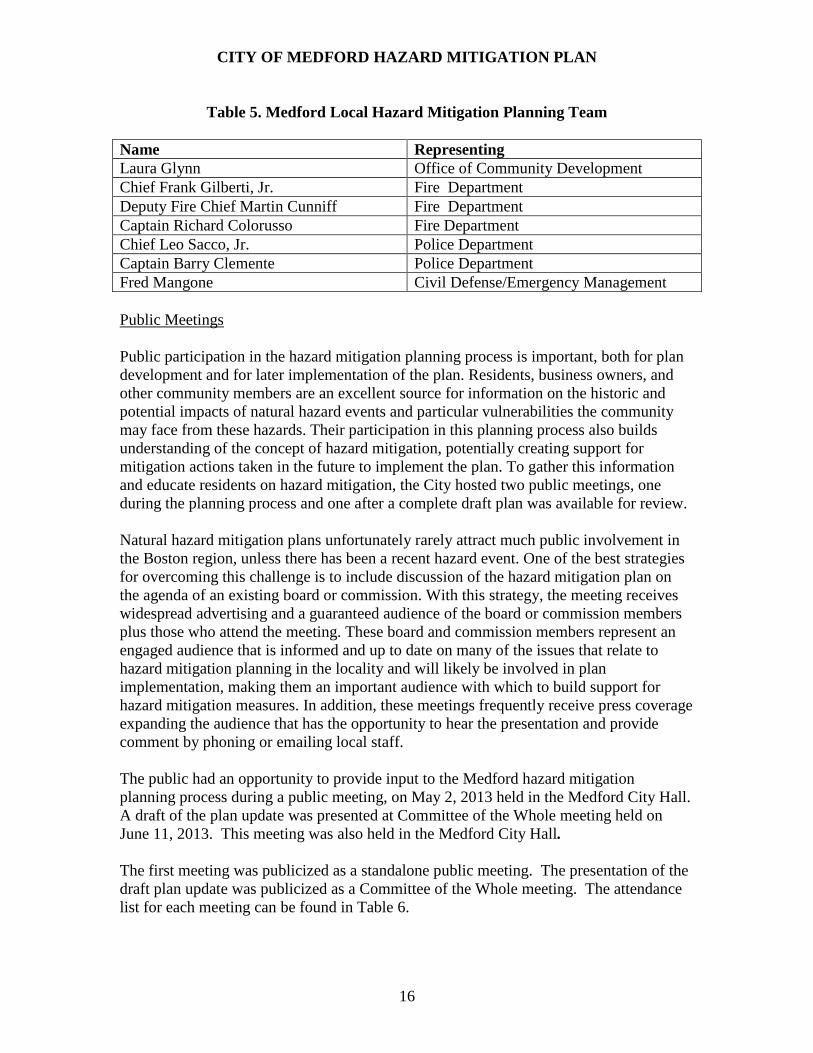
Table 5. Medford Local Hazard Mitigation Planning Team
Name Representing
Laura Glynn Office of Community Development
Chief Frank Gilberti, Jr. Fire Department
Deputy Fire Chief Martin Cunniff Fire Department
Captain Richard Colorusso Fire Department
Chief Leo Sacco, Jr. Police Department
Captain Barry Clemente Police Department
Fred Mangone Civil Defense/Emergency Management
Public Meetings
Public participation in the hazard mitigation planning process is important, both for plan
development and for later implementation of the plan. Residents, business owners, and
other community members are an excellent source for information on the historic and
potential impacts of natural hazard events and particular vulnerabilities the community
may face from these hazards. Their participation in this planning process also builds
understanding of the concept of hazard mitigation, potentially creating support for
mitigation actions taken in the future to implement the plan. To gather this information
and educate residents on hazard mitigation, the City hosted two public meetings, one
during the planning process and one after a complete draft plan was available for review.
Natural hazard mitigation plans unfortunately rarely attract much public involvement in
the Boston region, unless there has been a recent hazard event. One of the best strategies
for overcoming this challenge is to include discussion of the hazard mitigation plan on
the agenda of an existing board or commission. With this strategy, the meeting receives
widespread advertising and a guaranteed audience of the board or commission members
plus those who attend the meeting. These board and commission members represent an
engaged audience that is informed and up to date on many of the issues that relate to
hazard mitigation planning in the locality and will likely be involved in plan
implementation, making them an important audience with which to build support for
hazard mitigation measures. In addition, these meetings frequently receive press coverage
expanding the audience that has the opportunity to hear the presentation and provide
comment by phoning or emailing local staff.
The public had an opportunity to provide input to the Medford hazard mitigation
planning process during a public meeting, on May 2, 2013 held in the Medford City Hall.
A draft of the plan update was presented at Committee of the Whole meeting held on
June 11, 2013. This meeting was also held in the Medford City Hall.
The first meeting was publicized as a standalone public meeting. The presentation of the
draft plan update was publicized as a Committee of the Whole meeting. The attendance
list for each meeting can be found in Table 6.
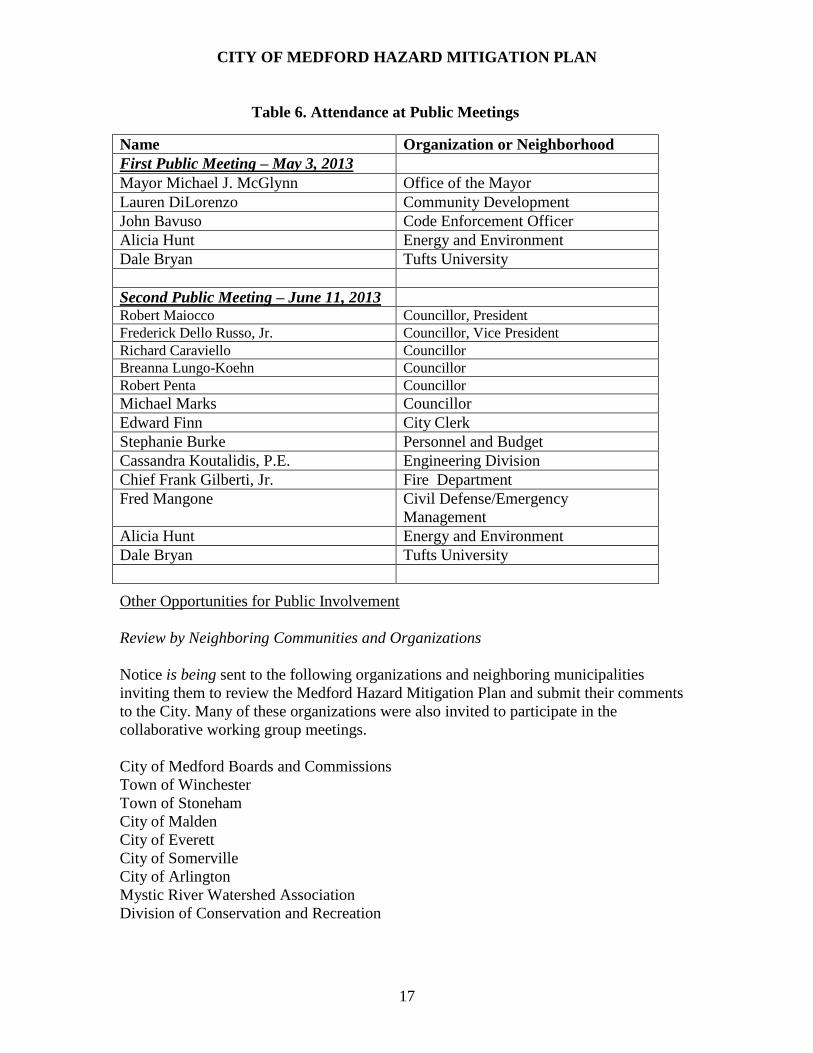
CITY OF MEDFORD HAZARD MITIGATION PLAN
17
Table 6. Attendance at Public Meetings
Name Organization or Neighborhood
First Public Meeting – May 3, 2013
Mayor Michael J. McGlynn Office of the Mayor
Lauren DiLorenzo Community Development
John Bavuso Code Enforcement Officer
Alicia Hunt Energy and Environment
Dale Bryan Tufts University
Second Public Meeting – June 11, 2013 Robert Maiocco Councillor, President
Frederick Dello Russo, Jr. Councillor, Vice President
Richard Caraviello Councillor
Breanna Lungo-Koehn Councillor
Robert Penta Councillor
Michael Marks Councillor
Edward Finn City Clerk
Stephanie Burke Personnel and Budget
Cassandra Koutalidis, P.E. Engineering Division
Chief Frank Gilberti, Jr. Fire Department
Fred Mangone
Civil Defense/Emergency
Management
Alicia Hunt Energy and Environment
Dale Bryan Tufts University
Other Opportunities for Public Involvement
Review by Neighboring Communities and Organizations
Notice is being sent to the following organizations and neighboring municipalities
inviting them to review the Medford Hazard Mitigation Plan and submit their comments
to the City. Many of these organizations were also invited to participate in the
collaborative working group meetings.
City of Medford Boards and Commissions
Town of Winchester
Town of Stoneham
City of Malden
City of Everett
City of Somerville
City of Arlington
Mystic River Watershed Association
Division of Conservation and Recreation
CITY OF MEDFORD HAZARD MITIGATION PLAN
18
Website
Draft copies of the Medford Hazard Mitigation Plan update are being posted on the
City’s website. Members of the public could access the draft document and submit
comments or questions.
Incorporation of Other Existing Plans and Studies
The Plan incorporates information from a number of other previously produced plans,
and studies as well as applicable regulatory documents. These include:
City of Medford Zoning Ordinance
City of Medford Open Space and Recreation Plan Update, 2011
City of Medford CPMP Annual Action Plan, 2012
Medford Square Master Plan, 2005
City of Medford Community Development Plan, 2004
A full listing of the documents incorporated in the development of this plan is included in
Section VIII – List of References.
CITY OF MEDFORD HAZARD MITIGATION PLAN
19
[This page intentionally left blank]
CITY OF MEDFORD HAZARD MITIGATION PLAN
20
IV. RISK ASSESSMENT
The risk assessment analyzes the potential natural hazards that could occur within the
City of Medford as well as the relationship between those hazards and current land uses,
potential future development, and critical infrastructure. This section also includes a
vulnerability assessment that estimates the potential damages that could result from
certain large scale natural hazard events.
Update Process
In order to update Medford’s risk assessment, MAPC gathered the most recently
available hazard and land use data and met with City staff to identify changes in local
hazard areas and development trends. MAPC also used the most recently available
version of HAZUS (described below).
Overview of Hazards and Impacts
The Massachusetts Hazard Mitigation Plan 2010 (state plan) provides an in-depth
overview of natural hazards in Massachusetts. The state plan indicates that Massachusetts
is subject to the following natural hazards (listed in order of frequency); floods, heavy
rainstorms, nor’easters or winter storms, coastal erosion, hurricanes, tornadoes, wildfires,
drought and earthquakes. Previous state and federal disaster declarations since 1991 are
summarized in Table 2.
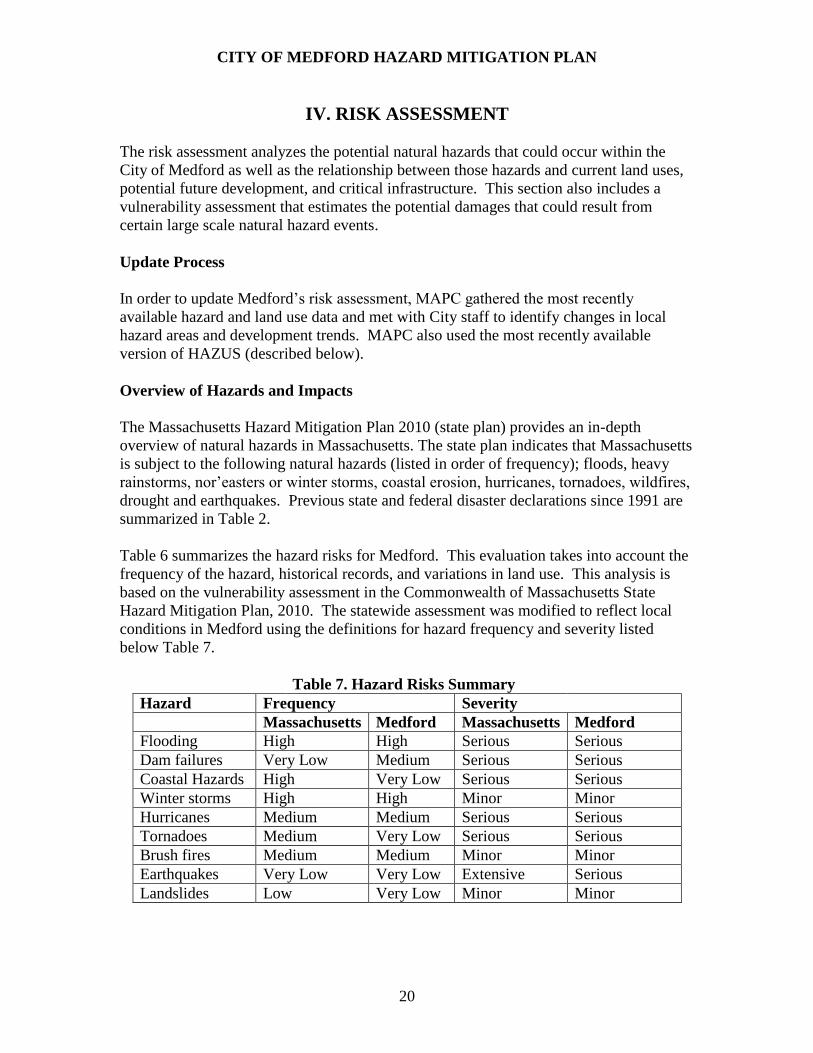
Table 6 summarizes the hazard risks for Medford. This evaluation takes into account the
frequency of the hazard, historical records, and variations in land use. This analysis is
based on the vulnerability assessment in the Commonwealth of Massachusetts State
Hazard Mitigation Plan, 2010. The statewide assessment was modified to reflect local
conditions in Medford using the definitions for hazard frequency and severity listed
below Table 7.
Table 7. Hazard Risks Summary
Hazard Frequency Severity
Massachusetts Medford Massachusetts Medford
Flooding High High Serious Serious
Dam failures Very Low Medium Serious Serious
Coastal Hazards High Very Low Serious Serious
Winter storms High High Minor Minor
Hurricanes Medium Medium Serious Serious
Tornadoes Medium Very Low Serious Serious
Brush fires Medium Medium Minor Minor
Earthquakes Very Low Very Low Extensive Serious
Landslides Low Very Low Minor Minor
CITY OF MEDFORD HAZARD MITIGATION PLAN
21
Flood Related Hazards
Flooding was the most prevalent serious natural hazard identified by local officials in
Medford. Flooding is generally the rising or overflowing of water onto normally dry land
and can be caused by hurricanes, nor’easters, severe rainstorms, and thunderstorms
among other causes. Global climate change has the potential to increase the frequency
and severity of rainstorms and snowstorms, which would be a continuation of trend
observed over the past several decades.
Regionally Significant Floods
There have been a number of major floods that have affected the Metro Boston region
over the last fifty years. Significant historic flood events in Medford have included:
March 1968
The blizzard of 1978
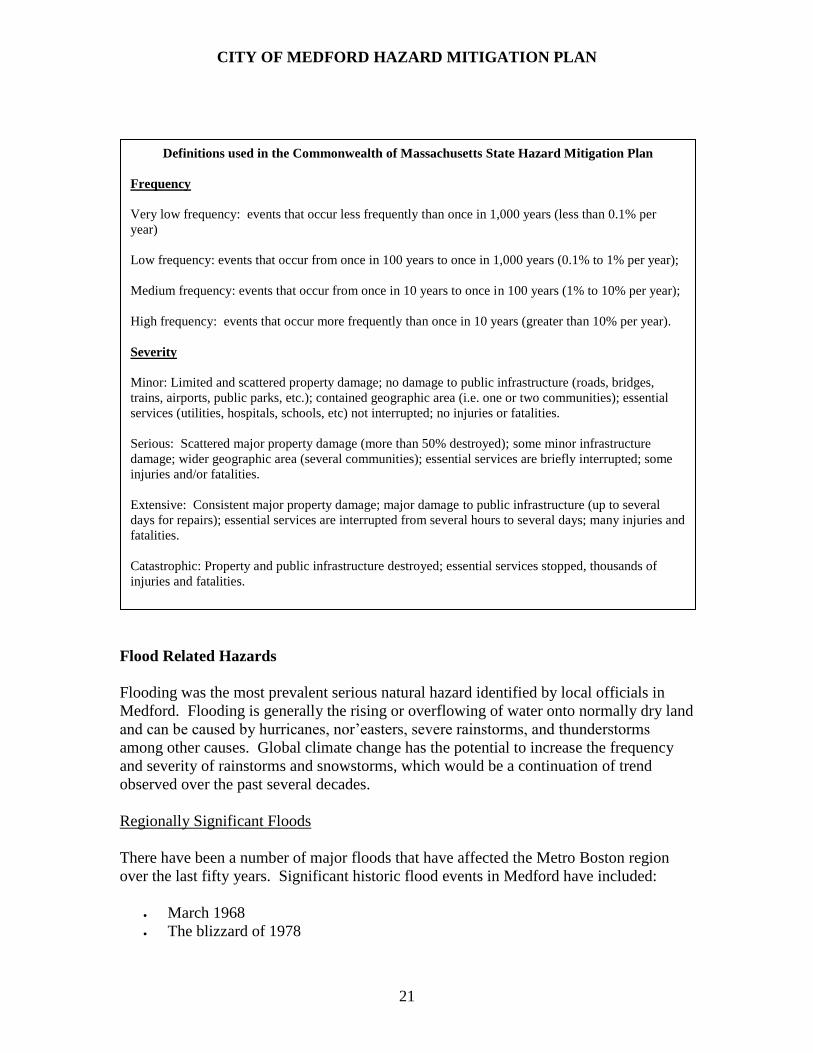
Definitions used in the Commonwealth of Massachusetts State Hazard Mitigation Plan
Frequency
Very low frequency: events that occur less frequently than once in 1,000 years (less than 0.1% per
year)
Low frequency: events that occur from once in 100 years to once in 1,000 years (0.1% to 1% per year);
Medium frequency: events that occur from once in 10 years to once in 100 years (1% to 10% per year);
High frequency: events that occur more frequently than once in 10 years (greater than 10% per year).
Severity
Minor: Limited and scattered property damage; no damage to public infrastructure (roads, bridges,
trains, airports, public parks, etc.); contained geographic area (i.e. one or two communities); essential
services (utilities, hospitals, schools, etc) not interrupted; no injuries or fatalities.
Serious: Scattered major property damage (more than 50% destroyed); some minor infrastructure
damage; wider geographic area (several communities); essential services are briefly interrupted; some
injuries and/or fatalities.
Extensive: Consistent major property damage; major damage to public infrastructure (up to several
days for repairs); essential services are interrupted from several hours to several days; many injuries and
fatalities.
Catastrophic: Property and public infrastructure destroyed; essential services stopped, thousands of
injuries and fatalities.

CITY OF MEDFORD HAZARD MITIGATION PLAN
22
January 1979
April 1987
October 1991 (“The Perfect Storm”)
October 1996
June 1998
March 2001
April 2004
May 2006
April 2007
March 2010
Overview of City-Wide Flooding
The City of Medford is subject to inland flooding in the forms of riverine flooding and
urban flooding. Riverine flooding occurs when the rate of precipitation and/or amount of
stormwater runoff overwhelms the capacity of natural or structured drainage systems
causing overflows; urban flooding occurs when precipitation causes the water table to
rise and leads to flooding of low-lying areas such as streets and underpasses. These types
of flooding are often combined as storm events lead to large amounts of draining
stormwater, which can be blocked by elements of the built environment and can be
backed up when drainage locations (ponds, streams, etc.) are at or above capacity.
The city is located entirely within the Mystic River Watershed. Flooding was the most
prevalent serious natural hazard identified by local officials in Medford. Flooding is
caused by hurricanes, nor’easters, severe rainstorms and thunderstorms and is often
worsened by coastal storm surges and high tides. The majority of flooding in the City is
caused by deficiencies in the drainage system rather than location within the flood plain.
Overview of Drainage System
The majority of Medford’s flooding problems are associated with the City’s drainage
system and the filling or channeling of natural water resource areas.
There are a variety of issues that affect the drainage system in the City. In some cases, the
system is served by older infrastructure that has been impacted by additional or increased
development and does not have the necessary capacity to accommodate the resulting
runoff. There are instances where waterways serve as part of the drainage system, such as
along Winter Brook, but these can become restricted or blocked due to siltation in the
open channel or connecting pipes. Lastly, debris from roadways or from residents
dumping (e.g., lawn clippings and other yard waste) have blocked pipes and culverts
which has resulted in flooding of homes and public ways.
A number of water resource areas, especially wetlands, have been filled in over time in
Medford to support development or in an attempt to change drainage pattern in a specific
area. These filled areas also have occurred along the Mystic River in portions of the
flood plain. These areas serve as natural drainage locations and during severe rain storms,
CITY OF MEDFORD HAZARD MITIGATION PLAN
23
these areas still have high water levels that can contribute to localized flooding issues and
potential inflow and infiltration issues with the piped drainage system.
Information on flood hazard areas was taken from two sources. The first was the
National Flood Insurance Rate Maps. The FIRM flood zones are shown on Map 3 in
Appendix B and defined below.
Flood Insurance Rate Map Zone Definitions
Zones A1-30 and AE: Special Flood Hazard Areas subject to inundation by the 1-
percent-annual-chance flood event determined by detailed methods. Base Flood
Elevations are shown within these zones.
Zone A (Also known as Unnumbered A Zones): Special Flood Hazard Areas subject to
inundation by the 1-percent-annual-chance flood event generally determined using
approximate methodologies. Because detailed hydraulic analyses have not been
performed, no Base Flood Elevations or depths are shown.
Zone AO: Special Flood Hazard Areas subject to inundation by 1-percent-annual-chance
shallow flooding (usually sheet flow on sloping terrain) where average depths are
between one and three feet. Average flood depths derived from detailed hydraulic
analyses are shown in this zone.
Zone B and X (shaded): Zones where the land elevation as been determined to be above
the Base Flood Elevation, but below the 500 year flood elevation. These zones are not
Special Flood Hazard Areas.
Zones C and X (unshaded): Zones where the land elevation has been determined to be
above both the Base Flood Elevation and the 500 year flood elevation. These zones are
not Special Flood Hazard Areas
The second source of flooding information was discussions with local officials. The
Locally Identified Areas of Flooding below were identified by City staff as areas where
flooding is known to occur or could occur if certain infrastructure failed. These areas do
not necessarily coincide with the flood zones from the FIRM maps. They may be areas
that flood due to inadequate drainage systems or other local conditions rather than
location within a flood zone. The numbers correspond to the numbers on Map 8,
“Locally Identified Hazard Areas”.
1. Wright’s Pond – Downstream area that could potentially be inundated in the event
of a dam breach.
2. Cranberry Brook Area – Area of chronic flooding due to under drainage pipes
downstream of the brook.
CITY OF MEDFORD HAZARD MITIGATION PLAN
24
3. Lincoln Road / Meetinghouse Brook Area – Area of chronic flooding that has
been exacerbated at times due to releases on the reservoir upstream by the Town
of Winchester.
4. Daly Rd / Meetinghouse Brook Area - Area of chronic flooding that has been
exacerbated at times due to releases on the reservoir upstream by the Town of
Winchester.
5. South Medford Area - Area of chronic flooding due to aging infrastructure and
downstream drainage issues in the City of Somerville.
6. Fifth Street Area - Area of chronic flooding due to drainage infrastructure issues.
7. Sydney St. Pump Station – Location of critical storm water pump station.
Dam Failure
Dam failure can occur as a result of structural failure, independent of a hazard event, or
as the result of the impacts of a hazard event such as flooding associated with storms or
an earthquake. In the event of a dam failure, the energy of the water stored behind even a
small dam can cause loss of life and property damage if there are people or buildings
downstream. The number of fatalities from a dam failure depends on the amount of
warning provided to the population and the number of people in the area in the path of
the dam’s floodwaters. Dam failure in general is infrequent but has the potential for
severe impacts. An issue for dams in Massachusetts is that many were built in the 19th
century without the benefits of modern engineering or construction oversight.
Through a review with City staff and information available from the Division of
Conservation and Recreation (DCR), six dams were identified in Medford. DCR assess
the dams are using the three hazard classifications below:
High Hazard: Dams located where failure or mis-operation will likely cause loss
of life and serious damage to home(s), industrial or commercial facilities,
important public utilities, main highway(s) or railroad(s).
Significant Hazard: Dams located where failure or mis-operation may cause
loss of life and damage home(s), industrial or commercial facilities, secondary
highway(s) or railroad(s) or cause interruption of use or service of relatively
important facilities.
Low Hazard: Dams located where failure or mis-operation may cause minimal
property damage to others. Loss of life is not expected.
CITY OF MEDFORD HAZARD MITIGATION PLAN
25
Three of the dams within the City’s limits are classified as high hazard dams, and two of
the dams have been improved since completion of the previous plan. An overview of the
dams is provided below:
South Reservoir West Dike – This dam is classified as a high hazard dam. This dam is
owned by the Town of Winchester and is managed by the municipal water department.
South Reservoir Dam – This dam is classified as a high hazard dam and is owned by the
Division of Conservation and Recreation.
South Reservoir East Dike - This dam is classified as a high hazard dam and is owned by
the Town of Winchester, The dam is managed by the Town’s municipal water
department.
Wright’s Pond Dam - Wrights Pond Dam is owned by the City of Medford. It was
reconstructed in the 1990s and was improved in 2012, including improvements to the
crest and spillway which were designed around the potential for precipitation from a 100
year storm. Wright’s Pond has an estimated downstream population of approximately 750
people.
Mystic Lakes Dam (#20) – This dam is owned by the Division of Conservation and
Recreation and is located between Medford and the City of Arlington. The dam, which
separates the upper lake from the lower lake on the Mystic River, had been listed as a
significant hazard was rebuilt in 2011 and included the restoration of fish ladders for
herring and eel.
Cradock Bridge – This bridge is located in Medford Square and serves as an urban flood
control structure that constricts water flow in much the way that a dam does. The bridge
is under the jurisdiction of the Department of Conservation and Recreation (DCR). The
Massachusetts Department of Transportation will be reconstructing the bridge over the
next 3 years, including replacement of the concrete barriers beneath the bridge that were
needed previously for locks under the bridge.
Although not located in Medford, another significant dam is the Amelia Earhart Dam,
which is located south of the City on the Mystic River between the Cities of Everett and
Somerville. The dam is listed as a low hazard, but is estimated to need $5 million dollars
in repairs, such as repairs to the current third pump and the possible installation of a
fourth pump. The dam separates the tidal and the non-tidal parts of the Mystic River,
and is currently able to pump 4,000 cubic feet per second of flow from the Mystic and
Malden Rivers against high tide into Boston Harbor. The pump improvements would
increase the rate that flood water can travel out of the cities and towns along the Mystic
River.
Repetitive Loss Structures
CITY OF MEDFORD HAZARD MITIGATION PLAN
26
There are two (2) repetitive loss structures in Medford, which is the same number of
structures identified in the 2008 plan. As defined by the Community Rating System
(CRS) of the National Flood Insurance Program (NFIP), a repetitive loss property is any
property which the NFIP has paid two or more flood claims of $1,000 or more in any
given 10-year period since 1978. For more information on repetitive losses see
http://www.fema.gov/txt/rebuild/repetitive_loss_faqs.txt.
Wind Related Hazards
Wind-related hazards include hurricanes and tornadoes as well as high winds during
severe rainstorms and thunderstorms. The typical wind speed in the Boston area ranges
from around 11 miles per hour to 14 over the course of the year, but independent of storm
events, gusts of up to 40 mph can occur. As with many communities, falling trees that
result in downed power lines and power outages are an issue in Medford. Information on
wind related hazards can be found on Map 5 in Appendix B
Hurricanes
Between 1858 and 2013, Massachusetts has experienced approximately 35 tropical
storms, eleven Category 1 hurricanes, five Category 2 hurricanes and one Category 3
hurricane. This equates to a frequency of once every six years. A hurricane or storm
track is the line that delineates the path of the eye of a hurricane or tropical storm. There
has been one recorded storm tracks through Medford, a Category 1 Hurricane in 1944.
The storm passed roughly through the southeastern part of the City. The City experiences
the impacts of the wind and rain of hurricanes and tropical storms regardless of whether
the storm track passed through the City. The hazard mapping indicates that the 100 year
wind speed is 110 miles per hour.
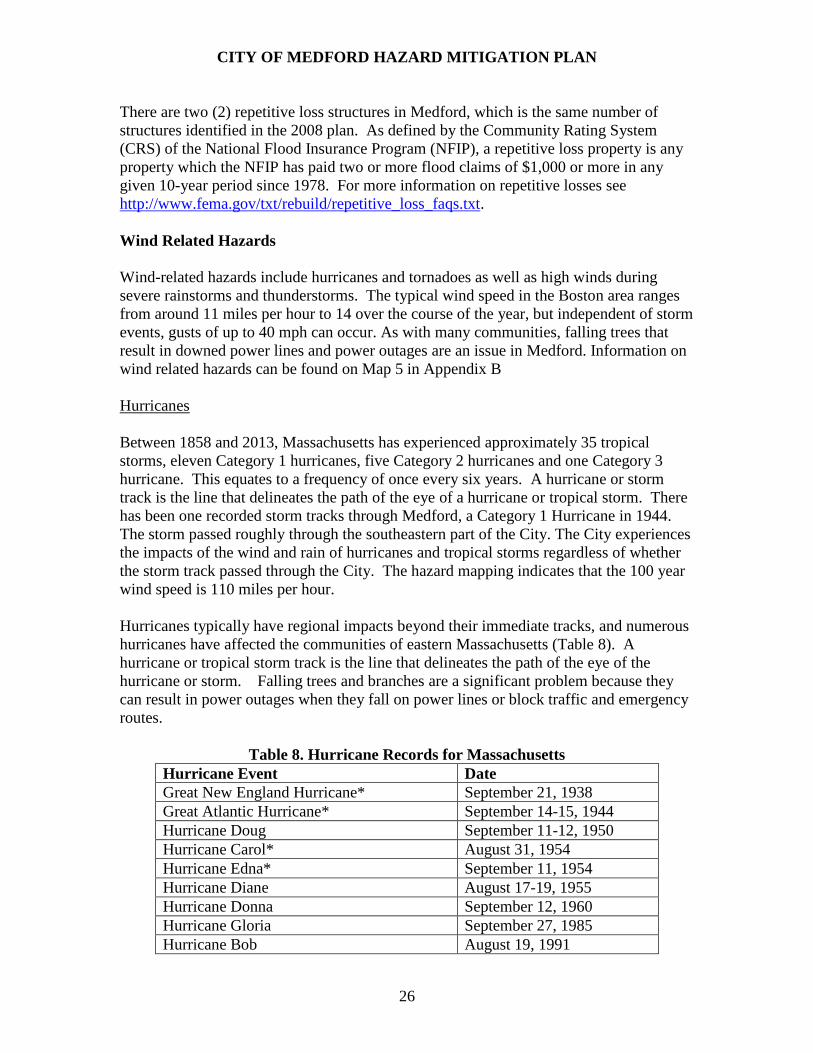
Hurricanes typically have regional impacts beyond their immediate tracks, and numerous
hurricanes have affected the communities of eastern Massachusetts (Table 8). A
hurricane or tropical storm track is the line that delineates the path of the eye of the
hurricane or storm. Falling trees and branches are a significant problem because they
can result in power outages when they fall on power lines or block traffic and emergency
routes.
Table 8. Hurricane Records for Massachusetts
Hurricane Event Date
Great New England Hurricane* September 21, 1938
Great Atlantic Hurricane* September 14-15, 1944
Hurricane Doug September 11-12, 1950
Hurricane Carol* August 31, 1954
Hurricane Edna* September 11, 1954
Hurricane Diane August 17-19, 1955
Hurricane Donna September 12, 1960
Hurricane Gloria September 27, 1985
Hurricane Bob August 19, 1991
CITY OF MEDFORD HAZARD MITIGATION PLAN
27
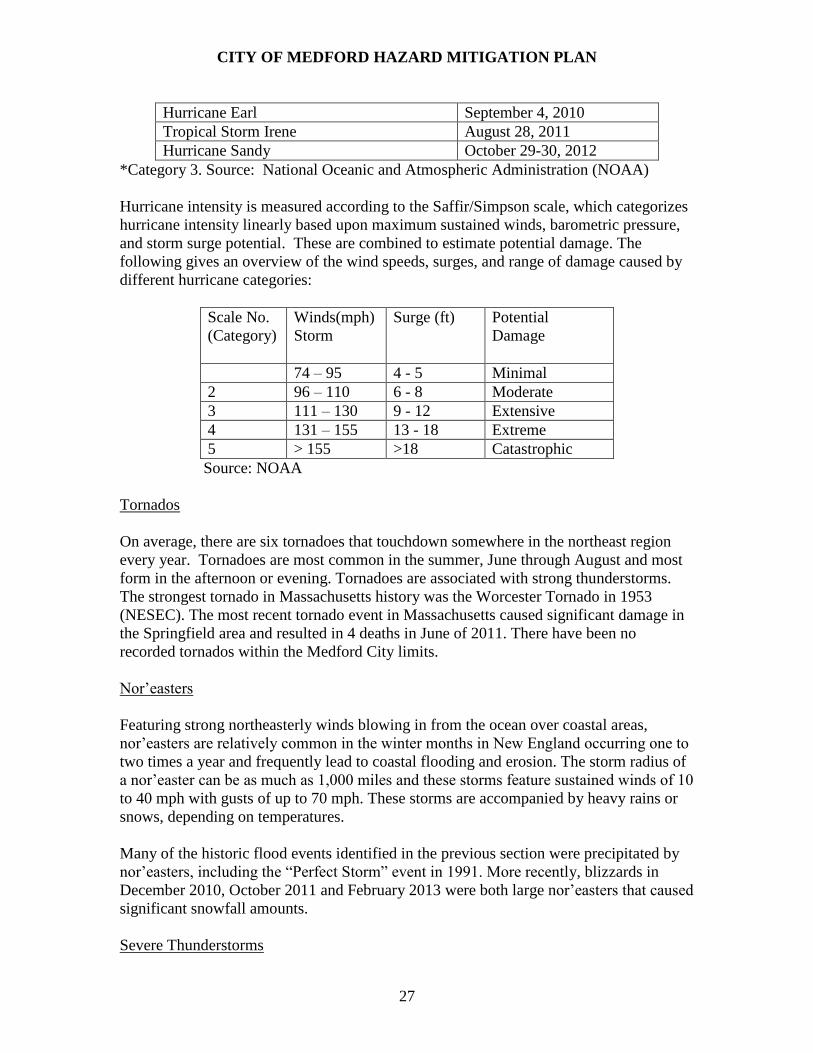
Hurricane Earl September 4, 2010
Tropical Storm Irene August 28, 2011
Hurricane Sandy October 29-30, 2012
*Category 3. Source: National Oceanic and Atmospheric Administration (NOAA)
Hurricane intensity is measured according to the Saffir/Simpson scale, which categorizes
hurricane intensity linearly based upon maximum sustained winds, barometric pressure,
and storm surge potential. These are combined to estimate potential damage. The
following gives an overview of the wind speeds, surges, and range of damage caused by
different hurricane categories:
Scale No.
(Category)
Winds(mph)
Storm
Surge (ft)
Potential
Damage
74 – 95 4 - 5 Minimal
2 96 – 110 6 - 8 Moderate
3 111 – 130 9 - 12 Extensive
4 131 – 155 13 - 18 Extreme
5 > 155 >18 Catastrophic
Source: NOAA
Tornados
On average, there are six tornadoes that touchdown somewhere in the northeast region
every year. Tornadoes are most common in the summer, June through August and most
form in the afternoon or evening. Tornadoes are associated with strong thunderstorms.
The strongest tornado in Massachusetts history was the Worcester Tornado in 1953
(NESEC). The most recent tornado event in Massachusetts caused significant damage in
the Springfield area and resulted in 4 deaths in June of 2011. There have been no
recorded tornados within the Medford City limits.
Nor’easters
Featuring strong northeasterly winds blowing in from the ocean over coastal areas,
nor’easters are relatively common in the winter months in New England occurring one to
two times a year and frequently lead to coastal flooding and erosion. The storm radius of
a nor’easter can be as much as 1,000 miles and these storms feature sustained winds of 10
to 40 mph with gusts of up to 70 mph. These storms are accompanied by heavy rains or
snows, depending on temperatures.
Many of the historic flood events identified in the previous section were precipitated by
nor’easters, including the “Perfect Storm” event in 1991. More recently, blizzards in
December 2010, October 2011 and February 2013 were both large nor’easters that caused
significant snowfall amounts.
Severe Thunderstorms

CITY OF MEDFORD HAZARD MITIGATION PLAN
28
While less severe than the other types of storms discussed, thunderstorms can lead to
localized damage and represent a hazard risk for communities. Generally defined as a
storm that includes thunder, which always accompanies lightning, a thunderstorm is a
storm event featuring lightning, strong winds, and rain and/or hail. Thunderstorms
sometime give rise to tornados. On average, these storms are only around 15 miles in
diameter and last for about 30 minutes. A severe thunderstorm can include winds of close
to 60 mph and rain sufficient to produce flooding.
Winter Storms
Winter storms are the most common and most familiar of the region’s hazards that affect
large geographic areas. The majority of blizzards and ice storms in the region cause more
inconvenience than they do serious property damage, injuries, or deaths. However,
periodically, a storm will occur which is a true disaster, and necessitates intense large-
scale emergency response. Occasionally winter storms can also hinder the tidal exchange
in tidally restricted watersheds and result in localized flooding within these areas. Ice
build-up at gate structures can also damage tide gates and increase the hazard potential as
a result of malfunctioning tide gates. Coastal storms also cause flooding because of tidal
surges. The average annual snowfall for the majority of the city is 36.1-48.0 inches.
There is a small band in the northwestern part of the City where the average snowfall is
48.1-72.0 inches.
The Northeast Snowfall Impact Scale (NESIS) developed by Paul Kocin of The Weather
Channel and Louis Uccellini of the National Weather Service (Kocin and Uccellini,
2004) characterizes and ranks high impact northeast snowstorms. These storms have
large areas of 10 inch snowfall accumulations and greater. NESIS has five categories:
Extreme, Crippling, Major, Significant, and Notable. NESIS scores are a function of the
area affected by the snowstorm, the amount of snow, and the number of people living in
the path of the storm. The largest NESIS values result from storms producing heavy
snowfall over large areas that include major metropolitan centers. The NESIS categories
are summarized below:
Source: Massachusetts State Hazard Mitigation Plan, 2010
Since 1958 Massachusetts has experienced two Category 5 Extreme snow storms, nine
Category 4 (Crippling) storms, and 13 Category 3 (Major) snow storms. The most
significant winter storm in recent history was the “Blizzard of 1978,” which resulted in
CITY OF MEDFORD HAZARD MITIGATION PLAN
29
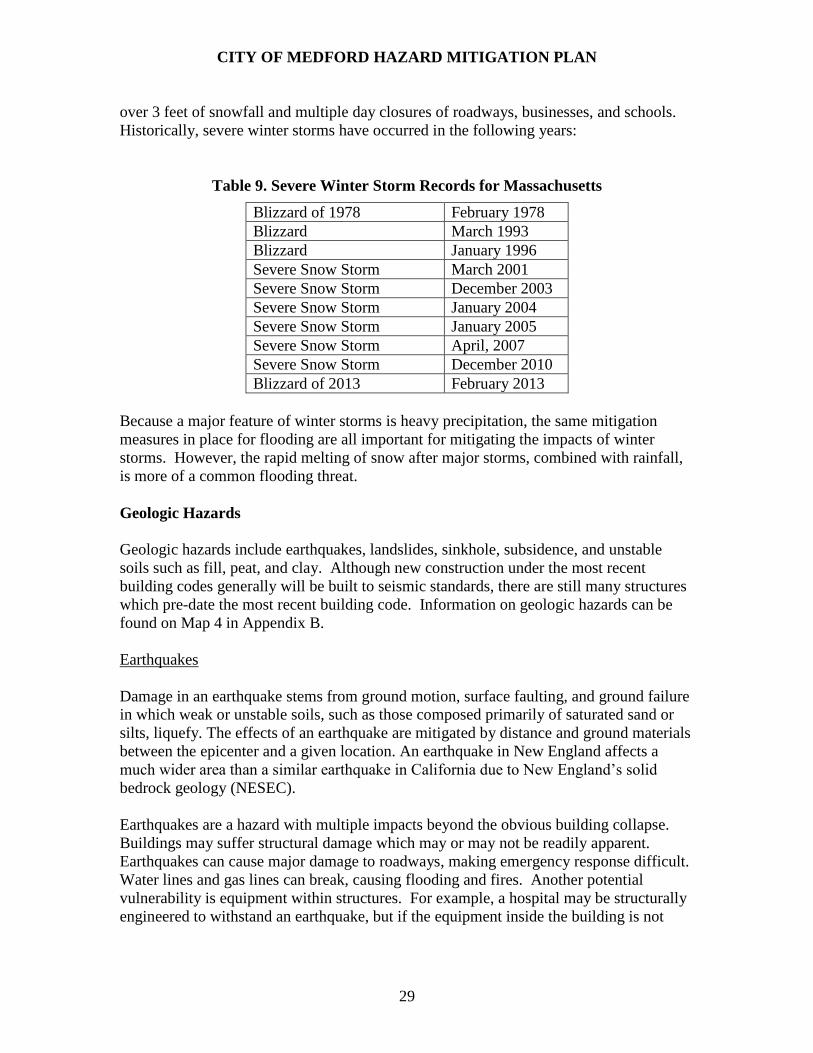
over 3 feet of snowfall and multiple day closures of roadways, businesses, and schools.
Historically, severe winter storms have occurred in the following years:
Table 9. Severe Winter Storm Records for Massachusetts
Blizzard of 1978 February 1978
Blizzard March 1993
Blizzard January 1996
Severe Snow Storm March 2001
Severe Snow Storm December 2003
Severe Snow Storm January 2004
Severe Snow Storm January 2005
Severe Snow Storm April, 2007
Severe Snow Storm December 2010
Blizzard of 2013 February 2013
Because a major feature of winter storms is heavy precipitation, the same mitigation
measures in place for flooding are all important for mitigating the impacts of winter
storms. However, the rapid melting of snow after major storms, combined with rainfall,
is more of a common flooding threat.
Geologic Hazards
Geologic hazards include earthquakes, landslides, sinkhole, subsidence, and unstable
soils such as fill, peat, and clay. Although new construction under the most recent
building codes generally will be built to seismic standards, there are still many structures
which pre-date the most recent building code. Information on geologic hazards can be
found on Map 4 in Appendix B.
Earthquakes
Damage in an earthquake stems from ground motion, surface faulting, and ground failure
in which weak or unstable soils, such as those composed primarily of saturated sand or
silts, liquefy. The effects of an earthquake are mitigated by distance and ground materials
between the epicenter and a given location. An earthquake in New England affects a
much wider area than a similar earthquake in California due to New England’s solid
bedrock geology (NESEC).
Earthquakes are a hazard with multiple impacts beyond the obvious building collapse.
Buildings may suffer structural damage which may or may not be readily apparent.
Earthquakes can cause major damage to roadways, making emergency response difficult.
Water lines and gas lines can break, causing flooding and fires. Another potential
vulnerability is equipment within structures. For example, a hospital may be structurally
engineered to withstand an earthquake, but if the equipment inside the building is not
CITY OF MEDFORD HAZARD MITIGATION PLAN
30
properly secured, the operations at the hospital could be severely impacted during an
earthquake. Earthquakes can also trigger landslides.
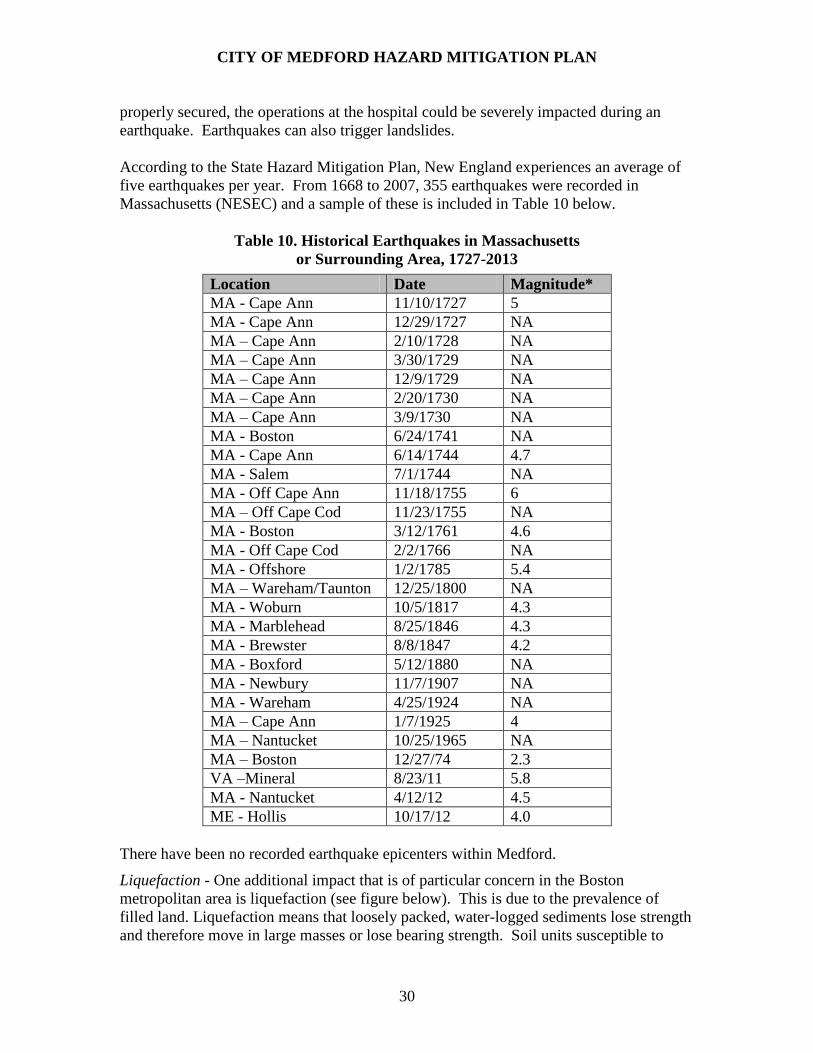
According to the State Hazard Mitigation Plan, New England experiences an average of
five earthquakes per year. From 1668 to 2007, 355 earthquakes were recorded in
Massachusetts (NESEC) and a sample of these is included in Table 10 below.
Table 10. Historical Earthquakes in Massachusetts
or Surrounding Area, 1727-2013
Location Date Magnitude*
MA - Cape Ann 11/10/1727 5
MA - Cape Ann 12/29/1727 NA
MA – Cape Ann 2/10/1728 NA
MA – Cape Ann 3/30/1729 NA
MA – Cape Ann 12/9/1729 NA
MA – Cape Ann 2/20/1730 NA
MA – Cape Ann 3/9/1730 NA
MA - Boston 6/24/1741 NA
MA - Cape Ann 6/14/1744 4.7
MA - Salem 7/1/1744 NA
MA - Off Cape Ann 11/18/1755 6
MA – Off Cape Cod 11/23/1755 NA
MA - Boston 3/12/1761 4.6
MA - Off Cape Cod 2/2/1766 NA
MA - Offshore 1/2/1785 5.4
MA – Wareham/Taunton 12/25/1800 NA
MA - Woburn 10/5/1817 4.3
MA - Marblehead 8/25/1846 4.3
MA - Brewster 8/8/1847 4.2
MA - Boxford 5/12/1880 NA
MA - Newbury 11/7/1907 NA
MA - Wareham 4/25/1924 NA
MA – Cape Ann 1/7/1925 4
MA – Nantucket 10/25/1965 NA
MA – Boston 12/27/74 2.3
VA –Mineral 8/23/11 5.8
MA - Nantucket 4/12/12 4.5
ME - Hollis 10/17/12 4.0
There have been no recorded earthquake epicenters within Medford.
Liquefaction - One additional impact that is of particular concern in the Boston
metropolitan area is liquefaction (see figure below). This is due to the prevalence of
filled land. Liquefaction means that loosely packed, water-logged sediments lose strength
and therefore move in large masses or lose bearing strength. Soil units susceptible to

CITY OF MEDFORD HAZARD MITIGATION PLAN
31
liquefaction include: non-engineered artificial fill, alluvial deposits, beach deposits,
fluvial deposits and flood plain deposits. Non-engineered artificial fill is what is typically
known locally as filled land. An earthquake with a magnitude of 5.5 or greater can trigger
liquefaction. In the Boston region, these areas of filled land are densely developed with
structures that pre-date the seismic provisions of the current Massachusetts State Building
Code.
Boston Study Region Liquefaction Potential
Source: Baise, Laurie G., Rebecca B. Higgins ; and Charles M. Brankman, Tufts University
Landslides
Landslides can result from human activities that destabilize an area or can occur as a
secondary impact from another natural hazard such as flooding. In addition to structural
damage to buildings and the blockage of transportation corridors, landslides can lead to
sedimentation of water bodies.
The majority of the city is classified as having a low risk for landslides. The southeastern
portion of the city, primarily in the vicinity of Wellington Circle, has a moderate risk for
landslides.
Other Natural Hazards
Brush Fires
CITY OF MEDFORD HAZARD MITIGATION PLAN
32
For the purposes of this plan, a brush fire is an uncontrolled fire occurring in a forested or
grassland area. In the Boston region these fires rarely grow to the size of a wildfire as
seen more typically in the western U.S. As their name implies, these fires typically burn
no more than the underbrush of a forested area. These fires present a hazard where there
is the potential for them to spread into developed or inhabited areas, particularly
residential areas where sufficient fuel materials might exist to allow the fire the spread
into homes.
The Fire Department responds to a number of brush fires of varying sizes annually.
Within the past year, there were no brush fires that resulted in significant property
damage. These fires occur most commonly in the Middlesex Fells Reservation, due to dry
and dead vegetation, and in the Mystic River Reservation, due to phragmites growth.
The following areas of City were identified as having the highest potential for brush fires.
The numbers correspond to the numbers on Map 8, “Hazard Areas”:
8. Middlesex Fells Reservation
9. Shepherd Brooks Estate/Oak Grove Cemetery
10. Mystic River Reservation
11. Fellsway Plaza Area
Land Use and Development Trends
Existing Land Use
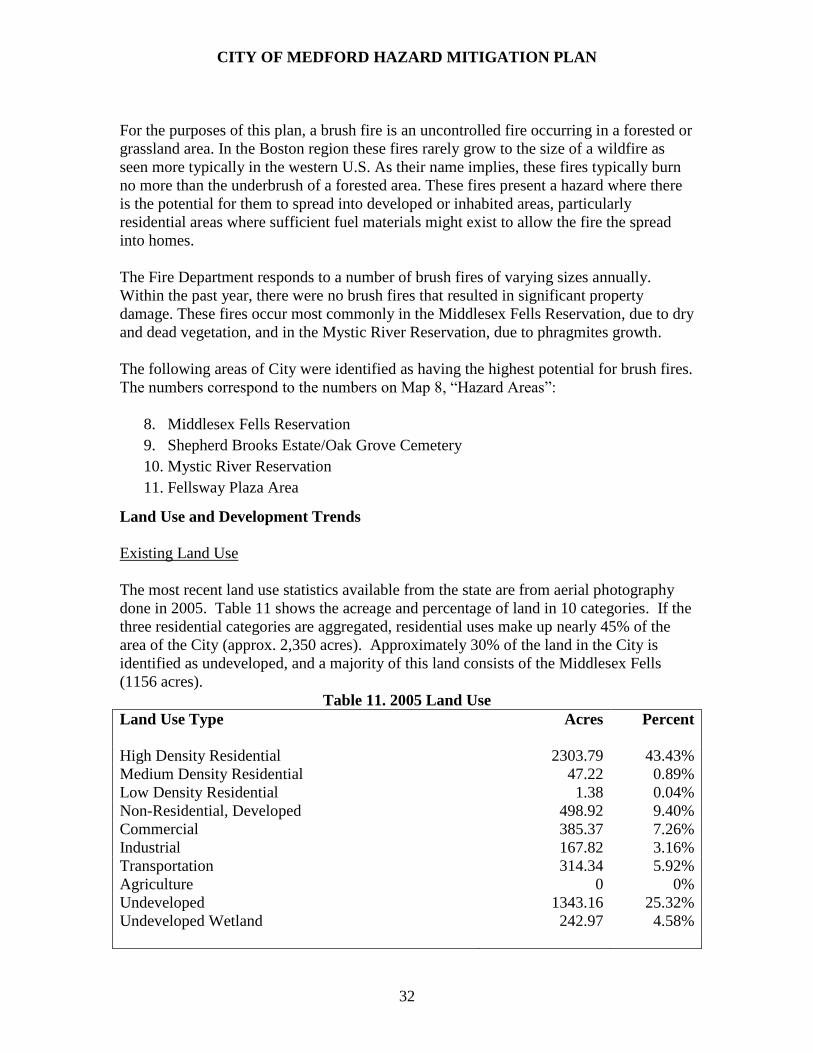
The most recent land use statistics available from the state are from aerial photography
done in 2005. Table 11 shows the acreage and percentage of land in 10 categories. If the
three residential categories are aggregated, residential uses make up nearly 45% of the
area of the City (approx. 2,350 acres). Approximately 30% of the land in the City is
identified as undeveloped, and a majority of this land consists of the Middlesex Fells
(1156 acres).
Table 11. 2005 Land Use
Land Use Type Acres Percent
High Density Residential 2303.79 43.43%
Medium Density Residential 47.22 0.89%
Low Density Residential 1.38 0.04%
Non-Residential, Developed 498.92 9.40%
Commercial 385.37 7.26%
Industrial 167.82 3.16%
Transportation 314.34 5.92%
Agriculture 0 0%
Undeveloped 1343.16 25.32%
Undeveloped Wetland 242.97 4.58%
CITY OF MEDFORD HAZARD MITIGATION PLAN
33
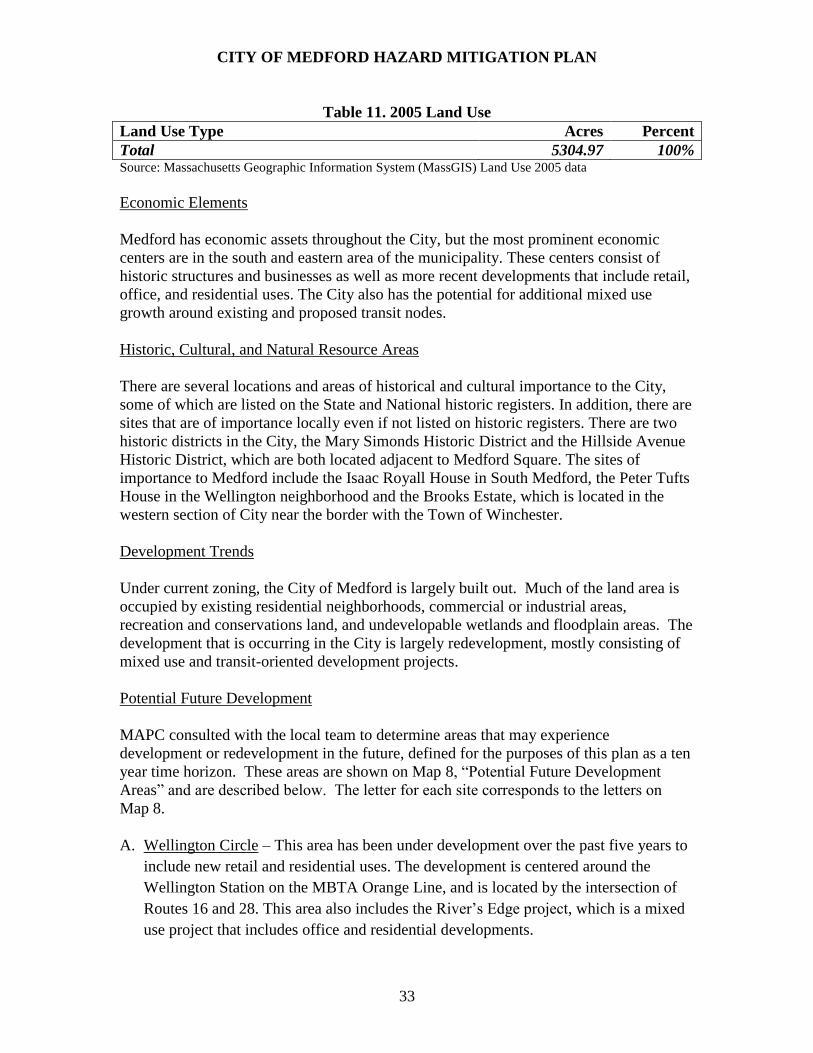
Table 11. 2005 Land Use
Land Use Type Acres Percent
Total 5304.97 100% Source: Massachusetts Geographic Information System (MassGIS) Land Use 2005 data
Economic Elements
Medford has economic assets throughout the City, but the most prominent economic
centers are in the south and eastern area of the municipality. These centers consist of
historic structures and businesses as well as more recent developments that include retail,
office, and residential uses. The City also has the potential for additional mixed use
growth around existing and proposed transit nodes.
Historic, Cultural, and Natural Resource Areas
There are several locations and areas of historical and cultural importance to the City,
some of which are listed on the State and National historic registers. In addition, there are
sites that are of importance locally even if not listed on historic registers. There are two
historic districts in the City, the Mary Simonds Historic District and the Hillside Avenue
Historic District, which are both located adjacent to Medford Square. The sites of
importance to Medford include the Isaac Royall House in South Medford, the Peter Tufts
House in the Wellington neighborhood and the Brooks Estate, which is located in the
western section of City near the border with the Town of Winchester.
Development Trends
Under current zoning, the City of Medford is largely built out. Much of the land area is
occupied by existing residential neighborhoods, commercial or industrial areas,
recreation and conservations land, and undevelopable wetlands and floodplain areas. The
development that is occurring in the City is largely redevelopment, mostly consisting of
mixed use and transit-oriented development projects.
Potential Future Development
MAPC consulted with the local team to determine areas that may experience
development or redevelopment in the future, defined for the purposes of this plan as a ten
year time horizon. These areas are shown on Map 8, “Potential Future Development
Areas” and are described below. The letter for each site corresponds to the letters on
Map 8.
A. Wellington Circle – This area has been under development over the past five years to
include new retail and residential uses. The development is centered around the
Wellington Station on the MBTA Orange Line, and is located by the intersection of
Routes 16 and 28. This area also includes the River’s Edge project, which is a mixed
use project that includes office and residential developments.

CITY OF MEDFORD HAZARD MITIGATION PLAN
34
B. Riverside Industrial Area – The Riverside area is the existing location of industrial
and commercial developments to the west of the Wellington Circle Area.
C. Medford Square – A historic commercial, cultural and institutional center of the City,
Medford Square is located by State Routes 38 and 60, and just to the east of Interstate
93. The City continues to focus on revitalizing the area according to the Master Plan
for the area, and exploring opportunities for commercial revitalization and
redevelopment and additional residential development.
D. Mystic Avenue – This area is located along Route 38 to the South of the Mystic
River, and is a commercial corridor. Due to some underutilized sites along the
corridor, it provides the opportunity for revitalization and could experience
redevelopment in the future.
E. Green Line Transit Development – College Avenue – This area at the intersection of
College Avenue and Boston Avenue is the planned location of a new station along the
MBTA Green Line Extension to Medford. Potential development and redevelopment
could occur in this area as a result of the new transit service.
F. Green Line Transit Development – Boston Avenue - This area at the intersection of
Boston Avenue and Route 16 (Mystic Valley Parkway) is the planned location of a
new station along the MBTA Green Line Extension to Medford. Potential
development and redevelopment, including redevelopment of nearby commercial and
residential uses, could occur in this area as a result of the new transit service.
G. Green Line Transit Development – Boston Avenue - This area in the vicinity of Ball
Square (Boston Avenue and Broadway) and along the municipal border with
Somerville is the planned location of a new station along the MBTA Green Line
Extension to Medford. Potential redevelopment, including redevelopment of nearby
commercial and industrial uses, could occur in this area as a result of the new transit
service.
H. Tufts University – The Tufts University campus is located in both Medford and the
City of Somerville. There could be potential for future development and growth
related to the campus.

CITY OF MEDFORD HAZARD MITIGATION PLAN
35
Vulnerability Assessment
The purpose of the vulnerability assessment is to estimate the extent of potential damages
from natural hazards of varying types and intensities.
Future Development in Hazard Areas
Table 12 shows the relationship of these parcels to two of the mapped hazards. This
information is provided so that planners can ensure that development proposals comply
with flood plain zoning and that careful attention is paid to drainage issues.
Table 12. Relationship of Potential Future Development Areas to Hazard Areas
Parcel Landslide risk Flood Zone Brush Fire
Riverside Industrial Area Moderate
Susceptibility No
No
Wellington Circle Moderate
Susceptibility 2.52% in AE
Yes
Mystic River
Reservation
Medford Square Low 3.9713% in
AE
No
Mystic Avenue Moderate
Susceptibility No
No
Green Line Transit Development
- College Avenue Low No
No
Green Line Transit Development
- Boston Avenue Low No
No
Green Line Transit Development
- Ball Square Low No
No
Tufts University Low No No
Critical Infrastructure in Hazard Areas
Critical infrastructure includes facilities that are important for disaster response and
evacuation (such as emergency operations centers, fire stations, water pump stations, etc.)
and facilities where additional assistance might be needed during an emergency (such as
nursing homes, elderly housing, day care centers, etc.). These facilities are listed in
Table 13 and are shown on all of the maps in Appendix B.
The purpose of mapping the natural hazards and critical infrastructure is to present an
overview of hazards in the community and how they relate to critical infrastructure, to
better understand which facilities may be vulnerable to particular natural hazards.
CITY OF MEDFORD HAZARD MITIGATION PLAN
36
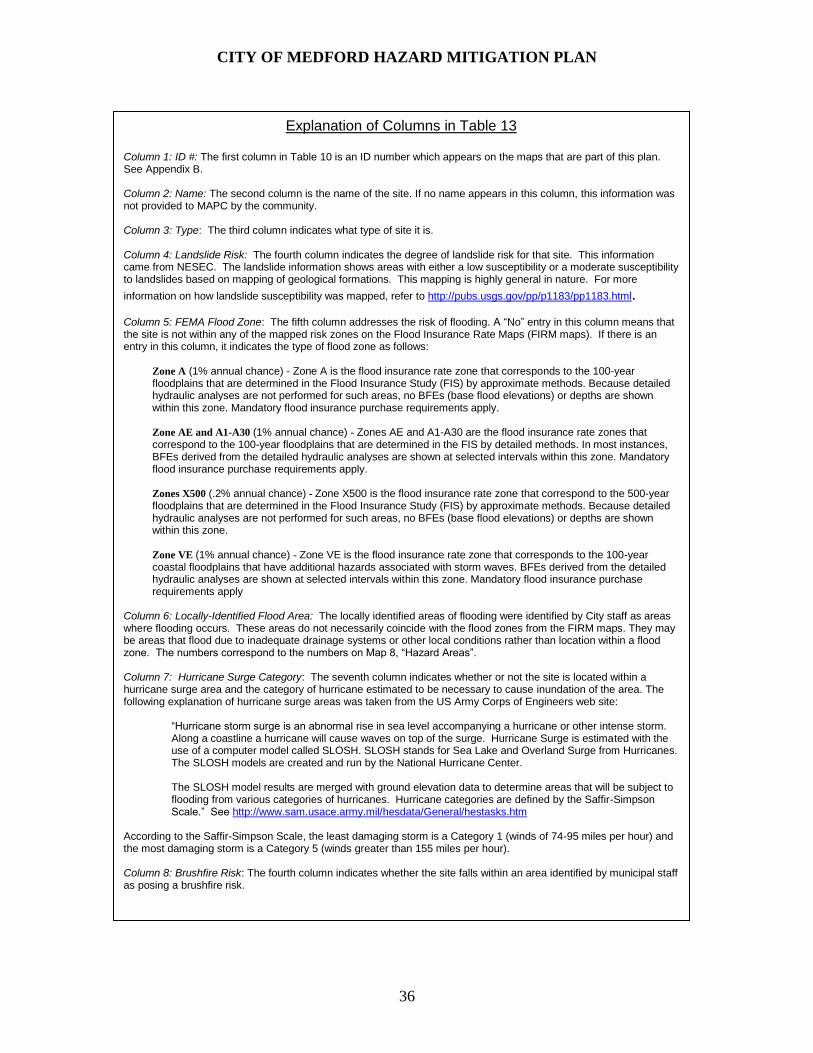
Explanation of Columns in Table 13 Column 1: ID #: The first column in Table 10 is an ID number which appears on the maps that are part of this plan. See Appendix B. Column 2: Name: The second column is the name of the site. If no name appears in this column, this information was not provided to MAPC by the community. Column 3: Type: The third column indicates what type of site it is. Column 4: Landslide Risk: The fourth column indicates the degree of landslide risk for that site. This information came from NESEC. The landslide information shows areas with either a low susceptibility or a moderate susceptibility to landslides based on mapping of geological formations. This mapping is highly general in nature. For more
information on how landslide susceptibility was mapped, refer to http://pubs.usgs.gov/pp/p1183/pp1183.html. Column 5: FEMA Flood Zone: The fifth column addresses the risk of flooding. A “No” entry in this column means that the site is not within any of the mapped risk zones on the Flood Insurance Rate Maps (FIRM maps). If there is an entry in this column, it indicates the type of flood zone as follows:
Zone A (1% annual chance) - Zone A is the flood insurance rate zone that corresponds to the 100-year floodplains that are determined in the Flood Insurance Study (FIS) by approximate methods. Because detailed hydraulic analyses are not performed for such areas, no BFEs (base flood elevations) or depths are shown within this zone. Mandatory flood insurance purchase requirements apply. Zone AE and A1-A30 (1% annual chance) - Zones AE and A1-A30 are the flood insurance rate zones that correspond to the 100-year floodplains that are determined in the FIS by detailed methods. In most instances, BFEs derived from the detailed hydraulic analyses are shown at selected intervals within this zone. Mandatory flood insurance purchase requirements apply.
Zones X500 (.2% annual chance) - Zone X500 is the flood insurance rate zone that correspond to the 500-year floodplains that are determined in the Flood Insurance Study (FIS) by approximate methods. Because detailed hydraulic analyses are not performed for such areas, no BFEs (base flood elevations) or depths are shown within this zone. Zone VE (1% annual chance) - Zone VE is the flood insurance rate zone that corresponds to the 100-year coastal floodplains that have additional hazards associated with storm waves. BFEs derived from the detailed hydraulic analyses are shown at selected intervals within this zone. Mandatory flood insurance purchase requirements apply
Column 6: Locally-Identified Flood Area: The locally identified areas of flooding were identified by City staff as areas where flooding occurs. These areas do not necessarily coincide with the flood zones from the FIRM maps. They may be areas that flood due to inadequate drainage systems or other local conditions rather than location within a flood zone. The numbers correspond to the numbers on Map 8, “Hazard Areas”. Column 7: Hurricane Surge Category: The seventh column indicates whether or not the site is located within a hurricane surge area and the category of hurricane estimated to be necessary to cause inundation of the area. The following explanation of hurricane surge areas was taken from the US Army Corps of Engineers web site:
“Hurricane storm surge is an abnormal rise in sea level accompanying a hurricane or other intense storm. Along a coastline a hurricane will cause waves on top of the surge. Hurricane Surge is estimated with the use of a computer model called SLOSH. SLOSH stands for Sea Lake and Overland Surge from Hurricanes. The SLOSH models are created and run by the National Hurricane Center. The SLOSH model results are merged with ground elevation data to determine areas that will be subject to flooding from various categories of hurricanes. Hurricane categories are defined by the Saffir-Simpson Scale.” See http://www.sam.usace.army.mil/hesdata/General/hestasks.htm
According to the Saffir-Simpson Scale, the least damaging storm is a Category 1 (winds of 74-95 miles per hour) and the most damaging storm is a Category 5 (winds greater than 155 miles per hour). Column 8: Brushfire Risk: The fourth column indicates whether the site falls within an area identified by municipal staff as posing a brushfire risk.
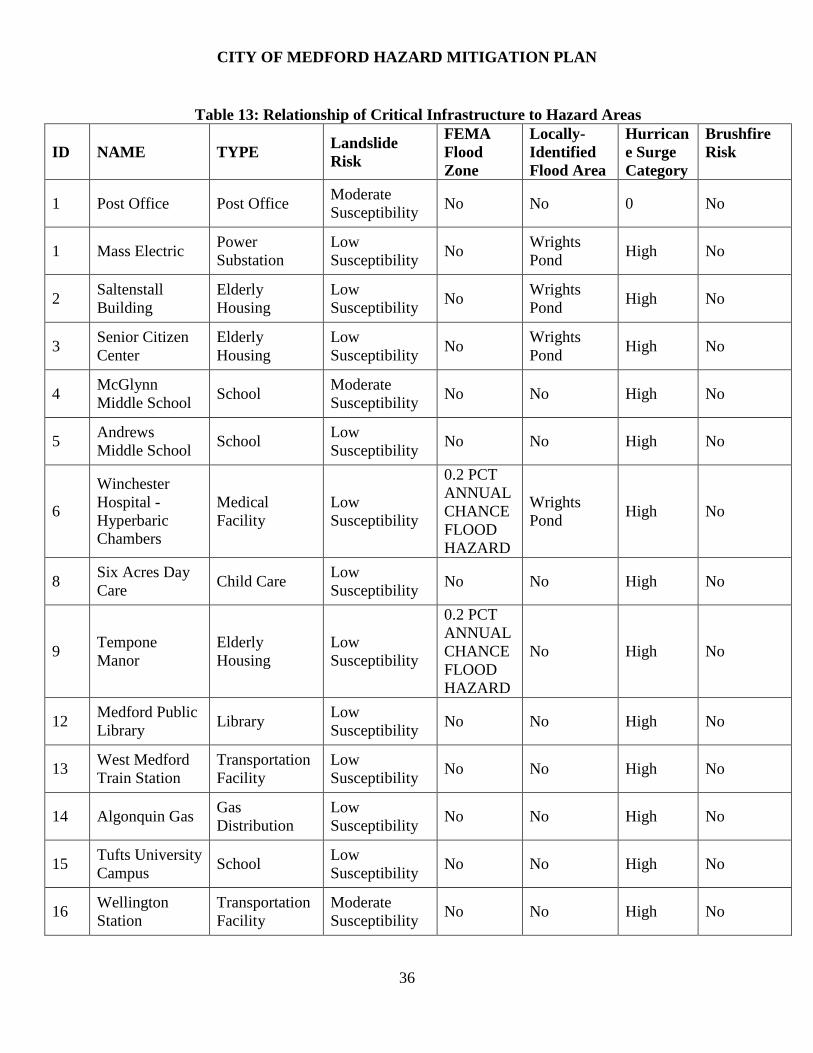
CITY OF MEDFORD HAZARD MITIGATION PLAN
36
Table 13: Relationship of Critical Infrastructure to Hazard Areas
ID NAME TYPE Landslide
Risk
FEMA
Flood
Zone
Locally-
Identified
Flood Area
Hurrican
e Surge
Category
Brushfire
Risk
1 Post Office Post Office Moderate
Susceptibility No No 0 No
1 Mass Electric Power
Substation
Low
Susceptibility No
Wrights
Pond High No
2 Saltenstall
Building
Elderly
Housing
Low
Susceptibility No
Wrights
Pond High No
3 Senior Citizen
Center
Elderly
Housing
Low
Susceptibility No
Wrights
Pond High No
4 McGlynn
Middle School School
Moderate
Susceptibility No No High No
5 Andrews
Middle School School
Low
Susceptibility No No High No
6
Winchester
Hospital -
Hyperbaric
Chambers
Medical
Facility
Low
Susceptibility
0.2 PCT
ANNUAL
CHANCE
FLOOD
HAZARD
Wrights
Pond High No
8 Six Acres Day
Care Child Care
Low
Susceptibility No No High No
9 Tempone
Manor
Elderly
Housing
Low
Susceptibility
0.2 PCT
ANNUAL
CHANCE
FLOOD
HAZARD
No High No
12 Medford Public
Library Library
Low
Susceptibility No No High No
13 West Medford
Train Station
Transportation
Facility
Low
Susceptibility No No High No
14 Algonquin Gas Gas
Distribution
Low
Susceptibility No No High No
15 Tufts University
Campus School
Low
Susceptibility No No High No
16 Wellington
Station
Transportation
Facility
Moderate
Susceptibility No No High No

CITY OF MEDFORD HAZARD MITIGATION PLAN
38
Table 13: Relationship of Critical Infrastructure to Hazard Areas
ID NAME TYPE Landslide
Risk
FEMA
Flood
Zone
Locally-
Identified
Flood Area
Hurrican
e Surge
Category
Brushfire
Risk
17 Kiss 108 Radio
Station
Broadcast
Facility
Moderate
Susceptibility No No Low No
19 Fire Station Fire Station Low
Susceptibility No
South
Medford High No
20 Key Span Gas Line Moderate
Susceptibility
0.2 PCT
ANNUAL
CHANCE
FLOOD
HAZARD
No High No
21 Glenridge
Nursing Care
Elderly
Housing
Low
Susceptibility No No High No
22 Little Red
School House Child Care
Moderate
Susceptibility No No High No
23 Mass Electric
Sub Station
Power
Substation
Moderate
Susceptibility No No High No
24 Wrights Pond
Dam Dam
Low
Susceptibility A No High
Middlesex
Fells
Reservation
25 Mystic Lakes
Dam Dam
Low
Susceptibility
0.2 PCT
ANNUAL
CHANCE
FLOOD
HAZARD
No High No
26 Walden Manor Elderly
Housing
Low
Susceptibility No No High No
27 Magoun Manor Elderly
Housing
Low
Susceptibility No No High No
28 Winthrop
House
Elderly
Housing
Low
Susceptibility No No High No
29
Courtyard
Nursing Care
Center
Elderly
Housing
Low
Susceptibility No No High No
30 Kennedy
School School
Low
Susceptibility No No High No

CITY OF MEDFORD HAZARD MITIGATION PLAN
39
Table 13: Relationship of Critical Infrastructure to Hazard Areas
ID NAME TYPE Landslide
Risk
FEMA
Flood
Zone
Locally-
Identified
Flood Area
Hurrican
e Surge
Category
Brushfire
Risk
31
Office of
Emergency
Management
Emergency
Operations
Center
Low
Susceptibility
0.2 PCT
ANNUAL
CHANCE
FLOOD
HAZARD
No High No
32 Walkling Court Elderly
Housing
Low
Susceptibility No No High No
33
Lawrence
Memorial
Hospital of
Medford
Hospital Low
Susceptibility No No High No
34 State Police
Barracks Police Station
Moderate
Susceptibility
0.2 PCT
ANNUAL
CHANCE
FLOOD
HAZARD
No High
Mystic
River
Reservation
35 Police
Headquarters Police Station
Low
Susceptibility
0.2 PCT
ANNUAL
CHANCE
FLOOD
HAZARD
No High No
36 Fire
Headquarters Fire Station
Low
Susceptibility
0.2 PCT
ANNUAL
CHANCE
FLOOD
HAZARD
No High No
37 Fire Station Fire Station Low
Susceptibility No No High No
38 Fire Station Fire Station Moderate
Susceptibility
0.2 PCT
ANNUAL
CHANCE
FLOOD
HAZARD
No High No
40 Water and
Sewer Plant
Public Works
Facility
Low
Susceptibility
0.2 PCT
ANNUAL
CHANCE
FLOOD
HAZARD
No High No
41 City Hall Municipal
Office
Low
Susceptibility No
Wrights
Pond High No
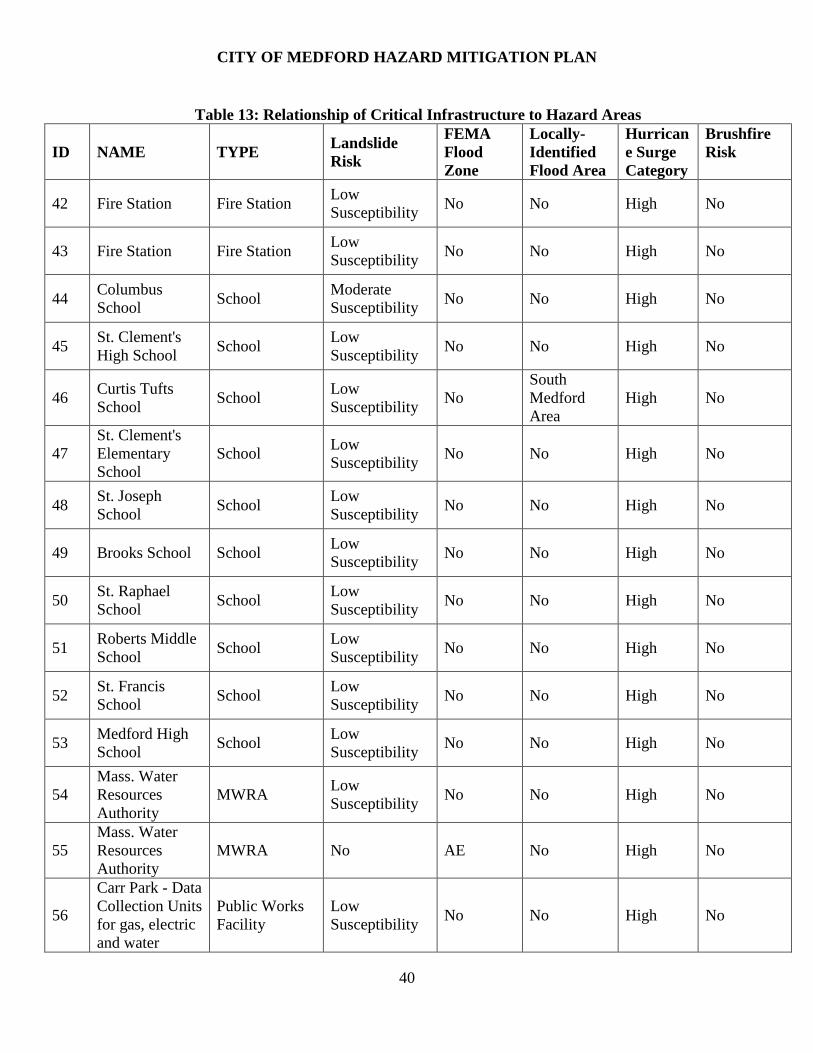
CITY OF MEDFORD HAZARD MITIGATION PLAN
40
Table 13: Relationship of Critical Infrastructure to Hazard Areas
ID NAME TYPE Landslide
Risk
FEMA
Flood
Zone
Locally-
Identified
Flood Area
Hurrican
e Surge
Category
Brushfire
Risk
42 Fire Station Fire Station Low
Susceptibility No No High No
43 Fire Station Fire Station Low
Susceptibility No No High No
44 Columbus
School School
Moderate
Susceptibility No No High No
45 St. Clement's
High School School
Low
Susceptibility No No High No
46 Curtis Tufts
School School
Low
Susceptibility No
South
Medford
Area
High No
47
St. Clement's
Elementary
School
School Low
Susceptibility No No High No
48 St. Joseph
School School
Low
Susceptibility No No High No
49 Brooks School School Low
Susceptibility No No High No
50 St. Raphael
School School
Low
Susceptibility No No High No
51 Roberts Middle
School School
Low
Susceptibility No No High No
52 St. Francis
School School
Low
Susceptibility No No High No
53 Medford High
School School
Low
Susceptibility No No High No
54
Mass. Water
Resources
Authority
MWRA Low
Susceptibility No No High No
55
Mass. Water
Resources
Authority
MWRA No AE No High No
56
Carr Park - Data
Collection Units
for gas, electric
and water
Public Works
Facility
Low
Susceptibility No No High No
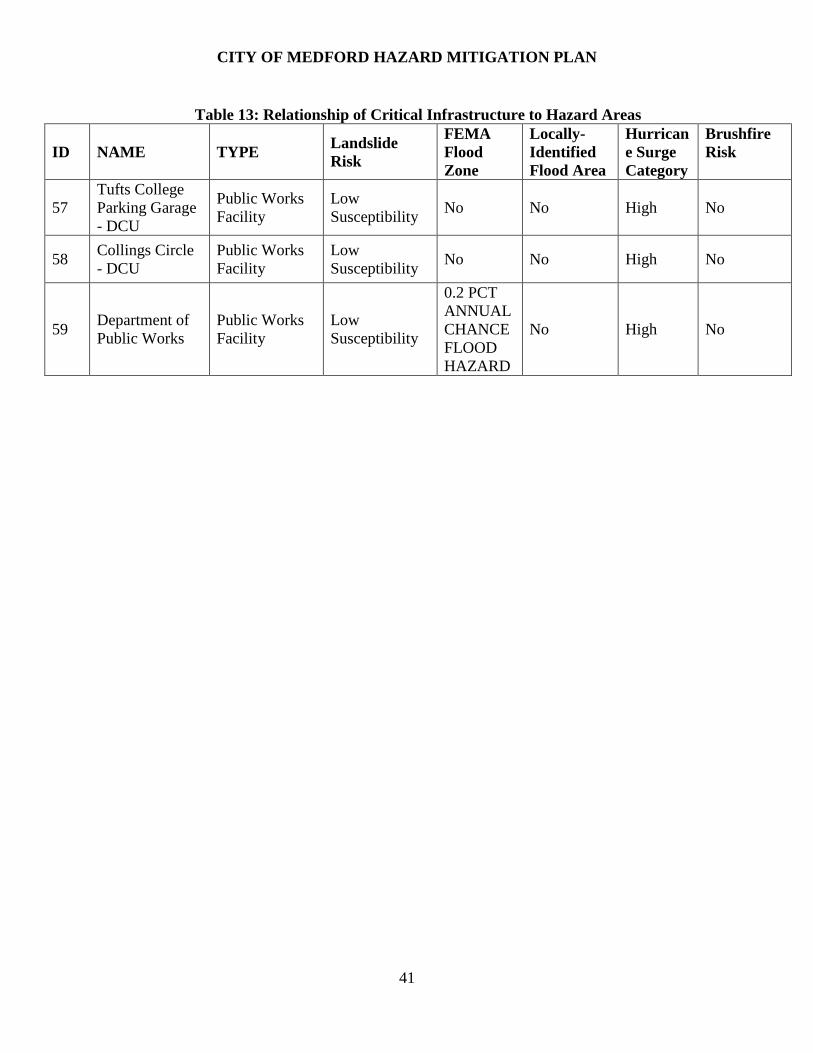
CITY OF MEDFORD HAZARD MITIGATION PLAN
41
Table 13: Relationship of Critical Infrastructure to Hazard Areas
ID NAME TYPE Landslide
Risk
FEMA
Flood
Zone
Locally-
Identified
Flood Area
Hurrican
e Surge
Category
Brushfire
Risk
57
Tufts College
Parking Garage
- DCU
Public Works
Facility
Low
Susceptibility No No High No
58 Collings Circle
- DCU
Public Works
Facility
Low
Susceptibility No No High No
59 Department of
Public Works
Public Works
Facility
Low
Susceptibility
0.2 PCT
ANNUAL
CHANCE
FLOOD
HAZARD
No High No

CITY OF MEDFORD HAZARD MITIGATION PLAN
42
Damage Assessments
An estimation of damages was performed for hurricanes, earthquakes, and flooding. The
methodology used for hurricanes and earthquakes was the HAZUS-MH software. The
methodology for flooding was developed specifically to address the issue in many of the
communities where flooding was not solely related to location within a floodplain.
Introduction to HAZUS-MH
HAZUS- MH (multiple-hazards) is a computer program developed by FEMA to estimate
losses due to a variety of natural hazards. The following overview of HAZUS-MH is
taken from the FEMA website. For more information on the HAZUS-MH software, go
to http://www.fema.gov/plan/prevent/hazus/index.shtm
“HAZUS-MH is a nationally applicable standardized methodology and software
program that contains models for estimating potential losses from earthquakes,
floods, and hurricane winds. HAZUS-MH was developed by the Federal
Emergency Management Agency (FEMA) under contract with the National
Institute of Building Sciences (NIBS). Loss estimates produced by HAZUS-MH
are based on current scientific and engineering knowledge of the effects of
hurricane winds, floods and earthquakes. Estimating losses is essential to
decision-making at all levels of government, providing a basis for developing and
evaluating mitigation plans and policies as well as emergency preparedness,
response and recovery planning.
HAZUS-MH uses state-of-the-art geographic information system (GIS) software
to map and display hazard data and the results of damage and economic loss
estimates for buildings and infrastructure. It also allows users to estimate the
impacts of hurricane winds, floods and earthquakes on populations.”
There are three modules included with the HAZUS-MH software: hurricane wind,
flooding, and earthquakes. There are also three levels at which HAZUS-MH can be run.
Level 1 uses national baseline data and is the quickest way to begin the risk assessment
process. The analysis that follows was completed using Level 1 data.
Level 1 relies upon default data on building types, utilities, transportation, etc. from
national databases as well as census data. While the databases include a wealth of
information on the City of Medford, it does not capture all relevant information. In fact,
the HAZUS training manual notes that the default data is “subject to a great deal of
uncertainty.”
However, for the purposes of this plan, the analysis is useful. This plan is attempting to
only generally indicate the possible extent of damages due to certain types of natural
disasters and to allow for a comparison between different types of disasters. Therefore,
this analysis should be considered to be a starting point for understanding potential
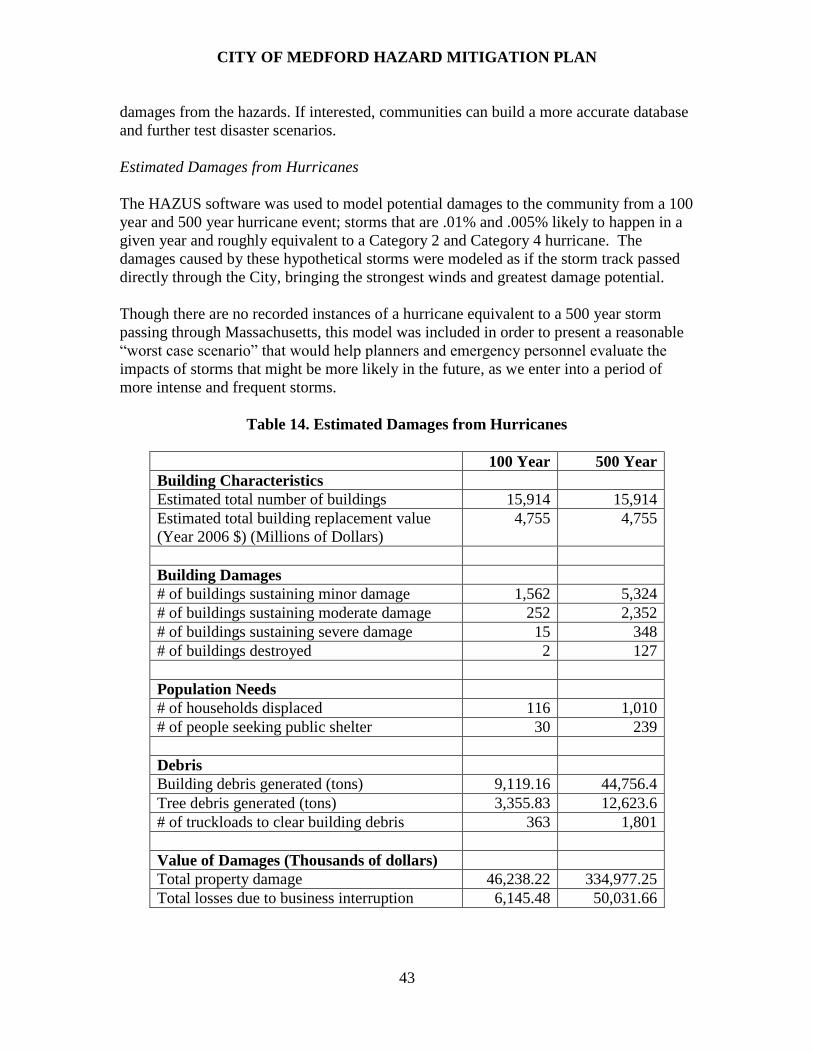
CITY OF MEDFORD HAZARD MITIGATION PLAN
43
damages from the hazards. If interested, communities can build a more accurate database
and further test disaster scenarios.
Estimated Damages from Hurricanes
The HAZUS software was used to model potential damages to the community from a 100
year and 500 year hurricane event; storms that are .01% and .005% likely to happen in a
given year and roughly equivalent to a Category 2 and Category 4 hurricane. The
damages caused by these hypothetical storms were modeled as if the storm track passed
directly through the City, bringing the strongest winds and greatest damage potential.
Though there are no recorded instances of a hurricane equivalent to a 500 year storm
passing through Massachusetts, this model was included in order to present a reasonable
“worst case scenario” that would help planners and emergency personnel evaluate the
impacts of storms that might be more likely in the future, as we enter into a period of
more intense and frequent storms.
Table 14. Estimated Damages from Hurricanes
100 Year 500 Year
Building Characteristics
Estimated total number of buildings 15,914 15,914
Estimated total building replacement value
(Year 2006 $) (Millions of Dollars)
4,755 4,755
Building Damages
# of buildings sustaining minor damage 1,562 5,324
# of buildings sustaining moderate damage 252 2,352
# of buildings sustaining severe damage 15 348
# of buildings destroyed 2 127
Population Needs
# of households displaced 116 1,010
# of people seeking public shelter 30 239
Debris
Building debris generated (tons) 9,119.16 44,756.4
Tree debris generated (tons) 3,355.83 12,623.6
# of truckloads to clear building debris 363 1,801
Value of Damages (Thousands of dollars)
Total property damage 46,238.22 334,977.25
Total losses due to business interruption 6,145.48 50,031.66
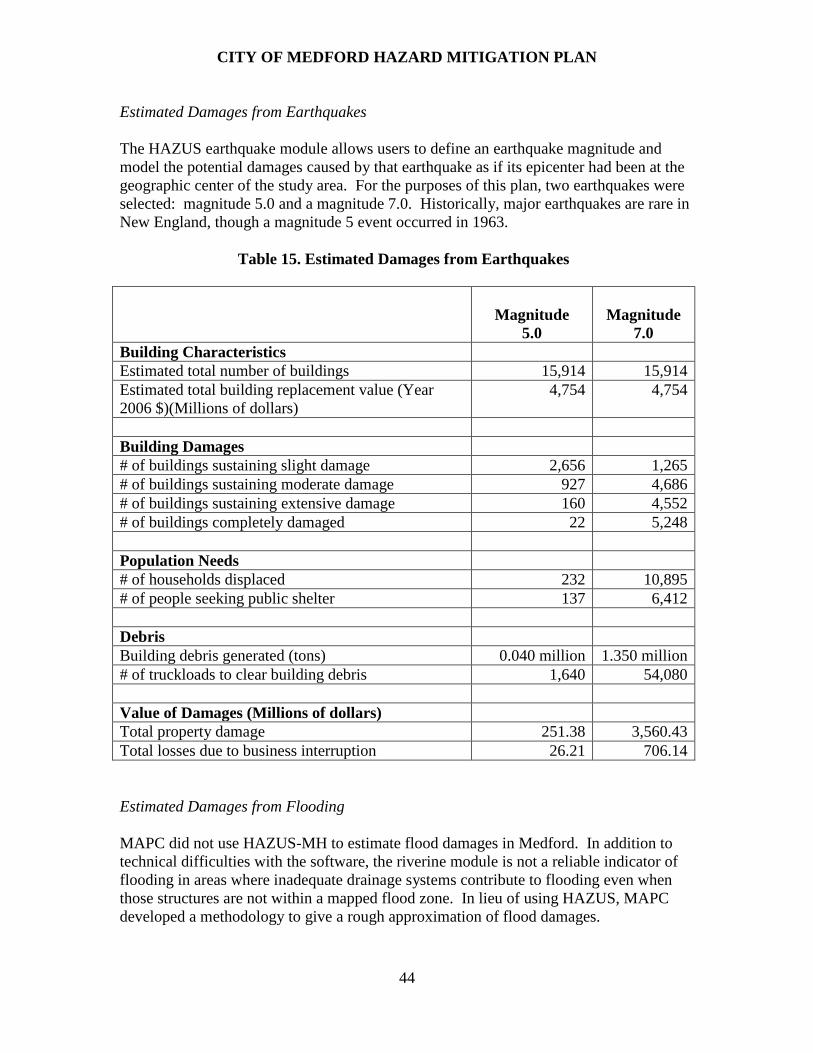
CITY OF MEDFORD HAZARD MITIGATION PLAN
44
Estimated Damages from Earthquakes
The HAZUS earthquake module allows users to define an earthquake magnitude and
model the potential damages caused by that earthquake as if its epicenter had been at the
geographic center of the study area. For the purposes of this plan, two earthquakes were
selected: magnitude 5.0 and a magnitude 7.0. Historically, major earthquakes are rare in
New England, though a magnitude 5 event occurred in 1963.
Table 15. Estimated Damages from Earthquakes
Magnitude
5.0
Magnitude
7.0
Building Characteristics
Estimated total number of buildings 15,914 15,914
Estimated total building replacement value (Year
2006 $)(Millions of dollars)
4,754 4,754
Building Damages
# of buildings sustaining slight damage 2,656 1,265
# of buildings sustaining moderate damage 927 4,686
# of buildings sustaining extensive damage 160 4,552
# of buildings completely damaged 22 5,248
Population Needs
# of households displaced 232 10,895
# of people seeking public shelter 137 6,412
Debris
Building debris generated (tons) 0.040 million 1.350 million
# of truckloads to clear building debris 1,640 54,080
Value of Damages (Millions of dollars)
Total property damage 251.38 3,560.43
Total losses due to business interruption 26.21 706.14
Estimated Damages from Flooding
MAPC did not use HAZUS-MH to estimate flood damages in Medford. In addition to
technical difficulties with the software, the riverine module is not a reliable indicator of
flooding in areas where inadequate drainage systems contribute to flooding even when
those structures are not within a mapped flood zone. In lieu of using HAZUS, MAPC
developed a methodology to give a rough approximation of flood damages.
CITY OF MEDFORD HAZARD MITIGATION PLAN
45
Medford is 8.29 square miles or 5304.97 acres. Approximately 478.74 acres have been
identified by local officials as areas of flooding. This amounts to 9.02% of the land area
in Medford. The number of structures in each flood area was estimated by applying the
percentage of the total land area to the number of structures (15,914) in Medford; the
same number of structures used by HAZUS for the hurricane and earthquake
calculations. HAZUS uses a value of $298,730.68 per structure for the building
replacement value. This was used to calculate the total building replacement value in
each of the flood areas. The calculations were done for a low estimate of 10% building
damages and a high estimate of 50% as suggested in the FEMA September 2002
publication, “State and Local Mitigation Planning how-to guides” (Page 4-13). The
range of estimates for flood damages is $42,901,748.09 to $214,508,740.47 (Table 16).
These calculations are not based solely on location within the floodplain or a particular
type of storm (i.e. 100 year flood).

CITY OF MEDFORD HAZARD MITIGATION PLAN
46
Table 16. Estimated Damages from Flooding
ID Flood Hazard
Area
Approximate
Area in Acres
% of Total
Land Area
in Medford
Estimated
Number of
Structures
Replacement
Value
Low Estimate of
Damages
High Estimate
of Damages
1 Wrights Pond 216.04 407.24% 648 $193,602,313 $19,360,231 $96,801,156
2 Cranberry Brook
Area 59.55 112.25% 179 $53,363,397 $5,336,340 $26,681,699
3
Lincoln Road /
Meetinghouse
Brook Area
74.86 141.11% 225 $67,084,150 $6,708,415 $33,542,075
4
Daly Rd /
Meetinghouse
Brook Area
11.84 22.31% 36 $10,608,431 $1,060,843 $5,304,215
5 South Medford
Area 110.51 208.31% 332 $99,029,263 $9,902,926 $49,514,632
6 Fifth Street Area 5.72 10.79% 17 $5,129,513 $512,951 $2,564,756

CITY OF MEDFORD HAZARD MITIGATION PLAN
47
Table 16. Estimated Damages from Flooding
ID Flood Hazard
Area
Approximate
Area in Acres
% of Total
Land Area
in Medford
Estimated
Number of
Structures
Replacement
Value
Low Estimate of
Damages
High Estimate
of Damages
7 Sydney St Pump
Station 0.22 0.42% 1 $200,415 $20,041 $100,207
Totals 478.74 9.02% 1436 $429,017,480.94 $42,901,748.09 $214,508,740.47
CITY OF MEDFORD HAZARD MITIGATION PLAN
48
[This page intentionally left blank]

CITY OF MEDFORD HAZARD MITIGATION PLAN
49
V. HAZARD MITIGATION GOALS
The Medford Local Multiple Hazard Community Planning Team met on March 27, 2013.
At that meeting, the team reviewed and discussed the goals from the 2008 Hazard
Mitigation Plan for the City of Medford. After some discussion, the existing goals were
found to still be reflective of the City’s objectives with regard to addressing hazard
mitigation in the community.
The following ten goals were endorsed by the Committee for the 2013 update of the
Medford Hazard Mitigation Plan:
1. Prevent and reduce the loss of life, injury and property damages resulting from all
major natural hazards.
2. Identify and seek funding for measures to mitigate or eliminate each known
significant flood hazard area.
3. Integrate hazard mitigation planning as an integral factor in all relevant municipal
departments, committees and boards.
4. Prevent and reduce the damage to public infrastructure resulting from all hazards.
5. Encourage the business community, major institutions and non-profits to work
with the City to develop, review and implement the hazard mitigation plan.
6. Work with surrounding communities, state, regional and federal agencies to
ensure regional cooperation and solutions for hazards affecting multiple
communities.
7. Ensure that future development meets all applicable standards for preventing and
reducing the impacts of natural hazards.
8. Take maximum advantage of resources from FEMA, MEMA and other agencies
to educate City staff and the public about hazard mitigation.

CITY OF MEDFORD HAZARD MITIGATION PLAN
50
[This page intentionally left blank]

CITY OF MEDFORD HAZARD MITIGATION PLAN
51
VI. HAZARD MITIGATION STRATEGY
The central component of a hazard mitigation plan is the strategy for reducing the
community’s vulnerabilities to natural hazard events. Responding to the analysis of risk,
vulnerabilities, potential impacts, and anticipated future development, the process for
developing this strategy is one of setting goals, understanding what actions the
community is already taking that contribute to mitigating the effects of natural hazards
and assessing where more action is needed to complement or modify existing measures.
The following sections include descriptions of existing mitigation measures, a status
update on mitigation measures identified in previous plans, and descriptions of proposed
new mitigation measures. All mitigation measures are evaluated by their benefits and
potential costs to arrive at a prioritized list of action items.
What is Hazard Mitigation?
Hazard mitigation means to permanently reduce or alleviate the losses of life, injuries and
property resulting from natural hazards through long-term strategies. These long-term
strategies include planning, policy changes, education programs, infrastructure projects
and other activities. FEMA currently has three mitigation grant programs: the Hazards
Mitigation Grant Program (HGMP), the Pre-Disaster Mitigation program (PDM), and the
Flood Mitigation Assistance (FMA) program. The three links below provide additional
information on these programs.
http://www.fema.gov/government/grant/hmgp/index.shtm
http://www.fema.gov/government/grant/pdm/index.shtm
http://www.fema.gov/government/grant/fma/index.shtm
Hazard Mitigation Measures can generally be sorted into the following groups:
Prevention: Government administrative or regulatory actions or processes that
influence the way land and buildings are developed and built. These actions also
include public activities to reduce hazard losses. Examples include planning and
zoning, building codes, capital improvement programs, open space preservation,
and stormwater management regulations.
Property Protection: Actions that involve the modification of existing buildings
or infrastructure to protect them from a hazard or removal from the hazard area.
Examples include acquisition, elevation, relocation, structural retrofits, flood
proofing, storm shutters, and shatter resistant glass.
Public Education & Awareness: Actions to inform and educate citizens, elected
officials, and property owners about the potential risks from hazards and potential
ways to mitigate them. Such actions include outreach projects, real estate
disclosure, hazard information centers, and school-age and adult education
programs.

CITY OF MEDFORD HAZARD MITIGATION PLAN
52
Natural Resource Protection: Actions that, in addition to minimizing hazard
losses also preserve or restore the functions of natural systems. These actions
include sediment and erosion control, stream corridor restoration, watershed
management, forest and vegetation management, and wetland restoration and
preservation.
Structural Projects: Actions that involve the construction of structures to reduce
the impact of a hazard. Such structures include storm water controls (e.g.,
culverts), floodwalls, seawalls, retaining walls, and safe rooms.
Emergency Services Protection: Actions that will protect emergency services
before, during, and immediately after an occurrence. Examples of these actions
include protection of warning system capability, protection of critical facilities,
and protection of emergency response infrastructure.
(Source: FEMA Local Multi-Hazard Mitigation Planning Guidance)
Existing Mitigation Measures
Existing Multi-Hazard Mitigation Measures
There are several mitigation measures that impact more than one hazard. These include
the Comprehensive Emergency Management Plan (CEMP), the Massachusetts State
Building Code and participation in a local Emergency Planning Committee.
Comprehensive Emergency Management Plan (CEMP) – Every community in
Massachusetts is required to have a Comprehensive Emergency Management Plan. These
plans address mitigation, preparedness, response and recovery from a variety of natural
and man-made emergencies. These plans contain important information regarding
flooding, dam failures and winter storms. Therefore, the CEMP is a mitigation measure
that is relevant to many of the hazards discussed in this plan.
Enforcement of the state building code – The Massachusetts State Building Code contains
many detailed regulations regarding wind loads, earthquake resistant design, flood-
proofing and snow loads. The building code can be viewed in its entirety at
http://www.mass.gov/bbrs/newcode.htm.
It was noted that the Massachusetts State Building Code does a good job overall of
protecting against the impacts of natural hazards. For example, for areas in Medford that
contain filled land and are of concern regarding liquefaction, construction is required to
be built on piles or various types of spread footings to account for the sub-standard soil
conditions. Also, the flood area construction areas are classified as A-Zone areas in the
building code and any recent construction in these areas, which has been limited, has
been performed in accordance with the State Building Code requirements.
Participation in the Mystic Regional Emergency Planning Committee (REPC) - The
Mystic REPC serves as the emergency planning committee for 19 cities and towns. These
include: Arlington, Burlington, Chelsea, Everett, Lynn, Lynnfield, Malden, Medford,
Melrose, North Reading, Reading, Revere, Saugus, Somerville, Stoneham, Wakefield,

CITY OF MEDFORD HAZARD MITIGATION PLAN
53
Winchester, Winthrop, and Woburn. The Mystic REPC’s 19 member cities and towns
work together to develop plans to educate, communicate, and protect their communities
in case of natural and man-made emergencies. The Mystic REPC is the first regional
planning committee to be certified by State of Massachusetts.
Participation in Additional Regional Emergency Preparedness and Response
Organizations - Medford also participates in additional regional organizations that
address emergency preparedness and response including:
Northeast Homeland Security Planning Councils, which includes 85 municipalities
and is responsible to develops a regional Homeland Security Plan and oversees
related grant program expenditures.
METROFIRE, which is an association of Fire Departments in the Metropolitan
Boston area to coordinate Mutual Aid and act as a common entity for improving the
overall effectiveness of their Fire and Emergency Medical Services
Mystic Valley Public Health Coalition – MDPH Region 3E (Medford, Malden,
Melrose, Wakefield, Stoneham and Reading (2011)) has been working as a
preparedness coalition since 2004. Medford has been the host agent since the
inception of the program.
Mystic Valley Medical Reserve Corps (2005) – The corps is a volunteer organization
of pre-credentialed volunteers to assist the Public Health Departments in the event of
an emergency or a public health initiative. The Public Health Director in Medford is
the Director, but the MRC serves the same six (6) cities and towns of the Public
Health Coalition.
Medford Health Department Emergency Response Plan – Per Massachusetts Department
of Public Health (MPDH) guidelines, the all hazards plan incorporates response and
recovery in the management of all hazards. The plan is revised as needed per guidance of
the Centers for Disease Control and Prevention (CDC) and MDPH.
Existing Flood Hazard Mitigation Measures
Section 46 of the Medford City Code – Development in the Flood Zone – This section of
the general code deals with development in the flood zones. Section 46.31 lists the
purposes of this section. Section 46-33 lists five approaches to reducing flood losses. The
areas subject to this ordinance are the areas of special flood hazard identified on the 1985
Flood Insurance Rate Map (FIRM) maps. Section 46-39 acknowledges that land outside
the special flood hazard areas may also flood. Section 46-75 regulates the alteration of
watercourses.
FEMA updated FIRMs since the 2008 plan. The City approved an amendment to Section
46 in June 2010to incorporate the updated FEMA FIRMs and bring the City into
compliance with federal regulations.
Wetlands Ordinance - Adopted after 2008 plan, the purpose of the ordinance (Sec. 87) is
to preserve and protect the wetlands, water resources, and adjacent upland areas by
controlling activities deemed by the Conservation Commission likely to have a
CITY OF MEDFORD HAZARD MITIGATION PLAN
54
significant individual and/or cumulative effect upon resource area values, such as public
or private water supply, groundwater, flood control, erosion and sedimentation control,
and storm damage prevention, deemed important to the community. The City continues
to review and explore opportunities to update.
Site Plan Review –Section 94-221 2.e sets forth requirements for site plans in the Mixed
Use zoning district. It requires that a preliminary site plan in the Mixed Use zoning
district must include a description of any problems of drainage or topography. The site
plan must also show the location of wetlands, water bodies and the 100 year flood plain
elevations as well as the location of existing and proposed drainage facilities. The site
plan must also include “the applicant’s calculation of requirements and evaluation of the
availability and adequacy of off-site public facilities including …and drainage”.
Adequate drainage is also listed as one of the criteria for reviewing and approving a site
plan. Section 94-331 sets forth the same requirements for site plan reviews in other
districts.
Linkage Fees – Section 94:441 sets up a fund for roads and traffic facility capital
improvements through a linkage fee for development projects of a certain size. Section
94-471 does the same for water and sewer facilities and Section 94-411 does this for
police and fire facilities. The funds can be used for capital improvements related to
accommodating new development.
Participation in the Upper Mystic River Watershed Project Impact Initiative – Medford,
along with Arlington, Burlington, Lexington, Reading, Stoneham, Wilmington,
Winchester and Woburn, came together to form the Upper Mystic Watershed Board
(UMWB). The UMWB is a collaborative, inter-governmental entity created to draft and
implement a regional flood mitigation strategy. The City continues to participate as
needed in coordination efforts for the UMWB, although the Board has not met in recent
years.
Street sweeping – The City has an annual street sweeping program. In the spring, sand is
removed from the streets and in the fall, the focus is on leaf removal. The program is
conducted using City employees. Additionally, the City also sweeps nightly on major
roadway corridors.
Catch basin cleaning – All catch basins in the City are cleaned once a year. This task is
performed by outside contractors. Approximately 3400 catch basins are cleaned annually.
Debris removal – When heavy rains are forecast, the Department of Public Works (DPW)
goes out to watch for and remove trash that has accumulated in the brooks, catch basins
and trash racks.
Subdivision regulations regarding runoff - The city engineering department continues to
be aggressive in working with developers to ensure that there is not net increase in runoff
from new development projects.
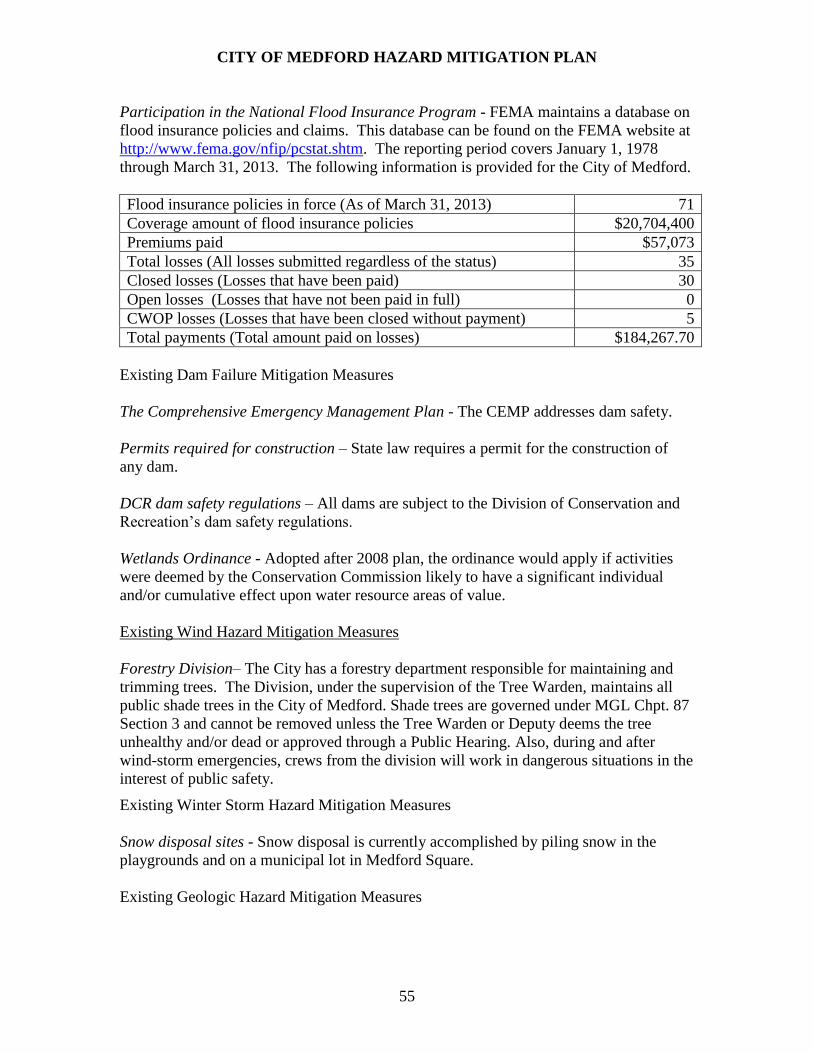
CITY OF MEDFORD HAZARD MITIGATION PLAN
55
Participation in the National Flood Insurance Program - FEMA maintains a database on
flood insurance policies and claims. This database can be found on the FEMA website at
http://www.fema.gov/nfip/pcstat.shtm. The reporting period covers January 1, 1978
through March 31, 2013. The following information is provided for the City of Medford.
Flood insurance policies in force (As of March 31, 2013) 71
Coverage amount of flood insurance policies $20,704,400
Premiums paid $57,073
Total losses (All losses submitted regardless of the status) 35
Closed losses (Losses that have been paid) 30
Open losses (Losses that have not been paid in full) 0
CWOP losses (Losses that have been closed without payment) 5
Total payments (Total amount paid on losses) $184,267.70
Existing Dam Failure Mitigation Measures
The Comprehensive Emergency Management Plan - The CEMP addresses dam safety.
Permits required for construction – State law requires a permit for the construction of
any dam.
DCR dam safety regulations – All dams are subject to the Division of Conservation and
Recreation’s dam safety regulations.
Wetlands Ordinance - Adopted after 2008 plan, the ordinance would apply if activities
were deemed by the Conservation Commission likely to have a significant individual
and/or cumulative effect upon water resource areas of value.
Existing Wind Hazard Mitigation Measures
Forestry Division– The City has a forestry department responsible for maintaining and
trimming trees. The Division, under the supervision of the Tree Warden, maintains all
public shade trees in the City of Medford. Shade trees are governed under MGL Chpt. 87
Section 3 and cannot be removed unless the Tree Warden or Deputy deems the tree
unhealthy and/or dead or approved through a Public Hearing. Also, during and after
wind-storm emergencies, crews from the division will work in dangerous situations in the
interest of public safety.
Existing Winter Storm Hazard Mitigation Measures
Snow disposal sites - Snow disposal is currently accomplished by piling snow in the
playgrounds and on a municipal lot in Medford Square.
Existing Geologic Hazard Mitigation Measures
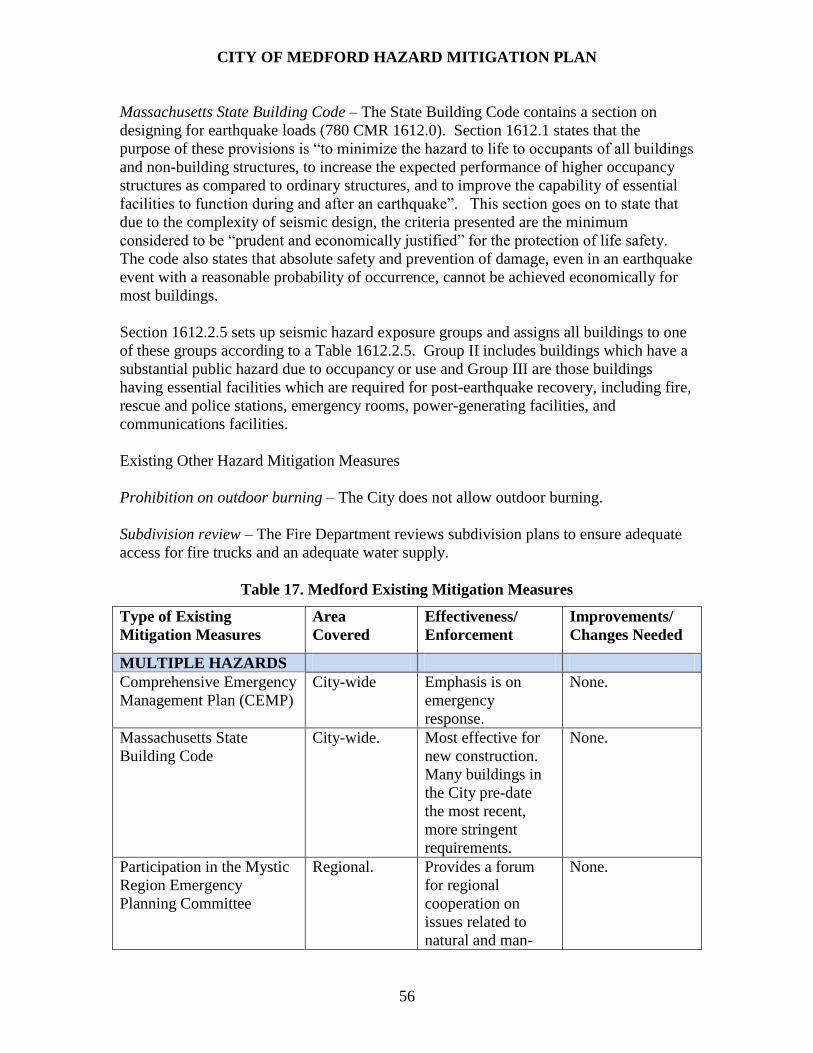
CITY OF MEDFORD HAZARD MITIGATION PLAN
56
Massachusetts State Building Code – The State Building Code contains a section on
designing for earthquake loads (780 CMR 1612.0). Section 1612.1 states that the
purpose of these provisions is “to minimize the hazard to life to occupants of all buildings
and non-building structures, to increase the expected performance of higher occupancy
structures as compared to ordinary structures, and to improve the capability of essential
facilities to function during and after an earthquake”. This section goes on to state that
due to the complexity of seismic design, the criteria presented are the minimum
considered to be “prudent and economically justified” for the protection of life safety.
The code also states that absolute safety and prevention of damage, even in an earthquake
event with a reasonable probability of occurrence, cannot be achieved economically for
most buildings.
Section 1612.2.5 sets up seismic hazard exposure groups and assigns all buildings to one
of these groups according to a Table 1612.2.5. Group II includes buildings which have a
substantial public hazard due to occupancy or use and Group III are those buildings
having essential facilities which are required for post-earthquake recovery, including fire,
rescue and police stations, emergency rooms, power-generating facilities, and
communications facilities.
Existing Other Hazard Mitigation Measures
Prohibition on outdoor burning – The City does not allow outdoor burning.
Subdivision review – The Fire Department reviews subdivision plans to ensure adequate
access for fire trucks and an adequate water supply.
Table 17. Medford Existing Mitigation Measures
Type of Existing
Mitigation Measures
Area
Covered
Effectiveness/
Enforcement
Improvements/
Changes Needed
MULTIPLE HAZARDS
Comprehensive Emergency
Management Plan (CEMP)
City-wide Emphasis is on
emergency
response.
None.
Massachusetts State
Building Code
City-wide. Most effective for
new construction.
Many buildings in
the City pre-date
the most recent,
more stringent
requirements.
None.
Participation in the Mystic
Region Emergency
Planning Committee
Regional. Provides a forum
for regional
cooperation on
issues related to
natural and man-
None.

CITY OF MEDFORD HAZARD MITIGATION PLAN
57
Table 17. Medford Existing Mitigation Measures
Type of Existing
Mitigation Measures
Area
Covered
Effectiveness/
Enforcement
Improvements/
Changes Needed
made disasters.
Participation in Additional
Regional Emergency
Preparedness and Response
Organizations
Regional. Provides a added
opportunities for
regional review,
planning and
coordination for
emergency
preparedness and
response
None.
Medford Health
Department Emergency
Response Plan
City-wide. Emphasis is on to
preparedness for
emergencies at
public health
departments.
None.
FLOOD HAZARDS
Section 46 of the Medford
City Code – Development
in the Flood Zone
Areas
designated as
special flood
hazard zones
on the 1985
FIRM maps.
Effective for areas
designated as
special flood hazard
areas. Section 46-
39 acknowledges
that land outside the
flood hazard zones
may also flood.
Amended in June
2010 to
incorporate
updated FEMA
FIRMs.
Wetlands Ordinance Areas
containing
wetlands,
water
resources, and
adjacent
uplands.
Effective. Update as needed
to reflect local
planning goals and
changes to state
wetland
regulations.
Site Plan Review
Provisions of the Zoning
Code
Any for
projects that
require site
plan review.
Effective. None.
Linkage fees City-wide but
only applies to
projects of a
certain size.
Effective. None.
Upper Mystic River
Watershed Project Impact
Initiative
The Upper
Mystic River
watershed.
Effective as a
regional planning
tool.
None.

CITY OF MEDFORD HAZARD MITIGATION PLAN
58
Table 17. Medford Existing Mitigation Measures
Type of Existing
Mitigation Measures
Area
Covered
Effectiveness/
Enforcement
Improvements/
Changes Needed
Street sweeping City-wide. Effective. None.
Catch basin cleaning/debris
removal.
City-wide. Generally effective.
When heavy rains
are forecast, the
DPW does
additional cleaning
as needed to
remove trash that
has accumulated.
None.
Participation in the
National Flood Insurance
Program
Areas
identified on
the FIRM
maps.
There are 71
policies in force.
Encourage all
eligible
homeowners to
obtain insurance.
Subdivision regulations City-wide. Effective. None.
DAM FAILURE
Comprehensive Emergency
Management Plan (CEMP)
All dams in the
City.
Emphasis is on
emergency
response.
None.
State permits required for
dam construction
State-wide. Most effective for
ensuring initial
construction meets
the code.
Improvements
needed to the
statewide system
for dam
inspections.
DCR dam safety
regulations
State-wide. Enforcement is an
issue.
Staffing and
budgeting needs to
be addressed.
Wetlands Ordinance Activities
likely to have a
significant
individual
and/or
cumulative
effect on water
resource areas
of value.
Effective. Update as needed
to reflect local
planning goals and
changes to state
wetland
regulations.
WIND HAZARDS
Forestry Division City-wide. Effective. None.

CITY OF MEDFORD HAZARD MITIGATION PLAN
59
Table 17. Medford Existing Mitigation Measures
Type of Existing
Mitigation Measures
Area
Covered
Effectiveness/
Enforcement
Improvements/
Changes Needed
WINTER HAZARDS
Snow disposal City-wide. Effective. None.
GEOLOGIC HAZARDS
Massachusetts State
Building Code
City-wide. Effective for most
situations.
None.
BRUSH FIRE
HAZARDS
Prohibition on outdoor
burning
City-wide. Effective. None.
Subdivision review City-wide. Effective. None.

CITY OF MEDFORD HAZARD MITIGATION PLAN
60
Implementation Progress on Previous Plans
At a meeting of the Medford Hazard Mitigation Committee, City staff reviewed the
mitigation measures identified in the 2008 Metro Boston Regional Pre-Disaster
Mitigation Plan Medford Annex determined whether measures identified in the plan had
been implemented or deferred. For implemented projects, they were categorized as either
complete or ongoing, with the latter referring to projects were still under development or
had begun but not yet completed. Ongoing measures are carried forward into the 2013
Medford Hazard Mitigation Plan. Of those measures that had been deferred, the
committee evaluated whether the measure should be deleted or carried forward into the
plan update. The decision on whether to delete or retain a particular measure was based
on the committee’s assessment of the continued relevance or effectiveness of the measure
and whether the deferral of action on the measure was due to the inability of the City to
take action on the measure.
Table 18. Mitigation Measures from the 2008 Plan
Mitigation
Measures
Priority Implementation
Responsibility
2012
Status
Sydney St.
drainage
improvements
High DPW Complete
Sydney Street
Connector
High DPW Complete
Cradock Ave.
drainage
improvements
High DPW Deferred/Complete
(Maintenance activities performed along lines which
addressed drainage issues)
South Medford
drainage
improvements
High DPW Ongoing
(Continuing to be under study with potential
refinement of geography where drainage issues are
located)
Winter Brook
Drainage
Improvements
High DPW Complete/Ongoing
(Small scale project performed to clear section of
Winter Brook where it is in an open channel/no
piping to enclose brook. Area continues to be under
study for potential drainage improvement project)
Study the
drainage impacts
of the Green Line
extension.
High DPW Ongoing
(Included as part of mitigation work of MBTA Green
Line extension project which is underway)
Cranberry Brook
drainage
improvements
Medium DPW Ongoing
(Project continues to be under study)
Park Street
drainage
Low DPW Ongoing/Deferred
(Project continues to be under study although area has
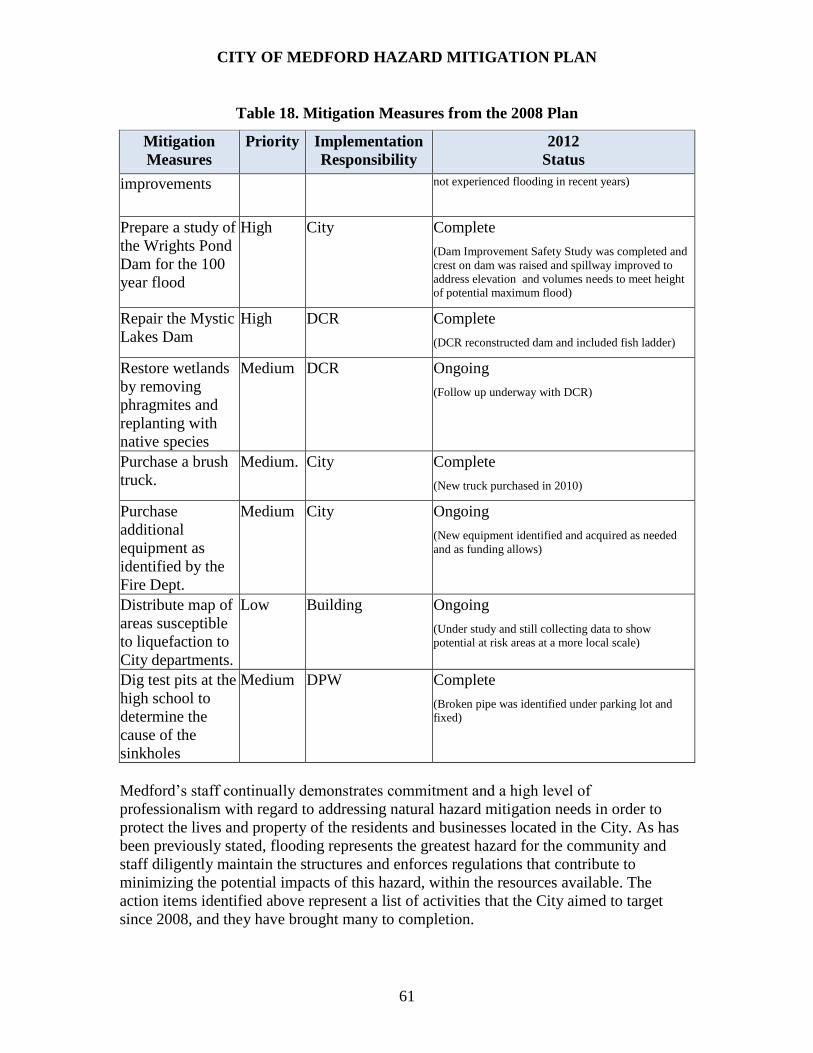
CITY OF MEDFORD HAZARD MITIGATION PLAN
61
Table 18. Mitigation Measures from the 2008 Plan
Mitigation
Measures
Priority Implementation
Responsibility
2012
Status
improvements not experienced flooding in recent years)
Prepare a study of
the Wrights Pond
Dam for the 100
year flood
High City Complete
(Dam Improvement Safety Study was completed and
crest on dam was raised and spillway improved to
address elevation and volumes needs to meet height
of potential maximum flood)
Repair the Mystic
Lakes Dam
High DCR Complete
(DCR reconstructed dam and included fish ladder)
Restore wetlands
by removing
phragmites and
replanting with
native species
Medium DCR Ongoing
(Follow up underway with DCR)
Purchase a brush
truck.
Medium. City Complete
(New truck purchased in 2010)
Purchase
additional
equipment as
identified by the
Fire Dept.
Medium City Ongoing
(New equipment identified and acquired as needed
and as funding allows)
Distribute map of
areas susceptible
to liquefaction to
City departments.
Low Building Ongoing
(Under study and still collecting data to show
potential at risk areas at a more local scale)
Dig test pits at the
high school to
determine the
cause of the
sinkholes
Medium DPW Complete
(Broken pipe was identified under parking lot and
fixed)
Medford’s staff continually demonstrates commitment and a high level of
professionalism with regard to addressing natural hazard mitigation needs in order to
protect the lives and property of the residents and businesses located in the City. As has
been previously stated, flooding represents the greatest hazard for the community and
staff diligently maintain the structures and enforces regulations that contribute to
minimizing the potential impacts of this hazard, within the resources available. The
action items identified above represent a list of activities that the City aimed to target
since 2008, and they have brought many to completion.
CITY OF MEDFORD HAZARD MITIGATION PLAN
62
[This page intentionally left blank]
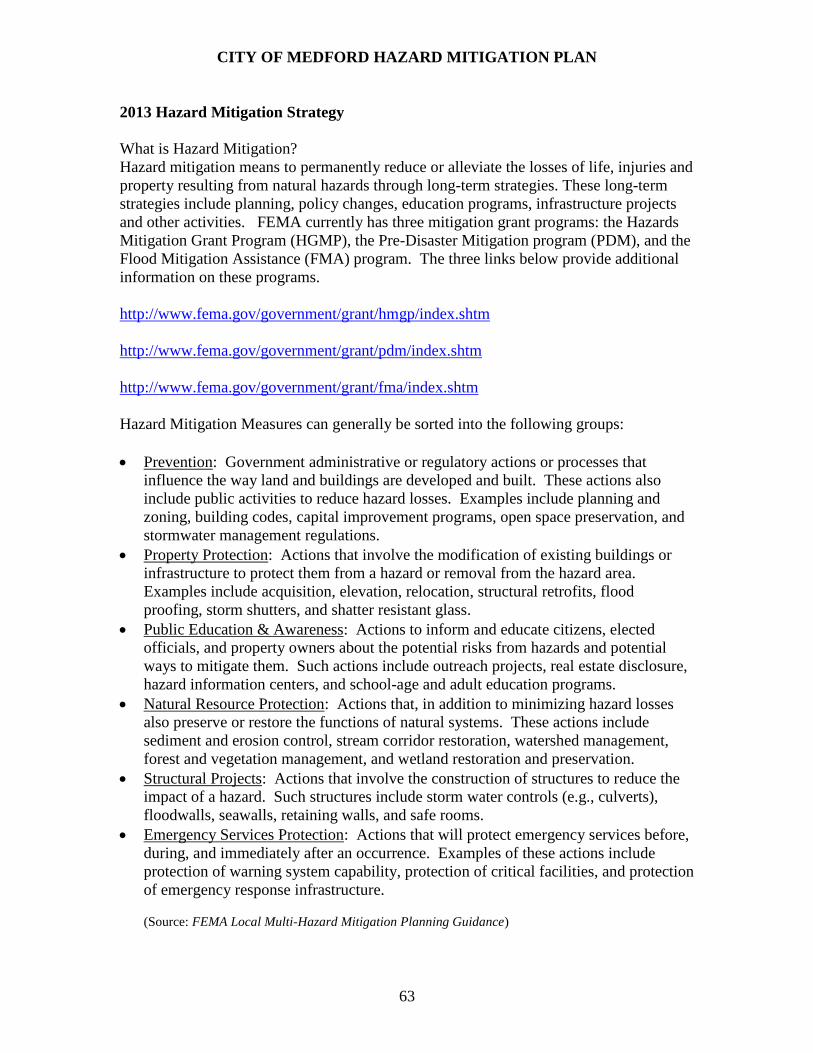
CITY OF MEDFORD HAZARD MITIGATION PLAN
63
2013 Hazard Mitigation Strategy
What is Hazard Mitigation?
Hazard mitigation means to permanently reduce or alleviate the losses of life, injuries and
property resulting from natural hazards through long-term strategies. These long-term
strategies include planning, policy changes, education programs, infrastructure projects
and other activities. FEMA currently has three mitigation grant programs: the Hazards
Mitigation Grant Program (HGMP), the Pre-Disaster Mitigation program (PDM), and the
Flood Mitigation Assistance (FMA) program. The three links below provide additional
information on these programs.
http://www.fema.gov/government/grant/hmgp/index.shtm
http://www.fema.gov/government/grant/pdm/index.shtm
http://www.fema.gov/government/grant/fma/index.shtm
Hazard Mitigation Measures can generally be sorted into the following groups:
Prevention: Government administrative or regulatory actions or processes that
influence the way land and buildings are developed and built. These actions also
include public activities to reduce hazard losses. Examples include planning and
zoning, building codes, capital improvement programs, open space preservation, and
stormwater management regulations.
Property Protection: Actions that involve the modification of existing buildings or
infrastructure to protect them from a hazard or removal from the hazard area.
Examples include acquisition, elevation, relocation, structural retrofits, flood
proofing, storm shutters, and shatter resistant glass.
Public Education & Awareness: Actions to inform and educate citizens, elected
officials, and property owners about the potential risks from hazards and potential
ways to mitigate them. Such actions include outreach projects, real estate disclosure,
hazard information centers, and school-age and adult education programs.
Natural Resource Protection: Actions that, in addition to minimizing hazard losses
also preserve or restore the functions of natural systems. These actions include
sediment and erosion control, stream corridor restoration, watershed management,
forest and vegetation management, and wetland restoration and preservation.
Structural Projects: Actions that involve the construction of structures to reduce the
impact of a hazard. Such structures include storm water controls (e.g., culverts),
floodwalls, seawalls, retaining walls, and safe rooms.
Emergency Services Protection: Actions that will protect emergency services before,
during, and immediately after an occurrence. Examples of these actions include
protection of warning system capability, protection of critical facilities, and protection
of emergency response infrastructure.
(Source: FEMA Local Multi-Hazard Mitigation Planning Guidance)
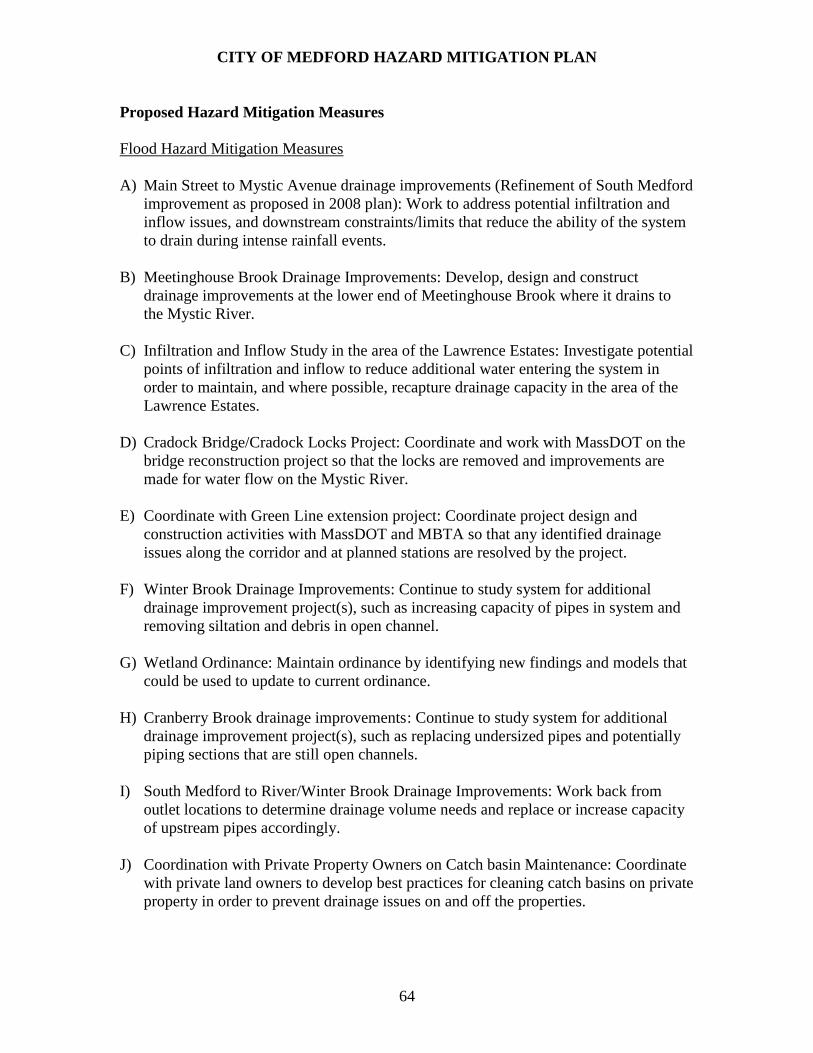
CITY OF MEDFORD HAZARD MITIGATION PLAN
64
Proposed Hazard Mitigation Measures
Flood Hazard Mitigation Measures
A) Main Street to Mystic Avenue drainage improvements (Refinement of South Medford
improvement as proposed in 2008 plan): Work to address potential infiltration and
inflow issues, and downstream constraints/limits that reduce the ability of the system
to drain during intense rainfall events.
B) Meetinghouse Brook Drainage Improvements: Develop, design and construct
drainage improvements at the lower end of Meetinghouse Brook where it drains to
the Mystic River.
C) Infiltration and Inflow Study in the area of the Lawrence Estates: Investigate potential
points of infiltration and inflow to reduce additional water entering the system in
order to maintain, and where possible, recapture drainage capacity in the area of the
Lawrence Estates.
D) Cradock Bridge/Cradock Locks Project: Coordinate and work with MassDOT on the
bridge reconstruction project so that the locks are removed and improvements are
made for water flow on the Mystic River.
E) Coordinate with Green Line extension project: Coordinate project design and
construction activities with MassDOT and MBTA so that any identified drainage
issues along the corridor and at planned stations are resolved by the project.
F) Winter Brook Drainage Improvements: Continue to study system for additional
drainage improvement project(s), such as increasing capacity of pipes in system and
removing siltation and debris in open channel.
G) Wetland Ordinance: Maintain ordinance by identifying new findings and models that
could be used to update to current ordinance.
H) Cranberry Brook drainage improvements : Continue to study system for additional
drainage improvement project(s), such as replacing undersized pipes and potentially
piping sections that are still open channels.
I) South Medford to River/Winter Brook Drainage Improvements: Work back from
outlet locations to determine drainage volume needs and replace or increase capacity
of upstream pipes accordingly.
J) Coordination with Private Property Owners on Catch basin Maintenance: Coordinate
with private land owners to develop best practices for cleaning catch basins on private
property in order to prevent drainage issues on and off the properties.

CITY OF MEDFORD HAZARD MITIGATION PLAN
65
K) Park Street drainage improvements: Continue to study system for additional drainage
improvement project(s), such as increasing capacity of drainage system in order to
handle additional runoff from increased development in area.
Measures to Ensure Compliance with NFIP
L) Floodplain Management: Continue to enforce the Floodplain Zoning District
(Section 470) and associated building regulations for floodplain areas. Update this
district to remain consistent with FEMA guidelines and floodplain mapping.
M) Floodplain Mapping: Maintain up to date maps of local FEMA identified
floodplains.
Wind Hazard Mitigation Measures
N) Tree Warden Coordination with Utility Companies: Have the Tree Warden coordinate
with utility companies on tree trimming to reduce potential for the downing of
overhead lines during storm events.
Winter Storm Hazard Mitigation Measures
O) Tree Warden Coordination with Utility Companies: Snow loading on trees has led to
falling branches and the downing of electrical and other overhead utility lines. The
Tree Warden should investigate where these impacts have occurred and coordinate
with utility companies on tree trimming to reduce potential for the downing of
overhead lines during storm events.
Geologic Hazard Mitigation Measures
P) Distribute Map of Areas Susceptible to Liquefaction to City Departments: The City
should provide a copy of the map of areas susceptible to liquefaction to all relevant
City departments to assist in planning and evaluating development proposals and for
disaster response.
Other Natural Hazards
Q) Reduce Phragmites in Wetlands: Restore wetlands, especially in the Mystic Valley
Parkway region, by removing phragmites and restoring native species to cut down on
fires and would help to beautify the wetlands.
R) Purchase Additional Equipment: Continue to identify and, as funding allows, acquire
new equipment for the Fire Department in order to responds to and address brush
fires.

CITY OF MEDFORD HAZARD MITIGATION PLAN
66
Prioritization of Mitigation Activities
The last step in developing the City’s mitigation strategy is to assign a level of priority to
each mitigation measure so as to guide the focus of the City’s limited resources towards
those actions with the greatest potential benefit. At this stage in the process, the Local
Hazard Mitigation Committee has limited access to detailed analyses of the cost and
benefits of any given measure, so prioritization is based on the committee member’s
knowledge of the existing and potential hazard impacts and an approximate sense of the
costs associated with pursuing any given measure.
Prioritization occurred through discussion at the third meeting of the local committee and
through subsequent review by committee members and public comment. Priority setting
was based on local knowledge of the hazard areas, including impacts of hazard events
and the extent of the area impacted and the relation of a given mitigation measure to the
City’s identified goals. In addition, through the discussion, the local committee also took
into consideration factors such as the number of homes and businesses affected, whether
or not road closures occurred and what impact closures had on delivery of emergency
services and the local economy, anticipated project costs, whether the City currently had
the technical and administrative capability to carry out the mitigation measures, whether
any environmental constraints existed, and whether the City would be able to justify the
costs relative to the anticipated benefits.
The table below demonstrates the prioritization. For each mitigation measure, the
geographic extent of the potential benefiting area is identified as is an estimate of the
overall benefit and cost of the measures. The benefits and costs were evaluated in terms
of:
Benefits
High Action will result in a significant reduction of hazard risk to people and/or
property from a hazard event
Medium Action will likely result in a moderate reduction of hazard risk to people
and/or property from a hazard event
Low Action will result in a low reduction of hazard risk to people and/or property
from a hazard event
Costs
High Estimated costs greater than $50,000
Medium Estimated costs between $10,000 to $50,000
Low Estimated costs less than $10,000 or staff time
With this assessment, an approximate timeframe has been identified in which the
municipality would attempt to achieve the mitigation measure.
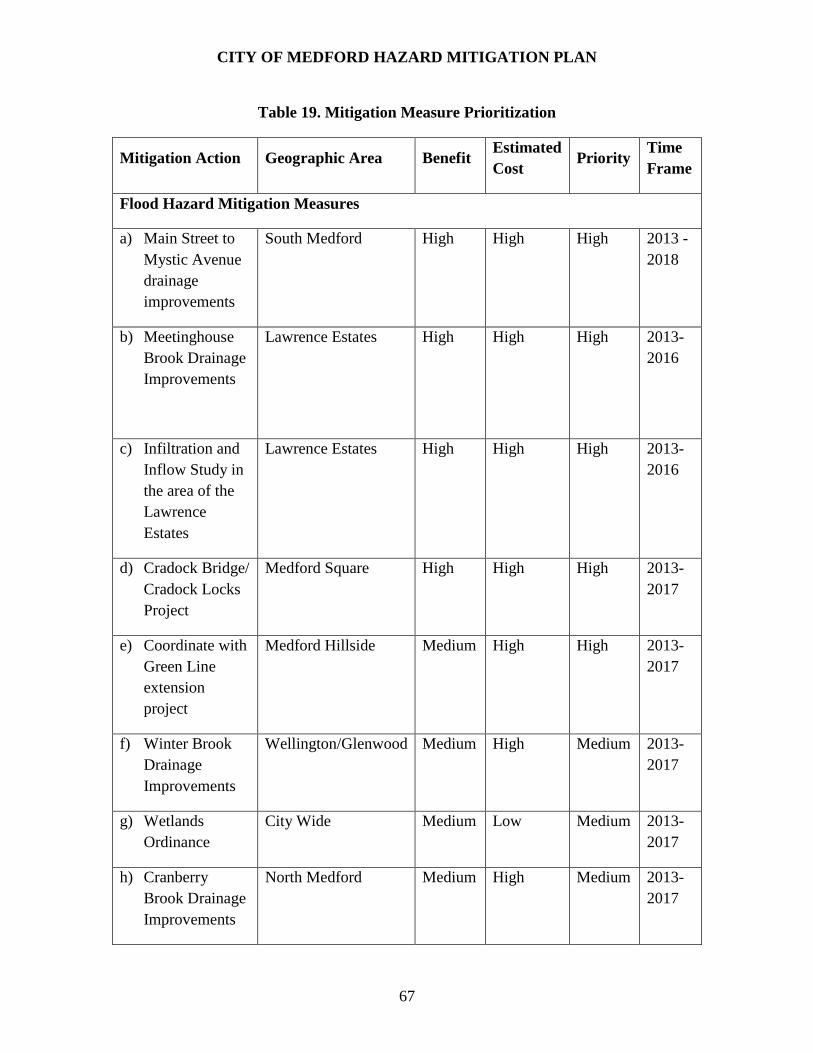
CITY OF MEDFORD HAZARD MITIGATION PLAN
67
Table 19. Mitigation Measure Prioritization
Mitigation Action Geographic Area Benefit Estimated
Cost Priority
Time
Frame
Flood Hazard Mitigation Measures
a) Main Street to
Mystic Avenue
drainage
improvements
South Medford High High High 2013 -
2018
b) Meetinghouse
Brook Drainage
Improvements
Lawrence Estates High High High 2013-
2016
c) Infiltration and
Inflow Study in
the area of the
Lawrence
Estates
Lawrence Estates High High High 2013-
2016
d) Cradock Bridge/
Cradock Locks
Project
Medford Square High High High 2013-
2017
e) Coordinate with
Green Line
extension
project
Medford Hillside Medium High High 2013-
2017
f) Winter Brook
Drainage
Improvements
Wellington/Glenwood Medium High Medium 2013-
2017
g) Wetlands
Ordinance
City Wide Medium Low Medium 2013-
2017
h) Cranberry
Brook Drainage
Improvements
North Medford Medium High Medium 2013-
2017

CITY OF MEDFORD HAZARD MITIGATION PLAN
68
Table 19. Mitigation Measure Prioritization
Mitigation Action Geographic Area Benefit Estimated
Cost Priority
Time
Frame
i) South Medford
to River/Winter
Brook Drainage
Improvements
South Medford Medium High Medium 2014-
2016
j) Coordination
with Private
Property
Owners on
Catch basin
Maintenance
City Wide Medium Low Low 2014-
2016
k) Park Street
drainage
improvements
Wellington/Glenwood Low High Low 2013-
2017
l) Floodplain
Management
Floodplains High Low Low 2013-
2017
m) Floodplain
Mapping
Floodplains High Low Low 2013-
2017
Wind Hazard Mitigation Measures
n) Tree Warden
Coordination
with Utility
Companies
City wide High Medium Medium 2013-
2017
Snow Hazard Mitigation Measures
o) Tree Warden
Coordination
with Utility
Companies
City wide High Medium Medium 2013-
2017
Geologic Hazard Mitigation Measures
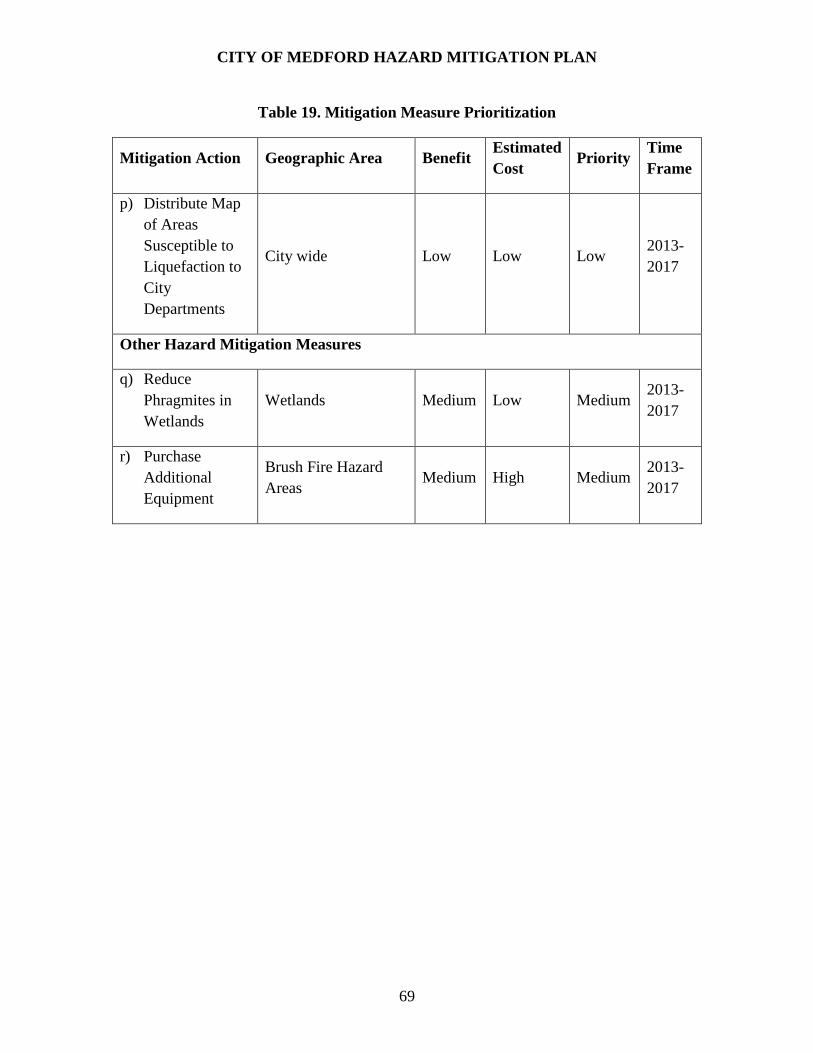
CITY OF MEDFORD HAZARD MITIGATION PLAN
69
Table 19. Mitigation Measure Prioritization
Mitigation Action Geographic Area Benefit Estimated
Cost Priority
Time
Frame
p) Distribute Map
of Areas
Susceptible to
Liquefaction to
City
Departments
City wide Low Low Low 2013-
2017
Other Hazard Mitigation Measures
q) Reduce
Phragmites in
Wetlands
Wetlands Medium Low Medium 2013-
2017
r) Purchase
Additional
Equipment
Brush Fire Hazard
Areas Medium High Medium
2013-
2017
CITY OF MEDFORD HAZARD MITIGATION PLAN
70
Introduction to Potential Mitigation Measures (Table 20)
Description of the Mitigation Measure – The description of each mitigation measure is
brief and cost information is given only if cost data were already available from the
community. The cost data represent a point in time and would need to be adjusted for
inflation and for any changes or refinements in the design of a particular mitigation
measure.
Priority – The designation of high, medium, or low priority was done at the meeting of
the Local Multiple Hazard Community Planning Team meeting. The designations reflect
discussion and a general consensus developed at the meeting but could change as
conditions in the community change. In determining project priorities, the local team
considered potential benefits and project costs.
Implementation Responsibility – The designation of implementation responsibility was
done by MAPC based on a general knowledge of what each municipal department is
responsible for. It is likely that most mitigation measures will require that several
departments work together and assigning staff is the sole responsibility of the governing
body of each community.
Time Frame – The time frame was based on a combination of the priority for that
measure, the complexity of the measure and whether or not the measure is conceptual, in
design, or already designed and awaiting funding. Because the time frame for this plan is
five years, the timing for all mitigation measures has been kept within this framework.
The identification of a likely time frame is not meant to constrain a community from
taking advantage of funding opportunities as they arise.
Potential Funding Sources – This column attempts to identify the most likely sources of
funding for a specific measure. The information on potential funding sources in this table
is preliminary and varies depending on a number of factors. These factors include
whether or not a mitigation measure has been studied, evaluated or designed, or if it is
still in the conceptual stages. MEMA and DCR assisted MAPC in reviewing the
potential eligibility for hazard mitigation funding. Each grant program and agency has
specific eligibility requirements that would need to be taken into consideration. In most
instances, the measure will require a number of different funding sources. Identification
of a potential funding source in this table does not guarantee that a project will be eligible
for, or selected for funding. Upon adoption of this plan, the local committee responsible
for its implementation should begin to explore the funding sources in more detail.
Additional information on funding sources – The best way to determine eligibility for a
particular funding source is to review the project with a staff person at the funding
agency. The following websites provide an overview of programs and funding sources.
Army Corps of Engineers (ACOE) – The website for the North Atlantic district
office is http://www.nae.usace.army.mil/. The ACOE provides assistance in a

CITY OF MEDFORD HAZARD MITIGATION PLAN
71
number of types of projects including shoreline/streambank protection, flood
damage reduction, flood plain management services and planning services.
Massachusetts Emergency Management Agency (MEMA) – The grants page
http://www.mass.gov/dem/programs/mitigate/grants.htm has a useful table that
compares eligible projects for the Hazard Mitigation Grant Program and the Flood
Mitigation Assistance Program.
United States Department of Agriculture – The USDA has programs by which
communities can get grants for firefighting needs. See the link below for some
example. http://www.rurdev.usda.gov/rd/newsroom/2002/cfg.html
Abbreviations Used in Table 17
FEMA Mitigation Grants includes:
FMA = Flood Mitigation Assistance Program.
HMGP = Hazard Mitigation Grant Program.
PDM = Pre-Disaster Mitigation Program
ACOE = Army Corps of Engineers.
DHS/EOPS = Department of Homeland Security/Emergency Operations
EPA/DEP (SRF) = Environmental Protection Agency/Department of Environmental
Protection (State Revolving Fund)
USDA = United States Department of Agriculture
Mass DOT = Massachusetts Department of Transportation
MBTA = Massachusetts Bay Transportation Authority
DCR = MA Department of Conservation and Recreation
DHCD = MA Department of Housing and Community Development
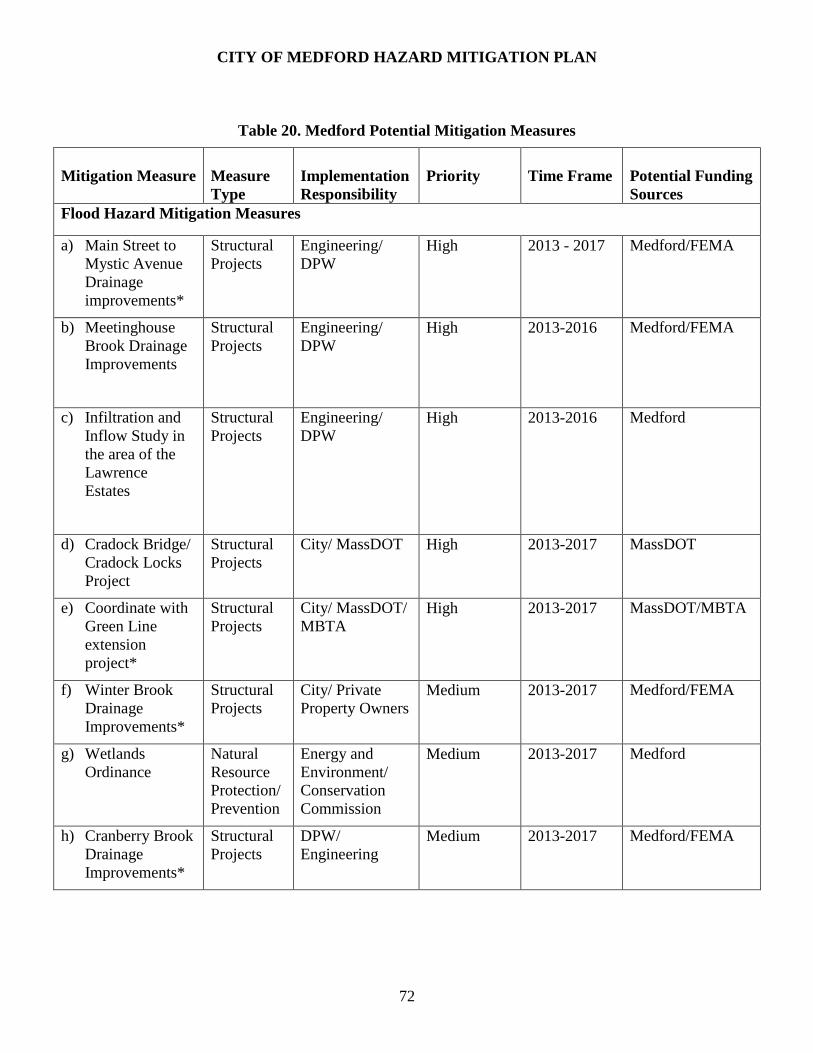
CITY OF MEDFORD HAZARD MITIGATION PLAN
72
Table 20. Medford Potential Mitigation Measures
Mitigation Measure
Measure
Type
Implementation
Responsibility
Priority
Time Frame
Potential Funding
Sources
Flood Hazard Mitigation Measures
a) Main Street to
Mystic Avenue
Drainage
improvements*
Structural
Projects
Engineering/
DPW
High 2013 - 2017 Medford/FEMA
b) Meetinghouse
Brook Drainage
Improvements
Structural
Projects
Engineering/
DPW
High 2013-2016 Medford/FEMA
c) Infiltration and
Inflow Study in
the area of the
Lawrence
Estates
Structural
Projects
Engineering/
DPW
High 2013-2016 Medford
d) Cradock Bridge/
Cradock Locks
Project
Structural
Projects
City/ MassDOT High 2013-2017 MassDOT
e) Coordinate with
Green Line
extension
project*
Structural
Projects
City/ MassDOT/
MBTA
High 2013-2017 MassDOT/MBTA
f) Winter Brook
Drainage
Improvements*
Structural
Projects
City/ Private
Property Owners
Medium 2013-2017 Medford/FEMA
g) Wetlands
Ordinance
Natural
Resource
Protection/
Prevention
Energy and
Environment/
Conservation
Commission
Medium 2013-2017 Medford
h) Cranberry Brook
Drainage
Improvements*
Structural
Projects
DPW/
Engineering
Medium 2013-2017 Medford/FEMA
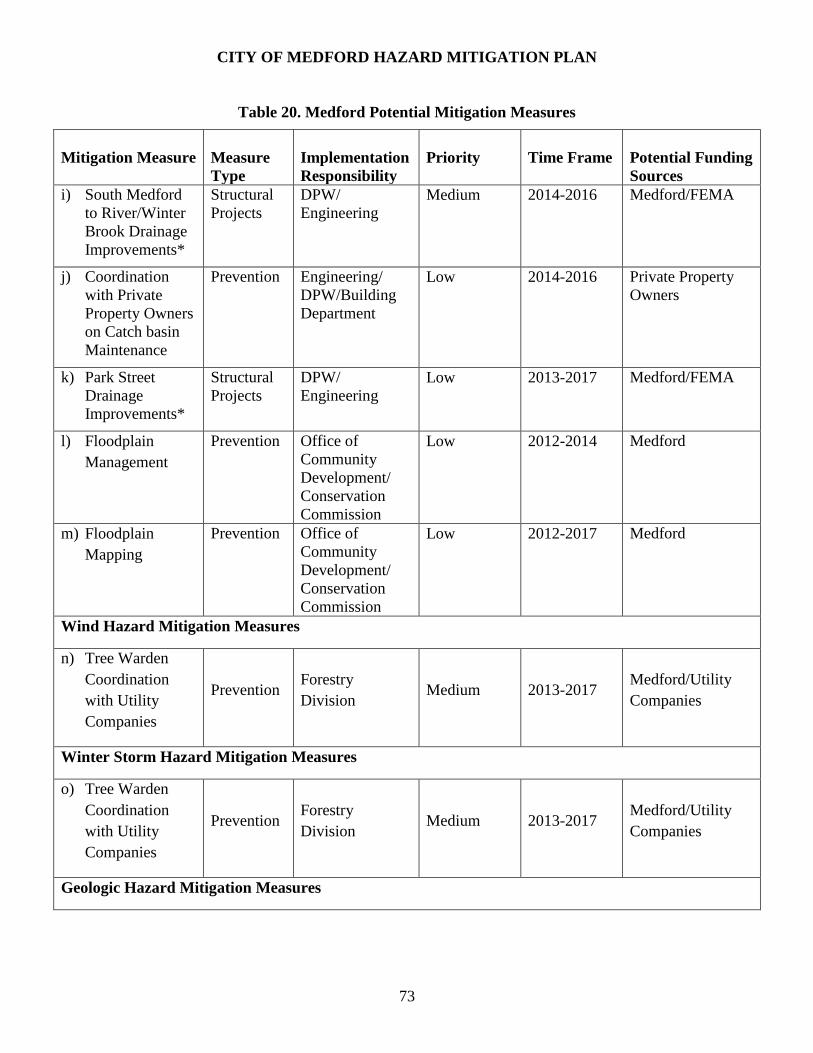
CITY OF MEDFORD HAZARD MITIGATION PLAN
73
Table 20. Medford Potential Mitigation Measures
Mitigation Measure
Measure
Type
Implementation
Responsibility
Priority
Time Frame
Potential Funding
Sources
i) South Medford
to River/Winter
Brook Drainage
Improvements*
Structural
Projects
DPW/
Engineering
Medium 2014-2016 Medford/FEMA
j) Coordination
with Private
Property Owners
on Catch basin
Maintenance
Prevention Engineering/
DPW/Building
Department
Low 2014-2016 Private Property
Owners
k) Park Street
Drainage
Improvements*
Structural
Projects
DPW/
Engineering
Low 2013-2017 Medford/FEMA
l) Floodplain
Management
Prevention Office of
Community
Development/
Conservation
Commission
Low 2012-2014 Medford
m) Floodplain
Mapping
Prevention Office of
Community
Development/
Conservation
Commission
Low 2012-2017 Medford
Wind Hazard Mitigation Measures
n) Tree Warden
Coordination
with Utility
Companies
Prevention Forestry
Division Medium 2013-2017
Medford/Utility
Companies
Winter Storm Hazard Mitigation Measures
o) Tree Warden
Coordination
with Utility
Companies
Prevention Forestry
Division Medium 2013-2017
Medford/Utility
Companies
Geologic Hazard Mitigation Measures
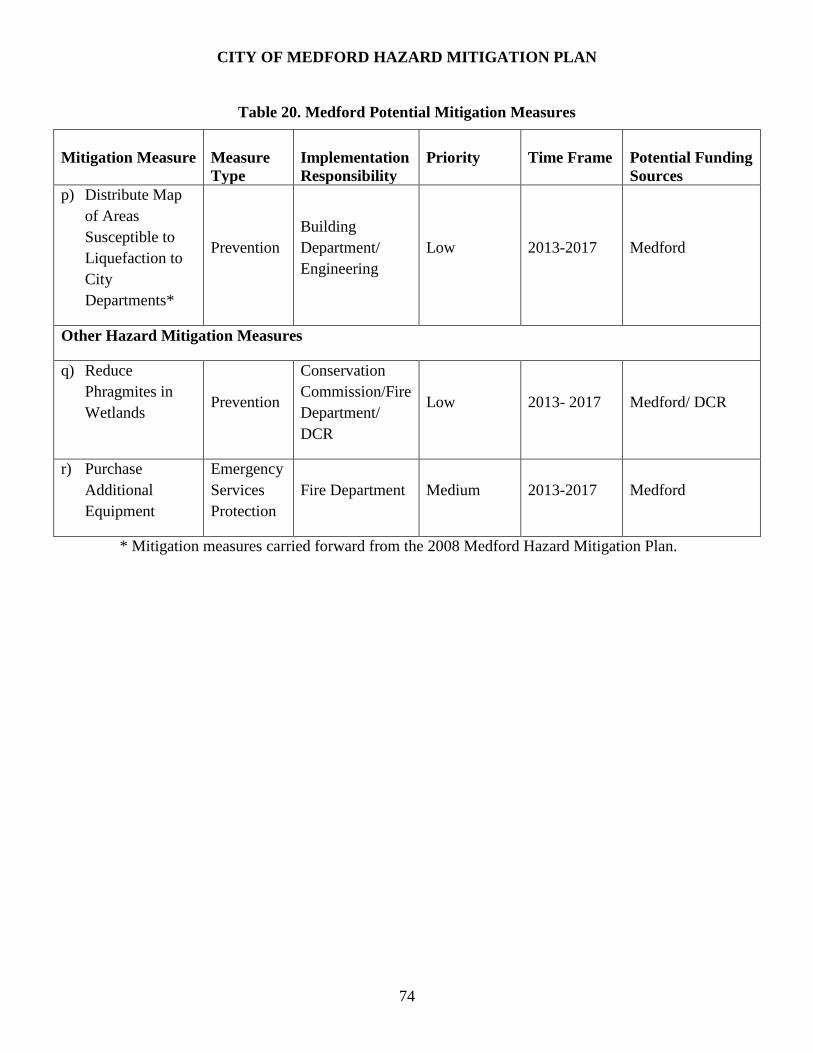
CITY OF MEDFORD HAZARD MITIGATION PLAN
74
Table 20. Medford Potential Mitigation Measures
Mitigation Measure
Measure
Type
Implementation
Responsibility
Priority
Time Frame
Potential Funding
Sources
p) Distribute Map
of Areas
Susceptible to
Liquefaction to
City
Departments*
Prevention
Building
Department/
Engineering
Low 2013-2017 Medford
Other Hazard Mitigation Measures
q) Reduce
Phragmites in
Wetlands Prevention
Conservation
Commission/Fire
Department/
DCR
Low 2013- 2017 Medford/ DCR
r) Purchase
Additional
Equipment
Emergency
Services
Protection
Fire Department Medium 2013-2017 Medford
* Mitigation measures carried forward from the 2008 Medford Hazard Mitigation Plan.

CITY OF MEDFORD HAZARD MITIGATION PLAN
75
Regional and Inter-Community Considerations
Regional Issues
Some hazard mitigation issues are strictly local. The problem originates primarily within
the municipality and can be solved at the municipal level (e.g., capacity issues in local
drainage system). Other issues are inter-community issues that involve cooperation
between two or more municipalities (e.g., downstream issues related to upstream flooding
on the Mystic River). There is a third level of mitigation which is regional; involving a
state, regional or federal agency or an issue that involves three or more municipalities
(e.g., any potential issues related to the Amelia Earhart Dam, which is owned by the
DCR).
Regional Partners and Hazard Mitigation Coordination
In the densely developed communities of the study area, mitigating natural hazards,
particularly flooding, is more than a local issue. The drainage systems that serve these
communities are a complex system of storm drains, tide gates, roadway drainage
structures, pump stations and other facilities owned and operated by a wide array of
agencies including but not limited to the City of Medford, the Department of
Conservation and Recreation (DCR), the Massachusetts Water Resources Authority
(MWRA), Massachusetts Department of Transportation (MassDOT) and the
Massachusetts Bay Transportation Authority (MBTA).
The planning, construction, operations and maintenance of these structures are integral to
the flood hazard mitigation efforts of communities. These agencies must be considered
the communities regional partners in hazard mitigation. These agencies also operate
under the same constraints as communities do including budgetary and staffing
constraints and numerous competing priorities. The following is a list of
recommendations from the 2008 plan that had planned to be undertaken in coordination
with or by regional agencies.
Cradock Bridge - The City of Medford identified the rehabilitation of the Cradock
Bridge, which is on a state roadway facility, as a high priority regional issue and the
bridge is now under redesign and planning for reconstruction over the next couple of
years.
Green Line Extension – The City of Medford believes that the MBTA Green Line
extension need continued studies so that it does not negatively impact drainage in
Medford. Drainage issues are now being considered as part of the Green Line extension
design and construction project. The project currently extends as far as the planned
College Avenue station, and may be extended to Mystic Valley Parkway in the future.
Maintenance of Land along the Mystic River – The City is still interested in the
possibility of taking ownership of the land owned by DCR along the Mystic River so that
CITY OF MEDFORD HAZARD MITIGATION PLAN
76
the City has control over maintenance of the land. To support this desire, the City and
DCR should begin to work together to ensure better maintenance of the open space along
the river.
Somerville Combined Sewer Overflows – The combined sewer overflows in Somerville
affect flooding in South Medford. The City and Somerville should coordinate around
drainage improvements project (e.g., CSO separation) to reduce flooding issues and
improve drainage infrastructure across the municipal borders.
Meetinghouse Brook – Although there are local issues that affect flooding from
Meetinghouse Brook, there has been past flooding along the waterway when Winchester
opened up a dam on the reservoir. The City will continue to reach out to Winchester in an
effort to coordinate and reduce the potential for flooding from releases for the reservoir.
River’s Edge Development – This development parcel is located in Medford, Malden and
Everett. It is important that all three communities continue to work together to
implement the master plan for this site and take steps to prevent impacts to the site from
natural hazards.
Flooding on the Aberjona River – The City of Medford continues to raise the issue of the
importance of undertaking flood mitigation measures on a watershed-wide basis.
Climate Change
The entirety of Massachusetts, and in particular the Commonwealth’s coastal cities and
towns, faces potential risk from Climate Change. Many of the natural hazards that cities
like Medford have historically experienced are likely to be exacerbated by climate change
in future years. This is particularly true for flooding caused by extreme precipitation,
flooding, and extreme heat. For example, according to the 2012 report When It Rains It
Pours – Global Warming and the Increase in Extreme Precipitation from 1948 to 2011,
intense rainstorms and snowstorms have become more frequent and more severe over the
last half century in the northeastern United States. Extreme downpours are now
happening 30 percent more often nationwide than in 1948. In other words, large rain or
snow storms that happened once every 12 months, on average, in the middle of the 20th
century, now happen every nine months.
Attempts to mitigate climate change or adapt to its potential impacts are largely outside
the scope of this Hazard Mitigation Plan, which relies primarily on historic trends to
assess risk and vulnerability. The potential changes to the State’s storm damage profile
caused by Climate Change will be well outside of historic trends, making those trends
uncertain predictors of future risk and vulnerability at best. Cities, towns, Regional
Planning Agencies and other regional and state agencies will need to advocate for a
statewide response that includes using the best available information to map and model
climate change data related to natural hazards and disseminate this information for use in
hazard mitigation planning and land use policy development.

CITY OF MEDFORD HAZARD MITIGATION PLAN
77
Lastly, in addition to understanding how the physical infrastructure will be impacted, it is
important to identify how vulnerable populations may suffer greater impacts under future
Climate Change scenarios. These populations could include the elderly, the very young,
low-income groups, immigrants and the homeless, among others, and could
disproportionately suffer the effects of extreme events, like flooding and heat waves, be
least-equipped to adapt. Efforts should be undertaken to identify the locations of possible
vulnerable populations. This could include coordination with updates to the City’s
demographic data (e.g., Census data for where those 65 and over, low-income and/or are
linguistically isolated are located) and collaboration with other boards that serve
communities that include Commission for Persons with Disabilities, the Council on
Aging and the Human Rights Commission.
After identifying these locations, strategies should be developed and implemented to
educate, engage and include these populations in hazard and emergency response
planning efforts.

CITY OF MEDFORD HAZARD MITIGATION PLAN
78
[This page intentionally left blank]

CITY OF MEDFORD HAZARD MITIGATION PLAN
79
VII. PLAN ADOPTION AND MAINTENANCE
Plan Adoption
The Medford Hazard Mitigation Plan was adopted by the City Council on [ADD DATE].
See Appendix D for documentation. The plan was approved by FEMA on [ADD DATE]
for a five-year period that will expire on [ADD DATE].
Plan Maintenance
MAPC worked with the Medford Hazard Mitigation Planning Team to prepare this plan.
This group will continue to meet on an as-needed basis to function as the Local Hazard
Mitigation Implementation Group, with one City official designated as the coordinator.
Additional members could be added to the local implementation group from businesses,
non-profits and institutions.
Implementation Schedule
Bi-Annual Survey on Progress– The coordinator of the Hazard Mitigation
Implementation Team will prepare and distribute a biannual survey in years two and four
of the plan. The survey will be distributed to all of the local implementation group
members and other interested local stakeholders. The survey will poll the members on
any changes or revisions to the plan that may be needed, progress and accomplishments
for implementation, and any new hazards or problem areas that have been identified.
This information will be used to prepare a report or addendum to the local hazard
mitigation plan. The Hazard Mitigation Implementation Team will have primary
responsibility for tracking progress and updating the plan.
Develop a Year Four Update – During the fourth year after initial plan adoption, the
coordinator of the Hazard Mitigation Implementation Team will convene the team to
begin to prepare for an update of the plan, which will be required by the end of year five
in order to maintain approved plan status with FEMA. The team will use the information
from the year four biannual review to identify the needs and priorities for the plan update.
Prepare and Adopt an Updated Local Hazard Mitigation Plan – FEMA’s approval of this
plan is valid for five years, by which time an updated plan must be approved by FEMA in
order to maintain the City’s approved plan status and its eligibility for FEMA mitigation
grants. Because of the time required to secure a planning grant, prepare an updated plan,
and complete the approval and adoption of an updated plan, the local Hazard Mitigation
Planning Team should begin the process by the end of Year 3. This will help the City
avoid a lapse in its approved plan status and grant eligibility when the current plan
expires.
At this point, the Hazard Mitigation Implementation Team may decide to undertake the
update themselves, contract with the Metropolitan Area Planning Council to update the
plan or to hire another consultant. However the Hazard Mitigation Implementation Team

CITY OF MEDFORD HAZARD MITIGATION PLAN
80
decides to update the plan, the group will need to review the current FEMA hazard
mitigation plan guidelines for any changes. The update of the Medford Hazard
Mitigation Plan will be forwarded to MEMA and DCR for review and to FEMA for
approval.
Integration of the Plans with Other Planning Initiatives
Upon approval of the Medford Hazard Mitigation Plan by FEMA, the coordinator of the
Hazard Mitigation Implementation Team with support from other members of the team
will provide all interested parties and implementing departments with a copy of the plan
and will initiate a discussion regarding how the plan can be integrated into that
department’s ongoing work.
At a minimum, the plan will be reviewed and discussed with the following departments
during the first six (6) months following plan adoption:
Fire
Civil Defense/ Emergency Management
Police
Public Works
Engineering
Planning and Community Development
Energy and Environment
Forestry
Health
Building
Other groups that will be coordinated with include large institutions, Chambers of
Commerce, land conservation organizations and watershed groups. The plans will also
be posted on a community’s website with the caveat that local team coordinator will
review the plan for sensitive information that would be inappropriate for public posting.
The posting of the plan on a web site will include a mechanism for citizen feedback such
as an e-mail address to send comments.

CITY OF MEDFORD HAZARD MITIGATION PLAN
81
VIII. LIST OF REFERENCES
In addition to the specific reports listed below, much of the technical information for this
plan came from meetings with City department heads and staff.
City of Medford Zoning Ordinance.
City of Medford Open Space and Recreation Plan Update, 2011
City of Medford CPMP Annual Action Plan, 2012.
City of Medford Community Development Plan, 2004.
Medford Square Master Plan, 2005.
Metro-Boston Multi-Hazard Mitigation Plan, Medford Annex, 2008.
Metropolitan Area Planning Council, Geographic Information Systems data.
Metropolitan Area Planning Council, Regional Plans and Data.
Commonwealth of Massachusetts State Hazard Mitigation Plan, 2010.
FEMA, Local Multi-Hazard Mitigation Planning Guidance, 2008.
FEMA, Flood Insurance Rate Maps for Medford, MA, 2010.
New England Seismic Network, Boston College Weston Observatory, website:
http://aki.bc.edu/index.htm
Northeast States Emergency Consortium, website: http://www.nesec.org/
CITY OF MEDFORD HAZARD MITIGATION PLAN
82
[This page intentionally left blank]
CITY OF MEDFORD HAZARD MITIGATION PLAN
83
APPENDIX A
MEETING AGENDAS
CITY OF MEDFORD HAZARD MITIGATION PLAN
84
[This page intentionally left blank]
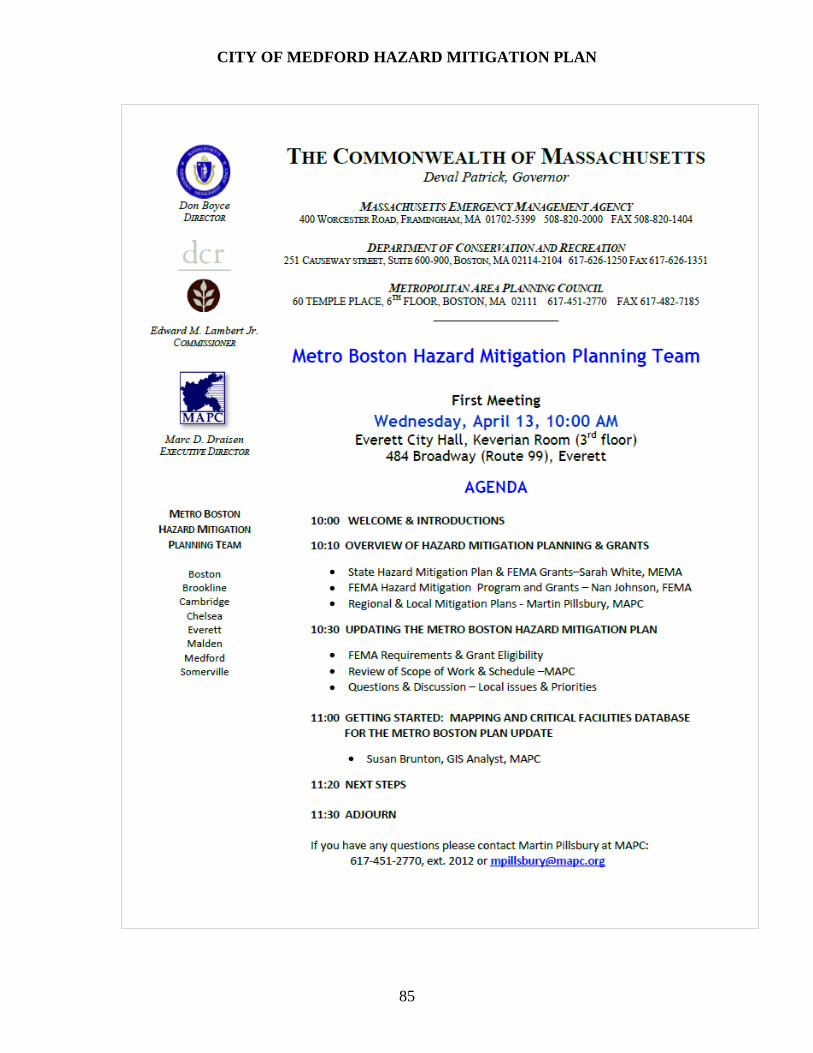
CITY OF MEDFORD HAZARD MITIGATION PLAN
85

CITY OF MEDFORD HAZARD MITIGATION PLAN
86
Meeting Agenda
Local Multiple Hazard Community Planning Team
City of Medford
March 27, 2013
1) Overview of Project Scope and Status
2) Introduce City of Medford Hazard Mitigation Planning Map Series and
Digitized Ortho Photo Map.
3) Identify:
a) Flood Hazard Areas (incl. areas with concentration of repetitive loss properties)
b) Fire Hazard Areas (incl. approximate number of annual wildfires and recent
incidences that resulted in property damage)
c) Future Potential Development Areas
d) Historical, Cultural or Natural Resource Areas
e) Dams (incl. type and ownership)
4) Review and Assess Plan Goals (see over)
5) Discuss Public Involvement and Outreach (see over)
6) Set Date for First Public Meeting and Discuss Public Outreach
7) Set Tentative Date Second Staff Meeting to:
a) Review Existing Mitigation Measures
b) Review Mitigation Measures from the 2008 Plan
c) Discuss Potential Mitigation Measures
d) Prioritize Mitigation Measures
Project Overview - MAPC received a grant to prepare natural hazards Pre-Disaster Mitigation Plan for
the communities of Boston, Brookline, Cambridge, Chelsea, Everett, Malden, Medford and Somerville.
MAPC is working with the eight communities to update their plans to mitigate potential damages of
natural hazards such as floods, winter storms, hurricanes, earthquakes and wild fires, before such
hazards occur. The federal Disaster Mitigation Act of 2000 requires that all municipalities adopt a
Pre-Disaster Mitigation Plan for natural hazards in order to remain eligible for FEMA Disaster
Mitigation Grants.
This FEMA planning program is separate from new or ongoing homeland security initiatives, and is
focused solely on addressing natural hazards, although some of the data collected for this plan may
be useful for other aspects of emergency planning as well.
CITY OF MEDFORD HAZARD MITIGATION PLAN
87
Public Participation
1. MAPC presents at 2 public meeting
2. Coordinate public outreach and information for meetings
3. Post on City website with a set public review period
4. Distribute to specified organizations or boards/commissions for their review
5. Distribute announcement to adjacent municipalities about Draft Plan Update
6. Other opportunities for local involvement and participation in process
2008 Plan - Goals
1. Prevent and reduce the loss of life, injury and property damages
resulting from all major natural hazards.
2. Identify and seek funding for measures to mitigate or eliminate each
known significant flood hazard area
3. Integrate hazard mitigation planning as an integral factor in all
relevant municipal departments, committees and boards.
4. Prevent and reduce the damage to public infrastructure resulting from
all hazards.
5. Encourage the business community, major institutions and non-profits
to work with the City to develop, review and implement the hazard
mitigation plan.
6. Work with surrounding communities, state, regional and federal
agencies to ensure regional cooperation and solutions for hazards
affecting multiple communities.
7. Ensure that future development meets all applicable standards for
preventing and reducing the impacts of natural hazards.
8. Take maximum advantage of resources from FEMA, MEMA and other
agencies to educate City staff and the public about hazard mitigation.
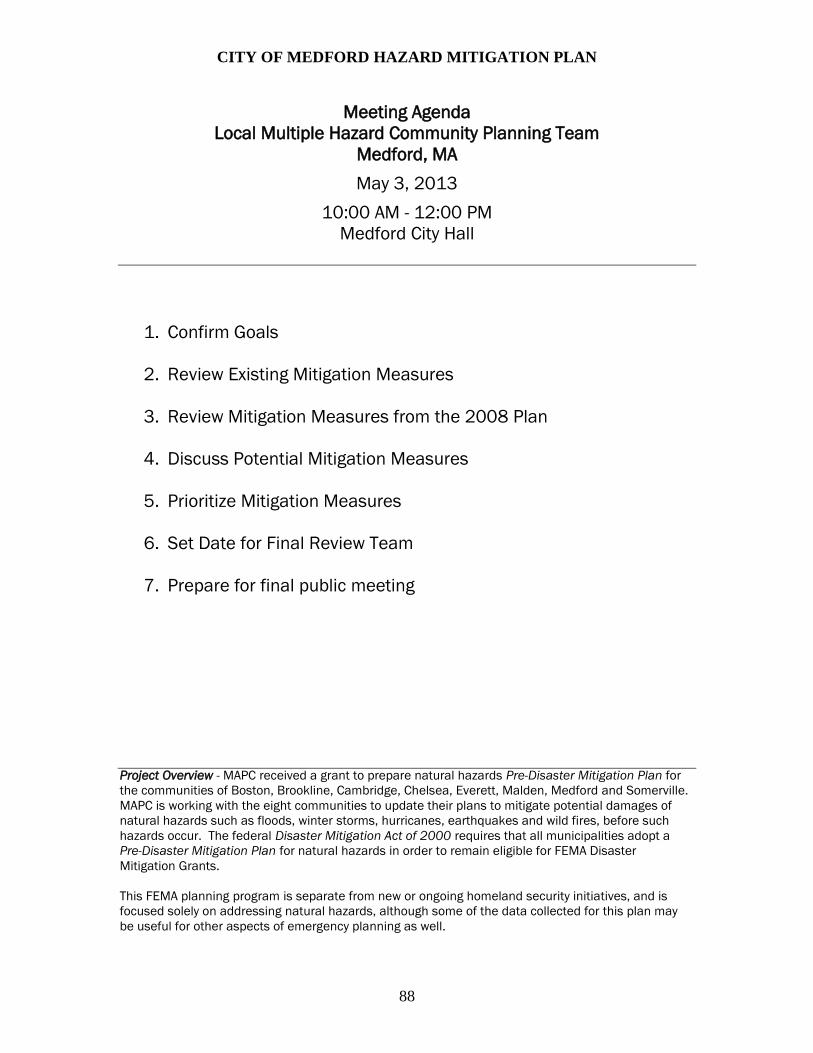
CITY OF MEDFORD HAZARD MITIGATION PLAN
88
Meeting Agenda
Local Multiple Hazard Community Planning Team
Medford, MA
May 3, 2013
10:00 AM - 12:00 PM
Medford City Hall
1. Confirm Goals
2. Review Existing Mitigation Measures
3. Review Mitigation Measures from the 2008 Plan
4. Discuss Potential Mitigation Measures
5. Prioritize Mitigation Measures
6. Set Date for Final Review Team
7. Prepare for final public meeting
Project Overview - MAPC received a grant to prepare natural hazards Pre-Disaster Mitigation Plan for
the communities of Boston, Brookline, Cambridge, Chelsea, Everett, Malden, Medford and Somerville.
MAPC is working with the eight communities to update their plans to mitigate potential damages of
natural hazards such as floods, winter storms, hurricanes, earthquakes and wild fires, before such
hazards occur. The federal Disaster Mitigation Act of 2000 requires that all municipalities adopt a
Pre-Disaster Mitigation Plan for natural hazards in order to remain eligible for FEMA Disaster
Mitigation Grants.
This FEMA planning program is separate from new or ongoing homeland security initiatives, and is
focused solely on addressing natural hazards, although some of the data collected for this plan may
be useful for other aspects of emergency planning as well.

CITY OF MEDFORD HAZARD MITIGATION PLAN
89
[This page intentionally left blank]
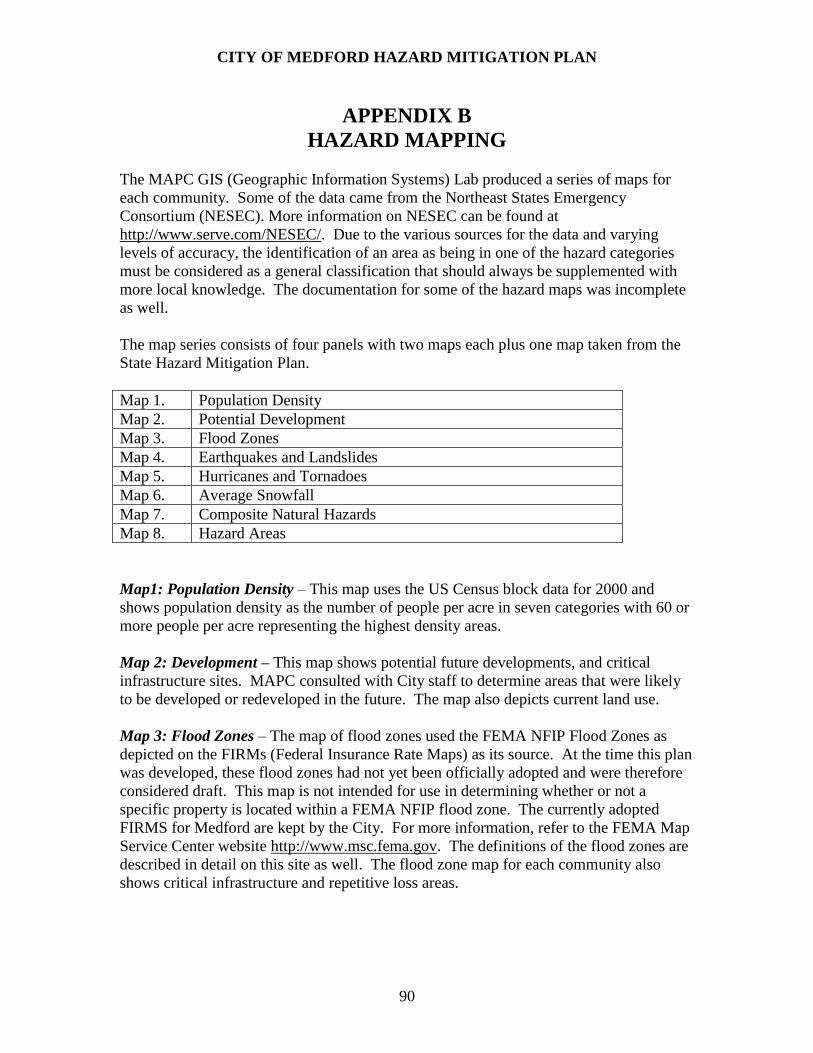
CITY OF MEDFORD HAZARD MITIGATION PLAN
90
APPENDIX B
HAZARD MAPPING
The MAPC GIS (Geographic Information Systems) Lab produced a series of maps for
each community. Some of the data came from the Northeast States Emergency
Consortium (NESEC). More information on NESEC can be found at
http://www.serve.com/NESEC/. Due to the various sources for the data and varying
levels of accuracy, the identification of an area as being in one of the hazard categories
must be considered as a general classification that should always be supplemented with
more local knowledge. The documentation for some of the hazard maps was incomplete
as well.
The map series consists of four panels with two maps each plus one map taken from the
State Hazard Mitigation Plan.
Map 1. Population Density
Map 2. Potential Development
Map 3. Flood Zones
Map 4. Earthquakes and Landslides
Map 5. Hurricanes and Tornadoes
Map 6. Average Snowfall
Map 7. Composite Natural Hazards
Map 8. Hazard Areas
Map1: Population Density – This map uses the US Census block data for 2000 and
shows population density as the number of people per acre in seven categories with 60 or
more people per acre representing the highest density areas.
Map 2: Development – This map shows potential future developments, and critical
infrastructure sites. MAPC consulted with City staff to determine areas that were likely
to be developed or redeveloped in the future. The map also depicts current land use.
Map 3: Flood Zones – The map of flood zones used the FEMA NFIP Flood Zones as
depicted on the FIRMs (Federal Insurance Rate Maps) as its source. At the time this plan
was developed, these flood zones had not yet been officially adopted and were therefore
considered draft. This map is not intended for use in determining whether or not a
specific property is located within a FEMA NFIP flood zone. The currently adopted
FIRMS for Medford are kept by the City. For more information, refer to the FEMA Map
Service Center website http://www.msc.fema.gov. The definitions of the flood zones are
described in detail on this site as well. The flood zone map for each community also
shows critical infrastructure and repetitive loss areas.

CITY OF MEDFORD HAZARD MITIGATION PLAN
91
Map 4: Earthquakes and Landslides – This information came from NESEC. For most
communities, there was no data for earthquakes because only the epicenters of an
earthquake are mapped.
The landslide information shows areas with either a low susceptibility or a moderate
susceptibility to landslides based on mapping of geological formations. This mapping is
highly general in nature. For more information on how landslide susceptibility was
mapped, refer to http://pubs.usgs.gov/pp/p1183/pp1183.html.
Map 5: Hurricanes and Tornadoes – This map shows a number of different items. The
map includes the storm tracks for both hurricanes and tropical storms. This information
must be viewed in context. A storm track only shows where the eye of the storm passed
through. In most cases, the effects of the wind and rain from these storms were felt in
other communities even if the track was not within that community. This map also shows
the location of tornadoes with a classification as to the level of damages. What appears
on the map varies by community since not all communities experience the same wind-
related events. These maps also show the 100 year wind speed.
Map 6: Average Snowfall - - This map shows the average snowfall and open space. It
also shows storm tracks for nor’easters, if any storms tracked through the community.
Map 7: Composite Natural Hazards - This map shows four categories of composite
natural hazards for areas of existing development. The hazards included in this map are
100 year wind speeds of 110 mph or higher, low and moderate landslide risk, FEMA Q3
flood zones (100 year and 500 year) and hurricane surge inundation areas. Areas with
only one hazard were considered to be low hazard areas. Moderate areas have two of the
hazards present. High hazard areas have three hazards present and severe hazard areas
have four hazards present.
Map 8: Hazard Areas – For each community, locally identified hazard areas are overlaid
on an aerial photograph. The critical infrastructure sites are also shown. The source of
the aerial photograph is Mass GIS.

CITY OF MEDFORD HAZARD MITIGATION PLAN
92
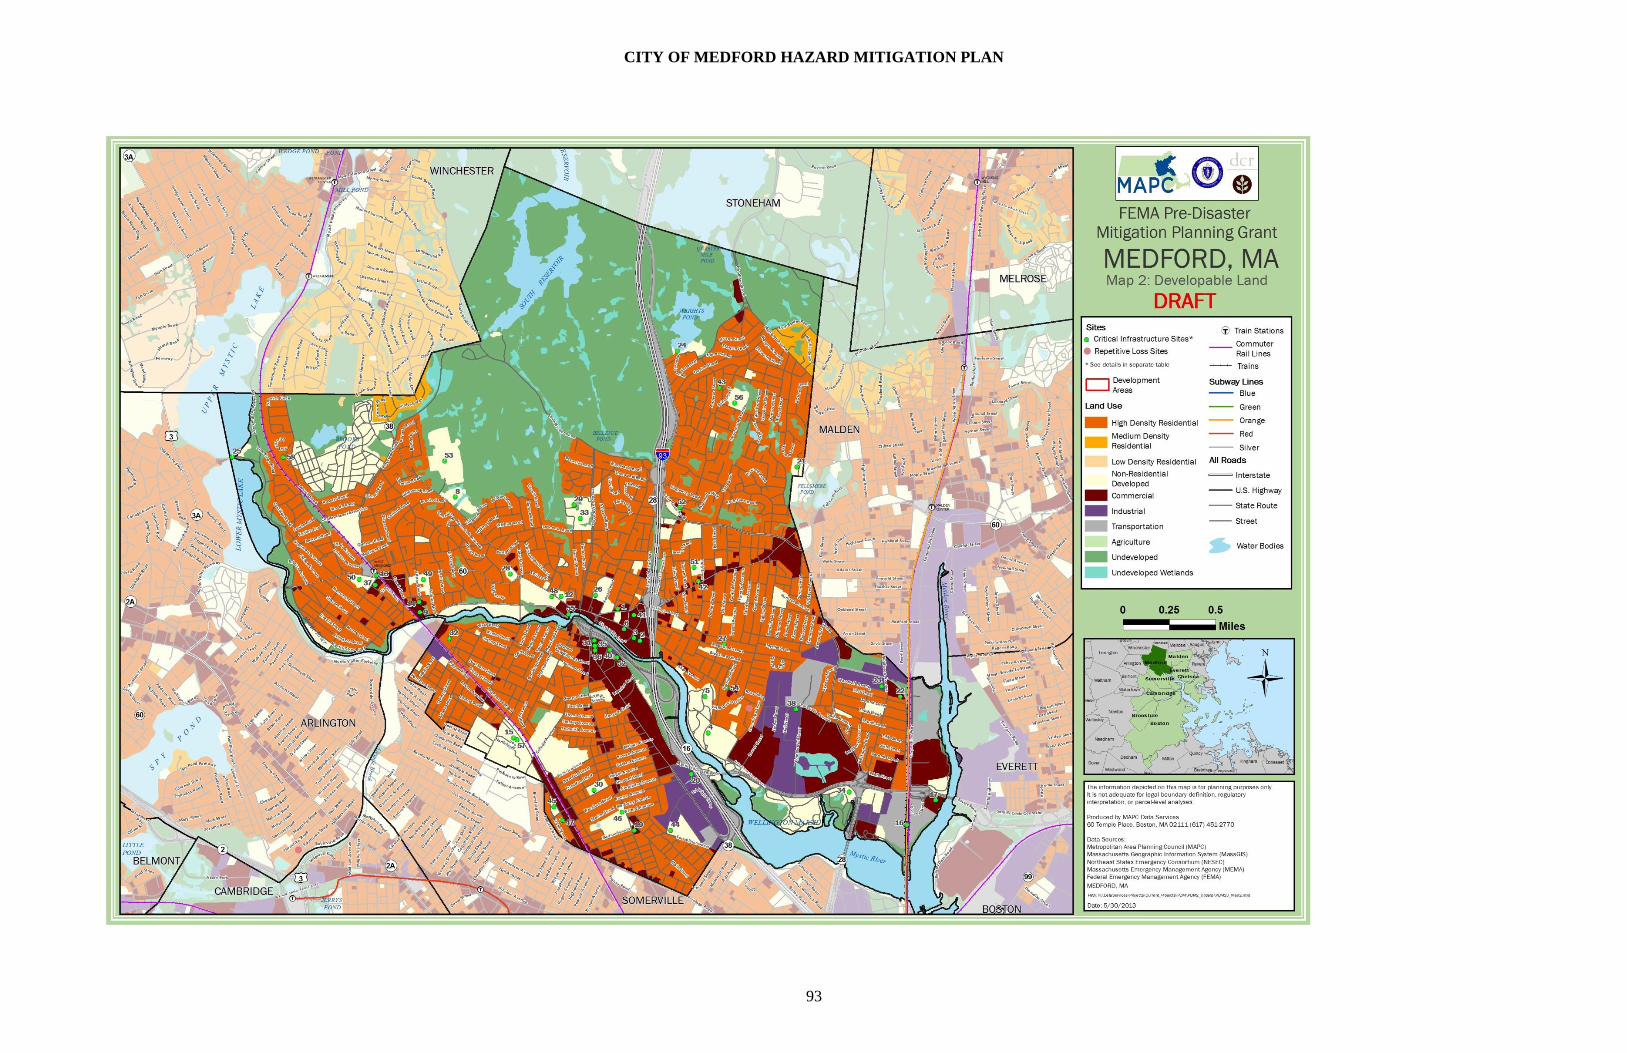
CITY OF MEDFORD HAZARD MITIGATION PLAN
93

CITY OF MEDFORD HAZARD MITIGATION PLAN
94

CITY OF MEDFORD HAZARD MITIGATION PLAN
95

CITY OF MEDFORD HAZARD MITIGATION PLAN
96
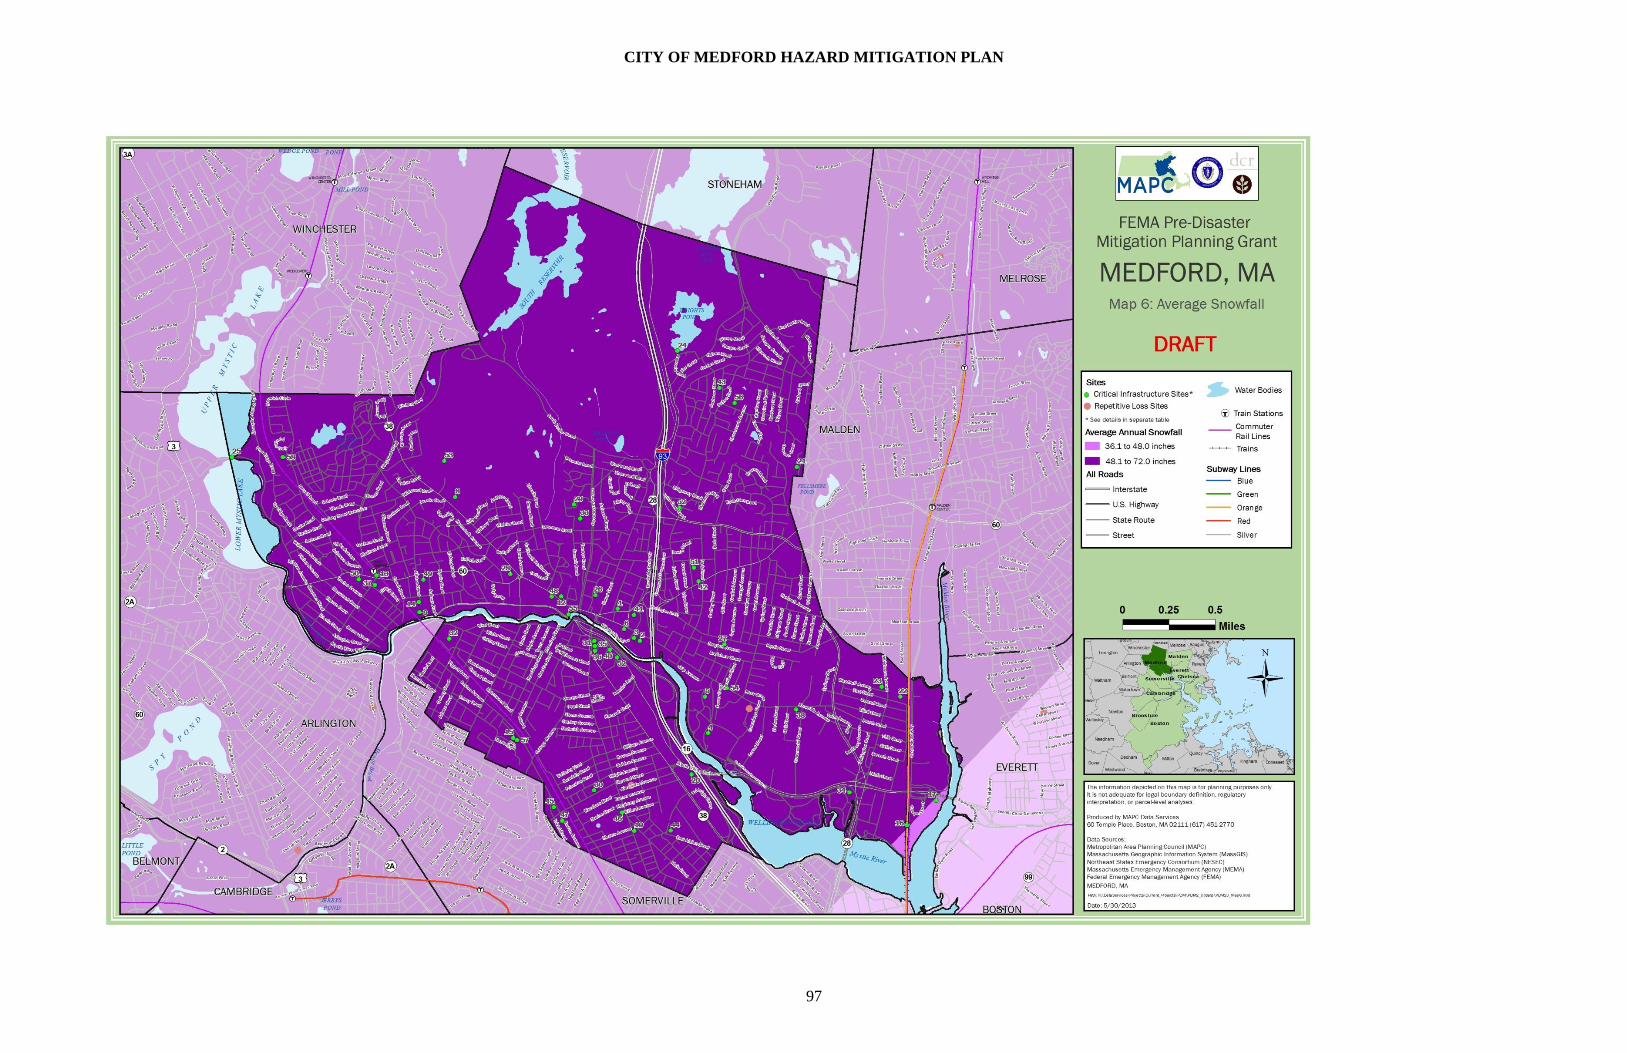
CITY OF MEDFORD HAZARD MITIGATION PLAN
97

CITY OF MEDFORD HAZARD MITIGATION PLAN
98
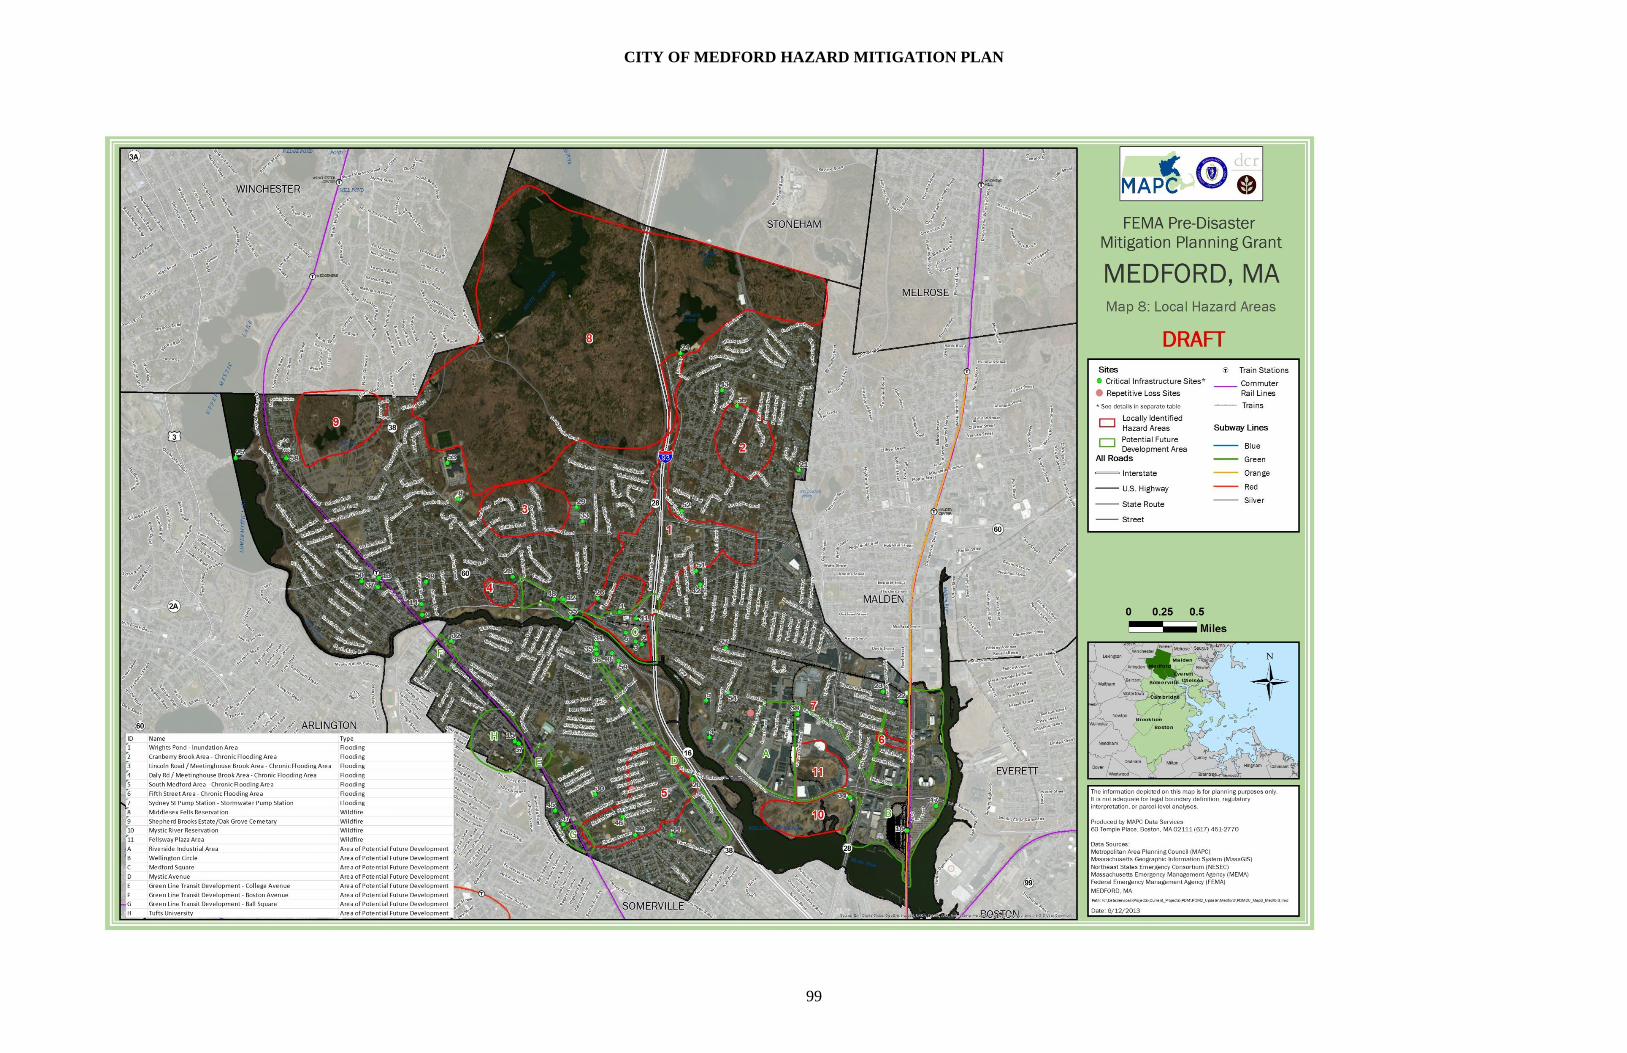
CITY OF MEDFORD HAZARD MITIGATION PLAN
99
CITY OF MEDFORD HAZARD MITIGATION PLAN
100
[This page intentionally left blank]
CITY OF MEDFORD HAZARD MITIGATION PLAN
101
APPENDIX C
DOCUMENTATION OF PUBLIC PARTICIPATION
CITY OF MEDFORD HAZARD MITIGATION PLAN
102
[This page intentionally left blank]
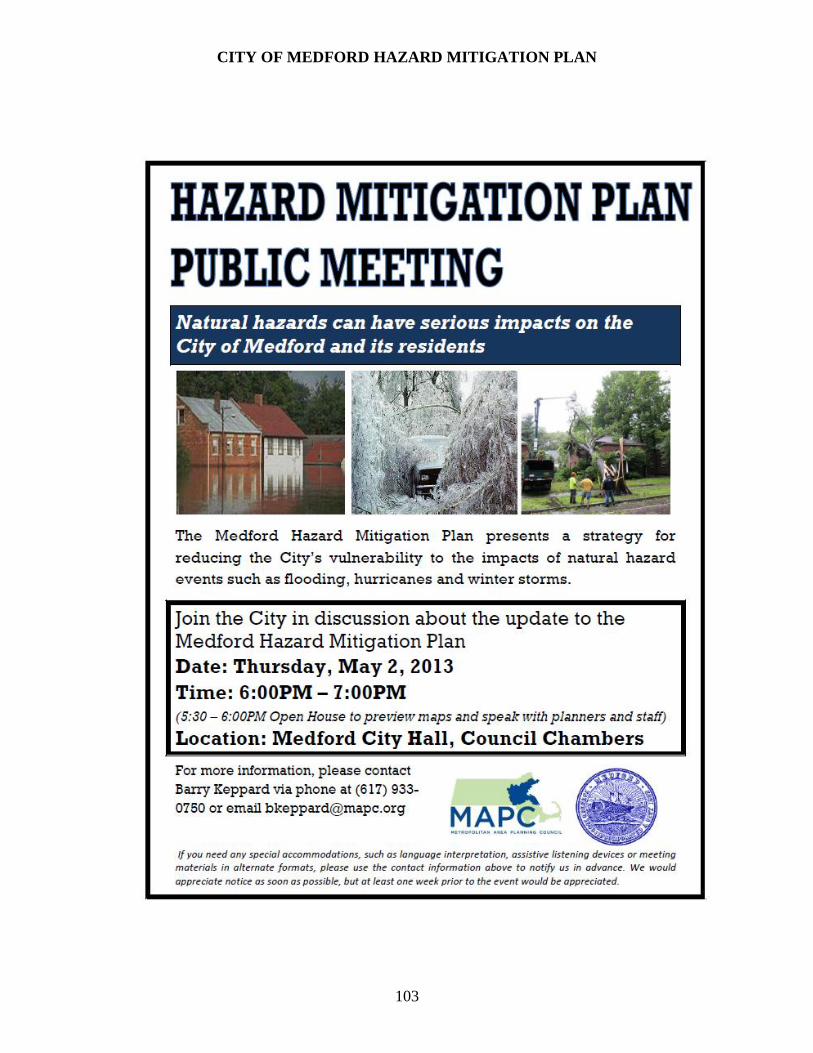
CITY OF MEDFORD HAZARD MITIGATION PLAN
103

CITY OF MEDFORD HAZARD MITIGATION PLAN
104
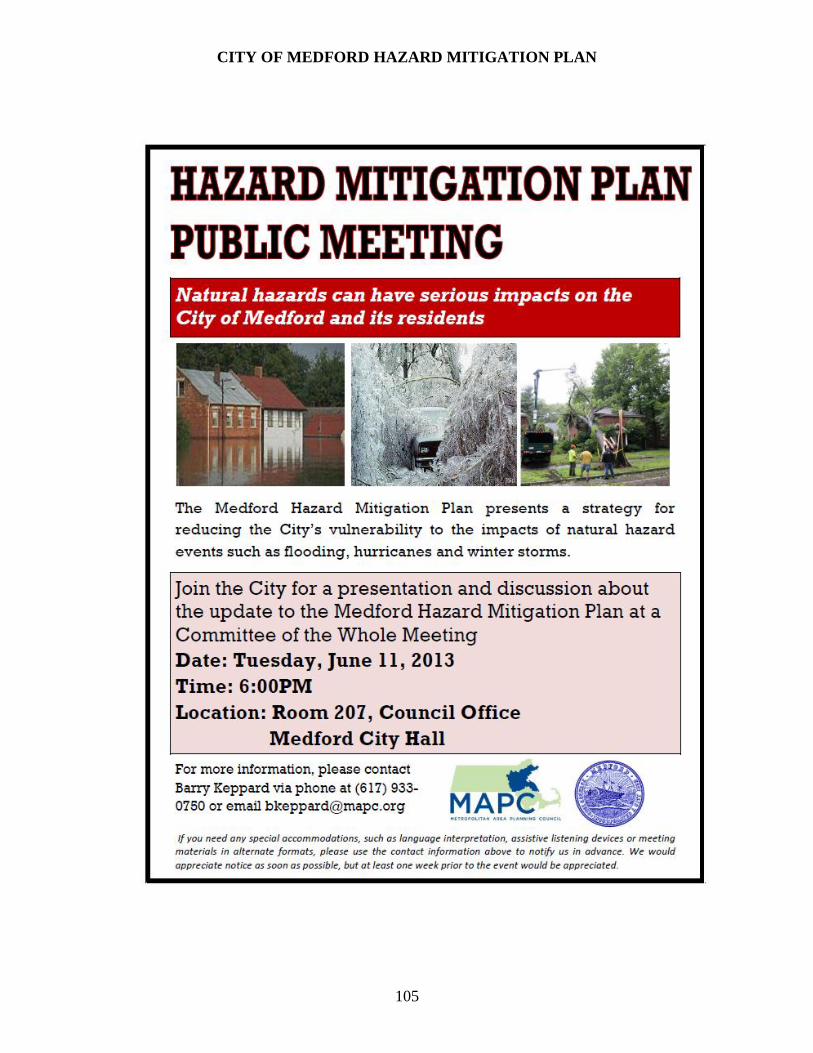
CITY OF MEDFORD HAZARD MITIGATION PLAN
105
CITY OF MEDFORD HAZARD MITIGATION PLAN
106
APPENDIX D
DOCUMENTATION OF PLAN ADOPTION

CITY OF MEDFORD HAZARD MITIGATION PLAN
107
DOCUMENTATION OF PLAN ADOPTION
[To be added to final plan after adoption by the City]