
Draft A Report - EURAMET · Web viewanalysis methods used by participating laboratories 4 7 results...
19
EURAMET Project 1084 Bilateral comparison of standards of CO (in nitrogen), NO (in nitrogen), NO 2 (in air) and SO 2 (in air) at ambient levels Final report T. Macé, C. Sutour, J. Couette (LNE) M.J.T. Milton, P. Brewer (NPL) R.M. Wessel, G. Nieuwenkamp (VSL)
Transcript of Draft A Report - EURAMET · Web viewanalysis methods used by participating laboratories 4 7 results...
EURAMET Project 1084Bilateral comparison of standards of CO (in nitrogen), NO (in nitrogen), NO2 (in air) and SO2 (in air) at ambient levels
Final report
T. Macé, C. Sutour, J. Couette (LNE)M.J.T. Milton, P. Brewer (NPL)R.M. Wessel, G. Nieuwenkamp (VSL)
July 2013

Table of contents
1 BACKGROUND................................................................................................................3
2 OBJECTIVES....................................................................................................................3
3 PARTICIPANTS................................................................................................................4
4 COMPLETION DATE........................................................................................................4
5 COMPARISON PROTOCOL.............................................................................................4
6 ANALYSIS METHODS USED BY PARTICIPATING LABORATORIES..........................4
7 RESULTS..........................................................................................................................6
8 CALCULATION OF DEGREES OF EQUIVALENCE.......................................................7
9 DISCUSSION OF RESULTS.............................................................................................8
10 CONCLUSIONS................................................................................................................9
-2-
1 BACKGROUND
Pollutants such as nitrogen monoxide (NO), nitrogen dioxide (NO2), carbon monoxide (CO) and sulphur dioxide (SO2) are regulated in the directive 2008/50/CE on ambient air quality.Consequently, measurements of the amount fractions of these 4 pollutants in ambient air shall be accurate to fulfil the requirements given in this directive. In general, the primary element of quality assurance for field instruments is regular calibration using certified gas mixtures.
National Metrology Institutes have developed methods for certifying reference gas mixtures used on site for calibrating analysers and some of them are accredited. One of the requirements for accreditation is to participate in comparisons to demonstrate the accuracy of values carried by national reference materials and measurement methods over the time. As the previous comparisons (CCQM-K26a on NO and CCQM-K26b on SO2) have been organized in 2004 there was a need to plan a new comparison on the 4 regulated pollutants (NO, NO2, CO and SO2).
2 OBJECTIVES
This document describes the protocol for a comparison for: Carbon monoxide (CO) in nitrogen at the nominal amount-of-substance fraction of
10 μmol/mol, Nitrogen monoxide (NO) in nitrogen at the nominal amount-of-substance fraction of
200 nmol/mol, Nitrogen dioxide (NO2) in air at the nominal amount-of-substance fraction of
200 nmol/mol, Sulfur dioxide (SO2) in air at the nominal amount-of-substance fraction of 270 nmol/mol.
The objective of this analytical comparison is to compare analytical results of the receiving laboratory on the respective gas mixtures to their reference values provided by the circulating laboratory for SO2, CO, NO2 and NO gas mixtures.
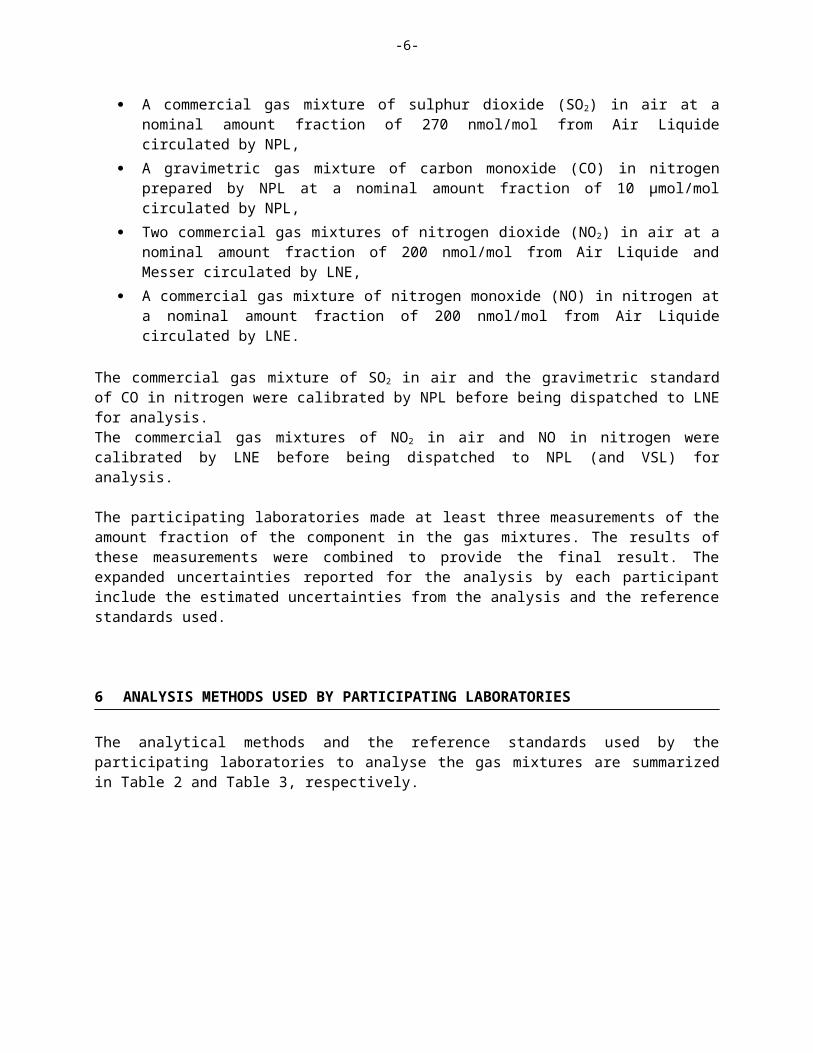
The comparison is aimed at typical amount fractions used to calibrate analysers carrying out automatic measurements of NO, CO and SO2 in ambient air. The NO2 composition is typical to verify the converter efficiency of the NO/NOx analyser.
It is proposed that this comparison can be used to support CMC claims for CO, NO, NO2 and SO2 over the amount fraction ranges shown in Table 1.
Table 1: “How far the light shines” statement
Component Amount Fraction Range (μmol/mol)
CO 10-1000 NO 0,2-10NO2 0,2-10SO2 0,2-10
-3-

3 PARTICIPANTS
LNE acted as pilot laboratory for this comparison which was led in the EURAMET framework.
The national Metrology Institutes which participated in this comparison are : NPL and LNE. VSL was added as independent third party for the NO2 comparison because the difference between the reported NPL and LNE values was unexpectedly large.
4 COMPLETION DATE
The completion date of this comparison is : May 2013.
5 COMPARISON PROTOCOL
This comparison involves 5 gas mixtures: A commercial gas mixture of sulphur dioxide (SO2) in air at a nominal amount fraction of
270 nmol/mol from Air Liquide circulated by NPL, A gravimetric gas mixture of carbon monoxide (CO) in nitrogen prepared by NPL at a
nominal amount fraction of 10 µmol/mol circulated by NPL, Two commercial gas mixtures of nitrogen dioxide (NO2) in air at a nominal amount
fraction of 200 nmol/mol from Air Liquide and Messer circulated by LNE, A commercial gas mixture of nitrogen monoxide (NO) in nitrogen at a nominal amount
fraction of 200 nmol/mol from Air Liquide circulated by LNE.
The commercial gas mixture of SO2 in air and the gravimetric standard of CO in nitrogen were calibrated by NPL before being dispatched to LNE for analysis.The commercial gas mixtures of NO2 in air and NO in nitrogen were calibrated by LNE before being dispatched to NPL (and VSL) for analysis.
The participating laboratories made at least three measurements of the amount fraction of the component in the gas mixtures. The results of these measurements were combined to provide the final result. The expanded uncertainties reported for the analysis by each participant include the estimated uncertainties from the analysis and the reference standards used.
6 ANALYSIS METHODS USED BY PARTICIPATING LABORATORIES
The analytical methods and the reference standards used by the participating laboratories to analyse the gas mixtures are summarized in Table 2 and Table 3, respectively.
-4-
Table 2: Analytical methods used by the participating laboratories
Participating laboratory
Analytical methods used
NO NO2 CO SO2
LNE
42C analyser (TEI) based on the principle of chemiluminescence
42C analyser (TEI) based on the principle of chemiluminescence
48C analyser (TEI) based on non dispersive infrared technique
43C analyser (TEI) based on the principle of UV fluorescence
NPL
CLD 66 analyser (Eco Physics) based on the principle of chemiluminescence
CLD 66 analyser (Eco Physics) based on the principle of chemiluminescence with a molybdenum catalyst to convert NO2 to NO (determination of the efficiency using gas phase titration with ozone)
02020 analyser (ABB) based on non disperse infrared technique
43i analyser (TEI) based on the principle of UV fluorescence
VSL - 17C analyser (TEI) based on the principle of chemiluminescence - -
Table 3: Reference standards used by the participating laboratories
Participating laboratory
Reference standards used
NO NO2 CO SO2
LNE
Generation of a reference gas mixture of NO in nitrogen at about 200 nmol/mol by dynamic dilution of a gravimetric gas mixture at 10 µmol/mol
Generation of a reference gas mixture of NO2 in air at about 200 nmol/mol by the permeation method
Generation of a reference gas mixture of CO in nitrogen at about 10 µmol/mol by dynamic dilution of a gravimetric gas mixture at 500 µmol/mol
Generation of a reference gas mixture of SO2 in air at about 280 nmol/mol by the permeation method
NPL
Generation of a reference gas mixture of NO in nitrogen at about 200 nmol/mol by dynamic dilution from a stable primary reference standard at 10 µmol/mol
Generation of reference gas mixtures of NO and NO2 in air at about 200 nmol/mol by dynamic dilution from stable primary reference standards of the target compound at 10 µmol/mol in each case
Preparation of a reference gas mixture of CO in nitrogen at 10.766 µmol/mol by gravimetry
Generation of a reference gas mixture of SO2 in air at about 280 nmol/mol by dynamic dilution from a stable primary reference standard at 5 µmol/mol
VSL - Generation of a reference gas mixture of NO2 in nitrogen (at about 150, 200, 250 and 300 nmol/mol) by dynamic dilution from a stable primary reference
- -
-5-
standard at 5 µmol/mol
7 RESULTS
CO/N2, NO/N2 and SO2/air
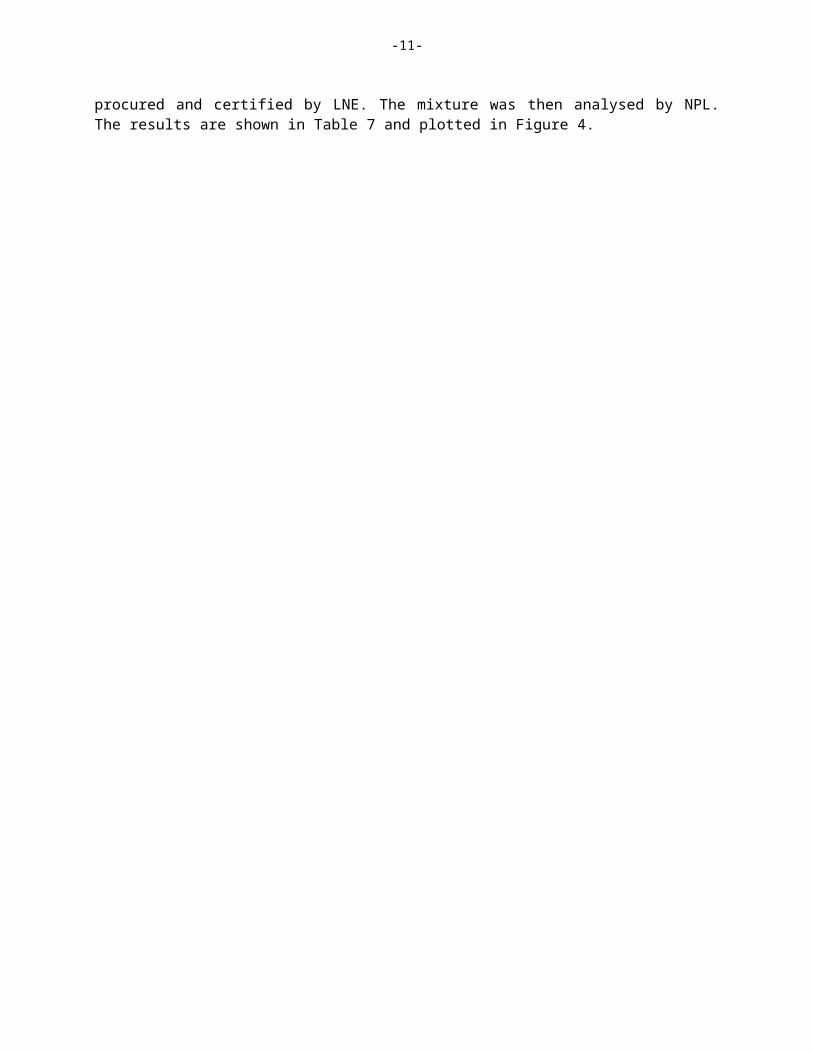
The results submitted by the participating laboratories for CO, NO and SO2 are shown in Table 4 to 6. All of the uncertainties represent 95 % confidence intervals (expanded using a coverage factor k of 2).
Table 4: Results for SO2 (December 2010)
Component Cylinder number
NPL LNE
Reference value
(nmol/mol)
Expanded uncertainty(k=2)
(nmol/mol)
Analytical value
(nmol/mol)
Expanded uncertainty(k=2)
(nmol/mol)
SO2D611759 (Air
Liquide) 275.6 5.5 269.6 3.0
Table 5: Results for CO (December 2010)
Component Cylinder number
NPL LNE
Reference value
(µmol/mol)
Expanded uncertainty(k=2)
(µmol/mol)
Analytical value
(µmol/mol)
Expanded uncertainty(k=2)
(µmol/mol)
CO 163993SG (NPL) 10.867 0.043 10.903 0.082
Table 6: Results for NO (December 2010)
Component Cylinder number
LNE NPL
Reference value
(nmol/mol)
Expanded uncertainty(k=2)
(nmol/mol)
Analytical value
(nmol/mol)
Expanded uncertainty(k=2)
(nmol/mol)
NO D320208 (Air Liquide) 202.3 2.2 200.1 2.0
Figures 1 - 3 show the amount fractions submitted by the participating laboratories for CO, NO and SO2.
-6-

Figure 1: Representation of the amount fractions for SO2 Figure 2: Representation of the amount
fractions for CO
Figure 3: Representation of the amount fractions for NO
The SO2 and CO analytical results for LNE do not deviate from the NPL reference values by more than the expanded uncertainty. The NO analytical results for NPL do not deviate from the LNE reference value by more than the expanded uncertainty.
NO2/air (Preliminary investigation)
A preliminary investigation was conducted. A commercial gas mixture of NO2 in air at a nominal amount fraction of 200 nmol/mol from Messer was procured and certified by LNE. The mixture was then analysed by NPL. The results are shown in Table 7 and plotted in Figure 4.
255
260
265
270
275
280
285
NPL LNE
SO2 cylinder (D611759)Amount fraction (nmol/mol)
194
196
198
200
202
204
206
LNE NPL
NO cylinder (D320208)Amount fraction (nmol/mol)
10.7
10.75
10.8
10.85
10.9
10.95
11
NPL LNE
CO cylinder (163993SG)Amount fraction (µmol/mol)
-7-

Table 7: Results of a preliminary investigation of 200 nmol/mol NO2/air mixture
Component Cylinder number
LNE (Beginning) NPL LNE (Return)
Reference value
(nmol/mol)
Expanded uncertainty
(k=2) (nmol/mol)
Analytical value
(nmol/mol)
Expanded uncertainty
(k=2) (nmol/mol)
Reference value
(nmol/mol)
Expanded uncertainty
(k=2) (nmol/mol)
NO2588845
(Messer) 178.6 4.6 166.4 5.0 177.8 4.4
Figure 4: Preliminary investigation of 200 nmol/mol NO2/air mixture
Figure 4 shows a significant deviation between the amount fractions reported by each institute. An investigation was conducted to identify the cause of the discrepancy and produced the following information.
Both institutes used an analyser with the same principle based on chemiluminescence. However the laboratories calibrate their analyser in different ways:
LNE calibrates it with a reference gas mixture of NO2 in air at about 200 nmol/mol generated by the permeation method,
NPL calibrates it with a reference gas mixture of NO in nitrogen at about 200 nmol/mol by dynamic dilution from a stable primary reference standard.
LNE has analysed gas mixture n°588845 by calibrating its NO/NOx analyser with a reference mixture of NO in air with nominal amount fraction of 200 nmol/mol. This was prepared by dynamic dilution with air from a gravimetric gas mixture of NO in nitrogen at about 10 µmol/mol. The analysed amount fraction was 175.65.5 nmol/mol: this amount fraction was not significantly different from the first set of amount fractions (178.64.6 nmol/mol and 177.84.4 nmol/mol) taking account the expanded uncertainties. The possibility that some NO2 impurities can be present in the NO stable primary reference standard at 10 µmol/mol prepared by NPL has been raised. The impurities have been analysed in the NO primary reference standard with
150
155
160
165
170
175
180
185
LNE NPL LNE
NO2 cylinder (588845)Amount fraction (nmol/mol)
-8-

FTIR by LNE: no impurity has been found which can interfere on the measurement made by a chemiluminescence analyser (cf. figure 5).
Figure 5: FTIR spectrum of the NO primary reference standard at about 10 µmol/mol prepared by NPL
The converter efficiency of the catalyst in NPL’s analyser was determined using a gas phase titration at three different amount fractions. The results were 98.7% at 200 nmol/mol, 97.7% at 500 nmol/mol and 97.9% at 800 nmol/mol. The change in the converter efficiency is negligible across the amount fraction range tested given an uncertainty of 1% (k=1) was employed in the uncertainty budget. Due to the discrepancy between NPL and LNE results a reference value could not be allocated.
NO2/air
VSL was added as independent third party for the NO2 measurements because the difference between the NPL and LNE values was unexpectedly large in the preliminary investigation and could not be explained in spite of several complementary experiments. A new commercial NO2
gas mixture (D721882) from Air Liquide was used for the comparison because the original cylinder (588845) was almost empty. The results submitted by the participants are shown in Table 8. All of the uncertainties represent 95% confidence intervals (expanded using a coverage factor k of 2).
CO2 (20 nmol/mol)
CO (40 nmol/mol)CO2 (20 nmol/mol)
NO2 CO2 (20 nmol/mol)
CO2 (20 nmol/mol)
-9-
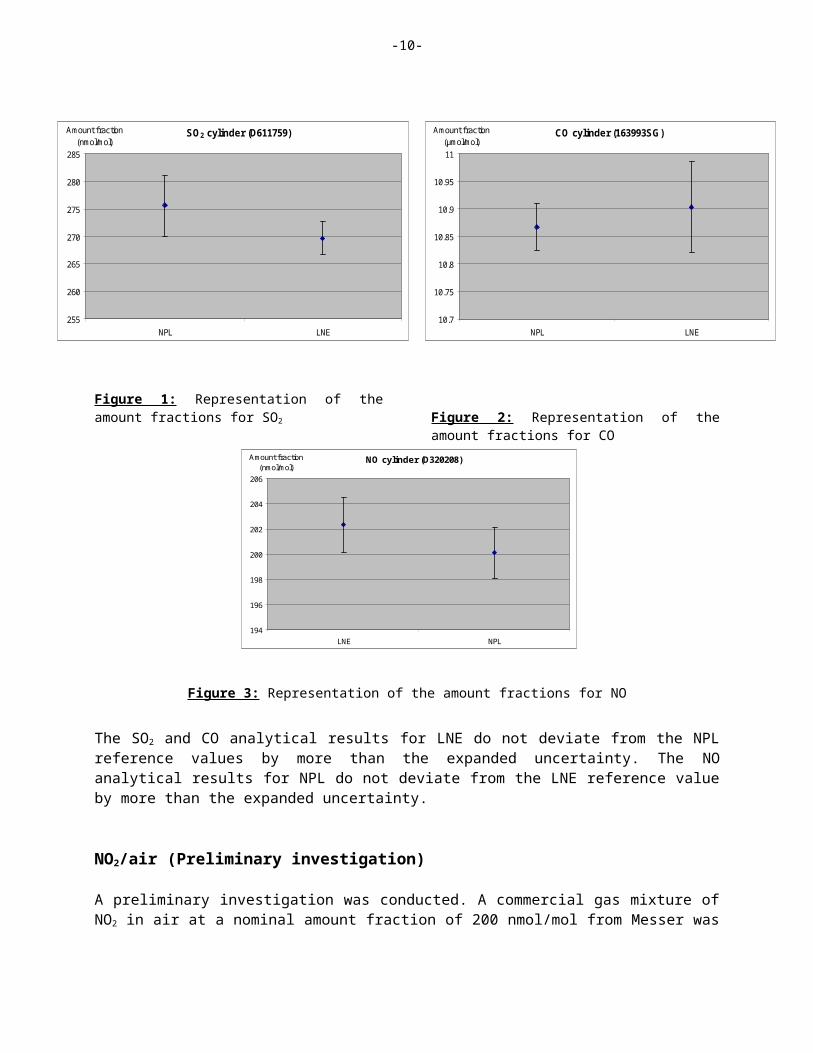
Table 8: NO2 results (August 2011)All the results are expressed in nmol/mol
Compo-nent
Cylinder number
LNE VSL LNE NPL LNE
Reference value
U(k=2)
Analytical value
U(k=2)
Reference value
U(k=2)
Analytical value
U(k=2)
Reference value
U(k=2)
NO2
D721882 (Air
Liquide)199.6 4.4 205 5 192.7 4.9 196.3 5.9 193.4 4.3
In figure 6 the results are plotted in terms of amount fractions submitted by the participating laboratories.
Figure 6: Reported NO2 amount fractions plotted against measurement date. A first order curve was fitted using a generalised least squares method
Figure 6 shows the data plotted against the measurement date. The results reported by LNE (triangles) indicate a decay in the amount fraction of NO2 during the comparison. A first order curve was fitted using a generalized least-squares method which takes into account the uncertainties of each reference value. The solid line shows the results and the dotted lines indicate the expanded uncertainty of the analysis. After correcting for this decay rate, the reported results demonstrate good agreement between LNE and NPL within the uncertainties stated. The amount fraction reported by VSL exhibits a bias to the reference value.
185
190
195
200
205
210
215
07/01/2011 26/02/2011 17/04/2011 06/06/2011 26/07/2011 14/09/2011
Date
Amount fraction (nmol/mol) NO2 cylinder (D721882)
LNE
LNE LNE
NPL
VSL
-10-
8 CALCULATION OF DEGREES OF EQUIVALENCE
The degree of equivalence of the participating laboratory in the comparison is defined as
Di=xlab−xref
Where xref denotes the reference value and x lab the result of each participating laboratory.
The standard uncertainty of Di can be expressed as
u ²(Di )=u ² lab+u ²ref
Where uref and ulab are standard combined uncertainties of reference value and participating laboratory, respectively, assuming that the error terms associated with the laboratory result and the reference value are uncorrelated.
The expanded uncertainty of Di, at 95% level of confidence, is given by
U (Di )=2×u(Di )
The degrees of equivalence are listed in Table 9 and shown in Figure 7.The LNE reference values were recalculated using the first order curve: 192.9 nmol/mol for VSL and 196.7 nmol/mol for NPL respectively.An uncertainty due to the stability of the NO2 amount fraction over the time has been calculated using the first order curve: this leads to a stability standard uncertainty equal to 1.61 nmol/mol. This stability standard uncertainty has been added to the mean of the 3 expanded uncertainties of 4.4, 4.9 and 4.3 nmol/mol which is equal to 4.5 nmol/mol. After correcting for the decay rate, the reported results demonstrate good agreement between LNE and NPL within the uncertainties stated but show that the bias between LNE and VSL remains (see figure 7).
Table 9: Calculation of the degrees of equivalence
Reference laboratory
Participant laboratory Component
xref
(nmol/mol)
Uref
(nmol/mol)xlab
(nmol/mol)
Ulab
(nmol/mol)
Di
(nmol/mol)U(Di)
(nmol/mol)
NPL LNE SO2 275.6 5.5 269.6 3.0 -6.00 6.26
LNE NPL NO 202.3 2.2 200.1 2.0 -2.20 2.97
LNE NPL NO2 192.9 5.6 196.3 5.9 3.40 8.13
LNE VSL NO2 196.7 5.6 205 5 8.30 7.51
Reference laboratory
Participant laboratory Component xref
(µmol/mol)
Uref
(µmol/mol)
xlab
(µmol/mol)
Ulab
(µmol/mol)
Di
(µmol/mol)U(Di)
(µmol/mol)
NPL LNE CO 10.867 0.043 10.903 0.082 0.04 0.09
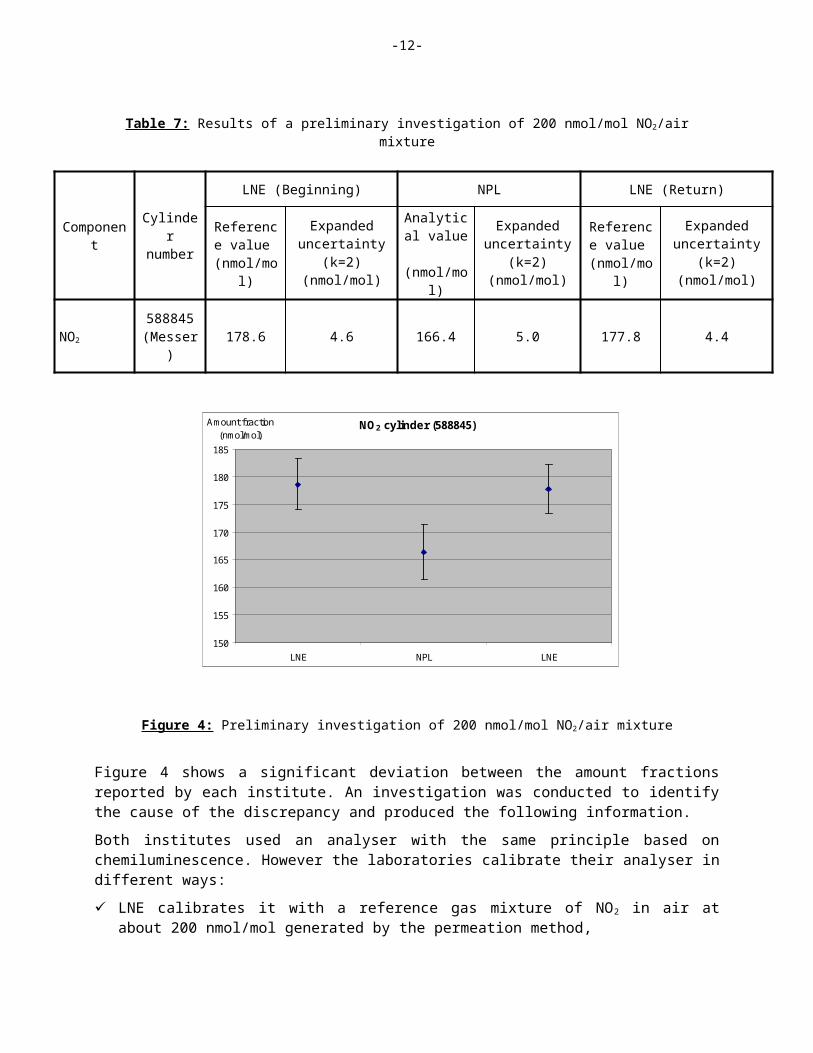
Figure 7: Representation of the degrees of equivalence
9 DISCUSSION OF RESULTS
The analytical amount fractions obtained by NPL and LNE for SO2, CO and NO are in a good agreement. Results from a preliminary investigation showed significant deviation between the NO2 amount fractions determined by LNE and NPL. Several complementary tests were carried out but no scientific explanations were found to explain the deviations. Consequently another national metrological institute (VSL) was invited to participate in the NO2 comparison. Three results were reported by LNE, measured at regular intervals over the duration of the comparison. The results indicated decay in the amount fraction of the comparison mixture. A first order curve was fitted to the data using a generalised least squares approach in order to determine the
-20.0
-15.0
-10.0
-5.0
0.0
5.0
10.0
15.0
20.0
LNE NPL NPL VSL
SO2NO
NO2
Degrees of equivalence (SO2, NO, NO2)
Deg
rees
of e
quiv
alen
ce (n
mol
/mol
)NO2
-1.0
-0.5
0.0
0.5
1.0
LNE
CO
Degrees of equivalence (CO)
Deg
rees
of e
quiv
alen
ce (µ
mol
/mol
)
-8-

decay rate of NO2. After correcting for this decay rate, the reported results demonstrate good agreement between LNE and NPL within the uncertainties stated but not between LNE and VSL. VSL may have slightly underestimated the uncertainty of the dynamic dilution to produce the calibration line used for determining the NO2 concentration of the gas mixture.
10 CONCLUSIONS
After making some investigations the agreement of the results between LNE and NPL in this EURAMET Project 1084 is good for amount fractions of:
CO at about 10 µmol/mol,
SO2 at about 270 nmol/mol,
NO at about 200 nmol/mol,
NO2 at about 200 nmol/mol.
-9-


