Dr. Steve Dritz - Latest Field Research and Available Tools to Evaluate and Improve Feed Efficiency
47
Latest Field Research and Available Tools to Evaluate and Improve Feed Efficiency Jason Woodworth, Mike Tokach, Bob Goodband, Steve Dritz, Joel DeRouchey
Transcript of Dr. Steve Dritz - Latest Field Research and Available Tools to Evaluate and Improve Feed Efficiency
Latest Field Research and Available Tools
to Evaluate and Improve Feed Efficiency
Jason Woodworth, Mike Tokach, Bob Goodband,
Steve Dritz, Joel DeRouchey

Calculators and tools
Premix updates
Journal papers
Abstracts
Podcasts
Swine Day
www.ksuswine.org

4
Developed by Jon DeJong

5

Predicted ADG of 167 lb BW pigs fed increasing dietary NE at varying levels of SID Lys
SID Lys,%
1.0
0.8
0.6
Nitikanchana et al. JAS 2015

Predicted G:F of 167 lb BW pigs fed increasing dietary NE at varying levels of SID Lys
Nitikanchana et al. JAS 2015

Example: Increasing energy, but not SID lysine
8
5%

9
Example: increasing energy and SID Lysine
7.8%

Formulated SID Lys, %
F/G
Gebhardt et al. 2015
Methods to Analyze Nutrition Dose Response Commercial Research Data - Goncalves et al., JAS 2016
SID Lysine in low crude protein diets for finishing pigs from 230 to 280 lb

Formulated SID Lys,
%
IOF
C,
$
Gebhardt et al. 2015
SID Lysine in low crude protein diets for finishing pigs from 230 to 280 lb

L-Tryptophan (Trp) is now commonly being used in diets across the US
12

13
Total Savings- Trp No: $5.04 Trp Yes: $7.78

SID Trp:Lys ratio at different target performance levels of finishing pigs
Percent of maximum performance, %
Item 95% 96% 97% 98% 99% 100%
ADG
QP1 17.6% 18.3% 18.9% 19.8% 20.8% 23.5%
G:F
BLL2 13.9% 14.5% 15.1% 15.7% 16.3% 16.9%
BLQ3 14.4% 14.7% 15.2% 15.7% 16.2% 17.0% 1ADG = – 0.329 + 6.3 × (Trp:Lys ratio) – 13.5 × (Trp:Lys ratio)2 + 0.015 × (Initial BW, kg) – 0.000098 × (Initial BW, kg)2
2 G:F = 0.599 – 1.0 × (0.169 – Trp:Lys ratio) – 0.004 × (Initial BW, kg) + 0.000017 × (Initial BW, kg)2 if SID Trp:Lys ratio < 16.9% 3 G:F = 0.6014 – 0.603 × (0.170 – Trp:Lys ratio) – 20.0 × (0.170 – Trp:Lys ratio)2 – 0.004 × (Initial BW, kg) + 0.000017 × (Initial BW, kg)2 if SID Trp:Lys ratio < 17.0%
Goncalves, 2015

17

18

20

21

22

Evaluating feed processing technologies

Evaluating feed processing technologies 24

Effects of Grinding Corn through a 2-, 3-, or 4-High Roller Mill on Milling Characteristics and Pig Performance
Gebhardt et al., 2015

Influence of roller mill configuration on ADG of 88-287 lb pigs
2.18
2.13
2.07
2.14
1.90
1.95
2.00
2.05
2.10
2.15
2.20
2.25
2.30
Rolls 2 3 4-Fine 4-Course
Particle Size
572 484 295 382
Gebhardt et al., 2015
lb
ab
c
b
a a,b,c=P< 0.05

Influence of roller mill configuration on ADFI of 88-287 lb pigs
6.20
6.03
5.83
6.02
5.50
5.75
6.00
6.25
6.50
Gebhardt et al., 2015
lb
b
c
b
a a,b,c=P< 0.05
Rolls 2 3 4-Fine 4-Course
Particle Size
572 484 295 382

Influence of roller mill configuration on F/G of 88-287 lb pigs
2.85 2.83 2.82 2.81
2.50
2.60
2.70
2.80
2.90
3.00
Gebhardt et al., 2015
P=0.147
Rolls 2 3 4-Fine 4-Course
Particle Size
572 484 295 382

Influence of roller mill configuration on IOFC of 88-287 lb pigs
70.99 70.06
68.23
71.70
65
67
69
71
73
75
Gebhardt et al., 2015
a a
b
a
Rolls 2 3 4-Fine 4-Course
Particle Size
572 484 295 382

2.5
2.7
2.9
3.1
3.3
3.5
800 600 400
Cabrera, 1994a
Cabrera, 1994b
Wondra, 1995
Effects of particle size on F/G of finishing pigs
Particle size, microns
1.2% per 100 microns 1.0% per 100 microns
2.5
2.7
2.9
3.1
3.3
3.5
25
0
35
0
45
0
55
0
65
0
75
0
Paulk, 2011
DeJong, 2012
Nemecheck, 2013
De Jong, 2014
Gebhardt, 2015
Particle size, microns

Corn particle size affects feed preference of nursery pigs
0.00
0.20
0.40
0.60
0.80
1.00
1.20
1.40
Trial 1 Trial 2 Trial 3 Trial 4 Trial 5
Gebhardt, 2015; Bokelman, 2015
700
250
700
400
403
267
525 403
525
267
P = 0.01 P = 0.11
Pelleted
Diets
P = 0.01 P = 0.01 P = 0.89
**Particle size (µm) of corn is noted above columns**
AD
FI,
lb

Conclusions-Reducing Particle Size • Nursery Pigs
– Benefits in F/G observed as particle size is decreased until 500-600 µm, then little benefit
• Finishing Pigs
– Meal diets result in 1% improvement in F/G for every 100 µm reduction through 300 µm
• Feed intake and gain are reduced when corn is ground to 300 microns in meal diets for nursery or finisher pigs
• Bottom line – we recommend grinding grain to 550-600 microns for meal diets.

33

Effects of pelleting regime on F/G
2.46
2.33
2.38 2.37 2.38 2.36
2.20
2.30
2.40
2.50
2.60
c
F/G
abc P < 0.05 SEM = 0.002
a
b b b
b
De Jong et al., JAS 2016 In Press

Effects of pelleting regime on pig removals per pen
0.5
1.9
1.1 0.9 0.9 0.9
0.0
0.5
1.0
1.5
2.0
2.5
3.0
b
Re
mo
vals
/pe
n
ab P < 0.05 SEM = 0.265 a
b b b b
De Jong et al., JAS 2016 In Press
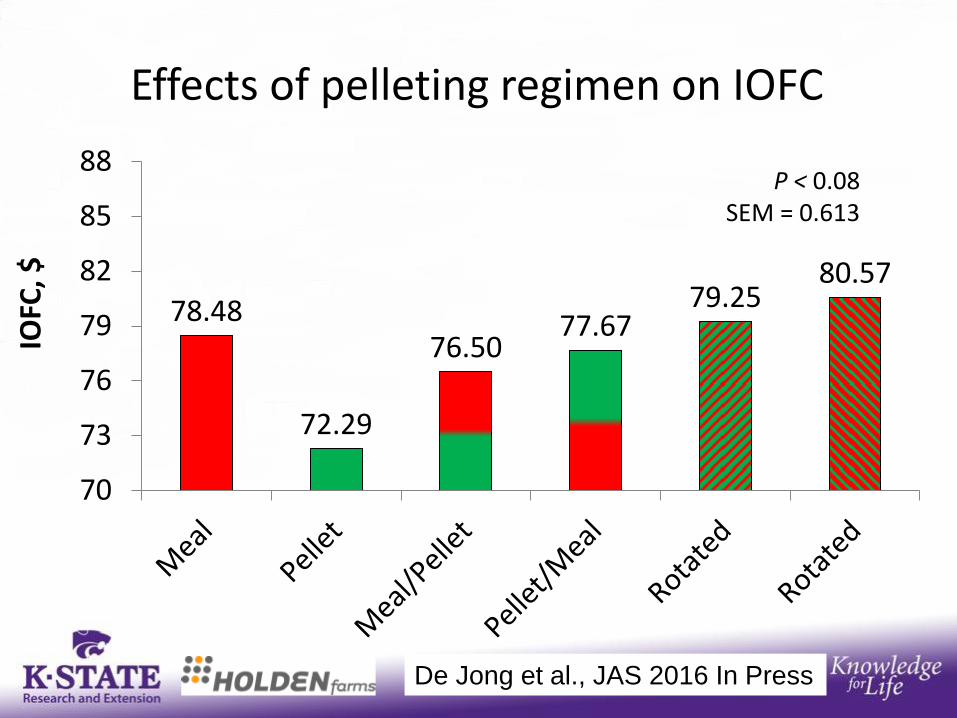
Effects of pelleting regimen on IOFC
78.48
72.29
76.50 77.67
79.25 80.57
70
73
76
79
82
85
88
IOFC
, $
P < 0.08 SEM = 0.613
De Jong et al., JAS 2016 In Press

37

38
Floor space Tool
Josh Flohr Metanalysis 2015

Floor space calculator 39

40

Feed efficiency (FG) adjustment calculator: Examples
42 Goncalves et al., 2017 JSHAP In Press

Objective: Evaluate the feed efficiency of gilts and sows under commercial conditions and their
reproductive performance
Graduate Student: Lori Thomas


Feed efficiency Factsheets • Swine Feed Efficiency, IPIC 25a: Not Always Linked to Net Income
• Swine Feed Efficiency, IPIC 25b: Genetic Impact
• Swine Feed Efficiency, IPIC 25c: Particle Size Testing Methodology
• Swine Feed Efficiency, IPIC 25d: Influence of Particle Size
• Swine Feed Efficiency, IPIC 25e: Influence of Pelleting
• Swine Feed Efficiency, IPIC 25f: Influence of Temperature
• Swine Feed Efficiency, IPIC 25g: Decision Tree
• Swine Feed Efficiency, IPIC25h: Influence of Market Weight
• Swine Feed Efficiency, IPIC 25i: Effect of Dietary Energy
• Swine Feed Efficiency, IPIC 25j: Influence of Ractopamine
• Swine Feed Efficiency, IPIC 25k: Feeder Design and Management
• Swine Feed Efficiency, IPIC 25l: Influence of Amino Acids
• Swine Feed Efficiency, IPIC 25m: Sow Feed on Whole Farm Efficiency
www.swinefeedefficiency.com

Calculators and tools
Premix updates
Journal papers
Abstracts
Podcasts
Swine Day
www.ksuswine.org

Thank you!
WWW.KSUswine.org