
Introduction To Corneal Transplantation Lecture 14 Liana Al-Labadi, O.D.

Dr. Sophia Labadi, Director, Centre for Heritage

Objectives of the evaluation
Has the regeneration scheme contributed to the community’s sustainability through encouraging community involvement and access – that is, has it enhanced quality of life? Has the scheme improved the area's appearance? Has it facilitated investment in the area? Has it created greater social and business
confidence?
Data collected
Questionnaires: around 500 questionnaires with 36 questions were mailed to randomly selected people of the regeneration scheme at its beginning and end. To complement the information from the
questionnaires, several face-to-face and written interviews were undertaken with individuals with firsthand experience in implementing the Townscape Heritage Initiative scheme.
Data collected: Townscape survey
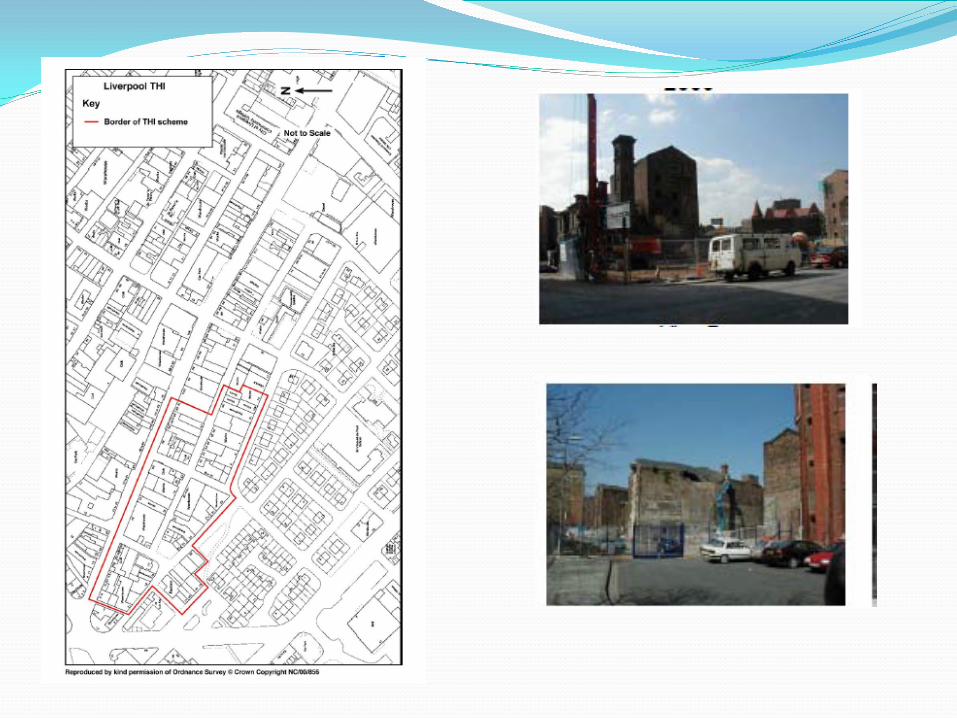
Condition survey: photos taken at the beginning and end of the scheme to monitor buildings with aesthetic or architectural significance. Land use survey: monitoring of the occupation of ground and upper floors of buildings. Streetscape evaluation: assessing different views of the areas to analyse:
- streetscape quality - private space management - heritage conservation

Secondary sources of data
Employment and unemployment levels; Socio-economic hardships of the population through
existing deprivation measures and child poverty index rank; Property values through average house price as well as
commercial and property value; Visitor numbers to local heritage sites; tourist
information centre headcount.

Indicators
The data collected contributed to building four indicators about: quality of life enhancement; townscape improvements; economic regeneration; image and confidence-building.
Quality of Life enhancement
Sub-indicator ‘Employment and Income’; Data obtained through tracking local employment and occupational profiles and measuring this against broader and regional statistics; existing indices in the UK, such as the Social Deprivation Index, have also been used. Lack of improvement of the employment situation: low level of income and employment both at the beginning and end of the scheme.

Indicator of economic regeneration
The first sub-indicator recorded changes in land uses; Data was obtained from secondary sources as well as observation from site surveys
Result: drastic reduction in the number of empty properties; important number of new constructions
Indicator of economic regeneration
‘Retail Usage and Demand’ was considered important to chart as it was an effective way of gauging consumers spending patterns. Evidence for this indicator was hoped to be gathered from local and national data sources, townscape observations, interviews and questionnaire responses. Unfortunately, no information was available on the numbers of retail planning applications or traffic flow, so this sub-indicator could not be calculated.

Indicator of economic regeneration ‘Capital values and yields’ measured commercial, retail or residential property market value and charted investor or business demand for space;
Results based on transaction data;
Result: In 1999 or 2000 not a single sale had been recorded, making it impossible to establish a baseline for property values. By 2005 prices in the area, however, were 15 per cent above the average price for the City of Liverpool.
‘Image and confidence building’ indicator Sub-indicator ‘media coverage and perception’ looks at press coverage, using data collected by the Heritage Lottery Fund and local libraries as well as local perceptions of the project using data from the questionnaires. Results: more positive coverage of the place in the news. As concerns perception of the project, in 2005 more than two-thirds of the respondents were unaware of a scheme that had been in their neighbourhood for five years.
‘Image and confidence building’ indicator The sub Indicator ‘Business Vitality and Investment’ assessed new businesses creation, planning application, redevelopment and conversions. Data was obtained through secondary data, interviews with local businesses and residents, and observations of the townscape. Results: Until 1999, the area had a history of disinvestment. Many of these problems have been overcome; the area is now entering the economic mainstream. Still, all is not well and the high level of ongoing construction impedes street life and commerce.
Issues
Issues in collecting primary and secondary data. Many indicators were constructed on the results of questionnaires. However, rates of response very low both in 2000 and 2005. Face-to-face interviews might have resulted in a greater rate of answers.

Gentrification A major issue relate to the gentrification of the area;
This is partly due to the fact that local communities were not systematically involved right from the beginning of the regeneration scheme and all through its different phases;
No particular scheme developed to ensure that affordable and decent housings remain for the long-term inhabitants of the regenerated urban areas so that they are not forced to move out.
For further information…
Online and free report: ‘Evaluating the socio-economic impacts of selected regenerated sites in Europe’
![[Disinvestment] Timeline, Methods, Pro & Anti Arguments, Modi Policy on PSU Reforms and Disinvestment](https://static.fdocuments.us/doc/165x107/56d6bf651a28ab3016961350/disinvestment-timeline-methods-pro-anti-arguments-modi-policy-on-psu.jpg)