Dr Rajiv Kumar - newasiaforum.org · 9/15/2005 · Dr Rajiv Kumar Chief Economist Confederation of...
39
Dr Rajiv Kumar Chief Economist Confederation of Indian Industry 15 September 2005 High Level Conference on Asian Economic Integration: Vision of a New Asia
Transcript of Dr Rajiv Kumar - newasiaforum.org · 9/15/2005 · Dr Rajiv Kumar Chief Economist Confederation of...
Dr Rajiv Kumar
Chief Economist
Confederation of Indian Industry
15 September 2005
High Level Conference onAsian Economic Integration:
Vision of a New Asia
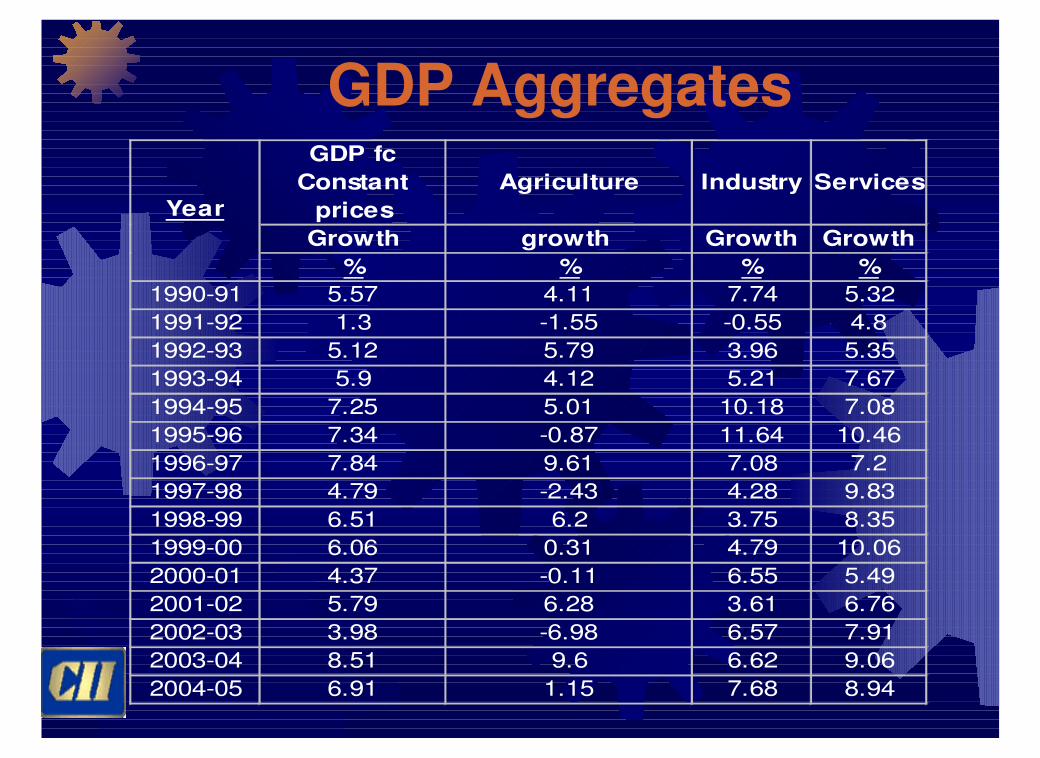
GDP AggregatesGDP fc
Constant
prices
Agriculture Industry Services
Growth growth Growth Growth
% % % %
1990-91 5.57 4.11 7.74 5.32
1991-92 1.3 -1.55 -0.55 4.8
1992-93 5.12 5.79 3.96 5.35
1993-94 5.9 4.12 5.21 7.67
1994-95 7.25 5.01 10.18 7.08
1995-96 7.34 -0.87 11.64 10.46
1996-97 7.84 9.61 7.08 7.2
1997-98 4.79 -2.43 4.28 9.83
1998-99 6.51 6.2 3.75 8.35
1999-00 6.06 0.31 4.79 10.06
2000-01 4.37 -0.11 6.55 5.49
2001-02 5.79 6.28 3.61 6.76
2002-03 3.98 -6.98 6.57 7.91
2003-04 8.51 9.6 6.62 9.06
2004-05 6.91 1.15 7.68 8.94
Year
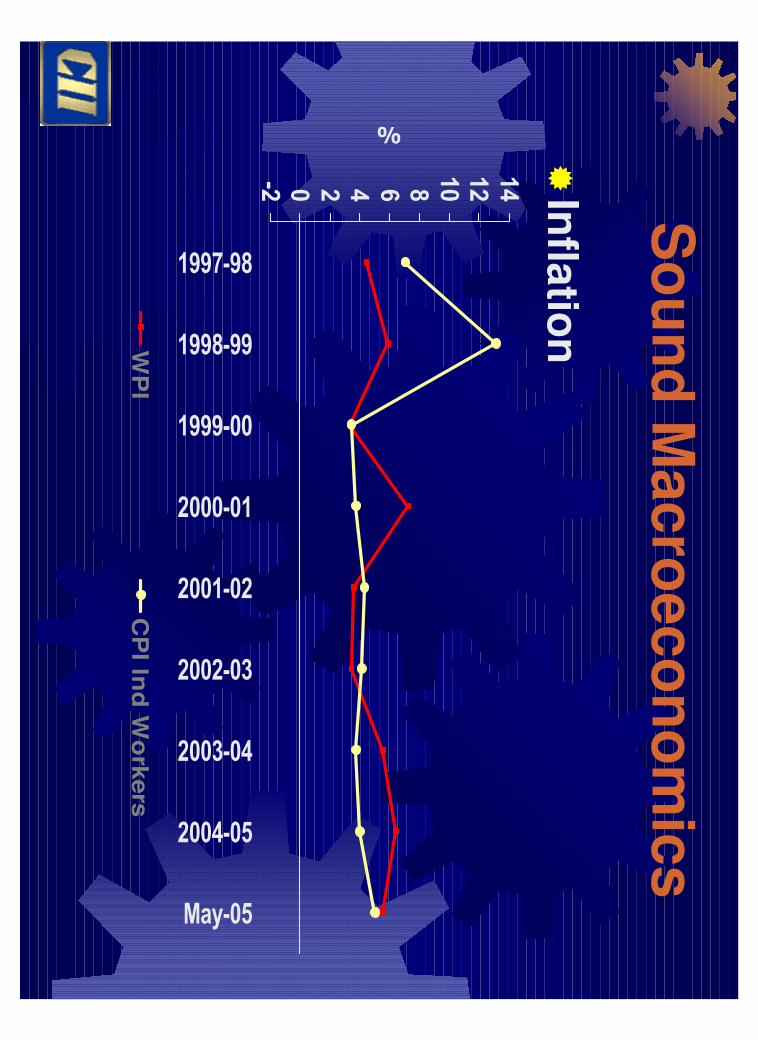
So
un
d M
acro
eco
no
mic
s
�In
flatio
n
-2 0 2 4 6 81012141997-98
1998-99
1999-00
2000-01
2001-02
2002-03
2003-04
2004-05
May-05
%
WP
IC
PI In
d W
ork
ers
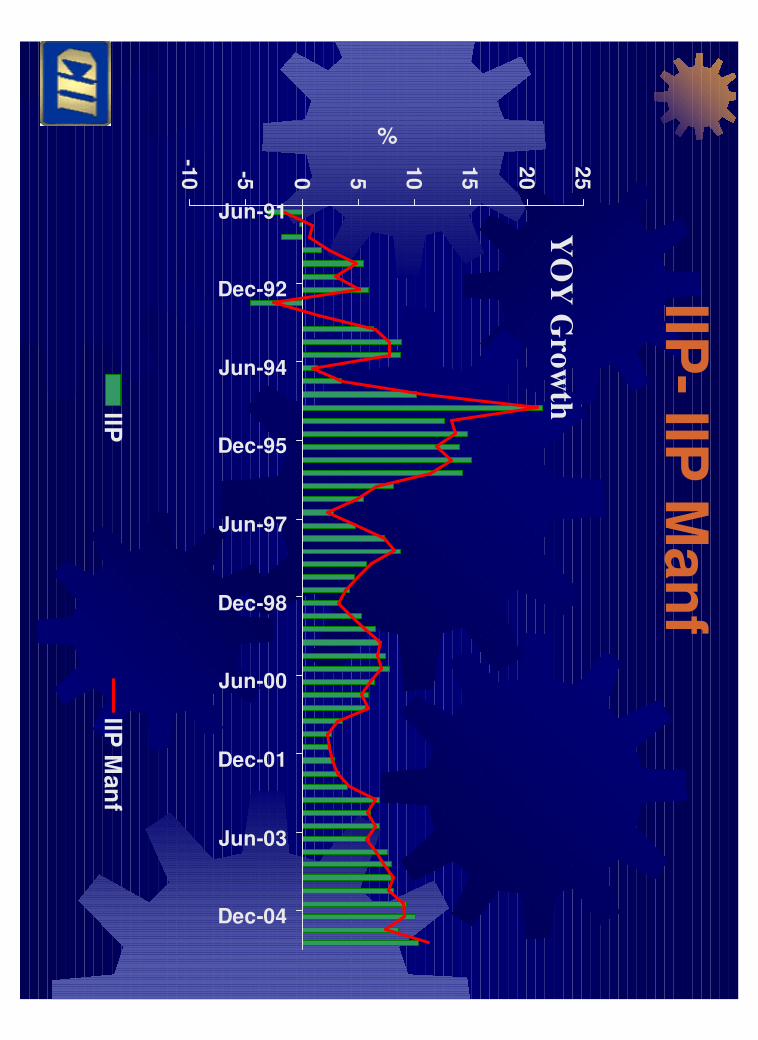
-10 -5 0 5
10
15
20
25
Jun-91
Dec-92
Jun-94
Dec-95
Jun-97
Dec-98
Jun-00
Dec-01
Jun-03
Dec-04
%
IIP
IIP M
an
f
YO
Y G
row
th
IIP-
IIPM
an
f

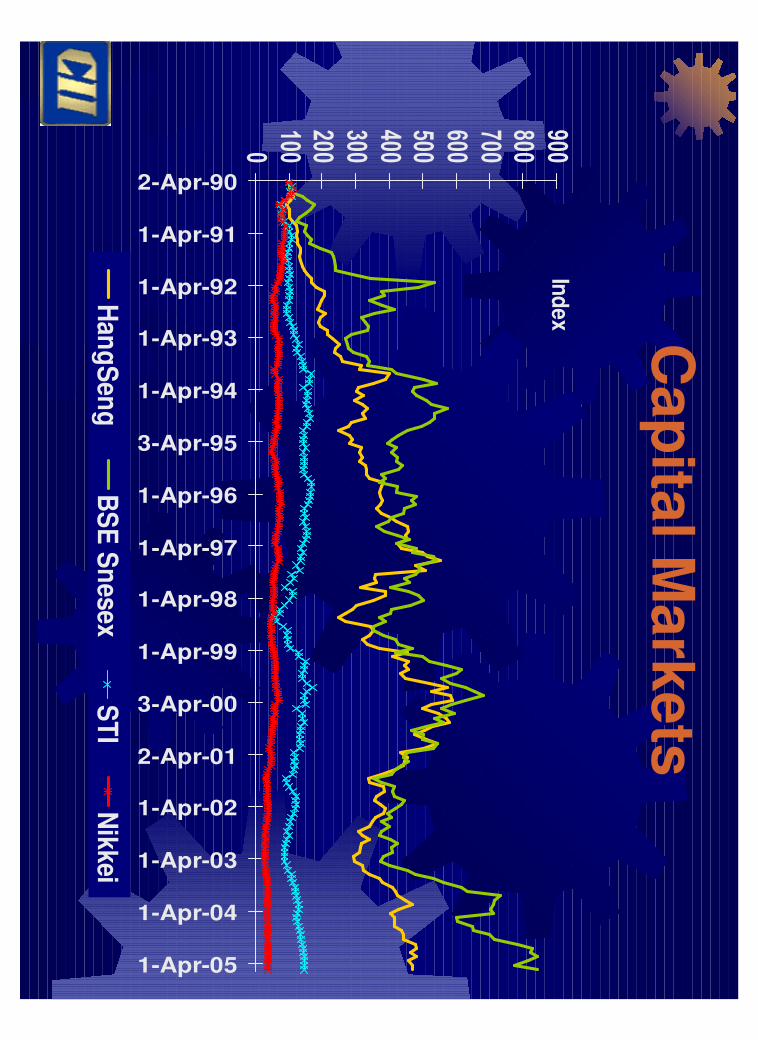
Capital Markets
0
400,000
800,000
1,200,000
1,600,000
2,000,000
2,400,000J
an
-94
Ja
n-9
5
Ja
n-9
6
Ja
n-9
7
Ja
n-9
8
Ja
n-9
9
Ja
n-0
0
Ja
n-0
1
Ja
n-0
2
Ja
n-0
3
Ja
n-0
4
Ja
n-0
5
Rs. Crore
0
4000
8000
12000Index
BSE Mkt. Cap BSE sensex Nifty
Cap
ital M
ark
ets
01002003004005006007008009002-Apr-90
1-Apr-91
1-Apr-92
1-Apr-93
1-Apr-94
3-Apr-95
1-Apr-96
1-Apr-97
1-Apr-98
1-Apr-99
3-Apr-00
2-Apr-01
1-Apr-02
1-Apr-03
1-Apr-04
1-Apr-05
Ind
ex
Han
gS
eng
BS
E S
nesex
ST
IN
ikkei

Corporate Performance
22.5
31.8
0
4
8
12
16
20
24
28
32
1999-00 2000-01 2001-02 2002-03 2003-04 2004-05*
%
Manfg. Services IIP gr.
� Corporate sales
Source: CMIE
* Apr-Dec

Business Outlook
� Expectation and trend in new orders
0
50
100
Past Six Months Next Six Months
% o
f to
tal r
esp
on
den
ts
Increase DecreaseNo Change
Source: CII Business Outlook Survey
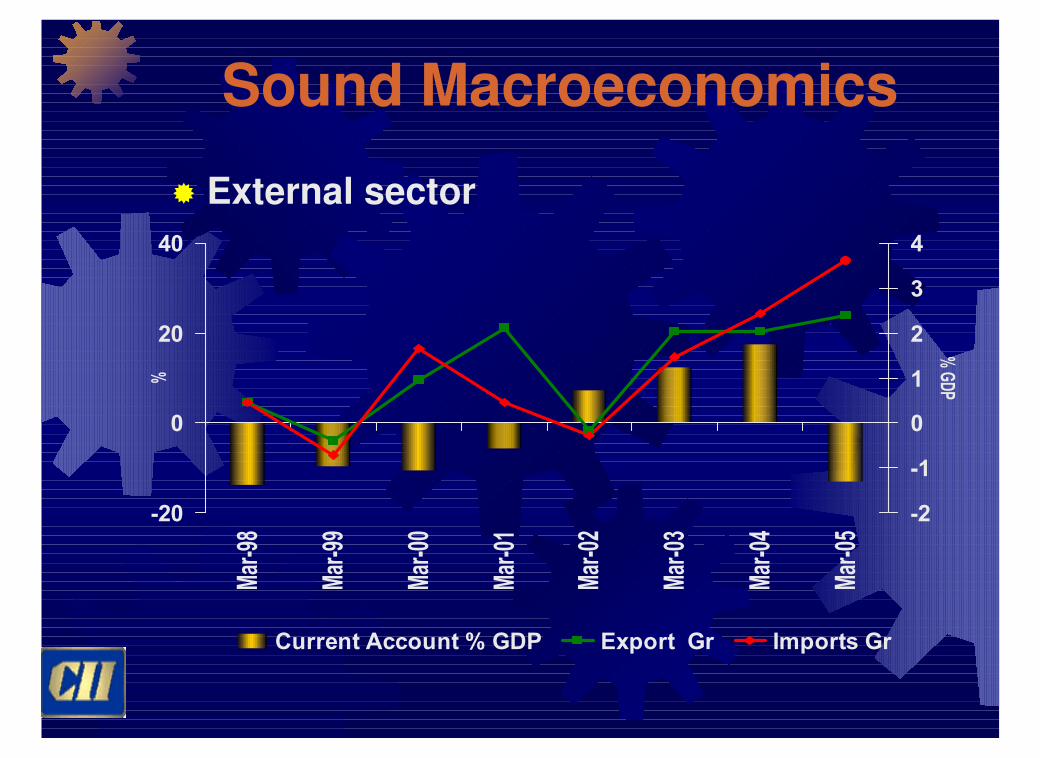
Sound Macroeconomics
� External sector
-20
0
20
40Mar-98
Mar-99
Mar-00
Mar-01
Mar-02
Mar-03
Mar-04
Mar-05
%
-2
-1
0
1
2
3
4
% GDP
Current Account % GDP Export Gr Imports Gr
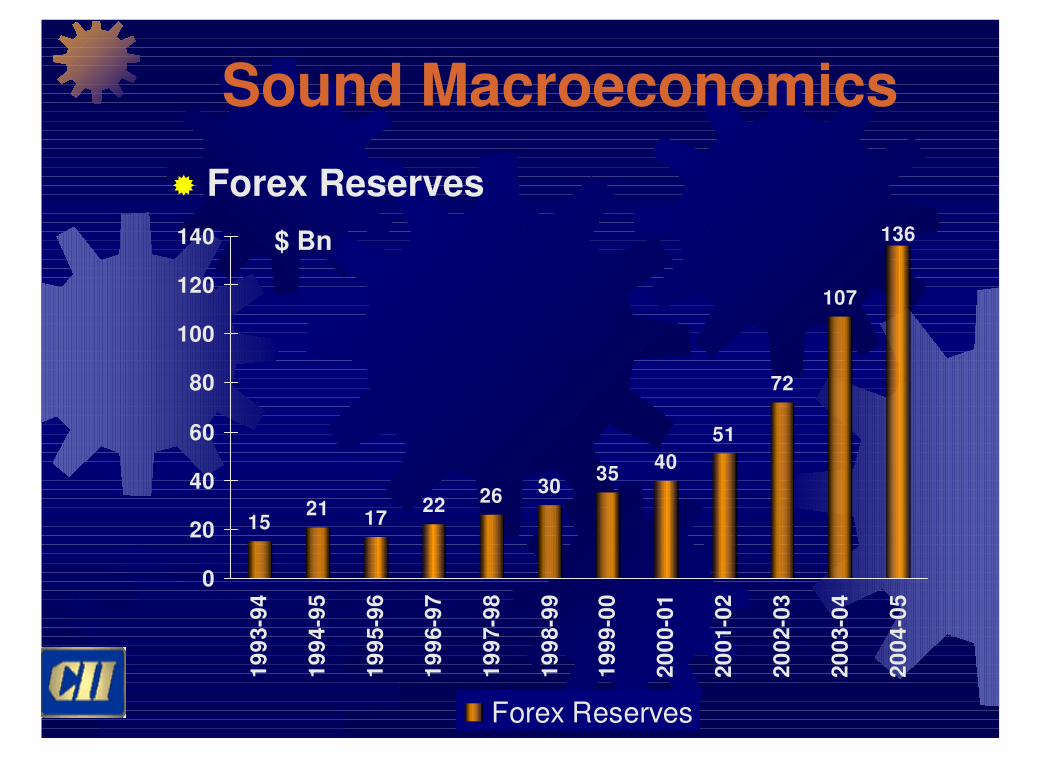
Sound Macroeconomics
1521 17
22 26 3035
40
51
72
107
136
0
20
40
60
80
100
120
1401
99
3-9
4
19
94
-95
19
95
-96
19
96
-97
19
97
-98
19
98
-99
19
99
-00
20
00
-01
20
01
-02
20
02
-03
20
03
-04
20
04
-05
Forex Reserves
� Forex Reserves
$ Bn
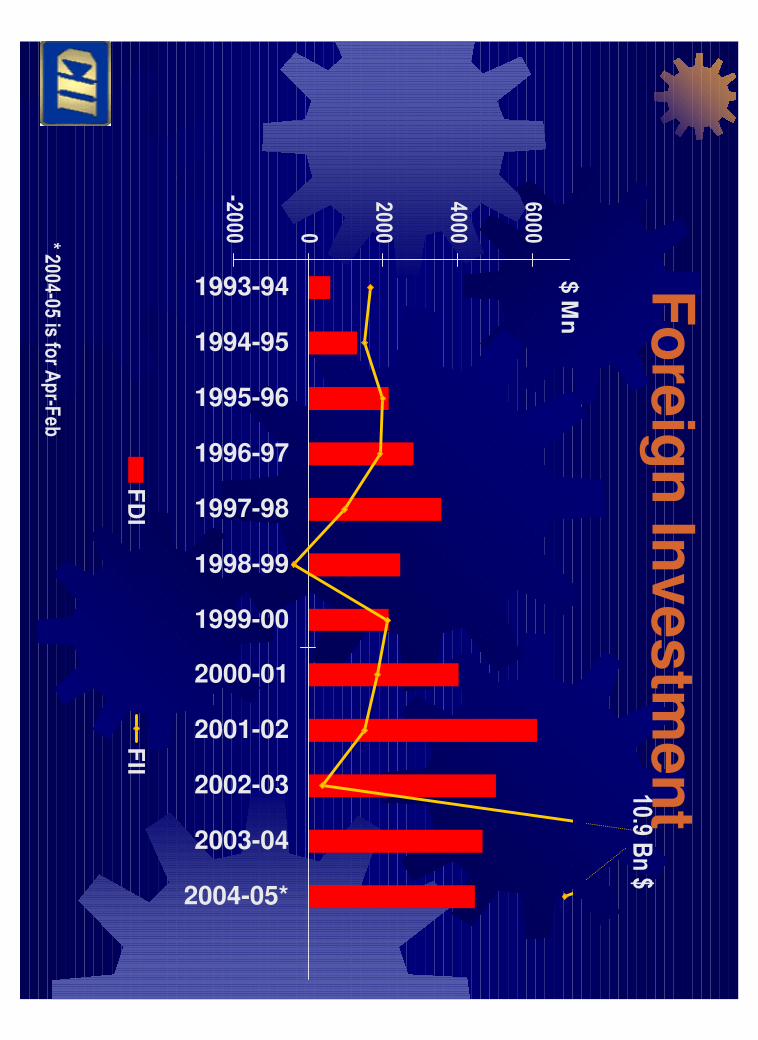
Fo
reig
n In
vestm
en
t
-2000 0
2000
4000
6000
1993-94
1994-95
1995-96
1996-97
1997-98
1998-99
1999-00
2000-01
2001-02
2002-03
2003-04
2004-05*
$ M
n
FD
IF
II
* 2004-05 is for A
pr-F
eb
10.9 Bn $

�GDP forecast
�Backed by good agriculture prospects,
continued momentum in industry and services
Sound Macroeconomics
% 2002-03A 2003-04A 2004-5F 2004-05 A 2005-06 F
Agriculture -5.2 9.6 1 1.1 3
Industry 6.4 6.6 7.6 8.3 8.1
Services 7.1 9.1 8.3 8.6 8.3
GDP 4 8.5 6.5 6.9 7.2
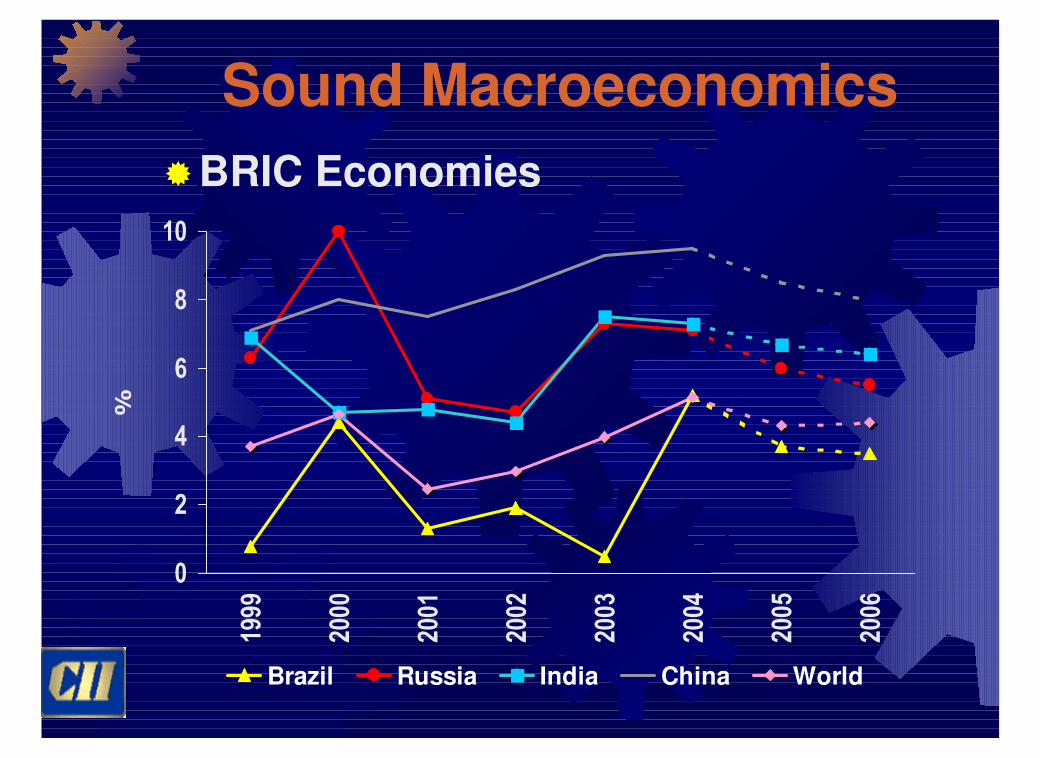
�BRIC Economies
Sound Macroeconomics
0
2
4
6
8
101999
2000
2001
2002
2003
2004
2005
2006
%
Brazil Russia India China World

Strong Fundamentals
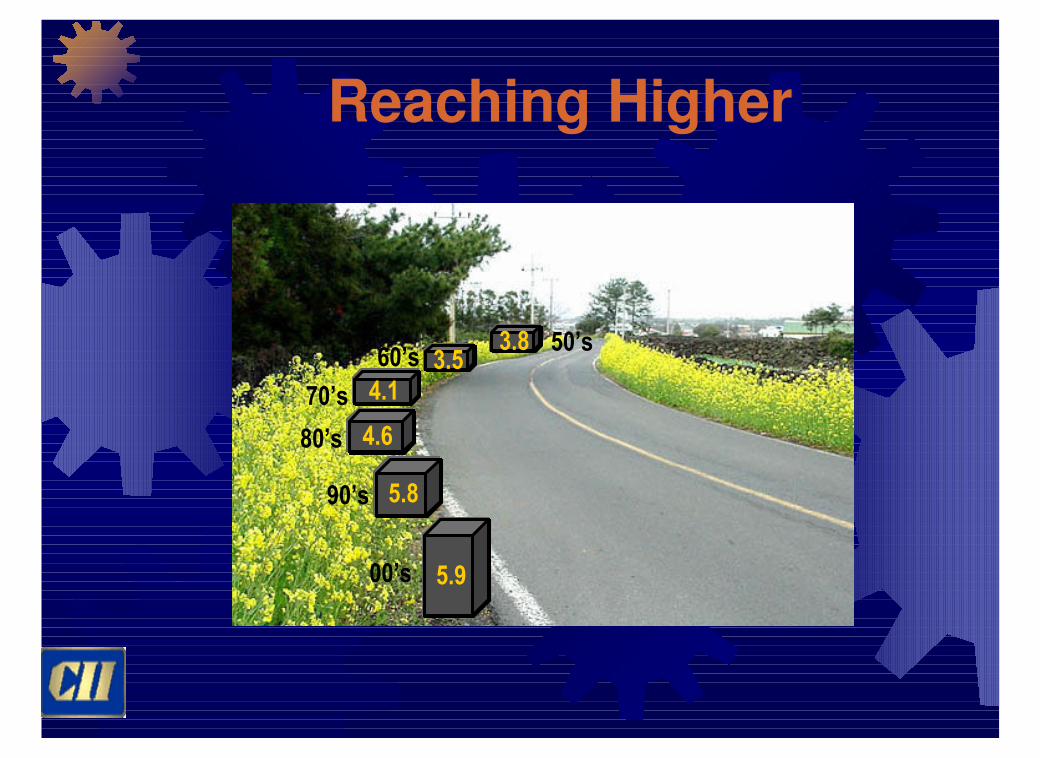
50’s
5.9
4.6
5.8
4.13.5
3.8
00’s
90’s
80’s
70’s
60’s
Reaching Higher

Deepening Democracy
….
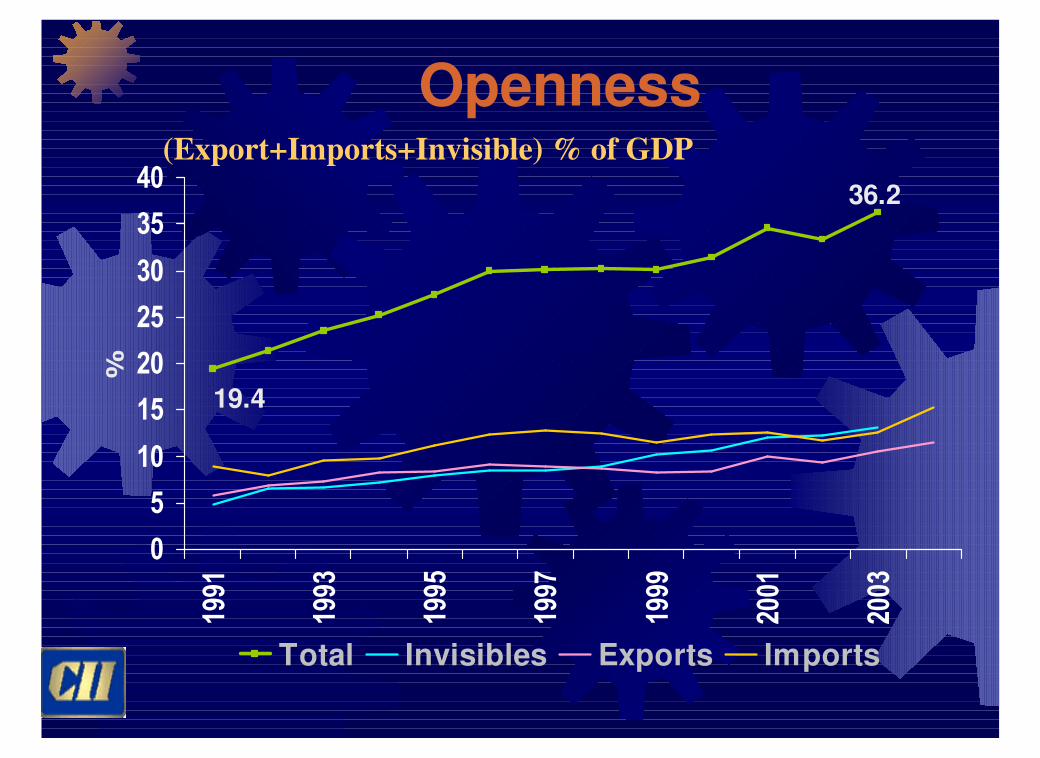
Openness
36.2
19.4
0
5
10
15
20
25
30
35
401991
1993
1995
1997
1999
2001
2003
%
Total Invisibles Exports Imports
(Export+Imports+Invisible) % of GDP
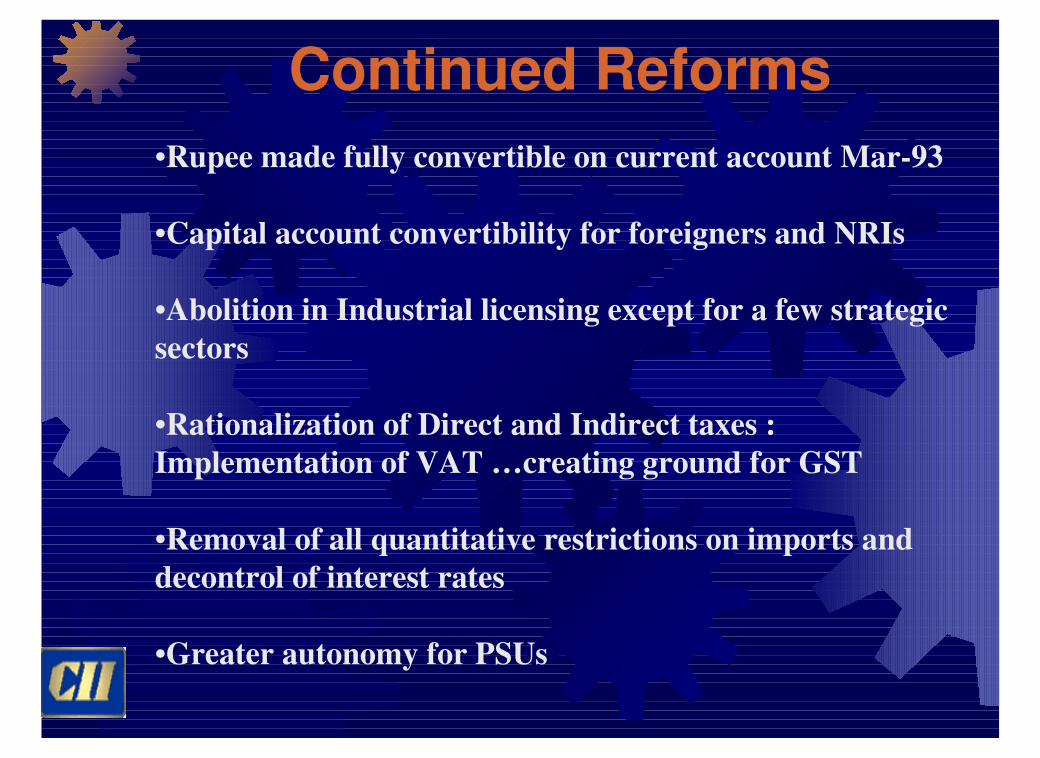
Continued Reforms
•Rupee made fully convertible on current account Mar-93
•Capital account convertibility for foreigners and NRIs
•Abolition in Industrial licensing except for a few strategic
sectors
•Rationalization of Direct and Indirect taxes :
Implementation of VAT …creating ground for GST
•Removal of all quantitative restrictions on imports and
decontrol of interest rates
•Greater autonomy for PSUs

Continued Reforms
•Portfolio investments by FIIs allowed both in Equity and
Debt markets
•FDI allowed in most sectors including insurance, and limits
raised in telecom, refining, banking
•The Fiscal Responsibility and Budget Management (FRBM)
Act notified in 2004
•Banking sector reforms
-Entry of private banks
-Conditions for foreign banks liberalized
•Financial sector reforms
-RBI Autonomy
-Creation of regulators SEBI, IRDA, TRAI

The demographic bonus
China 2020
Note: females on the left, males on the right scale
0 70
0 - 4
5 - 9
10 - 1415 - 1920 - 2425 - 29
30 - 3435 - 39
40 - 4445 - 49
50 - 5455 - 59
60 - 6465 - 6970 - 7475 - 79
80+
070 0 60
0 - 45 - 9
10 - 1415 - 1920 - 2425 - 2930 - 3435 - 3940 - 4445 - 4950 - 5455 - 5960 - 6465 - 6970 - 7475 - 79
80+
060
India 2020
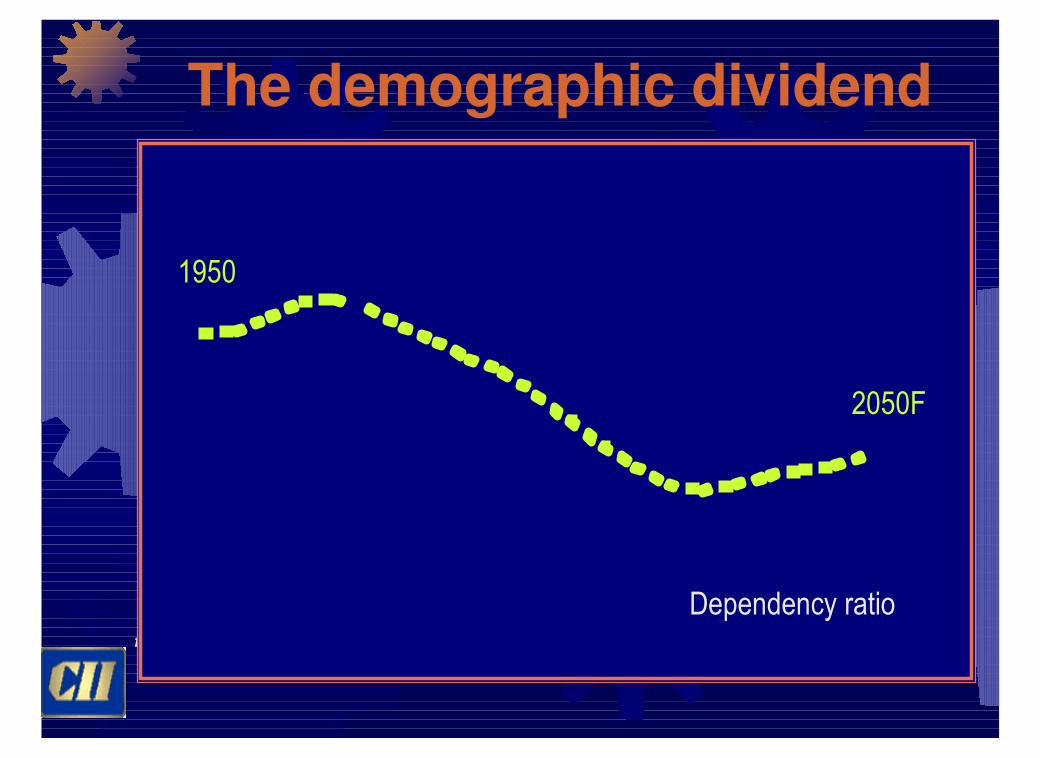
The demographic dividendJapan 2020
females on the left, males on the right scale
India 2020
millions of people
80+
0 60
0 - 45 - 9
10 - 1415 - 1920 - 2425 - 2930 - 3435 - 3940 - 4445 - 4950 - 5455 - 5960 - 6465 - 6970 - 7475 - 79
060
0 - 45 - 9
10 - 1415 - 1920 - 2425 - 2930 - 3435 - 3940 - 4445 - 4950 - 5455 - 5960 - 6465 - 6970 - 7475 - 79
80+
08 80
1950
2050F
Dependency ratio
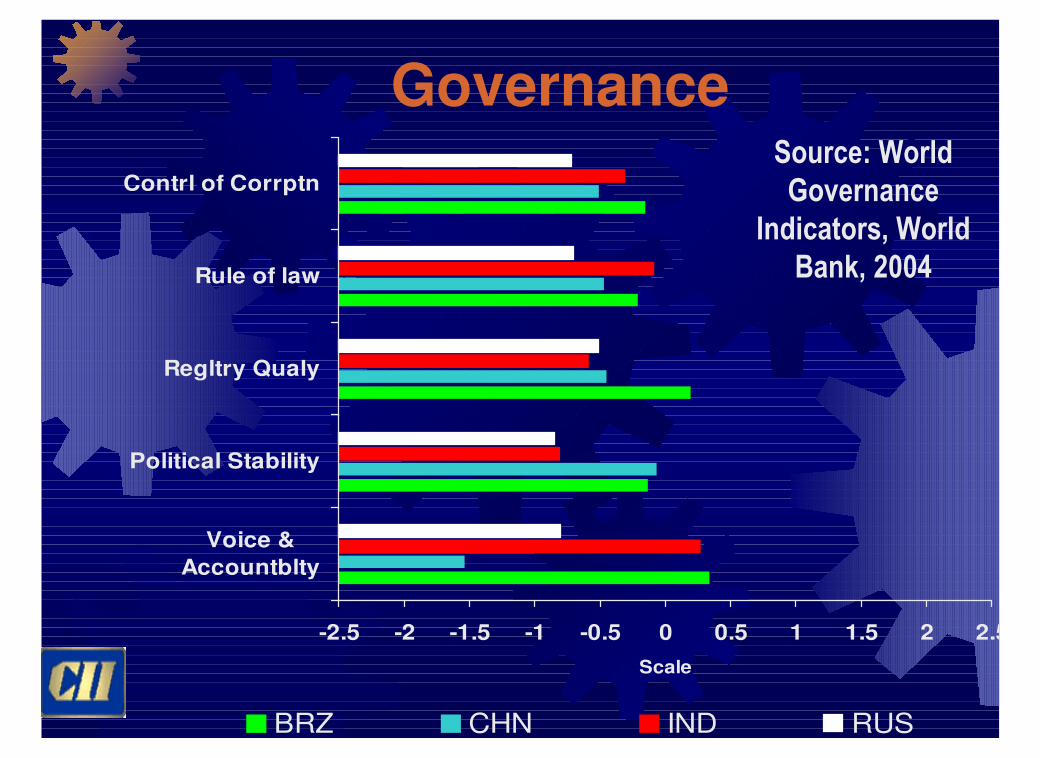
-2.5 -2 -1.5 -1 -0.5 0 0.5 1 1.5 2 2.5
Voice &
Accountblty
Political Stability
Regltry Qualy
Rule of law
Contrl of Corrptn
Scale
BRZ CHN IND RUS
Governance Source: World Governance
Indicators, World Bank, 2004

Investor Confidence
India climbed up 3 places in one year, to be the 3rd most favoured FDI destination
Constraints

Oil Price Rise & ImportsCrude oil price
Petroleum crude
& products imports
$/barrel Rs.crore
Mar-92 13123.12
Mar-93 4637.77
Mar-94 14.85 4398.89
Mar-95 18.37 5020.07
Mar-96 19.81 8049.97
Mar-97 22.84 9746.08
Mar-98 15.69 6941.78
Mar-99 13.05 6682.31
Mar-00 28.82 22269.13
Mar-01 28.79 14964.47
Mar-02 21.6 15910
Mar-03 34.02 23308
Mar-04 35.23 26600
Mar-05 49.65
Jun-05 53.05 41743.22
Year

Declin
ing
Tra
de B
ala
nce
-20000
-15000
-10000
-5000 0
5000
Mar-91
Mar-92
Mar-93
Mar-94
Mar-95
Mar-96
Mar-97
Mar-98
Mar-99
Mar-00
Mar-01
Mar-02
Mar-03
Mar-04
Mar-05
RsCR
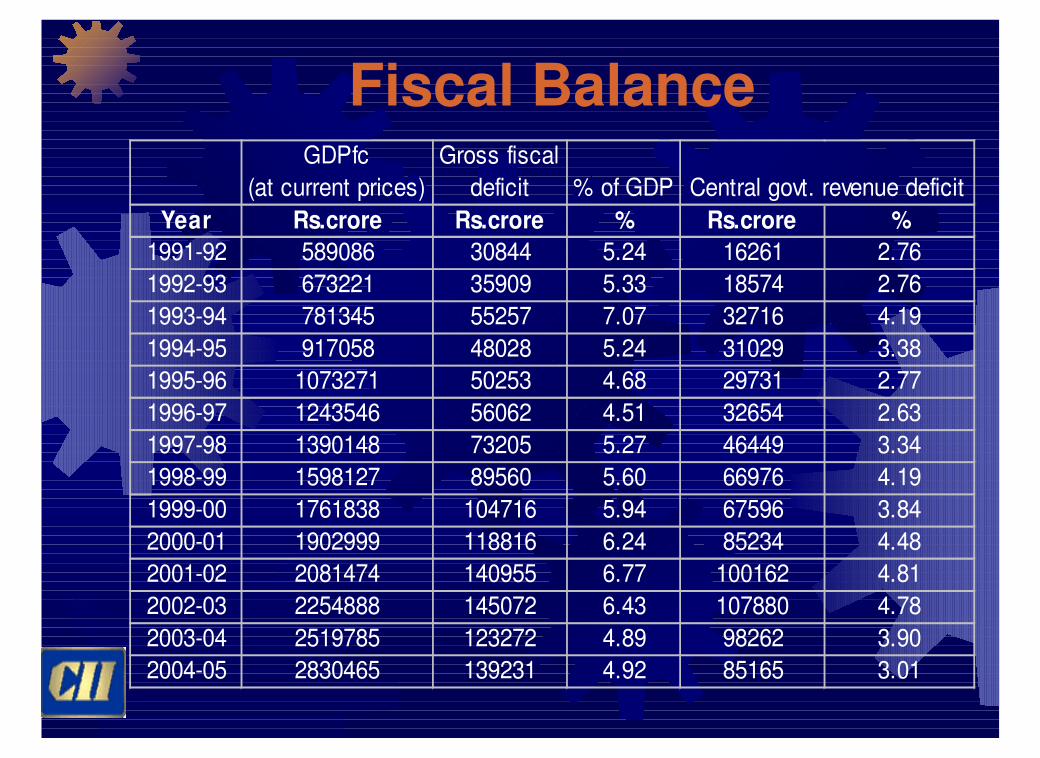
Fiscal BalanceGDPfc
(at current prices)
Gross fiscal
deficit % of GDP
Year Rs.crore Rs.crore % Rs.crore %
1991-92 589086 30844 5.24 16261 2.76
1992-93 673221 35909 5.33 18574 2.76
1993-94 781345 55257 7.07 32716 4.19
1994-95 917058 48028 5.24 31029 3.38
1995-96 1073271 50253 4.68 29731 2.77
1996-97 1243546 56062 4.51 32654 2.63
1997-98 1390148 73205 5.27 46449 3.34
1998-99 1598127 89560 5.60 66976 4.19
1999-00 1761838 104716 5.94 67596 3.84
2000-01 1902999 118816 6.24 85234 4.48
2001-02 2081474 140955 6.77 100162 4.81
2002-03 2254888 145072 6.43 107880 4.78
2003-04 2519785 123272 4.89 98262 3.90
2004-05 2830465 139231 4.92 85165 3.01
Central govt. revenue deficit

Performance of Central Sector Projects
2005 2004 2003
1 Ahead 16 28 32
2 On Schedule 65 73 77
3 Delayed 125 112 95
4 Without O.D.C and D.O.C 121 73 60
5 Total 327 286 264
6
Cost Overrun of Delayed
Projects (Rs crore) 25,388 26,689 27,674
7
Cost Overrun of Delayed
Projects (% of original
cost) 45.2 51.8 53.6
O.D.C
D.O.C
Source
: Original Date of Commissioning
: Date of Commissioning
: Ministry of Statistics & Programme Implementation, GOI
March
(No. of projects)

Thank You
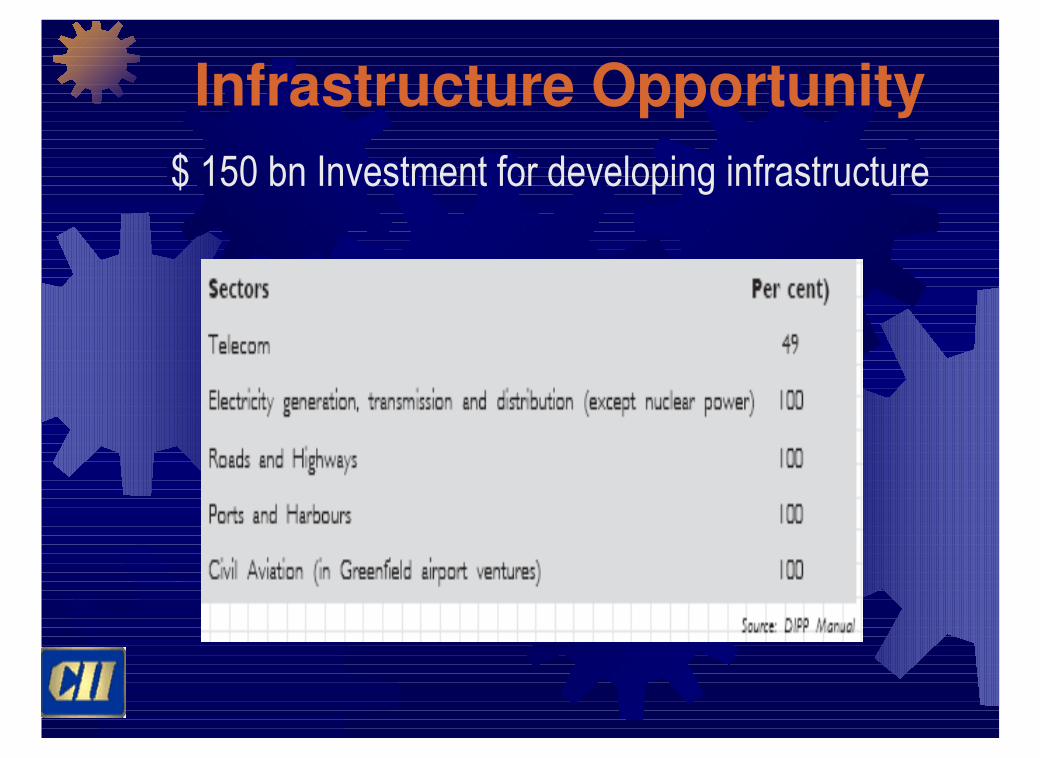
Infrastructure Opportunity
$ 150 bn Investment for developing infrastructure
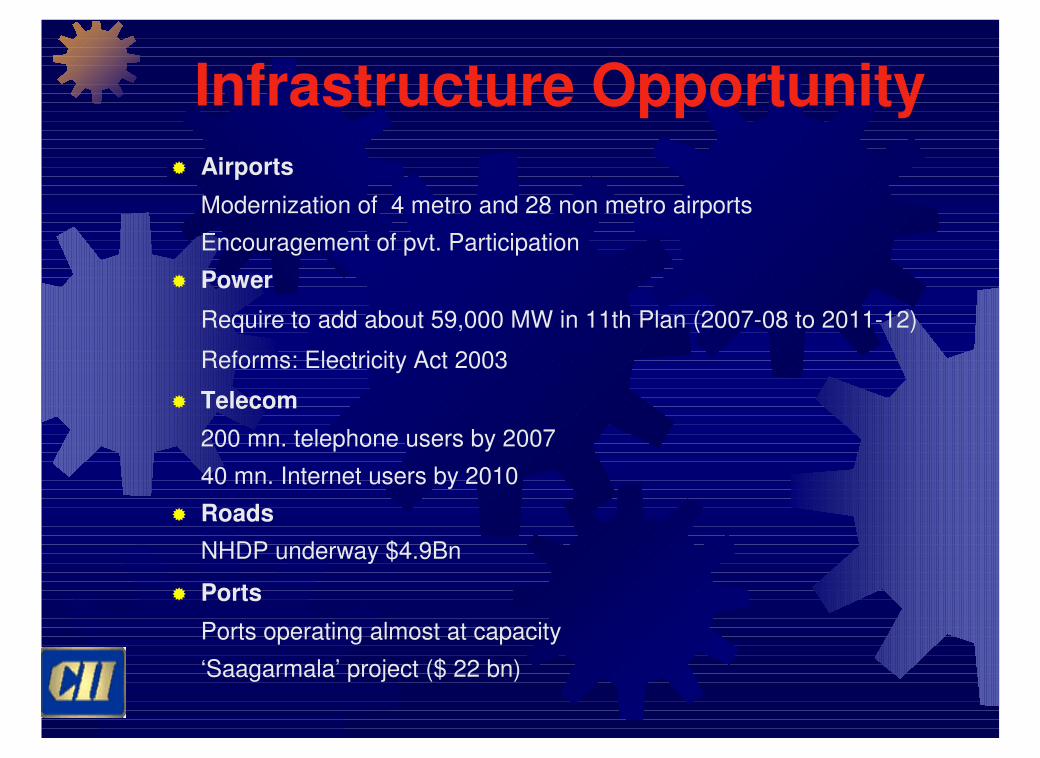
Infrastructure Opportunity� Airports
Modernization of 4 metro and 28 non metro airports
Encouragement of pvt. Participation
� Power
Require to add about 59,000 MW in 11th Plan (2007-08 to 2011-12)
Reforms: Electricity Act 2003
� Telecom
200 mn. telephone users by 2007
40 mn. Internet users by 2010
� Roads
NHDP underway $4.9Bn
� Ports
Ports operating almost at capacity
‘Saagarmala’ project ($ 22 bn)

FDI Policy
Activities for which an automatic route is not
available; government approval is required:
.Airports (beyond 74 %)
.Petroleum Sector-LNG transportation and
private sector oil refining
.Investing companies in Infrastructure & Services
Sector (49% equity cap)
.Defence & Strategic industries (26% equity cap)
.Atomic Minerals (74% equity cap) subject to
joint venture with Central/ State PSUs.
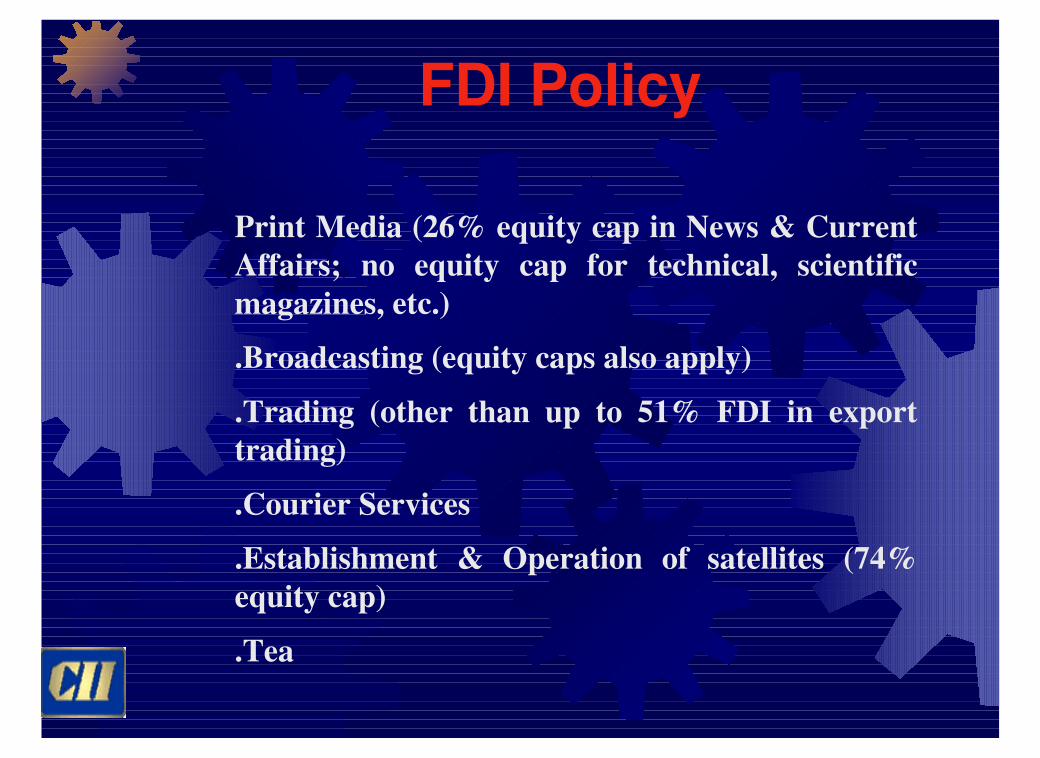
FDI Policy
Print Media (26% equity cap in News & Current
Affairs; no equity cap for technical, scientific
magazines, etc.)
.Broadcasting (equity caps also apply)
.Trading (other than up to 51% FDI in export
trading)
.Courier Services
.Establishment & Operation of satellites (74%
equity cap)
.Tea

FDI Policy
Automatic route is available but equity cap
applies:
.Private Sector Banking (74%)
.Insurance (26% equity cap)
.Basic & cellular telecommunications services
(74%)
.Domestic Airlines (49% equity cap subject to no
direct or indirect equity participation by foreign
airline)

FDI Policy
.ISPs with gateways, radio-paging & end-to-end
bandwidth (up to 49%)
.Coal & lignite mining (74%)
.Export Trading (up to 51%)
.Mining of diamonds and precious stones (74%)
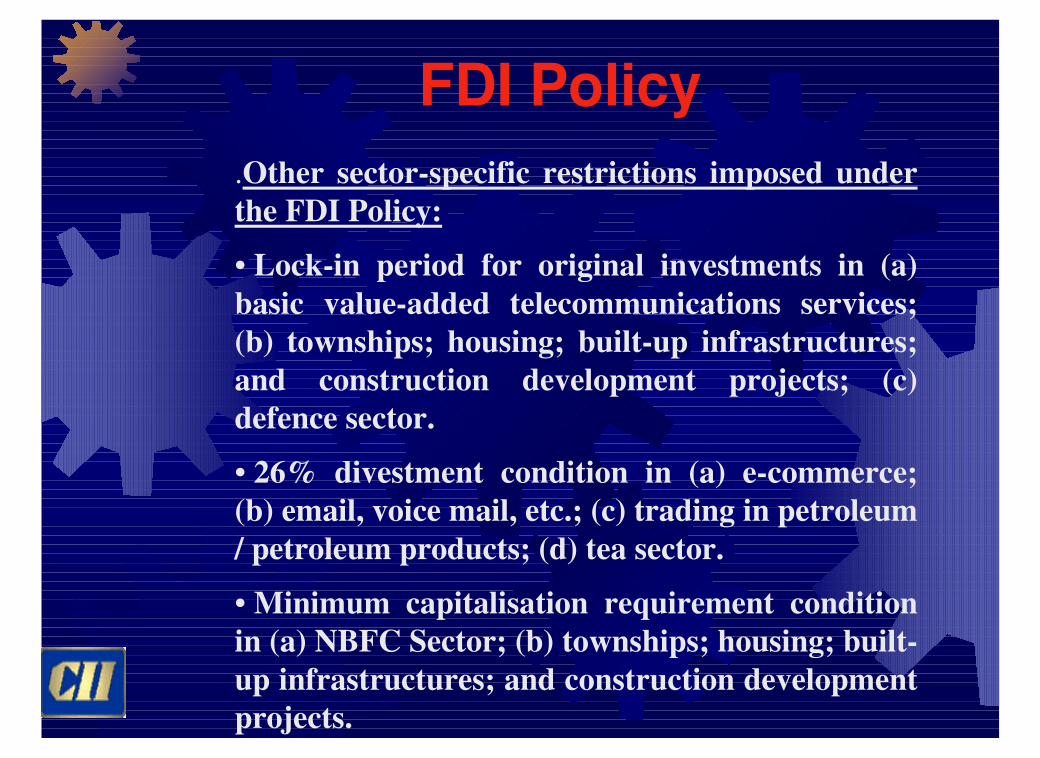
FDI Policy
.Other sector-specific restrictions imposed under
the FDI Policy:
• Lock-in period for original investments in (a)
basic value-added telecommunications services;
(b) townships; housing; built-up infrastructures;
and construction development projects; (c)
defence sector.
• 26% divestment condition in (a) e-commerce;
(b) email, voice mail, etc.; (c) trading in petroleum
/ petroleum products; (d) tea sector.
• Minimum capitalisation requirement condition
in (a) NBFC Sector; (b) townships; housing; built-
up infrastructures; and construction development
projects.

Net Invisible Inflows
-5000
0
5000
10000
15000
20000
25000
30000
1979
-80
1981
-82
1983
-84
1985
-86
1987
-88
1989
-90
1991
-92
1993
-94
1995
-96
1997
-98
1999
-00
2001
-02
2003
-04
$ Bn.
-0.5
0
0.5
1
1.5
2
2.5
3
3.5
4
4.5
5% of GDP
Net Inv. Earnings % GDP
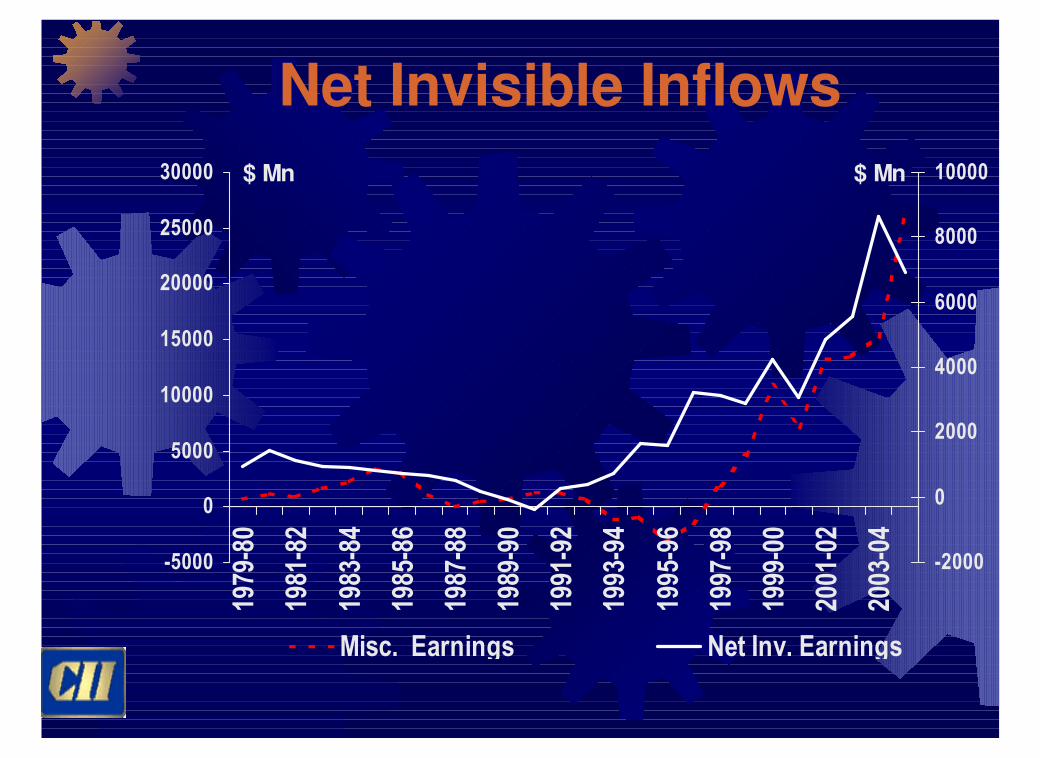
Net Invisible Inflows
-5000
0
5000
10000
15000
20000
25000
30000
1979-80
1981-82
1983-84
1985-86
1987-88
1989-90
1991-92
1993-94
1995-96
1997-98
1999-00
2001-02
2003-04
$ Mn
-2000
0
2000
4000
6000
8000
10000$ Mn
Misc. Earnings Net Inv. Earnings
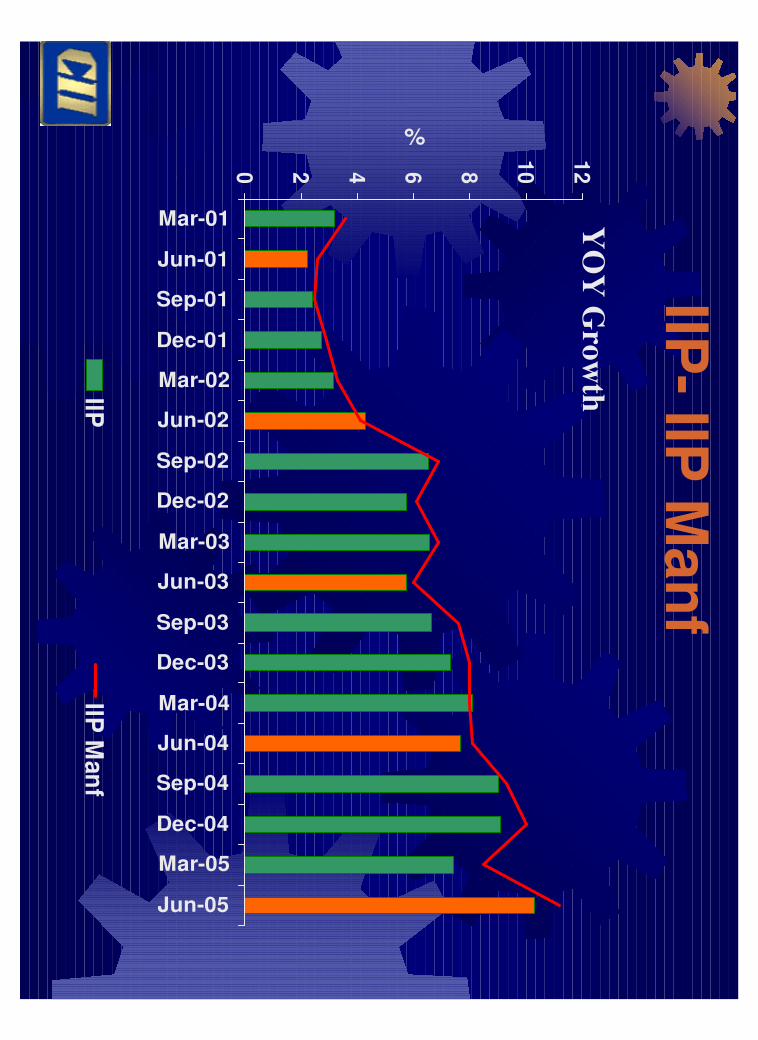
0 2 4 6 8
10
12
Mar-01
Jun-01
Sep-01
Dec-01
Mar-02
Jun-02
Sep-02
Dec-02
Mar-03
Jun-03
Sep-03
Dec-03
Mar-04
Jun-04
Sep-04
Dec-04
Mar-05
Jun-05
%
IIP
IIP M
an
f
IIP-
IIPM
an
f
YO
Y G
row
th