DR MIRANDA ORR (Orcid ID : 0000-0002-0418-2724) Article ... · (Correia-Melo et al., 2016; Hutter...
38
Accepted Article This article has been accepted for publication and undergone full peer review but has not been through the copyediting, typesetting, pagination and proofreading process, which may lead to differences between this version and the Version of Record. Please cite this article as doi: 10.1111/acel.12840 This article is protected by copyright. All rights reserved. DR MIRANDA ORR (Orcid ID : 0000-0002-0418-2724) Article type : Original Paper 1. Tau protein aggregation is associated with cellular senescence in the brain. 2. Nicolas Musi 1,2,3,† , Joseph M. Valentine 1,† , Kathryn R. Sickora 1 , Eric Baeuerle 1 , Cody S. Thompson 1 , Qiang Shen 4 , Miranda E. Orr 1,2,3* 3 . 1 Barshop Institute for Longevity and Aging Studies, University of Texas Health Science Center at San Antonio, 15355 Lambda Drive, San Antonio, TX, 78245, USA. 2 San Antonio Geriatric Research, Education and Clinical Center, South Texas Veterans Health Care System, 7400 Merton Minter, San Antonio, TX, 78229, USA. 3 Glenn Biggs Institute for Alzheimer’s & Neurodegenerative Diseases, 7400 Merton Minter, San Antonio, TX, 78229, USA. 4 Research Imaging Institute, University of Texas Health Science Center San Antonio, 7703 Floyd Curl Drive, San Antonio, TX, 78229, USA. † These authors contributed equally. 4. *Correspondence should be addressed to MEO [email protected] Miranda E. Orr, PhD Barshop Institute for Longevity and Aging Studies 15355 Lambda Drive STCBM 2.100.05 San Antonio, TX 78245 Phone: (210) 562-6117
Transcript of DR MIRANDA ORR (Orcid ID : 0000-0002-0418-2724) Article ... · (Correia-Melo et al., 2016; Hutter...

Acc
epte
d A
rtic
le
This article has been accepted for publication and undergone full peer review but has not
been through the copyediting, typesetting, pagination and proofreading process, which may
lead to differences between this version and the Version of Record. Please cite this article as
doi: 10.1111/acel.12840
This article is protected by copyright. All rights reserved.
DR MIRANDA ORR (Orcid ID : 0000-0002-0418-2724)
Article type : Original Paper
1. Tau protein aggregation is associated with cellular senescence in the brain.
2. Nicolas Musi1,2,3,†, Joseph M. Valentine1,†, Kathryn R. Sickora1, Eric Baeuerle1, Cody S.
Thompson1, Qiang Shen4, Miranda E. Orr1,2,3*
3. 1Barshop Institute for Longevity and Aging Studies, University of Texas Health Science
Center at San Antonio, 15355 Lambda Drive, San Antonio, TX, 78245, USA.
2San Antonio Geriatric Research, Education and Clinical Center, South Texas Veterans
Health Care System, 7400 Merton Minter, San Antonio, TX, 78229, USA.
3Glenn Biggs Institute for Alzheimer’s & Neurodegenerative Diseases, 7400 Merton Minter,
San Antonio, TX, 78229, USA.
4Research Imaging Institute, University of Texas Health Science Center San Antonio, 7703
Floyd Curl Drive, San Antonio, TX, 78229, USA.
†These authors contributed equally.
4. *Correspondence should be addressed to MEO [email protected]
Miranda E. Orr, PhD
Barshop Institute for Longevity and Aging Studies
15355 Lambda Drive
STCBM 2.100.05
San Antonio, TX 78245
Phone: (210) 562-6117
Acc
epte
d A
rtic
le
This article is protected by copyright. All rights reserved.
5. [email protected]; [email protected]; [email protected];
[email protected]; [email protected]
6. Tau aggregation induces cellular senescence in the brain.
7. tau, neurodegeneration, cellular senescence, aging, Alzheimer’s disease, senolytic
Summary
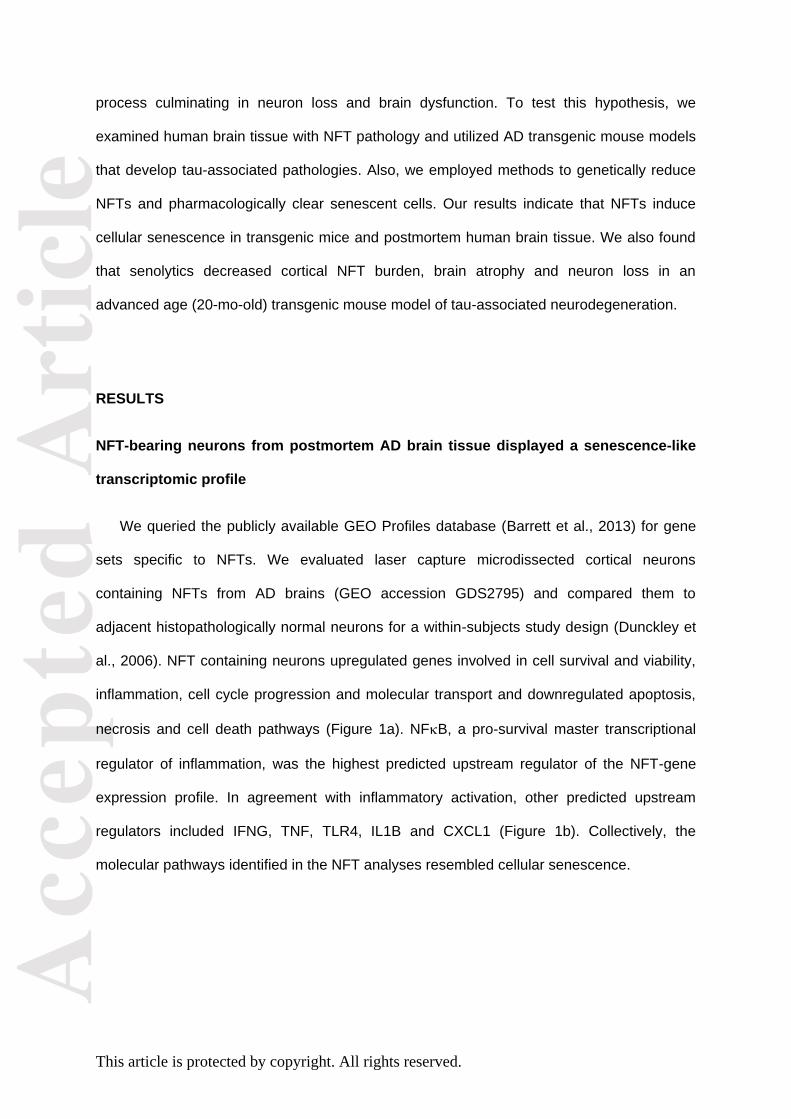
Tau protein accumulation is the most common pathology among degenerative
brain diseases, including Alzheimer’s disease (AD), progressive supranuclear palsy
(PSP), traumatic brain injury (TBI) and over twenty others. Tau-containing
neurofibrillary tangle (NFT) accumulation is the closest correlate with cognitive
decline and cell loss (Arriagada et al., 1992), yet mechanisms mediating tau toxicity
are poorly understood. NFT formation does not induce apoptosis (de Calignon et al.,
2009), which suggests secondary mechanisms are driving toxicity. Transcriptomic
analyses of NFT-containing neurons microdissected from postmortem AD brain
revealed an expression profile consistent with cellular senescence. This complex
stress response induces aberrant cell cycle activity, adaptations to maintain survival,
cellular remodeling, and metabolic dysfunction. Using four AD transgenic mouse
models, we found that NFTs, but not A plaques, display a senescence-like
phenotype. Cdkn2a transcript level, a hallmark measure of senescence, directly
correlated with brain atrophy and NFT burden in mice. This relationship extended to
postmortem brain tissue from humans with PSP to indicate a phenomenon common
to tau toxicity. Tau transgenic mice with late stage pathology were treated with
senolytics to remove senescent cells. Despite the advanced age and disease
progression, MRI brain imaging and histopathological analyses indicated a reduction
in total NFT density, neuron loss and ventricular enlargement. Collectively, these
findings indicate a strong association between the presence of NFTs and cellular

Acc
epte
d A
rtic
le
This article is protected by copyright. All rights reserved.
senescence in the brain, which contributes to neurodegeneration. Given the
prevalence of tau protein deposition among neurodegenerative diseases, these
findings have broad implications for understanding, and potentially treating, dozens
of brain diseases.
INTRODUCTION
The underlying processes driving chronic neurodegeneration in Alzheimer’s disease
(AD) and related neurodegenerative disorders are largely unknown and disease-modifying
treatments remain elusive. The accumulation of tau protein is the most common pathology
among these diseases making tau an appealing molecular target for intervention (Orr et al.,
2017). Tau-containing neurofibrillary tangles (NFTs) closely track with disease severity in
human AD ((Arriagada et al., 1992); however, NFT-containing neurons are long-lived and do
not induce immediate cell death (de Calignon et al., 2009). In silico modeling predicts that
NFT-containing neurons may survive decades (Morsch et al., 1999), which suggests that
non-cell autonomous mechanisms may contribute to NFT-associated toxicity.
Experimental data from various studies indicate that tau pathology may be associated
with cellular senescence, a fundamental aging mechanism shown to contribute to several
chronic diseases (recent review Kirkland and Tchkonia, 2017). This complex stress
response induces a near permanent cell cycle arrest, adaptations to maintain survival,
cellular remodeling, metabolic dysfunction and disruption to surrounding tissue to the
secretion of toxic molecules (Childs et al., 2016). While many of these features have been
described in AD brains and transgenic animal models throughout the literature (e.g.,
aberrant cell cycle activity, p16INK4A co-localization with NFTs (Arendt et al., 1996),
decreased lamin B1, heterochromatin relaxation (Frost et al., 2016), etc.,); a role for cellular
senescence in neurodegeneration has not been investigated. We hypothesized that tau
accumulation may activate this stress response, and thereby initiate a chronic degenerative
Acc
epte
d A
rtic
le
This article is protected by copyright. All rights reserved.
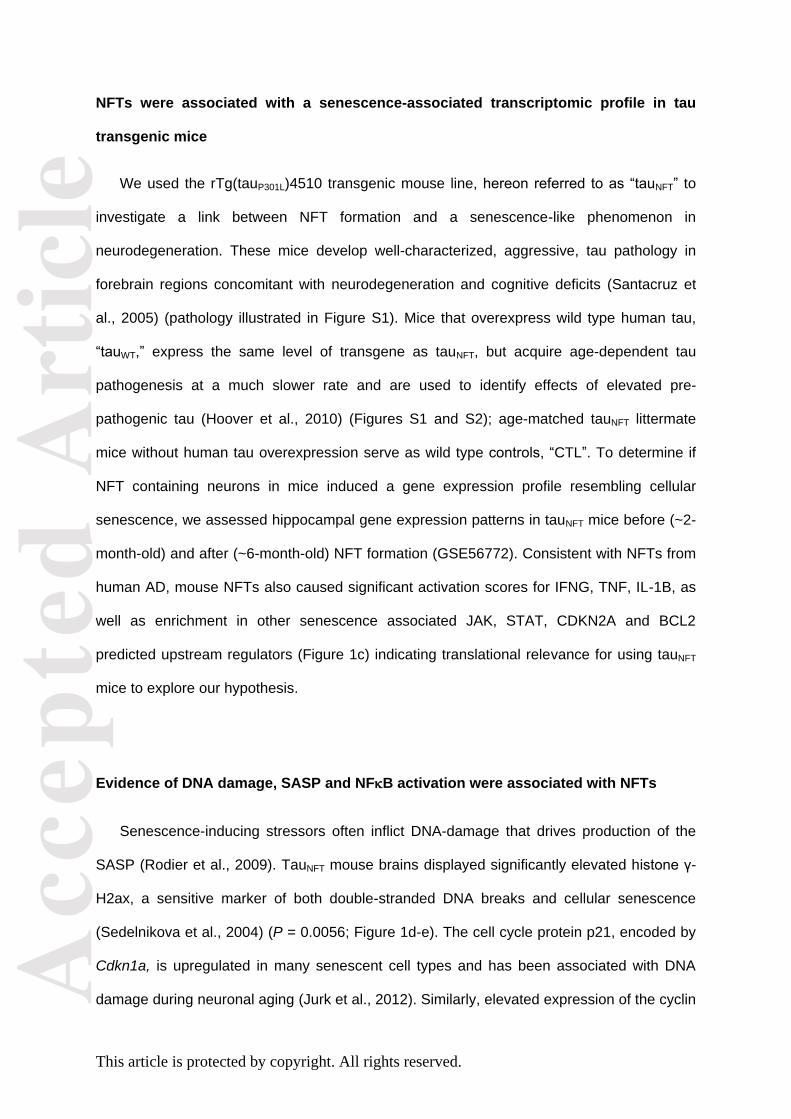
process culminating in neuron loss and brain dysfunction. To test this hypothesis, we
examined human brain tissue with NFT pathology and utilized AD transgenic mouse models
that develop tau-associated pathologies. Also, we employed methods to genetically reduce
NFTs and pharmacologically clear senescent cells. Our results indicate that NFTs induce
cellular senescence in transgenic mice and postmortem human brain tissue. We also found
that senolytics decreased cortical NFT burden, brain atrophy and neuron loss in an
advanced age (20-mo-old) transgenic mouse model of tau-associated neurodegeneration.
RESULTS
NFT-bearing neurons from postmortem AD brain tissue displayed a senescence-like
transcriptomic profile
We queried the publicly available GEO Profiles database (Barrett et al., 2013) for gene
sets specific to NFTs. We evaluated laser capture microdissected cortical neurons
containing NFTs from AD brains (GEO accession GDS2795) and compared them to
adjacent histopathologically normal neurons for a within-subjects study design (Dunckley et
al., 2006). NFT containing neurons upregulated genes involved in cell survival and viability,
inflammation, cell cycle progression and molecular transport and downregulated apoptosis,
necrosis and cell death pathways (Figure 1a). NFB, a pro-survival master transcriptional
regulator of inflammation, was the highest predicted upstream regulator of the NFT-gene
expression profile. In agreement with inflammatory activation, other predicted upstream
regulators included IFNG, TNF, TLR4, IL1B and CXCL1 (Figure 1b). Collectively, the
molecular pathways identified in the NFT analyses resembled cellular senescence.
Acc
epte
d A
rtic
le
This article is protected by copyright. All rights reserved.
NFTs were associated with a senescence-associated transcriptomic profile in tau
transgenic mice
We used the rTg(tauP301L)4510 transgenic mouse line, hereon referred to as “tauNFT” to
investigate a link between NFT formation and a senescence-like phenomenon in
neurodegeneration. These mice develop well-characterized, aggressive, tau pathology in
forebrain regions concomitant with neurodegeneration and cognitive deficits (Santacruz et
al., 2005) (pathology illustrated in Figure S1). Mice that overexpress wild type human tau,
“tauWT,” express the same level of transgene as tauNFT, but acquire age-dependent tau
pathogenesis at a much slower rate and are used to identify effects of elevated pre-
pathogenic tau (Hoover et al., 2010) (Figures S1 and S2); age-matched tauNFT littermate
mice without human tau overexpression serve as wild type controls, “CTL”. To determine if
NFT containing neurons in mice induced a gene expression profile resembling cellular
senescence, we assessed hippocampal gene expression patterns in tauNFT mice before (~2-
month-old) and after (~6-month-old) NFT formation (GSE56772). Consistent with NFTs from
human AD, mouse NFTs also caused significant activation scores for IFNG, TNF, IL-1B, as
well as enrichment in other senescence associated JAK, STAT, CDKN2A and BCL2
predicted upstream regulators (Figure 1c) indicating translational relevance for using tauNFT
mice to explore our hypothesis.
Evidence of DNA damage, SASP and NFB activation were associated with NFTs
Senescence-inducing stressors often inflict DNA-damage that drives production of the
SASP (Rodier et al., 2009). TauNFT mouse brains displayed significantly elevated histone γ-
H2ax, a sensitive marker of both double-stranded DNA breaks and cellular senescence
(Sedelnikova et al., 2004) (P = 0.0056; Figure 1d-e). The cell cycle protein p21, encoded by
Cdkn1a, is upregulated in many senescent cell types and has been associated with DNA
damage during neuronal aging (Jurk et al., 2012). Similarly, elevated expression of the cyclin
Acc
epte
d A
rtic
le
This article is protected by copyright. All rights reserved.
dependent kinase inhibitor 2a, Cdkn2a, is one of the most robust markers of cellular
senescence, and its protein product, p16INK4A, co-localizes with NFTs in human AD (Arendt
et al., 1996). Because anti-p21 and anti-p16INK4A antibodies are notoriously poor in mouse
tissue, we exclusively measured Cdkn1a and Cdkn2a gene expression. TauNFT brains
expressed 3-fold higher Cdkn1a than control mice (P = 0.0178, Figure 1f), which was
replicated in a separate mouse cohort (P = 0.0086, Figure S1f). Moreover, Cdkn2a was
expressed at levels 2.7- and 2.6-fold higher in tauNFT than CTL and tauWT, respectively (P =
0.0303 and P = 0.0352, respectively; Figure 1g); this effect was replicated in an
independent mouse cohort (P = 0.0016, Figure S1g).
Senescent cells exert chronic tissue degeneration through secretion of toxic SASP
(Coppe et al., 2010). Consistent with the transcriptomic profile in human NFT-bearing
neurons and mouse brain tissue (Figure 1a-c), SASP genes were found to be upregulated in
tauNFT brains, i.e., Il1b was 4- and 2-fold higher than CTL and tauWT, respectively; and Cxcl1
was 4-fold higher than both control genotypes; Tnfa was 13- and 8-fold higher than CTL and
tauWT, respectively; Tlr4 was 3-fold higher than both control genotypes (Figure 2a-d). Further
gene expression analyses allowed us to define an array specific to tau-pathology in tauNFT
brains (Figure S2e). NFB regulates the pro-survival, pro-inflammatory SASP gene
expression profile characteristic of cellular senescence (Salminen & Kaarniranta, 2011).
Consistent with NFB pathway activation and the SASP profile, nuclear localized NFB p65
was significantly increased in tauNFT brains (Figure 2e-f). In all measures, tauWT mice were
not significantly different from CTL. These results suggest that insoluble tau and/or post-
translational modifications associated with insoluble tau, but not general tau overexpression,
were responsible for the senescence-associated response (i.e., DNA damage, NFB
activation and upregulated SASP; Figures 1 and S2).
Acc
epte
d A
rtic
le
This article is protected by copyright. All rights reserved.
SA -gal activity did not correlate with NFTs or brain atrophy.
In regenerative tissues and in vitro cultures, senescent cells may exhibit SA -gal
activity, which is a measure of lysosomal galactoside activity at pH 6.0 and indicative of
altered/expanded lysosomal compartments (Severino et al., 2000). Examination of the gene
that codes for the hydrolase enzyme, galactosidase beta ( 1 (Glb1), revealed that tauNFT
mice expressed higher Glb1 gene expression than controls (Figure S3). However, staining
for gal hydrolase activity at pH 6.0 revealed fewer positive cells than controls. Further, SA
al reactive cells were observed even in very young mice (1-month-old) and the number
of SA gal reactive cells was positively correlated with brain mass (R2: 0.4852, P = 0.0039
Figure S3). While our results indicate that SA gal reactivity did not correlate with other
senescence markers or brain atrophy, the observed increase in Glb1 gene expression along
with a decrease in lysosomal activity at pH 6.0, compared to controls, is suggestive of tau-
associated lysosomal defects, which has been reported by others (Caballero et al., 2018; Y.
Wang et al., 2009).
NFT-containing brain tissue displayed aberrant cellular bioenergetics
Mitochondrial dysfunction is obligatory for SASP production and cellular senescence
(Correia-Melo et al., 2016; Hutter et al., 2004). To examine mitochondrial bioenergetics, we
performed high-resolution respirometry to yield accurate quantitative measurements of
oxidative phosphorylation in response to specific substrates for complex I, complex II, fat
oxidation and electron-transfer system (ETS) capacity. Across genotypes, we compared
cortex, hippocampus and cerebellum. This allowed for evaluation of specific differences in
oxygen consumption due to elevated transgenic tau (comparing CTL with tauwt and tauNFT),
pathogenic tau specific effects (comparing tauwt to tauNFT), as well as the interaction among
brains regions and tau expression (e.g., cortex and hippocampus express transgenic tau and
Acc
epte
d A
rtic
le
This article is protected by copyright. All rights reserved.
develop NFTs, but cerebellum does not). We found a significant genotype main effect for
oxygen flux in both cortex and hippocampus, indicating that global respiratory capacity was
impaired in NFT containing brain regions (P < 0.0001; Figure 3), an effect primarily driven by
CI+CII respiration coupled to ATP production (cortex: P = 0.0034; hippocampus: P = 0.0215;
Figure 2g and h, respectively), and uncoupled or maximum respiratory capacity (cortex: P =
0.0248; hippocampus: P = 0.0261; Figure 3g and h, respectively). These changes were
different between tauNFT and each of the control mouse lines, CTL and tauWT mice. Because
tauWT and tauNFT mice express comparable total tau levels, alterations to respiratory capacity
cannot be attributed to tau overexpression. Citrate synthase activity is a surrogate marker of
total mitochondrial content/mass, and was similar across genotypes and brain regions
(Figure 3i) suggesting that the defects in cellular respiration were due to altered
mitochondrial quality, not content/mass. Moreover, tauNFT cerebellum did not show deficits in
cellular respiration or Cdkn2a upregulation (Figure 3j, k), indicating that senescence-
associated mitochondrial dysfunction was present only in brain regions with persistent
pathogenic tau expression.
Cdkn2a upregulation occurred with NFT onset and correlated with NFT density
We pursued multiple genetic approaches to determine whether senescence was
mechanistically linked to NFT density, NFT onset, or merely protein accumulation. Reducing
NFT load in age-matched animals is not feasible; once NFTs form, they cannot be
therapeutically eliminated. However, genetically ablating endogenous mouse tau
(microtubule associated protein tau, Mapt) reduces NFT pathology and neurodegeneration in
tauNFT mice (tauNFT-Mapt0/0) (Wegmann et al., 2015). The reduced tau pathology
corresponded with 60% lower Cdkn2a expression (P = 0.0041, Figure 4a), decreased SASP
(Figure S4) and decreased brain atrophy (tauNFT-Mapt0/0: 0.4058 ± 0.009 versus age-
matched tauNFT Maptwt/wt: 0.3451 ± 0.0116; 17.5% difference, P = 0.0143, Figure 4b). TauNFT
Acc
epte
d A
rtic
le
This article is protected by copyright. All rights reserved.
mice develop aggressive tauopathy with NFT formation in early life, and show a
senescence-associated transcriptomic profile with NFT onset (Figure 1c). To detect subtle
cellular changes associated with different stages of age-associated NFT development and
progression, we focused on tauWT mice between 16-28-months-old. Cdkn2a gene
expression increased significantly during this age interval, and at 28 months of age tauWT
Cdkn2a expression was similar to that of 16-month-old tauNFT mice (Figure 4c).
Concomitantly, at this age, tauWT mice developed NFTs as visualized by Bielschowsky silver
staining and immunofluorescence analyses (Figure 4d). These results provide additional
evidence for the association between NFT formation and senescence-associated Cdkn2a
upregulation.
Cdkn2a upregulation was specific to NFT tau pathology and correlated with brain
atrophy
To determine if Cdkn2a expression was driven specifically by NFTs, or whether AD-
associated Aprotein deposition also increased Cdkn2a, we utilized 3xTgAD mice that
acquire both AD-associated pathologies with Adeposition and NFT onset at 6 and 18-
months of age, respectively (Oddo et al., 2003). In 15-month-old mice with heavy
Adeposition and phosphorylated tau, but lacking NFT pathology (Orr et al., 2014), Cdkn2a
expression was not elevated (Figure 4e). These data indicate that Cdkn2a expression was
neither a response to general protein accumulation, nor to pre-NFT tau pathology, but
instead required the presence of NFTs. Further, when plotted against brain weight, Cdkn2a
expression was a strong predictor of brain atrophy across mouse lines (P < 0.0001, R2 =
0.5615; Figure 4f).
Acc
epte
d A
rtic
le
This article is protected by copyright. All rights reserved.
CDKN2A was upregulated in NFT-containing brains from patients with progressive
supranuclear palsy
Tau pathology is common among >20 brain diseases. To investigate whether the
findings in human AD neurons and transgenic mice translated to human brains with pure
tauopathy (i.e., NFT pathology without other protein aggregates such as A, we acquired
human brain tissue with histopathologically confirmed progressive supranuclear palsy (PSP)
(Table 1 for patient characteristics). PSP is an age-associated tauopathy that clinically
manifests as parkinsonism with additional motor abnormalities and cognitive dysfunction (Orr
et al., 2017), and is neuropathologically defined by accumulation of four-repeat (4R) tau,
NFTs, gliosis and neurodegeneration (Flament et al., 1991). Consistent with the results from
transgenic mice, CDKN2A was upregulated in PSP brains (P = 0.0415, Figure 4g) and
expression correlated with NFT deposition, specifically in the parietal lobe (ANOVA, P =
0.0008; Kendall’s Tau rank correlation P = 0.059, Figure 4h). Moreover, one individual with
the worst cognitive performance, Mini–Mental State Examination (MMSE) score of 12,
displayed the highest level of CDKN2A expression, and high molecular weight tau (Figure
4i). Collectively, these findings led us to conclude that NFTs were directly linked to
senescence-associated Cdkn2a upregulation, which in turn was a strong predictor of
neurodegeneration and cognitive decline.
Senolytic treatment reduced NFT burden and neurodegeneration
Senescent cells comprise a small proportion of total cellular makeup within a tissue
(~15%) (Herbig et al., 2006). Nonetheless, genetically (Baker et al., 2011) or
pharmacologically (Zhu et al., 2015) clearing even a small percentage of these cells
improves healthspan and delays age-associated diseases (Kirkland et al., 2017). We used
some of the best-characterized senolytics to date, dasatinib and quercetin (DQ), to
determine the utility of targeting cellular senescence to treat tau-associated

Acc
epte
d A
rtic
le
This article is protected by copyright. All rights reserved.
neurodegeneration in late-life. Beginning at 20-months-old, tauNFT-Mapt0/0 and non-
transgenic-Mapt0/0 mice were randomized to receive vehicle or DQ at bi-weekly intervals for
3 months. When mice were 23-months-old, brain structure and cerebral blood flow were
analyzed with MRI and postmortem histopathology (Figure 5 and S5). Consistent with
senescent cell removal, intermittent DQ treatment significantly reduced the number of NFT-
containing cortical neurons (P < 0.0001, 5% reduction; Figure 5a,b). Relative to the existing
neuronal population at this advanced age, gene expression of the NFT-associated
senescence gene array was reduced by DQ (P = 0.0006; Figure S6a). Among these genes,
those highly sensitive to NFT-dependent upregulation (Data S2) were most affected to NFT
removal by DQ (i.e., Tlr4: P = 0.0459 and Cxcl1: P = 0.0142; Figure 5c; S6). NFTs are highly
correlated with the rate of ventricular enlargement, an indicator of brain atrophy and hallmark
of AD pathology (Silbert et al., 2003). TauNFT mice recapitulate this pathology on a wild type
(Figure S1) and Mapt0/0 background (P = 0.0007; Figure 5d). The DQ-dependent reduction in
cortical NFTs corresponded with decreased ventricular volume pathology (28% decrease, P
= 0.05, Figure 5d, f) and a reduction in cortical brain atrophy (compared to controls: P =
0.0092 and P = 0.0274, vehicle and DQ, respectively; Figure S5a). The absence of a full
rescue of ventricular enlargement to that of control animals was not completely unexpected
considering the severity of disease and age of the animals when treatment was initiated.
The MRI images also revealed white matter hyperintensity (WMH) pathology, areas of
increased brightness on T2-weighted MRIs (Figure S5b, c). WMH is driven by cerebral small
vessel disease, which causes chronic ischemia and increased risk of cognitive decline and
dementia (reviewed, (Prins & Scheltens, 2015)). TauNFT-Mapt0/0 vehicle-treated mice
displayed significant WMH pathology (P = 0.0341; Figure S5b, c), which is consistent with
recent reports of NFT-induced vascular abnormalities (Bennett et al., 2018). However,
tauNFT-Mapt0/0 mice treated with DQ did not display WMH volumes statistically different than
control mice (P = 0.2458; Figure S5b, c). Aberrant cerebral blood flow is a functional defect
that occurs in AD and tauNFT mice, and is closely associated with cognitive impairment (Wells

Acc
epte
d A
rtic
le
This article is protected by copyright. All rights reserved.
et al., 2015). In brain tissue with tau pathology, cerebral blood flow was elevated in tauNFT
Mapt0/0 vehicle-treated mice (21% whole brain, P = 0.045; cortex, 48.7%, P = 0.051, Figure
S5d, e), and consistent with previous reports of tauNFT mice on a Mapt+/+ background (Wells
et al., 2015). DQ improved cerebral blood flow in tauNFT Mapt0/0 mice such that cerebral
blood flow was no longer statistically different from controls (Figure S5d, e). Overall, a
composite analysis of DQ treatment in tauNFT mice revealed a significant global benefit on
cerebral blood flow and neurodegeneration (P = 0.0138; Figure S5f).
To elucidate whether the DQ-dependent reduction in NFT burden, SASP expression and
improvements to brain structure and cerebral blood flow conferred neuroprotection, we
measured levels of cell-type specific protein expression in the brain. DQ-treated mice
expressed significantly higher levels of neuronal proteins (NeuN: 25%, synaptophysin:
40.8%; PSD95: 38.5%; P < 0.05; Figure 5f-i). The astrocyte protein GFAP was unchanged,
while microglia Iba1 expression was elevated (Iba1: 40%, P = 0.0013; Figure S6b-d)
suggesting that DQ-mediated neuroprotection and decreased SASP was not derived from a
reduction in pro-inflammatory glia (astrocytes or microglia) but instead associated with fewer
NFT-containing neurons. Moreover, DQ did not alter total human tau protein levels indicating
the effects were not driven by changes in tau protein expression, but rather insoluble NFTs
or associated post-translational modifications (Figure S7). Collectively, our data suggest that
cyclic senescent cell removal of NFTs with DQ produced long-lasting global effects on brain,
as evidenced by histopathology and MRI analyses.
Discussion
The inability to effectively treat tau-associated diseases arises, in part, from a limited
understanding of processes driving neurodegeneration during the prodromal period. We
have identified cellular senescence, the quintessence of latent tissue degeneration, as a

Acc
epte
d A
rtic
le
This article is protected by copyright. All rights reserved.
cellular mechanism upregulated in tau-associated neurodegeneration. Findings in NFT-
developing transgenic mice, postmortem human AD and PSP brain tissue support this
concept.
Cellular senescence is an elaborate stress response that varies across tissues, and even
among cell types within tissues. Our experimental data provide an initial report of features
consistent with cellular senescence in the brain (i.e., transcriptomics, upregulated Cdkn1a
and Cdkn1a, SASP molecules and altered cellular bioenergetics). A complete depiction of
tau-associated cellular senescence will require several follow-up studies guided by these
results, and a close evaluation of already published data. For example, a cursory search of
literature has revealed aberrant HMGB1 (Nilson et al., 2017); loss of lamin B and
heterochromatin relaxation (Frost et al., 2016); and altered cellular morphology (Orr et al.,
2012) associated with tau pathology; all of which are consistent with cellular senescence.
Tau processing is complex and requires tight regulation to maintain neuronal viability.
Alterations to tau splice variant expression, post-translational modifications (e.g.,
phosphorylation, acetylation, glycosylation, conformational changes, oligomerization,
cleavage, etc), subcellular localization, etc., may result in neuronal dysfunction. As such,
pathogenic tau is observed in a spectrum of neurodegenerative diseases where its
histopathological characterization aids in clinical diagnoses. Our experimental results have
revealed a strong association between NFT pathology and a senescence-like phenotype.
However, we cannot exclude the possibility that other tau species and/or specific post-
translational modifications may also contribute to cellular senescence. The upstream
mediators driving tau-associated cellular senescence in AD and PSP also remain unknown;
however, it is tempting to speculate that tau-induced cell cycle re-entry may be involved
(Arendt, 2012). Aberrant cell cycle re-entry causes neuronal apoptosis and AD-associated
pathology (Park et al., 2007), and requires soluble tau (Seward et al., 2013). The observed
increase in NFT-associated Cdkn1a and Cdkn2a gene expression may allow stressed
neurons to abort cell cycle re-entry and enter a cellular state similar to cellular senescence.

Acc
epte
d A
rtic
le
This article is protected by copyright. All rights reserved.
In this way, NFTs formed in early pathogenic stages due to acute stress may initially protect
neurons from cell death, but then contribute to neurodegeneration later in life through
senescence-like mechanisms by altering the bioenergetic state of the brain and upregulating
the toxic SASP.
Pathogenic tau induces a traditional neuroinflammatory response by activating microglia
and astrocytes (for recent review (Laurent et al., 2018)). Our data suggest that NFT-
containing neurons may be active participants in perpetuating the inflammatory response as
well. Future studies are required to better understand the contribution of SASP to the overall
neuroinflammation phenotype common among many brain diseases. Nonetheless, our
findings suggest that therapeutically targeting cellular senescence effectively interrupted a
chronic neurodegenerative cascade to decrease NFT-associated pathology and improve
brain structure and aberrant cerebral blood flow even in the presence of established tau
pathology in a late-life advanced disease state. Overall our data provide evidence that
cellular senescence may be an underlying pathogenic process common among tauopathies,
which opens a new field of investigative research and offers a potential druggable target to
treat the >20 tau-associated neurodegenerative diseases.
METHODS
Mice. All animal experiments were carried out following National Institutes of Health and
University of Texas Health Science Center at San Antonio (UTHSCSA) Institutional Animal
Care and Use Committee guidelines. We used 16 to 32-month-old male and female rTg4510
and rTg21221 mice that reversibly express P301L mutant human tau or wild type human tau
4R02, respectively, on either a wild type or Mapt knockout Bl6/FVB genetic background
(Hoover et al., 2010; Santacruz et al., 2005; Wegmann et al., 2015). Non-transgene
expressing littermates from rTg4510 and rTg21221 are used as controls; since no
differences were found between these control lines, only littermates from rTg4510 are used
here (Extended Data Figure 1f-i). The mice were bred by Rose Pitstick and George A.
Acc
epte
d A
rtic
le
This article is protected by copyright. All rights reserved.
Carlson at McLaughlin Research Institute, Great Falls, MT. Mouse euthanasia, brain
dissection and preparation was performed as previously described (Orr et al., 2012; Orr et
al., 2014).
Ingenuity Pathway Analyses (IPA). The GEO accessions GDS2795 and GSE56772 were
accessed from the GEO Profiles database (Barrett et al., 2013; Dunckley et al., 2006) with
Rstudio version 1.0.143. Because the GDS2795 datset was a within subjects design, ratios
of NFT vs CTL gene expression were generated for each subject. Mean ratios of each gene
from GDS2795 and fold change values from GSE56772 were uploaded into IPA software
(IPA, QIAGEN Inc.,https://www.qiagenbioinformatics.com/products/ingenuity-pathway-
analysis). For GDS2795 GeneBank Accession IDs were used and 34910 out of 54675 genes
were identified by IPA software. The expression fold change cutoff value was set at 3 (both
down/upregulated) compressing the analyses to 3048 genes. For GSE56772 LIMMA
package was used to determine fold change and p-values. The P-value cutoff for IPA
analysis was set at P < 0.01 yielding 1294 transcripts, 738 down- and 556 up-regulated. We
utilized IPA causal analytic tools(Kramer et al., 2014) to elucidate predicted upstream
regulators, as well as disease and biological functions with significant z-scores enriched in
our data set.
Findings from GDS2795 were replicated with more stringent criteria (p < 0.05 for
NFT/CTL ratios with no fold change limit) allowing for 1715 genes to be uploaded into IPA
with similar results. Similarly, these findings were replicated a third time using the LIMMA
package, the most common method for microarray analysis. This method did not take into
account within subjects design. Using a P < 0.05, 1219 differentially regulated genes were
uploaded for IPA analyses; the results were similar to the original findings. Furthermore,
results from GSE56772 were replicated using Gene Set Enrichment Analysis (GSEA) with
default setting and similar results were obtained.

Acc
epte
d A
rtic
le
This article is protected by copyright. All rights reserved.
RNA extraction and qPCR. Frozen forebrain and cerebellum were powdered in liquid
nitrogen. RNA was extracted from ~25mg of each respective brain (or brain region) using the
RNAqueous 4PCR® kit (Ambion), following the manufacturer protocol including the 15
minute DNase treatment. qPCR was performed on 25ng RNA using the TaqMan® RNA-to-
CT™ 1-step kit. All gene expression analyses were made using Taqman gene expression
assays. RNA Polymerase II Subunit J (Polr2j) expression was used as an internal control for
both mouse and human gene expression assays, Mm00448649_m1 and Hs01558819_m1,
respectively. Taqman genes expression identifiers for target genes are as follows: mouse
and human Cdkn2a: Mm00494449_m1 and Hs00923894_m1, respectively; other mouse
genes: Cdkn1a: Mm00432448_m1; Glb1: Mm01259108_m1; Cxcl1: Mm04207460_m1; Tlr4:
Rn00569848_m1; Il1β: Mm00434228_m1; TNF: Mm00443258_m1. The senescent cell
population comprises a small proportion of all cells in a tissue; therefore SASP gene
expression values were normalized to neuronal Mapt, the senescence-susceptible neuronal
population. qPCR was performed using the Applied Biosystems 7900HT Sequence
Detection System, with SDS software version 2.3. Cycle profile was performed using the kit
manufacturer protocol.
Protein extraction and capillary electrophoresis. 50mg frozen forebrain was used for
subcellular fractionation and capillary electrophoresis as previously described (Orr et al.,
2015; Orr et al., 2014). Briefly, frozen tissue was powdered in liquid nitrogen, then
homogenized with dounce and pestle and fractionated following manufacture protocol
(Subcellular Protein Fractionation Kit, ThermoFisher Scientific, USA). Protein concentrations
were determined with BCA (Biorad, USA); 2ug protein was used for capillary
electrophoresis. Antibodies were diluted in Wes Antibody Diluent to the final working
concentrations: p65, 1:50 (Cell Signaling, D14E12; Beverly, MA, USA); phospho-Ser139
H2A.X, 1:50 (Cell Signaling, 20E3; Beverly, MA, USA); HT7, 1:1000 (Pierce/Invitrogen,
USA); NeuN, 1:50 (Millipore, MAB377; Temecula, CA, USA): GFAP 1:200 (Cell Signaling,
D1F4Q; Beverly, MA, USA); synaptophysin, 1:50 (Cell Signaling, D35E4; Beverly, MA,

Acc
epte
d A
rtic
le
This article is protected by copyright. All rights reserved.
USA); Plp1, 1:100 (Sigma, HPA004128; St. Louis, MO, USA). See Supporting Data Table 1
for complete antibody information. Protein quantification was performed by normalizing to
total protein concentration (Li & Shen, 2013; Moritz, 2017); (Extended Data Figure 8).
Histology. Brains were fixed in 4% PFA for 48 hours, transferred to PBS containing 0.02%
sodium azide and vibratome sectioned at 30m. Sections were washed 3x with TBS (pH
7.4), and incubated in 50% ethanol for 5 mins; followed by 70% ethanol for 5 minutes. The
sections were then submerged in 0.7% sudan black b dissolved in 70% ethanol for 5
minutes to quench lipofuscin-like autofluorescence. Tissues were then rinsed 3 times for 1-2
min in 50% ethanol. Following this step, tissue sections were transferred from 50% ethanol
to TBS and proceeded to immunofluorescence staining as described previously(Orr et al.,
2015; Orr et al., 2014). Primary antibodies used: PHF1 (1:100, kind gift from Dr. Peter
Davies), NeuN (1: 500 Cell Signaling, D3S31; Beverly, MA, USA), Histone 3 (1:400, Cell
Signaling, D1H2; Beverly, MA, USA) (Extended Data Table 1). Secondary antibodies: Goat
anti-Mouse IgG (H+L), Alexa Fluor 594 and Goat anti-Rabbit IgG (H+L), Alexa Fluor 488
(1:1500, Thermo Fisher Scientific). Imaging was performed using a Zeiss LSM 780 confocal
microscope, with ZEN 2.3 software.
Confocal Image Analyses: Image analyses were conducted using ImageJ’s FIJI. Analyses
were performed on confocal z-stacks imaged at 40x magnification. A maximum intensity
image was created by compressing four z-stack planes. All analyzed DAPI fields were
applied a bandpass filter under the same conditions, applied a threshold, and measured
using particle analysis excluding particles smaller than 25 µm2. All particles measured in the
analysis were checked for mislabels and any particles that included 2 nuclei or exhibited
abnormal/incorrect selection were excluded from analysis. Cell type was identified using
NeuN (neurons) and PHF1 (NFT-bearing neurons) immunofluorescence.
SA -gal Staining: Following euthanasia, brains were immediately removed and fresh-
frozen in an isopentane/liquid nitrogen slurry. The frozen brains were immediately adhered
to the cryotome chuck with optimal cutting temperature compound (OCT) pre-cooled to -

Acc
epte
d A
rtic
le
This article is protected by copyright. All rights reserved.
18°C; 10m coronal sections were collected, and mounted on superfrost plus microscope
slides (FisherScientific). After sectioning, slides were fixed for 10 minutes in 2%
paraformaldehyde/0.2% glutaraldehyde at room temperature, rinsed 3x in TBS and stained
with SA gal staining solution overnight(Dimri et al., 1995). Following SA gal staining,
sections were processed for immunofluorescence as described above.
Brightfield/SA gal Counts: SA gal brightfield images were taken on a Nikon Eclipse
Ci-L microscope, with a digital site DS-U2 camera (NIS-Elements software BR 4.51.00).
Coronally sectioned mouse brains (10m) were evaluated using DAPI, SA gal positive
and negative cells in the CA2 region of the hippocampus were counted across 8 tissue
sections per animal (n=5 per genotype). Staining was considered positive when granules of
blue stain were present.
High Resolution Respirometry. HRR was conducted using two Oxygraph-2k (model D &
G) machines from Oroboros Instruments (Austria). To minimize mitochondrial damage
associated with mitochondrial isolation techniques, we measured oxygen consumption in
fresh brain tissue homogenates(Makrecka-Kuka et al., 2015). Whole hippocampus, cortex
and cerebellum were homogenized with ~15 strokes using a Kontes glass homogenizer in
5% w/v ice cold MiRO6. Two mg of brain homogenate were loaded into the chamber and
experiments were carried out when oxygen concentration in each well was saturated under
atmospheric conditions (~190nM/mL O2). All reagents and SUIT protocol were described
previously(Pesta et al., 2011) with small modifications. Briefly, 1.25mM ADP was sufficient
for saturation in brain homogenate, rotenone was added at a concentration of 1M, and
FCCP was added in a single injection at a concentration of 0.5M.
DQ administration: Control and tauNFT Mapt0/0 mice aged 19-20 months were randomized
to receive DQ senolytic (5mg/kg dasatinib (LC Laboratories, Woburn, MA) with 50mg/kg
quercetin (Sigma-Aldrich, St. Louis, MO)) or vehicle (60% Phosal 50 PG, 30% PEG 400, and
10% ethanol) via oral gavage as described previously(Ogrodnik et al., 2017). Mice were

Acc
epte
d A
rtic
le
This article is protected by copyright. All rights reserved.
weighed and fasted for 2 hours prior to treatment. One month after the first treatment,
senolytic or vehicle gavage continued on a bi-weekly basis for a total of six treatment
sessions over twelve weeks. Within two weeks of the final treatment, all mice underwent MRI
analyses.
MRI: MRI experiments were performed on an 11.7 Tesla scanner (Biospec, Bruker, Billerica,
MA). A surface coil was used for brain imaging and a heart coil(Muir et al., 2008) for arterial-
spin labeling. Coil-to-coil electromagnetic interaction was actively decoupled. Mice were
maintained on 1.5% isoflurane anesthesia for MRI duration. Anatomical MRI: Anatomical
images were obtained using a fast spin echo sequence with a matrix = 128x128, field of view
(FOV) = 1.28cmx1.28 cm, repetition time (TR) = 4000 ms, effective echo times = 25 ms.
Thirty 1-mm coronal images were acquired with 4 averages. Total scan time= 8.5 minutes.
Cerebral blood flow (CBF) was measured using continuous arterial spin labeling technique
with single shot, spin-echo, echo-planar imaging and analyzed as previously described(Shen
et al., 2015). The images were acquired with partial Fourier (3/4) acquisition, matrix size =
64×64, FOV = 1.28cmx1.28 cm, TR = 3000 ms, TE = 10.59 ms, post labeling delay=350ms.
Seven 1-mm coronal images were acquired with 100 repetitions. Total scan time=10 mins.
Analyses: MRI analysis was conducted using Stimulate (Center for Magnetic Resonance
Research, University of Minnesota Medical School, Minneapolis, MN) running on a CentOS5
Linux Operating System(Strupp). Anatomical MRI images were used to measure cortex,
subcortex, ventricle, white matter hyperintensities (WMH) and whole brain volume. The
desired Region of Interest (ROIs) were outlined and volumes were obtained by multiplying
ROI total voxels by voxel volume (0.004 mm3). Ventricle and WMH volume was obtained by
thresholding anatomical image voxels to highlight regions of greater intensity, followed by
ROI traces of the target regions. Whole brain volume was obtained by ROI trace after
removal of the skull using a local Gaussian distribution 3D segmentation MATLAB code (L.
Wang et al., 2009).

Acc
epte
d A
rtic
le
This article is protected by copyright. All rights reserved.
Statistical Measures. Transgenic mouse analyses: Measurements were taken from
distinct samples. Key finding were repeated in separate mouse cohorts and are listed in
Extended Data Figures. Each age cohort for all analyses contained 3–9 animals (specified in
figure legends); both males and females were included. Only females were included in DQ
treatment and MRI analyses due to animal availability. Statistics were not used to
predetermine sample sizes, but instead was determined empirically from previous
experimental experience with similar assays, and/or from sizes generally employed in the
field. Data are expressed as mean ± standard error of the mean (s.e.m.). Genotype and
treatment comparisons were analyzed using one-way analysis of variance (ANOVA) with
Tukey post-hoc, or unpaired t-test unless stated otherwise in the figure legends.
Respirometric data, brain volume and cerebral blood flow data were analyzed using two-way
ANOVAs (genotype x respirometric parameter) and (treatment x brain region), respectively,
with Tukey’s post hoc comparisons. Human PSP brain tissue analyses: the PSP group
contained 14 samples and were compared to 10 age-matched controls with both sexes
included; significance was determined with unpaired two-tailed t-test. We performed ANOVA
analysis of the log base 10 transformed CDKN2A expression as predicted by the levels of
AD pathology, in addition we used the more conservative Kendall’s Tau rank correlation to
test this association as well. The human CDKN2A and AD pathology analyses were
performed using the R v3+ (Vienna, Austria) environment for statistical computing using an
accountable data analysis process. All other data were analyzed using GraphPad Prism
version 7.0c for Mac OS X, GraphPad Software, San Diego California, USA,
www.graphpad.com/. Data were considered statistically different at P < 0.05.

Acc
epte
d A
rtic
le
This article is protected by copyright. All rights reserved.
Arendt, T. (2012). Cell cycle activation and aneuploid neurons in Alzheimer's disease. Mol
Neurobiol, 46(1), 125-135. doi:10.1007/s12035-012-8262-0
Arendt, T., Rodel, L., Gartner, U., & Holzer, M. (1996). Expression of the cyclin-dependent kinase
inhibitor p16 in Alzheimer's disease. Neuroreport, 7(18), 3047-3049.
Arriagada, P. V., Growdon, J. H., Hedley-Whyte, E. T., & Hyman, B. T. (1992). Neurofibrillary
tangles but not senile plaques parallel duration and severity of Alzheimer's disease.
Neurology, 42(3 Pt 1), 631-639.
Baker, D. J., Wijshake, T., Tchkonia, T., LeBrasseur, N. K., Childs, B. G., van de Sluis, B., . . . van
Deursen, J. M. (2011). Clearance of p16Ink4a-positive senescent cells delays ageing-
associated disorders. Nature, 479(7372), 232-236. doi:10.1038/nature10600
Barrett, T., Wilhite, S. E., Ledoux, P., Evangelista, C., Kim, I. F., Tomashevsky, M., . . . Soboleva, A.
(2013). NCBI GEO: archive for functional genomics data sets--update. Nucleic Acids Res,
41(Database issue), D991-995. doi:10.1093/nar/gks1193
Bennett, R. E., Robbins, A. B., Hu, M., Cao, X., Betensky, R. A., Clark, T., . . . Hyman, B. T. (2018).
Tau induces blood vessel abnormalities and angiogenesis-related gene expression in
P301L transgenic mice and human Alzheimer's disease. Proc Natl Acad Sci U S A, 115(6),
E1289-E1298. doi:10.1073/pnas.1710329115
Caballero, B., Wang, Y., Diaz, A., Tasset, I., Juste, Y. R., Stiller, B., . . . Cuervo, A. M. (2018). Interplay
of pathogenic forms of human tau with different autophagic pathways. Aging Cell, 17(1).
doi:10.1111/acel.12692
Childs, B. G., Baker, D. J., Wijshake, T., Conover, C. A., Campisi, J., & van Deursen, J. M. (2016).
Senescent intimal foam cells are deleterious at all stages of atherosclerosis. Science,
354(6311), 472-477. doi:10.1126/science.aaf6659
Coppe, J. P., Patil, C. K., Rodier, F., Krtolica, A., Beausejour, C. M., Parrinello, S., . . . Campisi, J.
(2010). A human-like senescence-associated secretory phenotype is conserved in mouse
cells dependent on physiological oxygen. PLoS One, 5(2), e9188.
doi:10.1371/journal.pone.0009188
Correia-Melo, C., Marques, F. D., Anderson, R., Hewitt, G., Hewitt, R., Cole, J., . . . Passos, J. F.
(2016). Mitochondria are required for pro-ageing features of the senescent phenotype.
EMBO J, 35(7), 724-742. doi:10.15252/embj.201592862
de Calignon, A., Spires-Jones, T. L., Pitstick, R., Carlson, G. A., & Hyman, B. T. (2009). Tangle-
bearing neurons survive despite disruption of membrane integrity in a mouse model of
tauopathy. J Neuropathol Exp Neurol, 68(7), 757-761.
doi:10.1097/NEN.0b013e3181a9fc66
Dimri, G. P., Lee, X., Basile, G., Acosta, M., Scott, G., Roskelley, C., . . . et al. (1995). A biomarker that
identifies senescent human cells in culture and in aging skin in vivo. Proc Natl Acad Sci U
S A, 92(20), 9363-9367.

Acc
epte
d A
rtic
le
This article is protected by copyright. All rights reserved.
Dunckley, T., Beach, T. G., Ramsey, K. E., Grover, A., Mastroeni, D., Walker, D. G., . . . Stephan, D. A.
(2006). Gene expression correlates of neurofibrillary tangles in Alzheimer's disease.
Neurobiol Aging, 27(10), 1359-1371. doi:10.1016/j.neurobiolaging.2005.08.013
Flament, S., Delacourte, A., Verny, M., Hauw, J. J., & Javoy-Agid, F. (1991). Abnormal Tau proteins
in progressive supranuclear palsy. Similarities and differences with the neurofibrillary
degeneration of the Alzheimer type. Acta Neuropathol, 81(6), 591-596.
Frost, B., Bardai, F. H., & Feany, M. B. (2016). Lamin Dysfunction Mediates Neurodegeneration in
Tauopathies. Curr Biol, 26(1), 129-136. doi:10.1016/j.cub.2015.11.039
Herbig, U., Ferreira, M., Condel, L., Carey, D., & Sedivy, J. M. (2006). Cellular senescence in aging
primates. Science, 311(5765), 1257. doi:10.1126/science.1122446
Hoover, B. R., Reed, M. N., Su, J., Penrod, R. D., Kotilinek, L. A., Grant, M. K., . . . Liao, D. (2010). Tau
mislocalization to dendritic spines mediates synaptic dysfunction independently of
neurodegeneration. Neuron, 68(6), 1067-1081. doi:10.1016/j.neuron.2010.11.030
Hutter, E., Renner, K., Pfister, G., Stockl, P., Jansen-Durr, P., & Gnaiger, E. (2004). Senescence-
associated changes in respiration and oxidative phosphorylation in primary human
fibroblasts. Biochem J, 380(Pt 3), 919-928. doi:10.1042/BJ20040095
Jurk, D., Wang, C., Miwa, S., Maddick, M., Korolchuk, V., Tsolou, A., . . . von Zglinicki, T. (2012).
Postmitotic neurons develop a p21-dependent senescence-like phenotype driven by a
DNA damage response. Aging Cell, 11(6), 996-1004. doi:10.1111/j.1474-
9726.2012.00870.x
Kirkland, J. L., Tchkonia, T., Zhu, Y., Niedernhofer, L. J., & Robbins, P. D. (2017). The Clinical
Potential of Senolytic Drugs. J Am Geriatr Soc, 65(10), 2297-2301.
doi:10.1111/jgs.14969
Kramer, A., Green, J., Pollard, J., Jr., & Tugendreich, S. (2014). Causal analysis approaches in
Ingenuity Pathway Analysis. Bioinformatics, 30(4), 523-530.
doi:10.1093/bioinformatics/btt703
Laurent, C., Buee, L., & Blum, D. (2018). Tau and neuroinflammation: What impact for
Alzheimer's Disease and Tauopathies? Biomed J, 41(1), 21-33.
doi:10.1016/j.bj.2018.01.003
Li, R., & Shen, Y. (2013). An old method facing a new challenge: re-visiting housekeeping
proteins as internal reference control for neuroscience research. Life Sci, 92(13), 747-
751. doi:10.1016/j.lfs.2013.02.014
Makrecka-Kuka, M., Krumschnabel, G., & Gnaiger, E. (2015). High-Resolution Respirometry for
Simultaneous Measurement of Oxygen and Hydrogen Peroxide Fluxes in Permeabilized
Cells, Tissue Homogenate and Isolated Mitochondria. Biomolecules, 5(3), 1319-1338.
doi:10.3390/biom5031319
Moritz, C. P. (2017). Tubulin or Not Tubulin: Heading Toward Total Protein Staining as Loading
Control in Western Blots. Proteomics, 17(20). doi:10.1002/pmic.201600189
Acc
epte
d A
rtic
le
This article is protected by copyright. All rights reserved.
Morsch, R., Simon, W., & Coleman, P. D. (1999). Neurons may live for decades with
neurofibrillary tangles. J Neuropathol Exp Neurol, 58(2), 188-197.
Muir, E. R., Shen, Q., & Duong, T. Q. (2008). Cerebral blood flow MRI in mice using the cardiac-
spin-labeling technique. Magn Reson Med, 60(3), 744-748. doi:10.1002/mrm.21721
Nilson, A. N., English, K. C., Gerson, J. E., Barton Whittle, T., Nicolas Crain, C., Xue, J., . . . Kayed, R.
(2017). Tau Oligomers Associate with Inflammation in the Brain and Retina of
Tauopathy Mice and in Neurodegenerative Diseases. J Alzheimers Dis, 55(3), 1083-1099.
doi:10.3233/JAD-160912
Oddo, S., Caccamo, A., Shepherd, J. D., Murphy, M. P., Golde, T. E., Kayed, R., . . . LaFerla, F. M.
(2003). Triple-transgenic model of Alzheimer's disease with plaques and tangles:
intracellular Abeta and synaptic dysfunction. Neuron, 39(3), 409-421.
Ogrodnik, M., Miwa, S., Tchkonia, T., Tiniakos, D., Wilson, C. L., Lahat, A., . . . Jurk, D. (2017).
Cellular senescence drives age-dependent hepatic steatosis. Nat Commun, 8, 15691.
doi:10.1038/ncomms15691
Orr, M. E., Garbarino, V. R., Salinas, A., & Buffenstein, R. (2015). Sustained high levels of
neuroprotective, high molecular weight, phosphorylated tau in the longest-lived rodent.
Neurobiol Aging, 36(3), 1496-1504. doi:10.1016/j.neurobiolaging.2014.12.004
Orr, M. E., Pitstick, R., Canine, B., Ashe, K. H., & Carlson, G. A. (2012). Genotype-specific
differences between mouse CNS stem cell lines expressing frontotemporal dementia
mutant or wild type human tau. PLoS One, 7(6), e39328.
doi:10.1371/journal.pone.0039328
Orr, M. E., Salinas, A., Buffenstein, R., & Oddo, S. (2014). Mammalian target of rapamycin
hyperactivity mediates the detrimental effects of a high sucrose diet on Alzheimer's
disease pathology. Neurobiol Aging, 35(6), 1233-1242.
doi:10.1016/j.neurobiolaging.2013.12.006
Orr, M. E., Sullivan, A. C., & Frost, B. (2017). A Brief Overview of Tauopathy: Causes,
Consequences, and Therapeutic Strategies. Trends Pharmacol Sci, 38(7), 637-648.
doi:10.1016/j.tips.2017.03.011
Park, K. H., Hallows, J. L., Chakrabarty, P., Davies, P., & Vincent, I. (2007). Conditional neuronal
simian virus 40 T antigen expression induces Alzheimer-like tau and amyloid pathology
in mice. J Neurosci, 27(11), 2969-2978. doi:10.1523/JNEUROSCI.0186-07.2007
Pesta, D., Hoppel, F., Macek, C., Messner, H., Faulhaber, M., Kobel, C., . . . Gnaiger, E. (2011).
Similar qualitative and quantitative changes of mitochondrial respiration following
strength and endurance training in normoxia and hypoxia in sedentary humans. Am J
Physiol Regul Integr Comp Physiol, 301(4), R1078-1087.
doi:10.1152/ajpregu.00285.2011
Prins, N. D., & Scheltens, P. (2015). White matter hyperintensities, cognitive impairment and
dementia: an update. Nat Rev Neurol, 11(3), 157-165. doi:10.1038/nrneurol.2015.10

Acc
epte
d A
rtic
le
This article is protected by copyright. All rights reserved.
Rodier, F., Coppe, J. P., Patil, C. K., Hoeijmakers, W. A., Munoz, D. P., Raza, S. R., . . . Campisi, J.
(2009). Persistent DNA damage signalling triggers senescence-associated inflammatory
cytokine secretion. Nat Cell Biol, 11(8), 973-979. doi:10.1038/ncb1909
Salminen, A., & Kaarniranta, K. (2011). Control of p53 and NF-kappaB signaling by WIP1 and
MIF: role in cellular senescence and organismal aging. Cell Signal, 23(5), 747-752.
doi:10.1016/j.cellsig.2010.10.012
Santacruz, K., Lewis, J., Spires, T., Paulson, J., Kotilinek, L., Ingelsson, M., . . . Ashe, K. H. (2005).
Tau suppression in a neurodegenerative mouse model improves memory function.
Science, 309(5733), 476-481. doi:10.1126/science.1113694
Sedelnikova, O. A., Horikawa, I., Zimonjic, D. B., Popescu, N. C., Bonner, W. M., & Barrett, J. C.
(2004). Senescing human cells and ageing mice accumulate DNA lesions with
unrepairable double-strand breaks. Nature Cell Biology, 6(2), 168-170.
doi:10.1038/ncb1095
Severino, J., Allen, R. G., Balin, S., Balin, A., & Cristofalo, V. J. (2000). Is beta-galactosidase staining
a marker of senescence in vitro and in vivo? Exp Cell Res, 257(1), 162-171.
doi:10.1006/excr.2000.4875
Seward, M. E., Swanson, E., Norambuena, A., Reimann, A., Cochran, J. N., Li, R., . . . Bloom, G. S.
(2013). Amyloid-beta signals through tau to drive ectopic neuronal cell cycle re-entry in
Alzheimer's disease. J Cell Sci, 126(Pt 5), 1278-1286. doi:10.1242/jcs.1125880
Shen, Q., Huang, S., & Duong, T. Q. (2015). Ultra-high spatial resolution basal and evoked
cerebral blood flow MRI of the rat brain. Brain Res, 1599, 126-136.
doi:10.1016/j.brainres.2014.12.049
Silbert, L. C., Quinn, J. F., Moore, M. M., Corbridge, E., Ball, M. J., Murdoch, G., . . . Kaye, J. A. (2003).
Changes in premorbid brain volume predict Alzheimer's disease pathology. Neurology,
61(4), 487-492.
Strupp, J. P. Stimulate: A GUI based fMRI Analysis Software Package. Neuroimage, 3(3), S607.
Wang, L., Li, C., Sun, Q., Xia, D., & Kao, C. Y. (2009). Active contours driven by local and global
intensity fitting energy with application to brain MR image segmentation. Comput Med
Imaging Graph, 33(7), 520-531. doi:10.1016/j.compmedimag.2009.04.010
Wang, Y., Martinez-Vicente, M., Kruger, U., Kaushik, S., Wong, E., Mandelkow, E. M., . . .
Mandelkow, E. (2009). Tau fragmentation, aggregation and clearance: the dual role of
lysosomal processing. Hum Mol Genet, 18(21), 4153-4170. doi:10.1093/hmg/ddp367
Wegmann, S., Maury, E. A., Kirk, M. J., Saqran, L., Roe, A., DeVos, S. L., . . . Hyman, B. T. (2015).
Removing endogenous tau does not prevent tau propagation yet reduces its
neurotoxicity. EMBO J, 34(24), 3028-3041. doi:10.15252/embj.201592748
Wells, J. A., O'Callaghan, J. M., Holmes, H. E., Powell, N. M., Johnson, R. A., Siow, B., . . . Lythgoe, M.
F. (2015). In vivo imaging of tau pathology using multi-parametric quantitative MRI.
Neuroimage, 111, 369-378. doi:10.1016/j.neuroimage.2015.02.023

Acc
epte
d A
rtic
le
This article is protected by copyright. All rights reserved.
Zhu, Y., Tchkonia, T., Pirtskhalava, T., Gower, A. C., Ding, H., Giorgadze, N., . . . Kirkland, J. L.
(2015). The Achilles' heel of senescent cells: from transcriptome to senolytic drugs.
Aging Cell, 14(4), 644-658. doi:10.1111/acel.12344
Acknowledgements. We thank Drs. Jia Nie for assistance with oral gavage; Ning Zang for
assistance collecting tissues; and Ji Li for maintaining the mouse colony, assistance with
tissue collection and laboratory management. We thank Mr. Anthony Andrade for providing
technical assistance with sectioning mouse brains. The Nathan Shock Pathology Core and
Nathan Shock Metabolism Core provided the cryostat and Oxygraph-2k, respectively. Drs.
Yuji Ikeno and Judith Campisi provided technical advice on SA gal staining. We would like
to acknowledge Dr. Jonathan Gelfond for assisting with the data analysis, and was
supported by NIH grants NIA Shock Center P30AG013319 and NIA Pepper Center
P30AG044271. The authors acknowledge Karen H. Ashe for development of the rTg4510
mouse line. We thank the McLaughlin Research Institute: Dr. George Carlson and Rose
Pitstick for breeding all mouse lines used here, and Dr. Andrea Grindeland for performing
silver staining. We are grateful to the Banner Sun Health Research Institute Brain and Body
Donation Program of Sun City, Arizona for the provision of human brain tissue. The Brain
and Body Donation Program is supported by the National Institute of Neurological Disorders
and Stroke (U24 NS072026 National Brain and Tissue Resource for Parkinson’s Disease
and Related Disorders, the National Institute on Aging (P30 AG19610 Arizona Alzheimer’s
Disease Core Center), the Arizona Department of Health Services (contract 211002, Arizona
Alzheimer’s Research Center), the Arizona Biomedical Research Commission (contracts
4001, 0011, 05-901 and 0110 for the Arizona Parkinson’s Disease Consortium) and the
Michael J. Fox Foundation for Parkinson’s Research. This work was supported by the San
Antonio Nathan Shock Center for Excellence, the UT Health Science Center School of
Medicine Briscoe Women’s Health and the US Department of Veterans Affairs Career
Development Award (IK2BX003804) awarded to M.E.O. N.M. is supported by R01-DK80157,
R01-DK089229, P30 AG013319 (San Antonio Nathan Shock Center), and P30 AG044271

Acc
epte
d A
rtic
le
This article is protected by copyright. All rights reserved.
(San Antonio Claude D. Pepper Older Americans Independence Center). J.M.V. is
supported by a Biology of Aging T32 Training Grant (T32 AG021890).
Author Contributions N.M. provided guidance and support to authors and edited the
manuscript. J.M.V. designed and conducted GSEA and respirometry experiments, analyzed
and interpreted data, prepared figures, wrote methods, independently confirmed key results
of gene expression and histological measures, helped write and edit the manuscript. K.S.
managed senolytic treatment experiments, performed histological staining, conducted
blinded histological analyses of immunofluorescence data, wrote methods and edited the
manuscript. E.B. assisted with senolytic treatments, conducted blinded analyses of
anatomical MRI images and wrote corresponding methods. Q.S. performed all MRI
experiments and analyses, conducted blinded analyses of CBF data and provided oversight
to E.B. in anatomical analyses. C.S.T. performed histology, SA -gal staining and blinded
quantification, developed FIJI analysis protocols, wrote methods and edited the manuscript.
M.E.O. conceived, supervised and attained funding for the project; designed the
experiments, conducted experiments, analyzed and interpreted data, provided guidance and
supervision to co-authors, prepared figures and wrote the manuscript.
Conflict of Interest. None Declared
Data Availability Statement. References for source data for Figure 1 are provided with the
paper; data that support Figure 1 findings are available from the corresponding author upon
reasonable request. All other data supporting the findings of this study are available within
the paper, and its extended data files.

Acc
epte
d A
rtic
le
This article is protected by copyright. All rights reserved.
Table 1. Human Postmortem Brain Characteristics
Control (n=10) PSP (n=14) p-value
Age at death (yrs) 85.70 ± 2.81 83.86 ± 3.08 0.6765
Sex (M/F) 6/4 9/5 N/A
Last MMSE score 27.67 ± 0.87 (n=9) 21.00 ± 2.02 0.0194
Brain mass (g) 1169 ± 17.83 1139 ± 43.21 0.5800
Total Tangles 4.03 ± 0.77 7.64 ± 0.66 0.0017
Figure 1 | Neurofibrillary tangles were associated with cellular senescence-associated
gene pathways in human Alzheimer’s disease neurons and tau transgenic mouse
brains. (a) Pathways and predicted upstream regulators identified by Ingenuity Pathway
Analyses (IPA, QIAGEN) as significantly enriched in Alzheimer’s disease patient-derived
neurons with neurofibrillary tangles compared to non-tangle containing neurons; z-score
plotted on x-axis and (p-value) indicated in bar graph. Cellular functions and (b) predicted
upstream regulators employed by neurofibrillary tangle containing neurons derived from
Alzheimer’s disease patient are shown. (c) Predicted upstream regulators of gene
transcription in tauNFT mice after the onset of neurofibrillary tangles (~6-mo-old vs. ~2-mo-
old); z-score plotted on x-axis and (p-value) indicated in bar graph. (d-e) Representative
immunoblot generated by capillary electrophoresis on chromatin-bound fractions from
mouse forebrain homogenate probed with anti--H2ax antibody. (e) Densitometric
normalization of -H2ax to total protein content (CTL: n=3; tauWT n=4; tauNFT: n=5; ANOVA, P
= 0.0056. Mice aged 16-18-months old). (f-k) Quantitative gene expression on RNA isolated
from CTL (open bar, n=3), tauWT (closed bar, n=3) and tauNFT (red bar, n=4) mouse forebrain
Acc
epte
d A
rtic
le
This article is protected by copyright. All rights reserved.
targeting (f): Cdkn2a, P = 0.0066 and (g) Cdkn1a, P = 0.0207. Gene expression was
analyzed by one-way ANOVA Tukey’s multiple comparison posthoc. Data are graphically
represented as mean ± s.e.m.
Figure 2 | Neurofibrillary tangles were associated with upregulation of SASP gene
expression and NFB activation. (a) Quantitative gene expression on RNA isolated from
CTL (open bar, n=3), tauWT (closed bar, n=3) and tauNFT (red bar, n=4) mouse forebrain
targeting SASP associated genes Il1b, P = 0.0025; (b) Cxcl1, P = 0.0040; (c) Tnfa, P =
0.0114; (d) Tlr4, P = 0.0144. (d) Immunoblot generated by capillary electrophoresis on
subcellular fractionated mouse forebrain homogenate probed with anti-NFB p65 antibody.
Total cellular p65 (top blot) and nuclear localized p65 protein levels (bottom blot) were (e)
normalized to total protein content. Total p65; P = 0.0758; nuclear p65, P = 0.0223. CTL:
open bar, n=3; tauWT: closed bar, n=4; tauNFT: red bar, n=5. In all experiments, mice were
aged 16-18-months-old; both males and females were included. Significance determined by
one-way ANOVA Tukey’s multiple comparison posthoc. Data are graphically represented as
mean ± s.e.m.
Figure 3 | Brain regions with neurofibrillary tangles displayed altered cellular
respiration. (a-c) Representative respirometric traces from cortical and (d-f) hippocampal
tissues using the SUIT protocol to measure oxygen consumption (top gray traces: CTL;
black middle traces: tauWT; bottom red traces: tauNFT). (g) Tissue mass-specific respiration
analyses in cortical and (h) hippocampal tissue. Two-way ANOVA Tukey’s multiple
comparison posthoc: ** P < 0.005. (i) Biochemical analyses of citrate synthase (CS) activity
to assess total mitochondrial content in the cortex and hippocampus (n=5/group).
Experimental mice were aged 16-18-months-old with n=6/group; both males and females
were included (j) Total oxygen consumption and (k) Cdkn2a gene expression were
measured in the cerebellum, a brain region devoid of NFTs. n=3/group. Data are graphically
Acc
epte
d A
rtic
le
This article is protected by copyright. All rights reserved.
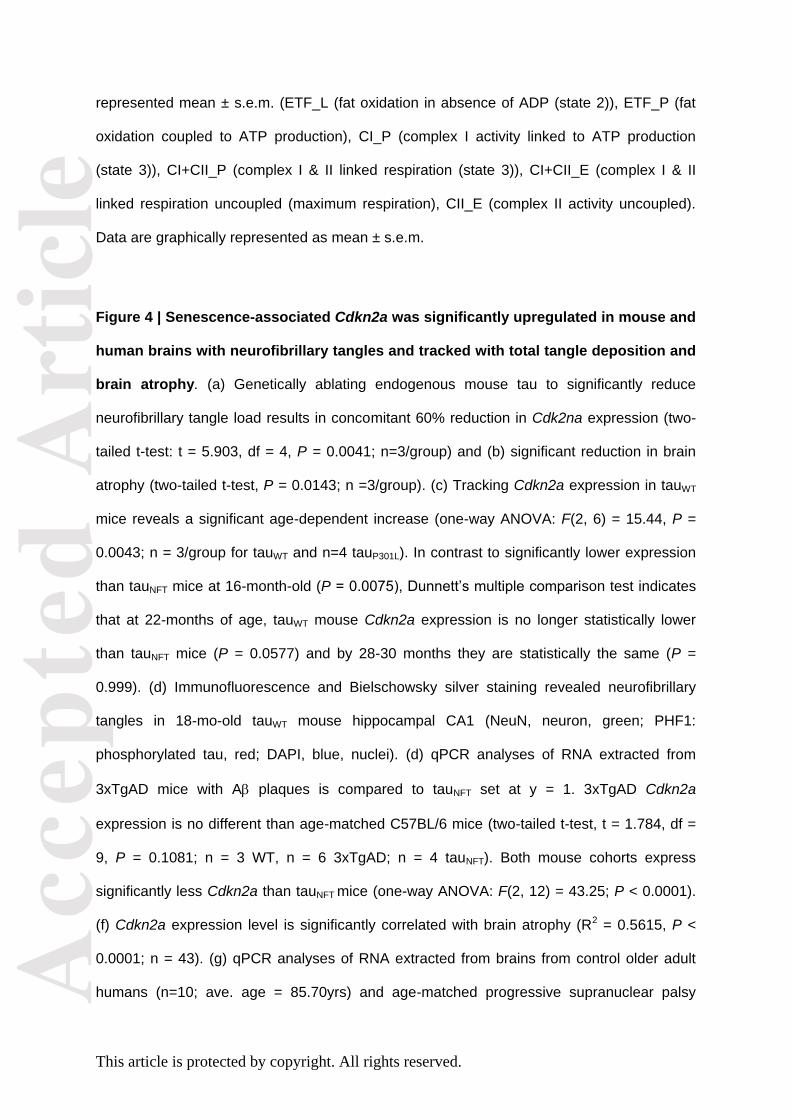
represented mean ± s.e.m. (ETF_L (fat oxidation in absence of ADP (state 2)), ETF_P (fat
oxidation coupled to ATP production), CI_P (complex I activity linked to ATP production
(state 3)), CI+CII_P (complex I & II linked respiration (state 3)), CI+CII_E (complex I & II
linked respiration uncoupled (maximum respiration), CII_E (complex II activity uncoupled).
Data are graphically represented as mean ± s.e.m.
Figure 4 | Senescence-associated Cdkn2a was significantly upregulated in mouse and
human brains with neurofibrillary tangles and tracked with total tangle deposition and
brain atrophy. (a) Genetically ablating endogenous mouse tau to significantly reduce
neurofibrillary tangle load results in concomitant 60% reduction in Cdk2na expression (two-
tailed t-test: t = 5.903, df = 4, P = 0.0041; n=3/group) and (b) significant reduction in brain
atrophy (two-tailed t-test, P = 0.0143; n =3/group). (c) Tracking Cdkn2a expression in tauWT
mice reveals a significant age-dependent increase (one-way ANOVA: F(2, 6) = 15.44, P =
0.0043; n = 3/group for tauWT and n=4 tauP301L). In contrast to significantly lower expression
than tauNFT mice at 16-month-old (P = 0.0075), Dunnett’s multiple comparison test indicates
that at 22-months of age, tauWT mouse Cdkn2a expression is no longer statistically lower
than tauNFT mice (P = 0.0577) and by 28-30 months they are statistically the same (P =
0.999). (d) Immunofluorescence and Bielschowsky silver staining revealed neurofibrillary
tangles in 18-mo-old tauWT mouse hippocampal CA1 (NeuN, neuron, green; PHF1:
phosphorylated tau, red; DAPI, blue, nuclei). (d) qPCR analyses of RNA extracted from
3xTgAD mice with A plaques is compared to tauNFT set at y = 1. 3xTgAD Cdkn2a
expression is no different than age-matched C57BL/6 mice (two-tailed t-test, t = 1.784, df =
9, P = 0.1081; n = 3 WT, n = 6 3xTgAD; n = 4 tauNFT). Both mouse cohorts express
significantly less Cdkn2a than tauNFT mice (one-way ANOVA: F(2, 12) = 43.25; P < 0.0001).
(f) Cdkn2a expression level is significantly correlated with brain atrophy (R2 = 0.5615, P <
0.0001; n = 43). (g) qPCR analyses of RNA extracted from brains from control older adult
humans (n=10; ave. age = 85.70yrs) and age-matched progressive supranuclear palsy

Acc
epte
d A
rtic
le
This article is protected by copyright. All rights reserved.
(n=14; ave. age = 83.86yrs) indicate a 57% upregulation of CDKN2A with progressive
supranuclear palsy diagnosis (unpaired t-test, t = 2.165, df = 22, P = 0.0415) that (h)
positively correlates with neurofibrillary tangle deposition in the parietal lobe (ANOVA, P =
0.0008; Kendall’s Tau rank correlation P = 0.059). (i) Immunoblot generated by capillary
electrophoresis on cortical brain homogenate from control and progressive supranuclear
palsy human brains probed with total tau antibody, HT7. The individual with the highest
CDKN2A expression (panel g) displayed high molecular weight tau, lane 9*. Data is
graphically represented as error bars, mean ± s.e.m.
Figure 5 | Senolytic treatment reduced neurofibrillary tangle burden, ventricular
enlargement and neurodegeneration in 23-month-old tau transgenic mice. (a)
Representative brain images analyzed for neurofibrillary tangles in tau transgenic mice
treated with either vehicle or dasatinib and quercetin (DQ). (Phosphorylated tau, PHF1, red;
total tyrosine phosphorylation, pTyr, yellow; and DAPI nuclei; blue. Scale bar = 10m). (b)
Neurofibrillary tangle counts from n = 3 mice/group sampled from 12 cortical images/mouse
and analyzed with unpaired two-tailed t-test, **** P < 0.0001. (c) DQ significantly reduced
hippocampal Tlr4, P = 0.0459, and Cxcl1, P = 0.0142, gene expression as measured by
qPCR. Vehicle-treated (open symbols, n=7) and DQ-treated (red closed symbols, n = 5);
data analyzed by unpaired two-tailed t-test. (d) Representative brain images from anatomical
T2-weighted MRI. (e) Quantification of ventricle volume analyzed by one-way ANOVA, P =
0.0010; Holm-Sikak’s posthoc: *** P = 0.0007, * P = 0.05. (f) Immunoblot generated by
capillary electrophoresis on forebrain homogenates (n = 6/group) with antibodies against
neuronal proteins NeuN, synaptophysin (synapto.), and PSD95 normalized to total protein.
(g) Neuronal protein expression was normalized to total protein and analyzed by unpaired
two-tailed t-test, NeuN: * P = 0.0432, (h) synaptophysin (Synapto): * P = 0.0416 and (i)
PSD95: * P = 0.0398. n = 6/group. Data represented as mean +/- SEM.

Acc
epte
d A
rtic
le
This article is protected by copyright. All rights reserved.
Supporting Data Figure 1 | The tauNFT mouse model develops neurofibrillary tangles
and brain atrophy. (a-c) Histological staining of cortical brain sections from 16-month-old
(a) CTL, (b) tauWT and (c) tauNFT mice with antibodies against neurons (NeuN, red);
neurofibrillary tangles (PHF1, green) and nuclei (DAPI, blue). Only tauNFT mice develop
neurofibrillary tangles at this age. Scale bar 10m. (d) Histological comparison of CTL
hemibrain (left) to tauNFT mouse hemibrain (right). Images illustrate severe forebrain atrophy
with ventricular enlargement in tauNFT mice. (e) Brain weight measurements reflect the
significant neurodegeneration in tauNFT mice (n=3/group; one-way ANOVA: P = 0.0015,
Tukey’s posthoc analysis: CTL vs. tauWT = 0.0644, CTL vs. tauNFT = 0.0011; tauWT vs. tauNFT
= 0.0477. Data are graphically represented as mean ± s.e.m. (f-i) Quantitative gene
expression analyses on RNA isolated from CTL non-transgene expressing littermates of
tauWT mice (TRE- tauWT: closed circles) and tauNFT mice (TRE-tauNFT: red circles) mouse
forebrain indicates statistically similar expression by unpaired two-tailed t-test. (f) Tnfa: P =
0.2256 (g) Tlr4: P = 0.5230 (h) Il1b: P = 0.2244 and (i) Cxcl1: P = 0.9808. Data are
graphically represented as mean with 95% CI.
Supporting Data Figure 2 | The tau-induced senescence-associated gene expression
was dependent on high molecular weight tau. (a) Sixteen-month-old tauWT and tauNFT
mice express similar levels of Mapt gene expression. (b) Representative capillary
electrophoresis immunoblot using total human tau antibody (HT7) on brain homogenates
from 16-mo-old tauWT and tauNFT mice. (c-g) Quantitative gene expression analyses on RNA
isolated from control (CTL, non-transgene expressing mice), tauWT and tauNFT mice. (c)
Some senescence-associated genes were not changed by NFT formation (i.e., (c) Il6 or (d)
Lmnb1). The significant upregulation in other senescence-associated genes in tauNFT but not
tauWT mice allowed us to identify a gene expression array dependent on NFT formation.
These genes include Tnfa, Tlr4, Il1, Cxcl1, Cdk1a and Cdkn2a. Gene expression was
normalized to neuronal Mapt expression and analyzed by Two-way ANOVA. N=3/mice

Acc
epte
d A
rtic
le
This article is protected by copyright. All rights reserved.
group. (f-g) Cdkn1a and Cdkn2a are reproducibly elevated in a separate mouse cohort.
Unpaired two-tailed t-test: Cdkn1a: P = 0.0086 and (g) Cdkn2a: P = 0.0016; tauNFT mice
(closed bars) and CTLs (TRE-tauNFT: open bars); n=3/group).
Supporting Data Figure 3 | Senescence associated beta galactosidase reactivity was
positively correlated with brain mass, but not neurofibrillary tangle pathology. (a)
Senescence associated beta galactosidase (SA -gal) staining carried out at pH 6.0
illustrated reactivity in 1-mo-old control mouse forebrain and (b) cerebellum. (c) Quantitative
gene expression analyses on RNA isolated from CTL (open bar), tauWT (closed bar) and
tauNFT (red bar) mouse forebrain revealed significantly upregulated lysosomal hydrolase
Glb1 gene expression in tauNFT mice; ANOVA, P = 0.0070; CTL: n=3; tauWT n=3; tauNFT: n=4.
(d) SA -gal staining of control 18-mo-old brain; CA1 (box) and cortex (brackets). (e) TauNFT
mouse brains stained with -galactosidase developed very low reactivity at pH 6.0 but (f)
positive -galactosidase activity was observed in tauNFT mice when stained at physiological
pH 4. (g-h) Immunostaining with anti-NeuN revealed co-labeling of SA -gal positive cells
with neurons. (i) Five experimental cohorts of CTL, tauWT and tauNFT 18-mo-old mice were
analyzed for SA -gal reactivity at pH 6.0; both males and females were included. The
number of CA2 cells sampled on each histological slide was plotted; (j) the total number of
CA2 cells counted did not differ among genotypes. (k) The percentage of SA -gal positive
CA2 cells was significantly lower in tauWT mice than controls, and tauNFT mice contained
significantly fewer SA -gal positive CA2 cells than CTL and tauWT mice. (Repeated
measures one-way ANOVA: P = 0.0049). (l) The percentage of SA -gal positive CA2 cells
was significantly correlated with brain mass (R2 = 0.4852, P = 0.0 039). Data are graphically
represented as mean ± s.e.m.
Acc
epte
d A
rtic
le
This article is protected by copyright. All rights reserved.
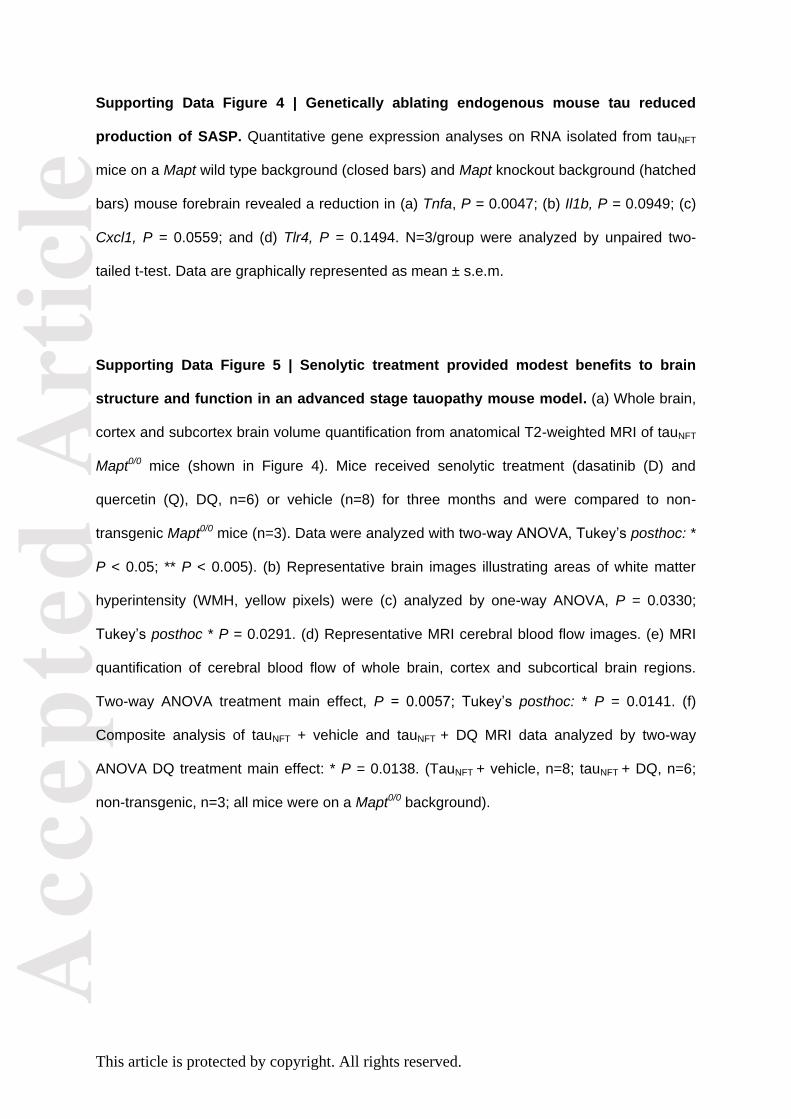
Supporting Data Figure 4 | Genetically ablating endogenous mouse tau reduced
production of SASP. Quantitative gene expression analyses on RNA isolated from tauNFT
mice on a Mapt wild type background (closed bars) and Mapt knockout background (hatched
bars) mouse forebrain revealed a reduction in (a) Tnfa, P = 0.0047; (b) Il1b, P = 0.0949; (c)
Cxcl1, P = 0.0559; and (d) Tlr4, P = 0.1494. N=3/group were analyzed by unpaired two-
tailed t-test. Data are graphically represented as mean ± s.e.m.
Supporting Data Figure 5 | Senolytic treatment provided modest benefits to brain
structure and function in an advanced stage tauopathy mouse model. (a) Whole brain,
cortex and subcortex brain volume quantification from anatomical T2-weighted MRI of tauNFT
Mapt0/0 mice (shown in Figure 4). Mice received senolytic treatment (dasatinib (D) and
quercetin (Q), DQ, n=6) or vehicle (n=8) for three months and were compared to non-
transgenic Mapt0/0 mice (n=3). Data were analyzed with two-way ANOVA, Tukey’s posthoc: *
P < 0.05; ** P < 0.005). (b) Representative brain images illustrating areas of white matter
hyperintensity (WMH, yellow pixels) were (c) analyzed by one-way ANOVA, P = 0.0330;
Tukey’s posthoc * P = 0.0291. (d) Representative MRI cerebral blood flow images. (e) MRI
quantification of cerebral blood flow of whole brain, cortex and subcortical brain regions.
Two-way ANOVA treatment main effect, P = 0.0057; Tukey’s posthoc: * P = 0.0141. (f)
Composite analysis of tauNFT + vehicle and tauNFT + DQ MRI data analyzed by two-way
ANOVA DQ treatment main effect: * P = 0.0138. (TauNFT + vehicle, n=8; tauNFT + DQ, n=6;
non-transgenic, n=3; all mice were on a Mapt0/0 background).
Acc
epte
d A
rtic
le
This article is protected by copyright. All rights reserved.
Supporting Data Figure 6 | Senolytic treatment decreased SASP gene expression but
not astrocytes or microglia. (a) Quantitative senescence gene expression array from
hippocampus of vehicle-treated (open symbols, n=7) and DQ-treated (red closed symbols, n
= 5) mice relative to neuronal Mapt gene expression. Two-way ANOVA: treatment main
effect, ***P = 0.0006. (b) Representative capillary electrophoresis immunoblot using
antibodies against GFAP and Iba1 to quantify relative levels of astrocytes and microglia,
respectively, in brain homogenates from vehicle or senolytic (dasatinib and quercetin, DQ)
treated mice. (c) Densitometric normalization of GFAP and (d) Iba1 antibody
immunoreactivity against total protein analyzed by unpaired two-tailed t-test. ** = 0.0013.
N=6/group Data are graphically represented as mean ± s.e.m.
Supporting Data Figure 7 | Senolytic treatment did not alter soluble tau expression. (a)
Representative capillary electrophoresis immunoblot using total human tau antibody (HT7)
on brain homogenates from vehicle or senolytic (dasatinib and quercetin, DQ) treated mice.
(b) Densitometric normalization of total tau immunoreactivity against total protein indicates
similar protein expression between treatment groups. Vehicle, n=5; DQ, n=4. Data are
graphically represented as mean with 95% CI.
Supporting Data Figure 8 | Total protein concentration was used as the internal
loading control for protein quantification. (a) Representative capillary electrophoresis
immunoblot on cytosolic (Cyt.) and nuclear (Nuc.) enriched fractions using antibodies
against Lamin A/C and -Actin. (b) Representative capillary electrophoresis immunoblot of
brain homogenates from control or tau transgenic mice using antibodies against Lamin A/C
and -Actin. (c) Representative capillary electrophoresis immunoblot used to detect total
protein concentration. (d) Quantification of Lamin A/C, (e) -Actin and (f) total protein

Acc
epte
d A
rtic
le
This article is protected by copyright. All rights reserved.
concentration. CTL: n = 3; tauNFT: n = 5; unpaired two-tailed t-test, Lamin A/C **** P <
0.0001; Actin: ** P = 0.0097; Total Protein: P = 0.2916. (g) Representative
electropherogram generated from capillary electrophoresis total protein immunoblot.
Figure 1 | Neurofibrillary tangles were associated with cellular senescence-associated
gene pathways in human Alzheimer’s disease neurons and tau transgenic mouse
brains.
Figure 2 | Neurofibrillary tangles were associated with upregulation of SASP gene
expression and NFB activation

Acc
epte
d A
rtic
le
This article is protected by copyright. All rights reserved.
Figure 3 | Neurofibrillary tangle-containing brain regions displayed impaired cellular
respiration.

Acc
epte
d A
rtic
le
This article is protected by copyright. All rights reserved.
Figure 4 | Senescence-associated Cdkn2a was significantly upregulated in mouse and
human brains with neurofibrillary tangles and tracked with total tangle deposition and
brain atrophy.

Acc
epte
d A
rtic
le
This article is protected by copyright. All rights reserved.
Figure 5 | Senolytic treatment reduced NFT burden, ventricular enlargement and
neurodegeneration in 23-month-old tau transgenic mice.