Dr Elizabeth Fernandez School of Social Sciences and International Relations
65
How do Children Fare in Care: A Longitudinal Study of Outcomes in Foster Care Family Permanence and Foster Care Session 22 Dr Elizabeth Fernandez School of Social Sciences and International Relations University of New South Wales Australia [email protected] International Society for Child Indicators Inaugural Conference Chapin Hall Center for Children Chicago, Illinois June 26-28, 2007
description
How do Children Fare in Care: A Longitudinal Study of Outcomes in Foster Care Family Permanence and Foster Care Session 22. Dr Elizabeth Fernandez School of Social Sciences and International Relations University of New South Wales Australia [email protected] - PowerPoint PPT Presentation
Transcript of Dr Elizabeth Fernandez School of Social Sciences and International Relations
How do Children Fare in Care: A Longitudinal Study of Outcomes in Foster Care
Family Permanence and Foster Care Session 22
Dr Elizabeth FernandezSchool of Social Sciences and International Relations
University of New South WalesAustralia
International Society for Child Indicators Inaugural ConferenceChapin Hall Center for Children
Chicago, IllinoisJune 26-28, 2007

Children’s Conceptions of Fostering
• What is a foster home?: "Places of refuge where people can stay, where you get looked after.” Would you call this home a foster home?: "No, this is my house.” (009, male, 11 years old)
• Would you call yourself a foster child?: "Not really, I wouldn't call myself one cause my carer treats me as her own son, even though she's already got one and she's already got a daughter but she treats me as her own son. And I really adore her.”
• “No a normal kid like everyone else. Because here it is like a real family. Some parents don’t care about children, that’s why I came into foster care.” (005, male, 12 years old)

Children’s Conceptions of Fostering (cont’d)
• “A person who acts like your mum and dad, I haven’t got my mum and dad or my brother or the pets that I had before. That’s why it’s not the same. You’re in somebody else’s house and it’s not your real mum and dad but it’s the person that’s looking after you for the moment.” (female, 8 years old)
• “Sort of because they miss their mum and they really want to go back to her, and they won’t be able to see her for a long, long time, so they act differently because of this. But once they settle in they get fine, and then um they just forget about it and start moving on.” (male, 9 years old)
The impact of the care experience on children’s wellbeing
• Children come to the foster family setting as an already at risk group
• In relation to children's wellbeing in care research has identified a range of concerns including
• Instability in care placements (Barber & Delfabbro, 2003; Fernandez, 1999; Pecora, Williams, Kesler & Herings, 2003; Ryan and Testa, 2004)
• Inability of care systems to ensure optimal educational outcomes (Jackson, 2000;Dobel-Ober, Lawrence, Berridge & Sinclair, 2003; Rosenfeld & Richman, 2003; Zetlin, Weinberg & Kimm, 2003)

Previous Research Highlights that:
• Children in care are significantly more likely to exhibit psychological problems than children in the general population (Anderson et al. 2004; Clausen et al. 1998; Barber & Delfabbro, 2003; Minnis & Devine, 2001; Meltzer et al. 2003).
• Evidence of indications of emotional and behavioural concerns in the clinical range (McMillen et al. 2004; Callaghan et al. 2003; Garland et al. 2003; Stahmer et al. 2005
• Children who experience multiple changes in caregivers tend to develop elevated emotional and behavioural problems (Stanley et al. 2005)
• Children with externalising behaviours are particularly vulnerable to placement breakdown (Stijker et al. 2005; Newton et al. 2000; Mc Auley & Trew, 2000).
• Children leaving the care system are disproportionately likely to experience homelessness, unemployment, depression and become involved in problematic activity (Courtney & Dworsky, 2006; Stein, 1994).

Previous Research Highlights (cont)
• Studies undertaken internationally point to the educational deficits which children bring to the care experience (Jackson, 2001; Harker et al. 2004; Mitic & Rimer, 2002; Zetlin et al. 2003)
• Low educational attainment, poor attendance, overrepresentation in school exclusion, frequent school changes ,low completion rates and high unemployment among those who age out of the system are noted (Blome, 1997; Harker et al. 2004; Jackson, 2001; Pecora et al. 2006; Stein, 1994)
• Limited supports are available in schools to respond to the emotional and behavioural difficulties children present (Elliot, 2002; Remsbery, 2003 )
The impact of the care experience on children’s wellbeing
• Current research points to limitations of cross sectional studies in capturing developmental sequences
• Increasing recognition of the need to give a central place to the voices of children in research and practice (Gilligan, 2002; Newman, 2003)
• Limited research that views outcome from different participants in the foster care process (Courtney, 2000; Kelly & Gilligan, 2002)
The Research Aims
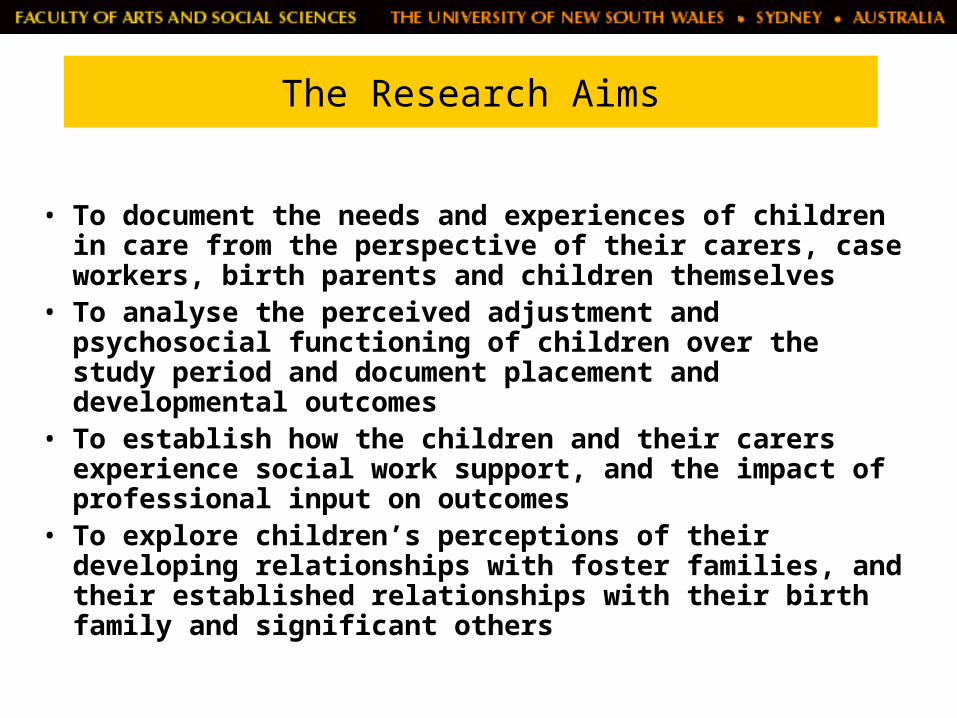
• To document the needs and experiences of children in care from the perspective of their carers, case workers, birth parents and children themselves
• To analyse the perceived adjustment and psychosocial functioning of children over the study period and document placement and developmental outcomes
• To establish how the children and their carers experience social work support, and the impact of professional input on outcomes
• To explore children’s perceptions of their developing relationships with foster families, and their established relationships with their birth family and significant others

Data Collection
• Interviews were carried out at 4 months after entry to care and 18-24 month intervals thereafter
• Child interviews (8 – 18 yrs) • Caseworkers (of children of all ages)• Foster/adoptive carers (of children of all ages) • Birth parents (of children of all ages)

Interviews Explored
• Conceptions of fostering• Child’s placement history• Reasons for entry to care• Relationship with the carer and foster siblings• Relationship with the birth family• Schooling experience• Physical health• Emotional and behavioural development• Identity and self image • Relationship with caseworker and agency
Data Collection (cont’d)
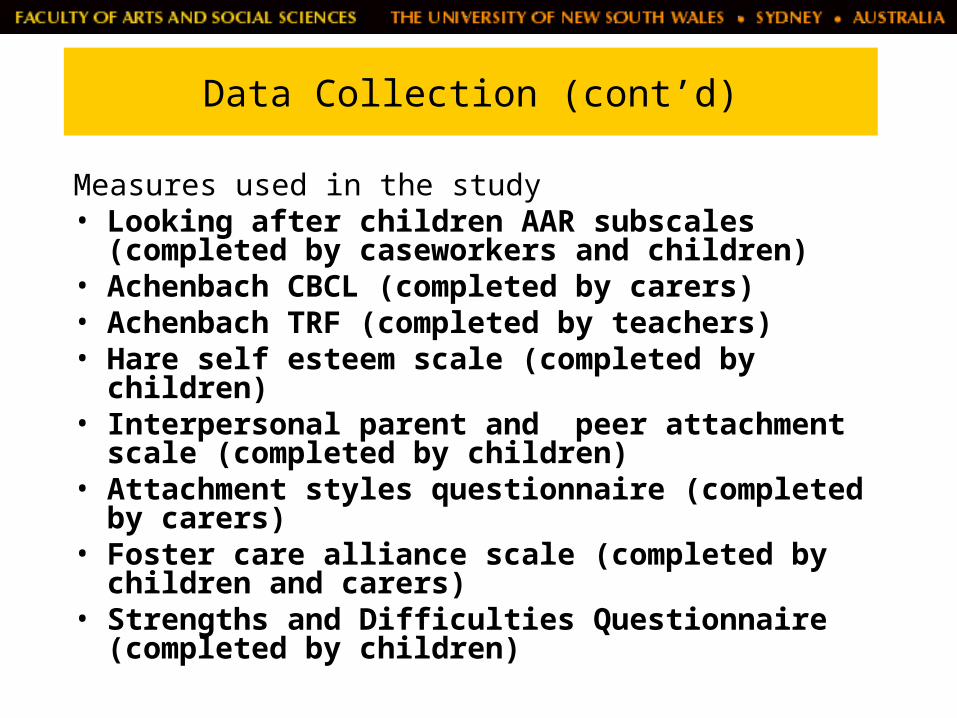
Measures used in the study• Looking after children AAR subscales (completed by
caseworkers and children)• Achenbach CBCL (completed by carers)• Achenbach TRF (completed by teachers)• Hare self esteem scale (completed by children)• Interpersonal parent and peer attachment scale
(completed by children)• Attachment styles questionnaire (completed by
carers)• Foster care alliance scale (completed by children
and carers)• Strengths and Difficulties Questionnaire (completed
by children)
About the Children
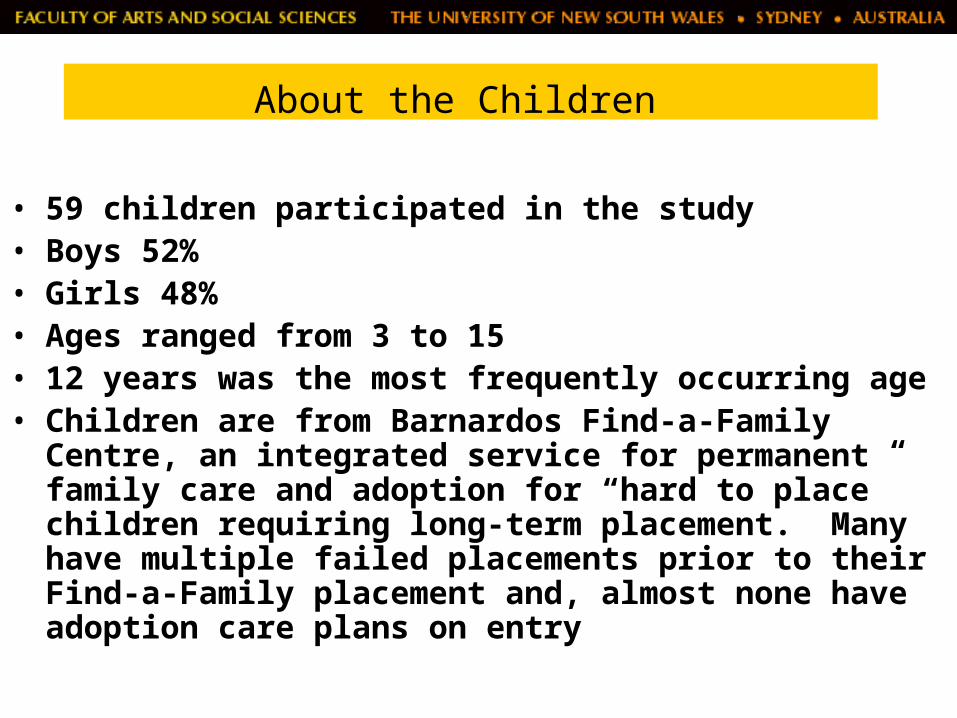
• 59 children participated in the study• Boys 52%• Girls 48%• Ages ranged from 3 to 15• 12 years was the most frequently occurring age • Children are from Barnardos Find-a-Family Centre, an
integrated service for permanent family care and adoption for “hard to place” children requiring long-term placement. Many have multiple failed placements prior to their Find-a-Family placement and, almost none have adoption care plans on entry

Primary Reasons for Care
• Factors related to the Birth Mothers• Drug or alcohol dependence (29%)• Mental health 22% cases • Physical abuse and neglect 36% of cases• Factors related to the Birth Father • Abandonment 39% of cases. • Physical or sexual abuse or neglectful parenting 39%• Domestic violence (22%)• Child factors • Emotional and behavioural factors (25%) including
antisocial behaviour or severe emotional disturbance such as depression

Care History
• Respondents have been in care for 8.2 years on average and have been in Barnardo’s care for the majority of that time (6.3 years). Respondents have had on average 4.4 placements in total.
• Males have spent longer in care on average (9 years) than have females (7.4 years)
• The majority (71%) of children are in non relative foster families and 19% are adopted

Change of Placement and Children’s Responses
Many of the children interviewed had multiple carers over time. Children’s placements ranged from 2 to 7 foster homes, an irony that is presented by one of the children when asked why they thought they were in care
• ‘Ah, cause we've moved around a lot’ (male, 11yrs)
• Every kid should get a prize for having the courage to move. Something like a hundred dollars’ (male,13 yrs)
Below another child advise around an issue that many of the children have experienced, that is being moved because of challenging behaviours.
• ‘Don’t chuck temper tantrums. And that's it’( male,13 yrs)

Change of Placement and Children’s Responses (cont)
Many children were aware that they would eventually find a permanent foster placement, even though they were not sure how long their present placement would last
• ‘(SIGH) well if I am very very, extremely good I might stay here and this might be my forever family but if um, if this isn’t a good place I will have to move, which I don’t want to’ (female, 8 yrs)
• ‘ (Until) I'm old enough to move out into a flat’ (female, 11yrs)

Change of SchoolsThree quarters of the children had experienced at least one
change in schooling since their separation from their birth family More than half of the children had had three or more changes
• ‘Heaps, probably about 5 or 6 times. I think I get stupider every time I have to move’ (female,14 yrs)
• ‘I’ve been to thousands of schools...about, 5 or 6. I don't know’ (male, 11yrs))
When asked to evaluate how they were doing at school, most children attempted to assess their own abilities.
• ‘…can't hardly read…and plus I'm year 5 going in year 6…can't even hardly read or do neat writing…’ (female, 10 yrs)
• ‘Um, playing and English. I'm not so good at my maths’ (female, 11yrs)• ‘Hand writing everything. Not everything in the world though…I'm good at mostly
everything’ (female, 8yrs)
Q. what are you like compared to your classmates?• Um, middle of the class. I mean, we got graded and it goes up to A's and I'm in
the…(middle)’ (male, 12yrs)

Foster Mother Cohesion & Foster Father Cohesion
0
10
20
30
40
50
60
70
80
Very Well Quite Well Not Very Well & Don't Know
Cohesion (Base = 42)
Pe
r c
en
t
Foster Mother
Foster Father

Foster Parent Cohesion• Forty-eight per cent of respondents indicated they
got on 'very well' both with their foster mother and their foster father.
• All but one respondent indicated that they got on with their foster mother ‘very well’ or ‘quite well’
• Almost 9 out of 10 respondents were positive about their relationship with their foster father, rating 'very well' or 'quite well‘
• Just over 1 in 10 respondents indicated that they got on with their foster father 'not very well'
• Eighty-six per cent of respondents were positive about their relationship with their foster sibling
• However nearly 1 in 10 respondents indicated that they got on with their foster sibling 'not very well'

Children’s perceptions of cohesion
• The relationships with the foster mothers remained very positive, especially amongst boys and younger children
• Children who had a stronger level of maternal attachment were more likely to sustain highly cohesive relationships within the foster families
• The higher the cohesion with the foster mother the higher the cohesion with the foster father (r=0.37, n=40, p=0.021)
• Age was significantly related to cohesion with the foster father (r=0.5, p=0.01) such that older children were less likely to report getting on “very well” with the foster father
Children’s perceptions of cohesion (cont’d)
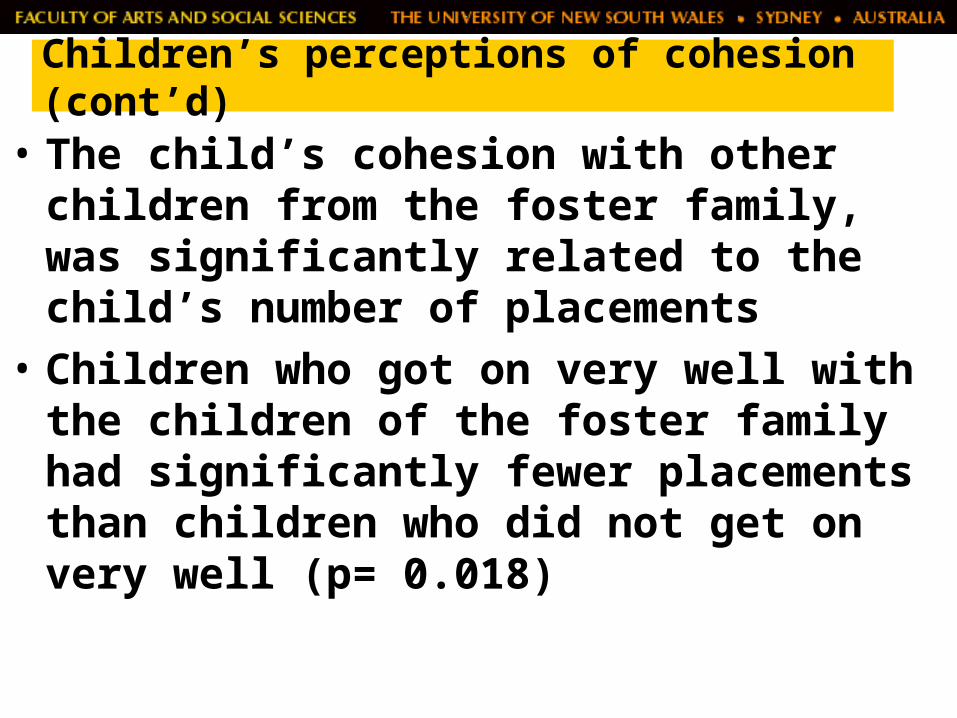
• The child’s cohesion with other children from the foster family, was significantly related to the child’s number of placements
• Children who got on very well with the children of the foster family had significantly fewer placements than children who did not get on very well (p= 0.018)

Cohesion (cont)
• ‘She's (female carer), understanding, she's nice. She helps me with lots of things. She’s just a very kind person she's got a nice heart…sometimes I give a hug to (carer) before I go to bed…I don't know what's the most important thing. When I go shopping with her, just me and her by ourselves we just talk you know. I like how we have time by ourselves sometimes’ (female, 17yrs)
• ‘She, umm, she'll spend lots of time on me and she's really nice, and…she helps me with things when I need help...she always has the right advice to tell me...cause they treat me like I’m part of the family so I think I am’ (female, 10yrs)

Birth Parent Contact
0
10
20
30
40
50
60
Once a Month orless
Quarterly/Holidays Annually Never
Contact (Base M=39; F=32)
Pe
r c
en
t
Birth Mother
Birth Father
Contact with Birth Parents

Frequency of Contact
• Birth Mothers and siblings were the most frequently contacted family members
• One child in 5 had contact with his or her birth mother at least fortnightly
• Nearly three-quarters of children (72%) saw their birth mother at least once every 3 months
• A quarter had no contact at all• Just over half (56%) of the children had no
contact at all with their birth father• 28% saw their father between once a month and
every few months or holidays

Q. How do you feel when you see her? (Birth Mother)• ‘Happy…Mmm, I dunno I just have this feeling…Mmm,
nice, mmm happy, mmm that's about it’ (006, male, 11yrs)
• ‘Um, the fact that I'm happy’ (007, female, 11yrs)• ‘I’m always missing my mum. It doesn't happen that
much now, cause I see her every month’ (male, 13yrs) • ‘I ask her a lot of questions, I ask her what was she like
when she was little, what was I like when I was little…Just to see her…She realises what she's done and she tried to change but that's her’ (female, 17yrs)
• ‘Most of the time she doesn't turn up…She might turn up every second time….She's heaps nice. And she never laid a hand on me’ (male, 14yrs)
Current Contact with Family of Origin
Current Contact with Family of Origin (cont)
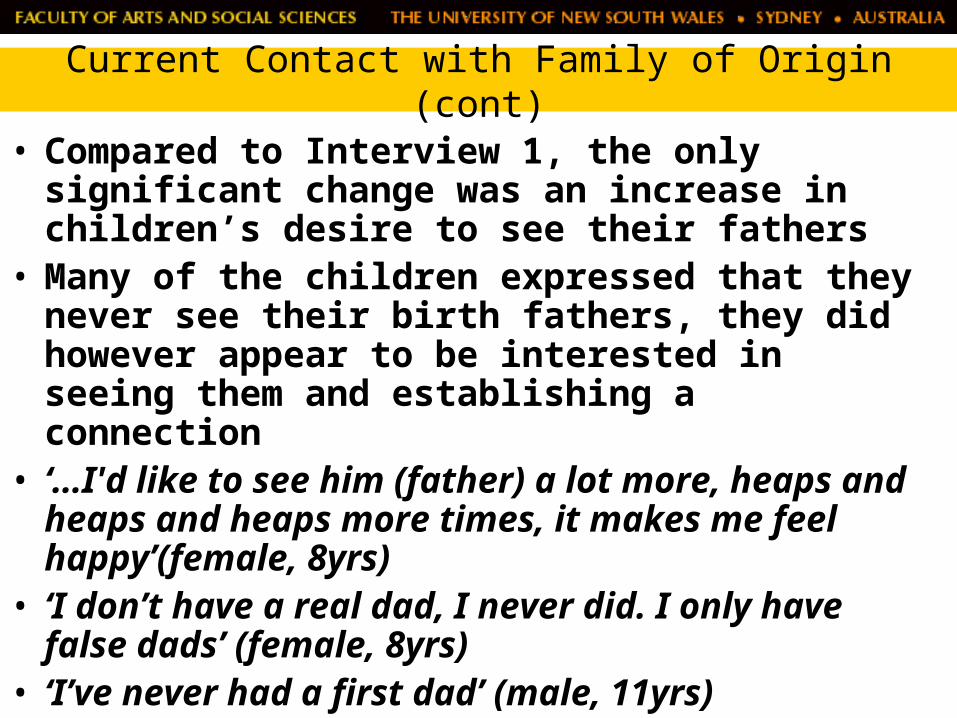
• Compared to Interview 1, the only significant change was an increase in children’s desire to see their fathers
• Many of the children expressed that they never see their birth fathers, they did however appear to be interested in seeing them and establishing a connection
• ‘…I'd like to see him (father) a lot more, heaps and heaps and heaps more times, it makes me feel happy’(female, 8yrs)
• ‘I don’t have a real dad, I never did. I only have false dads’ (female, 8yrs)
• ‘I’ve never had a first dad’ (male, 11yrs)

Children’s Self Esteem• Children’s self esteem was assessed using the Hare
self esteem scale. Includes peer self-esteem, home self esteem and school self-esteem and a total score
• Girls and boys both had an average of 82• Peer self esteem was negatively correlated with total
number of placements, (r= -0.42, p=0.05) so that the more placements children had the lower their peer self esteem
• Age at entry to care was also found to be related to “global self esteem” (r=0.37, p=0.05). That is, children who went into care at an older age had higher self esteem at interview 2

Hare Self Esteem Scores, including gender breakdown
• Girls were found to have remained stable from Interview 2 to Interview 3 on all the subscales and the total self esteem score
• Boys however had significantly higher home self esteem scores and total self esteem scores at Interview 3 compared to interview 2.
• This finding is encouraging given the small sample sizes and indicates that boys responded positively to the foster home environment.

Self esteem and Children’s care history
• From the children’s interviews it was apparent that being in care affected their self esteem. However, the children did also compare themselves to their peers for some reassurance.
• ‘It’s like we're second hand kids; unless that's how all kids feel who are my age…’ (female, 12yrs)
• ‘When I see my friends with their parents I see nothing different...it just seems the same, like I’ve got play stations and Nintendo’s, and being allowed to play and going to friends houses as well’ (male, 13yrs)
• ‘Some people in my class don't even have a dad. And I get lots of stuff’ (female, 10yrs)
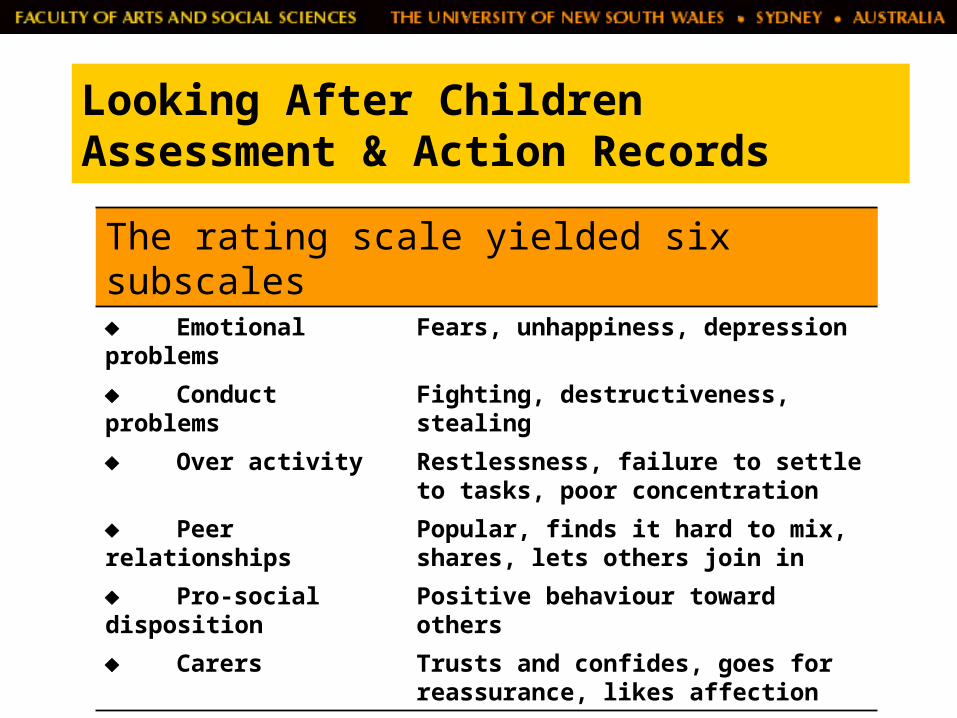
Looking After Children Assessment & Action Records
The rating scale yielded six subscales Emotional problems Fears, unhappiness, depression
Conduct problems Fighting, destructiveness, stealing
Over activity Restlessness, failure to settle to tasks, poor concentration
Peer relationships Popular, finds it hard to mix, shares, lets others join in
Pro-social disposition Positive behaviour toward others
Carers Trusts and confides, goes for reassurance, likes affection
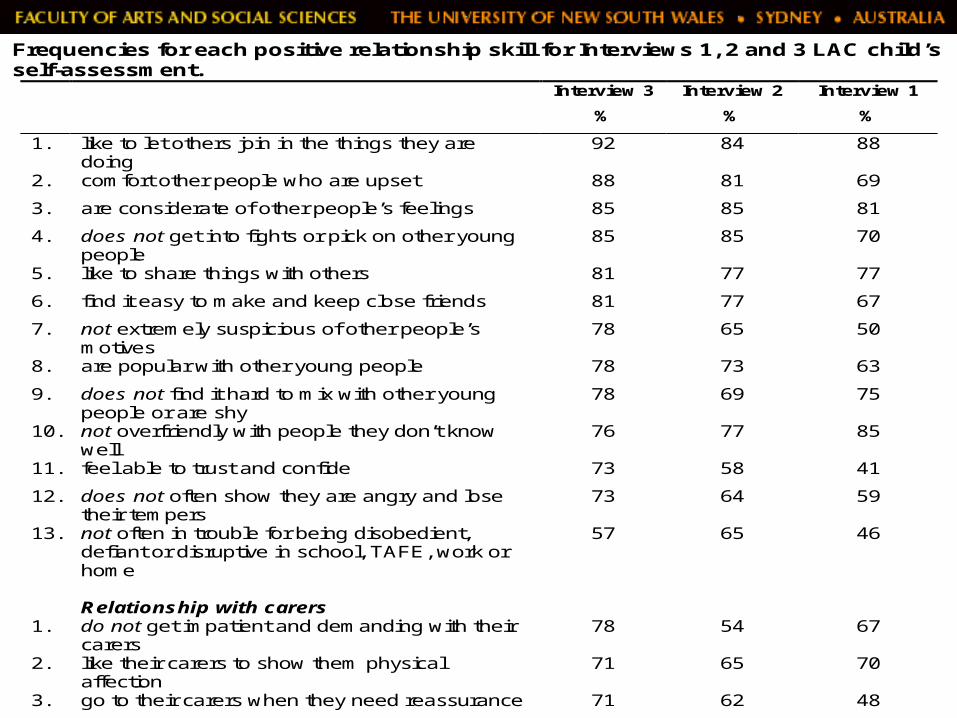
Frequencies for each positive relationship skill for Interviews 1, 2 and 3 LAC child’s self-assessment.
Interview 3
%
Interview 2
%
Interview 1
%
1. like to let others join in the things they are doing
92 84 88
2. comfort other people who are upset 88 81 69
3. are considerate of other people’s feelings 85 85 81
4. does not get into fights or pick on other young people
85 85 70
5. like to share things with others 81 77 77
6. find it easy to make and keep close friends 81 77 67
7. not extremely suspicious of other people’s motives
78 65 50
8. are popular with other young people 78 73 63
9. does not find it hard to mix with other young people or are shy
78 69 75
10. not overfriendly with people they don’t know well
76 77 85
11. feel able to trust and confide 73 58 41
12. does not often show they are angry and lose their tempers
73 64 59
13. not often in trouble for being disobedient, defiant or disruptive in school, TAFE, work or home
57 65 46
Relationship with carers
1. do not get impatient and demanding with their carers
78 54 67
2. like their carers to show them physical affection
71 65 70
3. go to their carers when they need reassurance 71 62 48

Relationship skills
• At Interview 3, 11 skills were reported by more than 75 per cent of the children, an increase of six skills from Interview 1 and four from Interview 2
• At Interview 3 more children were reporting feelings of trust, confidence amongst their peers and less demanding with their carers
• Several behaviours did not improve very much from Interview 2 to 3 including ‘comfort others who are upset’, ‘considerate of other’s feelings’, ‘not getting into fights’, ‘sharing’, ‘ability to make friends’
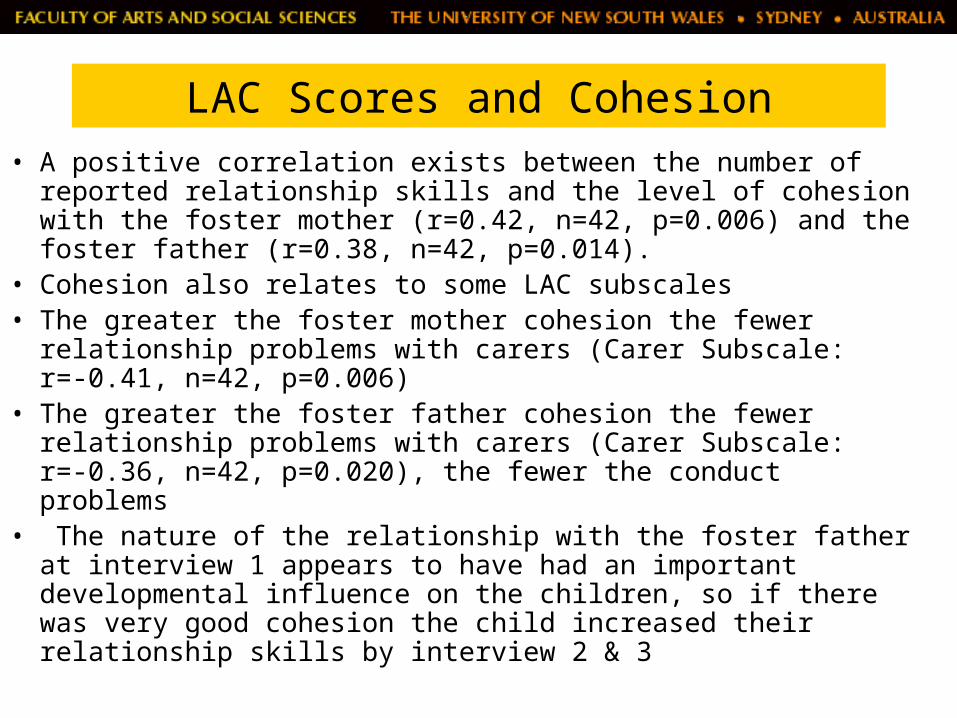
LAC Scores and Cohesion
• A positive correlation exists between the number of reported relationship skills and the level of cohesion with the foster mother (r=0.42, n=42, p=0.006) and the foster father (r=0.38, n=42, p=0.014).
• Cohesion also relates to some LAC subscales • The greater the foster mother cohesion the fewer relationship
problems with carers (Carer Subscale: r=-0.41, n=42, p=0.006)
• The greater the foster father cohesion the fewer relationship problems with carers (Carer Subscale: r=-0.36, n=42, p=0.020), the fewer the conduct problems
• The nature of the relationship with the foster father at interview 1 appears to have had an important developmental influence on the children, so if there was very good cohesion the child increased their relationship skills by interview 2 & 3

Concentration and behaviour problems LAC child’s self-assessment. Interview 3
%
Interview 2
%
Interview 1
%
1. Rush into things without thinking 45 42 41
2. Do not find it easy to concentrate
when they want to
28 44 39
3. Find it difficult to stick to things for
more than a few moments
28 44 31
4. Are very restless and fidgety 28 40 35
5. Not responsible and can not be
trusted
7 12 12
6. Deliberately break or steal things 0 8 0
Most frequently the children reported rushing into things without thinking.

Frequencies for each anxiety symptom from Interview s 1, 2 and 3 LAC child’s self-assessment.
Interview 3
%
Interview 2
%
Interview 1
%
1. Worry a lot 38 27 56
2. Often get aches and pains (including
headaches, stomach aches)
23 19 48
3. Have a very poor appetite or are concerned
about dieting
19 23 32
4. Have difficulty in sleeping because of worry or
anxiety
16 32 44
5. Have strong feelings of misery or sadness 14 38 54
6. Are frightened of particular things or situations
(e.g. open spaces, going to school/TAFE or
being alone)
14 42 40
7. Sometimes wet the bed 4 0 0
8. Deliberately injuring themselves (e.g.cutting, or
taking an overdose)
2 15 4
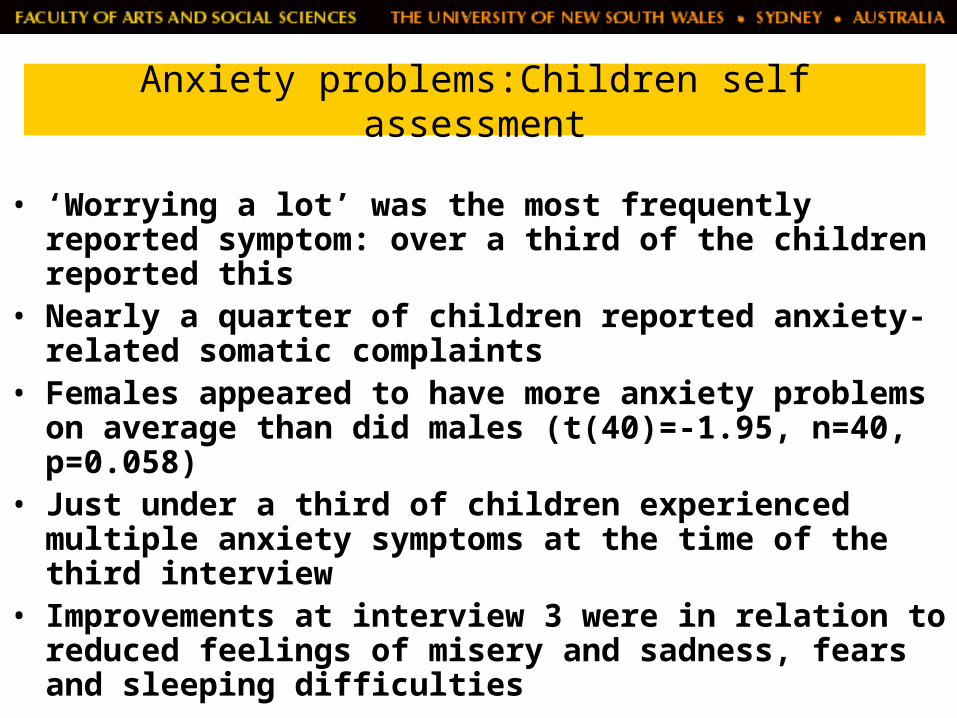
Anxiety problems:Children self assessment
• ‘Worrying a lot’ was the most frequently reported symptom: over a third of the children reported this
• Nearly a quarter of children reported anxiety-related somatic complaints
• Females appeared to have more anxiety problems on average than did males (t(40)=-1.95, n=40, p=0.058)
• Just under a third of children experienced multiple anxiety symptoms at the time of the third interview
• Improvements at interview 3 were in relation to reduced feelings of misery and sadness, fears and sleeping difficulties
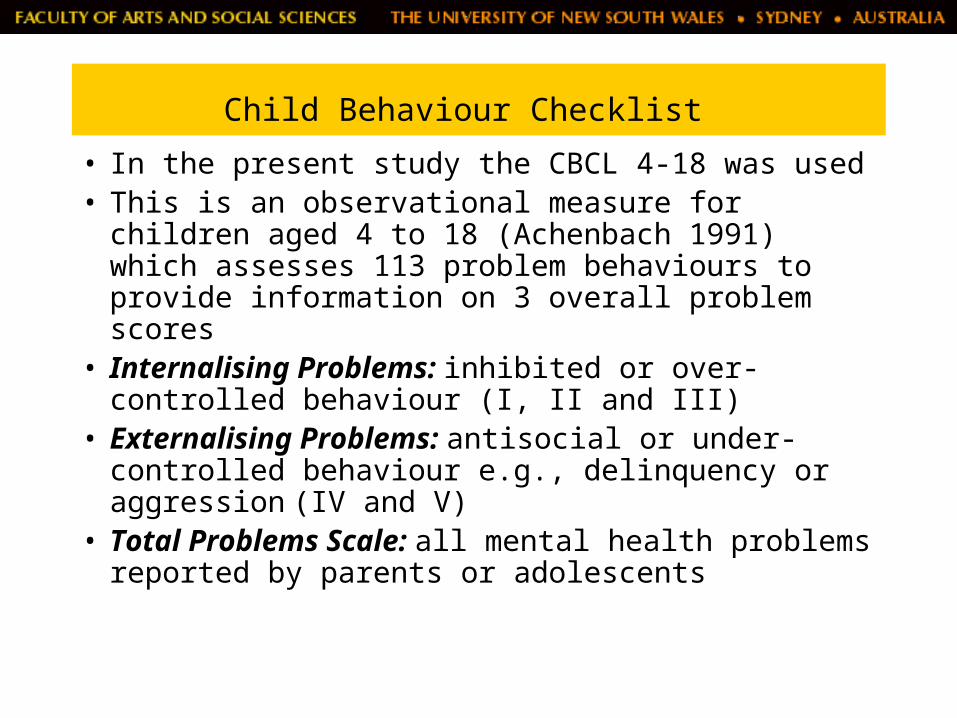
Child Behaviour Checklist • In the present study the CBCL 4-18 was used• This is an observational measure for children
aged 4 to 18 (Achenbach 1991) which assesses 113 problem behaviours to provide information on 3 overall problem scores
• Internalising Problems: inhibited or over-controlled behaviour (I, II and III)
• Externalising Problems: antisocial or under-controlled behaviour e.g., delinquency or aggression (IV and V)
• Total Problems Scale: all mental health problems reported by parents or adolescents
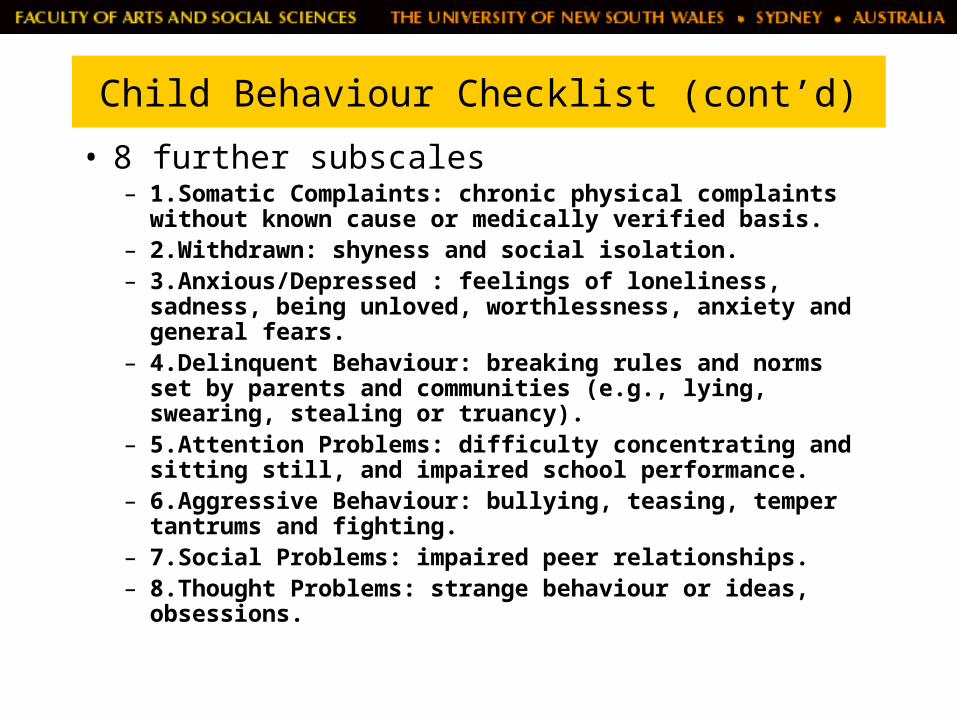
Child Behaviour Checklist (cont’d)
• 8 further subscales – 1.Somatic Complaints: chronic physical complaints without
known cause or medically verified basis. – 2.Withdrawn: shyness and social isolation. – 3.Anxious/Depressed : feelings of loneliness, sadness,
being unloved, worthlessness, anxiety and general fears. – 4.Delinquent Behaviour: breaking rules and norms set by
parents and communities (e.g., lying, swearing, stealing or truancy).
– 5.Attention Problems: difficulty concentrating and sitting still, and impaired school performance.
– 6.Aggressive Behaviour: bullying, teasing, temper tantrums and fighting.
– 7.Social Problems: impaired peer relationships.– 8.Thought Problems: strange behaviour or ideas,
obsessions.
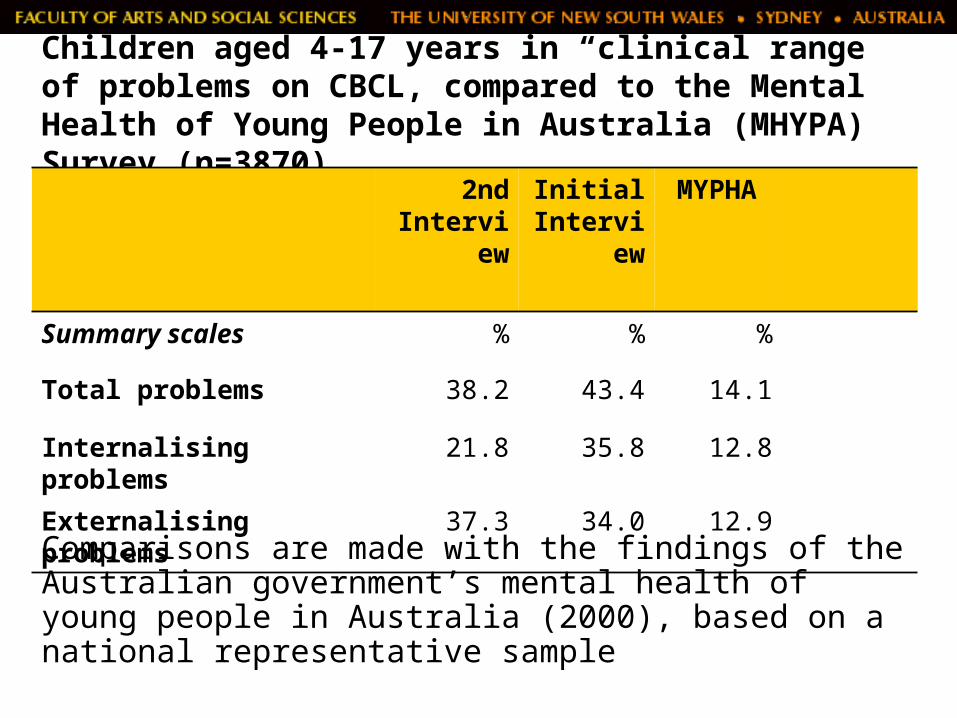
Children aged 4-17 years in “clinical range” of problems on CBCL, compared to the Mental Health of Young People in Australia (MHYPA) Survey (n=3870) 2nd
Interview
Initial Interview
MYPHA
Summary scales % % %
Total problems 38.2 43.4 14.1
Internalising problems 21.8 35.8 12.8
Externalising problems 37.3 34.0 12.9
Comparisons are made with the findings of the Australian government’s mental health of young people in Australia (2000), based on a national representative sample
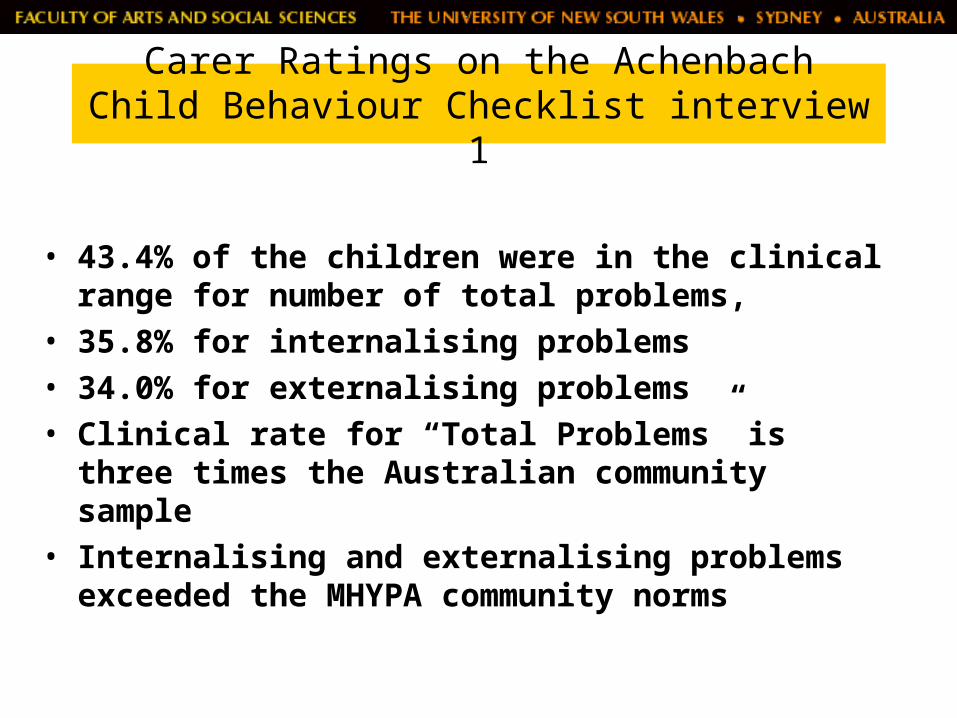
Carer Ratings on the Achenbach Child Behaviour Checklist interview 1
• 43.4% of the children were in the clinical range for number of total problems,
• 35.8% for internalising problems • 34.0% for externalising problems• Clinical rate for “Total Problems” is three times the
Australian community sample• Internalising and externalising problems exceeded
the MHYPA community norms

Carer Ratings on the Achenbach Child Behaviour Checklist interview 2
• Between 7.5 and 28% demonstrated clinically significant problems on the subscales
• Attention problems, social problems, delinquent behaviour, anxiety and depression rated in the clinical range.
• 38% of children were in the clinical range of “total problems”
• 22% for internalising problems• 37% for externalising problems

Comparison data of scores from
Interviews 1 to 2
• Significant decreases detected between carer ratings at Interview 1 and 2 on the internalising scores (t=2.07, df 50, p<0.05) and the anxiety and depression subscale (t=2.01, df 50, p< 0.05)
• Fewer children fell into the clinical range of “total problems” at the second interview
• Ratings remained above the Australian normative data on all subscales total problems and externalising problems
• Internalising problems had dropped.

CBCL Teacher Report Form (TRF)
• Teachers of children in care were asked to complete the Achenbach teachers check-list, a companion to the child behaviour checklist
• The instrument is norm referenced and assesses key problem sub-scales and overall problem scores
• The TRF also includes an Adaptive Functioning Scale which include 5 ratings over two subscales on the child’s positive attributes as displayed at School

TRF (cont’d) • Academic Performance
– teacher’s ratings of the child’s performance in academic subjects
• Adaptive Functioning• Four adaptive characteristics and the sum of
the four characteristics – How hard the child is working – How appropriately he/she is behaving – How much he/she is learning– How happy he/she is
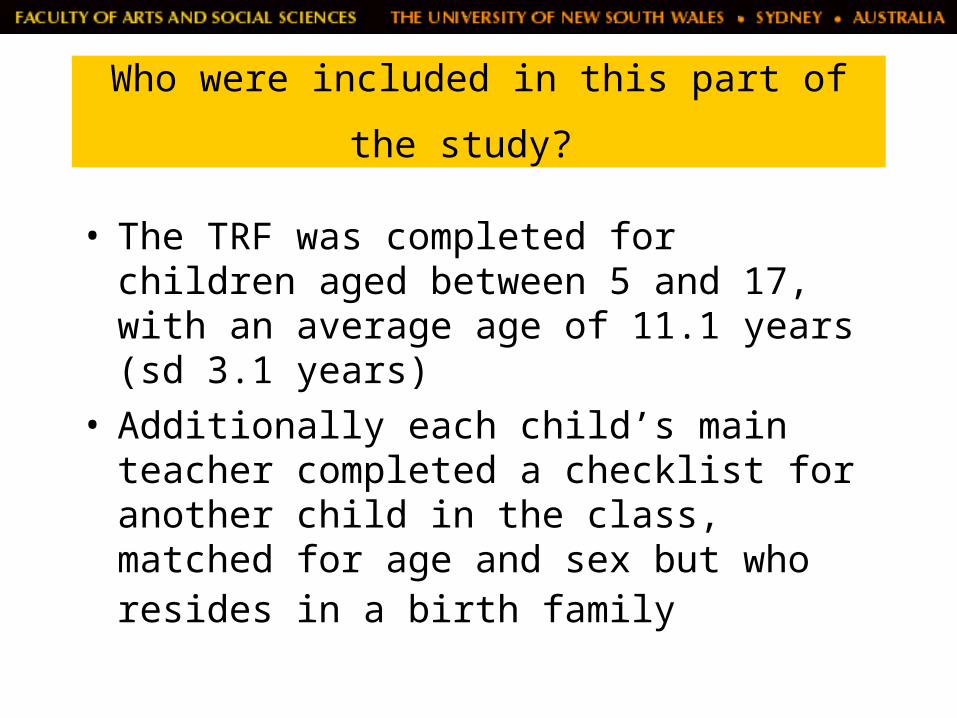
Who were included in this part of the
study?
• The TRF was completed for children aged between 5 and 17, with an average age of 11.1 years (sd 3.1 years)
• Additionally each child’s main teacher completed a checklist for another child in the class, matched for age and sex but who resides in a birth family

Table: T-scores for TRF Problems at Assessment 1 for Care and Control Groups
Care Group Control Group
mean sd max mean sd max
internalising problems
53.35 8.67 80.00 56.37 8.48 68.00
externalising problems
56.72 9.19 84.00 52.14 7.51 66.00
total problems 56.40 8.95 80.00 55.09 7.34 68.00
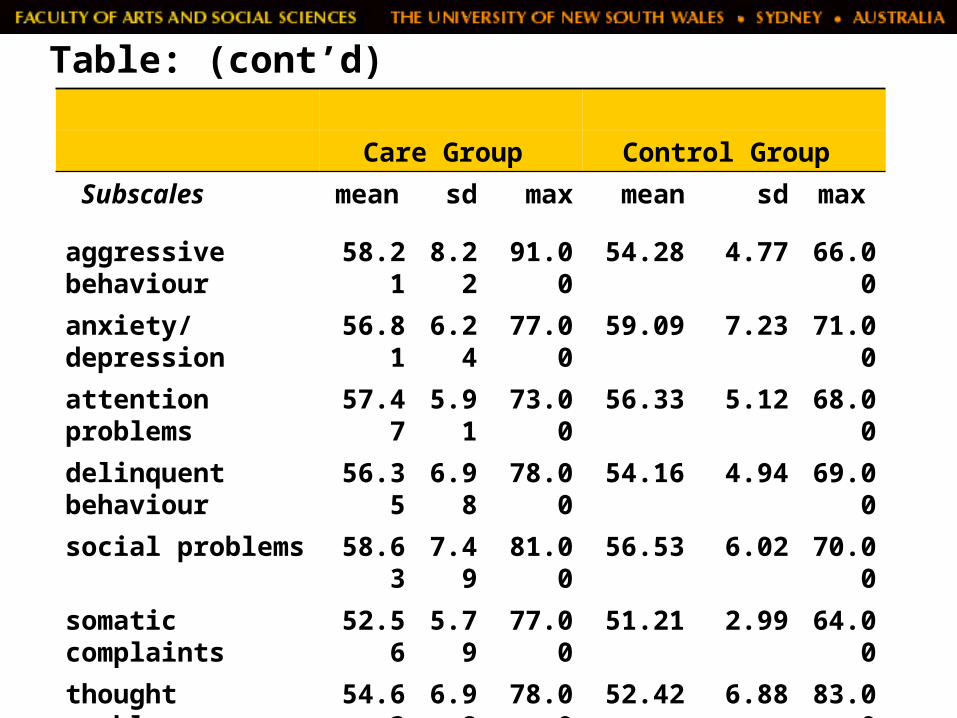
Table: (cont’d)
Care Group Control Group
Subscales mean sd max mean sd max
aggressive behaviour
58.21 8.22 91.00 54.28 4.77 66.00
anxiety/depression 56.81 6.24 77.00 59.09 7.23 71.00
attention problems 57.47 5.91 73.00 56.33 5.12 68.00
delinquent behaviour
56.35 6.98 78.00 54.16 4.94 69.00
social problems 58.63 7.49 81.00 56.53 6.02 70.00
somatic complaints
52.56 5.79 77.00 51.21 2.99 64.00
thought problems 54.63 6.98 78.00 52.42 6.88 83.00
withdrawn 53.91 4.87 67.00 55.95 5.48 70.00
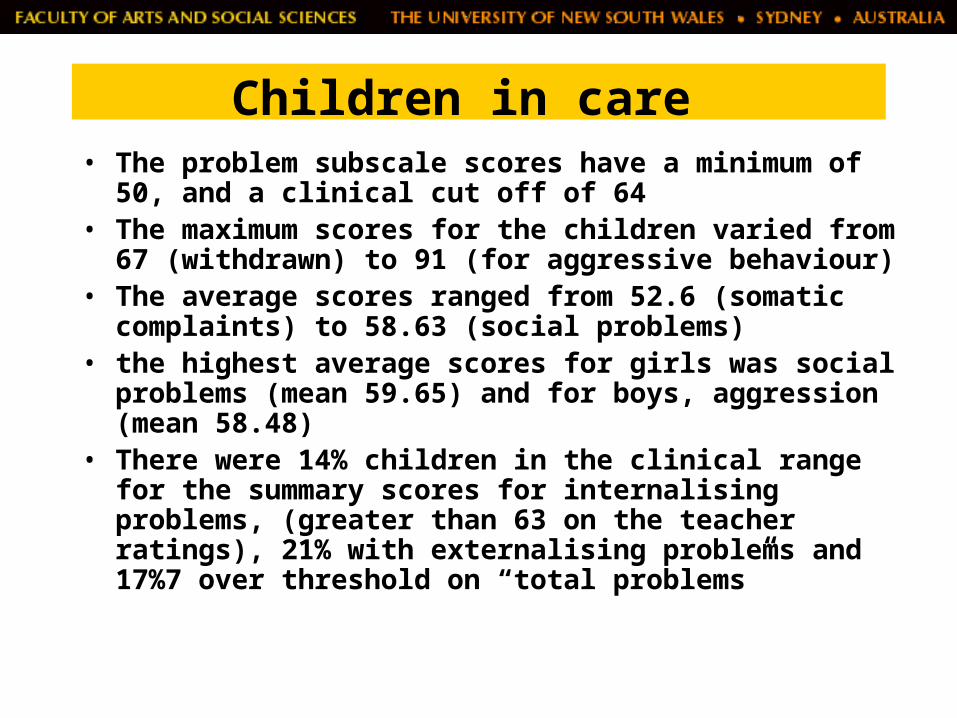
Children in care • The problem subscale scores have a minimum of 50,
and a clinical cut off of 64• The maximum scores for the children varied from 67
(withdrawn) to 91 (for aggressive behaviour)• The average scores ranged from 52.6 (somatic
complaints) to 58.63 (social problems) • the highest average scores for girls was social
problems (mean 59.65) and for boys, aggression (mean 58.48)
• There were 14% children in the clinical range for the summary scores for internalising problems, (greater than 63 on the teacher ratings), 21% with externalising problems and 17%7 over threshold on “total problems”

Control Group Children • Compared to the children in care only two
significant differences were detected• Firstly the children in care had higher t-scores
on aggressive behaviour (means = 58.2 for care and 54.3 control; P=0.013)
• The care group had higher t-scores for externalising problems (means =56.7 for care, 52.1 for control, p=0.019)
• The control group had high level of children in the clinical range of scores for internalising problems
• 25%of the children in the control group had scores which fell in the clinical range for internalising problems

Figure 11: Percentage of children in the clinical range for TRF summary scales compared to the sample of matched children, not in care
0
5
10
15
20
25
30
Barnardos Control
Total Problems Internalising Externalsing
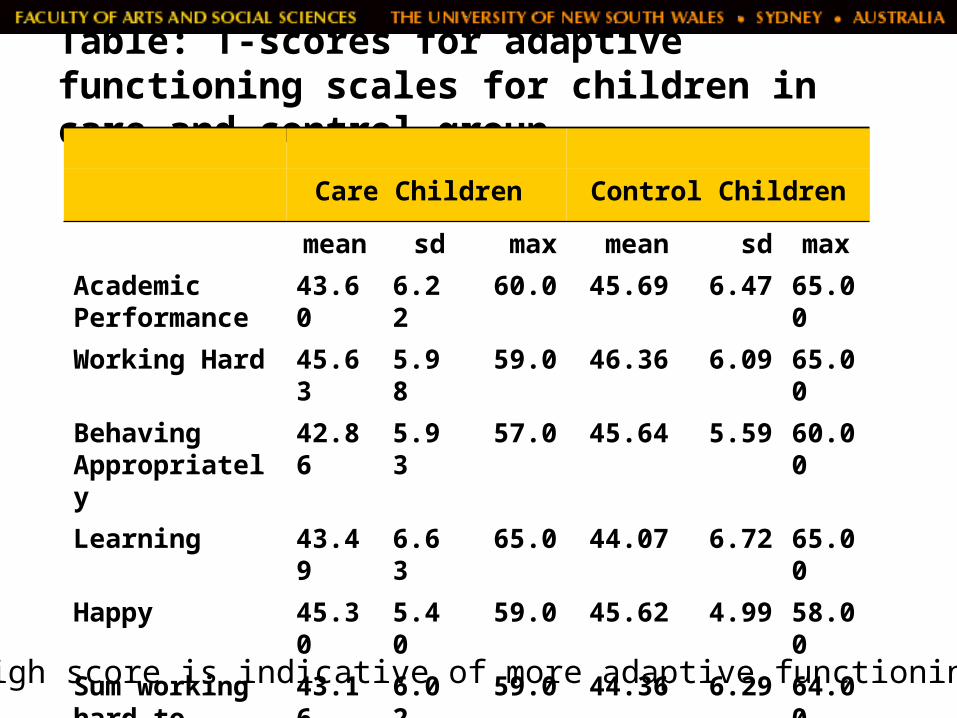
Table: T-scores for adaptive functioning scales for children in care and control group
Care Children Control Children
mean sd max mean sd max
Academic Performance
43.60 6.22 60.0 45.69 6.47 65.00
Working Hard 45.63 5.98 59.0 46.36 6.09 65.00
Behaving Appropriately
42.86 5.93 57.0 45.64 5.59 60.00
Learning 43.49 6.63 65.0 44.07 6.72 65.00
Happy 45.30 5.40 59.0 45.62 4.99 58.00
Sum working hard to happy
43.16 6.02 59.0 44.36 6.29 64.00
A high score is indicative of more adaptive functioning

Adaptive Functioning Scales (TRF) • Children in care
– children in care had the highest average score for “happiness” and the lowest for behaving appropriately
– By gender, girls had their highest average ratings for working hard (mean = 44.85)
– and the boys, being happy (46.35) or working hard (46.5)– The highest percentiles in the scales for this group
ranged from 73rd percentile (behaving appropriately) to the 93rd percentile (learning)
• Control group– The control group children’s percentile means varied
from a low of 30.31 for learning, to a high of 37.40 for working hard

Figure 13: Adaptive scale percentiles for children in care and the matched children, not in care for academic performance and the sum of the adaptive scales
0
5
10
15
20
25
30
35
40
care control girls incare
girlscontrol
boys incare
boyscontrol
Academic Sum of Adaptive
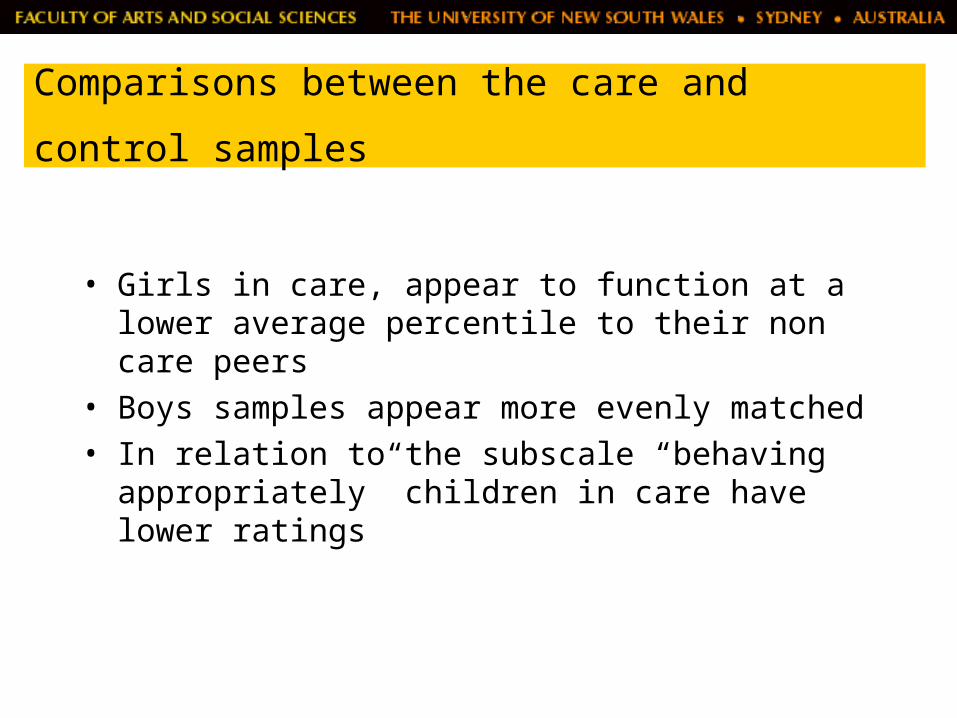
Comparisons between the care and control
samples
• Girls in care, appear to function at a lower average percentile to their non care peers
• Boys samples appear more evenly matched • In relation to the subscale “behaving
appropriately” children in care have lower ratings
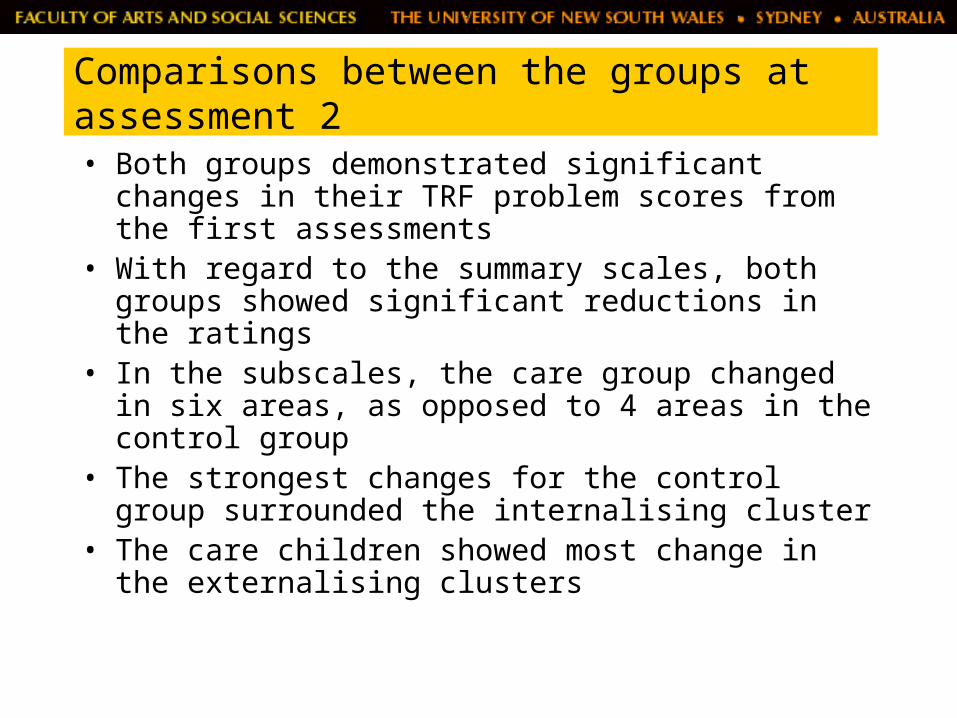
Comparisons between the groups at assessment 2 • Both groups demonstrated significant changes
in their TRF problem scores from the first assessments
• With regard to the summary scales, both groups showed significant reductions in the ratings
• In the subscales, the care group changed in six areas, as opposed to 4 areas in the control group
• The strongest changes for the control group surrounded the internalising cluster
• The care children showed most change in the externalising clusters

Summary • Both the children in care and control group had
arrange of problems detected• Evidence of a greater prevalence of problems
in the care group• The high prevalence of internalising problems
amongst the control group • At the second assessment there were no
differences between the two groups on the problem subscales, which, in a restorative program is a positive finding

Summary (cont’d)
• On the adaptive functioning scales, children in care showed significant improvements across all subscales
• Children in care were functioning near to the 50th percentile, based on the normal population
• Control group showed some significant gains but without the same breadth or magnitude
• Some of this change may be attributed to the effects of restorative care and the Barnardos intervention

Comparisons between the groups at assessment 2 (cont’d)
• the teachers not “blind” to the status of the two children that they were assessing
• factors need to be considered when interpreting these data – Some of these changes might be apportioned to
different rating styles of the teachers at the different time points, but this is a constant for the two groups.
– Some may be natural maturation although the age related norms should also account for this effect.
– Finally some of the effects may be attributed to the effects of the Barnardos intervention
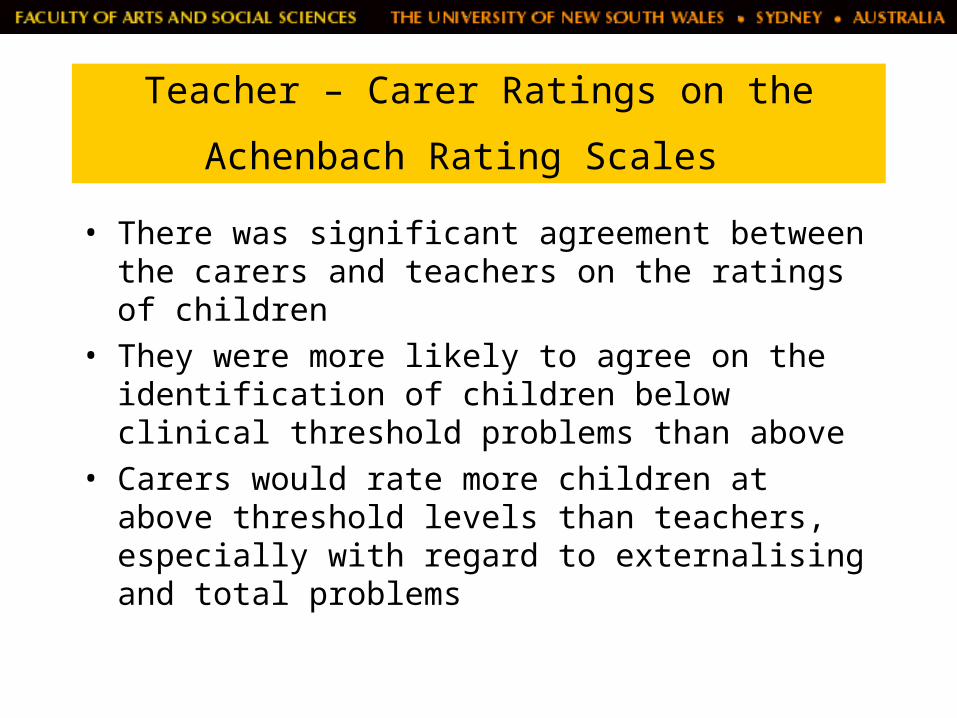
Teacher – Carer Ratings on the
Achenbach Rating Scales • There was significant agreement between the
carers and teachers on the ratings of children• They were more likely to agree on the
identification of children below clinical threshold problems than above
• Carers would rate more children at above threshold levels than teachers, especially with regard to externalising and total problems
Teacher – Carer Ratings on the
Achenbach Rating Scales (cont’d) • This difference may be an indication that
teachers were more conservative than the carers
• Have a better idea of the normal range of behaviour
• The structure of the classroom provides sufficient guidelines for the children to behave within non clinical levels
• In the absence of such structure, the carers observe more problematic spectrum
Summary and implications
• Children had high levels of psychological need• Problems with attention, social interactions, anxiety, aggression
approximate estimates from other studies• Findings underline the importance of recognising emotional and
behavioural difficulties experienced by children in care early and identifying their impact on carers.
• Vulnerabilities and strengths of children based on gender and age, and the need for individualised and differential responses from carers and caseworkers.
• Recognise adversities which threaten Children’s wellbeing in care such as, maltreatment histories, disrupted attachments and interrupted schooling
• Externalising behaviours have been cited as a strong predictor of placement breakdown (Leathers, 2002)
• Strengthen professional decision making to ensure children are less likely to move
Summary and implications (cont)
• Monitor children at increased risk of instability in care
• Support children at risk of psychological difficulties with therapeutic services
• Support carers in enhancing their relationship with troubled children
• Skill foster parents in approaches needed for the sensitive management of children’s emotional and behavioural problems
• Support carers and teachers through professional training to identify and work with vulnerable children to prevent the development of psychopathology
Focus on Strengths and Competencies of
Children in Care
• Children’s sense of happiness improved overtime is a positive finding implying placement in care provided a route to rehabilitative intervention for children with maltreating histories
• Permanent care afforded a context to develop a more secure base
• Being in care offered a pathway into restorative services
• School environment and the educational process can potentially offer structure, boundaries and security to the children in care systems

Focus on Strengths and Competencies of Children in Care (cont)
• The importance of school in offering children positive role models and benefits of ‘routines and rituals’ for children experiencing upheaval and adversity in their environment (Gilligan,1998)
• Research attributes positive school experience and achievement to ‘happy’ adult behaviour (Rutter, Quinton et al. 1993)
• Instability of care placements and the difficulties involved in starting new schools on a regular basis
present significant challenges to children in care

Resilience enhancing interventions • Develop strategic interventions that promote
children’s strengths and competence • Foster children’s relationship building skills• Support carers in acknowledging and
reinforcing children’s prosocial behaviours• Develop co-ordinated multidisciplinary
response to address overlapping domains of need, such as education and mental health