Dr. Donald L. Fisher, PI Dr. Michael Knodler, Co PI ...transctr/pdf/netc/netcr71_04-2.pdf · Dr....
61
i Driver-Eye-Movement-Based Investigation for Improving Work-Zone Safety Dr. Donald L. Fisher, PI Dr. Michael Knodler, Co PI Jeffrey Muttart, Student Assistant Prepared for The New England Transportation Consortium January 28, 2009 NETCR71 Project No. NETC 04-2 This report, prepared in cooperation with the New England Transportation Consortium, does not constitute a standard, specification, or regulation. The contents of this report reflect the views of the authors who are responsible for the facts and the accuracy of the data presented herein. The contents do not necessarily reflect the views of the New England Transportation Consortium or the Federal Highway Administration.
Transcript of Dr. Donald L. Fisher, PI Dr. Michael Knodler, Co PI ...transctr/pdf/netc/netcr71_04-2.pdf · Dr....

i
Driver-Eye-Movement-Based Investigation for Improving Work-Zone Safety
Dr. Donald L. Fisher, PI Dr. Michael Knodler, Co PI
Jeffrey Muttart, Student Assistant
Prepared for The New England Transportation Consortium
January 28, 2009
NETCR71 Project No. NETC 04-2
This report, prepared in cooperation with the New England Transportation Consortium, does not constitute a standard, specification, or regulation. The contents of this report reflect the views of the authors who are responsible for the facts and the accuracy of the data presented herein. The contents do not necessarily reflect the views of the New England Transportation Consortium or the Federal Highway Administration.

ii
ACKNOWLEDGEMENTS
The following are the members of the Technical Committee that developed the scope of work for the project and provided technical oversight throughout the course of the research: Robert Rocchio, Rhode Island Department of Transportation, Chairman Neil Boudreau, Massachusetts Highway Department Joseph Cristalli, Connecticut Department of Transportation Michael Davies, Federal Highway Administration – Maine Division Bonnie DuBose, Federal Highway Administration – Connecticut Division William Lambert, New Hampshire Department of Transportation Douglas Small, Massachusetts Highway Department William Thompson, Maine Department of Transportation We would also like to thank Steve Socha, members of the University of Massachusetts Police Department, and especially Chief Barbara O’Connor for their help with the study. Further, very sincere thanks must go to Anuj Pradhan, for always being there for others in our lab and for his help on this project.

iii
Technical Report Documentation Page
1. Report No.
2. Government Accession No.
N/A 3. Recipient’s Catalog No.
N/A
4. Title and Subtitle
5. Report Date
6. Performing Organization Code
N/A 7. Author(s) 8. Performing Organization Report No.
Dr. Donald L. Fisher, PI Dr. Michael Knodler, Co PI Jeffrey Muttart, Student Assistant
NETCR71
9. Performing Organization Name and Address
Department of Mechanical and Industrial Engineering, University of Massachusetts Amherst
10 Work Unit No. (TRAIS)
N/A
11. Contract or Grant No.
N/A
13. Type of Report and Period Covered 12. Sponsoring Agency Name and Address
New England Transportation Consortium C/O Advanced Technology & Manufacturing Center University of Massachusetts Dartmouth 151 Martine Street Fall River, MA 02723
Final Report
14. Sponsoring Agency Code
NETC 04-2 study conducted in cooperation with the U.S. DOT
15 Supplementary Notes
N/A 16. Abstract
17. Key Words
18. Distribution Statement
No restrictions. This document is available to the public through the National Technical Information Service, Springfield, Virginia 22161.
19. Security Classif. (of this report) Unclassified
20. Security Classif. (of this page) Unclassified
21. No. of Pages
22. Price
N/A Form DOT F 1700.7 (8-72) Reproduction of completed page authorized
Crashes continue to be a problem in work zones. Analyses have indicated that rear-end and sideswipe crashes are the most frequent. Investigators have hypothesized that distractions are often the cause of both types of crashes. These distractions will only increase as more and more drivers attend to other tasks, such as cell phone conversations. Three experiments were run todetermine whether cell phone use in work zones increased drivers’ inattention to the forward roadway. In Experiment 1, driverswere asked to navigate a virtual roadway on a driving simulator which contained a number of work zones. In Experiment 2,drivers were asked to navigate a test track in a real car which contained an actual work zone. And in Experiment 3, drivers wereagain asked to navigate a virtual roadway with signs warning drivers not to use their cell phones in the work zone. In allexperiments, the drivers were asked to engage in a mock cell phone conversation for some portion of the trials. And in allexperiments, the drivers’ eyes were tracked. Cell phones clearly decreased drivers’ ability to respond to events around them asdetermined both by vehicle and eye behavior. And warning signs were effective at increasing drivers’ attention to the roadway.
Driver-Eye-Movement-Based Investigation for Improving Work-Zone Safety
NETCR71
January 28, 2009
61
work-zone safety, cell phone use,driver-eye-movement

iv

1
TABLE OF CONTENTS
1. EXECUTIVE SUMMARY ............................................................................................... 3 2. BACKGROUND AND OBJECTIVES................................................................................ 4
2.1 Rear-End Crashes................................................................................................ 4 2.2 Side-Swipe Crashes ............................................................................................ 5 2.3 Research Goal and Hypotheses........................................................................... 6
3. EXPERIMENT 1: DRIVING SIMULATOR ...................................................................... 6 3.1 Method ................................................................................................................ 7
3.1.1 Participants...................................................................................................... 7 3.1.2 Equipment ....................................................................................................... 7 3.1.3 Simulation (Visual Database and Scenarios).................................................. 8 3.1.4 Hands Free Cell Phone Task........................................................................... 9 3.1.5 Experimental Design..................................................................................... 10 3.1.6 Procedure ...................................................................................................... 12 3.1.7 Dependent Variables..................................................................................... 13
3.2 Results and Discussion ..................................................................................... 14 3.2.1 Distance to First Response............................................................................ 14 3.2.2 Brake Response Time ................................................................................... 15 3.2.3 Search Area................................................................................................... 15 3.2.4 Relative Velocity at 49 Feet.......................................................................... 16 3.2.5 Hard Brakes .................................................................................................. 17 3.2.6 Mirror Glances .............................................................................................. 18 3.2.7 Workload....................................................................................................... 18
3.3 Conclusions....................................................................................................... 19 4. EXPERIMENT 2: OPEN ROAD ................................................................................... 20
4.1 Method .............................................................................................................. 20 4.1.1 Participants.................................................................................................... 21 4.1.2 Equipment ..................................................................................................... 21 4.1.3 Field Course .................................................................................................. 24 4.1.4 Experimental Design..................................................................................... 27 4.1.5 Procedure ...................................................................................................... 28
4.2 Dependent Variables......................................................................................... 29 4.2.1 Hard Brakes (Simulator): Relative Velocity and Deceleration Rate (Field) 29 4.2.2 Distance Before Braking Response (Simulator): SAVb and Minimum Closing Distance (Field) ........................................................................................... 30 4.2.3 Brake Response Time (Simulator and Field)................................................ 31 4.2.4 Subjective Ratings of Workload and Hard Brakes(Simulator and Field)..... 32
4.3 Results and Discussion ..................................................................................... 32 4.3.1 Drivers Who Braked in the Target Zone....................................................... 33 4.3.2 Drivers Who Rode the Brakes ...................................................................... 34 4.3.3 Drives Who Rode the Throttle...................................................................... 35 4.3.4 Workload and Performance Index ................................................................ 36
4.4 Conclusions....................................................................................................... 37 5. EXPERIMENT 3: DRIVING SIMULATOR AND WARNING SIGNS ................................ 38
5.1 Method .............................................................................................................. 39

2
5.1.1 Participants.................................................................................................... 39 5.1.2 Equipment ..................................................................................................... 39 5.1.3 Experimental Design..................................................................................... 39 5.1.4 Simulation ..................................................................................................... 40 5.1.5 Procedure ...................................................................................................... 40 5.1.6 Dependent Variables..................................................................................... 40
5.2 Results and Discussion ..................................................................................... 41 5.2.1 Compliance ................................................................................................... 42 5.2.2 Crash Rate..................................................................................................... 42 5.2.3 Brake Response Time ................................................................................... 42 5.2.4 Braking Latency Time .................................................................................. 42 5.2.5 Minimum Following Distance ...................................................................... 43 5.2.6 Minimum Speed............................................................................................ 43 5.2.7 Subtended Angular Velocity......................................................................... 43 5.2.8 Mirror Glances .............................................................................................. 43 5.2.9 Workload and Performance Index ................................................................ 45
5.3 Conclusions....................................................................................................... 45 6. RESEARCH FINDINGS................................................................................................ 46 7. REFERENCES............................................................................................................. 48 APPENDIX A: HANDS-FREE CELL PHONE TASK .................................................... 52 APPENDIX B: DIRECTIONS FOR WORK ZONE RESEARCH ASSISTANTS ...................... 53 APPENDIX C: DIRECTIONS FOR DRIVER OF THE LEAD VEHICLE ............................... 54 APPENDIX D: DIRECTIONS FOR THE IN-VEHICLE EXPERIMENTER ........................... 56 APPENDIX E: DIRECTIONS FOR THE IN-LAB RESEARCH ASSISTANT.......................... 57

3
1. EXECUTIVE SUMMARY
Crashes continue to be a problem in work zones. Analyses have indicated
that rear-end and sideswipe crashes are the most frequent. Investigators have hypothesized that distractions are often the cause of both types of crashes. These distractions will only increase as more drivers attend to other tasks, such as cell phone conversations. To address this issue, three studies were undertaken. In the first study, virtual worlds that reflect various work zone geometries were developed for an advanced driving simulator. These worlds contained 32 virtual work zones, and 38 drivers navigated through these worlds. On one portion of a trip, the drivers were asked to respond to a series of short sentences, which mimicked a hands-free cell phone conversation. A lead vehicle ahead of the participant driver braked occasionally in the work zone activity area. Braking scenarios involved either the lead vehicle stopping after an advance cue that traffic ahead was going to stop (e.g., a pedestrian might step out into the work zone) or the lead vehicle stopping for no apparent reason, most often after passing a roadside obstacle (potential distraction). Drivers engaged in a mock cell phone task delayed slowing for a stopped lead vehicle in the work zone and then, when they finally did brake, they did so impulsively so that there were more hard brakes (but not necessarily more efficient braking). When at a point only 49 feet (15 m) from impact, cell phone drivers were traveling an average of more than 8 mph (8.8 km/h) faster if a cue indicated that the lead vehicle might brake suddenly. This is of consequence because a driver traveling 31 mph can stop in 49 feet, while a driver who is traveling 39 mph will still be traveling 20 mph after skidding 49 feet. One may infer from these results that drivers using a cell phone in the field would be more likely to rear end a lead vehicle than drivers not so engaged. Furthermore, drivers using the cell phone failed to utilize their rear view mirrors nearly half again as much as those who were driving without a cell phone task. One can infer that this would increase drivers’ risk of side-swipe crashes.
The second study was conducted in the field with simulated work zones and again
half the drivers were engaged in the mock hands-free cell phone task and half were not. The drivers traveled an 8 mile route while following a lead vehicle with a modified taillight/brake-light assembly. When following the lead vehicle the brake lights worked as they normally do (stepping on the brake illuminated the lights). However, while traveling through one of two simulated work zones (with actors actually working), the driver of the lead vehicle could turn the brake lights on even though the lead vehicle was not decelerating (mitigating concerns about safety). Half of the time, the driver would turn the brake lights on when there was a cue that the lead vehicle should be braking (a pedestrian crossing in front of the lead vehicle); and half the time the driver would turn the brake lights on when there was no cue that the lead vehicle might be braking; otherwise the brake lights remained off in the work zone. Similarly to the simulator study, when on the cell phone, drivers’ behavior was not influenced by downstream cueing that the lead vehicle might have to stop. Specifically, the response time and relative velocity of drivers on the cell phone remained unaffected by cueing whereas the response time and relative velocity of drivers not on the cell phone decreased when a cue was given that the lead vehicle might have to brake.
Based upon the results from the first two studies, measures were taken to attempt to
mitigate the risk to which cell phone drivers exposed themselves and others. The results from the first two studies suggest that drivers cued that a lead vehicle might be braking

4
who are not on the cell phone perform significantly better than drivers in the same situation who are on their cell phone. However, if the drivers are not cued, both those on and off the cell phone perform equally poorly. This led to the design of a warning for a work zone that traffic ahead could be slowing that was evaluated in the final study. In this third and final study, the driving simulator was again utilized. The lead vehicle braked in a cued and uncued situation. Furthermore, half of the time that a lead vehicle in the work zone was stopped or traveling slowly, the drivers were displayed a message on a flashing variable message sign, “STOP AHEAD CELL OFF. We found that drivers not engaged in a cell phone task were able to reduce their speed earlier in response to a slowing lead vehicle than were drivers engaged in the cell phone task. They were also less likely to brake hard and more likely to make glances at the rear and side view mirrors. Moreover, drivers not engaged in a cell phone task scanned almost twice as far to the left and right. Finally, the use of a variable message sign that is activated by slow traffic speed was associated with improved performance in both the cell and no cell phone driving.
In summary, the results strongly suggest that cell phone use reduces driver
awareness and may increase the likelihood of a crash in work zone activity areas. Furthermore, signs can be designed for the work zone which helps reduce the likelihood of a crash. Thus, we determined whether drivers traveling through a work zone who were and were not using a cell phone drove more safely in a driving simulator when the sign, SLOW AHEAD/TURN PHONE OFF, was displayed than when no such sign was displayed.
2. BACKGROUND AND OBJECTIVES 2.1 REAR-END CRASHES.
There are a significant number of crashes, injuries, and fatalities in work zones, and the numbers appear to be on the rise. Approximately 37,000 injuries occur in work zones in the U.S. each year (1). Moreover, approximately 1,000 work zone fatalities occur annually (2). Significantly, Raub, Sawaya, Schofer, and Ziliaskopoulos (3) found that these various rates were under-reported because some of the work zone related accidents occurred outside the defined limits of the work zone. For example, when traffic is backed up due to an upcoming work zone, a rear-end crash may occur prior to the work zone. Although this accident is not considered to have occurred inside the work zone, its cause is clearly work zone related. Therefore, the work zone problem is probably even greater than it first appears. Also, there is an increased danger within work zones (4), both to the workers and to the drivers (3). Thus, it is important to determine what can be done to mitigate the problem. Zhao and Garber (4) investigated crashes that occurred throughout Virginia between 1996 and 1999. They found differences between the types of collisions that occurred inside and outside of work zone areas. A higher proportion of work zone crashes involved multiple vehicles. They also found that the proportion and types of collisions varied by work zone region. The highest proportion of work zone crashes occurred within the activity area and the most common type of crash was a rear-end crash. This was not surprising given that there are often few opportunities for escape within the work zone area. Further, there were significantly more sideswipe collisions within the transition area than in the advance warning area. Raub et al. (3) found much the same pattern in Illinois. In particular, they found rear-end collisions to be common in

5
Illinois work zones, particularly in the activity area where there are often limited chances or no chance for escape. Several reasons have been proposed as explanations for each type of crash and are discussed below.
Raub et al. (3) found that driver distraction within the work zone activity area was a significant contributing factor to such crashes. Perhaps the most obvious distraction is the activity within the work zone itself. Drivers distracted by this activity behave in ways that are unexpected (e.g., slowing or stopping when not necessary). This creates the conditions for the increase in rear-end crashes, especially given drivers’ apparent willingness to glance away from the forward roadway at objects on the side of the road for very long and unsafe periods of time (5). In particular, although drivers may be able to stay in their lane while glancing away from the forward roadway (6), it is clear that they will not detect something as simple as a brake light (7; 8; 9). Although distractions within the work zone area may explain the high crash rate within such areas, these distractions are not likely to have increased and thus are unlikely to explain the observed increase in crashes in work zone areas. Instead, it is plausible that the increased use of in-vehicle technologies such as cell phones is a major cause of this increase (10; 6; 11). The effect of cell phone use during driving has been a topic of considerable interest to researchers in transportation engineering. In an influential study that led to restrictions on driver cell phone use in Japan, Ishida and Matsuura (5) compared driver performance with a hand-held cell phone, a hands-free unit, and with no cell phone use. They found that even when a hands-free cell phone was used, driver performance was significantly disrupted. There have been a number of studies yielding similar results here in the United States. For example, it is known that drivers using cell phones take longer to respond to red lights, that it disrupts their visual scanning pattern, and that they are less likely to notice information in their environment even though they are looking directly at it (12) If the use of a cell phone significantly interferes with driving under normal circumstances, it is likely that this interference would be magnified within a work zone in which additional driver attention is required. Part of the problem could be that drivers may not realize the need to pay close attention because they are just driving straight and may have already slowed. Thus, if the driver is paying attention to the cell phone conversation and, in addition, is distracted by activity in the work zone area, the driver may have few if any resources left for processing events directly in front which may need a quick response. In either case, the effects of cell phone use in work zones have yet to be measured. 2.2 SIDE-SWIPE CRASHES Next, consider causes of the second major type of crash in work zones, the sideswipe. Not surprisingly, Raub et al. (3) have shown that vehicle conflicts during merging lead to the sideswipe collisions. Clearly, aggressive drivers who wait until the last minute to take advantage of what is typically a relatively uncongested transition lane are one cause of these conflicts, but some drivers may simply miss the advance warning signs and fail to yield the right of way, in part because they are not paying attention. This failure to see the advance warning signs or to yield the right of way can only be increased by cell phone use. Thus, again it is driver distraction which is at the root of the problem and cell phones (and other in-vehicle technologies) are likely to exacerbate the problem.

6
2.3 RESEARCH GOAL AND HYPOTHESES In summary, there are an increasing number of collisions in work zones. The majority of such collisions are either rear end or sideswipe crashes. Cell phones are a likely contributor to these crashes. Our long term goals are twofold: first to determine whether communications such as occur on the cell phone do indeed lead to an increase in these two very different types of crashes in the work zone and second to determine whether signs can be designed which mitigate the effect of cell phones in work zones. Our goal for the research reported below was to determine whether such communications lead to behaviors which were likely to increase the number of crashes and to evaluate the effects of one particular sign on cell phone use in work zones. On the basis of the available literature, we have four specific research hypotheses which bear on the first general goal: understanding the effect of cell phone communications on drivers’ behavior in work zones. These hypotheses were tested both on a driving simulator (Experiment 1) and in the field (Experiment 2). The first three hypotheses relate to rear end collisions, and the fourth to sideswipe collisions. First, we hypothesized that drivers have more centrally focused search patterns when engaged in a cell phone conversation (H1). Second, because drivers have been shown to have fewer glances to mirrors and the speedometer fewer glances at billboards and decreased horizontal scanning while conversing over a cell phone and furthermore, even when looking ahead, they may not be mentally processing whatever it is upon which they are fixating (6; 11; 5; 13; 14; 15). Thus, we hypothesized that a mock cell phone task would cause these drivers to miss the available peripheral cues to stop ahead and therefore they would respond slower (i.e., to begin breaking further downstream of a triggering event) than drivers who are not engaged in this task (H2). Third, consistent with drivers responding more slowly, we predicted that they would be traveling faster as they came near a lead vehicle which itself was slowing or stopping (H3). Fourth, we hypothesized that because drivers using cell phones fail to detect problems in a timely manner, they would be more likely to brake hard than drivers who are not using a cell phone (H4). Fifth, we hypothesized that, due to the resource demands required by a simulated hands free cell phone task, these drivers would be more likely to fail to look into any of the rear view mirrors prior to a lane change (H5). With respect to the second general goal, designing and evaluating a sign that would mitigate the effects of cell phone use in work zones, we felt that the only generally safe message was one which told drivers to turn off their cell phones. Since drivers using their cell phones already often believe that they are paying attention, telling drivers to pay better attention might have little effect. Thus, in Experiment 3 we tested a message on the driving simulator that told drivers to turn of their cell phone. Some drivers on the cell phone saw the message; other drivers did not. We wanted to determine whether the message had any effect of drivers’ performance in the work zone.
3. EXPERIMENT 1: DRIVING SIMULATOR The nature of rear end and sideswipe crashes makes it very difficult to study them in the field. It is difficult to study both because the situations in which one is interested may put drivers at risk and because one does not have complete control over the factors that one wants to evaluate or over the data one would like to collect. For example, one would like to have a lead vehicle stop because of some activity ahead. This would give information on rear end collisions. Yet this clearly puts the driver at risk. One would like to control the content of the cell phone conversation so that one knew the driver was

7
truly engaged in the conversation. Yet, in the field this is difficult. Finally, one would like to gather eye movements. Knowing whether drivers glanced in their rear or side view mirrors would provide important information on sideswipe collisions. In the field, this can be very challenging. Thus, to address our initial research questions we chose to use a driving simulator instead of a field study where participants maneuvered an actual car on the open road. On a driving simulator, neither the participant driver nor other drivers are a risk to themselves or others. We can control the cognitive demands of the cell phone conversation. And we can easily gather eye movements. 3.1 METHOD
Briefly, the drivers maneuvered a total of 32 work zones in the virtual world, 16 while engaged in a mock cell phone conversation and 16 while not so engaged. All work zones involved closure of one of the two lanes in a highway. The driver followed a lead vehicle, which would, on occasion, slow, to a stop. The stop was either cued (activity downstream of the lead vehicle could be used to infer that the lead vehicle would need to stop) or uncued. Because we wanted to study drivers in situations which demanded their attention, we did not activate the brake lights of the lead vehicle as it slowed. Not only is this realistic (tail lights are often difficult to see in daylight conditions, either because the light levels may be too high, the taillights too dim, or the taillights simply not activated), but it also allowed us better to discriminate between the cued and uncued conditions, an effect that would have been mitigated, presumably, had the taillights been activated. 3.1.1 Participants A total of 38 drivers between the ages of 18 and 59 years participated in the experiment. The average age was 26.4 years. Drivers were allowed to participate only if they had a valid driver’s license and did not wear glasses (contacts were permissible). The recruiting process for drivers was conducted in the Amherst, Massachusetts area using flyers posted around the campus and advertisements. 3.1.2 Equipment A fixed-based driving simulator in the Human Performance Laboratory at the University of Massachusetts at Amherst was utilized for this study (Figure 1). The simulator makes use of a Saturn sedan and the forward driving scene is displayed across three screens that encompass a visual horizontal field of 150 degrees and a vertical field of 30 degrees. The images are displayed at a resolution of 1024 X 768 dpi in each screen with a refresh rate of 60 Hz. The simulator also broadcasts road and engine noises with a Bose surround sound audio system. The ASL MobileEye eye tracker was employed to monitor eye movements of the driver. The MobilEye samples eye movements at 30 Hz. It contains both a scene camera (pointed ahead of the driver) and infrared optics. In the video that is reconstructed from the infrared and scene data, a crosshair representing the direction of gaze of the driver is superimposed onto the forward scene view. Among other things, this allows one to determine whether drivers made glances into the rear view mirrors prior to attempting a lane change.

8
Figure 1: University of Massachusetts at Amherst Driving Simulator 3.1.3 Simulation (Visual Database and Scenarios)
While traveling a total of 56 miles in the experiment, each driver maneuvered through 32 work zones and faced an emergency response situation 16 times. The entire 56 mile trip was divided into 4 blocks, each block contained eight work zones. Each block consisted of a simulated drive on a four-lane divided highway (two lanes in each direction); a grassy median divider separated the lanes in each direction. In each block, signs directing the drivers to move into either the right or left lane were placed in such a way that there was an equal likelihood of a driver being in either the right or left lane and being faced with a work zone in the right or left lane. Therefore, half the time the driver had to negotiate a transition for the work zone and half the time they were already in the appropriate lane. Leading up to the work zone were three sets of signs (one on each side of the road). The first set warned of a work zone ahead. The second set, 500 feet away, advised the driver of either a right or left lane closure. The third set, another 500 feet from the second set, consisted of symbolic merge signs. There was at least one mile dividing the end transition of each work zone with the pre-construction signing for the next.
The environment was a rural highway with rolling hills, embankments and trees along each side of the road (Figure 2). The simulated environment was set to cloudy and 3:00 PM (traveling easterly) to improve the contrast with the signs. The road was straight with four 22.5-degree turns that had a radius of 270 m. In addition to the participant driver, there were other vehicles ahead of the driver, most notably a lead vehicle. This lead vehicle would occasionally slow down and stop (see discussion below).

9
Figure 2. Work zone activity area and surrounding roadway environment.
Channelization through the work zone was accomplished using 42-inch high traffic cones to be consistent with the size of T-top cones and barrels that are used in real life work zones. When there is activity in the work zone, there is a 500 foot buffer space before the first worker. Half of the work zones had no activity and half involved activity. In those work zones with activity, there were three pieces of large equipment, five stationary workers and two moving objects in each work zone (Figure 2). One moving object was moving parallel to and the other perpendicularly to the direction of travel of the participant driver. All stationary workers and equipment were placed in the same positions for all work zones (whether right or left closures). Moving workers on the left were placed 1 m further from the dashed lane line than when on the right to be sure they were at the same visual eccentricity for the participant driver.
The scene viewed through the rear view mirrors showed a series of stationary
photographs depicting a road with no vehicles or a vehicle that was shown at a subtended visual angle that is similar to a vehicle that is 80 feet, 160 feet or 960 feet (1, 2 and 12 seconds) behind. The experimenter used a remote device to control the following vehicle display. The scene was changed every time the subject changed lanes to depict the proper view (right or left lane view) to the rear. 3.1.4 Hands Free Cell Phone Task The hands-free communication task (or mock cell phone task) involved the subjects wearing ear buds and listening to a series of sentences that were similar to the grammatical reasoning (working memory) tasks used by Baddeley (16). Other studies have also used a similar task to replicate the cellular phone task (17, 18). The variation on the task is that the difficulty of the task was reduced slightly from that of Alm & Nilsson (18). In the present experiment, the drivers were read a series of 5-word sentences every 10 seconds. After each sentence, the driver was asked if the sentence made sense or not. Seven seconds after the sentence began, the subject was asked, “Last word?” and was given an additional three seconds to answer. An example of the procedure is as follows. The driver was read, “The truck delivered the package.” In response the driver should answer “yes”. The experimenter would then ask “Last word? And the driver should respond, “Package”. An example of a sentence that does not make

10
sense is “The octopus burned the onions”. Drummond, Brown, and Salamat (19) investigated Baddeley’s grammatical reasoning test and found that asking subjects to listen to longer sentences or recall the last word after several sentences may require drivers to tap portions of the brain involved in cell phone conversations that are not normally activated during sentences involving fewer words. Therefore, the hands-free mock cell phone task was intended to replicate a very casual cell phone conversation that required only minimal mental rehearsal or recall intervals of not greater than 3 seconds. 3.1.5 Experimental Design Two blocks of 16 scenarios were created. Five factors were varied orthogonally within blocks based upon the following treatments: (1) the activity in the work zone (present or absent), (2) the location of the work zone (left or right side), (3) the approach (right or left) which is equivalent to the requirement to change lanes in order to move through the work zone (required or not required), (4) the presence of a vehicle in the left side view or rear view mirror when a lane change is required (present or absent), and (5) whether the lead car braked with or without warning. When the lead car braked without cues there were no foreseeable hazards downstream of the participant’s vehicle. When a cue was provided, there was either a pedestrian crossing the road several vehicles ahead, a stopped (taller) trailer ahead, or a vehicle emerging from the work zone ahead of a lead vehicle. This combination of conditions led to two base sets of 16 scenarios (Blocks A and B). The manner in which the 16 work zones were presented to participants was counterbalanced across scenarios so the approach (right or left), work zone location (right or left), activity within the work zone (equipment within the work zone or an empty work zone), whether there was a following vehicle or not, and the occurrence of a lead vehicle which braked all seemed to vary randomly (see Table 1, Table 2). Moreover, in each block of 16 scenarios, the work zone was located on the left or right half of the time, activity in the work zone occurred half of the time, lane changes were required half of the time, a vehicle was present in the left side view or rear view mirror half of the time, and the lead car braked half of the time.

11
Table 1. Randomized block design that shows the order in which each subject was presented each scenario (Blocks A – cell phone in first and third block).
Each participant drove four 14-mile blocks with 8 scenarios each, in two of the 14-mile blocks doing the mock cell phone task and two not doing the task. Half of the participants did the cell phone task in the first and third blocks (Table 1); the other half in the second and forth blocks (Table 2). .
12
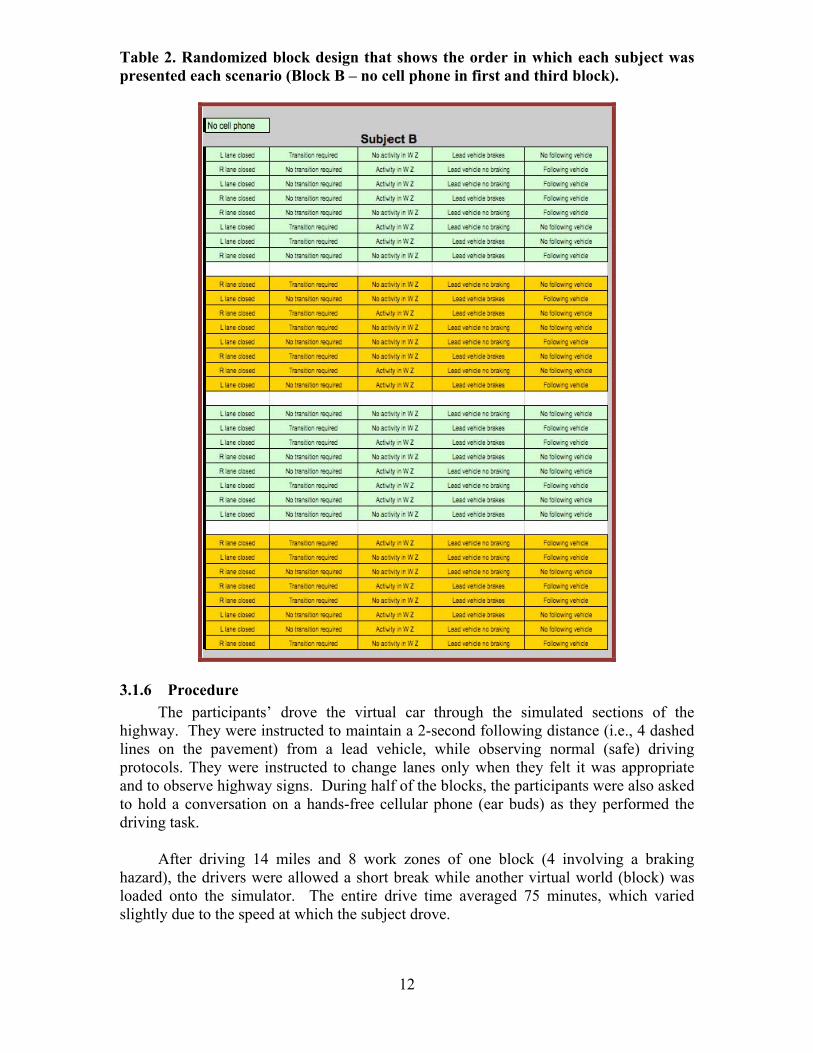
Table 2. Randomized block design that shows the order in which each subject was presented each scenario (Block B – no cell phone in first and third block).
3.1.6 Procedure The participants’ drove the virtual car through the simulated sections of the highway. They were instructed to maintain a 2-second following distance (i.e., 4 dashed lines on the pavement) from a lead vehicle, while observing normal (safe) driving protocols. They were instructed to change lanes only when they felt it was appropriate and to observe highway signs. During half of the blocks, the participants were also asked to hold a conversation on a hands-free cellular phone (ear buds) as they performed the driving task. After driving 14 miles and 8 work zones of one block (4 involving a braking hazard), the drivers were allowed a short break while another virtual world (block) was loaded onto the simulator. The entire drive time averaged 75 minutes, which varied slightly due to the speed at which the subject drove.

13
At the beginning of a session, each subject signed an informed consent form. At the end of a session each subject completed a debriefing questionnaire where they were asked to give subjective ratings of the difficulty due to the following vehicle (rear view mirror task), mock cell phone task and negotiating through the work zones. 3.1.7 Dependent Variables Participants were required to wear the eye-tracking device during all trials so that a measure of their eye movements could be obtained. In addition, vehicle information including following distance, vehicle speed, and merging procedure were recorded. Thus, we obtained information relevant to the likelihood of a sideswipe or rear end crash in a real driving situation. We employed seven objective indices of drivers’ behavior. (1) The first was a measure of the total area (5th percentile to 95th percentile glance location, both height and width) scanned by the driver, as well as the breadth of scanning along the horizontal and vertical axes (used to test H1, i.e., the hypothesis that drivers have more centrally focused search patterns when engaged in a cell phone conversation). (2) The second was the response distance (used to test H2, i.e., the hypothesis that a mock cell phone task would cause these drivers to miss the available peripheral cues to stop ahead and therefore they would respond slower -- begin breaking further downstream of a triggering event -- than drivers who are not engaged in this task). Response distance was the distance between a fixed trigger location and the first braking of the participant driver. The trigger location was a point on the road such that when the participant vehicle crossed it, a significant event occurred in the work zone activity area ahead of the participant vehicle. (3) The third was the brake reaction time, which was the time which elapsed between the trigger location and when the brakes were first applied. (4) The fourth was a measure of whether the driver braked hard in the work zone activity area. The driver was scored as braking hard, if the car decelerated at a rate greater than 0.5 g for longer than 0.1 second (used to test H4, i.e., the hypothesis that because drivers using cell phones fail to detect problems in a timely manner, they would be more likely to brake hard than drivers who are not using a cell phone). (The 0.5 g threshold is equivalent to full braking on wet pavement and is approximately the point at which skid marks begin to appear in most cases.) (5) The fifth is the speed of the vehicle when it was within 49 feet (15 m) of the lead vehicle (used to test H3, i.e., the hypothesis that drivers engaged in a mock cell phone task would be traveling faster as they came near a lead vehicle which itself was slowing or stopping and therefore would need to decelerate more). We chose 15 m because we learned in our pilot testing that early and late responders were both traveling slow speeds when very near the rear of the lead vehicle. Fifteen meters was selected because it was typically near the middle of the deceleration curves and better showed the difference in the driver response. An example of what we mean here is displayed in see Figure 3 (this is prototypical data; it does not correspond to the data of any actual participant in the experiment). Here is it clear that the difference between the velocities of the early braking and late braking drivers is greatest within 15 m of the lead vehicle. (6) The sixth was the number of times a driver glanced at either the rear or side view mirrors (used to test H5, i.e., the hypothesis that, due to the resource demands required by a simulated hands free cell phone task, these drivers would be more likely to fail to look into any of the rear view mirrors prior to a lane change). This was easily determined from evaluation of the crosshairs on the videotape, which indicated with 0.5-degree accuracy exactly upon what the driver was focused at each point in time. The glances had to occur 3 seconds or less before the driver changed lanes in order to count as an indication that the driver was

14
checking for cars in the adjacent lane. Lane changes in response to signs, work zone transitions and slow moving vehicles were recorded. Lane changes immediately after leaving the work zone were not recorded because it could be argued that the driver knew nothing was approaching from the previously closed lane. (6) We also gathered subjective ratings of workload using a simple Likert scale. In particular, participants were asked to select which of the following best described the influence of the cell phone on their driving in the work zone: a) “Not at all”; b) “It could have slightly, but I did not let it”; c) It could have significantly affected my driving, but I tried to limit its influence”; d) “This task negatively influenced my performance”; and e) “This task was very difficult”.
Figure 3. Graphical display showing the vehicle speed acquisition point 3.2 RESULTS AND DISCUSSION
Analyses were undertaken on the measures discussed above. To begin, consider the comparisons that are relevant to the likelihood that a driver would be in a rear end collision. Specifically, an analysis was done to determine the influence of cues, work zone activity, and cell phone use upon, response distance, speed of the vehicle when within 49 feet of the lead vehicle (LV), and hard braking (greater than 0.5 g).
3.2.1 Distance to First Response First, we analyzed the response distance (between the trigger location and the first braking activities). The mock cell phone users traveled 245 feet before braking as opposed to 226 feet for the non-cell phone users, a difference of 19 feet, t(31) = 2.58, p < .02. This indicates that the distraction from the cell phone usage caused drivers to delay their appropriate actions to slow down relative to the drivers not using the cell phone. However, this effect was modulated by whether there was a cue that the lead vehicle might stop. When there was such a cue, the difference between the groups was 34 feet,
Deceleration Profiles
0
20
40
60
80
100
51 45 39 33 27 21 15 9 3
Distance to Contact (m)
Km
/H
Late braking Early braking then coasting

15
whereas when there was no cue, the difference was only 4 feet (Table 3). The interaction of cell phone use and cuing was significant, t(31) = 2.17, p < .05. This makes sense, as when there is no clear cue to stop, neither the cell phone users nor the no cell phone users have the necessary information to tell them to slow. However, there could be another reason why the groups do not differ in response distance when there is no downstream cue. In particular, both groups may be slowed relative to drivers who were looking straight ahead and not on the cell phone. Specifically, drivers not on the cell phone may respond slower to a vehicle straight ahead because they are looking more often to the left or right whereas drivers on the cell phone, although looking straight ahead more often, may respond slowly because they are attending to the conversation. Thus, there may be a tradeoff between general inattention and non-cell phone users looking more broadly when there is no advance cue that the LV is stopping that leads to the rough equivalence in response distance for the two groups. 3.2.2 Brake Response Time
The time from a trigger location (a location defined in the simulated environment) to brake application was recorded for each condition. While these times do not represent real world response times (because they are started from an arbitrary location), they can be utilized to compare conditions. Drivers engaged in the cell phone task had essentially the same response time as those who were not engaged in the cell phone task when the lead vehicle slowed for no particular reason, i.e., when advance cueing was not available (Meancell = 3.15 versus Meancontrol = 3.13; see Table 3). However, when cuing was offered, those who were not on the cell phone responded faster, but not significantly so (2.52 sec compared to 2.75 sec).
One must recall that the methodology was set up in such a way that drivers who are inattentive to the roadside and objects other than straight ahead, would actually have an advantage. Therefore, this research does not show that cell users respond as fast as non-cell users, it tells us that attentive drivers who are scanning their environment will respond as well as a driver who is staring directly ahead when responding to a stopped or slowing lead vehicle. However, it also tells us that when there are cues in the environment to stop, cell phone drivers are slower to respond to the cues.
Table 3. Results from Simulator Experiment 1.
Cued‐ Cell
Cued‐ No Cell
Uncued‐ Cell
Uncued‐ No Cell
Hard Brakes 50% 36% 50% 38%
Dist to 1st Response 246 ft 212 ft 244 ft 240 ft
Speed at 49 ft behind LV 39.0 mph 31.0 mph 35.5 mph 36.5 mph BRT 2.75 s. 2.52 s. 3.15 s. 3.13 s.
3.2.3 Search Area
Consistent with this interpretation, drivers who were not on the cell phone had a search area of 21.8 deg2 compared to those on the cell phone of 18.6 deg2. t(20) = 2.46, p < .03. (The degrees of freedom are smaller here than in the above analyses because eye tracker data was available on a smaller set of participants.) Interestingly, the horizontal

16
search width decreased significantly for drivers on the cell phone compared to drivers not on the cell phone, t(20) = 2.78, p < .02, often by more than half, while the vertical search height did not t(20) = .314 (see Figure 4). A significant percentage of the drivers, when recalling the last word of the sentence, looked up (into the sky). This behavior was exhibited by less than half of the drivers but was enough to increase the average vertical search areas for drivers on a cell phone so as to make the vertical search area in the two conditions (cell and no cell) almost identical. The cell phone task was varied by blocks, such that the drivers were exposed to every possible combination of orders.
Figure 4: Horizontal search widths of drivers negotiating a simulated work zone while engaged in a cell phone task and without the cell phone task (see text for a
definition of this measure). 3.2.4 Relative Velocity at 49 Feet
Second, this pattern was mirrored in the data on the speed of the vehicle (within 49 feet of the lead vehicle) when it began stopping. Overall, drivers in the cell phone task were traveling faster than the drivers in the no cell phone task (37.2 mph vs. 33.7 mph). However, this overall difference was not significant, t(31) = 1.40, p < .20. There was the same interaction as in the above data, as the difference was 8.0 mph for the cued condition but actually -1.0 mph for the uncued condition (see Table 3, Figure 5). However, both the 8.0 mph difference for the cued condition and the interaction just failed to reach significance, t(31) = 2.11, p = .06, t(30) = 1.86, p < .10.

17
Figure 5: Influence of cluing and mock cell phone use upon the ability of the subject to reduce his speed when within 49 feet (15 m) of a stopped or slowing lead vehicle. 3.2.5 Hard Brakes As a result of these late responses to the event in the work zone area, the cell phone drivers were much more likely to brake hard (greater than 0.5 g deceleration). Drivers involved in the mock cell phone task decelerated sharply in 50.3% (this percentage includes impacts and hard brakes) of the braking scenarios while those who were not on the cell phone decelerated sharply in only 36.5% (this percentage includes impacts and hard brakes) of the scenarios, t(31) = 3.50, p < .002 (see Table 4). However, unlike the prior two measures, there was little interaction with cuing condition, t(31) = .07 (Table 3). Perhaps this is because the hard braking measure reflects inattention relatively late in the epoch being studied, unlike the other two measures which assessed inattention due to the cell phone usage quite early in the epoch being studied. Thus, if drivers brake hard later in the epoch, they probably have not seen the cue even if it was present, and its presence would not matter regardless of whether the driver was a cell phone user or not. Interestingly enough, drivers who were engaged in a hands-free cell phone task decelerated at a lower rate than those who were not engaged in the cell task, but the difference did not reach significance. The probable reason that cell drivers decelerated at a lower rate is that their responses were indecisive in many instances.
No Cell Use Mock Cell Task
CellUse
30.00
32.00
34.00
36.00
38.00M
ean
Spee
d_49
ft
ClueNo ClueClued to Stop
Initial Speed of the Subject Vehicle was Approximately 55 mph
Speed of Subject's Vehicle at 49 Feet from Lead Vehicle
Cue No Cue Cued stop

18
Table 4. Hard braking events expressed as a percentage of total braking events for cell and non-cell phone driving.
Cell No CellImpacts 21 18 Hard Brakes: No Impact 119 77 Observations 278 260 Percent Hard Brakes 50.3% 36.5%
3.2.6 Mirror Glances Using the video recordings from the MobileEye, a comparison was made of the rear view mirror glances by drivers when using and not using the cell phone. Mirror glances were recorded for lane changes in response to other vehicles, to work zone transitions (the start of cones), and to signs directing drivers to move right or left. There were a total of 454 lane changes. In 78 of these lane changes, the drivers failed to look in their rear mirrors (17.2%) and 49 of the 78 failed glances were made while drivers were on the cell phone while only 29 of those who were not on the cell phone failed to glance. Moreover, in each of the three separate situations where lane change could occur (signs, transition area, cars), the majority of failed glances were made by drivers engaged in a cell phone task. The comparison of the distribution of mirror glances in the cell and no cell phone conditions was made using a Chi-Square analysis by comparing the number of times each driver failed to glance in the mirror when on and not on the cell phone. The null hypothesis was that cell and non-cell phone drivers would check the mirror equally often. This hypothesis could be rejected (χ2 = 3.913; p < .05).
Table 5. Results of glance data while negotiating a simulated work zone transition area. 3.2.7 Workload
Finally, the subjective rating data indicated that drivers appeared to underestimate the influence of the cell phone task on their performance, as only 28.1% of the drivers indicated that the hands-free cell phone task negatively influenced their performance (and none rated it as very difficult). The distribution of ratings was as follows: 1) “Not at all” (12.5%); 2) “It could have slightly, but I did not let it” (31.3%); 3) It could have significantly affected my driving, but I tried to limit its influence” (28.1%); 4) “This task negatively influenced my performance” (28.1%); and 5) “This task was very difficult” (0%). Importantly, the ones who rated it as the easiest braked hard an average of 1.55 times per block of driving while those who rated the cell task as difficult braked hard an

19
average of 1.0 times each block (18 mile drive), which is consistent with the hypothesis that many cell phone users are unaware of the extent to which the cell phone is capturing their attention to the detriment of their driving (see Figure 6).
Figure 6: Subjective rating of the difficulty of the mock cell phone task and relative
to the subjective rating of the influence of the cell phone task. 3.3 CONCLUSIONS
This research reports an analysis of the types of situations that are most associated with crashes in work zones. Because it was conducted on higher speed (simulated) roads, it is also representative of the types of crashes that could lead to severe injuries or fatalities due to the greater impact speeds.
We found that the drivers using the cell phone were delayed in their speed
reduction and then, when they finally did brake, they did so impulsively so that there were more hard brakes (but not more efficient braking). Specifically, when at a point only 49 feet (15 m) from impact, cell phone drivers were traveling an average of more than 6 mph (8.8 km/h) faster. A driver traveling 32 mph can stop in 49 feet, while a driver who is traveling 38 mph will still be traveling 20 mph after skidding 49 feet. We infer that this is because drivers on the cell phone also missed critical information that was available to them both from the roadsides and from actions of downstream traffic. This would suggest a shrinking of the effective visual field in not only the horizontal but also the vertical and longitudinal directions. Due to the apparent need to gather information in the forward view, it was at the expense of information that was available in other areas, particularly toward the rear. Drivers using the cell phone failed to utilize their rear view mirrors nearly half again as much as those who were driving without a cell phone task. Lacking peripheral glances in the forward view as well as missed mirror

20
glances toward the rear view would likely relate to a greater exposure to potential side-swipe crash situations.
This research is consistent with the findings reported by Dingus et al. (20). They
found that cell phone use (10%) was the most frequent secondary task contributor to forward roadway inattention for near crashes. Most of these cases were during a conversation (i.e., cell phone – talking/listening) as opposed to dialing or answering.
In summary, half of the braking scenarios involved cues that traffic ahead was
going to stop. Drivers who were engaged in the mock cell phone conversation did not appear to pay as close attention to these cues, exhibiting more sharp decelerations (greater than 0.5 g, consistent with H3), taking longer to respond (consistent with H2), and traveling faster near the lead vehicle as it was stopping or stopped (consistent with H4). Not only did engaging in a mock cell phone task affect drivers processing of cues directly ahead of them, but we found that drivers in the mock cell phone task searched less broadly side to side (consistent with H1) and were 30% less likely to check their rear view mirror (consistent with H5). These results strongly suggest that cell phone use reduces situational awareness and will increase the two major types of crashes in work zone activity areas, which are rear end and sideswipe collisions.
4. EXPERIMENT 2: OPEN ROAD The above research indicates that mock hands-free cell phone use on a driving simulator leads to a number of undesirable driver and eye behaviors inside work zones. While in general one hopes to find behaviors in the field similar to what one finds on the driving simulator (21), obviously this cannot be known with assurance without actually undertaking a field study. This is done in Experiment 2 and reported below. 4.1 METHOD
The comparison of results on a driving simulator and in the field is not an easy one, even though the experiments run in both venues were similar. We would have liked to create scenarios in the field where we could measure the same variables as we measured on the driving simulator. However, whereas potentially dangerous situations can be negotiated in a simulated environment, such is not the case in the field. Therefore, the goal was to replicate the simulator experiment with safety constrants, which required a change in the methodology and subsequently the dependent variables.
To begin, recall that in the simulator study described above (Experiment 1) drivers traveling through work zones encountered either the lead vehicle stopping after an advance cue that traffic ahead might need to stop (e.g., a pedestrian might step out into the work zone) or the lead vehicle stopping for no apparent reason, most often after passing a roadside obstacle (potential distraction). The brake lights were never activated. In the field experiment, much the same design was used except for the occasional activation of the brake lights. Specifically, the drivers followed a lead vehicle with a modified taillight/brake-light assembly. While traveling through the simulated work zones (with actors actually working), the lead vehicle’s brake lights could be illuminated by the lead vehicle driver without the lead vehicle actually decelerating. This let us compare the influence of cell phones on drivers’ behavior when the brake lights were

21
illuminated and an advance cue was available with drivers’ behavior when the brake lights were illuminated and no advance cue was available. Given the above modification to the brake light assembly, twenty-four drivers navigated a closed one mile road on campus a total of four times (four loops), in part of which a simulated work zone with barrels was set up. Vehicle data were captured and stored in real time. The vehicle itself was instrumented with three cameras (in addition to the eye tracker), one aimed on the driver’s foot, one on the speedometer and one at the readout from a forward facing laser rangefinder that measured the following distance. The driver wore the same eye tracker in the field study that was used in the simulator study. On two of the loops, the driver was engaged in a simulated hands-free cell phone task (the same one that was used in the simulator); on the other two loops the driver was not so engaged. A lead vehicle was always ahead of the participant driver. Cues that the lead vehicle would stop were used on two of the loops. In this case, a human like mannequin (on a short platform with casters) was pulled across the work zone when the lead vehicle closed to within 150 feet (when the lead vehicle crossed the pedestrian trigger which was the first barrel in the work zone activity area). The thought was that a pedestrian (i.e., a mannequin) entering the path of a lead vehicle should alert an attentive driver to the fact that he or she may have to slow for a lead vehicle soon. The lead vehicle never actually decelerated, but the driver of the lead vehicle activated the brake lights when the lead vehicle passed the LV braking trigger (the second barrel in the work zone activity area) half of the time that the mannequin was pulled across the road and half of the time that the mannequin remained in the work zone. All mannequins wore traffic safety vests with florescent and retroreflective materials. 4.1.1 Participants
A total of 26 drivers were recruited for the experiment. Drivers were allowed to participate only if they had a valid driver’s license and did not wear glasses (contacts were permissible). The data from one participant was lost due to equipment failure and a second person did not have a valid driver’s license at the time of the testing and was not allowed to participate. Full data were collected from 12 men and 12 women, between the ages of 19 and 48 years. The average age was 24 years. The recruiting process for drivers was conducted in the Amherst, Massachusetts’ area using flyers posted around the campus and in the downtown area. 4.1.2 Equipment
All participants drove a driving school vehicle. A driving instructor was the front seat passenger in the driving school vehicle (a foot brake was installed on the passenger side of the vehicle). The driving instructor was told to apply his brake pedal in all instances that required his intervention. (There were two such occasions and neither occurred while the driver was driving through the work zones and both instances occurred after the data collection portion of the test had concluded.)
In addition to the participant driver, there were other vehicles ahead of the driver, most notably a lead vehicle. The vehicle was equipped with modified taillights that were mounted to the back of the vehicle (Figure 7). The mock brake lights were wired to a 12-volt battery that was in the trunk of the vehicle and were activated by use of a plunger switch that was held by the driver of the lead vehicle. The driver of the lead vehicle was trained to activate the modified brakes (that were brighter and larger than the standard

22
brake lights) every time the lead vehicle driver used the brake pedal. However, when braking in the work zone was called for, only the modified brake lights were activated. The vehicle was also equipped with a ULS range finder by Laser Technologies Incorporated (Figure 8). The range finder was mounted to the hood of the driving school vehicle and was aimed at the lead vehicle in such a way that following distance was accurately reported within one-meter when following between 49 and 213 feet (15 and 65 meters). The following distance of the driver was constantly being recorded at a refresh rate of 10 Hz.
Figure 7: The modified brake light system that was utilized in Study II.

23
Figure 8: United Laboratories Systems range finder placed on the driving school
vehicle. Driver performance was recorded with a four channel digital video recorder that recorded forward view using the ASL MobileEye (upper left), foot/pedal usage (lower left), range finder readouts (upper right) and vehicle speed (lower right, Figure 9). Figure 9: View within work zone 1, the forward view (above left), the range (top right) in meters. The speedometer (bottom right) and the foot on the brake (bottom left). This equipment was powered by three battery packs that allowed for seven hours of recording (Figure 10). The study was conducted seven hours each day for four days.

24
Figure 10: Recording equipment utilized in study II. The equipment includes (in a
clockwise direction), three battery packs, a laptop that reported the results from the range finder (mounted on the roof), a 5 inch television screen that showed the four camera views from the four-channel DVR (the gray box below) and the Sony DVR for the ASL MobileEye that records eye movement and driver’s forward view (on
top of the four channel DVR). 4.1.3 Field Course Each subject completed four drives (loops around the football and softball stadiums), each drive requiring the drivers (if they consent to continue until completed) to maneuver through two work zones that were placed on a road adjacent to the football stadium (Figure 11).

25
Figure 11: Aerial view of the location in which the simulated work zones (white ovals) were placed as well as the location of the police flagger (orange circles). Photograph was obtained from Google Earth. The two work zones were 1,000 feet apart (white ovals, Figure 11). Police flaggers were placed at the entrance to the football stadium to control traffic into that area (orange blobs). (Testing had to be halted for one day to allow the football team to continue on its National Championship campaign.).
Figure 12: View approaching a road bump (upper left). The lead vehicle is seen braking in response to the road bump ahead. The driver’s foot is on the brake pedal (lower left).

26
Figure 13: Approaching one of two stop signs (upper left). Note the lead vehicle is within 14.3 m (upper right), the vehicle is traveling approximately 12 mph (lower right), the driver is looking generally straight ahead and the foot is on the brake (lower left). Each loop of two miles in length (8 miles total of driving) took them through an area of moderately heavy pedestrian traffic, across a speed bump (Figure 12) and through two stop sign controlled intersections (Figure 13). Specifically, when traveling along the western portion of the route, the environment was a rural road that was closed to other vehicle traffic, although because the route is routinely used as a walking route, there were frequently pedestrians in the area. The eastern portion of the route involved the two stopped controlled intersections and light traffic.
Research assistants were assigned to each work zone to “act like they were working” and to draw the inflatable pedestrian across the road when necessary. Each work zone assistant was dressed in matching traffic vests. Each research assistant in the work zones was given a script to determine which occasions to have the pedestrian cross in front of the lead vehicle. They also practiced drawing the inflatable pedestrian across the road so that the timing was uniform for each driver. When the lead vehicle passed the last transition barrel that was placed 150 feet from the inflatable pedestrian, the inflatable pedestrian would begin to be pulled across the remaining travel path. A research assistant drove the lead vehicle. All research assistants received one hour of training in the procedure.
If the methodology called for the brake lights to be illuminated, that was done when
the lead vehicle approached the second barrel after the end of the transition. The second barrel was located 120 feet or approximately four seconds from the crossing location of the pedestrian (this is the lead vehicle braking trigger). However, the brake lights were illuminated half the time and the pedestrian crossed half the time.

27
Channelization through the work zone was accomplished using 42-inch high traffic barrels which were rented from a local construction company. Placement of the barrels was in accordance with MUTCD guidelines 6C-2a for taper lengths (1). 4.1.4 Experimental Design
Two work zones were created on a closed course road, one a right lane closure and the second a left lane closure. Three factors were varied for each participant with a random block design: (1) the use of a mock cell phone task (used or not used), (2) the occurrence of an advance cue indicating that the LV would be braking (present or absent) and the illumination of the brake lights (illuminated or not illuminated). The order in which each driver was exposed to the eight conditions (2×2×2) was varied across participants so that each combination was equally likely but randomized in the order in which the drivers experienced each condition.
For each drive, all drivers were faced with a left lane closure after a right lane
closure; any other order would have required the drivers to be traveling into the sun or to make a u-turn in an area of real traffic. Since left versus right lane closures did not appear to have any influence on the performance of drivers in Experiment 1, we elected for safety reasons, including anticipation and the sight line of the experimental assistants, to follow a clockwise direction around the loop for all drivers.
This combination of conditions led to two base sets of 8 scenarios (Blocks A and B;
Table 6), odd numbered subjects were given Block A and even numbered subjects were given Block B. The manner in which the work zones were presented to participants was counterbalanced across scenarios so that the cell phone task, brake lights of the lead vehicle, and presence of a crossing pedestrian (advanced cuing) all seemed to vary randomly.

28
Table 6. Counterbalancing in Experiment 2. (Blocks A and B)
Specifically, each participant drove four laps around the closed road circuit: they
responded to the mock cell phone task during two of the laps (four work zone scenarios in total) and had no cell phone task during the other two laps (four work zone scenarios in total). Half of the participants did the cell phone task in the first two laps; the other half in the second two laps.
4.1.5 Procedure Research assistants were stationed at the Human Performance Laboratory to greet each driver, obtain informed consent, and escort the driver to and from the driving school vehicle. At that point, all drivers were outfitted with the ASL MobileEye. The participants drove a driving school passenger car through the course. The route that each subject drove in the experimental portions is shown in Figure 11. They were instructed to maintain a constant following distance. The entire drive time averaged one hour; it varied slightly due to the speed at which the subject drove. A certified driving instructor from the Baird School of Driving (of Maine) was seated in the front passenger seat of the driving school vehicle. The experimenter was seated in the back seat of the subject’s vehicle and monitored all proceedings. Also, in Experiment 1, mirror glances were counted while in this experiment, there was no other traffic in the area, other than the lead vehicle. The route traveled by each participant from the Human Performance Laboratory to the test track is shown in Figure 14. When examining Figure 14, you can see that the drivers left the Human Performance Laboratory and drove to the area of the stadium at which time they circles the stadium three times. The top down view of the test track is presented in Figure 11.

29
Figure 14: Route taken by the subject drivers from the Human Performance Laboratory to the circle around the football and softball stadiums (the large loop shown above), which was circled four times by each subject before returning to the lab. The two stars show the location of the stop controlled intersections. At the end of a session each subject completed a debriefing questionnaire where they were asked to give subjective ratings of the difficulty of both the mock cell phone task and negotiating through the work zones as well as how each influenced their performance. 4.2 DEPENDENT VARIABLES
As noted earlier, in the first experiment using a driving simulator the following were dependent measures: distance to the first response; brake response time; eye glance search area; speed at 49 feet (15 m) from the rear of the LV; hard brakes; mirror glances; and subjective rating of the cell phone task. This experiment was a field study where placing the driver in an imminent crash scenario is not possible. Therefore, the approach had to be altered. Instead, we analyzed: relative velocity and average deceleration in the field study as proxies for hard brakes in the simulator study; SAVb (subtended angular velocity at braking) and minimum closing distance as proxies for the distance to the first braking response; the BRT (brake response time), which we also measured in the simulator, though differently; and finally we asked each driver to rate the subjective influence of the cell phone task.
4.2.1 Hard Brakes (Simulator): Relative Velocity and Deceleration Rate (Field)
When it was not possible to measure the same behavior in the field that was measured on the driving simluator, at least one proxy was gathered in the field for the

30
behavior that had been measured on the simulator. First, consider the proxy for hard brakes in the simulator. In the field it is not possible to allow scenarios that would require a hard braking or emergency response maneuver. However, we were able to measure relative velocity (relative velocity or VR) and a characteristic of deceleration behavior, the deceleration rate (g).
Relative Velocity. The relative velocity of the responding driver in the work zone activity area was measured as shown in Equation 1:
Equation 1 VR = (Ri – Rf) / t, where VR is the relative velocity (the relative velocity), Ri is the initial following distance (range from the range-finder; measure from the first cone in the work zone, i.e., the pedestrian trigger), Rf is the range when the driver responded (hit the brakes) and t is the response time of the driver. The relative velocity is an indication of how far a driver has closed on the lead vehicle when the driver applies his or her brakes. If the relative velocity is small or negative, the driver has taken maintained a constant or increasing distance from the lead vehicle. Since the lead vehicle is maintaining velocity or slowing only slightly, this can only happen if the driver has taken his or her foot off the accelerator early. If the relative velocity is large, then the driver is closing on the lead vehicle. This means that the driver took his or her foot off the accelerator relatively late. It is assumed that this would necessitate a hard brake.
Deceleration Rate. The deceleration rate that was measured by dividing the change in velocity over the response time,
Equation 2 μ = (Vi – Vf) / (g × t), where μ is the negative acceleration in g’s, Vi is the initial velocity (at the last cone in the transition zone or first cone in the work zone, i.e., the pedestrian trigger), Vf is the final velocity (opposite the pedestrian), g is acceleration due to gravity, and t is the response time. The deceleration rate is also tied to how soon the driver takes his or her foot off the accelerator and brakes. If the driver does so as soon as he or she sees the lead vehicle stopping then the deceleration rate will be large (and the relative velocity would be small) since t is very small. If the driver waits until the very end just before braking to take his or her foot off the accelerator and on the accelerator, then the deceleration rate would be small (and the relative velocity would be large) since t is very large. Again, this would presumably necessitate a hard brake if the lead vehicle were really slowing. 4.2.2 Distance Before Braking Response (Simulator): SAVb and Minimum
Closing Distance (Field)
Subtended Angular Velocity at Braking. Next consider the proxy for the distance before the braking response in the simulator. The proxy that was used here was the subtended angular velocity at braking (SAVb). A subtended angle is the number of degrees of an observer’s visual field that an object encompasses (See Figure 15). The subtended angular velocity at the time the brakes were applied (SAVb) is computed as indicated in Equation 3:

31
Equation 3 SAVb = [(w x VR) / (R2)], where w is the width of the lead vehicle, VR is the relative velocity (computed as the following vehicle velocity minus lead vehicle velocity), and R is the range (following distance when the brakes are applied). The argument for using the subtended angular velocity at braking as a proxy for the distance before the braking response can now be made clear. Specifically, it is well established that the looming rate is used by drivers to estimate time-to-collision information (22; 23) and when best to brake. The subtended angular velocity is one measure of the looming rate. And thus the subtended angular velocity at braking is the threshold equivalent of the looming rate above which drivers feel it is necessary to initiate braking. Note that SAVb is an imperfect proxy for the distance travelled before a braking response because the subtended angular velocity is a rate and thus a driver at different distances can have the same subtended angular velocity. Nevertheless, it is of interest to know whether drivers on the cell phone have a different and much larger SAVb than drivers not on the cell phone.
Figure 15. Subtended angle
Mimimum Closing Distance. In the simulator experiment, the distance before a braking response was first initiated was measured. This was the distance the subject driver traveled from when the LV began to slow (initiated by the participant driver’s vehicle traveling over a hidden trigger location in the simulated road) to when the subject driver applied the brakes. In the field, the braking trigger location for the lead vehicle is at a shorter distance and relative velocities are much different (the LV braking trigger is the second barrell in the work zone activity area). Therefore, a measurement of distance from the rear of the LV at which braking was initiated was measured. One must be careful here comparing the simulator and field results for this variable. In particular, in the simulator experiment, a lower number (distance after trigger before braking) suggests a better performance whereas in the field experiment, a higher number (distance from LV at which braking was initiated) is associated with a better performance. Therefore, the fourth variable was minimum closing distance, which was the closest the following driver closed on the lead vehicle within four seconds of the trigger location (when the lead vehicle passed the end of the work zone transition; the four seconds corresponds to the time it takes to travel from the trigger to the pedestrian when present). 4.2.3 Brake Response Time (Simulator and Field)
In Experiment 1, brake response time was the time from the pedestrian trigger location to the start of braking. Similarly, the brake response time in Experiment 2 is measured from the time that the subject’s vehicle passed the last barrel in the work zone transition (the pedestrian trigger location and the first barrel in the work zone) and the first braking of the participant driver.

32
4.2.4 Subjective Ratings of Workload and Hard Brakes(Simulator and Field)
We also gathered, as in Experiment 1, participants’ subjective ratings of the workload when drivers were engaged in a hands-free cell phone task. In Experiment 1 we learned that there was an inverse relationship between the subjective rating of the influence of the cell phone task and the likelihood of hard braking. For example, those who rated the cell phone task as easiest, braked hard the most often. A measure of hard brakes was not available in Experiment 2. Therefore, a different measure of drivers’ performance was constructed. Specifically, to explore further the relation between the subjective ratings of workload and a broader measure of driving behaviors, a performance index was developed to compare the performance of the drivers in Experiment 2 with their subjective rating of the influence of the hands-free cell phone task. The performance index considered the standardized scores for minimum closing distance, the percentage of responses to braking events, the deceleration rate, the brake response time and the relative velocity (relative velocity) and was represented by Equation 4:
Equation 4 Performance Index = ZMinR + ZPCTR + Zμ – ZBRT - ZVR ,
where ZMinR is the z-score for the minimum range (following distance) during the response phase, ZPCTR is the z-score for the percent of braking events to which a response is given, Zμ is the z-score for the deceleration rate, ZBRT is the z-score for the reaction time and ZVR is the z-score for the relative velocity. Z scores were computed across all conditions (no cell, no cue; no cell, cue; cell, no cue; cell, cue). 4.3 RESULTS AND DISCUSSION
The descriptive statistics (means) for the various different dependent variables are
listed in the three tables below. We needed to disaggregate the responses of the drivers in each of the eight conditions (two brake light by two cell use by two cue conditions) into one of three groups: 1) drivers who braked somewhere in the target zone (between the first barrel in the work activity area – the pedestrian trigger -- and the fifth barrel located 150 downstream which is wear the pedestrian crossed the road); 2) drivers who had their foot on the brakes throughout the target zone; and 3) drivers who had their foot on the throttle throughout the target zone. However, since there was no a priori reason to disaggregate the results for the measure of subjective workload, such a disaggregation was not undertaken.
Note that except for the minimum closing distance, the dependent measures need
to be modified slightly for the latter two groups, those always on the brakes or always on the throttle. Specifically, for drivers who were always on the brakes or always on the throttle, the response time was set equal to 4 s (the time on average that it took drivers to travel between the pedestrian trigger and the actual location of the pedestrian). Thus the relative velocity and deceleration rate can be defined for both of these two groups. The subtended angular velocity at braking can be defined for the group that always rides the brakes, but not the group that always rides the throttle. The BRT is not defined for either group.

33
4.3.1 Drivers Who Braked in the Target Zone The results for drivers who braked in the target zone are displayed below in Table 7. Note that drivers on the cell phone who braked while in the work zone activity area took about twice as long to do such [BRT = 2.4 s; this is just the average BRT of the four cells in Table 7 where a cell phone is used, i.e., (1.92+3.03+2.86+1.85)/4] as drivers not on the cell phone (BRT = 1.2 s), came about 30% closer to the lead vehicle (Minimum Range is 23.8 vs. 33.4 ft), and closed about 33% faster (Relative Velocity is 6.4 mph vs. 4.9 mph). Drivers on the cell phone also decelerated much less quickly (1.03 ft/s) than did drivers not on the cell phone (2.5 ft/s), especially when the brake lights of the lead vehicle were illuminated, indicating that they were less likely to respond appropriately to the developing situation (a slowing vehicle ahead). Moreover, drivers on the cell phone were either going faster or closer to the lead vehicle when they actually braked (SAVb is 0.0065 vs. 0.0045). Table 7. Throttle to Brake: Results from field study relative to cell use, cueing and
brake lights.
No Brake Lights
Cued Not Cued
Cell No Cell Cell No Cell
Relative Velocity 5.98 mph 2.63 mph 14.17 mph 13.80 mph Deceleration 2.25 ft/s 2.50 ft/s 0.57 ft/s 1.00 ft/s Min Range 21.50 ft 23.57 ft 25.39 ft 34.60 ft BRT 1.92 sec 1.82 sec 3.03 sec 1.07 sec SAVb 0.0082 rad/s 0.0041 rad/s 0.0118 rad/s 0.0044 rad/s No. Respond 4 6 7 3 Brake Lights
Cued Not Cued
Cell No Cell Cell No Cell
Relative Velocity 5.10 mph -5.55 mph 0.36 mph 8.30 mph Deceleration 0.50 ft/s 3.50 ft/s 0.80 ft/s 3.00 ft/s Min Range 23.92 ft 44.80 ft 24.40 ft 30.70 ft BRT 2.86 sec 0.75 sec 1.85 sec 1.33 sec SAVb 0.0043 rad/s 0.0042 rad/s 0.0015 rad/s 0.0056 rad/s No. Respond 6 2 5 4
The pattern is clearly one which suggests that the cell phone interferes with every aspect of safe driving. However, statistically it is not clear how to analyze the data. Originally, we had assumed that everyone would apply the brakes in the target zone. What would differ would be the point at which the brakes were applied. However, as we noted above some drivers rode the brakes, some rode the accelerator and some behaved as expected, braking in the target zone. That means that the number of responses is much smaller than we expected ( The results for drivers who braked in the target zone are displayed below in Table 7. Note that drivers on the cell phone who braked while in the work zone activity area took about twice as long to do such [BRT = 2.4 s; this is just the

34
average BRT of the four cells in Table 7 where a cell phone is used, i.e., (1.92+3.03+2.86+1.85)/4] as drivers not on the cell phone (BRT = 1.2 s), came about 30% closer to the lead vehicle (Minimum Range is 23.8 vs. 33.4 ft), and closed about 33% faster (Relative Velocity is 6.4 mph vs. 4.9 mph). Drivers on the cell phone also decelerated much less quickly (1.03 ft/s) than did drivers not on the cell phone (2.5 ft/s), especially when the brake lights of the lead vehicle were illuminated, indicating that they were less likely to respond appropriately to the developing situation (a slowing vehicle ahead). Moreover, drivers on the cell phone were either going faster or closer to the lead vehicle when they actually braked (SAVb is 0.0065 vs. 0.0045). Table 7). By itself this is not a problem. However, the drivers in one cell are not necessarily the same as the drivers in another cell. For example, the six drivers who were on the cell phone and braked when the brake lights of the lead vehicle were illuminated and the pedestrian was pulled across the road (cued) do not necessarily include the two drivers who were not on the cell phone and braked when the brake lights of the lead vehicle were illuminated and the pedestrian was pulled across the road. Thus, we have neither a clear between or clear within subjects analysis we can do. The reader will note that there is no measure of eye behavior above. Unfortunately, we could not analyze the eye tracker data. The ASL eye tracking equipment lost its ability to maintain calibration of the eye during the running of the field experiment, but did not give any indication that something had gone awry. It was not until reanalyzing the data that the problem was discovered. 4.3.2 Drivers Who Rode the Brakes Next, consider those drivers who rode the brakes the entire time they were in the target zone (Table 8). Recall that t as used in the measures of the relative velocity and deceleration was set equal to 4 s. There was very little difference between the drivers on and off the cell phone on three of the four dependent measures: deceleration (1.29 ft/s for drivers on the cell phone vs. 1.53 ft/s for drivers not on the cell phone), minimum range (27.20 ft vs. 26.30 ft), or SAVb (0.0035 rad/s vs. 0.0042 rad/s). However, the drivers on the cell phone closed less quickly overall than the drivers not on the cell phone (.85 mph vs. 3.71 mph). Looking at the results more closely, one finds that drivers on the cell phone were closing quickly when there were no brake lights and the pedestrian stepped into the road, but closed very slowly when there were brake lights and the pedestrian stepped into the road. Arguably, the drivers riding the brake and on the cell phone were not paying much attention. Only when the brake lights were illuminated and the pedestrian stepped out in front of the lead vehicle did they process what might happen and react inappropriate (slow way down).

35
Table 8. Always on Brake: Results from field study relative to cell use, cueing and brake lights.
No Brake Lights
Cued Not Cued
Cell No Cell Cell No Cell
Relative Velocity 14.67 mph 1.30 mph 2.82 mph -0.48 mph Deceleration 0.33 ft/s 1.00 ft/s 1.60 ft/s 1.50 ft/s Min Range 26.43 ft 26.03 ft 24.52 ft 27.38 ft BRT na na na na SAVb 0.0103 rad/s 0.0022 rad/s 0.0031 rad/s 0.0011 rad/s No. Respond 7 4 2 4 Brake Lights
Cued Not Cued
Cell No Cell Cell No Cell
Relative Velocity -16.55 mph 9.30 mph 2.48 mph 4.70 mph Deceleration 3.00 ft/s 2.00 ft/s 1.20 ft/s 0.67 ft/s Min Range 27.83 ft 28.60 ft 26.44 ft 26.78 ft BRT na na na na SAVb 0.0001 rad/s 0.0057 rad/s 0.0032 rad/s 0.0051 rad/s No. Respond 6 2 5 4
4.3.3 Drives Who Rode the Throttle Finally, consider drivers whose foot was always on the throttle in the target zone. Their results are displayed in Table 9. As in the case of drivers who were always on the brakes, there was very little difference between the drivers on and off the cell phone on two of the relevant measures: deceleration (3.06 ft/s for drivers on the cell phone vs. 3.24 ft/s for drivers not on the cell phone) and minimum range (26.72 ft vs. 25.89 ft. However, the drivers on the cell phone closed less quickly than the drivers not on the cell phone (0.23 mph vs. 3.12 mph), repeating a pattern we saw above for the drivers who were always riding the brakes. However, here in the one condition that stood out in the last analysis because the drivers slowed quite a bit (drivers on the cell phone when the brake lights were illuminated and the pedestrian stepped out into the roadway) now stands out because the drivers did not slow at. If anything they might have sped up slightly. There is no easy way to explain the relatively large increase in speed in this condition with the corresponding relatively large decrease in speed of the same drivers on the cell phone when no pedestrian stepped out into the road.

36
Table 9. Always on Throttle: Results from field study relative to cell use, cueing and brake lights.
No Brake Lights
Cued Not Cued
Cell No Cell Cell No Cell
Relative Velocity 1.43 mph 1.53 mph -7.75 mph 6.08 mph Deceleration 3.71 f/s 2.75 f/s 1.00 f/s 1.50 f/s Min Range 26.13 ft 26.43 ft 23.00 ft 23.55 ft BRT na na na na SAVb na na na na No. Respond 3 3 5 4 Brake Lights
Cued Not Cued
Cell No Cell Cell No Cell
Relative Velocity 14.28 mph 1.78 mph -7.05 mph 3.10 mph Deceleration 4.50 f/s 2.00 f/s 3.75 f/s 6.00 f/s Min Range 23.38 ft 25.22 ft 31.08 ft 27.70 ft BRT na na na na SAVb na na na na No. Respond 4 1 5 6
4.3.4 Workload and Performance Index As noted above, the drivers rated the influence of the cell phone task using a Likert Scale. In particular, when asked if the cell phone task had an influence on their driving, they were asked to give one of the responses listed in Table 10 (column 1). The subjective ratings of the influence of the cell phone task from the field (Experiment 2, Table 10, column 5) are slightly lower overall when compared to the subjective ratings by the simulator drivers (Experiment 1, Table 10, column 3). No driver rated the hands-free task as very difficult. Only one driver rated the hands-free task as negatively affecting their performance. The performance index (PI) on the driving simulator was the percentage of hard brakes (column 3). The performance index in the field was the linear combination of z scores (Equation 4). As we can see from Figure 16, in the field there still seems to be an inverse relationship between performance and subjective rating such that as drivers rated the task as easier, their performance was not as good. However, this relationship did not reach significance (F = 1.611, P = 0.203).

37
Figure 16. Subjective influence of the hands-free cell phone task
Table 10. Standardization of the subjective ratings of the influence that the hands-free cell phone task had on driving performance in the driving simulator and in the
field. (PI is the Performance Index.) Simulator Std PI
SimulatorField Std PI
Field 1.“Not at all”; 12.5% -0.70 12.5% -1.02 2. “It could have slightly, but I did not let it”; 31.3% -0.95 41.7% 0.18
3. “It could have significantly affected my driving, but I tried to limit its influence”;
28.1% 1.17 41.7% -0.47
4. “This task negatively influenced my performance”;
28.1% 0.49 4.2% 1.31
5. “This task was very difficult”.
0% 0.00 0.0% 0.00
4.4 CONCLUSIONS It had been assumed that all drivers would brake when they left the transition zone and entered the work zone. In fact, not all did such. However, when confining the analyses to just those drivers who did brake, it is clear that the drivers on the cell phone performed much less safely than did drivers not on the cell phone. In particular, drivers

38
on the cell phone who braked while in the work zone activity area took about twice as long to do such, came about 30% closer to the lead vehicle, and closed about 33% faster. Drivers on the cell phone also decelerated much less than half as quickly as did drivers not on the cell phone, indicating that they were less likely to respond appropriately to the developing situation (a slowing vehicle ahead). Moreover, drivers on the cell phone were either going faster or closer to the lead vehicle when they actually braked. On those variables that could be measured among drivers who were always on the brake or always on the throttle, only the relative velocity differed. In particular, drivers on the cell phone had a smaller relative velocity than drivers not on the cell phone. Both overall and cell by cell it was not clear exactly what was happening.
Regarding the subjective ratings of the influence that cell phone use had on their performance, it was found here, as in Experiment 1, that those drivers who thought the cell phone had the least impact on their driving were actually the ones who drove the worst. Perhaps there is a silver lining in this cloud. Potentially, there could potentially be a degree of improvement in driver’s performance if the driver is taught to realize the amount of information he or she may be missing when on the cell phone. Those who subjectively rated the cell task as “somewhat interfering” actually scored best on overall performance measures.
5. EXPERIMENT 3: DRIVING SIMULATOR AND WARNING SIGNS In the first experiment we showed that the search area is reduced and hard brakes are
more likely with a hands-free cell phone task. In the second experiment we showed that performance was equally degraded during the hands-free cell phone task when driving in the field, at least among those that braked. Since rear end collisions are the most common crash scenario in work zones (26), the use of cell phones while driving in work zones poses a real hazard, which corroborated our use of a cell phone task to replicate a moderately distracted driver. In Experiment 1, we also learned that drivers make fewer side-to-side glances when using a cell phone. This will impact side swipe collisions.
In Experiment 3 (a simulator study) we decided to evaluate signs that may improve
guidance and attention through work zones, and mitigate the inattention caused by the cell phone task. In particular we examined the influence of a sign that flashes SLOW AHEAD/TURN PHONE OFF (Figure 17). This variable message type sign is displayed only when traffic ahead is slowed or stopped. (We envision activation by use of radar, an on road traffic speed monitoring device, or a network of combined cell phones and GPS devices). At such a point in time, the VMS begins to flash at the start of the transition. There is no message displayed when traffic is free flowing.
We need to ask whether the sign we are designing is one which fits generally within the MUTCD guidelines. The answer is yes. The most relevant discussion is given in Part 6, Temporary Traffic Control, 6F.55. Also, in part 2D.06 of the Manual on Uniform Traffic Control Devices for Highways and Streets (Federal Highway Administration, 2003 with revisions 1 and 2) [MUTCD] (1) it states the following, “The legibility distance includes a reasonable safety factor for inattention, blocking of view by other vehicles, unfavorable weather, inferior eyesight, or other causes for delayed or slow reading.” Part 4B.01 also indicates “Standards for traffic control signals are important because traffic control signals need to attract the attention of a variety of road users, including those who are older, those with impaired vision, as well as those who are

39
fatigued or distracted, or who are not expecting to encounter a signal at a particular location.” The flashing of the sign should attract drivers’ attention to the sign (4B.01) and it should increase the effective legibility distance (2D.06).
Figure 17 Illuminated flashing warning displayed at the roadside, “SLOW AHEAD TURN PHONE OFF.” 5.1 METHOD
In Experiment 3, the second driving simulator study, we decided to project the cell phone warning signs onto the virtual roadway displayed on the three screens in order to get the level of brightness we could not achieve with individual images drawn in the simulator world. This involved the creation of animations that were projected onto the virtual environment and move along the road and expand in visual angle as the participant drove past it. 5.1.1 Participants
A total of 14 drivers, 12 men and 2 women, between the ages of 31 and 67 years participated in the experiment. The data of one other participant was not used because the participant suffered motion sickness and did not complete the experiment. The average age was 41.1 years. Drivers were allowed to participate only if they had a valid driver’s license and did not wear glasses. (The eye tracking glasses could be used by participants wearing contacts, but not those wearing glasses.) 5.1.2 Equipment
The ASL MobileEye eye tracker was employed to monitor eye movements of the driver. A description of its capabilities is discussed in Experiment 1. The driving simulator used in Experiment 1 was also used in this experiment. 5.1.3 Experimental Design
The same randomized block design in Experiment 1 was employed with an added factor of a warning or not. Briefly, while driving 28 miles, each driver negotiated through 16 work zones and faced a braking scenario 8 times. The order of presentation

40
was divided into 2 blocks, so that each driver was equally likely to be offered a variable message sign advising them to stop ahead, or not. 5.1.4 Simulation
The same environment used in simulator Experiment 1 was utilized in this study. The warning signs were animated and projected onto the driving scene by a projector that was mounted on the roof of the Saturn (pictured in Figure 1). As was the case in Experiment 1, drivers were equally likely to face a cued or uncued braking scenario and drove while engaged in the hands-free cell task half the time.
5.1.5 Procedure
The participants drove the virtual car through the simulated sections of the highway. They were instructed to maintain a constant following distance. During half of the blocks, the participants were also asked to do the secondary communications task as they performed the driving task.
The participants drove 14 miles and 8 work zones of one block (4 involving a “braking” hazard and four involving a cued scenario). The entire drive time averaged one hour; it varied slightly due to the speed at which the subject drove.
At the beginning of a session, each subject signed an informed consent form. At
the end of a session each subject completed a debriefing questionnaire where they were asked to give subjective ratings of the difficulty they experienced while driving due to having to monitor the following vehicle (rear view mirror task), engage in the mock cell phone task, and negotiate through the work zones.
The procedure in this study was similar to Experiment 1 with the exception that
drivers would periodically be shown a flashing warning message SLOW AHEAD/TURN PHONE OFF when traffic ahead was stopped.
Clearly, real life drivers place a value on cell phone usage while driving.
Therefore, it was important to place a weight on the cell phone conversation in this research. The participants were instructed that they were being measured for both their driving performance and their ability to respond correctly to the hands-free phone task. The decision was left to each driver to continue with the hands-free conversation or to press the off button (which was attached to the center of the steering wheel).
5.1.6 Dependent Variables
Participants were required to wear the eye-tracking device during all trials so that a measure of their eye movements could be obtained. In addition, behavioral information including following distance, vehicle speed, and merging procedure were recorded. Thus, we obtained information relevant to the likelihood of a sideswipe or rear end crash in a real driving situation. We recorded eye glances to the flashing sign, the number of drivers who actually did turn off the cell phone in response to the sign, and the glances away from the road if the driver did turn off the phone. Dingus et al. (20) found that the likelihood of a crash increased if the drivers made glances away from the road for any two seconds of a six second epoch. Although on the surface it may sound reasonable to ask drivers to turn off their cell phone, it may not be reasonable if doing so causes drivers to glance away from

41
the road for more than two out of any six second interval. In this case, such a request may not be the safest alternative. Furthermore, a flashing sign may attract glances toward the sign and away from the road ahead. Therefore, it is imperative to place such a sign prior to the probable event locations.
The criterion used for counting a glance as an indication that the driver was
checking for cars in the adjacent lane when changing lanes was a simple one. In particular, if the glance occurred three seconds or less before the driver changed lanes in order, then the glance was counted as an indication that the driver was checking for cars in the adjacent lane. Lane changes in response to signs, work zone transitions and slow moving vehicles were recorded. Lane changes immediately after leaving the work zone were not recorded because it could be argued that the driver knew nothing was approaching from the previously closed lane.
Since Experiment 1 was conducted, additional data analysis programs have been
developed that allow for further scrutiny of the driving simulator results. Specifically, we were able to determine when the lead vehicle was braking. Therefore, rather than measuring from a trigger location or from the location the lead vehicle stops as was done in Experiment 1, we were able to measure response times and distances from the lead vehicle’s location at the start of the response phase. 5.2 RESULTS AND DISCUSSION The overall results from the second simulator study (Experiment 3) are shown in Table 11. “WARN” refers to instances when the driver received an advanced warning that traffic ahead was stopped and that they should turn off their cell phone. The other variables have been discussed previously.
Table 11. Results from Second Simulator Experiment (Experiment 3)
No Cell No Cue
Cell No Cue
No Cell Cue
Cell Cue
Relative Velocity (Ex 3) 10.5 mph 5.9 mph 15.8 mph 8.6 mph Relative Velocity (Ex 3) WARN 27.4 mph ‐2.2 mph ‐5.2 mph 41.7 mph
Deceleration (Ex 3) 5.5 ft/s/s 9.2 ft/s/s 7.8 ft/s/s 5.6 ft/s/s
Deceleration (Ex 3) WARN 3.2 ft/s/s 3.5 ft/s/s 7.6 ft/s/s 9.3 ft/s/s
SAV braking (Ex 3) 0.077 rad/s 0.080 rad/s 0.053 rad/s 0.070 rad/s
SAV braking (Ex 3) WARN 0.052 rad/s 0.072 rad/s 0.063 rad/s 0.070 rad/s
Closest Dist (Ex 3) 81.7 ft 77.0 ft 103.9 ft 77.4 ft
Closest Dist (Ex 3) WARN 187.2 ft 90.8 ft 59.8 ft 60.2 ft
Min Speed (Ex 3) 56.0 mph 39.1 mph 59.6 mph 42.9 mph
Min Speed (Ex 3) WARN 47.6 mph 37.2 mph 8.3 mph 64.6 mph
BRT (Ex 3) 4.06 sec 3.25 sec 1.06 sec 2.99 sec
BRT (Ex 3) WARN 1.23 sec 2.31 sec 1.88 sec 1.80 sec
BLT (Ex 3) 4.69 sec 3.49 sec 1.39 sec 3.40 sec
BLT (Ex 3) WARN 1.67 sec 2.79 sec 2.21 sec 2.20 sec
Closed loop time 0.63 sec 0.24 sec 0.33 sec 0.41 sec
Closed loop time WARN 0.43 sec 0.49 sec 0.34 sec 0.40 sec

42
5.2.1 Compliance One indicator of the effectiveness of the warning sign is the extent to which the sign gets drivers to turn off their cell phones. Only two drivers turned off the cell phone in response to the warning sign SLOW AHEAD / TURN PHONE OFF. As was expected, if a driver finds utility in remaining on the cell phone, they will likely do so. Of the two drivers, one looked down at the cell phone when turning it off and the other did not (turning it off by “feel”). Of the eleven who did not turn off the cell phone, two did look down at the cell phone after fixating on the sign, obviously contemplating whether to turn the phone off or not. All drivers made at least one fixation at the message sign and two visually followed the sign as they drove by it. Attracting attention off the road and away from traffic ahead may be considered a negative outcome. 5.2.2 Crash Rate
Perhaps the crash rate is the most important indicator of the effectiveness of the warning sign. In Experiment 1, the average crash rate was one crash for every 72 minutes of driving. When we examine the drivers in this study who did not receive a warning, they drove an average of 79 minutes between crashes, which is a very similar rate. Anecdotally, it did not appear that the drivers performed much better after receiving a warning and not until the results were compiled was there a clear difference between the drivers who did and did not receive a warning. After a warning, no driver crashed. While such a stark change in behavior is unlikely to generalize to the real world, it is clear there was an improvement (See Figure 18.).
Figure 18. Crashes per 100 miles traveled in simulated environment
5.2.3 Brake Response Time The above results make sense when we look at measures such as brake response time (the time between when the lead vehicle slows and the driver first applies the brakes). Specifically, drivers who saw a warning responded more quickly (1.81 s) than did drivers how did not see a warning (2.84 s). Moreover, the warning had the same effect for drivers on the cell phone (a reduction of 1.065 s) as it had for drivers not on the cell phone (1.005 s). More generally, drivers on the cell phone (2.59 s) responded more slowly than did drivers not on the cell phone (2.06 s) 5.2.4 Braking Latency Time Braking latency time is the time from brake onset until the driver reached a brake displacement of 10%. The effect of a warning continued to remain strong during the later

43
stages in the processing of a braking event. Drivers seeing a warning depressed the brakes to criterion almost a full second (2.22 s) faster than drivers who did not see the warning (3.24 s). However, there was very little difference in the braking latency time as a function of whether drivers were not on the cell phone (a reduction of 1.1 s) or on the cell phone (a reduction of 0.95 s). More generally, drivers on the cell phone (2.97 s) depressed the brakes more slowly than did drivers not on the cell phone (2.49 s) 5.2.5 Minimum Following Distance These same general findings are mirrored in the minimum following distance, with an important caveat. Specifically, drivers who saw a warning did not approach the lead vehicle as closely (99.50 ft) as did those who did not see a warning (85.00 feet). However, this change is due entirely to drivers who were not on the cell phone. They actually increased their following distance considerably (30.7 ft) when given a warning whereas drivers on the cell decreased their following distance, though only a very small amount (1.7 ft). If we look more closely at the results we see that this is because the presence of a cue appears to impact negatively the following distance in the presence of a warning, actually decreasing that distance by 17.2 ft. More generally, drivers on the cell phone followed at a much closer distance (76.35 ft) than did drivers not on a cell phone (108.15 ft). 5.2.6 Minimum Speed
The above pattern is repeated when we look at the minimum speed. Drivers who received a warning reduced their minimum speed by almost 10 mph, from 49.40 when no warning was present to 39.43 when a warning was present. Again, drivers not on the cell phone were responsible entirely for this reduction, decreasing their minimum speed by 29.85 mph when they were given a warning. The drivers on the cell phone actually increased their minimum speed by 9.90 mph. However, again this increase was due entirely to the change when the drivers received the warning and there was a cue that traffic was going to stop, the minimum speed increasing in this case from 42.90 mph (no warning) to 60.20 mph (warning). More generally, the drivers not on the cell phone reached a slightly lower minimum speed (42.88 mph) than did the drivers on the cell phone (45.95 mph).
5.2.7 Subtended Angular Velocity There is no difference in the subtended angular velocity of drivers given (.007 rad/s) or not given (.007 rad/s) a warning. The reduction in the subtended angular velocity produced by the warning was slightly larger for drivers not on a cell (.0075 rad/s) than it was for drivers on a cell (.004 rad/s), consistent with what one might expect. In general, drivers not on a cell phone were slightly more sensitive (.0613) than drivers on a cell (.073). 5.2.8 Mirror Glances
Drivers on the cell phone failed to glance in the rear view mirror more often in response to signs that advised them to change lanes, much less often when approaching a work zone transition and when preparing to pass a slow moving lead vehicle. Interestingly, only one driver who was not on the cell phone tried to pass a slow moving lead vehicle. Overall, 91% of the time drivers made glances to a mirror when expected to do so when not using a cell phone and 73% of the time when using the cell phone.

44
Table 12 Mean glances into the rear view mirror at signs, work zone transitions and when preparing to pass slow moving lead vehicles.
Descriptive Statistics Dependent Variable: Mirror Glance
Reason Cell Use Mean Std.
Deviation N
No 1.0000 .00000 30
Yes .8696 .33925 69
Sign
Total .9091 .28894 99
No .8462 .36552 39
Yes .4615 .50839 26
WZ Transition
Total .6923 .46513 65
No 1.0000 . 1
Yes .3750 .51755 8
Slow LV
Total .4444 .52705 9
No .9143 .28196 70
Yes .7282 .44709 103
Total
Total .8035 .39853 173
We can make a direct comparison between Experiment 1 and Experiment 3 results and we see that the results were similar; however, a greater portion of the failed glances occurred during the cell phone task (Table 13.). We should clarify, that in the two simulator studies, the rear view scene was a stationary photograph that depicted traffic at the proper perspective. Although there were rewards tied to successful mirror glances;; however, the mirror glance task was still a measure of cognitive workload and situational awareness in that when not on the cell phone, drivers clearly had less difficulty performing the task.
Table 13. Comparison of Mirror Glances in Experiments 1 and 3
Mirror Glances in Preparation for a Lane
Change
Lane Changes
Failed Glances
% Failed
Glances
Failed Glances
Cell Task
% Failed
Glances Cell Task
Experiment 1 454 78 17.2% 49 62.8%
Experiment 3 173 34 19.7% 28 82.4%

45
5.2.9 Workload and Performance Index The performance index was developed using standardized scores for the minimum following distance (MinR), percent response, deceleration factor (μ), brake response time and closing sped (VR) and was calculated using Equation 4. The correlation between the subjective influence of the hands-free cell phone task and the performance index reached statistical significance. Participants who rated the hands-free cell phone task as the most difficult had the highest performance indexes. This result is encouraging in that if we can make cell phone drivers aware of the information they are missing (or how difficult it is to drive safely when on the cell phone), drivers may be able to both improve their performance and be less likely to use the cell phone when driving.
Figure 19 Performance index of drivers relative to their subjective rating of the
influence that the hands-free cell task had on their driving performance. 5.3 CONCLUSIONS
The third study in this series allowed us to explore remedies for moderately
distracted drivers. A warning triggered by the traffic pattern in a work zone offered a level of improvement in driver performance and was associated with a much lower probability of a crash. The decrease in the crash rate that occurs with the use of the warning sign is consistent with the decreases in brake response time and braking latency, the increase in following distance, and the decrease in the minimum speed.
In a real life warning situations, driver trust is always at the forefront. Current technology allows for the monitoring of traffic speed in the work zone and notifying approaching drivers. A sign which would make use of such technologies was evaluated in this experiment. However, there will always be warnings which are given when not necessary (false alarms) and warnings not given when they should be (misses). Thus, we included false alarms and misses in our study. There were six false warnings or a 20% false alarm rate. The miss rate (no warning when a braking event existed) was 50%.

46
Despite the error rates associated with this study, the real time warning was associated with a measurable decrease in the probability of a crash.
However, several caveats are in order. First, in several instances the overall
improvements in safety which were measured when the warning sign was present were the consequence of large changes in the condition in which the drivers were not talking on the cell phone. For example, when the warning was present drivers on the cell phone actually drove closer and had a larger minimum speed than when the warning was not present. This suggests that in order to compute the expected benefits of a warning sign one is going to need to know the proportion of drivers on and off the cell phone. Second, a message asking cell phone drivers to turn off their cell phone does have two possible safety consequences when compared with a message that simply asked drivers not to use their cell phone. Specifically, drivers asked to turn off their phones may need to look away from the road to end a conversation as they enter the work zone and again to glance away from the road to dial the other party after they exit the work zone. The costs in this case could outweigh the benefits. An alternative would be to present drivers with a sign that indicated that they should not use their cell phone. Presumably such drivers would indicate to the person to whom they were talking that the conversation needed to end for a short period of time, not actually be aborted. Third, the sign could be displayed during all active construction times rather than just when the traffic was slowed. The advantage of doing such is obvious if it were effective. Drivers on their cell phones are more at risk of crashing under all circumstances. There is no obvious disadvantage to doing such unless drivers decide to ignore the message more frequently when it is always presented than when it is presented only in the most risky of situations. Fourth, we know only that the sign we used reduces risky behaviors when combined with the “LEFT MERGE” or “RIGHT MERGE” signs. We do not know whether others of the signs that are normally placed in the construction zone would have led drivers to reduce their use of the cell phone as much as we observed since we did not use such signs. Finally, the sign we used might need to be placed at several points in a long work zone if traffic both sped up and slowed down. This may be a practical constraint. More useful might be the existing sign which said “BE PREPARED TO STOP” (W3-4) along with a supplemental “WHEN FLASHING” panel. Such a sign would only need to be placed once at the start of a work zone if there were slowing at any point. “SLOW AHEAD” implies a specific location and thus would need to be placed at all such locations. Of course, one still needs to add information about cell phone use.
6. RESEARCH FINDINGS
This research reports an analysis of the effect of cell phones and warning signs on the driver behaviors that are most likely to lead to the types of crashes that are most often observed in work zones. Three experiments were conducted, the first on a driving simulator, the second in the field, and the third again on a driving simulator.

47
First, consider the effect of cell phones on drivers’ behavior in work zones (Table 14). In Experiment 1, undertaken on the driving simulator, on half of the scenarios cues were presented to the driver that traffic ahead was going to stop. Drivers who were engaged in the mock cell phone conversation did not appear to pay as close attention to these cues, exhibiting more sharp decelerations (greater than 0.5 g), taking longer to respond, and traveling faster near the lead vehicle as it was stopping or stopped. Not only did engaging in a mock cell phone task affect drivers processing of cues directly ahead of them, but we found that drivers in the mock cell phone task searched less broadly side to side and were 30% less likely to check their rear view mirror. These results strongly suggest that cell phone use reduces situational awareness and will increase the two major types of crashes in work zone activity areas, which are rear end and sideswipe collisions.
In Experiment 2, undertaken in the field, it is clear that the drivers on the cell phone performed much less safely than did drivers not on the cell phone, at least when confining the analyses to those drivers who did brake in the work zone activity area. In particular, drivers on the cell phone who braked while in the work zone activity area took about twice as long to do such, came about 30% closer to the lead vehicle, and closed about 33% faster. Moreover, drivers on the cell phone were either going faster or closer to the lead vehicle when they actually braked. Contrariwise, drivers not on the cell phone decelerated almost twice as much as did drivers on the cell phone when the lead vehicle braked, indicating that they were more likely to respond appropriately to the developing situation (a slowing vehicle ahead). In Experiment 3, undertaken on a driving simulator, drivers engaged in a mock cell phone task again performed much less safely than drivers not so engaged. They took longer to initiate braking and to follow through with braking. Moreover, they followed more closely and at a higher minimum speed. Looking at the mirror glances, fully 82.4% of the failures to glance in the mirror when changing lanes occurred while the driver was talking on the cell phone. Table 14. Summary Results in Experiments 1, 2 and 3 for Drivers Engaged and Not
Engaged on a Cell Phone. Dependent Variable Experiment 1 Experiment 2 Experiment 3 Brake Response Time Cell slower Cell slower Cell slower Brake Latency Time Cell slower Distance to 1st Response Cell longer Speed Near LV Cell faster Cell faster Cell faster Hard Brakes Cell harder Minimum Closing Distance Cell closer Cell closer SAVb Cell larger Deceleration (brake lights) Cell smaller Search Area Cell smaller Mirror Scanning Cell less frequent Cell less frequent Perhaps one of the most intriguing findings in this research is the relationship between the ways drivers believed the hands-free cell phone task influenced their performance and how it actually did influence their performance. Drivers exhibited a form of ignorant bliss in that those who subjectively reported that the cell phone task had the smallest influence on their performance actually performed the worst. Perhaps what

48
may be a valuable finding is that the drivers who reported the hands-free cell phone task to be most difficult actually performed the best. Apparently those who force themselves to be more vigilant and search more broadly when on the cell phone, and therefore process more information per unit time, are better able to recognize all the information that should be processed when driving in a work zone. However, drivers who reported the cell phone task to be easy frequently missed important details in their environments early on or missed them entirely. Due to a lack of feedback, these drivers do not learn that they are missing valuable information until they experience an aversive stimulus. Unfortunately, the first aversive event may be a crash scenario. If drivers are made aware of the information they may be missing in some way, then this result suggests that there may be some improvement in performance
Finally, we want to summarize what we found out about the effect of warnings on drivers behavior in a work zone. On average, without a warning, the crash rate per 100 miles was 2.36 in Experiment 1 and 1.71 in Experiment 3. In both experiments drivers engaged in a cell phone conversation were clearly more at risk than drivers not so engaged. In Experiment 3, we also included a warning on half of the trials that traffic ahead was slowed. No driver crashes when the warning was displayed, either drivers engaged or not engaged in a cell phone conversation. The decrease in the crash rate that occurs with the use of the warning sign is consistent with the decreases in brake response time and braking latency, the increase in following distance, and the decrease in the minimum speed. However, we noted that a caveat was in order. In several instances the overall improvements in safety which were measured when the warning sign was present were the consequence of large changes in the condition in which the drivers were not talking on the cell phone. For example, when the warning was present drivers on the cell phone actually drove closer and had a larger minimum speed than when the warning was not present. This suggests that in order to compute the expected benefits of a warning sign one is going to need to know the proportion of drivers on and off the cell phone.
7. REFERENCES 1. Federal Highway Administration. Manual on Uniform Traffic Control Devices for Highways and Streets. Washington, DC : Federal Highway Administration, 2003 with revisions 1 and 2. 2. International Road Federation. Safety for workers. World Highways. April 2000, Vol. 9, pp. 61-62. 3. Raub, R. A., et al. Traffic Control Systems in Construction Workzones. Evanston, Illinois : Traffic Institute, Northwestern University, February 2001. No. ITRC FR 97-5. 4. Zhao, M. and Garber, N. J. Crash Characteristics at Work Zones. Charlottesville, Virginiaand Washington, DC : University of Virginia, and Department of Transportation, May 2001. No. UVA/29472/CE01/100. 5. Ishida, T. and Matsuura, T. The effect of cellular phone use on driving performance. IATSS Research. 2001, Vol. 25, pp. 6-14. 6. Strayer, D. L. and Johnston, W. A. Driven to distraction: Dual-task studies of simulated driving and conversing on a cellular phone. Psychological Science. 2001, Vol. 12, pp. 462-466. 7. Boff, K. R. and Lincoln, J. E. Visual warning signals: Effects of flashing, Engineering data compendium: Human perception and performance. s.l. : Wright-Patterson AFB, 1988. 2408.

49
8. The Effect of Presence Lights on the Detection of Change of Headway. Fisher, A.J. and Hall, R.R. s.l. : Australian Road Research, 1978, Vol. 8, pp. 13-16. 9. Schreiner, L. M. An investigation of the effectiveness of a strobe light as an imminent rear warning signal. Master’s Thesis in Industrial Systems and Engineering. Blacksburg, VA : Virginia Polytechnic Institute, 2000. 10. Muttart, J. W., et al. Driving Without a Clue: Evaluation of Driver Simulator Performance During Hands-Free Cell Phone Operation in a Work Zone. Washington, DC : Transportation Research Board of the National Academies, 2007. pp. 9-14. Transportation Research Record 2018. 11. Strayer, D. L., et al. Why Do Cell Phone Conversations Interfere With Driving? [book auth.] W. R. Walker and D. Herrmann (Eds.). Cognitive Technology: Transforming Thought and Society. Jefferson, NC. : McFarland & Company Inc., 2008. 12. Simons, D. J. and Chabris, C. F. Gorillas in ours midst: Sustained inattentional blindness for dynamics events. Perception. 1999, Vol. 28, pp. 1059-1074. 13. Lam, L. T. Distractions and the risk of car crash injury: the effect of drivers’ age. Journal of Safety Research. 2001, Vol. 33, pp. 411–419. 14. Recarte, M.A. and Nunes, L. Mental workload while driving: Effects on visual search. Journal of Experimental Psychology: Applied. 2003, Vol. 9, pp. 119-137. 15. Harbluk, J.L., Noy, I and Eizenman, E. The impact of cognitive distraction on driver visual behaviour and vehicle control. Ottawa, Canada : Transport Canada, 2002. Rep. No. TP 13889E. 16. Baddeley, A. A 3-minute reasoning test based on grammatical transformations. Psychological Science. 1968, Vol. 10, pp. 341-342. 17. Nilsson, L. and Alm, H. Effects of mobile telephone use on elderly drivers' behavior - including comparisons to young drivers' behavior. Linkoping, Sweden : Transportation Research Board of the National Academies, 1991. NTIS No. PB92-153170. 18. Alm, H. and Nilsson, L. Changes in driver behavior as a function of hands free mobile telephones: A simulator study. Linoping, Sweden : National Technical Information Service., 1991. NTIS No. PB92-153188. 19. Drummond, S., Brown, G.G. and Salamat, J.S. Brain regions involved in simple and complex grammatical transformations. Cognitive Neuroscience and Neuropsychology. 2003, Vol. 14, pp. 1117-1122. 20. Dingus, T. A., et al. The 100-Car naturalistic Driving Study Phase II-Resultof the 100-Car Field Experiment. Washington, DC : National Highway Traffic safety Administration, April 2006. DOT HS 810 59. 21. McGehee, D.V., Brown, T. and Wilson, T. Examination of drivers' collision avoidance behavior in a stationary lead vehicle situation using a front-to-rear-end collision warning system. Washington, DC : USDOT/NHTSA Office of Crash Avoidance Research Technical Report, 1997. DTNH22-93-C-07326. 22. Hoffman, E. R. and Mortimer, R. G. Scaling of relative velocity between vehicles. Accident Analysis and Prevention. 128, 1996, pp. 415-427. 23. Summala, H., Lamble, D. and Laakso, M. Driving experience and perception of the lead car's braking when looking at in-car targets. Accident Analysis and Prevention. 30, 1998, pp. 401-407. 24. Hoffman, E. R. and Mortimer, R. G. Scaling of relative velocity between vehicles. Proceedings of the Human Factors and Ergonomics Society 38th Annual Meeting. 2, 1994, pp. 1-5. 25. Muttart, J.W., Messerschmidt, W. and Gillen, L. Relationship between Relative Velocity Detection and Driver Response Times in Vehicle Following Situations . Warrendale, PA : Society of Automotive Engineers, 2005. 2005-01-0427.

50
26. Socrock, G. S., Ranney, T. A. and Lehto, M. R. Motor vehicle crashes in roadway construction workzones: an analysis using narrative text from insurance claims. Accident Analysis and Prevention. 1996, Vol. 28, pp. 131-138. 27. Chang, M. S., Messer, C. J. and Santiago, A. J. Timing traffic signal change intervals based on driver behavior. Washington, DC : Transportation Research Board of the National Academies, 1985. pp. 20-30. TRR 1027. 28. Lamble, D., et al. Cognitive load and detection thresholds in car following situations: Safety implications for using mobile (cellular) telephones while driving. Accident Analysis and Prevention. 31, 1999, pp. 617-623. 29. Shannon, C.E. A Mathematical Theory of Communication. Bell System Technical Journal. 27, 1948, pp. 379-423, 623-656. 30. I., El-Shawarby, et al. Evaluation of Driver Deceleration Behavior at Signalized Intersections. Washington, DC : Transportation Research Board of the National Academies, 2007. pp. 29-35. TRR 2018. 31. Zhang, C. and Ivan, J. N. Effects of Geometric Characteristics on Head-on Crash Incidence on Two-Lane Roads in Connecticut. Washington, DC : Transportation Research Board of the National Academies, 2005. pp. 159-164. TRR 1908. 32. Yan, X., Radwan, E. and Guo, D. Effects of major-road vehicle speed and driver age and gender on left-turn gap acceptance. Accident Analysis & Prevention. 2007, Vol. 39, pp. 843-852. 33. Wang, J., et al. Normal Acceleration Behavior of Passenger Vehicles Starting from Rest at All-Way Stop-Controlled Intersections. Washington, DC : Transportation Research Board of the National Academies, 2004. pp. 158-166. Transportation Research Record 1883. 34. Summala, H.:Nieminen, T. and Punto, M. Maintaining lane position with peripheral vision during in-vehicle tasks. Human Factors. 1996, Vol. 38, pp. 442-451. 35. Proctor, C. L., et al. Analysis of Acceleration in Passenger Cars and Heavy Trucks. Warrendale, PA : Society of Automotive Engineers, 1995. 950136. 36. Nawrot, M., Nordenstrom, B. and Olson, A. Disruption of Eye Movements byEthanol Intoxication AffectsPerception of Depth FromMotion Parallax. Psychological Science. 2004, Vol. 15. 37. Muttart, J. W. Vehicle Acceleration: Observations and Test Results. Accident Investigation Quarterly. 1996, Vol. 10. 38. Mourant, R. R. and Rockwell, T. H. Strategies of Visual Search by Novice and Experienced Drivers. Human Factors. 1972, Vol. 14, pp. 325-335. 39. Perceptual factors in rear end crashes. Mortimer, R., G. Santa Monica, CA : s.n., 1990. Human Factors Society 34th Annual Meeting, Human Factors & Ergonomics Society. pp. 591-594. 40. Long, G. Acceleration Characteristics of Starting Vehicles. Washington, DC : Transportation Research Board of the National Academies, 2000. TRR 1737. 41. Lave, C. A. Speeding, Coordination, and the 55 MPH Limit. The American Economic Review. 75.5, 1985 December, pp. 1159, 1161. 42. Knipling, R., et al. Assessment of IVHS countermeasures for collision avoidance: Rear-end crashes. Final Report. Washington, DC : National Highway Traffic Safety Administration, 1993. DOT HS 807 995. 43. Horowitz, T.S., et al. Searching Day and Night: A Disassociation of Effects of Circadian Phase and Time Awake on Visual Selective Attention and Vigilance. Psychological Science. 2003, Vol. 14, pp. 549-557.

51
44. Hong, Z. Normal Acceleration Characteristics of the Leading Vehicle in a Queue at Signalized Intersections on Arterial Streets Master of Science in Civil Engineering Thesis. Atlanta, GA : Georgia Intitute of Technology, 2007. 45. Harwood, D. W., et al. Intersection Sight Distance. Washington, DC : TRB National Research Council, 1996. NCHRP Report 383. 46. Garber, N. J. and Gadiraju, R. Factors Affecting Speed Variance and Its Influence on Accidents. Washington, DC : Transportation Research Record 1213. p. 64. 47. Fugger, T., et al. Driver Characteristics at Signal Controlled Intersections. Warrendale, PA : Society of Automotive Engineers, 2001. 2001-01-0045. 48. Fricke, Lynn, B. Traffic Accident Reconstruction. Evansville, IL : Northwestern University Traffic Institute, 1990. 49. Fisher, D. L., Pollatsek, A. P. and Pradhan, A. K. Can novice drivers be trained to scan for information that will reduce their likelihood of a crash? Injury Prevention 2006;12(Supplement 1 ):i25-i29; doi:10.1136/ip.2006.012021. 2006, Vol. 12 (Supplement 1), pp. 25-29. 50. Chan, E., et al. Evaluation on a driving simulator of the effect on drivers’ eye behaviors from distractions inside and outside the vehicle. Human Factors. 2008, Vol. in revision. 51. Brehmer, B. Variable errors set a limit to adaptation. Ergonomics. 33, 1990, pp. 1231-1239. 52. Microsimulation and Analytical Methods for Modelling Urban Traffic. Akcelik, R. and Beasley, M. Truckee, CA : Conference on Advanced Modeling Techniques and Quality of Service in Highway capacity Analysis, 2001. 53. Acceleration and Deceleration Models. Akcelik, R. and Beasley, M. Melbourne, AU : 23rd Conference on Australian Transportation Research, December 2001. 54. Safety for workers. World Highways. Apr 2000, Vol. 9, pp. 61-62. 55. Intelligent Transportation Systems in Work Zones: A Cross-Cutting Study... Integrated Work Zone Systems for Improving Travel Conditions and Safety. Federal Highway Administration. Washington, DC : Federal Highway , (November 2002). FHWA-OP-02-025. 56. Lee, S, Olsen, E. C. B. and Simons-Morton, B. Eyeglance behavior of novice teen and experienced adult drivers. TRB 85th Annual Meeting, Transportation Research Record. 2006. 57. Fisher, D. L., Pradhan, A. K., Pollatsek, A. and Knodler, M. A. Jr. Empirical evaluation of hazard anticipation behaviors in the field and on a driving simulator using an eye tracker. Washington, DC : Transportation Research Board, 2008.

52
APPENDIX A: HANDS-FREE CELL PHONE TASK
The hands-free communication task (i.e., mock cell phone task) involved the subjects wearing ear buds and listening to a series of sentences that were similar to the grammatical reasoning (working memory) tasks used by Baddeley (16). Other studies have also used a similar task to replicate the cellular phone task (17,18). The variation on the task is that the difficulty of the task was reduced slightly from that of Alm & Nilsson (12, 13). In the present experiment, the drivers heard a 5-word sentence every 10 seconds through a cell phone ear bud. After each sentence, the driver was asked if the sentence made sense or not. Seven seconds after the sentence began, the subject was asked, “Last word?” and was given an additional three seconds to answer. An example of the procedure is as follows. The driver was read, “The truck delivered the package.” In response the driver should answer “yes”. The experimenter would then ask “Last word? And the driver should respond, “Package”. An example of a sentence that does not make sense is “The octopus burned the onions”. Drummond, Brown, and Salamat, (19) investigated Baddeley’s grammatical reasoning test and found that asking participants to listen to longer sentences or recall the last word after several sentences may require drivers to tap portions of the brain that are not normally activated during sentences involving fewer words. Therefore, the hands-free mock cell phone task was intended to replicate a very casual cell phone conversation that does not require mental rehearsal or recall intervals of greater than 3 seconds.

53
APPENDIX B: DIRECTIONS FOR WORK ZONE RESEARCH ASSISTANTS Safety is foremost. Therefore always be prepared to move out of the way of an errant vehicle. If required to move a mock pedestrian into the path of the lead vehicle, do so from a distance of no closer than 25 feet from the work zone path designed for the vehicle and from a position behind the cones or barrels. You will be issued a two-way radio. Feel free to activate the radio and announce, “Abort” if you see a hazard of any kind or if you have not yet set up the experiment properly. Odd # subjects 1. PED NO 2. NO PED 3. NO NO 4. PED PED Even # subjects 1. NO PED 2. PED NO 3. PED NO 4. NO PED REPEAT

54
APPENDIX C: DIRECTIONS FOR DRIVER OF THE LEAD VEHICLE
Depress brake light button every time you use the brakes. Safety is always foremost. Therefore if you hear someone call out “Abort” on the two-way radio or if there is a stray pedestrian in the area (other than assistants) stop the vehicle slowly (so as not to be rear ended by the subject vehicle). Moving the vehicle off the road may entice the subject vehicle to continue and we do not want that to happen. Start near Engineering Lab 1. Once the experimenter is completed with the calibration process, he will click the two-way radio three times as a message for you to take the lead position. Following the path as outlined on the map on the next page.

55
You will attempt to drive through the work zones while traveling a constant rate of 25 mph. After passing a marked barrel (that we will identify to you) you will activate your mock brake lights for approximately 3 seconds. Activate mock brake lights as follows Odd # subjects 1. YES YES 2. NO NO 3. YES NO 4. NO YES Even # subjects 1. YES NO 2. YES NO 3. NO YES 4. NO YES REPEAT
4 laps

56
APPENDIX D: DIRECTIONS FOR THE IN-VEHICLE EXPERIMENTER Verify that subject has signed informed consent and had their license verified. Calibrate subject Read script Directions for this research You will be driving for approximately 45 minutes. You will drive through 2 work zones – 4 times each for a total of 8 work zones. During half of this drive you will have a hands free question and answer task and in the other half you will not. You may notice that there is a lead vehicle while driving. Please do not pass the lead vehicle and follow at a safe distance behind the lead vehicle, but while keeping up with that vehicle. It is important that you maintain a constant but safe following distance. If when preparing to move from one lane to another you see a vehicle in your rear view mirror, put on your directional signal and then change lanes as you normally would. The speed limit on the roads you will be traveling is 25 mph. You have been fitted with eye tracking glasses. These glasses have been calibrated to your eyes, if you move or adjust the glasses, we will have to re-calibrate. Therefore, try not to move the glasses and if you do move the glasses in any way, please let me know. Please drive safely. Therefore, if exposed to a dangerous situation or a potential hazard, your safety is always more important that research data. If you wish to retire from this study at any time please drive slowly off the right side of the road and we will return you to Engineering Lab I where you will receive full compensation for your participation. Do you understand these directions? TELEPHONE TASK
You will be read a series of sentences. At the end of the sentence, you must state, “Yes” if the sentence makes sense (is possible), or “No” if the sentence does not make sense. You will be given 3 seconds to answer after which you will be asked the question “Last Word?” At which point you will be given 3 seconds to repeat the last word of the sentence before another sentence is read. If you do not understand a sentence, try your best and get ready for the next question.
I will now read two sentences as an example of the procedure. The cook baked the cake Last word: The apple fried the onion Last word Do you understand the telephone task? Click 3 times to announce to LV On 2-way radio, announce subject number

57
APPENDIX E: DIRECTIONS FOR THE IN-LAB RESEARCH ASSISTANT Greet subjects Verify current driver’s license Have them sign a consent form. Make sure they are not wearing glasses Put Consent, debriefing form & payment voucher form (2) and a miniDV tape in a manila envelope. All items should have the subject’s number written on them (I have pens in my desk if you run out). If you run out of copies, make more on the copying machine (SW corner of the room). Give the envelope to the subject to take into the car with them. Oversee study, keep in touch via two-way radios, but limit radio traffic (do not disturb subject). There will be a two way radio in the lead vehicle, at the work zones and at the lab. Give relief workers a description of their task and arrange for a ride to the stadium (in the Lead vehicle). When subject returns take the debriefing form and voucher out of their envelope. Have them complete each form. Pay them $25 and thank them.