Dr. Arvind Virmani ...
19
Dr. Arvind Virmani https://sites.google.com/site/drarvindvirmani/ https://www.facebook.com/arvindvirmani2 h d bl http://dravirmani.blogspot.in/ https://sites.google.com/site/chintan1997reg/
Transcript of Dr. Arvind Virmani ...

Dr. Arvind Virmanihttps://sites.google.com/site/drarvindvirmani/https://www.facebook.com/arvindvirmani2
h d blhttp://dravirmani.blogspot.in/https://sites.google.com/site/chintan1997reg/

Trends & Effects of Global CrisisTrends & Effects of Global Crisis
Trends & Projections(fig 1 & 1a)j ( g )Fiscal Crises in Developed countries
Economic growth constrainedEconomic growth constrainedSlower Growth of World GDP, Trade
Export oriented economies will looseExport oriented economies will looseGrowth/Development model
Domestic oriented (export neutral): Domestic oriented (export neutral): Speed up existing reform approach
Energy/Oil rich: Return to LT trend
August 22, 2014 @dravirmani 2
gy

Shares of world GDP and calculated IMF quota
August 22, 2014 @dravirmani 3

1. Trends in Real Relative Size f C t i (Gd P )of Countries (Gdp Ppp)
110%China Japan
80%
90%
100%p
India Germany
Russia Brazil
50%
60%
70%
%
30%
40%
50%
10%
20%
2008
2009
2010
2011
2012
2013
2014
2015
2016
2017
2018
2019
2020
2021
2022
2023
2024
2025
2026
2027
2028
August 22, 2014 @dravirmani 4

1b Relative Economic Size (GdpPpp)
60%India Japan Germany
50%
Russia Brazil UK
France Italy
40%
20%
30%
10%
2005
2006
2007
2008
2009
2010
2011
2012
2013
2014
2015
2016
2017
2018
2019
2020
2021
2022
2023
2024
2025
August 22, 2014 @dravirmani 5
2 2 2 2 2 2 2 2 2 2 2 2 2 2 2 2 2 2 2 2 2

Traditional Principle Set ATraditional Principle Set AOne Country One Vote :
UN General Assembly: Gridlock and irrelevance=> Modified principle: Basic Votes
O P O VOne Person One Vote:Protection of individual/minority rights through rule of law essential for true democracy law essential for true democracy. =>Modified principle: Share of World Population
Economic Weight in World Economy(Blend): g y( )=>Modified principle: Share of World GDP
January 12, 2012 Chair: Governance & Quota Reform 6

Traditional Principle Set BTraditional Principle Set BDemand/Debtors:
Vulnerability/Variability of BOP => Access(quota tranches)
Reality: Linked to (a) Size/GDP and (b) Contagion (negative Reality: Linked to (a) Size/GDP and (b) Contagion (negative effect on others).
=>Modified principle: Formula based on GDP will automatically address the dissonance between theory and reality.Asymmetric treatment of positive and negative contributions to Rest of the World. Formula should logically result in higher quota in the former case and lower quota in the latter case!
January 12, 2012 Chair: Governance & Quota Reform 7

Traditional Principle Set BTraditional Principle Set BSupply/Creditors:
Resources: One time contribution‐> Higher share ever after?Resources: One time contribution‐> Higher share ever after?
Equity Based Institution: Not company with free market in shares and individuals free to buy from or sell to company.
All countries have to accept IMF rules (e.g. surveillance)=>Modified principle: Quota formula ‐maximum equity/voting right equity/voting right.
Large majority of countries is willing to contribute more if it translates into higher quota/voting share.Minority of countries with fund constraints, are free to to contribute less and have a lower share of votes.
Temporary needs can be met through counter cyclical p y g yDebt/borrowing limits.
January 12, 2012 Chair: Governance & Quota Reform 8

Proposed Principles (Set C).Proposed Principles (Set C). Domestic GovernmentDemocratic principle: 1 person 1 vote
Global Economic Governance: Global Economic Governance: Partial surrender of Ec. sovereigntyM ifiMore autonomy => greater sacrificeEconomic size => Autonomy/Power
Global Role Economic size (GdpPpp)Economy share in Aggregate (World)GDP => Quota Share
August 22, 2014 @dravirmani 9
y gg g ( ) Q

b ld h bT1. Contribution to World Growth: Abs
2006 2007 2008 2009 2010 2011 2012 20132006 2007 2008 2009 2010 2011 2012 2013
China 0.23 0.26 0.38 1.63 0.26 0.33 0.32 0.32USA 0.11 0.08 ‐0.03 ‐1.07 0.12 0.08 0.09 0.11Euro Area 0.10 0.09 0.02 ‐1.00 0.05 0.06 0.04 0.05India 0.08 0.08 0.10 0.49 0.10 0.11 0.11 0.11Russia 0.05 0.05 0.06 ‐0.38 0.02 0.03 0.03 0.03Japan 0.03 0.03 ‐0.03 ‐0.59 0.05 ‐0.01 0.03 0.03pMexico 0.02 0.01 0.01 ‐0.21 0.02 0.02 0.02 0.02Brazil 0.02 0.03 0.05 ‐0.03 0.04 0.03 0.03 0.03Korea 0.02 0.02 0.02 0.01 0.02 0.02 0.02 0.02UK 0 02 0 02 0 00 0 23 0 01 0 01 0 01 0 01UK 0.02 0.02 0.00 ‐0.23 0.01 0.01 0.01 0.01Turkey 0.02 0.01 0.00 ‐0.10 0.02 0.02 0.01 0.01Indonesia 0.01 0.01 0.03 0.09 0.02 0.02 0.02 0.02Memo item
August 22, 2014 @dravirmani 10
Germany 0.03 0.03 0.01 0.32 0.03 0.03 0.01 0.01

b ld h kContribution to World Growth: Rank
2006 2007 2008 2009 2010 2011 2012 2013
China 1 1 1 1 1 1 1 1USA 2 4 2 3 3 3USA 2 4 2 3 3 3Euro Area 3 2 6 4 4 4 4India 4 3 2 2 3 2 2 2Russia 5 5 3 7 5 6 5Japan 6 7 5 5 7Japan 6 7 5 5 7Mexico 7 12 11 10 9 10 10Brazil 8 6 4 6 6 7 6Korea 9 9 9 8 8 10 9 9UK 10 10 15 11UK 10 10 15 11Turkey 11 11 8 13Indonesia 12 11 5 3 12 7 8 8
August 22, 2014 @dravirmani 11

Openness vs Macro ContributionOpenness vs Macro Contribution
Openness (Trade‐GDP ratio)Unrelated to global importance or impact
Global Aggregate Demand shortfallGlobal Aggregate Demand shortfallContribution to net demand Critical to global recoveryTable of net contributionsTable of net contributions
Abandon Anti deluvian concepts
August 22, 2014 @dravirmani 12
p

ib i ld dNet Contribution to World Demand: Net Balance on Goods & Services
2009 2010 2010 2009 2010
Deficit Deficit Net Cont Rank RankUSA ‐381.3 ‐500.0 43% 1 1India ‐78.4 ‐82.8 7% 2 2UK ‐46 4 ‐76 2 7% 3 3UK 46.4 76.2 7% 3 3
Surpus Surplus Net Cont Rank RankChina 220.1 232.1 ‐14% 183 183Germany 178 6 193 9 ‐12% 182 182Germany 178.6 193.9 12% 182 182Russia 91.5 123.6 ‐8% 181 181Saudi Arabia 37.6 85.4 ‐5% 175 180Netherlands 58.9 63.5 ‐4% 180 177
August 22, 2014 @dravirmani 13

l lEconomic Reality vs. Quota Proposals
Post 2ndRound(%) % Rank Share Rank % Rank Abs % D/S Rank
USA 17.67 17.41 1 19.105 1 7.5% 3 500 43.4% 1
2010 Contribution toto net demand(‐net G&S)
Contribution togrowth in 2011
2011 country sharein aggregate GDP
Quota Shares14th general review
Japan 6.56 6.46 2 5.574 4 ‐0.7% 182 ‐75 ‐4.6% 179China 4.00 6.39 3 14.351 2 32.6% 1 ‐232 ‐14.3% 183Germany 6.11 5.59 4 3.918 5 2.7% 6 ‐194 ‐12.0% 182UK 4.51 4.23 5 2.858 8 0.8% 19 76 6.6% 3France 4.51 4.23 6 2.811 9 1.2% 14 58 5.0% 4It l 3 31 3 16 7 2 319 10 0 4% 37 36 3 2% 6Italy 3.31 3.16 7 2.319 10 0.4% 37 36 3.2% 6India 2.44 2.75 8 5.668 3 10.8% 2 83 7.2% 2Russia 2.49 2.71 9 3.014 6 3.3% 4 ‐124 ‐7.6% 181Brazil 1.78 2.32 10 2.928 7 2.8% 5 11 0.9% 13Canada 2.67 2.31 11 1.764 14 0.9% 16 31 2.7% 7LIC 1 88 1 89 1 29 1 9% 63LIC 1.88 1.89 1.29 1.9% 63LMIC 9.0 8.8 12.0 18.1% 140UMIC 15.2 17.5 26.0 45.3% ‐316HIC 73.9 71.8 60.7 32.0% ‐355
August 22, 2014 @dravirmani 14

Table: Variation of Quota share with GDP PPP share (in GDP blend)GDP PPP share (in GDP blend)
G GDPPPP h (i GDP bl d)Group0.0 0.4 0.5 0.6 1.0
Low Income Countries 0.66 0.91 0.98 1.04 1.29
GDPPPP share (in GDP blend)
Lower Middle Income countries 6.7 8.8 9.3 9.9 12.0Upper Middle Income countries 18.6 21.5 22.3 23.0 26.0Higher Income countries 74.1 68.7 67.4 66.0 60.7
August 22, 2014 @dravirmani 15
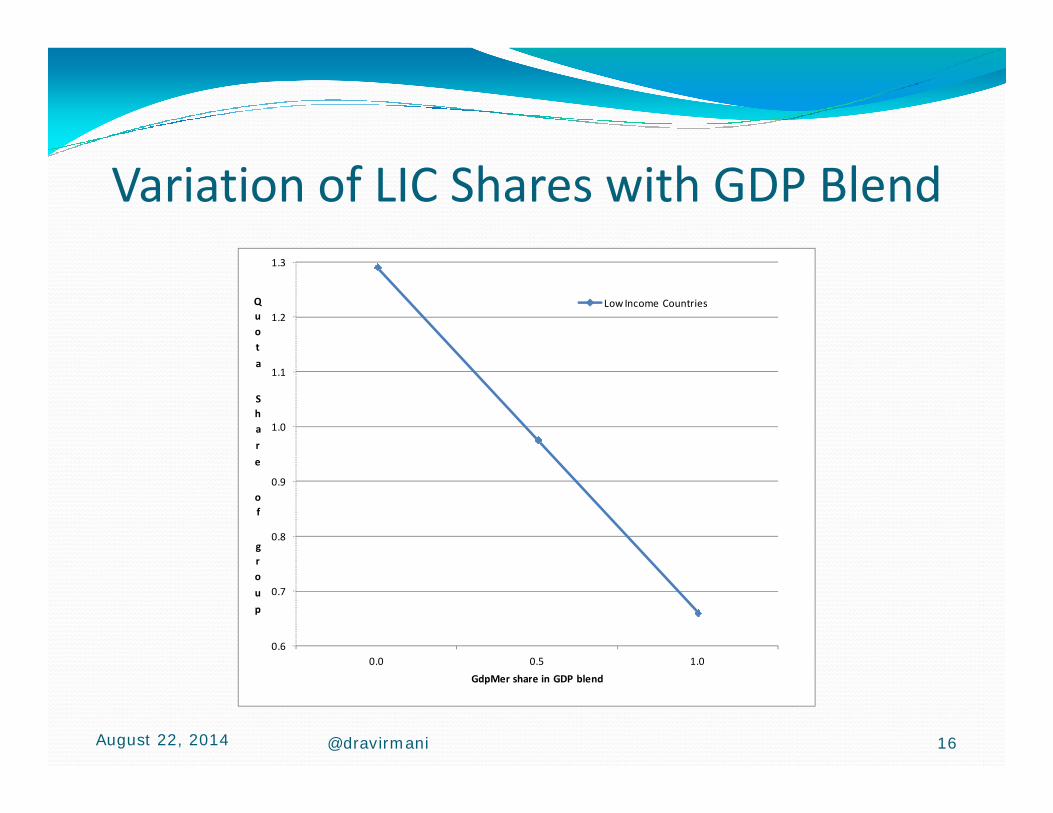
Variation of LIC Shares with GDP Blend
1.2
1.3
Quot
Low Income Countries
1.0
1.1a
Sha
r
0.8
0.9
e
of
gr
0.6
0.7
0 0 0 5 1 0
ro
u
p
August 22, 2014 @dravirmani 16
0.0 0.5 1.0
GdpMer share in GDP blend

Variation of LMIC, UMIC and HIC Shares with Blend
65
75
Quot
45
55a
Sha
r
Lower Middle Income countries
Upper Middle Income countries
25
35
e
of
gr
Higher Income countries
5
15
0 0 0 5 1 0
ro
u
p
August 22, 2014 @dravirmani 17
0.0 0.5 1.0
GdpMer share in GDP blend

CONCLUSIONImplications for Quota Formula
Simplicity, Transparency and EquityEconomic Importance in World Economy:
Gdp Share in Global economy (80%); Majority weight of GdpPPP in blend
Voice and Vulnerability of people Population shares (15%) or share of global poorp ( 5 ) g p
Country Representation: Incorporate basic vote into formula (5%)
January 12, 2012 Chair: Governance & Quota Reform 18
Incorporate basic vote into formula (5%)

ReferencesArvind Virmani “Global Economic Governance: IMF Quota Reform ” Arvind Virmani, Global Economic Governance: IMF Quota Reform, IMF Working Paper No WP/11/208, July 2011. http://www.imf.org/external/pubs/cat/longres.aspx?sk=25198.0[WpPp 1/2011 https://sites.google.com/site/drarvindvirmani/ ].[WpPp 1/2011 https://sites.google.com/site/drarvindvirmani/ ].Arvind Virmani & Michael D. Patra, “IMF Reforms Twenty‐ten: Do They Mirror Global Economic Realities?” Economic and Political Weekly, Vol XLVI, No. 30, July 23, 2011.Weekly, Vol XLVI, No. 30, July 23, 2011.Arvind Virmani, “IMF Governance and Quota Reform,” Working Paper WsWp2/2011, September 2011 [https://sites.google.com/site/drarvindvirmani/].[https://sites.google.com/site/drarvindvirmani/].“Economic Power as the Foundation of Global Power : The Evolution of Global Power Potential", Working paper No.WsWp 2/2012, May 2012. [ https://sites.google.com/site/drarvindvirmani/].[ https://sites.google.com/site/drarvindvirmani/].
August 22, 2014 @dravirmani 19