DPM flow pattern of LHD in underground mines with...
13
Corresponding author: [email protected] (R. Morla). Shahrood University of Technology Iranian Society of Mining Engineering (IRSME) Journal of Mining and Environment (JME) journal homepage: www.jme.shahroodut.ac.ir Vol. 10, No. 2, 2019, 315-326. DOI: 10.22044/jme.2019.7961.1666 DPM flow pattern of LHD in underground mines with different ventilation conditions R. Morla * , S. Karekal and A. Godbole School of Civil, Mining, and Environmental engineering, University of Wollongong, Australia Received 13 January 2019; received in revised form 15 February 2019; accepted 26 February 2019 Keywords Coal Mines DPM Diesel-Operated LHD CFD Simulation Abstract Diesel-operated Load Haul Dumper (LHD) vehicles are commonly used in underground coal mines. Despite their value as utility vehicles, the main drawback of these vehicles is that they generate diesel particulate matter (DPM), a known carcinogenic agent. In this work, an attempt is made to model DPM flows generated by LHDs in an underground coal mine environment for different DPM flow and intake air flow directions. The field experiments are conducted and used to validate the computational fluid dynamics (CFD) models and used to map the DPM flow patterns. The results obtained show that if DPM and the intake air co-flow (flow in the same direction), DPM is confined predominantly in the middle of the roadway. To the contrary, if the DPM and intake air counter-flow (flow in the opposite directions), the DPM spread occurs throughout the entire cross-section of the roadway. In the latter case, the operator will be more susceptible to exposure to high concentrations of DPM. Overall, the DPM concentration decreases with an increase in the intake air velocities. For co-flow for intake air velocities of 2 m/s, 3 m/s, and 4 m/s, the DPM concentrations at 50 m downstream of the vehicles are 39 µg/m 3 , 23 µg/m 3 , and 19 µg/ m 3 , respectively. The DPM concentration is also influenced by the DPM temperature at the source. For the DPM temperatures of 30 o C, 40 o C, 50 o C, and 60 o C, the DPM concentrations at 50 m downstream of the source are 43 µg/m 3 , 34 µg/m 3 , 12 µg/m 3 , and 9 µg/m 3 , respectively. 1. Introduction Diesel-operated LHD/Utility vehicles are commonly used in underground mines for loading and transportation of coal, ore, waste rock, and materials. These machines are efficient to reduce manpower, and improve productivity and safety. LHDs are generally operated at a speed of 20 to 30 km/h. The dimensions of an LHD are as follow: a length between 8 and 15 m, a width between 2.5 and 3.5 m, and a weight between 20 and 75 tons [1]. Each LHD consists of the front and back parts connected by articulated points. Each section of the unit has rubber wheels that are not steerable. Breaks, bucket, and steering are operated by the hydraulic system. These machines can operate by both the manual and the automatic systems. The primary concern with these vehicles is the generation of diesel particulate matter (DPM), causing adverse health effects on the operators after a prolonged exposure. DPM is a by-product of an incomplete combustion of fuel in a diesel engine. These particles have a solid core mainly consisting of elemental carbon (EC) that is surrounded by organic carbon (OC). These two are cumulatively known as the total carbon (TC) [2]. Various research works [3] have concluded that exposure to diesel exhausts can cause cancer in humans. As per Australian coal mine regulations, the maximum allowable 8-hour time-weighted average exposure to EC that is expelled from a diesel engine is 0.1 mg/m 3 [4-6].
Transcript of DPM flow pattern of LHD in underground mines with...

Corresponding author: [email protected] (R. Morla).
Shahrood
University of Technology
Iranian Society of Mining
Engineering (IRSME)
Journal of Mining and Environment (JME)
journal homepage: www.jme.shahroodut.ac.ir
Vol. 10, No. 2, 2019, 315-326. DOI: 10.22044/jme.2019.7961.1666
DPM flow pattern of LHD in underground mines with different ventilation
conditions
R. Morla*, S. Karekal and A. Godbole
School of Civil, Mining, and Environmental engineering, University of Wollongong, Australia
Received 13 January 2019; received in revised form 15 February 2019; accepted 26 February 2019
Keywords
Coal Mines
DPM
Diesel-Operated LHD
CFD Simulation
Abstract Diesel-operated Load Haul Dumper (LHD) vehicles are commonly used in underground coal mines. Despite their value as utility vehicles, the main drawback of these vehicles is that they generate diesel particulate matter (DPM), a known carcinogenic agent. In this work, an attempt is made to model DPM flows generated by LHDs in an underground coal mine environment for different DPM flow and intake air flow directions. The field experiments are conducted and used to validate the computational fluid dynamics (CFD) models and used to map the DPM flow patterns. The results obtained show that if DPM and the intake air co-flow (flow in the same direction), DPM is confined predominantly in the middle of the roadway. To the contrary, if the DPM and intake air counter-flow (flow in the opposite directions), the DPM spread occurs throughout the entire cross-section of the roadway. In the latter case, the operator will be more susceptible to exposure to high concentrations of DPM. Overall, the DPM concentration decreases with an increase in the intake air velocities. For co-flow for intake air velocities of 2 m/s, 3 m/s, and 4 m/s, the DPM concentrations at 50 m downstream of the vehicles are 39 µg/m3, 23 µg/m3, and 19 µg/ m3, respectively. The DPM concentration is also influenced by the DPM temperature at the source. For the DPM temperatures of 30 oC, 40 oC, 50 oC, and 60 oC, the DPM concentrations at 50 m downstream of the source are 43 µg/m3, 34 µg/m3, 12 µg/m3, and 9 µg/m3, respectively.
1. Introduction Diesel-operated LHD/Utility vehicles are commonly used in underground mines for loading and transportation of coal, ore, waste rock, and materials. These machines are efficient to reduce manpower, and improve productivity and safety. LHDs are generally operated at a speed of 20 to 30 km/h. The dimensions of an LHD are as follow: a length between 8 and 15 m, a width between 2.5 and 3.5 m, and a weight between 20 and 75 tons [1]. Each LHD consists of the front and back parts connected by articulated points. Each section of the unit has rubber wheels that are not steerable. Breaks, bucket, and steering are operated by the hydraulic system. These machines can operate by both the manual and the automatic systems.
The primary concern with these vehicles is the generation of diesel particulate matter (DPM), causing adverse health effects on the operators after a prolonged exposure. DPM is a by-product of an incomplete combustion of fuel in a diesel engine. These particles have a solid core mainly consisting of elemental carbon (EC) that is surrounded by organic carbon (OC). These two are cumulatively known as the total carbon (TC) [2]. Various research works [3] have concluded that exposure to diesel exhausts can cause cancer in humans. As per Australian coal mine regulations, the maximum allowable 8-hour time-weighted average exposure to EC that is expelled from a diesel engine is 0.1 mg/m3 [4-6].

Morla et al./ Journal of Mining & Environment, Vol. 10, No. 2, 2019
316
To limit the DPM exposure to safe levels for the mine personnel, and to design effective DPM control strategies, comprehensive mapping of DPM near LHD is required for different flow conditions. This paper outlines a study of the DPM flow patterns near a diesel-powered LHD using computational fluid dynamics (CFD) simulations validated against the field experimental data. The field experiments were conducted in two stages using an Airtec real-time DPM monitoring instrument. In stage 1, the DPM concentration was monitored when the DPM and air intake flew in the same direction. In stage 2, the DPM and intake air flew in the opposite directions. For each stage, CFD simulation studies were carried out with different intake air velocities and DPM temperatures.
2. Materials and methods 2.1. Details of experimental mine and field experiment To study the DPM flow pattern generated by LHD/Loader/Utility vehicles, field experiments were conducted in one of the coal mines of Coal India Limited. The mine has two ‘depillaring’ panels with continuous miners, one longwall panel, and a few development sections. The mine has five intake airways and two return air shafts, and the ventilation system of the mine is operated by two axial flow fans. To ensure that there was no DPM in the intake air, the field experiments
were conducted in an isolated intake airway. The air flow was controlled by a regulator located at the return side of the airway. A calibrated Airtec real-time DPM monitor was used for this field study. During the experiments, the flow rate of the instrument was adjusted to 2.83 × 10⁻⁵ m3/s (1.7 L per min). In this work, EC was considered as a DPM. In stage 1 of the experiments, the DPM source was placed such that the ventilation (intake) air and the DPM-laden ‘smoke’ flew in the same direction. In stage 2, the ventilation air and LHD smoke flew in the opposite directions. In these field studies, the test vehicle was a 150 kW LHD equipped with DPM filters and run in a ‘no-load’ condition.
2.2. Stage 1: DPM and ventilation air flow in same direction In stage I, the experimental arrangement is such that the LHD exhaust smoke and the intake air flow in the same direction (co-flow), as shown in Figure 1. The DPM samples were collected downstream of LHD. Three sampling stations located at 2 m, 5 m, and 10 m from the vehicle were selected. Figure 1 shows the location of LHD and sampling stations. Each station had nine sampling points arranged in three rows (top, center, and bottom) and three columns (left, middle, and right). Figure 2 shows the location of sampling points in mine gallery.
Figure 1. Experiment stage 1: location of sampling stations and sampling points.
Figure 2. Details of sampling points in an experimental gallery.
TL TM TR
CL CM CR
BL BM BR DPM sampling point
Experimental gallery
0.6 m
1.2 m
2.0 m
1.5 m 1.5 m 1.5 m 1.5 m
2 m 5 m 10 m
Air flow direction DPM direction
Sampling station Sampling point Vehicle exhaust part

Morla et al./ Journal of Mining & Environment, Vol. 10, No. 2, 2019
317
2.3. Stage 2: DPM and ventilation air flow in opposite directions In the stage 2 experiments, the LHD exhaust is arranged such that the smoke is directed opposite to the ventilation air flow. The DPM samples were collected downstream side of the LHD. In this case, the DPM samples were collected around LHD, and also at 6 m, 10 m, and 20 m
downstream of LHD at a height of 1.2 m from the floor. Figure 3 shows the location and details of the sampling points. Three samples were collected at the 6 m sample station, and one sample was collected at the middle of the roadway at the 10 m and 20 m sample stations. During this experiment, the air flow in the experimental gallery was 32.4 m3/s.
Figure 3. Stage 2: location of sampling stations and sampling points; top view.
2.4. CFD modelling Numerical modelling studies with CFD have been used in the mining industry to solve various critical ventilation issues. Morla et al. (2013 and 2014) [7, 8] have used CFD to study inertisastion options to control the spontaneous combustion of coal for blasting gallery panels. Balusu (1993) [9] has conducted CFD modelling to design dust scrubber. Tanguturi and Balusu (2014) [10] used CFD modelling investigations to control methane flow and distribution in the back side of the supports near the tail gate. Tanguturi and Balusu (2015) [11] used the CFD modelling simulation studies to understand the longwall goaf gas flow strategies. Hua et al. (2012) [12] investigated methane distribution flow pattern from adjacent coal seams of a longwall panel into the goaf with CFD. Ting (2005) [13] used CFD modelling simulations to simulate the longwall goaf gas flow behavior with respect to panel orientation, location of inertisation injection points, and location of goaf drainage holes. Ting and Wang (2013) [14] used the CFD modelling investigations with different air velocity flow rates at longwall face to simulate the gas and respirable dust particles. Morla et al. (2017 and 2018) [15, 16] carried out basic CFD simulations of DPM flows generated by diesel-operated man-riding vehicles in coal mines. Similar CFD modelling studies have been
conducted for metal mines for 30 kW stir skid loader (Zheng et al., 2011a, 2011b, Zheng et al., 2015a, 2015b) [17-20]. In the present work, we presented simulations of DPM generated by a diesel-operated LHD/Loader/Utility vehicle in a coal mine. The commercially available CFD package ANSYS Fluent (version 19.1) was used. The CFD simulations were carried out in the sequence of steps outlined in the following paragraphs.
2.4.1. Construction of computational domain and mesh The computational domain is a 70 m long tunnel with a rectangular cross-section (width of 6 m, height of 2.7 m). A CAD model of an LHD vehicle was designed and imported into the computational domain. The location of the exhaust was at the rear end of LHD. The exhaust flow was a mixture of DPM and air. Figure 4 (a) shows the CAD model representing the vehicle, and Figure 4 (b) shows the experimental gallery with LHD. Figure 5 (a) shows the mesh generated for the complex surfaces of the vehicle, and (b) shows the details of the computational domain and mesh made up of about half-million computational cells. Finer cells were used to capture the details of the flow in regions such as small gaps and adjacent to solid surfaces.
10 m 6 m
10 m
a c e
b d f
g
h
i j k Air flow direction
DPM flow direction
LHD exhaust part

Morla et al./ Journal of Mining & Environment, Vol. 10, No. 2, 2019
318
Figure 4. CFD model of man riding vehicle and experimental gallery.
Figure 5. (a) Meshed LHD, (b) Meshed gallery with LHD. 2.4.2. Setting up flow conditions The boundary conditions of the model were considered as the intake air velocity of 2 m/s and the 300 K temperature. The velocity of DPM was considered as 2 m/s at 323 K. DPM was considered as a pseudo-gas, and chemical reactions and collisions were not considered. The Boussinesq approximation was invoked to simulate the buoyancy effects and the standard k- model to simulate the turbulence.
2.4.3. Governing equations Air flow in the tunnel was treated as a turbulent flow. To model turbulence, the Reynolds-Averaged Navier-Stokes equation was used. In Reynolds averaging, the solution variables in the exact Navier-Stokes equations consist of time-averaged and fluctuated components for velocity components [21].
' i i iu ū u
where ūi and 'iu are the mean and fluctuating velocity components (i = 1, 2, 3). The Reynolds-averaged Navier-Stokes (RANS) equation was obtained by substituting time and average velocity in the momentum equation:
0
ii
ut x (2)
, ,
2 3
i i jj
ji lij
i j j i l
i jj
u u ux x
uu upx x x x x
u ux
(3)
where , , i ju u is the Reynolds stress, which can be solved using the Boussinesq hypothesis and Reynolds stress models (RSMs). In the Boussinesq hypothesis, the Reynolds stress is related to the mean velocity gradient [21]:
, , 2
3
ji ki j t t ij
j i k
uu uu u k
x x x (4)
To determine the turbulent viscosity, t , the k- model was used.
2
tkC
(5)
where C is a constant, k is the turbulence kinetic energy, and is the dissipation rate of k. The turbulent heat transport is modelled using the concept of Reynolds analogy to turbulent
a. LHD–CAD model.
Smoke pipe
b. Experimental gallery with LHD.
LHD
a. Surface mesh of LHD b. Surface mesh of LHD & gallery
Morla et al./ Journal of Mining & Environment, Vol. 10, No. 2, 2019
319
momentum transfer. The modelled energy equation is as follows:
ii
p ti ij heff
j k j
E u E pt x
c Tk u Sx x
(6)
where k is the thermal conductivity, E is the total energy, and ij eff
is the deviatoric stress tensor,
defined as:
2 3
j i kij eff eff ijeff
i j k
u u ux x x
(7)
The standard k-ε model is based on the model transport equations k and ε. The model transport equation for k was derived from the exact equation, while the model transport equation for ε was obtained using physical reasoning, and bears little resemblance to its mathematically exact counterpart. In the derivation of the k-ε model, the assumption is that the flow is fully turbulent, and the effect of molecular viscosity is negligible. As the mine air is considered as fully turbulent flow, the k-ε model is valid for mine air. The turbulent kinetic energy, k, and its rate of dissipation, ε, are obtained from the following governing equations [21]:
ii
t
j k j
k b M k
k kut x
kx x
G G Y S
(8)
2
1 3 2
ii
t
j j
k b
ut x
x x
C G C G C SK K
(9)
where bG is the generation of turbulent kinetic energy due to buoyancy, and kG is the production of turbulent kinetic energy due to the mean velocity gradient. To conduct the DPM investigations in a mine gallery, a ‘species transport model’ was used. ANSYS fluent predicts the local mass fraction of each species, Yi, though the solution of a convection-diffusion equation for the ith species. The conservation equation takes the following general form:
Δ Δ
i i i i iY vY J R S
t (10)
3. Results and discussions CFD simulations and field experiments 3.1. Stage 1: DPM and ventilation air flow in same direction (co-flow) Figure 6 shows the results of the CFD simulations in isometric view when DPM and air flow are in the same direction (co-flow). A high DPM concentration is observed in the middle of the gallery. At 50 m downstream of the vehicle, the DPM particles are seen to spread over most of the middle gallery. Figure 7 shows the contours of the DPM concentration at 2 m, 5 m, and 10 m downstream of the vehicle. In Figure 7 (a), a high DPM concentration is observed in the middle of the roadway. Figure 7 (b) shows the maximum concentration in the middle of the gallery, and a negligible concentration can be observed at the left and right sides of the roadways. Figure 7 (c) shows that the DPM flow move towards the roof of the roadway; DPM concentration at the center of the roadway is 70 µg/m3, and low concentrations are observed at the left and right sides of the roadway. Table 1 compares the field measurements with the CFD simulation results of the DPM concentration at the three sampling stations downstream of the vehicle. It can be observed that the simulated results are in a fair agreement with the measured data in most cases. Some discrepancies between the simulated and the measured results can be due to the unevenness in the gallery wall surfaces that were not considered while modelling. Overall, the difference varies from -17% to +21%.

Morla et al./ Journal of Mining & Environment, Vol. 10, No. 2, 2019
320
Figure 6. DPM flow pattern for co-flow-isometric view.
Figure 7. EC concentration at 2 m, 5 m, and 10 m downstream of the vehicle.
Table 1. Comparison between the simulated results (SR, µg/m3) and the experimental results (ER, µg/m3). At sample station 2 m (µg/m3)
Top row Middle row Bottom row Sample point ER SR Difference, % ER SR Difference, % ER SR Difference, %
L 62 65 4 M 127 125 -1 96 95 -1 97 110 +13 R 64 65 1 32 30 -6
At sample station 5 m (µg/m3) L 64 70 9 32 35 9 M 33 37 10 95 102 7 64 55 -14 R 31 32 3 32 37 21 32 28 -12
At sample station 10 m (µg/m3) L 64 65 1 M 61 52 -17 95 85 -10 64 58 -9 R 65 60 -7
a. DPM concentration at 2 m downstream of the vehicle.
b. DPM concentration at 5 m downstream of the vehicle.
c. DPM concentration at 10 m downstream of the vehicle.
DPM concentration (g/m3)
DPM Concentration (g/m3)

Morla et al./ Journal of Mining & Environment, Vol. 10, No. 2, 2019
321
3.2. Stage 2: DPM and ventilation air flow in opposite directions (counter-flow) Figure 8 shows the results of the CFD simulations in isometric view when DPM and air flow are in the opposite directions (counter-flow). Near LHD, a high DPM concertation can be observed in the middle of the gallery and above LHD. At the downstream side of LHD, the DPM particles spread throughout the gallery with the maximum concentration in the middle and at the sides of the gallery. Figure 9 shows the DPM concentration at 2 m, 5 m, and 8 m downstream of the vehicle rear end. Figure 9 (a) shows a high DPM concentration near the top and bottom portions of the vehicle. Figure 9 (b) shows the maximum concentration at the top and bottom portions of the vehicle; the concentrations also spread at the left and right sides of the roadways. The DPM concentration at the LHD operator is 125 µg/m3. Figure 9 (c) shows the DPM flow moving towards the roof and bottom of the roadway, and the DPM concentration spreads towards the left and right sides of the roadway.
Figure 10 shows the DPM concentration field at 6 m, 10 m, and 20 m downstream of the vehicle. Figure 10 (a) shows the DPM concentration at 6 m downstream of the vehicle. Here, a high DPM concentration is observed near the floor of the roadway, and the concentration gradually reduces towards the roof. Figure 10 (b) shows the DPM concentration field at 10 m downstream of the vehicle. Here, the maximum concentration is at middle of the gallery and the left and right sides of the roadways. Figure 10 (c) shows the DPM concertation field at 20 m downstream of the vehicle. Here, DPM was found to spread throughout the entire roadway. The DPM concentration at the center of the roadway was 34 µg/m3, and similar concentrations were observed at the left and right sides of the roadway. Table 2 shows the compared field and simulation DPM concentration results at the downstream side of the vehicle at different sampling points. In this table, it could be observed that the simulated results were in a fair agreement with the measured data; the difference varies between -21% and +21%.
Table 2. Comparison between the simulated results (SR in µg/m3) and the experimental results (ER in µg/m3).
Sample point ER SR Difference, % 2 m to source (a) - 125 - 2 m to source (b) 70 55 -21 5 m to source (c) 56 60 7 5 m to source (d) 55 43 -21 8 m to source (e) 42 35 -16 8 m to source (f) 27 27 0 6 m to vehicle (g) 14 17 21 6 m to vehicle (h) 42 48 14 6 m to vehicle (i) 26 25 -3 10 m to vehicle (j) 42 48 14 20 m to vehicle (k) 28 34 21
Figure 8. DPM flow pattern-isometric view.
DPM concentration (g/m3)

Morla et al./ Journal of Mining & Environment, Vol. 10, No. 2, 2019
322
Figure 9. DPM concentration at 2 m, 5 m, and 10 m downstream of the smoke pipe.
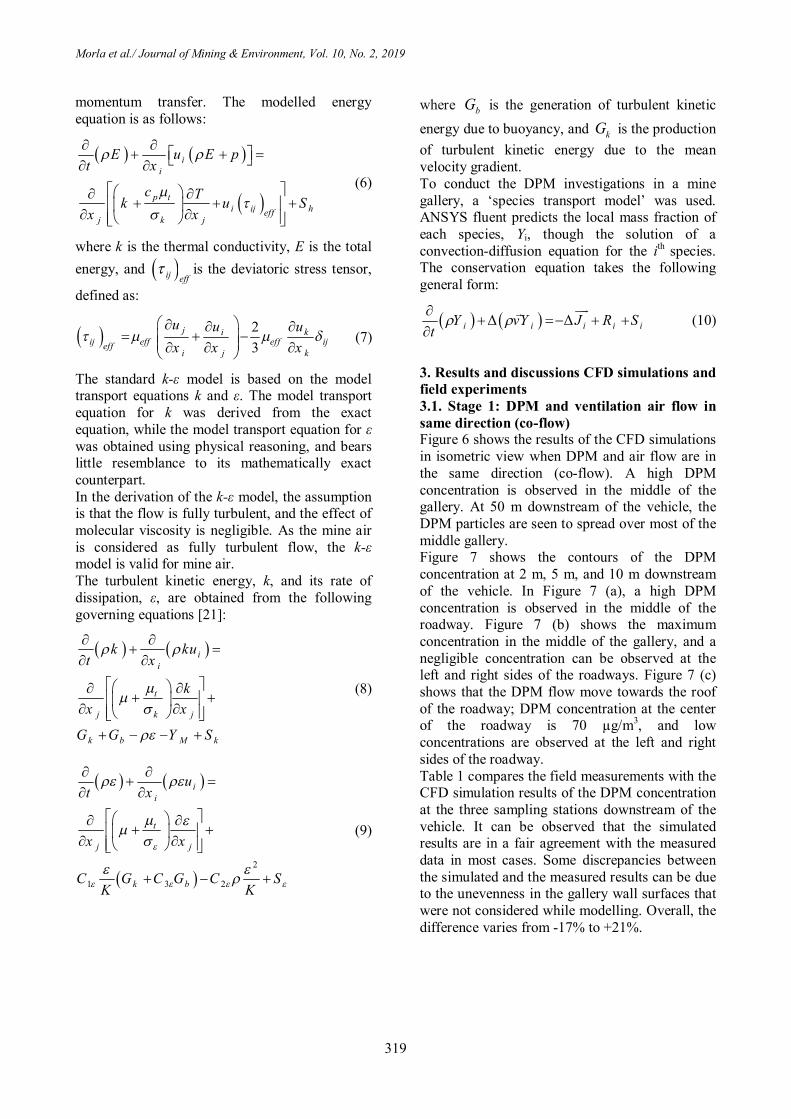
Figure 10. EC concentration at 2 m, 5 m, and 10 m downstream of the vehicle. 3.3. Changes of DPM concentration with intake air velocities The DPM concentration at the downstream side of the vehicle may change with intake air velocities. To study this, the simulation studies were conducted with 1 m/s, 2 m/s, 3 m/s, and 4 m/s air velocities for both PDM and intake in the same direction case (co-flow). Figures 11 and 12 show the DPM concentration patterns for different
intake air velocities. At a low air velocity (1 m/s), the high DPM concentration of 600 µg/m3 was observed at a distance of 1 m from the source. The DPM concentration was reduced with increase in the ventilation air velocity. With a ventilation air velocity of 1 m/s, at 10 m downstream to the source, most of the DPM was seen to move towards the roadway walls so that the concentration at the middle of the roadway was
a. DPM concentration at 2 m downstream of the smoke pipe.
b. DPM concentration at 5m downstream of the smoke pipe
c. DPM concentration at 8 m downstream of the smoke pipe.
DPM concentration (g/m3)
a b
c d
e f
a. DPM concentration at 6 m downstream of the vehicle.
b. DPM concentration at 10 m downstream of the vehicle.
c. DPM concentration at 20 m downstream of the vehicle.
DPM concentration (g/m3) h g i
j
k
Morla et al./ Journal of Mining & Environment, Vol. 10, No. 2, 2019
323
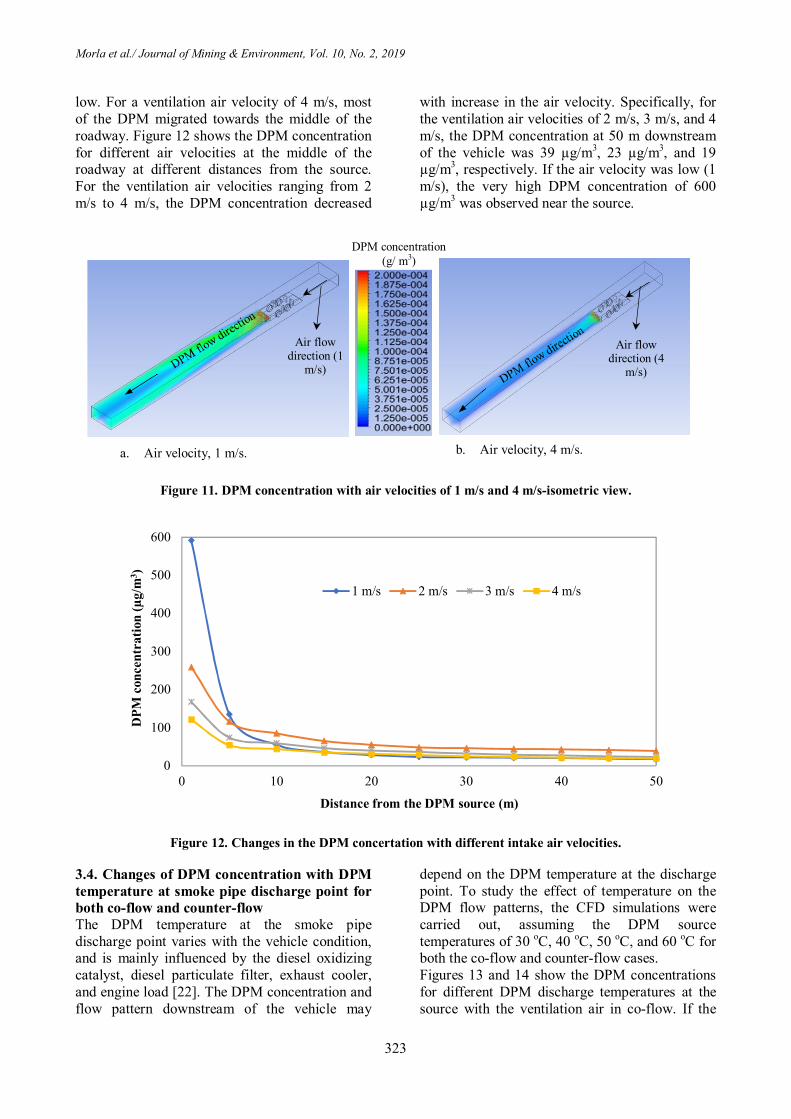
low. For a ventilation air velocity of 4 m/s, most of the DPM migrated towards the middle of the roadway. Figure 12 shows the DPM concentration for different air velocities at the middle of the roadway at different distances from the source. For the ventilation air velocities ranging from 2 m/s to 4 m/s, the DPM concentration decreased
with increase in the air velocity. Specifically, for the ventilation air velocities of 2 m/s, 3 m/s, and 4 m/s, the DPM concentration at 50 m downstream of the vehicle was 39 µg/m3, 23 µg/m3, and 19 µg/m3, respectively. If the air velocity was low (1 m/s), the very high DPM concentration of 600 µg/m3 was observed near the source.
Figure 11. DPM concentration with air velocities of 1 m/s and 4 m/s-isometric view.
Figure 12. Changes in the DPM concertation with different intake air velocities.
3.4. Changes of DPM concentration with DPM temperature at smoke pipe discharge point for both co-flow and counter-flow The DPM temperature at the smoke pipe discharge point varies with the vehicle condition, and is mainly influenced by the diesel oxidizing catalyst, diesel particulate filter, exhaust cooler, and engine load [22]. The DPM concentration and flow pattern downstream of the vehicle may
depend on the DPM temperature at the discharge point. To study the effect of temperature on the DPM flow patterns, the CFD simulations were carried out, assuming the DPM source temperatures of 30 oC, 40 oC, 50 oC, and 60 oC for both the co-flow and counter-flow cases. Figures 13 and 14 show the DPM concentrations for different DPM discharge temperatures at the source with the ventilation air in co-flow. If the
0
100
200
300
400
500
600
0 10 20 30 40 50
1 m/s 2 m/s 3 m/s 4 m/s
DPM
con
cent
ratio
n (µ
g/m
3 )
Distance from the DPM source (m)
a. Air velocity, 1 m/s. b. Air velocity, 4 m/s.
DPM concentration (g/ m3)
Air flow direction (4
m/s)
Air flow direction (1
m/s)

Morla et al./ Journal of Mining & Environment, Vol. 10, No. 2, 2019
324
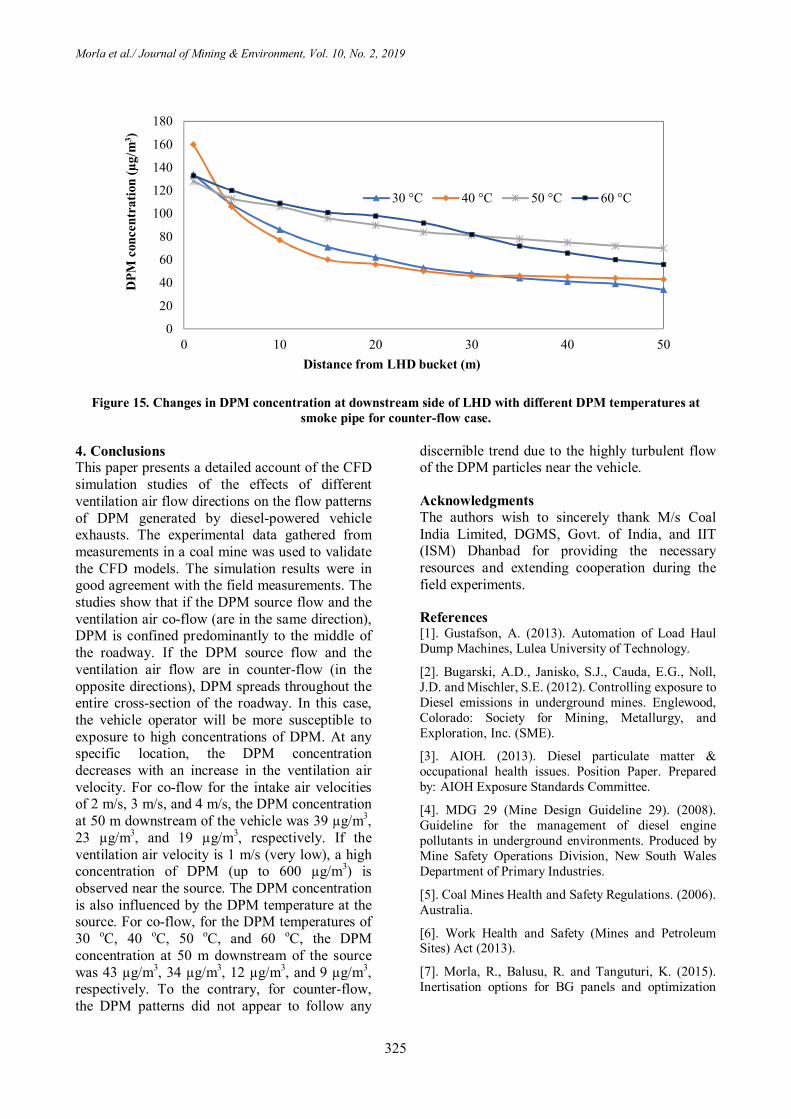
temperature was high, DPM was found to disperse throughout the entire roadway. For the DPM source temperatures of 30 oC, 40 oC, 50 oC, and 60 oC, the DPM concentration at 50 m downstream to the source, middle of the roadway, and at 1.2 m height was 43 µg/m3, 39 µg/m3, 12 µg/m3, and 9
µg/m3, respectively. Figure 15 shows the DPM flow pattern with the source DPM and ventilation air in counter-flow. In this case, the DPM dispersion does not appear to follow any particular trend due to the highly turbulent flow of the DPM particles near LHD.
Figure 13. DPM concentration with 30 oC and 60 oC of DPM temperatures at discharge point, ISO view for a co-
flow case.
Figure 14. Changes in the DPM concentration at downstream side of LHD with different DPM temperatures at
smoke pipe for co-flow case.
0
50
100
150
200
250
300
0 10 20 30 40 50
30 °C 40 °C 50 °C 60 °C
DPM
con
cent
ratio
n (µ
g/m
3 )
Distance from DPM source (m)
a. DPM discharge temperature 30 oC b. DPM discharge temperature 60 oC
DPM concentration (g/ m3)
Air flow direction
Air flow direction
Morla et al./ Journal of Mining & Environment, Vol. 10, No. 2, 2019
325
Figure 15. Changes in DPM concentration at downstream side of LHD with different DPM temperatures at
smoke pipe for counter-flow case. 4. Conclusions This paper presents a detailed account of the CFD simulation studies of the effects of different ventilation air flow directions on the flow patterns of DPM generated by diesel-powered vehicle exhausts. The experimental data gathered from measurements in a coal mine was used to validate the CFD models. The simulation results were in good agreement with the field measurements. The studies show that if the DPM source flow and the ventilation air co-flow (are in the same direction), DPM is confined predominantly to the middle of the roadway. If the DPM source flow and the ventilation air flow are in counter-flow (in the opposite directions), DPM spreads throughout the entire cross-section of the roadway. In this case, the vehicle operator will be more susceptible to exposure to high concentrations of DPM. At any specific location, the DPM concentration decreases with an increase in the ventilation air velocity. For co-flow for the intake air velocities of 2 m/s, 3 m/s, and 4 m/s, the DPM concentration at 50 m downstream of the vehicle was 39 µg/m3, 23 µg/m3, and 19 µg/m3, respectively. If the ventilation air velocity is 1 m/s (very low), a high concentration of DPM (up to 600 µg/m3) is observed near the source. The DPM concentration is also influenced by the DPM temperature at the source. For co-flow, for the DPM temperatures of 30 oC, 40 oC, 50 oC, and 60 oC, the DPM concentration at 50 m downstream of the source was 43 µg/m3, 34 µg/m3, 12 µg/m3, and 9 µg/m3, respectively. To the contrary, for counter-flow, the DPM patterns did not appear to follow any
discernible trend due to the highly turbulent flow of the DPM particles near the vehicle.
Acknowledgments The authors wish to sincerely thank M/s Coal India Limited, DGMS, Govt. of India, and IIT (ISM) Dhanbad for providing the necessary resources and extending cooperation during the field experiments.
References [1]. Gustafson, A. (2013). Automation of Load Haul Dump Machines, Lulea University of Technology.
[2]. Bugarski, A.D., Janisko, S.J., Cauda, E.G., Noll, J.D. and Mischler, S.E. (2012). Controlling exposure to Diesel emissions in underground mines. Englewood, Colorado: Society for Mining, Metallurgy, and Exploration, Inc. (SME).
[3]. AIOH. (2013). Diesel particulate matter & occupational health issues. Position Paper. Prepared by: AIOH Exposure Standards Committee.
[4]. MDG 29 (Mine Design Guideline 29). (2008). Guideline for the management of diesel engine pollutants in underground environments. Produced by Mine Safety Operations Division, New South Wales Department of Primary Industries.
[5]. Coal Mines Health and Safety Regulations. (2006). Australia.
[6]. Work Health and Safety (Mines and Petroleum Sites) Act (2013).
[7]. Morla, R., Balusu, R. and Tanguturi, K. (2015). Inertisation options for BG panels and optimization
0
20
40
60
80
100
120
140
160
180
0 10 20 30 40 50
30 °C 40 °C 50 °C 60 °C
DPM
con
cent
ratio
n (µ
g/m
3 )
Distance from LHD bucket (m)

Morla et al./ Journal of Mining & Environment, Vol. 10, No. 2, 2019
326
using CFD modelling. The International Journal of Mining Science and Technology. 25 (3): 401-405.
[8]. Morla, R., Balusu, R. and Tanguturi, K. (2013). Prediction and control of spontaneous combustion in thick coal seams, 13th coal operators conference, university of Wollongong. pp. 232-239.
[9]. Balusu, R. (1993). Ph.D. Thesis, University of Wollongong.
[10]. Tanguturi, K. and Balusu, R. (2014). CFD modelling of methane gas distribution and control strategies in a gassy coal mine. Journal of computational multiphase flows. 6 (1): 65-78.
[11]. Tanguturi, K. and Balusu, R. (2015). Fundamental understanding of goaf gas displacement in longwall goaf. Journal of mining and environment. 6 (2): 191-203.
[12]. Hua, G., Johnny, Q. and Qingdong, Q. (2012). CFD investigation of goaf flow of methane released from unmined adjacent coal seams. 9th international conference on CFD in the minerals and process industries, CSIRO.
[13]. Ting, R. (2005). CFD modelling of goaf gas monitoring to improve he control of spontaneous combustion in longwalls. Coal operators conference, University of Wollongong. pp. 259-264.
[14]. Ting, R. and Wang, Z. (2013). Computational fluid dynamics of respirable dust and gas behaviour on a longwall face. Australian mine ventilation conference. pp. 191-200.
[15]. Morla, R. and Karekal, S. (2017). Diesel Particulate Matter Investigations in Underground Coal
Mines. International Journal of Engineering and Technology. 9 (4): 2698-2703.
[16]. Morla, R., Godbole, A., Karekal, S., Bhattchargee, R. and Nasin, B. (2018). Fundamental understanding of diesel-operated man riding vehicle DPM dispersion- A case study. Journal of Sustainable Mining. 17 (3): 105-110.
[17]. Zheng Y. (2011). Diesel particulate matter dispersion analysis in underground metal/ non-metal mines using CFD. Ph.D. Thesis, Missouri University of Science and Technology.
[18]. Zheng, Y., Lan, H., Magesh, T. and Tien, J.C. (2011). DPM dispersion experiment at MST’s experimental mine and comparison with CFD simulation. Journal of Coal Science and Engineering. 17 (3): 285-289.
[19]. Zheng, Y., Magesh, T., Lan, H. and Ten, C.J. (2015). Effect of auxiliary ventilations on diesel particulate matter dispersion inside a dead-end entry. International Journal of Mining Science and Technology. 25 (6): 927-932.
[20]. Zheng, Y., Magesh, T., Lan, H. and Tien, C.J. (2015). Simulation of DPM distribution in a long single entry with buoyancy effect. International Journal of Mining Science and Technology. 25 (1): 47-52.
[21]. ANSYS. (2013). ANSYS fluent theory guide. Canonsburg, PA: ANSYS, Inc.
[22]. Gonzales, H.R. (2008). Diesel exhaust emission system temperature test. U.S. Department of Agriculture Forest Service.
Morla 1398دوره دهم، شماره دوم، سال زیست، پژوهشی معدن و محیط - / نشریه علمیو همکاران
شرایط تهویه در معادن زیرزمینی با (LHD)ماشین بارگیري و باربري )DPM( دیزلی معلق ذراتالگوي جریان متفاوت
R. Morla*, S. Karekal and A. Godbole
School of Civil, Mining, and Environmental engineering, University of Wollongong, Australia
26/2/2019، پذیرش 13/1/2019ارسال
[email protected]* نویسنده مسئول مکاتبات:
چکیده:
هـا تولیـد اصلی آن مشکلآالت، منافع این ماشین رغم علی. شوند میزیرزمینی استفاده سنگ زغالدر معادن معموالً ،LHDآالت بارگیري و باربري دیزلی ماشیندر محیط ها LHDتولید شده توسط DPM هاي جریانمدل زا است. در این پژوهش تالش براي ساخت ) به عنوان یک عامل سرطانDPMذرات معلق دیزلی (
هاي میدانی انجام شد و براي انجام شده است. آزمایشهواي ورودي متفاوت هاي جریانو جهت DPM هاي متفاوتزیرزمینی براي جریان سنگ زغالیک معدن استفاده شد. نتایج به دست آمده نشان داد که اگر ) CFDسازي دینامیک سیاالت محاسباتی (هاي شبیهاز مدل DPMي الگوي جریان اعتبارسنجی و تهیه نقشه
جریـان باشند، جهت هم ریغ هواي وروديو DPMجریان . در مقابل اگر محدود خواهد شد عمدتاً DPM، جریان جهت باشندهم هواي وروديو DPMجریان DPM اپراتور بیشتر در معرض غلظت بااليخواهد یافت و گسترش DPM به طور کلی، غلظت .ردیگ یمقرار DPM کـاهش وروديبا افزایش سـرعت هـواي
میکروگـرم بـر 39ماشـین از دست نییپامتري 50در DPMغلظت ،متر بر ثانیه 4و 3، 2از وروديهواي هايسرعتجهت، براي هاي همبراي جریان .ابدی یمــب ــه مترمکع ــب ب ــه ترتی ــر 19و 23ب ــرم ب ــبمیکروگ ــی مترمکع ــاهش م ــد. ک ــتیاب ــاي DPM غلظ ــأثیر دم ــت ت ــز تح ــرار DPM نی ــع ق در منب
میکروگرم بر 9و 12، 34، 43به ترتیب برابر منبع دست نییپامتري 50در DPMغلظت گراد، درجه سانتی 60و 50، 40، 30از DPMبراي دماهاي .ردیگ یم .یابدکاهش می مترمکعب
.)CFDسازي دینامیک سیاالت محاسباتی (شبیه دیزلی، LHDماشین بارگیري و باربري ،)DPM( دیزلی معلق سنگ، ذراتمعادن زغال کلمات کلیدي:


![Application of simulated annealing for optimization …jme.shahroodut.ac.ir/article_1514_de0bbc30f91b5467efd...in open-pit mines [36]. Yari et al. developed an evaluation system for](https://static.fdocuments.us/doc/165x107/5ea12f31d3cc932f5174f79b/application-of-simulated-annealing-for-optimization-jme-in-open-pit-mines-36.jpg)