Dplyr and Plyr
37
PLYR & DPLYR Mathew Hall
-
Upload
paul-richards -
Category
Software
-
view
1.046 -
download
0
Transcript of Dplyr and Plyr

PLYR & DPLYRMathew Hall

PLYR: LOADING DATAmyDT <- data.frame( number=1:3, letter=c('a','b','c') )myDT
## number letter## 1 1 a## 2 2 b## 3 3 c

PLYR: LOADING DATA
D <- read.csv("TB_burden_countries_2014-11-16.csv")head(names(D))
## [1] "country" "iso2" "iso3" "iso_numeric" "g_whoregion"## [6] "year"

PLYR: FILTERING
mean(D[D$country=='Afghanistan','e_prev_100k'])
## [1] 376.4

PLYR: FILTERING
with(D, mean(e_prev_100k[country=='Afghanistan']))
## [1] 376.4

PLYR: SELECTING COLUMNS
head(D[,c('e_prev_100k','e_prev_100k_lo', 'e_prev_100k_hi')])
## e_prev_100k e_prev_100k_lo e_prev_100k_hi## 1 306 156 506## 2 343 178 562## 3 371 189 614## 4 392 194 657## 5 410 198 697## 6 424 199 733

PLYR: SUMMARISINGddply(D, .(country), summarise, mid=mean(e_prev_100k))
## country mid## 1 Afghanistan 376.42## 2 Albania 29.33## 3 Algeria 124.38## 4 American Samoa 14.57## 5 Andorra 29.92## 6 Angola 388.58

PLYR: SUMMARISINGddply(D, .(country, year > 2000), summarise, lo=mean(e_prev_100k_lo), hi=mean(e_prev_100k_hi))## country year > 2000 lo hi## 1 Afghanistan FALSE 193.45 695.00## 2 Afghanistan TRUE 181.92 576.23## 3 Albania FALSE 15.18 60.27## 4 Albania TRUE 11.11 45.38## 5 Algeria FALSE 57.00 184.36## 6 Algeria TRUE 69.23 223.15

PLYR: SORTING
plot(arrange(D, e_prev_100k)$e_prev_100k)

PLYR: ADDING COLUMS
mutate(D, country_t = paste0(country,year))
## country iso2 iso3 iso_numeric g_whoregion year e_pop_num e_prev_100k## 1 Afghanistan AF AFG 4 EMR 1990 11731193 306## 2 Afghanistan AF AFG 4 EMR 1991 12612043 343## 3 Afghanistan AF AFG 4 EMR 1992 13811876 371## 4 Afghanistan AF AFG 4 EMR 1993 15175325 392## 5 Afghanistan AF AFG 4 EMR 1994 16485018 410## 6 Afghanistan AF AFG 4 EMR 1995 17586073 424…## e_inc_tbhiv_num_hi source_tbhiv c_cdr c_cdr_lo c_cdr_hi country_t## 1 16 NA 20 15 24 Afghanistan1990## 2 20 NA 96 80 110 Afghanistan1991## 3 24 NA NA NA NA Afghanistan1992## 4 31 NA NA NA NA Afghanistan1993## 5 39 NA NA NA NA Afghanistan1994## 6 47 NA NA NA NA Afghanistan1995

PLYR: ADDING COLUMS
ddply(D,.(),transform, country_t = paste0(country,year))
## country iso2 iso3 iso_numeric g_whoregion year e_pop_num e_prev_100k## 1 Afghanistan AF AFG 4 EMR 1990 11731193 306## 2 Afghanistan AF AFG 4 EMR 1991 12612043 343## 3 Afghanistan AF AFG 4 EMR 1992 13811876 371## 4 Afghanistan AF AFG 4 EMR 1993 15175325 392## 5 Afghanistan AF AFG 4 EMR 1994 16485018 410## 6 Afghanistan AF AFG 4 EMR 1995 17586073 424…## e_inc_tbhiv_num_hi source_tbhiv c_cdr c_cdr_lo c_cdr_hi country_t## 1 16 NA 20 15 24 Afghanistan1990## 2 20 NA 96 80 110 Afghanistan1991## 3 24 NA NA NA NA Afghanistan1992## 4 31 NA NA NA NA Afghanistan1993## 5 39 NA NA NA NA Afghanistan1994## 6 47 NA NA NA NA Afghanistan1995

DPLYR
split
apply
combine
summarise
mutate
Take a data frame, compute summaries, produce a new data frame

PIPES
data
group by country
create column: incidence/population
summarise: mean rate

summarise: mean rate
WITHOUT PIPES
data
group by country
create column: incidence/population
data
data$rate <- incidence/population
summarise(group_by(data,country),mean.rate=mean(rate))

summarise: mean rate
PIPES
data
group by country
create column: incidence/population
data
data$rate <- incidence/population
data %>% group_by(country) %>% summarise(mean.rate=mean(rate))

summarise: mean rate
PIPES
group by country
create column: incidence/population
data
data %>% mutate(rate = incidence/population) %>% group_by(country) %>% summarise(mean.rate=mean(rate))

PIPES
@romain_francois

DPLYR: LOAD
D <- read.csv("TB_burden_countries_2014-11-16.csv")D <- tbl_df(D)

DPLYR: LOAD
D <- read.csv("TB_burden_countries_2014-11-16.csv")D <- tbl_df(D)

DPLYR: SELECTING
D %>% select(e_prev_100k,e_prev_100k_lo,e_prev_100k_hi)
## Source: local data frame [5,120 x 3]## ## e_prev_100k e_prev_100k_lo e_prev_100k_hi## 1 306 156 506## 2 343 178 562## 3 371 189 614## 4 392 194 657## 5 410 198 697## 6 424 199 733## 7 438 202 764## 8 448 203 788## 9 454 204 800## 10 446 203 782## .. ... ... ...

DPLYR: FILTER & SUMMARISED %>% filter(country == 'Afghanistan') %>% summarise( mid=mean(e_prev_100k), lo=mean(e_prev_100k_lo), hi=mean(e_prev_100k_hi) )
## Source: local data frame [1 x 3]## ## mid lo hi## 1 376.4 187.2 630.7

DPLYR: FILTER & SUMMARISE
D %>% group_by(country) %>% summarise(mid=mean(e_prev_100k))
## Source: local data frame [219 x 2]## ## country mid## 1 Afghanistan 376.417## 2 Albania 29.333## 3 Algeria 124.375## 4 American Samoa 14.567## 5 Andorra 29.921## 6 Angola 388.583## 7 Anguilla 52.417## 8 Antigua and Barbuda 8.725## 9 Argentina 55.500## 10 Armenia 76.875## .. ... ...

DPLYR: PLOTTING
D %>% arrange(e_prev_100k) %>% mutate(id=row_number()) %>% select(id, e_prev_100k) %>% plot
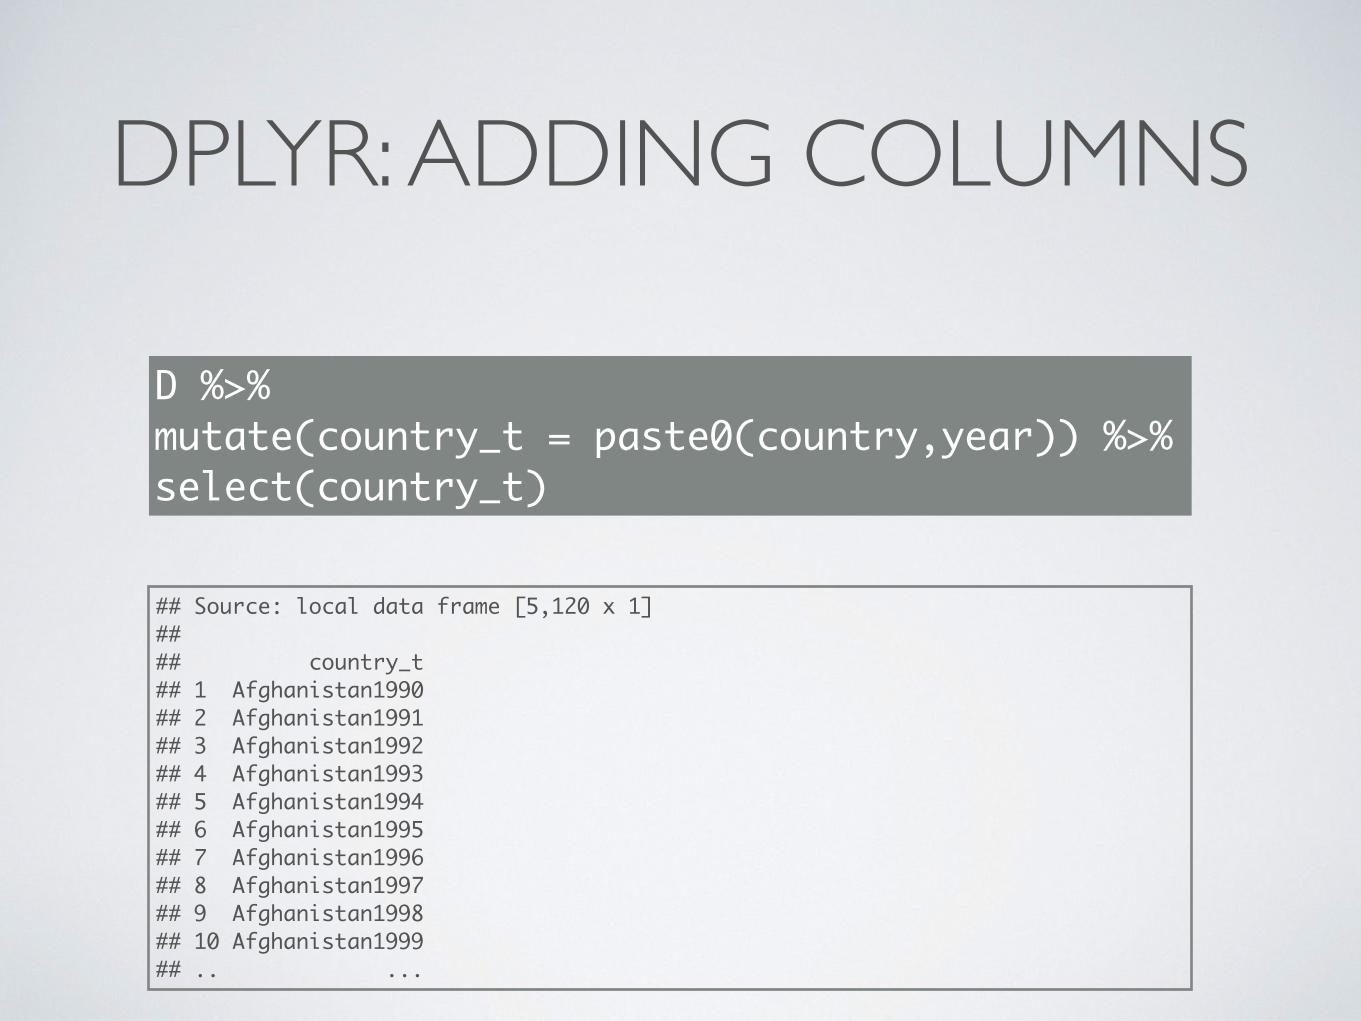
DPLYR: ADDING COLUMNS
D %>% mutate(country_t = paste0(country,year)) %>%select(country_t)
## Source: local data frame [5,120 x 1]## ## country_t## 1 Afghanistan1990## 2 Afghanistan1991## 3 Afghanistan1992## 4 Afghanistan1993## 5 Afghanistan1994## 6 Afghanistan1995## 7 Afghanistan1996## 8 Afghanistan1997## 9 Afghanistan1998## 10 Afghanistan1999## .. ...

DPLYR: DATABASES
data <- data.frame(x=1:200000000, y=runif(4), z=runif(50))format(object.size(data), units="GB")
## [1] "3.7 Gb"

DPLYR: DATABASES
src <- src_sqlite(“data.sqlite")data <- tbl(src, "data")

DPLYR: DATABASES
data %>% summarise(mean(x), max(y), mean(z))
## Source: sqlite 3.7.17 [data.sqlite]## From: <derived table> [?? x 3]## ## mean(x) max(y) mean(z)## 1 1e+08 0.9008 0.4501## .. ... ... ...

DPLYR: DATABASES
data %>% summarise(mean(x), max(y), mean(z))
## Source: sqlite 3.7.17 [data.sqlite]## From: <derived table> [?? x 3]## ## mean(x) max(y) mean(z)## 1 1e+08 0.9008 0.4501## .. ... ... ...
Use data as if it were local data.frame
Processing done in the database

DPLYR
• Similar to data.table & sqldf
• (Almost) transparently use a DB for speed
• Works with pipes
• Lazy

POSTSCRIPT: PLYR
• Most functions provided by dplyr, except:
• **ply, nicer than sapply, tapply, etc.

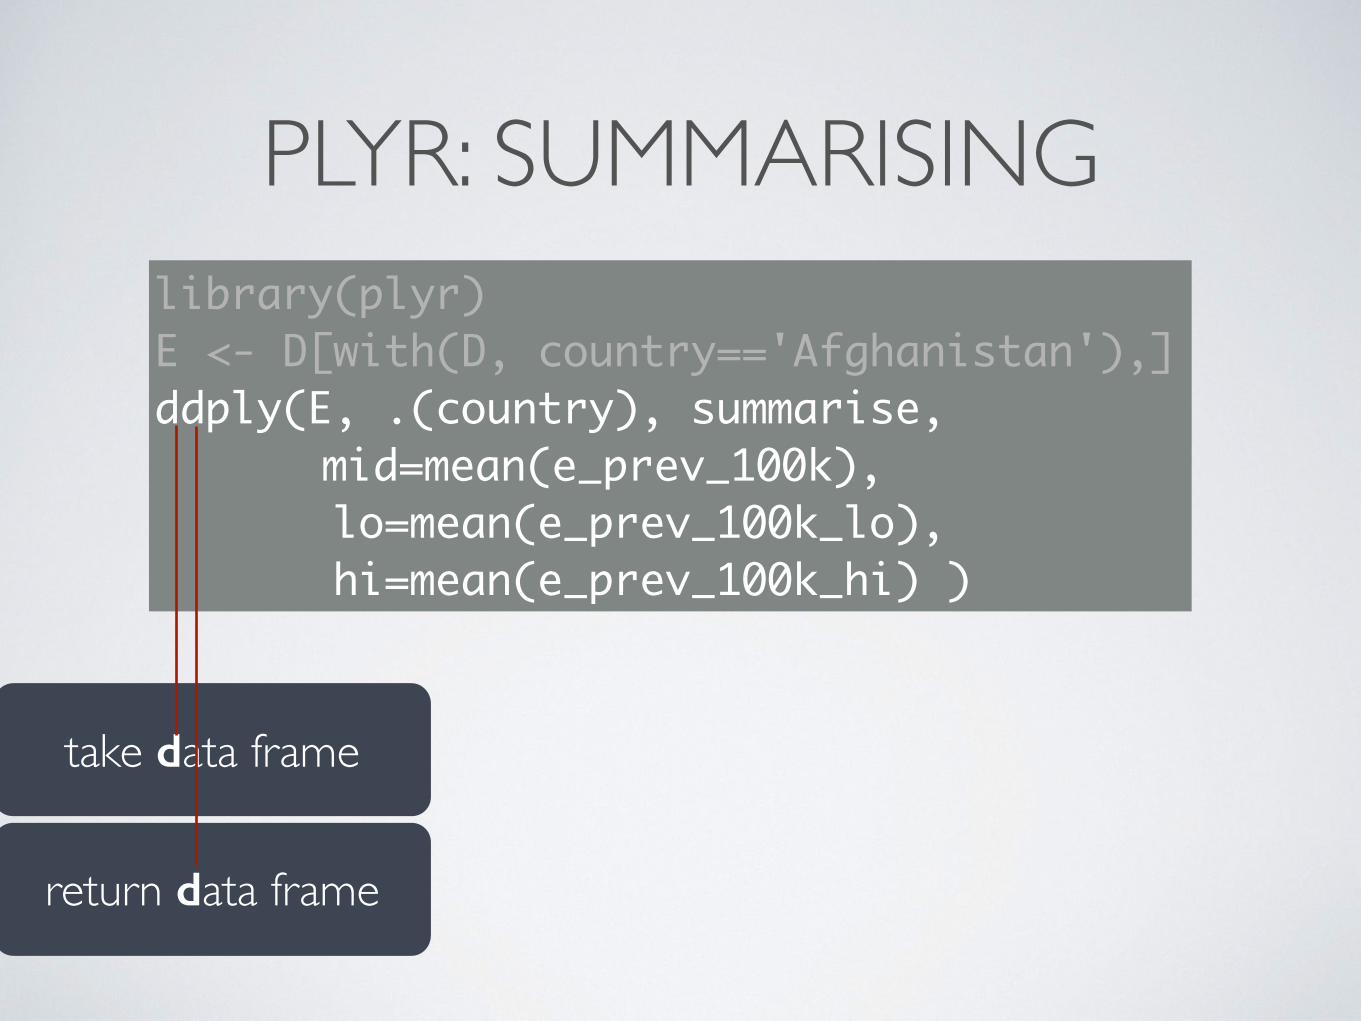
PLYR: SUMMARISINGlibrary(plyr)E <- D[with(D, country=='Afghanistan'),] ddply(E, .(country), summarise,
mid=mean(e_prev_100k), lo=mean(e_prev_100k_lo), hi=mean(e_prev_100k_hi) )
## country mid lo hi## 1 Afghanistan 376.4 187.2 630.7
return data frame
PLYR: SUMMARISINGlibrary(plyr)E <- D[with(D, country=='Afghanistan'),] ddply(E, .(country), summarise,
mid=mean(e_prev_100k), lo=mean(e_prev_100k_lo), hi=mean(e_prev_100k_hi) )
take data frame

return data frame
PLYR: SUMMARISINGlibrary(plyr)E <- D[with(D, country=='Afghanistan'),] ddply(E, .(country), summarise,
mid=mean(e_prev_100k), lo=mean(e_prev_100k_lo), hi=mean(e_prev_100k_hi) )
take data frame
grouping columnsinput

return data frame
PLYR: SUMMARISINGlibrary(plyr)E <- D[with(D, country=='Afghanistan'),] ddply(E, .(country), summarise,
mid=mean(e_prev_100k), lo=mean(e_prev_100k_lo), hi=mean(e_prev_100k_hi) )
take data frame
grouping columnsinput
new columns

PLYR: READ ALL CSV FILES
ldply( list.files(pattern="test.*\\.csv"), read.csv)
## X a b## 1 1 0.005018 0.329372## 2 2 0.145043 -1.065981## 3 3 0.930621 0.005956## 4 4 0.047814 0.271862## 5 5 0.916632 -0.630735## 6 6 0.746737 0.385569## 7 7 0.223346 1.312936## 8 8 0.904864 -0.433001## 9 9 0.653918 -1.065692## 10 10 0.770291 -0.209569## 11 11 0.387646 1.820283## 12 12 0.361888 -0.164768## 13 13 0.799788 -1.141612## 14 14 0.960051 -0.368712

PLYR: PLOT EACH GROUPd_ply( long, .(Sensor), function(df){ pdf(paste0(df$Sensor[1],".pdf")); plot(df$value); dev.off() })

RESOURCES
• dplyr vignettes: http://cran.r-project.org/web/packages/dplyr/vignettes
• plyr : StackOverflow, google