DPAM L - Degroof Petercam
181
DPAM L Investment Company with Variable Capital ("SICAV") with multiple sub-funds governed by Luxembourg law Organisme de Placement Collectif en Valeurs Mobilières ("OPCVM") Audited Annual Report as at 31 December 2020 R.C.S. Luxembourg B 27.128 Subscriptions may only be made on the basis of this prospectus ("the Prospectus") including the fact sheets for each of the sub-funds and on the basis of the key investor information ("Key Information"). The Prospectus may only be distributed if accompanied by the latest annual report and the latest semi-annual report if the latter is more recent than the annual report.
Transcript of DPAM L - Degroof Petercam

DPAM L
DPAM L
Investment Company with Variable Capital ("SICAV") with multiple sub-funds governed by Luxembourg law
Organisme de Placement Collectif en Valeurs Mobilières ("OPCVM")
Audited Annual Report as at 31 December 2020
R.C.S. Luxembourg B 27.128
Subscriptions may only be made on the basis of this prospectus ("the Prospectus") including the fact sheets for each of the sub-funds and on the basis of the key investor information ("Key Information"). The Prospectus may only be distributed if accompanied by the latest annual report and the latest semi-annual report if the latter is more recent than the annual report.


DPAM L
Contents
Conte nts
Organisation .............................................................................................................................................................. 4
General information of the Fund .............................................................................................................................. 6
Manager's Report .................................................................................................................................................... 10
Report of the Réviseur d’Entreprises agréé ............................................................................................................ 22
Combined Statement of Net Assets as at 31 December 2020 ................................................................................ 25
Combined Statement of Operations and Changes in Net Assets from 1 January 2020 to the 31 December 2020 26
Statement of Net Assets as at 31 December 2020 .................................................................................................. 27
Statement of Operations and Changes in Net Assets from 1 January 2020 to the 31 December 2020 ................. 47
Securities portfolio statement as at 31 December 2020 ........................................................................................ 63
Geographical allocation of the securities portfolio as at 31 December 2020 ....................................................... 117
Economic Allocation of the securities portfolio as at 31 December 2020 ............................................................ 125
Allocation by Currency of the securities portfolio as at 31 December 2020 ........................................................ 133
Changes occuring in the number of shares ........................................................................................................... 138
Changes in capital, total net assets and share value ............................................................................................. 152
Notes to the financial statements as at 31 December 2020 ................................................................................ 161
Additional information (unaudited) as at 31 December 2020 .............................................................................. 178

DPAM L
Organisation
4
Organisation
Registered office :
12, rue Eugène Ruppert, L-2453 Luxembourg
Date of incorporation :
23 December 1987
Board of Directors of the fund :
Chairman :
- Jérôme CASTAGNE, Director Degroof Petercam Asset Services S.A.
Members :
- Peter DE COENSEL, Director Degroof Petercam Asset Management S.A.
- Yvon LAURET, Independent Director - Jean-Michel LOEHR, Administrator - Thomas MURILLO
Degroof Petercam Asset Management S.A.
Management Company :
Degroof Petercam Asset Services S.A. 12, rue Eugène Ruppert, L-2453 Luxembourg
Manager(s) :
Degroof Petercam Asset Management S.A. 18, rue Guimard, B-1040 Brussels Degroof Petercam Asset Management France 44, rue de Lisbonne, F-75008 Paris (for the sub-fund DPAM L CONVERTIBLE WORLD SUSTAINABLE
Depositary Bank and Paying Agent :
Banque Degroof Petercam Luxembourg S.A. 12, rue Eugène Ruppert, L-2453 Luxembourg
Domiciliary and Central Administration :
Degroof Petercam Asset Services S.A. 12, rue Eugène Ruppert, L-2453 Luxembourg
Auditor :
PricewaterhouseCoopers, Société coopérative 2, rue Gerhard Mercator, BP 1443, L-1014 Luxembourg

DPAM L
Organisation
5
Representative and Payment Domicile :
Marcard Stein & CO AG Hambourg 36, Ballindamm , D-20095 Hamburg Germany Erste Bank der oesterreichischen Sparkassen AG 1, Am Belvedere, A-1100 Vienne Austria Banque Degroof Petercam S.A. 44, rue de l'Industrie, B-1040 Brussels Belgium Allfunds Bank S.A. C/Estafeta N6, Complejo Plaza de la Fuente, E-28109 Alcobendas, Madrid Spain Caceis Bank France 1-3, place Valhubert, F-75013 Paris France Société Générale London Branch Exchange House, 12 Primrose Street, London EC2A 2EG United Kingdom Allfunds Bank S.A. Via Bochetto 6, I-20123 Milan Italy SGSS S.p.A Via Benigno Crespi 19A - MAC2, I-20159 Milan Italia Banque Degroof Petercam (Suisse) S.A. Place de l’Université 8, CH-1205 Genève Switzerland
Centralising Correspondent :
Caceis Bank France 1-3, place Valhubert, F-75013 Paris

DPAM L
General information of the Fund
6
General informati on of the Fund
DPAM L (the "SICAV") was incorporated on 23 December 1987 as an Investment Company with Variable Capital (SICAV) with multiple Sub-Funds, governed by Luxembourg Law for an unlimited period. At the date of the report, the SICAV is subject to the law of 10 August 1915 and its amended laws related to commercial companies, to the Part I of the law of 17 December 2010 (“the Law of 2010”) related to Undertakings for Collective Investment and to the Council Directive 2009/65/EC as amended. The publications are made in "Recueil Electronique des Sociétés et Associations (RESA)" and accessible on the site "Registre de Commerce et des Sociétés de Luxembourg". The Articles of Incorporation of the SICAV were published in the "Mémorial, Recueil des Sociétés et Associations" on 17 February 1988, and the Articles of Incorporation, amended for the last time by the Extraordinary General Meeting of Shareholders of 2 January 2017 were published in the "Registre Electronique des Sociétés et Associations". The SICAV has appointed DEGROOF PETERCAM ASSET SERVICES S.A. as management company to perform globally all the collective portfolio management functions referred to in Appendix II to the Law of 2010, namely the management of the portfolio and the administration and sale of the shares in the SICAV. As at 31 December 2020, the following Sub-Funds are active: - DPAM L BONDS EUR QUALITY SUSTAINABLE in EUR - DPAM L BONDS UNIVERSALIS UNCONSTRAINED in EUR - DPAM L BONDS HIGHER YIELD in EUR - DPAM L BONDS GOVERNMENT SUSTAINABLE HEDGED in EUR - DPAM L EQUITIES CONVICTION RESEARCH in EUR - DPAM L BONDS EUR HIGH YIELD SHORT TERM in EUR - DPAM L PATRIMONIAL FUND in EUR - DPAM L BONDS EMERGING MARKETS SUSTAINABLE in EUR - DPAM L BONDS EUR CORPORATE HIGH YIELD in EUR - DPAM L GLOBAL TARGET INCOME in EUR - DPAM L BALANCE CONSERVATIVE SUSTAINABLE in EUR - DPAM L BONDS CLIMATE TRENDS SUSTAINABLE in EUR - DPAM L BONDS GOVERNMENT SUSTAINABLE in EUR - DPAM L CONVERTIBLE WORLD SUSTAINABLE* in EUR *launched on 30 October 2020 The Sub-Funds DPAM L LIQUIDITY EUR&FRN and DPAM L BONDS EUR GOVERNMENT 1-5 were closed on 7 December 2020. At the date of the report, the following classes of shares are available: - Class A shares: distribution shares, denominated in the sub-fund's reference currency, which, in principle, entitle their holder to receive a cash dividend, as described in the current prospectus ; - Class B shares: capitalisation shares, denominated in the sub-fund's reference currency, which, in principle, do not entitle their holder to receive a dividend, but the amount attributable to the holder from the amount to be distributed is capitalised in the Sub-Fund to which these capitalisation shares belong ;

DPAM L
General information of the Fund
7
- Class B CHF shares: capitalisation shares that differ from class B shares in that they are denominated in Swiss francs ; - Class B EUR HEDGED shares: capitalisation shares that differ from class B shares in that the non-Euro currency risk is limited by an active policy of hedging the exchange rate risk against the Euro. The overall proportion of currencies other than the Euro in the sub-fund's net assets will be hedged pro rata to the net assets of the B EUR HEDGED share class. Investors should be aware that implementation of an active exchange rate risk hedging policy is likely to entail extra charges ; - Class B USD shares: capitalisation shares that differ from class B shares in that they are denominated in US dollars ; - Class E shares: shares with the same characteristics as class A shares, reserved for institutional investors within the meaning of Article 174 paragraph (2), section c) of the law of 17 December 2010 ; - Class F shares: shares with the same characteristics as class B shares, reserved for institutional investors within the meaning of Article 174 paragraph (2), section c) of the law of 17 December 2010. - Class F CHF shares: capitalisation shares that differ from class F shares in that they are denominated in Swiss francs ; - Class F USD shares: capitalisation shares that differ from class F shares in that they are denominated in US dollars ; - Class J shares: capitalisation shares that differ from class F shares in that they are reserved to institutional or professional investors having one or more current discretionary management mandates with one or more companies belonging to Degroof Petercam Group, to the account(s) to which these discretionary management mandates apply, and in that they have a different management fee ; - Class L shares: capitalisation shares that are different from class B shares on account of their sales commission and different management fee ; - Class M shares: distribution shares that differ from class A shares in that they are reserved for investors having one or more current discretionary management mandates with one or more companies belonging to Degroof Petercam Group, and they are reserved for the account(s) to which these discretionary management mandates apply, and in that they are reserved for mandates with an “all in” type rate structure, and in that (iv) they have a different management fee. In this context, the “all in” type rate structure includes management fees and custody fees charged to the account(s) to which these “all in” type discretionary management mandates apply ; - Class N shares: capitalisation shares that differ from class B shares in that they are reserved for investors having one or more current discretionary management mandates with one or more companies belonging to Degroof Petercam Group, and they are reserved for the account(s) to which these discretionary management mandates apply, and in that they are reserved for mandates with an “all in” type rate structure, and in that they have a different management fee. In this context, the “all in” type rate structure includes management fees and custody fees charged to the account(s) to which these “all in” type discretionary management mandates apply ;

DPAM L
General information of the Fund
8
- Class N USD shares: capitalisation shares which differ from class N shares in that they are denominated in US dollars ; - Class P shares: capitalisation shares which differ from class F shares by the absence of (i) a management fee and (ii) a minimum initial subscription amount and in that they are (i) they are reserved for investors currently holding one or more discretionary management mandates with Degroof Petercam Asset Management and (ii) they are reserved for the account(s) to which these discretionary management mandates apply ; - Class V shares: distribution shares that are different from class A shares in that, at the discretion of the Management Company, they are characterised by the countries in which the Shares are offered, namely countries of the European Union (except Belgium), the United Kingdom and Switzerland and they have a different management fee ; - Class V EUR HEDGED shares: distribution shares which differ from class V shares in that the exchange risk against the euro is hedged. The Manager must take measures to systematically hedge the exchange risk in relation to the sub-fund's reference currency within a tolerance threshold defined in the information on the sub-fund. Investors are advised that implementing an exchange risk hedging policy may result in additional costs as mentioned in the prospectus of the sub-fund ; - Class W shares: capitalisation shares that are different from class B shares in that, at the discretion of the Management Company, they are characterised by the countries in which the Shares are offered, namely countries of the European Union (except Belgium), the United Kingdom and Switzerland and they have a different management fee ; - Class W CHF shares : capitalisation shares which differ from class W shares in that they are denominated in Swiss francs ; - Class W USD shares: capitalisation shares which differ from class W shares in that they are denominated in US dollars ; - Class W EUR HEDGED shares: capitalisation shares that differ from class W shares in that the non-Euro currency risk is limited by an active policy of hedging the exchange rate risk against the Euro. The overall proportion of currencies other than the Euro in the sub-fund's net assets will be hedged pro rata to the net assets of the W EUR HEDGED share class. Investors should be aware that implementation of an active exchange rate risk hedging policy is likely to entail extra charges. Dividends payable on any distribution class may, at the request of the shareholder, be paid in cash or in the form of new shares of the respective class. The Net Asset Value of each Sub-Fund is calculated each bank business day in Luxembourg ("Valuation Day") that corresponds to a net asset value which will be dated that Valuation Day but calculated on the bank business day following that Valuation Day. The Net Asset Value, issue price and redemption price (of each Sub-Fund) are available each business day at the registered office of the SICAV, and in Switzerland, available each business day in Geneva at the representative office BANQUE DEGROOF PETERCAM (SWITZERLAND) S.A., Geneva (for the relevant Sub-Funds).

DPAM L
General information of the Fund
9
The SICAV publishes, at the end of each year, an annual report audited by the Auditor and, at the end of each half year, an unaudited semi-annual report. These financial reports contain separate financial statements for each Sub-Fund. The consolidation currency is the Euro. The following documents are available to the public at the Registered Office of the SICAV or from the http://funds.degroofpetercam.lu and http://funds.degroofpetercam.com : - the articles of association of the SICAV ; - the prospectus of the SICAV (including the fact sheets for the SICAV’s sub-funds) ; - the Key Information (for each sub-fund and each class of shares) ; - the financial reports of the SICAV. A copy of the agreement entered into with the Manager of the SICAV manager can be consulted free of charge at the registered office of the SICAV.

DPAM L
Manager's Report
10
Manager's Report
Global equities suffered their worst performance since the 2008 crisis from mid-February 2020 to the end of March, when the rapid spread of Covid-19 outside of China shook the markets. The equity markets then rebounded strongly as governments and central banks announced unprecedented support measures. Later in the year, risk assets benefited from the stronger-than-expected economic recovery and the discovery of effective vaccines. In 2020, global equities will have risen 12% in dollar terms. US equities outperformed other regions. Among the major zones, only European equities ended the year in negative territory. The price of oil fell by half during the first quarter of 2020, due to lower demand owing to containment measures and to the disagreement within the OPEC+ alliance, before rebounding during the rest of the year. US government bonds recorded a positive performance during the period under review, with the US 10-year rate falling from 1.91% to 0.94%. Yields on similar German bonds fluctuated between -0.20% and -0.80% during the year, ending the period under review at -0.58%. The price of gold in dollar terms appreciated by 23% in 2020, driven up by expansionary monetary and fiscal policies and uncertainty related to the Covid-19 crisis. The euro appreciated against the dollar in the second half of the year, reaching USD 1.22 at the end of the period, compared to USD 1.12 at the end of 2019. The recovery plan approved by the European Council in July was one of the reasons for the renewed optimism of investors about the common currency. United States of America The US economy remained strong at the beginning of the year. The effects of the coronavirus on economic activity were not felt until March. The US economy lost more than 22 million jobs in the space of two months (March and April), and the unemployment rate peaked at 14.7% in April. It then declined to less than 7% at the end of the period. US private consumption declined considerably between February and April when the restrictive measures put in place to combat the virus negatively impacted consumption. The economy in the United States began to recover starting in May. Private consumption has rebounded strongly since that month, but still had not caught up to its February level by the end of the year. There were signs that the economic recovery was running out of steam starting in the autumn. In November, household consumption fell for the first time since April. In addition, job creation slowed sharply in the last few months of the year. Inflation fell significantly during the crisis before rebounding in the spring. However, at the end of the period, it remained below 2%. The Federal Reserve Bank took emergency monetary measures in response to the growing threat of the virus to the US economy. The US key rate returned to its historic low of 0% in March, while it was still at 1.5% at the beginning of the year. At the virtual meeting of central bankers in Jackson Hole, Federal Reserve Chairman J. Powell announced the expected change in the definition of the central bank’s inflation target. The Fed will now set an average inflation target of 2% over an undefined period. But to the disappointment of the markets, the Fed did not announce any new monetary measures in September to achieve its new objective. In December, the Fed changed its stance on asset purchases. It now links the duration of its purchases to significant progress being made towards its objectives of full employment and inflation. As for fiscal policy, the US Congress approved a historic USD 2.2 trillion budget support plan in the second half of March. This fiscal support was of paramount importance during the crisis because it increased the income of Americans as a whole. After months of tough negotiations, Republicans and Democrats in Congress finally approved another USD 900 billion support plan in December, the second largest in history. Eurozone Economic confidence indicators showed a slight improvement in activity in January and February. However, the arrival of Covid-19 completely reversed this scenario. Business confidence indicators fell to historic lows in March and April. Leading macroeconomic indicators picked up again in April as the restrictive measures were gradually lifted. The economic contraction between February and April was more pronounced in Italy, France and Spain than in Germany and the Netherlands. The various countries announced plans to provide

DPAM L
Manager's Report
11
economic support in the form of a state guarantee for corporate loans and increased assistance for households and companies in difficulty. On the political side, the highlight of the period was the European Commission’s proposal in May for a European recovery plan worth EUR 750 billion. The first signs that the economic recovery in the eurozone was running out of steam were already appearing in July. Business confidence in services has declined since then. This indicator rebounded in December following the announcement of vaccines and agreement on the European recovery plan. In addition, core inflation reached an all-time low in September, at 0.2%, while headline inflation moved into negative territory from August onwards. When the Covid-19 crisis hit the eurozone economy, the European Central Bank first established new financing lines on favourable terms for the banking sector. The ECB then launched a pandemic purchase programme on 18 March, which was increased in June and in December. At its December meeting, the ECB announced that it would extend its purchases until March 2022. Three additional bank refinancing operations will also be offered in 2021. The ECB’s intervention contributed to the decline in spreads in the eurozone’s southern countries. Japan The Japanese economy continued to contract in the first and second quarters of 2020, before rebounding in the third quarter. The Japanese central bank decided to increase the size of its purchase programme several times over the period and to maintain its policy of setting the 10-year rate at 0%. From a budgetary point of view, Japan's response to the crisis was among the largest in the world. Emerging markets The downward trend in emerging central bank rates accelerated in 2020 due to the drop in economic activity caused by the outbreak of the virus. India, Mexico, South Africa and Brazil have been hit particularly hard by the pandemic. But economic activity rebounded from May onwards. In China, most activity indicators marked record declines in February. At its annual meeting in May, the Chinese Communist Party announced a stimulus package that contained mainly new spending on infrastructure. According to official Chinese figures, economic activity in the second quarter of 2020 returned to the level seen at the end of 2019. Chinese growth continued to accelerate in the last months of the year.
DPAM L LIQUIDITY EUR&FRN The Net Asset Value of the Fund (B shares) was 335.04. The three-month EURIBOR fell during 2020, reaching a low of minus 55 bps at end-year. Floating rate notes are often linked to movements in the 3-month EURIBOR for payment of their coupons. So this segment of the portfolio had a difficult time of it. Company debt (Floating rate notes are linked to IG corporates) recovered in 2020. Volatility spiked up very soon in the year due to several lockdowns all over the world. In terms of valuation, 2020 started with EUR investment grade (IG) credit asset class valued at wide levels on the back of the pandemic , which gave us some buy/switch opportunities. The fund was liquidated during the month of December 2020. DPAM L BONDS EUR QUALITY SUSTAINABLE The net asset value of the capitalization shares (B share) gained 1.86% during the year 2020.

DPAM L
Manager's Report
12
2020 proved to be a tumultuous year for global financial markets, with the coronavirus pandemic and the subsequent policy responses leading to major swings in asset prices. European investment grade spreads ended the year at the same level they started it, ending the year around 100bp, at an index level. Having hit a wide of 260bp in March, credit markets saw a relentless rally back to pre-pandemic levels driven by a combination of: - European Central Bank Corporate Sector Purchase Programme (CSPP) and Pandemic Emergency Purchase Programme corporate bond purchases of around 90bn; - a shift in the level of fiscal support for the private sector; - and rising hopes for a vaccine led economic recovery next year. Euro investment grade supply set a post-crisis record of €567bn in 2020, up by 3% on 2019. Some of this issuance was driven by issuers raising precautionary liquidity cushions. Demand technical were strong through the course of last year. We started the year with an overweight in the subordinated space, with overweight’s in lower tier2 banks, on the limited issuance expectations and their cheapness vs Senior Non Preferred, and overweight in subordinated insurance bonds. We also had an overweight in the real estate sector, constructed around logistics, German residential and Spain, which are all maturing stories but which should all continue to deliver solid operating performance which should protect investment yields and drive values higher. We also increased our weight in corporate debt rated BBB as the worries that highly leveraged companies (i.e. AB Inbev, AT&T …) slightly receded during the year. After the rollercoaster ride in 2020 that witnessed both an extraordinary economic shock and unprecedented monetary and fiscal stimulus, we expect that fundamentals will regain importance and will determine more and more the path for fixed income prices over the course of 2021. The ECB has now turned the asset class in a monetary policy tool and should reduce the impact of volatility in spreads in the coming months, if of course tapering discussions don’t start. We remain cautious on interest rate risk in the euro area due to the too strong narrative that central bank intervention can continue to suppress any fundamentally justified re-pricing of yields to the upside, we have therefore an underweight duration exposure versus the benchmark. We continue to like corporate bonds with strong balance sheets that can profit from the gradual reopening of the economy. Selectivity and credit selection is key here since that the recovery is likely to be uneven across and within sectors. DPAM L BONDS UNIVERSALIS UNCONSTRAINED The net asset value of the capitalization shares (B share) increased of 2.01% during the year 2020. Over 2020 global bond markets were dominated by the economic effects of the pandemic alongside the supporting policy actions taken by fiscal and monetary authorities. The Universalis Unconstrained fund started the year on a very defensive portfolio construction footing. The fund was aggressively long protection iTraxx Crossover in Europe and CDX High Yield in the US. When the markets collapsed over March it enabled us to remain calm even under conditions that saw ALL bond markets collapse with the exception of nominal US government bonds. The resulting drawdown was harsh and labelled as well as a ‘one in a hundred years’ market event…like the pandemic. Our exposure to inflation linked bonds explains the approximately 11% drawdown between 19 February and 18 March 2020. The all-in response by central banks reversed the impact as of 18 March. By the end of March, we decided to unwind our credit protection as well as our remaining US interest rate cover. These decisions, in hindsight, were crucial for a steady recovery that unfolded till the end of the year. Indeed, the global policy response kicked-off a reflation trend that lifted inflation expectations across inflation linked markets. Our IG credit exposure across EU and US markets also contributed to the steady recovery.

DPAM L
Manager's Report
13
By the end of Q3, the start of Q4 we initiated a rotation out of IG Euro corporate bonds in favor of quality hard currency emerging market government bonds. Investments were sourced across China, Romania, Chili, Indonesia. We refrained from increasing EMFX exposure. Overall our interest rate profile remained high into year-end. 2020 was a challenging year that ended well. The challenges posed across the next episode of this peculiar market cycle will be high. Our focus will be geared towards a correct balance of expected returns and underlying risk. DPAM L BONDS HIGHER YIELD During 2020, the strategy experienced significant volatility in connection with the coronavirus pandemic. The European high-yield market recorded a slightly negative performance from the beginning of the year, followed by a significant correction in March. However, the massive support of central banks and governments subsequently allowed the market to regain investor confidence and, beginning in April, high-yield bond spreads tightened continuously. The default rate was also reasonable. While the rating agencies expected default rates of around 6%, in the end the rate was just 3.3% for the European high-yield market. The fund's strategy was defensive throughout the year and avoided investing in companies where the risk of debt restructuring was high. We maintained significant diversification, retaining our positions in subordinated bank bonds, diversifying our assets in local emerging market debt and also taking positions in US high-yield bonds. The fund (B shares) had a return of 3.54% for the year. We do not believe that there is significant potential for credit spreads to tighten in 2021. However, the market should produce a positive return, mainly thanks to the attractiveness of carry trades with bonds. We believe that the interest rate policy conducted by the Fed and the ECB should above all be geared towards maintaining a very accommodative bias. In this context, high-yield debt undeniably has a certain attraction given its high carry relative to other fixed-income asset classes. However, a more volatile environment cannot be ruled out given the high valuation levels of certain assets. DPAM L BONDS GOVERNMENT SUSTAINABLE AND SUSTAINABLE HEDGED The net asset value of the capitalization shares (B share) has changed for 2020 :
-0.12 for the Sub-Fund DPAM L BONDS GOVERNMENT SUSTAINABLE +3,19 for the Sub-Fund DPAM L BONDS GOVERNMENT SUSTAINABLE HEDGED
For some time now, the portfolio consists of an important allocation to dollar-block economies (namely, Australia, New Zealand, Canada) and Gilts based on a rate convergence view versus Core Europe and Japan. The portfolio started the year with a modified duration below the duration reference (JPM EMU Index). The modified duration was gradually increased during the course of March on growing concerns about the COVID-19 outbreak. At the very beginning of the year, we built a significant position (10%) in KFW that was offering a very attractive Bund-spread at this time. This spread has progressively tightened since and we decided to take some profit on about half the position. In April 2020, France became eligible again, while Czech Republic and South Korea were ranked as ineligible. Both countries were confirmed as ineligible in October 2020. Hence, as per the investment guidelines, the exit from both countries was implemented in a smooth and efficient way in the course of end November/early December.

DPAM L
Manager's Report
14
We started the year with a decent allocation to inflation-linked bonds (12%) built in H2 2019, considering the inflation breakevens were attractively priced (cheap) at the time. Inflation-linked bonds currently represent 10% of the total AUM (as of 31/12/2020, vs. 12% at the end of 2019). So far, despite the hit taken by breakevens in the context of the COVID-19 outbreak, we have seen a strong recovery in breakeven rates, but we see potential for further recovery, especially as the recession scenarios fades. The EUR-denominated bond segment in the portfolio remained at about 45% over the year. In general, the portfolio benefitted from a diversification outside the Eurozone as yields converged to Bund (e.g. in Australia, New Zealand, etc.). Given the high rating bias of the eligible universe and the strong rally seen in the EU Periphery (i.e., Italy, Portugal, Spain), the absence from these countries led to a lower performance in Europe. DPAM L EQUITIES CONVICTION RESEARCH The fund ended the year at a NAV value (B-SHARE) of EUR 1.323,42. The sub-fund achieved a negative return of –2,89% in 2020, while the European stock market average, measured by the MSCI Europe net return index, achieved a negative return of -3,3%. Despite the great corona crisis the compartment finished 2020 almost positive, helped by a strong monetary and fiscal response and the outlook of mass vaccination. Most sectors ended up in the green, with the exception of health care (almost flat), energy and financials. The composition of the sub-fund consists of the strongest convictions of the European buy side analysts, taking into account the weight of each sector. After all, the analysts look for the best risk-adjusted ideas within their sector. In the first four years according to these principles, all sectors contributed positively to the strong relative performance compared to the European stock market average. Changes to the Fund can be made if an alternative with more potential can be found for a similar risk. Important additions during 2020: Cellnex, Amadeus, Ferrovial, Burberry Atlas Copco, DSV, Interpump, Equinor and Ferrari Important dis-investments in 2020: Deutsche Telekom, Safran, Thales, Assa Abloy, Shell and Vinci Interesting to note here is that in May we changed 4 (out of 6) names in the industrial sector in order to rebalance the geographic exposure from Europe to APAC and to rebalance the exposure in terms of business mix. We sold Assa Abloy, Thales, Safran and Ryanair and we have bought Ferrari, Atlas Copco, DSV and Interpump. In TMT we have added Amadeus and Cellnex to the Fund. Amadeus offers a distribution and reservation platform for the travel industry (mainly airlines but also hotels). They are therefore at the core of the Covid crisis and have been severely disrupted by the Covid situation in 2020. Amadeus remains however a very strong company with a solid market position (they are the market leader) that should recover once the travel environment starts to normalize combined with the fact that Amadeus is a market share gainer in an already very consolidated space (oligopoly). Cellnex will benefit from a continued need to densify wireless networks (to manage network congestion) but also from future M&A potential in the tower space while its revenue base is contracted for operators. The manager expects a strong start of the stock market year as market participants expect the economic recovery to broaden during 2021 backed by vaccination and fiscal stimulus. Thanks to this more industries should see their earnings recover. However, the manager also expects the stock market to be weaker in the second halve of the year as earnings recovery could come short to expectations. At the same time sustainability of investments will continue to play an ever more important role. While being mindful for potential pockets of market concentration, the manager continues to focus on good business models, avoiding areas under disruption.

DPAM L
Manager's Report
15
DPAM L BONDS EUR HIGH YIELD SHORT TERM During 2020, the strategy experienced significant volatility in connection with the coronavirus pandemic. The European high-yield market recorded a slightly negative performance from the beginning of the year, followed by a significant correction in March. However, the massive support of central banks and governments subsequently allowed the market to regain investor confidence and, beginning in April, high-yield bond spreads tightened continuously. The default rate was also reasonable. While the rating agencies expected default rates of around 6%, in the end the rate was just 3.3% for the European high-yield market. The fund (B shares) had a negative return of -1.67% for the year. We do not believe that there is significant potential for credit spreads to tighten in 2021. However, the market should produce a positive return, mainly thanks to the attractiveness of carry trades with bonds. We believe that the interest rate policy conducted by the Fed and the ECB should above all be geared towards maintaining a very accommodative bias. In this context, high-yield debt undeniably has a certain attraction given its high carry relative to other fixed-income asset classes. However, a more volatile environment cannot be ruled out given the high valuation levels of certain assets. DPAM L PATRIMONIAL FUND The Net Asset Value of the fund’s F-share was EUR 136.72 on 31 December 2020. DPAM L – Patrimonial’s F-share gained 0.86% during the calendar year. The year was started with profit-taking in January after a very good 2019 performance, bringing back the equity weight to nearly 30%. Towards the end of February the Covid-19 virus -initially assumed to be restricted to Asia like the SarS virus-, started to spread in Europe and then across the globe. This made its mark on the rest of the calendar year, with mobility restrictions and entire sectors being forced to limit their activities. It led to the strongest GDP decline on record, together with the steepest decline of global equities. Putting the emphasis on capital preservation, the fund was de-risked significantly and fast on all risk axes. The equity weight for instance reached a low of 5% by mid-March and the portfolio interest rate sensitivity had also been strongly reduced. -Fortunately, national and monetary authorities then also reacted in a way that was equally unseen in terms of speed and magnitude, with respect to global interest rate decreases, liquidity injections and subsidies. Even though the economic uncertainty was still extremely uncertain, linked to the pandemic that was out-of-control, financial markets started to react favorably to all the stimulus, recuperating after the strong sell-off. Also the fund’s Net Asset Value started to gain ground. Gradually, the fund was re-risked again, but at a modest pace given all the lingering uncertainties. By the arrival of the summer, financial markets essentially traded on how much the pandemic appeared to be under control in various parts of the world, with China in the strongest position. By August, the portfolio’s risk stance had reached an average level. Later in the year, financial markets very much focused on hopes for a vaccine, -as researched by different pharmaceutical companies, - together with the outcome of the US elections. In the last quarter, good news on the arrival of different vaccines, together with Biden winning the US presidential elections, drove risk assets higher. Indeed, the Democratic agenda contained a more sizeable stimulus program than the Republican one. Whether the Democrats would control both chambers of the Congress though, remained uncertain until the Georgia Senate elections early 2021. Not pursuing any calendar year bias the portfolio positioning will be carried over in 2021. The year is started with a diversified portfolio with a moderately constructive risk stance, with select cyclical positions, such as US small caps and EMU banks, to anticipate on the economic recovery and all the stimulus.

DPAM L
Manager's Report
16
To steer the general asset allocation, we will continue to look at both the fundamental as technical market environment. We will continue to consider the convictions of internal experts on different asset classes, to come to a founded and diversified asset allocation. DPAM L BONDS EMERGING MARKETS SUSTAINABLE The Net Asset Value of the fund’s B-share has decreased of 2,09% in 2020. In Central Europe/Balkans, our top picks, Romania and Serbia outperformed Czech Republic and Poland. At the beginning of H2 we successfully witched another 1.5% Poland and 1.5% Czech Republic to Hungary. Montenegro, in which we have a small position (0.4%) performed poorly and has been sold. In the Sub Sahara region, frontier markets have recovered well. Ivory coast, Ghana and Senegal ended the year in positive territory. South Africa was an underperformer. The most volatile region has been Latin and Central America. Overall, our country selection has worked well, with a high weight to Mexico (10%), one of the few countries in the region that saw a positive yearly return and little exposure to Brazil (3.50%). This little exposure however, resulted in the single most negative attribution. Another negative result was for Peru, were we reduced exposure from 7% to 4%. Colombia (5%) showed a very small positive return. Our absence from Russia (excluded country) and Turkey worked well. Our broad diversification was once again very instrumental in reducing volatility on an absolute level. We keep our positive view going into 2021, but acknowledge that country selection will be more important than ever. DPAM L BONDS EUR CORPORATE HIGH YIELD During 2020, the strategy experienced significant volatility in connection with the coronavirus pandemic. The European high-yield market recorded a slightly negative performance from the beginning of the year, followed by a significant correction in March. However, the massive support of central banks and governments subsequently allowed the market to regain investor confidence and, beginning in April, high-yield bond spreads tightened continuously. The default rate was also reasonable. While the rating agencies expected default rates of around 6%, in the end the rate was just 3.3% for the European high-yield market. The fund's strategy was defensive throughout the year and avoided investing in companies where the risk of debt restructuring was high. This strategy was successful until April. However, the support given by governments in the form of guaranteed loans brought about a massive rally in bonds issued by companies with a weaker financial profile. We maintained our discipline and avoided taking positions in bank bonds issued by these companies. Our more defensive approach is reflected in the level of return achieved in 2020. The fund (B shares) underperformed its benchmark, the Bloomberg Barclays Euro HY, 3% Issuer constrained, ex. Financials, by 1.56%. We do not believe that there is significant potential for credit spreads to tighten in 2021. However, the market should produce a positive return, mainly thanks to the attractiveness of carry trades with bonds.

DPAM L
Manager's Report
17
We believe that the interest rate policy conducted by the Fed and the ECB should above all be geared towards maintaining a very accommodative bias. In this context, high-yield debt undeniably has a certain attraction given its high carry relative to other fixed-income asset classes. However, a more volatile environment cannot be ruled out given the high valuation levels of certain assets. DPAM L GLOBAL TARGET INCOME The Net Asset Value of the fund EUR 68,706,805.65 as at 31 December 2020. The DPAM L Global Target Income was launched in December 2014. The strategy of the fund is based on a quantitative approach that aims at a maximum diversification and the payment of a quarterly dividend of minimum 3% per annum. To achieve these goals, the fund invests in a variety of asset classes. Higher yielding bonds are a first important portfolio component. The risk profile of this asset class is somewhere between stocks and government bonds. Within the high yield bond allocation, a clear distinction is made between euro short term high yield bonds, euro corporate high yield bonds and longer duration global high yield bonds. The short term high yield bonds former has been a very stable component in the portfolio with a constant allocation of 19% because of its effective contribution to diversification. Higher yielding bonds represented between 21% and 44% in the fund. An optimized mix between interest rate sensitivity, global equity allocation and currencies with high yields bonds leads to a strongly diversified portfolio. In the Global Target Income fund, interest rate exposure was a key component to diversify risk. US Treasury bonds had a deeply negative correlation with US equities and also with global risky assets. Therefore, most of our interest rate exposure came from positions on the US curve via US bond futures and a position in the global government bond fund. The German 10-year Bund also effectively diversified risk in the portfolio, but to a lesser extent. Our allocation to EUR interest rate risk came from the positions in high quality euro government bond funds. We covered part of this interest rate risk by a short position via bund futures. Overall duration was slightly higher compared to last year and varied between 3.9 and 6.6 years. The wider duration range comes from the active management during the Covid-19 market correction in February/March 2020. The fund was rapidly de-risked during the market correction and re-risked shortly after to benefit from the recovery. In the riskier bond part, high yield bonds took a beating when the Covid virus turned into a pandemic. Investors liquidated all their positions and looked for the safety of cash. Our allocation to high yield bonds was reduced significantly in February. However, since their volatility remained lower than equities and the since the high yield bond spreads recovered afterwards, the fund remained invested in this asset class. These bonds supported us to maintain the yield target of 3%. The equity allocation in the fund varied between 34% at the beginning of the year and about 12.8% during the market correction. Over the year the equity allocation was gradually restored to end the year at 24.8%. Equity volatility jumped higher during the crisis, after more than a decade of exceptionally low volatility. However, as volatility started to normalize, we increased the allocation to stocks. On the currency side, the USD and the JPY hedged away quite some downside on the risky portfolio part. Especially the JPY acted as a solid haven currency. Although the volatility of the fund was clearly higher than in the preceding years, it remained aligned with the risk profile of defensive asset classes. The dynamic management succeeded in mitigating the negative impact of the Covid crisis. The Global Target Income Fund ended the year with a performance of -2.68% after costs. Evenly important, this performance was obtained with a volatility of about 4.8%. The government bond positions contributed 4.5% to the performance. The equity positions did not fully recover and ended the year at a contribution of -3.5%. Higher yielding bonds (inclusive emerging markets bonds in local currency) generated an additional

DPAM L
Manager's Report
18
negative contribution of -4.58%. The positive contribution of the high quality corporate bond position explains the rest. The strategy for 2021 will depend on the evolution of the volatilities and correlations between the underlying funds. Although 2020 was clearly a challenging year, the strategy behaved as expected. During the market correction, the fund aggressively de-risked. When correlations and volatilities normalized the fund’s strategy returned to adding risk. Central banks remain accommodative and fiscal stimulus will further help the recovery. Of course, a lot will depend on the success of the vaccines in handling the virus. The studies indicate highly efficient vaccines and the global rollout is accelerating. The fund still has its income component of 3%. This will help the patient investor to recover. Since the funds remains invested, we expect a gradual recovery of the performance. Volatility is under control and we see nice opportunities to improve diversification in the portfolio. The management of the fund remains active and is responsive to changing market dynamics. DPAM L BONDS EUR GOVERNMENT 1-5 Although it took governments a while to react to this peculiar situation given their non-existent experience with a pandemic, March 2020 was characterized by stringent lockdowns as never seen before. As a consequence, economic activity abruptly fell to lower levels than during the Global Financial Crisis and inflation followed oil and the output gap downward. Since 2015, inflation in Europe had been on an upward trend, although still at low levels, which was abruptly interrupted by the economic consequences of the Covid virus. Since the summer months, the latest inflation prints have fallen back into deflationary territory and will most likely stay that way over the first months of 2021. In terms of markets, the immediate reaction was an enormous flight to safety where the Germany 10 year Bund reached an all-time-low of -85 basispoints while peripheral spreads widened to levels not seen in many years. As some oil futures even started to price in negative territory, inflation-linked bonds across the world fell to extremely low levels. Since then, the riskier parts of the European bond universe have been gradually moving back to yield levels that are in general lower and tighter than pre-Covid times following the strong monetary and fiscal policy reactions. Every crisis has its immediate and very strong negative effects but also poses the potential for longer term positive consequences. On a European level we have seen this first by the implementation of the €100bio SURE employment support program and a bit later by the Next Generation financing program adding an additional €750 billion of fire power to tackle the economic slump. Especially the latter is a significant step in the further integration of the European Union on a fiscal level as the programs entails a range of new revenue instruments on a European level. The governing council of the ECB reacted to the crisis by launching a new emergency asset purchase program called PEPP thereby further strengthening the ECB’s (un)conventional monetary policy toolkit. The PEPP was created with a dual purpose, i.e. firstly to counter any fragmentation in the Euro Area and secondly to close the medium-term inflation gap that has emerged from the Covid pandemic. At the end of 2020, the potential purchase envelope has a size of €1850 bio and should be running until at least March 2022. Another consequence of the pandemic has been the postponement of the highly anticipated strategy review by the ECB until September 2020 to finish a year later. It is expected that no real changes to the mandate of price stability will be incorporated, but the target will become officially symmetric. This should hopefully increase inflation expectations as the inflation distribution will become symmetrical compared to a fat left-tail distribution currently. It is also likely that the APP and PEPP program will be merged, the inflation measure might be changed to incorporate owner-occupied housing costs, and climate goals will most likely become incorporated in the ECB’s secondary objectives. The fund suffered on a relative basis during the first weeks following the initial Covid-19 market shock due to its pro-cyclical positioning. Since we adopted a liquidity-based risk overlay strategy we were able to cope

DPAM L
Manager's Report
19
with the challenging environment and ensured alignment with our tracking error model limits. In addition, we raised cash to profit from some irrational spread movements. Just before summer, we reinitiated our positioning in peripheral spreads (mainly long-end Italy), CEE exposure (mainly Romania) and towards inflation-linked bonds. Over the last months of 2020 we further reduced our duration stance. DPAM L BALANCED CONSERVATIVE SUSTAINABLE On 31 December 2020, the net asset value of the DPAM L Balanced Conservative Sustainable fund (F shares) was EUR 29,606.64. This represents a rise of 6.40% for 2020. The fund closed ahead of its competition. The dynamic way in which we dealt with the asset allocation - in particular during periods of stress - ensured that we have not left any return opportunities unused in this respect. Most of the performance, however, could be attributed tot he excellent equity selection (in sustainable growth equities). At the start of 2020, the markets continued their fervour of 2019. The put of the central banks was still applicable and the economic data seemed to improve, moving the ghost of recession to the background. The outbreak of the corona virus in China started as early as January, and despite the lock-down of Wuhan, the world did not seem too concerned. As this appeared to have an impact on supply to the production lines in Europe and the rest of the world, we decided to be on the safe side and to selectively decrease the weight of equities. The enormous speed of the spread of the virus throughout Europe and the rest of the world, caused the market to seize up. When Italy was the first country to go into lock-down, we decided on time to strongly reduce the weight of risky assets, and positioned the portfolio more defensively in respect of selection. In March and April, central banks all over the world - headed by the FED - started to intervene en masse to stave off a financial crisis, and policy makers worldwide announced significant fiscal support measures to prevent an economic depression. At that point, we decided to gradually increase the equity weight again. We persevered with this until the end of the summer and continued to focus on quality growth companies with solid free cash-flow generation, healthy balance sheets etc. This was rewarded, but during the summer, we periodically noticed style rotations in favor of value equities. For this reason, we built in a partial hedge in the portfolio with a barbell structure (a combination of growth and value equities) In the bond section, we persisted in our preference for government bonds from the European periphery and quality IG corporate bonds, in view of the ECB's purchasing programs. In September, we returned to a balanced portfolio due to the second COVID wave and the impending elections in the US. This turned out to be a good move, because September and October closed with negative returns. This situation changed, however, in November, when it appeared that Biden would become the new US President, and Pfizer introduced a massive game-changer: a vaccine with 90%+ efficacy. This offered new perspectives to the world, and the markets reported their strongest month of November since records began. It was also the sign for us to considerably increase equity weight and to slightly reduce the defensive character. Ultimately, our fund benefited greatly from this move and our barbell strategy. In respect of bonds, we kept the emphasis on investment grade corporate and government bonds. The positive news about the COVID-19 vaccines offered the word new hope and a positive outlook. In the coming months, we need an improvement in economic activity to increase the prices of risky assets. Market strategies are positive already, but investors still have a hoard of cash. This creates some scope for risky assets to continue to increase in value. In view of the impact of COVID-19 on the economy and the potential requirement of more fiscal stimulus, interest rates will continue to be low for quite some time. This will prevent value equities from fully making up for their underperformance compared to growth equities. Therefore, the style rotation we implemented in the fund, has been rather a tactical call. In the longer term, we maintain our preference for growth equities.

DPAM L
Manager's Report
20
Our general message for 2021 is mainly positive for financial assets, but the real economy is still showing quite a few scars. Therefore, we have to consider potential risks, but the risk/return ratio has become much more positive in recent times. BONDS CLIMATE TRENDS SUSTAINABLE The Net Asset Value of the fund (B shares) EUR 103.83, a performance of 2.68%. During the last weeks of 2019, we started receiving some rumours out of China that a new contagious SARS respiratory strain was discovered in the Wuhan province. It took until February 2020 however before it came clear the virus had emigrated across the world and the first global pandemic since a century was upon us. Although it took governments a while to react to this peculiar situation given their non-existent experience with a pandemic, March 2020 was characterized by stringent lockdowns as never seen before. Therefore, economic activity abruptly fell to lower levels than during the Global Financial Crisis and inflation followed oil and the output gap lower. Since 2015, inflation in Europe had been on an upward trend, although still at low levels, this was abruptly interrupted by the economic consequences of the Covid virus. Since the summer months, the latest inflation prints have fallen back into deflationary territory and will most likely only start to reverse over the first months of 2021. In terms of markets, the immediate reaction was an enormous flight to safety where the Germany 10 Year Bund reached an all-time-low of -85 bps while peripheral and corporate spreads widened to levels not seen in many years. As some oil futures even started to price in negative territory, inflation-linked bonds across the world fell to extremely low levels. Since then, the riskier parts of the European bond universe have been gradually moving back to yield levels that are in general lower and tighter than pre-Covid times following the strong monetary and fiscal policy reactions. Every crisis has its immediate and very strong negative effects but also poses the potential for longer term positive consequences. On a European level we have seen this first by the implementation of the EUR 100bio SURE employment support program and a bit later by the Next Generation financing program adding an additional EUR 750 billion of fire power to tackle the economic downturn. The focus on digital and green infrastructure could provide a boon for a capex-led investment revival in productivity and growth. It is a significant step in the further integration of the European Union on a fiscal level as the programs entails a range of new revenue instruments on a European level. Green bonds have continued their explosive growth and are becoming a mainstream market segment. We have witnessed a further diversification in issuers, sectors and type if instruments. We feel that the emerging of sustainability-linked bonds could provide an additional impetus to finance climate change. More and stricter climate regulation will only exacerbate this trend. The duration of the portfolio was managed dynamically the entire year, with on average a preference for shorter maturities and corporate bonds. Our FX exposure was reduced over the course of the year. The fund will continue to dynamically adjust the factors that are determining for its performance in order to benefit from the waves of volatility and changes in investor sentiment regarding different segments of the bond market. We believe that the unprecedented experiment between procyclical fiscal and monetary policy will lead to higher interest rates and tighter spreads over the medium term due to better growth prospects and a revival in inflation expectations. Our actively managed portfolio will continue to select interesting climate conscious issuers that provide compelling investment cases in order to deliver robust risk-adjusted performances over the medium term. DPAM L CONVERTIBLE WORLD SUSTAINABLE DPAM L Convertible World Sustainable was launched on 30 October 2020. We invested our portfolio immediately and took advantage of the announcement of the arrival of Pfizer's vaccine, which led to an

DPAM L
Manager's Report
21
historic one-day rise in the equity markets. The fund achieved a performance of 8.1% between 30 October and 31 December. Most of this performance was achieved generated by stocks such as SBI Holding, Zscaler, Bilibili and MongoDB. Our allocation is very heavily weighted in the European and Asian zones, especially Japan. We are very cautious about US technology stocks, where we view valuations as excessive. We focus our stock-picking on companies that have a real impact on ESG criteria such as Illumina, Qiagen, Teladoc and China Education. We look for stocks that have a tangible positive impact on the planet in the communication and education sectors. We expect the primary market to be dynamic in 2021. Luxemburg, 15 March 2021 Past performance is not indicative of future performance. They are not constant over time.

22
Audit report To the Shareholders of DPAM L
Our opinion In our opinion, the accompanying financial statements give a true and fair view of the financial position of DPAM L and of each of its sub-funds (the “Fund”) as at 31 December 2020, and of the results of their operations and changes in their net assets for the year then ended in accordance with Luxembourg legal and regulatory requirements relating to the preparation and presentation of the financial statements. What we have audited The Fund’s financial statements comprise:
the combined statement of net assets for the Fund and the statement of net assets for each of the sub-funds as at 31 December 2020;
the combined statement of operations and changes in net assets for the Fund and the statement of operations and changes in net assets for each of the sub-funds for the year then ended;
the schedule of investments as at 31 December 2020; and
the notes to the financial statements, which include a summary of significant accounting policies.
Basis for opinion We conducted our audit in accordance with the Law of 23 July 2016 on the audit profession (Law of 23 July 2016) and with International Standards on Auditing (ISAs) as adopted for Luxembourg by the “Commission de Surveillance du Secteur Financier” (CSSF). Our responsibilities under the Law of 23 July 2016 and ISAs as adopted for Luxembourg by the CSSF are further described in the “Responsibilities of the “Réviseur d’entreprises agréé” for the audit of the financial statements” section of our report. We believe that the audit evidence we have obtained is sufficient and appropriate to provide a basis for our opinion. We are independent of the Fund in accordance with the International Ethics Standards Board for Accountants’ Code of Ethics for Professional Accountants (IESBA Code) as adopted for Luxembourg by the CSSF together with the ethical requirements that are relevant to our audit of the financial statements. We have fulfilled our other ethical responsibilities under those ethical requirements.
Other information The Board of Directors of the Fund is responsible for the other information. The other information comprises the information stated in the annual report but does not include the financial statements and our audit report thereon. Our opinion on the financial statements does not cover the other information and we do not express any form of assurance conclusion thereon.

23
In connection with our audit of the financial statements, our responsibility is to read the other information identified above and, in doing so, consider whether the other information is materially inconsistent with the financial statements or our knowledge obtained in the audit, or otherwise appears to be materially misstated. If, based on the work we have performed, we conclude that there is a material misstatement of this other information, we are required to report that fact. We have nothing to report in this regard.
Responsibilities of the Board of Directors of the Fund for the financial statements The Board of Directors of the Fund is responsible for the preparation and fair presentation of the financial statements in accordance with Luxembourg legal and regulatory requirements relating to the preparation and presentation of the financial statements, and for such internal control as the Board of Directors of the Fund determines is necessary to enable the preparation of financial statements that are free from material misstatement, whether due to fraud or error. In preparing the financial statements, the Board of Directors of the Fund is responsible for assessing the Fund’s ability to continue as a going concern, disclosing, as applicable, matters related to going concern and using the going concern basis of accounting unless the Board of Directors of the Fund either intends to liquidate the Fund or to cease operations, or has no realistic alternative but to do so.
Responsibilities of the “Réviseur d’entreprises agréé” for the audit of the financial statements The objectives of our audit are to obtain reasonable assurance about whether the financial statements as a whole are free from material misstatement, whether due to fraud or error, and to issue an audit report that includes our opinion. Reasonable assurance is a high level of assurance, but is not a guarantee that an audit conducted in accordance with the Law of 23 July 2016 and with ISAs as adopted for Luxembourg by the CSSF will always detect a material misstatement when it exists. Misstatements can arise from fraud or error and are considered material if, individually or in the aggregate, they could reasonably be expected to influence the economic decisions of users taken on the basis of these financial statements. As part of an audit in accordance with the Law of 23 July 2016 and with ISAs as adopted for Luxembourg by the CSSF, we exercise professional judgment and maintain professional scepticism throughout the audit. We also:
identify and assess the risks of material misstatement of the financial statements, whether due to fraud or error, design and perform audit procedures responsive to those risks, and obtain audit evidence that is sufficient and appropriate to provide a basis for our opinion. The risk of not detecting a material misstatement resulting from fraud is higher than for one resulting from error, as fraud may involve collusion, forgery, intentional omissions, misrepresentations, or the override of internal control;
obtain an understanding of internal control relevant to the audit in order to design audit procedures that are appropriate in the circumstances, but not for the purpose of expressing an opinion on the effectiveness of the Fund’s internal control;
evaluate the appropriateness of accounting policies used and the reasonableness of accounting estimates and related disclosures made by the Board of Directors of the Fund;
conclude on the appropriateness of the Board of Directors of the Fund’s use of the going concern basis of accounting and, based on the audit evidence obtained, whether a material uncertainty exists related to events or conditions that may cast significant doubt on the Fund’s ability to continue as a

24
going concern. If we conclude that a material uncertainty exists, we are required to draw attention in our audit report to the related disclosures in the financial statements or, if such disclosures are inadequate, to modify our opinion. Our conclusions are based on the audit evidence obtained up to the date of our audit report. However, future events or conditions may cause the Fund to cease to continue as a going concern;
evaluate the overall presentation, structure and content of the financial statements, including the disclosures, and whether the financial statements represent the underlying transactions and events in a manner that achieves fair presentation.
We communicate with those charged with governance regarding, among other matters, the planned scope and timing of the audit and significant audit findings, including any significant deficiencies in internal control that we identify during our audit. PricewaterhouseCoopers, Société coopérative Luxembourg, 7 April 2021 Represented by
Sébastien Sadzot Report of the Réviseur d’Entreprises agréé

DPAM L
Combined Statement of Net Assets as at 31 December 2020
The accompanying notes form an integral part of these Financial Statements
25
Combine d Statement of Net Asset s as at 31 December 2020
The accompanying notes for m an integral part of these Financial State ments
NOTES COMBINED (IN EUR)
Assets
Investments in securities 1a 7,831,398,412.26
Cash at banks 173,884,049.22
Interest receivable on cash account 6,632.81
Interest receivable on bonds 75,580,959.97
Dividends receivable on shares 9,931.52
Amounts receivable on subscriptions 9,800,566.05
Amounts receivable on investment sold 3,137,113.45
Amounts receivable on spot exchange contracts 7,750,000.00
Unrealised gain on forward exchange contracts 9 777,185.70
Amounts receivable from the broker on futures 0.08
Unrealised gains on IRS 11 5,853.93
Futures guaranty deposit 10 8,267,124.38
Collateral on OTC derivatives 9,11 19,580,000.00
Total Assets 8,130,197,829.37
Liabilities
Taxes and Expenses payable 3 9,474,672.38
Overdraft at banks 2,678,811.29
Overdraft interest 81,649.58
Interest payable on CDS 106,111.10
Amounts payable on redemptions 2,544,816.38
Amounts payable on purchases of investments 7,038,104.28
Amounts payable on spot exchange contracts 7,757,881.68
Amounts payable on IRS 8,143.72
Unrealised Loss on Forward Exchange Contracts 9 13,856,145.95
Amounts payable to the broker on futures 10,069.79
Unrealised Loss on IRS 11 94,109.99
Unrealised loss on CDS 11 5,793,094.00
Total Liabilities 49,443,610.14
Net assets at the end of the year 8,080,754,219.23

DPAM L
Combined Statement of Operations and Changes in Net Assets
from 1 January 2020 to the 31 December 2020
The accompanying notes form an integral part of these Financial Statements
26
Combine d Statement of Operations a nd Change s in Net Assets from 1 January 202 0 to the 31 De ce mber 20 20
Combined State ment of Operations and C hanges in Net As sets from 1 January 2020 to the 31 December 2020
The accompanying notes for m an integral part of these Financial State ments
NOTES COMBINED (IN EUR)
Income Dividends 1e 5,710,440.03 Interest on bonds 1e 182,366,516.01 Interest on IRS 133,687.79 Dividends on CDS 3,031,572.08 Interest on cash accounts 514,901.99 Commission on subscriptions and redemptions 4,8 2,186,475.02 Tax claim 121,358.59 Other income 4,229.94 Total Income 194,069,181.45
Expenses Performance fee 5 1,644,324.45 Management Fee 5 21,835,419.49 Depositary fees 1,545,565.68 Subscription tax 6 1,554,217.12 Administration fees 8,121,500.84 Miscellaneous fees 1,167,973.48 Transaction fees 4,416,172.54 Interest on IRS 41,141.09 Interest expenses on CDS 5,624,533.71 Overdraft interest 1,275,991.39 Taxes paid to foreign authorities 198,917.27 Total Expenses 47,425,757.06
Net Profit / (Loss) 146,643,424.39
Net Realised Profit / (Loss) - on investments 1b -85,246,983.88 - on currencies -5,057,498.03 - on forward exchange contracts 11,413,318.21 - on futures -26,036,077.42 - on IRS and CDS 24,827,115.32
Total Net Realised Profit / (Loss) 66,543,298.59 Change in Net Unrealised Appreciation or Depreciation
- on investments 1d 12,928,734.05 - on forward exchange contracts -8,387,675.59 - on futures -10,154,056.76 - on IRS and CDS -3,097,487.39
Result of operations 57,832,812.90
- Subscriptions 3,981,521,904.99
- Redemptions -2,149,887,219.91
Dividends paid 12 -26,250,575.93
Net changes in Net Assets 1,863,216,922.05
Net assets at the beginning of the year 6,217,537,297.18 Net assets at the end of the year 8,080,754,219.23

DPAM L
Statement of net assets as at 31 December 2020
anying notes form an integral part of these Financial Statements
27
Statement of net assets as at 31 De ce mber 2 020
anying notes for m an integral pa rt of these Financial Statement s
DPAM L BONDS EUR QUALITY SUSTAINABLE
NOTES
VALUE (IN EUR)
Assets
Investments in securities 1a 1,426,708,794.26 Cash at banks 11,202,085.05 Interest receivable on cash account 0.00 Interest receivable on bonds 10,673,024.16 Dividends receivable on shares 0.00 Amounts receivable on subscriptions 4,493,862.23 Amounts receivable on investment sold 0.00 Amounts receivable on spot exchange contracts 0.00 Unrealised gain on forward exchange contracts 9 0.00 Amounts receivable from the broker on futures 0.00 Unrealised gains on IRS 11 0.00 Futures guaranty deposit 10 1,775,146.30
Collateral on OTC derivatives 9,11 2,410,000.00
Total Assets 1,457,262,912.00
Liabilities
Taxes and Expenses payable 3 1,200,611.77 Overdraft at banks 0.00 Overdraft interest 6,177.31 Interest payable on CDS 33,333.33 Amounts payable on redemptions 136,156.60 Amounts payable on purchases of investments 0.00 Amounts payable on spot exchange contracts 0.00 Amounts payable on IRS 0.00 Unrealised Loss on Forward Exchange Contracts 9 0.00 Amounts payable to the broker on futures 0.00 Unrealised Loss on IRS 11 0.00 Unrealised loss on CDS 11 2,605,098.00
Total Liabilities 3,981,377.01
Net assets at the end of the year 1,453,281,534.99
Number of Shares Outstanding (at the end of the exercice)
- A 175,040.594
- B 56,273.660
- E 20,053.693
- F 677,589.257
- J 20,092.881
- L 1,913.000
- M 608,412.577
- N 4,172.735
- P 480,699.000
- W 6,910.881
Net Asset Value per Share (at the end of the exercice)
- A 151.89 - B 602.85 - E 452.50 - F 629.36 - J 26,747.59 - L 552.04 - M 153.30 - N 608.38 - P 662.93 - W 618.70

DPAM L
Statement of net assets as at 31 December 2020
anying notes form an integral part of these Financial Statements
28
DPAM L BONDS UNIVERSALIS UNCONSTRAINED
NOTES
VALUE (IN EUR)
Assets
Investments in securities 1a 1,205,184,459.28 Cash at banks 20,096,450.11 Interest receivable on cash account 0.00 Interest receivable on bonds 7,258,880.26 Dividends receivable on shares 0.00 Amounts receivable on subscriptions 92,732.97 Amounts receivable on investment sold 3,137,113.45 Amounts receivable on spot exchange contracts 7,750,000.00 Unrealised gain on forward exchange contracts 9 0.00 Amounts receivable from the broker on futures 0.00 Unrealised gains on IRS 11 0.00 Futures guaranty deposit 10 3,520,427.59
Collateral on OTC derivatives 9,11 3,230,000.00 Total Assets 1,250,270,063.66
Liabilities
Taxes and Expenses payable 3 1,542,806.42 Overdraft at banks 0.00 Overdraft interest 6,170.50 Interest payable on CDS 72,777.77 Amounts payable on redemptions 237,395.77 Amounts payable on purchases of investments 0.00 Amounts payable on spot exchange contracts 7,757,881.68 Amounts payable on IRS 0.00 Unrealised Loss on Forward Exchange Contracts 9 0.00 Amounts payable to the broker on futures 0.00 Unrealised Loss on IRS 11 0.00 Unrealised loss on CDS 11 3,187,996.00 Total Liabilities 12,805,028.14
Net assets at the end of the year 1,237,465,035.52

DPAM L
Statement of net assets as at 31 December 2020
anying notes form an integral part of these Financial Statements
29
DPAM L BONDS UNIVERSALIS UNCONSTRAINED
NOTES
VALUE (IN EUR)
Number of Shares Outstanding (at the end of the exercice)
- A 393,087.761
- B 464,736.593
- B CHF 328.000
- E 171,813.153
- F 2,907,916.620
- J 7,765.702
- M 742,892.326
- N 34,741.923
- P 683,890.000
- V 2,897.632
- W 216,525.433
Net Asset Value per Share (at the end of the exercice)
- A 145.65 - B 181.30 - B CHF 184.01 - E 127.43 - F 189.79 - J 29,257.42 - M 147.42 - N 183.35 - P 202.08 - V 156.49 - W 186.42

DPAM L
Statement of net assets as at 31 December 2020
anying notes form an integral part of these Financial Statements
30
DPAM L BONDS HIGHER YIELD
NOTES
VALUE (IN EUR)
Assets
Investments in securities 1a 196,958,782.54 Cash at banks 6,357,161.13 Interest receivable on cash account 0.00 Interest receivable on bonds 2,761,368.53 Dividends receivable on shares 0.00 Amounts receivable on subscriptions 3,284.37 Amounts receivable on investment sold 0.00 Amounts receivable on spot exchange contracts 0.00 Unrealised gain on forward exchange contracts 9 435,154.42 Amounts receivable from the broker on futures 0.00 Unrealised gains on IRS 11 0.00 Futures guaranty deposit 10 0.00
Collateral on OTC derivatives 9,11 0.00 Total Assets 206,515,750.99
Liabilities
Taxes and Expenses payable 3 485,214.27 Overdraft at banks 2,678,811.29 Overdraft interest 1,349.23 Interest payable on CDS 0.00 Amounts payable on redemptions 8,196.13 Amounts payable on purchases of investments 0.00 Amounts payable on spot exchange contracts 0.00 Amounts payable on IRS 0.00 Unrealised Loss on Forward Exchange Contracts 9 0.00 Amounts payable to the broker on futures 0.00 Unrealised Loss on IRS 11 0.00 Unrealised loss on CDS 11 0.00 Total Liabilities 3,173,570.92
Net assets at the end of the year 203,342,180.07

DPAM L
Statement of net assets as at 31 December 2020
anying notes form an integral part of these Financial Statements
31
DPAM L BONDS HIGHER YIELD
NOTES
VALUE (IN EUR)
Number of Shares Outstanding (at the end of the exercice)
- A 1,011,479.663
- B 120,162.670
- B CHF 187.899
- E 189,890.858
- F 98,329.675
- M 145,367.532
- N 4,447.489
- P 33,452.000
- V 4,657.002
- W 3,796.081
Net Asset Value per Share (at the end of the exercice)
- A 91.28 - B 288.74 - B CHF 306.88 - E 104.13 - F 303.57 - M 92.46 - N 292.02 - P 307.93 - V 100.82 - W 298.09

DPAM L
Statement of net assets as at 31 December 2020
anying notes form an integral part of these Financial Statements
32
DPAM L BONDS GOVERNMENT SUSTAINABLE HEDGED
NOTES
VALUE (IN EUR)
Assets
Investments in securities 1a 767,959,939.52 Cash at banks 23,114,519.48 Interest receivable on cash account 0.00 Interest receivable on bonds 3,789,486.98 Dividends receivable on shares 0.00 Amounts receivable on subscriptions 799,481.68 Amounts receivable on investment sold 0.00 Amounts receivable on spot exchange contracts 0.00 Unrealised gain on forward exchange contracts 9 0.00 Amounts receivable from the broker on futures 0.00 Unrealised gains on IRS 11 0.00 Futures guaranty deposit 10 247,035.50
Collateral on OTC derivatives 9,11 8,540,000.00 Total Assets 804,450,463.16
Liabilities
Taxes and Expenses payable 3 652,563.19 Overdraft at banks 0.00 Overdraft interest 10,902.71 Interest payable on CDS 0.00 Amounts payable on redemptions 849,803.68 Amounts payable on purchases of investments 0.00 Amounts payable on spot exchange contracts 0.00 Amounts payable on IRS 0.00 Unrealised Loss on Forward Exchange Contracts 9 10,789,190.02 Amounts payable to the broker on futures 0.00 Unrealised Loss on IRS 11 0.00 Unrealised loss on CDS 11 0.00 Total Liabilities 12,302,459.60
Net assets at the end of the year 792,148,003.56

DPAM L
Statement of net assets as at 31 December 2020
anying notes form an integral part of these Financial Statements
33
DPAM L BONDS GOVERNMENT SUSTAINABLE HEDGED
NOTES
VALUE (IN EUR)
Number of Shares Outstanding (at the end of the exercice)
- A 7,983.746
- B 25,373.563
- E 9,141.995
- F 275,016.528
- J 6,352.841
- L 1,391.639
- M 19,229.585
- N 170.000
- P 14,049.000
- V 2,093.556
- W 24,449.296
Net Asset Value per Share (at the end of the exercice)
- A 1,383.82 - B 1,399.45 - E 1,419.50 - F 1,700.10 - J 27,356.05 - L 1,379.48 - M 1,392.39 - N 1,408.61 - P 1,750.42 - V 1,428.59 - W 1,421.39

DPAM L
Statement of net assets as at 31 December 2020
anying notes form an integral part of these Financial Statements
34
DPAM L EQUITIES CONVICTION RESEARCH
NOTES
VALUE (IN EUR)
Assets
Investments in securities 1a 323,570,731.11 Cash at banks 5,424,190.57 Interest receivable on cash account 0.00 Interest receivable on bonds 0.00 Dividends receivable on shares 0.00 Amounts receivable on subscriptions 13,313.76 Amounts receivable on investment sold 0.00 Amounts receivable on spot exchange contracts 0.00 Unrealised gain on forward exchange contracts 9 0.00 Amounts receivable from the broker on futures 0.00 Unrealised gains on IRS 11 0.00 Futures guaranty deposit 10 0.00
Collateral on OTC derivatives 9,11 0.00 Total Assets 329,008,235.44
Liabilities
Taxes and Expenses payable 3 551,488.38 Overdraft at banks 0.00 Overdraft interest 3,197.83 Interest payable on CDS 0.00 Amounts payable on redemptions 33,284.40 Amounts payable on purchases of investments 0.00 Amounts payable on spot exchange contracts 0.00 Amounts payable on IRS 0.00 Unrealised Loss on Forward Exchange Contracts 9 0.00 Amounts payable to the broker on futures 0.00 Unrealised Loss on IRS 11 0.00 Unrealised loss on CDS 11 0.00 Total Liabilities 587,970.61
Net assets at the end of the year 328,420,264.83
Number of Shares Outstanding (at the end of the exercice)
- A 2,421.870
- B 14,998.025
- F 26,157.887
- J 7,074.659
- M 22,500.571
- N 3,776.642
- P 2,708.000
Net Asset Value per Share (at the end of the exercice)
- A 1,088.33 - B 1,323.42 - F 112.60 - J 28,410.50 - M 1,105.43 - N 1,342.54 - P 26,607.39

DPAM L
Statement of net assets as at 31 December 2020
anying notes form an integral part of these Financial Statements
35
DPAM L BONDS EUR HIGH YIELD SHORT TERM
NOTES
VALUE (IN EUR)
Assets
Investments in securities 1a 327,164,110.87 Cash at banks 11,837,899.70 Interest receivable on cash account 0.00 Interest receivable on bonds 4,573,539.73 Dividends receivable on shares 0.00 Amounts receivable on subscriptions 0.00 Amounts receivable on investment sold 0.00 Amounts receivable on spot exchange contracts 0.00 Unrealised gain on forward exchange contracts 9 0.00 Amounts receivable from the broker on futures 0.00 Unrealised gains on IRS 11 0.00 Futures guaranty deposit 10 0.00
Collateral on OTC derivatives 9,11 0.00 Total Assets 343,575,550.30
Liabilities
Taxes and Expenses payable 3 409,187.66 Overdraft at banks 0.00 Overdraft interest 3,644.39 Interest payable on CDS 0.00 Amounts payable on redemptions 30,938.11 Amounts payable on purchases of investments 0.00 Amounts payable on spot exchange contracts 0.00 Amounts payable on IRS 0.00 Unrealised Loss on Forward Exchange Contracts 9 0.00 Amounts payable to the broker on futures 0.00 Unrealised Loss on IRS 11 0.00 Unrealised loss on CDS 11 0.00 Total Liabilities 443,770.16
Net assets at the end of the year 343,131,780.14

DPAM L
Statement of net assets as at 31 December 2020
anying notes form an integral part of these Financial Statements
36
DPAM L BONDS EUR HIGH YIELD SHORT TERM
NOTES
VALUE (IN EUR)
Number of Shares Outstanding (at the end of the exercice)
- A 190,086.186
- B 174,137.377
- E 164,050.909
- F 1,155,568.332
- F CHF 1,600.000
- J 2,525.153
- L 4,083.403
- M 118,700.939
- N 93,541.789
- P 114,888.000
- V 837.387
- W 84,253.892
Net Asset Value per Share (at the end of the exercice)
- A 108.22 - B 135.25 - E 112.59 - F 140.34 - F CHF 151.48 - J 25,094.22 - L 133.17 - M 109.22 - N 136.34 - P 145.81 - V 109.70 - W 138.51

DPAM L
Statement of net assets as at 31 December 2020
anying notes form an integral part of these Financial Statements
37
DPAM L PATRIMONIAL FUND
NOTES
VALUE (IN EUR)
Assets
Investments in securities 1a 188,771,834.60 Cash at banks 5,772,131.18 Interest receivable on cash account 0.00 Interest receivable on bonds 1,009,104.04 Dividends receivable on shares 2,755.94 Amounts receivable on subscriptions 0.00 Amounts receivable on investment sold 0.00 Amounts receivable on spot exchange contracts 0.00 Unrealised gain on forward exchange contracts 9 0.00 Amounts receivable from the broker on futures 0.00 Unrealised gains on IRS 11 0.00 Futures guaranty deposit 10 1,073,801.41
Collateral on OTC derivatives 9,11 0.00 Total Assets 196,629,627.17
Liabilities
Taxes and Expenses payable 3 405,009.89 Overdraft at banks 0.00 Overdraft interest 2,116.11 Interest payable on CDS 0.00 Amounts payable on redemptions 25,348.00 Amounts payable on purchases of investments 0.00 Amounts payable on spot exchange contracts 0.00 Amounts payable on IRS 0.00 Unrealised Loss on Forward Exchange Contracts 9 25,890.05 Amounts payable to the broker on futures 0.02 Unrealised Loss on IRS 11 0.00 Unrealised loss on CDS 11 0.00 Total Liabilities 458,364.07
Net assets at the end of the year 196,171,263.10
Number of Shares Outstanding (at the end of the exercice)
- A 1,251,223.569
- B 265,325.490
- E 1,971.381
- F 54,328.432
- M 56,692.693
- N 38,932.667
Net Asset Value per Share (at the end of the exercice)
- A 113.81 - B 129.85 - E 122.12 - F 136.72 - M 115.26 - N 131.45

DPAM L
Statement of net assets as at 31 December 2020
anying notes form an integral part of these Financial Statements
38
DPAM L BONDS EMERGING MARKETS SUSTAINABLE
NOTES
VALUE (IN EUR)
Assets
Investments in securities 1a 2,577,065,056.28 Cash at banks 76,273,236.42 Interest receivable on cash account 6,632.81 Interest receivable on bonds 38,998,115.61 Dividends receivable on shares 0.00 Amounts receivable on subscriptions 1,492,595.26 Amounts receivable on investment sold 0.00 Amounts receivable on spot exchange contracts 0.00 Unrealised gain on forward exchange contracts 9 0.00 Amounts receivable from the broker on futures 0.08 Unrealised gains on IRS 11 5,853.93 Futures guaranty deposit 10 669,632.03
Collateral on OTC derivatives 9,11 2,100,000.00 Total Assets 2,696,611,122.42
Liabilities
Taxes and Expenses payable 3 3,084,313.48 Overdraft at banks 0.00 Overdraft interest 44,405.22 Interest payable on CDS 0.00 Amounts payable on redemptions 506,760.38 Amounts payable on purchases of investments 5,915,710.69 Amounts payable on spot exchange contracts 0.00 Amounts payable on IRS 8,143.72 Unrealised Loss on Forward Exchange Contracts 9 2,580,402.48 Amounts payable to the broker on futures 0.00 Unrealised Loss on IRS 11 94,109.99 Unrealised loss on CDS 11 0.00 Total Liabilities 12,233,845.96
Net assets at the end of the year 2,684,377,276.46

DPAM L
Statement of net assets as at 31 December 2020
anying notes form an integral part of these Financial Statements
39
DPAM L BONDS EMERGING MARKETS SUSTAINABLE
NOTES
VALUE (IN EUR)
Number of Shares Outstanding (at the end of the exercice)
- A 867,376.343
- B 1,457,195.298
- B CHF 1,531.268
- B USD 148,192.613
- E 2,604,321.632
- F 8,539,804.227
- F CHF 96,019.984
- F USD 2,320,698.168
- J 8,874.809
- L 22,217.525
- M 374,217.920
- N 30,551.607
- N USD 169,189.252
- P 492,513.000
- V 149,315.000
- W 1,816,805.692
- W CHF 7,365.000
- W USD 485,459.126
Net Asset Value per Share (at the end of the exercice)
- A 98.07 - B 131.52 - B CHF 139.37 - B USD 123.61 - E 101.69 - F 137.13 - F CHF 148.07 - F USD 133.21 - J 27,481.08 - L 129.51 - M 99.30 - N 133.14 - N USD 124.62 - P 142.09 - V 109.10 - W 136.92 - W CHF 140.57 - W USD 124.85

DPAM L
Statement of net assets as at 31 December 2020
anying notes form an integral part of these Financial Statements
40
DPAM L BONDS EUR CORPORATE HIGH YIELD
NOTES
VALUE (IN EUR)
Assets
Investments in securities 1a 429,774,054.28 Cash at banks 1,107,260.67 Interest receivable on cash account 0.00 Interest receivable on bonds 5,024,161.35 Dividends receivable on shares 0.00 Amounts receivable on subscriptions 398,501.60 Amounts receivable on investment sold 0.00 Amounts receivable on spot exchange contracts 0.00 Unrealised gain on forward exchange contracts 9 0.00 Amounts receivable from the broker on futures 0.00 Unrealised gains on IRS 11 0.00 Futures guaranty deposit 10 0.00
Collateral on OTC derivatives 9,11 3,300,000.00 Total Assets 439,603,977.90
Liabilities
Taxes and Expenses payable 3 600,573.71 Overdraft at banks 0.00 Overdraft interest 861.35 Interest payable on CDS 0.00 Amounts payable on redemptions 700,396.85 Amounts payable on purchases of investments 0.00 Amounts payable on spot exchange contracts 0.00 Amounts payable on IRS 0.00 Unrealised Loss on Forward Exchange Contracts 9 0.00 Amounts payable to the broker on futures 0.00 Unrealised Loss on IRS 11 0.00 Unrealised loss on CDS 11 0.00 Total Liabilities 1,301,831.91

DPAM L
Statement of net assets as at 31 December 2020
anying notes form an integral part of these Financial Statements
41
DPAM L BONDS EUR CORPORATE HIGH YIELD
NOTES
VALUE (IN EUR)
Net assets at the end of the year 438,302,145.99
Number of Shares Outstanding (at the end of the exercice)
- A 126,082.857
- B 142,745.169
- E 56,732.841
- F 1,467,378.404
- J 3,417.000
- L 205.141
- M 156,165.860
- N 120.000
- P 88,266.767
- V 304,621.000
- W 40,939.313
Net Asset Value per Share (at the end of the exercice)
- A 124.22 - B 146.88 - E 147.21 - F 151.81 - J 28,278.73 - L 106.75 - M 125.93 - N 135.37 - P 159.70 - V 111.72 - W 149.07

DPAM L
Statement of net assets as at 31 December 2020
anying notes form an integral part of these Financial Statements
42
DPAM L GLOBAL TARGET INCOME
NOTES
VALUE (IN EUR)
Assets
Investments in securities 1a 64,664,313.82 Cash at banks 3,581,278.31 Interest receivable on cash account 0.00 Interest receivable on bonds 0.00 Dividends receivable on shares 0.00 Amounts receivable on subscriptions 0.00 Amounts receivable on investment sold 0.00 Amounts receivable on spot exchange contracts 0.00 Unrealised gain on forward exchange contracts 9 0.00 Amounts receivable from the broker on futures 0.00 Unrealised gains on IRS 11 0.00 Futures guaranty deposit 10 627,338.60
Collateral on OTC derivatives 9,11 0.00 Total Assets 68,872,930.73
Liabilities
Taxes and Expenses payable 3 149,395.42 Overdraft at banks 0.00 Overdraft interest 268.03 Interest payable on CDS 0.00 Amounts payable on redemptions 16,460.93 Amounts payable on purchases of investments 0.00 Amounts payable on spot exchange contracts 0.00 Amounts payable on IRS 0.00 Unrealised Loss on Forward Exchange Contracts 9 0.00 Amounts payable to the broker on futures 0.70 Unrealised Loss on IRS 11 0.00 Unrealised loss on CDS 11 0.00 Total Liabilities 166,125.08
Net assets at the end of the year 68,706,805.65
Number of Shares Outstanding (at the end of the exercice)
- A 244,493.527
- B 39,339.417
- E 10,000.000
- F 332,575.426
- M 15,495.101
Net Asset Value per Share (at the end of the exercice)
- A 97.19 - B 116.76 - E 95.46 - F 113.86 - M 98.65

DPAM L
Statement of net assets as at 31 December 2020
anying notes form an integral part of these Financial Statements
43
DPAM L BALANCED CONSERVATIVE SUSTAINABLE
NOTES
VALUE (IN EUR)
Assets
Investments in securities 1a 54,602,106.63 Cash at banks 2,657,408.73 Interest receivable on cash account 0.00 Interest receivable on bonds 182,565.13 Dividends receivable on shares 7,175.58 Amounts receivable on subscriptions 0.00 Amounts receivable on investment sold 0.00 Amounts receivable on spot exchange contracts 0.00 Unrealised gain on forward exchange contracts 9 0.00 Amounts receivable from the broker on futures 0.00 Unrealised gains on IRS 11 0.00 Futures guaranty deposit 10 0.00
Collateral on OTC derivatives 9,11 0.00 Total Assets 57,449,256.07
Liabilities
Taxes and Expenses payable 3 184,888.02 Overdraft at banks 0.00 Overdraft interest 797.63 Interest payable on CDS 0.00 Amounts payable on redemptions 0.00 Amounts payable on purchases of investments 0.00 Amounts payable on spot exchange contracts 0.00 Amounts payable on IRS 0.00 Unrealised Loss on Forward Exchange Contracts 9 0.00 Amounts payable to the broker on futures 0.00 Unrealised Loss on IRS 11 0.00 Unrealised loss on CDS 11 0.00 Total Liabilities 185,685.65
Net assets at the end of the year 57,263,570.42
Number of Shares Outstanding (at the end of the exercice)
- A 66,470.104
- B 245,662.983
- F 340.843
- V 12,674.369
- W 1,408.649
Net Asset Value per Share (at the end of the exercice)
- A 115.82 - B 153.76 - F 29,606.64 - V 116.90 - W 155.16

DPAM L
Statement of net assets as at 31 December 2020
anying notes form an integral part of these Financial Statements
44
DPAM L BONDS CLIMATE TRENDS SUSTAINABLE
NOTES
VALUE (IN EUR)
Assets
Investments in securities 1a 155,982,404.04 Cash at banks 4,156,981.51 Interest receivable on cash account 0.00 Interest receivable on bonds 887,508.34 Dividends receivable on shares 0.00 Amounts receivable on subscriptions 1,358,394.27 Amounts receivable on investment sold 0.00 Amounts receivable on spot exchange contracts 0.00 Unrealised gain on forward exchange contracts 9 0.00 Amounts receivable from the broker on futures 0.00 Unrealised gains on IRS 11 0.00 Futures guaranty deposit 10 82,190.50
Collateral on OTC derivatives 9,11 0.00 Total Assets 162,467,478.66
Liabilities
Taxes and Expenses payable 3 128,077.72 Overdraft at banks 0.00 Overdraft interest 1,063.08 Interest payable on CDS 0.00 Amounts payable on redemptions 75.53 Amounts payable on purchases of investments 0.00 Amounts payable on spot exchange contracts 0.00 Amounts payable on IRS 0.00 Unrealised Loss on Forward Exchange Contracts 9 0.00 Amounts payable to the broker on futures 0.00 Unrealised Loss on IRS 11 0.00 Unrealised loss on CDS 11 0.00 Total Liabilities 129,216.33
Net assets at the end of the year 162,338,262.33
Number of Shares Outstanding (at the end of the exercice)
- A 3,000.000
- B 4,373.258
- F 38,839.515
- J 4,361.000
- M 51,674.000
- P 1,000.000
- W 107,201.175
Net Asset Value per Share (at the end of the exercice)
- A 103.92 - B 103.83 - F 104.62 - J 26,232.56 - M 104.54 - P 26,312.20 - W 106.30

DPAM L
Statement of net assets as at 31 December 2020
anying notes form an integral part of these Financial Statements
45
DPAM L BONDS GOVERNMENT SUSTAINABLE
NOTES
VALUE (IN EUR)
Assets
Investments in securities 1a 85,616,717.37 Cash at banks 1,360,082.65 Interest receivable on cash account 0.00 Interest receivable on bonds 387,499.48 Dividends receivable on shares 0.00 Amounts receivable on subscriptions 1,148,399.91 Amounts receivable on investment sold 0.00 Amounts receivable on spot exchange contracts 0.00 Unrealised gain on forward exchange contracts 9 0.00 Amounts receivable from the broker on futures 0.00 Unrealised gains on IRS 11 0.00 Futures guaranty deposit 10 65,682.81
Collateral on OTC derivatives 9,11 0.00 Total Assets 88,578,382.22
Liabilities
Taxes and Expenses payable 3 56,337.75 Overdraft at banks 0.00 Overdraft interest 382.54 Interest payable on CDS 0.00 Amounts payable on redemptions 0.00 Amounts payable on purchases of investments 1,122,393.59 Amounts payable on spot exchange contracts 0.00 Amounts payable on IRS 0.00 Unrealised Loss on Forward Exchange Contracts 9 460,663.40 Amounts payable to the broker on futures 0.00 Unrealised Loss on IRS 11 0.00 Unrealised loss on CDS 11 0.00 Total Liabilities 1,639,777.28
Net assets at the end of the year 86,938,604.94
Number of Shares Outstanding (at the end of the exercice)
- B 950.000
- F 86,742.805
- J 3,093.000
- M 2,315.000
- P
Net Asset Value per Share (at the end of the exercice)
- B 99.88 - F 100.63 - J 25,180.37 - M 100.08 - P

DPAM L
Statement of net assets as at 31 December 2020
anying notes form an integral part of these Financial Statements
46
DPAM L CONVERTIBLE WORLD SUSTAINABLE
NOTES
VALUE (IN EUR)
Assets
Investments in securities 1a 27,375,107.66 Cash at banks 943,363.71 Interest receivable on cash account 0.00 Interest receivable on bonds 35,706.36 Dividends receivable on shares 0.00 Amounts receivable on subscriptions 0.00 Amounts receivable on investment sold 0.00 Amounts receivable on spot exchange contracts 0.00 Unrealised gain on forward exchange contracts 9 342,031.28 Amounts receivable from the broker on futures 0.00 Unrealised gains on IRS 11 0.00 Futures guaranty deposit 10 205,869.64
Collateral on OTC derivatives 9,11 0.00 Total Assets 28,902,078.65
Liabilities
Taxes and Expenses payable 3 24,204.70 Overdraft at banks 0.00 Overdraft interest 313.65 Interest payable on CDS 0.00 Amounts payable on redemptions 0.00 Amounts payable on purchases of investments 0.00 Amounts payable on spot exchange contracts 0.00 Amounts payable on IRS 0.00 Unrealised Loss on Forward Exchange Contracts 9 0.00 Amounts payable to the broker on futures 10,069.07 Unrealised Loss on IRS 11 0.00 Unrealised loss on CDS 11 0.00 Total Liabilities 34,587.42
Net assets at the end of the year 28,867,491.23
Number of Shares Outstanding (at the end of the exercice)
- B 100,000.000
- F 91,700.000
- P 330.000
Net Asset Value per Share (at the end of the exercice)
- B 101.93 - F 108.10 - P 26,552.74

DPAM L
Statement of Operations and Changes in Net Assets
from 1 January 2020 to the 31 December 2020
The accompanying notes form an integral part of these Financial Statements
47
Statement of Operations and Cha nges in Net Assets from 1 January 2020 to the 3 1 Dece mber 2020
Statement of O perations and C hanges in Net Asset s from 1 January 2020 to the 31 December 2020
The accompanying notes for m an integral part of these Financial State ments
DPAM L LIQUIDITY EUR &FRN (liquidated on 7 December 2020)
NOTES
VALUE (IN EUR)
Income Dividends 1e 0.00 Interest on bonds 1e 36,339.75 Interest on IRS 0.00 Dividends on CDS 0.00 Interest on cash accounts 104.47 Commission on subscriptions and redemptions 4,8 608.00 Tax claim 0.00 Other income 0.00 Total Income 37,052.22
Expenses Performance fee 5 0.00 Management Fee 5 21,803.12 Depositary fees 3,900.93 Subscription tax 6 4,408.02 Administration fees 44,885.01 Miscellaneous fees 41,351.35 Transaction fees 5,056.92 Interest on IRS 0.00 Interest expenses on CDS 0.00 Overdraft interest 4,366.60 Taxes paid to foreign authorities 5,673.77 Total Expenses 131,445.72 Net Profit / (Loss) -94,393.50
Net Realised Profit / (Loss) - on investments 1b 48,867.25 - on currencies 0.00 - on forward exchange contracts 0.00 - on futures 0.00 - on IRS and CDS 0.00
Total Net Realised Profit / (Loss) -45,526.25 Change in Net Unrealised Appreciation or Depreciation
- on investments 1d -84,647.25 - on forward exchange contracts 0.00 - on futures 0.00 - on IRS and CDS 0.00
Result of operations -130,173.50
- Subscriptions 1,903,280.92
- Redemptions -24,314,222.72
Dividends paid 12 0.00 Net changes in Net Assets -22,541,115.30 Net assets at the beginning of the year 22,541,115.30 Net assets at the end of the year 0.00

DPAM L
Statement of Operations and Changes in Net Assets
from 1 January 2020 to the 31 December 2020
The accompanying notes form an integral part of these Financial Statements
48
DPAM L BONDS EUR QUALITY SUSTAINABLE
NOTES
VALUE (IN EUR)
Income Dividends 1e 0.00 Interest on bonds 1e 18,155,493.54 Interest on IRS 0.00 Dividends on CDS 923,691.03 Interest on cash accounts 0.00 Commission on subscriptions and redemptions 4, 8 286,207.96 Tax claim 0.00 Other income 0.00 Total Income 19,365,392.53
Expenses Performance fee 5 0.00 Management Fee 5 2,291,156.59 Depositary fees 296,442.39 Subscription tax 6 209,788.18 Administration fees 1,253,562.25 Miscellaneous fees 166,653.29 Transaction fees 281,318.07 Interest on IRS 0.00 Interest expenses on CDS 1,199,443.12 Overdraft interest 169,295.56 Taxes paid to foreign authorities 11,621.78 Total Expenses 5,879,281.23 Net Profit / (Loss) 13,486,111.30
Net Realised Profit / (Loss) - on investments 1b 6,922,565.34 - on currencies 0.00 - on forward exchange contracts 0.00 - on futures -6,021,160.00 - on IRS and CDS 2,229,348.38
Total Net Realised Profit / (Loss) 16,616,865.02 Change in Net Unrealised Appreciation or Depreciation
- on investments 1d 27,109,849.75 - on forward exchange contracts 0.00 - on futures -1,693,020.00 - on IRS and CDS 171,535.00
Result of operations 42,205,229.77
- Subscriptions 505,634,652.42
- Redemptions -192,148,980.85
Dividends paid 12 -694,613.52 Net changes in Net Assets 354,996,287.82 Net assets at the beginning of the year 1,098,285,247.17 Net assets at the end of the year 1,453,281,534.99

DPAM L
Statement of Operations and Changes in Net Assets
from 1 January 2020 to the 31 December 2020
The accompanying notes form an integral part of these Financial Statements
49
DPAM L BONDS UNIVERSALIS UNCONSTRAINED
NOTES
VALUE (IN EUR)
Income Dividends 1e 0.00 Interest on bonds 1e 18,838,150.48 Interest on IRS 0.00 Dividends on CDS 967,604.13 Interest on cash accounts 0.00 Commission on subscriptions and redemptions 4, 8 0.00 Tax claim 0.00 Other income 0.00 Total Income 19,805,754.61
Expenses Performance fee 5 0.00 Management Fee 5 3,749,619.74 Depositary fees 250,934.24 Subscription tax 6 266,746.13 Administration fees 1,189,890.96 Miscellaneous fees 150,345.90 Transaction fees 218,974.51 Interest on IRS 0.00 Interest expenses on CDS 2,408,424.16 Overdraft interest 122,995.25 Taxes paid to foreign authorities 10,894.63 Total Expenses 8,368,825.52 Net Profit / (Loss) 11,436,929.09
Net Realised Profit / (Loss) - on investments 1b 7,615,688.98 - on currencies 392,485.31 - on forward exchange contracts 34,464.14 - on futures -17,437,841.95 - on IRS and CDS 17,078,122.72
Total Net Realised Profit / (Loss) 19,119,848.29 Change in Net Unrealised Appreciation or Depreciation
- on investments 1d 15,851,717.53 - on forward exchange contracts 0.00 - on futures -7,154,198.13 - on IRS and CDS -3,187,996.00
Result of operations 24,629,371.69
- Subscriptions 445,589,141.15
- Redemptions -184,685,716.14
Dividends paid 12 -1,486,535.43 Net changes in Net Assets 284,046,261.27 Net assets at the beginning of the year 953,418,774.25 Net assets at the end of the year 1,237,465,035.52

DPAM L
Statement of Operations and Changes in Net Assets
from 1 January 2020 to the 31 December 2020
The accompanying notes form an integral part of these Financial Statements
50
DPAM L BONDS HIGHER YIELD
NOTES
VALUE (IN EUR)
Income Dividends 1e 0.00 Interest on bonds 1e 7,851,041.69 Interest on IRS 0.00 Dividends on CDS 422,222.29 Interest on cash accounts 3,346.92 Commission on subscriptions and redemptions 4, 8 120,634.14 Tax claim 0.00 Other income 0.00 Total Income 8,397,245.04
Expenses Performance fee 5 0.00 Management Fee 5 1,150,217.60 Depositary fees 41,586.62 Subscription tax 6 130,347.17 Administration fees 272,191.27 Miscellaneous fees 61,829.91 Transaction fees 128,721.18 Interest on IRS 0.00 Interest expenses on CDS 1,250,694.39 Overdraft interest 31,563.04 Taxes paid to foreign authorities 6,308.29 Total Expenses 3,073,459.47 Net Profit / (Loss) 5,323,785.57
Net Realised Profit / (Loss) - on investments 1b -2,883,141.36 - on currencies -1,061,849.25 - on forward exchange contracts 1,326,542.03 - on futures 76,950.00 - on IRS and CDS 4,085,980.00
Total Net Realised Profit / (Loss) 6,868,266.99 Change in Net Unrealised Appreciation or Depreciation
- on investments 1d -414,612.15 - on forward exchange contracts 308,147.37 - on futures -199,300.00 - on IRS and CDS 0.00
Result of operations 6,562,502.21
- Subscriptions 70,843,011.33
- Redemptions -50,973,782.65
Dividends paid 12 -3,762,798.84 Net changes in Net Assets 22,668,932.05 Net assets at the beginning of the year 180,673,248.02 Net assets at the end of the year 203,342,180.07

DPAM L
Statement of Operations and Changes in Net Assets
from 1 January 2020 to the 31 December 2020
The accompanying notes form an integral part of these Financial Statements
51
DPAM L BONDS GOVERNMENT SUSTAINABLE HEDGED
NOTES
VALUE (IN EUR)
Income Dividends 1e 0.00 Interest on bonds 1e 9,274,271.33 Interest on IRS 0.00 Dividends on CDS 0.00 Interest on cash accounts 1,321.89 Commission on subscriptions and redemptions 4, 8 99,063.18 Tax claim 0.00 Other income 0.00 Total Income 9,374,656.40
Expenses Performance fee 5 0.00 Management Fee 5 1,270,329.99 Depositary fees 160,682.75 Subscription tax 6 101,786.95 Administration fees 860,011.88 Miscellaneous fees 69,842.50 Transaction fees 85,192.96 Interest on IRS 0.00 Interest expenses on CDS 0.00 Overdraft interest 73,098.96 Taxes paid to foreign authorities 6,546.62 Total Expenses 2,627,492.61 Net Profit / (Loss) 6,747,163.79
Net Realised Profit / (Loss) - on investments 1b 4,021,412.59 - on currencies 716,711.57 - on forward exchange contracts 9,375,219.61 - on futures -1,130,000.74 - on IRS and CDS 0.00
Total Net Realised Profit / (Loss) 19,730,506.82 Change in Net Unrealised Appreciation or Depreciation
- on investments 1d 7,024,543.86 - on forward exchange contracts -7,547,081.25 - on futures -232,350.00 - on IRS and CDS 0.00
Result of operations 18,975,619.43
- Subscriptions 536,954,707.75
- Redemptions -325,902,632.03
Dividends paid 12 0.00 Net changes in Net Assets 230,027,695.15 Net assets at the beginning of the year 562,120,308.41 Net assets at the end of the year 792,148,003.56

DPAM L
Statement of Operations and Changes in Net Assets
from 1 January 2020 to the 31 December 2020
The accompanying notes form an integral part of these Financial Statements
52
DPAM L EQUITIES CONVICTION RESEARCH
NOTES
VALUE (IN EUR)
Income Dividends 1e 5,302,244.04 Interest on bonds 1e 0.00 Interest on IRS 0.00 Dividends on CDS 0.00 Interest on cash accounts 10.89 Commission on subscriptions and redemptions 4, 8 0.00 Tax claim 2,690.00 Other income 0.00 Total Income 5,304,944.93
Expenses Performance fee 5 1,407,597.97 Management Fee 5 827,238.55 Depositary fees 70,549.34 Subscription tax 6 61,790.34 Administration fees 350,658.85 Miscellaneous fees 41,607.26 Transaction fees 510,576.31 Interest on IRS 0.00 Interest expenses on CDS 0.00 Overdraft interest 40,568.67 Taxes paid to foreign authorities 7,277.32 Total Expenses 3,317,864.61 Net Profit / (Loss) 1,987,080.32
Net Realised Profit / (Loss) - on investments 1b -5,925,713.66 - on currencies 23,575.06 - on forward exchange contracts 0.00 - on futures 0.00 - on IRS and CDS 0.00
Total Net Realised Profit / (Loss) -3,915,058.28 Change in Net Unrealised Appreciation or Depreciation
- on investments 1d 10,838,798.99 - on forward exchange contracts 0.00 - on futures 0.00 - on IRS and CDS 0.00
Result of operations 6,923,740.71
- Subscriptions 64,981,588.25
- Redemptions -20,604,899.91
Dividends paid 12 -726,982.00 Net changes in Net Assets 50,573,447.05 Net assets at the beginning of the year 277,846,817.78 Net assets at the end of the year 328,420,264.83

DPAM L
Statement of Operations and Changes in Net Assets
from 1 January 2020 to the 31 December 2020
The accompanying notes form an integral part of these Financial Statements
53
DPAM L BONDS EUR HIGH YIELD SHORT TERM
NOTES
VALUE (IN EUR)
Income Dividends 1e 0.00 Interest on bonds 1e 12,980,424.18 Interest on IRS 0.00 Dividends on CDS 0.00 Interest on cash accounts 3.29 Commission on subscriptions and redemptions 4, 8 1,062,498.09 Tax claim 0.00 Other income 0.00 Total Income 14,042,925.56
Expenses Performance fee 5 0.00 Management Fee 5 1,189,395.83 Depositary fees 90,456.53 Subscription tax 6 59,289.62 Administration fees 563,782.33 Miscellaneous fees 62,173.76 Transaction fees 155,337.50 Interest on IRS 0.00 Interest expenses on CDS 0.00 Overdraft interest 31,111.36 Taxes paid to foreign authorities 7,541.47 Total Expenses 2,159,088.40 Net Profit / (Loss) 11,883,837.16
Net Realised Profit / (Loss) - on investments 1b -32,122,637.83 - on currencies 42.73 - on forward exchange contracts -112.60 - on futures 0.00 - on IRS and CDS 0.00
Total Net Realised Profit / (Loss) -20,238,870.54 Change in Net Unrealised Appreciation or Depreciation
- on investments 1d 5,780,966.85 - on forward exchange contracts 0.00 - on futures 0.00 - on IRS and CDS 0.00
Result of operations -14,457,903.69
- Subscriptions 141,655,444.09
- Redemptions -306,646,697.47
Dividends paid 12 -806,487.83 Net changes in Net Assets -180,255,644.90 Net assets at the beginning of the year 523,387,425.04 Net assets at the end of the year 343,131,780.14

DPAM L
Statement of Operations and Changes in Net Assets
from 1 January 2020 to the 31 December 2020
The accompanying notes form an integral part of these Financial Statements
54
DPAM L PATRIMONIAL FUND
NOTES
VALUE (IN EUR)
Income Dividends 1e 167,239.26 Interest on bonds 1e 1,145,358.50 Interest on IRS 0.00 Dividends on CDS 0.00 Interest on cash accounts 5,042.11 Commission on subscriptions and redemptions 4, 8 0.00 Tax claim 0.00 Other income 3,965.03 Total Income 1,321,604.90
Expenses Performance fee 5 236,726.48 Management Fee 5 772,734.19 Depositary fees 20,869.57 Subscription tax 6 133,436.71 Administration fees 301,561.68 Miscellaneous fees 23,075.93 Transaction fees 113,080.67 Interest on IRS 0.00 Interest expenses on CDS 0.00 Overdraft interest 29,575.93 Taxes paid to foreign authorities 5,841.29 Total Expenses 1,636,902.45 Net Profit / (Loss) -315,297.55
Net Realised Profit / (Loss) - on investments 1b 540,106.73 - on currencies -101,158.41 - on forward exchange contracts 1,170,076.97 - on futures 2,553,166.18 - on IRS and CDS 0.00
Total Net Realised Profit / (Loss) 3,846,893.92 Change in Net Unrealised Appreciation or Depreciation
- on investments 1d -3,999,304.81 - on forward exchange contracts -47,298.73 - on futures 182,266.37 - on IRS and CDS 0.00
Result of operations -17,443.25
- Subscriptions 139,457,016.05
- Redemptions -45,351,966.29
Dividends paid 12 -435,653.63 Net changes in Net Assets 93,651,952.88 Net assets at the beginning of the year 102,519,310.22 Net assets at the end of the year 196,171,263.10

DPAM L
Statement of Operations and Changes in Net Assets
from 1 January 2020 to the 31 December 2020
The accompanying notes form an integral part of these Financial Statements
55
DPAM L BONDS EMERGING MARKETS SUSTAINABLE
NOTES
VALUE (IN EUR)
Income Dividends 1e 0.00 Interest on bonds 1e 96,490,728.95 Interest on IRS 133,687.79 Dividends on CDS 0.00 Interest on cash accounts 500,927.29 Commission on subscriptions and redemptions 4, 8 284,124.23 Tax claim 118,389.40 Other income 0.00 Total Income 97,527,857.66
Expenses Performance fee 5 0.00 Management Fee 5 7,948,123.99 Depositary fees 446,638.02 Subscription tax 6 394,030.73 Administration fees 2,255,875.26 Miscellaneous fees 348,089.61 Transaction fees 2,578,517.40 Interest on IRS 41,141.09 Interest expenses on CDS 0.00 Overdraft interest 694,803.02 Taxes paid to foreign authorities 95,709.90 Total Expenses 14,802,929.02 Net Profit / (Loss) 82,724,928.64
Net Realised Profit / (Loss) - on investments 1b -55,316,330.65 - on currencies -5,014,963.74 - on forward exchange contracts -429,263.41 - on futures -5,300,251.57 - on IRS and CDS 0.00
Total Net Realised Profit / (Loss) 16,664,119.27 Change in Net Unrealised Appreciation or Depreciation
- on investments 1d -57,512,735.37 - on forward exchange contracts -982,810.86 - on futures -1,208,088.16 - on IRS and CDS -81,026.39
Result of operations -43,120,541.51
- Subscriptions 1,506,814,039.30
- Redemptions -728,836,222.56
Dividends paid 12 -16,248,651.86 Net changes in Net Assets 718,608,623.37 Net assets at the beginning of the year 1,965,768,653.09 Net assets at the end of the year 2,684,377,276.46

DPAM L
Statement of Operations and Changes in Net Assets
from 1 January 2020 to the 31 December 2020
The accompanying notes form an integral part of these Financial Statements
56
DPAM L BONDS EUR CORPORATE HIGH YIELD
NOTES
VALUE (IN EUR)
Income Dividends 1e 0.00 Interest on bonds 1e 14,710,294.99 Interest on IRS 0.00 Dividends on CDS 718,054.63 Interest on cash accounts 0.00 Commission on subscriptions and redemptions 4, 8 263,064.73 Tax claim 0.00 Other income 0.00 Total Income 15,691,414.35
Expenses Performance fee 5 0.00 Management Fee 5 1,452,135.84 Depositary fees 90,508.43 Subscription tax 6 68,522.59 Administration fees 541,732.95 Miscellaneous fees 62,099.28 Transaction fees 180,403.36 Interest on IRS 0.00 Interest expenses on CDS 765,972.04 Overdraft interest 31,865.59 Taxes paid to foreign authorities 7,237.98 Total Expenses 3,200,478.06 Net Profit / (Loss) 12,490,936.29
Net Realised Profit / (Loss) - on investments 1b -5,460,384.81 - on currencies 73.02 - on forward exchange contracts 0.00 - on futures 350.00 - on IRS and CDS 1,433,664.22
Total Net Realised Profit / (Loss) 8,464,638.72 Change in Net Unrealised Appreciation or Depreciation
- on investments 1d 2,739,752.00 - on forward exchange contracts 0.00 - on futures -62,750.00 - on IRS and CDS 0.00
Result of operations 11,141,640.72
- Subscriptions 274,301,678.33
- Redemptions -182,796,920.24
Dividends paid 12 -1,226,377.60 Net changes in Net Assets 101,420,021.21 Net assets at the beginning of the year 336,882,124.78 Net assets at the end of the year 438,302,145.99

DPAM L
Statement of Operations and Changes in Net Assets
from 1 January 2020 to the 31 December 2020
The accompanying notes form an integral part of these Financial Statements
57
DPAM L GLOBAL TARGET INCOME
NOTES
VALUE (IN EUR)
Income Dividends 1e 0.00 Interest on bonds 1e 0.00 Interest on IRS 0.00 Dividends on CDS 0.00 Interest on cash accounts 3,174.96 Commission on subscriptions and redemptions 4, 8 0.00 Tax claim 0.00 Other income 0.00 Total Income 3,174.96
Expenses
Performance fee 5 0.00
Management Fee 5 446,099.97 Depositary fees 17,197.50 Subscription tax 6 2,997.62 Administration fees 117,184.48 Miscellaneous fees 31,198.60 Transaction fees 11,107.38 Interest on IRS 0.00 Interest expenses on CDS 0.00 Overdraft interest 12,700.46 Taxes paid to foreign authorities 5,788.27 Total Expenses 644,274.28 Net Profit / (Loss) -641,099.32
Net Realised Profit / (Loss) - on investments 1b -3,583,575.36 - on currencies -89,163.99 - on forward exchange contracts 7,436.05 - on futures 1,328,907.07 - on IRS and CDS 0.00
Total Net Realised Profit / (Loss) -2,977,495.55 Change in Net Unrealised Appreciation or Depreciation
- on investments 1d -1,206,427.73 - on forward exchange contracts 0.00 - on futures 316,943.05 - on IRS and CDS 0.00
Result of operations -3,866,980.23
- Subscriptions 23,544,903.71
- Redemptions -32,001,462.43
Dividends paid 12 -797,680.27 Net changes in Net Assets -13,121,219.22 Net assets at the beginning of the year 81,828,024.87 Net assets at the end of the year 68,706,805.65

DPAM L
Statement of Operations and Changes in Net Assets
from 1 January 2020 to the 31 December 2020
The accompanying notes form an integral part of these Financial Statements
58
DPAM L BONDS EUR GOVERNMENT 1-5 (liquidated on 7 December 2020)
NOTES
VALUE (IN EUR)
Income Dividends 1e 0.00 Interest on bonds 1e 231,780.86 Interest on IRS 0.00 Dividends on CDS 0.00 Interest on cash accounts 0.00 Commission on subscriptions and redemptions 4, 8 1,045.00 Tax claim 0.00 Other income 0.00 Total Income 232,825.86
Expenses Performance fee 5 0.00 Management Fee 5 7,477.86 Depositary fees 2,122.73 Subscription tax 6 2,650.87 Administration fees 37,980.74 Miscellaneous fees 35,507.11 Transaction fees 6,963.46 Interest on IRS 0.00 Interest expenses on CDS 0.00 Overdraft interest 1,756.17 Taxes paid to foreign authorities 5,439.94 Total Expenses 99,898.88 Net Profit / (Loss) 132,926.98
Net Realised Profit / (Loss) - on investments 1b -295,044.60 - on currencies 0.00 - on forward exchange contracts 0.00 - on futures 3,990.00 - on IRS and CDS 0.00
Total Net Realised Profit / (Loss) -158,127.62 Change in Net Unrealised Appreciation or Depreciation
- on investments 1d 124,916.75 - on forward exchange contracts 0.00 - on futures -1,865.00 - on IRS and CDS 0.00
Result of operations -35,075.87
- Subscriptions 6,939,987.29
- Redemptions -15,504,142.27
Dividends paid 12 0.00 Net changes in Net Assets -8,599,230.85 Net assets at the beginning of the year 8,599,230.85 Net assets at the end of the year 0.00

DPAM L
Statement of Operations and Changes in Net Assets
from 1 January 2020 to the 31 December 2020
The accompanying notes form an integral part of these Financial Statements
59
DPAM L BALANCED CONSERVATIVE SUSTAINABLE
NOTES
VALUE (IN EUR)
Income Dividends 1e 240,956.73 Interest on bonds 1e 326,804.94 Interest on IRS 0.00 Dividends on CDS 0.00 Interest on cash accounts 39.79 Commission on subscriptions and redemptions 4, 8 14,522.22 Tax claim 279.19 Other income 264.91 Total Income 582,867.78
Expenses Performance fee 5 0.00 Management Fee 5 458,308.20 Depositary fees 11,393.12 Subscription tax 6 94,107.80 Administration fees 82,263.23 Miscellaneous fees 22,236.40 Transaction fees 62,477.63 Interest on IRS 0.00 Interest expenses on CDS 0.00 Overdraft interest 8,390.04 Taxes paid to foreign authorities 5,812.14 Total Expenses 744,988.56 Net Profit / (Loss) -162,120.78
Net Realised Profit / (Loss) - on investments 1b 1,780,411.16 - on currencies -3,495.30 - on forward exchange contracts 0.00 - on futures 0.01 - on IRS and CDS 0.00
Total Net Realised Profit / (Loss) 1,614,795.09 Change in Net Unrealised Appreciation or Depreciation
- on investments 1d 1,494,565.00 - on forward exchange contracts 0.00 - on futures 0.00 - on IRS and CDS 0.00
Result of operations 3,109,360.09
- Subscriptions 19,170,361.81
- Redemptions -17,291,522.99
Dividends paid 12 -64,794.95 Net changes in Net Assets 4,923,403.96 Net assets at the beginning of the year 52,340,166.46 Net assets at the end of the year 57,263,570.42

DPAM L
Statement of Operations and Changes in Net Assets
from 1 January 2020 to the 31 December 2020
The accompanying notes form an integral part of these Financial Statements
60
DPAM L BONDS CLIMATE TRENDS SUSTAINABLE
NOTES
VALUE (IN EUR)
Income Dividends 1e 0.00 Interest on bonds 1e 1,262,028.54 Interest on IRS 0.00 Dividends on CDS 0.00 Interest on cash accounts 450.19 Commission on subscriptions and redemptions 4, 8 27,837.19 Tax claim 0.00 Other income 0.00 Total Income 1,290,315.92
Expenses Performance fee 5 0.00 Management Fee 5 143,598.92 Depositary fees 20,614.39 Subscription tax 6 13,824.32 Administration fees 135,553.56 Miscellaneous fees 13,931.72 Transaction fees 34,918.10 Interest on IRS 0.00 Interest expenses on CDS 0.00 Overdraft interest 14,267.32 Taxes paid to foreign authorities 8,841.32 Total Expenses 385,549.65 Net Profit / (Loss) 904,766.27
Net Realised Profit / (Loss) - on investments 1b 43,425.32 - on currencies -38,958.08 - on forward exchange contracts 0.00 - on futures -103,110.00 - on IRS and CDS 0.00
Total Net Realised Profit / (Loss) 806,123.51 Change in Net Unrealised Appreciation or Depreciation
- on investments 1d 3,662,448.55 - on forward exchange contracts 0.00 - on futures -24,900.00 - on IRS and CDS 0.00
Result of operations 4,443,672.06
- Subscriptions 109,494,256.40
- Redemptions -2,926,517.07
Dividends paid 12 0.00 Net changes in Net Assets 111,011,411.39 Net assets at the beginning of the year 51,326,850.94 Net assets at the end of the year 162,338,262.33
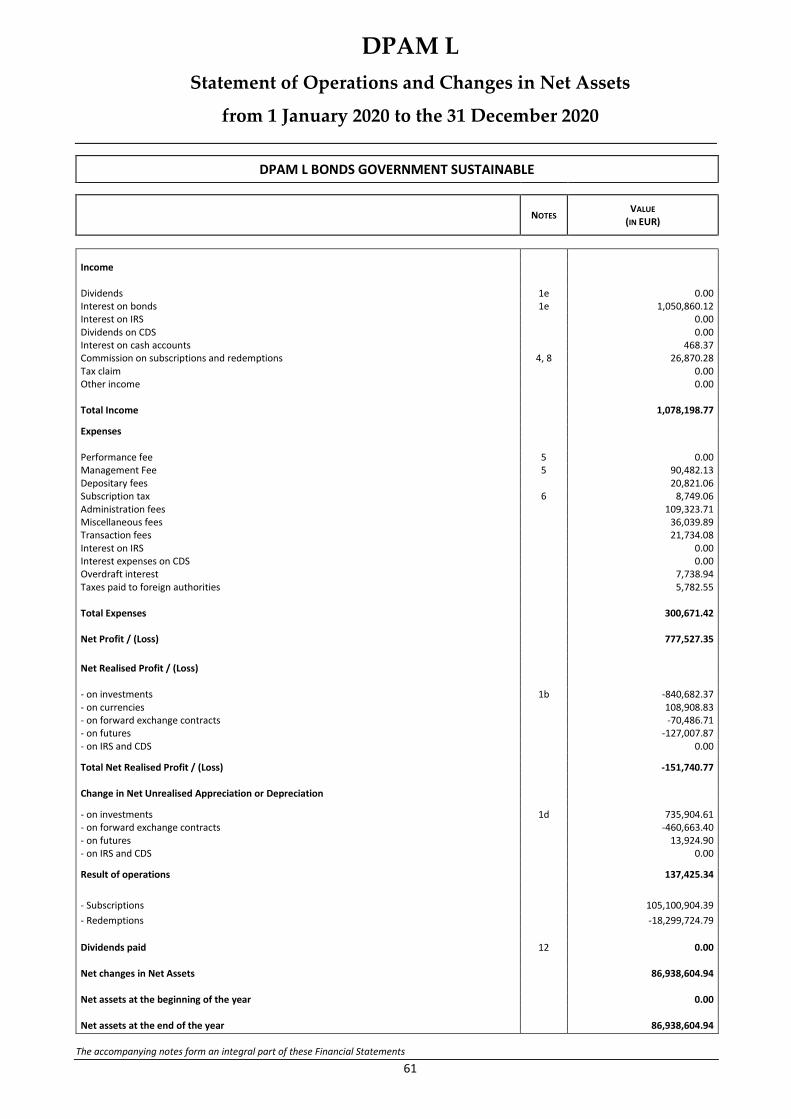
DPAM L
Statement of Operations and Changes in Net Assets
from 1 January 2020 to the 31 December 2020
The accompanying notes form an integral part of these Financial Statements
61
DPAM L BONDS GOVERNMENT SUSTAINABLE
NOTES
VALUE (IN EUR)
Income Dividends 1e 0.00 Interest on bonds 1e 1,050,860.12 Interest on IRS 0.00 Dividends on CDS 0.00 Interest on cash accounts 468.37 Commission on subscriptions and redemptions 4, 8 26,870.28 Tax claim 0.00 Other income 0.00 Total Income 1,078,198.77
Expenses Performance fee 5 0.00 Management Fee 5 90,482.13 Depositary fees 20,821.06 Subscription tax 6 8,749.06 Administration fees 109,323.71 Miscellaneous fees 36,039.89 Transaction fees 21,734.08 Interest on IRS 0.00 Interest expenses on CDS 0.00 Overdraft interest 7,738.94 Taxes paid to foreign authorities 5,782.55 Total Expenses 300,671.42 Net Profit / (Loss) 777,527.35
Net Realised Profit / (Loss) - on investments 1b -840,682.37 - on currencies 108,908.83 - on forward exchange contracts -70,486.71 - on futures -127,007.87 - on IRS and CDS 0.00
Total Net Realised Profit / (Loss) -151,740.77 Change in Net Unrealised Appreciation or Depreciation
- on investments 1d 735,904.61 - on forward exchange contracts -460,663.40 - on futures 13,924.90 - on IRS and CDS 0.00
Result of operations 137,425.34
- Subscriptions 105,100,904.39
- Redemptions -18,299,724.79
Dividends paid 12 0.00 Net changes in Net Assets 86,938,604.94 Net assets at the beginning of the year 0.00 Net assets at the end of the year 86,938,604.94

DPAM L
Statement of Operations and Changes in Net Assets
from 1 January 2020 to the 31 December 2020
The accompanying notes form an integral part of these Financial Statements
62
DPAM L CONVERTIBLE WORLD SUSTAINABLE
NOTES
VALUE (IN EUR)
Income Dividends 1e 0.00 Interest on bonds 1e 12,938.14 Interest on IRS 0.00 Dividends on CDS 0.00 Interest on cash accounts 11.82 Commission on subscriptions and redemptions 4, 8 0.00 Tax claim 0.00 Other income 0.00 Total Income 12,949.96
Expenses Performance fee 5 0.00 Management Fee 5 16,696.97 Depositary fees 848.06 Subscription tax 6 1,741.01 Administration fees 5,042.68 Miscellaneous fees 1,990.97 Transaction fees 21,793.01 Interest on IRS 0.00 Interest expenses on CDS 0.00 Overdraft interest 1,894.48 Taxes paid to foreign authorities 2,600.00 Total Expenses 52,607.18 Net Profit / (Loss) -39,657.22
Net Realised Profit / (Loss) - on investments 1b 208,049.39 - on currencies 10,294.22 - on forward exchange contracts -557.87 - on futures 119,931.45 - on IRS and CDS 0.00
Total Net Realised Profit / (Loss) 298,059.97 Change in Net Unrealised Appreciation or Depreciation
- on investments 1d 782,997.47 - on forward exchange contracts 342,031.28 - on futures -90,719.79 - on IRS and CDS 0.00
Result of operations 1,332,368.93
- Subscriptions 29,136,931.80
- Redemptions -1,601,809.50
Dividends paid 12 0.00 Net changes in Net Assets 28,867,491.23 Net assets at the beginning of the year 0.00 Net assets at the end of the year 28,867,491.23

DPAM L
Securities portfolio statement as at 31 December 2020
The accompanying notes form an integral part of these Financial Statements
63
Securities port folio state ment as at 31 De ce mber 2 020
The accompanying notes for m an integral part of these Financial State ments
DPAM L BONDS EUR QUALITY SUSTAINABLE
Investment Quantity CCY Cost
(in EUR) Evaluation value
(in EUR)
% Total Net
Assets
Transferable securities admitted to an official stock exchange or dealt in on another regulated market
Bonds
ABBOTT IRELAND FINANCE 0,375 19-191127 2,500,000 EUR 2,481,400.00 2,569,012.50 0.18%
ABBOTT IRELAND FINANCE 0,875 18-270923 1,500,000 EUR 1,498,680.00 1,546,072.50 0.11%
ABBOTT IRELAND FINANCE 1,50 18-270926 4,000,000 EUR 3,997,910.00 4,351,620.00 0.30%
AB INBEV 2,875 20-020432 8,000,000 EUR 9,006,969.99 10,052,520.00 0.69%
ACTIVIDADES DE CONSTRUCCION Y SERVICIOS 1,375 20-170625 1,500,000 EUR 1,499,205.00 1,540,987.50 0.11%
ADIDAS A.G. 0,00 20-051028 1,000,000 EUR 994,100.00 1,008,550.00 0.07%
AEROPORTS DE PARIS 1,00 20-050129 3,000,000 EUR 2,936,040.00 3,190,320.00 0.22%
AGEAS N.V. FRN 20-241151 4,000,000 EUR 3,985,040.00 4,070,200.00 0.28%
AHOLD DELHAIZE N.V. 1,125 18-190326 4,000,000 EUR 4,086,140.00 4,260,700.00 0.29%
AIR LIQUIDE FINANCE 0,625 19-200630 2,200,000 EUR 2,177,736.00 2,337,511.00 0.16%
AIR LIQUIDE FINANCE 1,875 14-050624 2,000,000 EUR 2,042,072.68 2,150,660.00 0.15%
AIR PRODUCTS & CHEMICALS INC. 0,50 20-050528 1,300,000 EUR 1,295,125.00 1,346,852.00 0.09%
AKELIUS RESIDENTIAL 1,125 20-110129 1,000,000 EUR 998,610.00 1,034,345.00 0.07%
AKELIUS RESIDENTIAL PROPERTY 1,125 17-141124 1,500,000 EUR 1,477,500.00 1,545,360.00 0.11%
AKZO NOBEL N.V. 1,625 20-140430 1,000,000 EUR 993,970.00 1,130,720.00 0.08%
ALLIANDER N.V. 0,375 20-100630 1,500,000 EUR 1,496,775.00 1,551,562.50 0.11%
ALLIANDER N.V. FRN 18-PERPETUAL 2,400,000 EUR 2,379,456.00 2,536,296.00 0.17%
ALLIANZ SE 3,099 17-060747 2,000,000 EUR 2,048,485.45 2,315,800.00 0.16%
ALLIANZ SE FRN 12-171042 1,000,000 EUR 1,200,800.00 1,099,620.00 0.08%
ALLIANZ SE FRN 15-070745 3,000,000 EUR 3,035,130.00 3,237,930.00 0.22%
ALLIANZ SE FRN 19-250949 2,000,000 EUR 1,992,290.00 2,072,290.00 0.14%
AMERICA MOBIL SAB DE CV 1,50 16-100324 2,000,000 EUR 2,063,400.00 2,096,560.00 0.14%
AMERICA MOVIL S.A.B. DE CV 0,75 19-260627 8,000,000 EUR 7,952,209.99 8,251,560.00 0.57%
AMERICA MOVIL S.A.B. DE CV 2,125 16-100328 7,000,000 EUR 7,927,429.78 7,933,030.00 0.55%
AMERICA MOVIL S.A.B. DE CV FRN 13-060973 9,800,000 EUR 11,397,688.41 11,267,060.00 0.78%
AMERICAN HONDA FINANCE 1,95 20-181024 2,000,000 EUR 1,997,360.00 2,152,350.00 0.15%
ANHEUSER BUSCH INBEV 1,15 18-220127 2,000,000 EUR 1,994,266.00 2,136,390.00 0.15%
ANHEUSER BUSCH INBEV 1,65 19-280331 3,000,000 EUR 2,984,490.00 3,378,705.00 0.23%
ANHEUSER BUSCH INBEV 2,75 16-170336 4,000,000 EUR 4,196,345.00 5,051,140.00 0.35%
ANZ BANKING GROUP FRN 19-211129 3,000,000 EUR 3,003,726.00 3,059,550.00 0.21%
ARGENTA SPAARBANK 1,00 19-060224 4,000,000 EUR 3,998,840.00 4,146,960.00 0.29%
ARGENTA SPAARBANK 1,00 20-290127 2,000,000 EUR 1,990,600.00 2,050,970.00 0.14%
ARGENTA SPAARBANK 1,0 20-131026 2,500,000 EUR 2,485,850.00 2,554,875.00 0.18%
ARGENTA SPAARBANK 3,875 16-240526 4,000,000 EUR 4,040,200.00 4,060,400.00 0.28%
ARGENTUM NETHERLAND 2,00 18-170930 1,200,000 EUR 1,198,860.00 1,412,496.00 0.10%
ARGENTUM NETHERLAND FRN 19-190249 3,000,000 EUR 2,974,740.00 3,434,850.00 0.24%
ARKEMA 1,50 15-200125 1,500,000 EUR 1,541,985.00 1,599,517.50 0.11%
ARKEMA 1,50 17-200427 4,000,000 EUR 3,940,000.00 4,366,160.00 0.30%
AROUNDTOWN PROPERTY FRN 19-PERPETUAL 5,000,000 EUR 5,127,345.62 5,150,425.00 0.35%
AROUNDTOWN S.A. 0,00 20-160726 2,000,000 EUR 1,962,900.00 1,961,560.00 0.13%
ASAHI GROUP 0,155 20-231024 1,400,000 EUR 1,400,000.00 1,408,883.00 0.10%
ASAHI GROUP 0,541 20-231028 2,000,000 EUR 2,000,000.00 2,033,250.00 0.14%
ASML HLDG N.V. 0,25 20-250230 2,000,000 EUR 1,980,580.00 2,042,290.00 0.14%
ASML HLDG N.V. 0,625 20-070529 1,000,000 EUR 998,950.00 1,051,050.00 0.07%
ASSICURAZIONI GENERALI 2,429 20-140731 2,700,000 EUR 2,700,000.00 2,964,195.00 0.20%
ASSICURAZIONI GENERALI 3,875 19-290129 3,000,000 EUR 3,423,586.61 3,579,585.00 0.25%

DPAM L
Securities portfolio statement as at 31 December 2020
The accompanying notes form an integral part of these Financial Statements
64
DPAM L BONDS EUR QUALITY SUSTAINABLE
Investment Quantity CCY Cost
(in EUR) Evaluation value
(in EUR)
% Total Net
Assets
ASSICURAZIONI GENERALI FRN 16-080648 5,000,000 EUR 5,795,180.00 6,065,275.00 0.42%
AT&T INC. 1,45 14-010622 1,500,000 EUR 1,495,710.00 1,530,037.50 0.11%
AT&T INC. 1,60 20-190528 2,000,000 EUR 1,998,520.00 2,185,530.00 0.15%
AT&T INC. 3,15 17-040936 3,000,000 EUR 3,185,845.00 3,804,330.00 0.26%
AT&T INC. 3,55 12-171232 2,000,000 EUR 2,326,200.00 2,622,630.00 0.18%
ATF NETHERLANDS B.V. 1,875 17-190126 3,100,000 EUR 3,031,741.00 3,344,931.00 0.23%
ATOS SE 0,75 18-070522 3,000,000 EUR 2,992,620.00 3,038,580.00 0.21%
AUTOROUTES DU SUD DE LA FRANCE 1,00 16-130526 1,200,000 EUR 1,186,788.00 1,275,150.00 0.09%
AXA FRN 13-040743 2,500,000 EUR 2,801,930.00 2,807,112.50 0.19%
AXA FRN 14-PERPETUAL 2,500,000 EUR 2,656,725.00 2,844,812.50 0.20%
AXA FRN 18-280549 3,000,000 EUR 3,222,204.34 3,514,980.00 0.24%
BANCO BILBAO VIZCAYA 0,50 20-140127 2,000,000 EUR 1,984,280.00 2,043,350.00 0.14%
BANCO DE SABADELL 1,625 18-070324 6,000,000 EUR 6,150,790.00 6,270,060.00 0.43%
BANCO DE SABADELL 1,75 20-290623 400,000 EUR 399,884.00 410,368.00 0.03%
BANCO DE SABADELL FRN 20-110327 1,500,000 EUR 1,538,280.00 1,552,507.50 0.11%
BANCO SANTANDER S.A. 1,125 18-170125 1,900,000 EUR 1,895,934.00 1,976,988.00 0.14%
BANKINTER S.A. 0,625 20-061027 2,700,000 EUR 2,689,956.00 2,757,753.00 0.19%
BANK OF AMERICA 0,736 17-070222 2,000,000 EUR 2,000,000.00 2,002,100.00 0.14%
BANK OF AMERICA 1,625 15-140922 4,200,000 EUR 4,220,496.00 4,335,954.00 0.30%
BANK OF AMERICA FRN 19-080829 3,000,000 EUR 3,000,000.00 3,076,545.00 0.21%
BARCLAYS PLC FRN 19-090625 1,800,000 EUR 1,792,962.00 1,836,801.00 0.13%
BAXTER INTERNATIONAL 1,30 19-150529 6,000,000 EUR 6,425,470.01 6,529,620.00 0.45%
BECTON DICKINSON 1,90 16-151226 4,000,000 EUR 4,165,762.63 4,326,900.00 0.30%
BELFIUS BANQUE 0,375 20-020925 2,000,000 EUR 1,995,360.00 2,021,380.00 0.14%
BFCM 0,75 19-150623 1,500,000 EUR 1,492,380.00 1,538,722.50 0.11%
BFCM 1,25 17-260527 2,000,000 EUR 1,991,926.76 2,165,910.00 0.15%
BFCM 1,875 16-041126 3,000,000 EUR 2,963,443.50 3,252,900.00 0.22%
BFCM 1,875 19-180629 2,000,000 EUR 1,993,680.00 2,206,420.00 0.15%
BMW FINANCE N.V. 0,25 18-140122 3,000,000 EUR 2,987,550.00 3,017,250.00 0.21%
BMW FINANCE N.V. 0,375 20-140127 3,000,000 EUR 3,007,420.00 3,078,375.00 0.21%
BMW FINANCE N.V. 1,50 19-060229 6,000,000 EUR 6,290,196.90 6,700,350.00 0.46%
BNP PARIBAS S.A. 0,625 20-031232 4,700,000 EUR 4,695,676.00 4,752,334.50 0.33%
BNP PARIBAS S.A. 1,125 18-221123 1,500,000 EUR 1,498,350.00 1,554,577.50 0.11%
BNP PARIBAS S.A. 1,375 19-280529 2,000,000 EUR 1,988,220.00 2,175,860.00 0.15%
BNP PARIBAS S.A. 2,375 15-170225 1,500,000 EUR 1,632,450.00 1,616,377.50 0.11%
BNP PARIBAS S.A. FRN 14-141027 3,500,000 EUR 3,561,930.00 3,641,785.00 0.25%
BNP PARIBAS S.A. FRN 18-201130 2,000,000 EUR 2,061,252.00 2,162,710.00 0.15%
BNP PARIBAS S.A. FRN 19-230127 3,000,000 EUR 3,062,780.00 3,290,790.00 0.23%
BNP PARIBAS S.A. FRN 20-010928 3,000,000 EUR 2,978,880.00 3,033,705.00 0.21%
BNP PARIBAS S.A. FRN 20-141027 2,000,000 EUR 1,995,620.00 2,025,280.00 0.14%
BNP PARIBAS S.A. FRN 20-190228 3,000,000 EUR 2,990,550.00 3,036,180.00 0.21%
BOOKING HLDG 0,80 17-100322 2,000,000 EUR 2,008,180.00 2,021,920.00 0.14%
BOSTON SCIENTIFIC 0,625 19-011227 2,000,000 EUR 1,986,810.00 2,022,570.00 0.14%
BOUYGUES 1,125 20-240728 4,000,000 EUR 4,080,440.00 4,337,100.00 0.30%
BOUYGUES 3,625 12-160123 5,000,000 EUR 5,693,300.00 5,406,000.00 0.37%
BPCE S.A. 1,00 19-010425 1,600,000 EUR 1,597,216.00 1,665,240.00 0.11%
BPCE S.A. 1,00 19-150724 2,500,000 EUR 2,478,125.00 2,605,837.50 0.18%
BPCE S.A. 1,125 17-180123 2,000,000 EUR 2,017,000.00 2,053,460.00 0.14%
BPCE S.A. 2,875 16-220426 1,200,000 EUR 1,187,616.00 1,362,444.00 0.09%
BPCE S.A. 4,625 13-180723 3,500,000 EUR 4,002,992.00 3,908,660.00 0.27%
BPCE S.A. FRN 15-301127 2,000,000 EUR 2,076,480.00 2,098,330.00 0.14%

DPAM L
Securities portfolio statement as at 31 December 2020
The accompanying notes form an integral part of these Financial Statements
65
DPAM L BONDS EUR QUALITY SUSTAINABLE
Investment Quantity CCY Cost
(in EUR) Evaluation value
(in EUR)
% Total Net
Assets
BPCE S.A. FRN 20-150927 2,000,000 EUR 1,984,280.00 2,031,970.00 0.14%
BRITISH TELECOM 2,125 18-260928 2,000,000 EUR 2,210,300.00 2,259,140.00 0.16%
CA-IMMOBILIEN 0,875 20-150227 2,000,000 EUR 1,983,440.00 2,013,970.00 0.14%
CAIXABANK S.A.. FRN 20-181126 2,000,000 EUR 1,994,660.00 2,008,980.00 0.14%
CAIXABANK S.A. 0,375 20-030225 2,000,000 EUR 1,994,120.00 2,026,630.00 0.14%
CAIXABANK S.A. 1,375 19-190626 1,000,000 EUR 994,120.00 1,055,625.00 0.07%
CAIXABANK S.A. FRN 20-100726 2,000,000 EUR 1,991,700.00 2,056,320.00 0.14%
CAPGEMINI SE 0,625 20-230625 1,000,000 EUR 998,870.00 1,029,610.00 0.07%
CAPGEMINI SE 1,00 18-181024 2,000,000 EUR 2,006,693.33 2,080,560.00 0.14%
CAPGEMINI SE 2,00 20-150429 5,000,000 EUR 5,022,368.00 5,682,575.00 0.39%
CIE FINANCE ET INDUSTRIES 0,375 16-070225 1,000,000 EUR 999,590.00 1,026,900.00 0.07%
CIE SAINT GOBAIN 1,75 20-030423 2,000,000 EUR 1,998,260.00 2,085,820.00 0.14%
CITIGROUP INC. 1,625 18-210328 2,000,000 EUR 2,004,000.00 2,202,390.00 0.15%
CITIGROUP INC. FRN 18-240726 5,000,000 EUR 4,987,470.00 5,317,125.00 0.37%
CITIGROUP INC. FRN 20-060726 4,000,000 EUR 4,037,300.00 4,215,000.00 0.29%
CLOVERIE PLC ZURICH 1,50 18-151228 3,500,000 EUR 3,581,530.00 3,916,972.50 0.27%
CLOVERIE PLC ZURICH 1,75 14-160924 3,000,000 EUR 2,983,370.00 3,224,805.00 0.22%
CNP ASSURANCES 0,375 20-080328 3,000,000 EUR 2,991,450.00 2,998,230.00 0.21%
COCA-COLA CO 0,125 20-150329 2,000,000 EUR 1,992,760.00 2,016,250.00 0.14%
COCA-COLA EUROPEAN PARTNERS 0,70 19-120931 3,500,000 EUR 3,506,435.00 3,546,847.50 0.24%
COCA-COLA HBC 0,625 19-211129 1,500,000 EUR 1,486,440.00 1,554,795.00 0.11%
COFINIMMO -SICAFI- S.A. 0,875 20-021230 1,000,000 EUR 992,220.00 1,017,700.00 0.07%
CONTI-GUMMI FINANCE 2,125 20-271123 3,000,000 EUR 3,041,960.00 3,173,895.00 0.22%
CONTINENTAL 0,375 19-270625 3,000,000 EUR 2,994,060.00 3,025,575.00 0.21%
COOP RABOBANK 0,625 19-270224 2,500,000 EUR 2,495,100.00 2,561,200.00 0.18%
COOP RABOBANK 0,875 20-050528 2,500,000 EUR 2,497,800.00 2,623,525.00 0.18%
COOP RABOBANK 1,25 16-230326 3,000,000 EUR 3,082,496.00 3,213,825.00 0.22%
CPI PROPERTY 1,625 19-230427 1,200,000 EUR 1,135,110.00 1,234,476.00 0.08%
CPI PROPERTY 2,75 20-120526 2,867,000 EUR 3,046,546.58 3,114,895.15 0.21%
CREDIT AGRICOLE 0,75 18-051223 2,800,000 EUR 2,786,084.00 2,881,522.00 0.20%
CREDIT AGRICOLE 1,00 17-160924 3,000,000 EUR 2,980,647.00 3,137,985.00 0.22%
CREDIT AGRICOLE 1,75 19-050329 3,000,000 EUR 3,034,650.00 3,358,950.00 0.23%
CREDIT AGRICOLE S.A. 0,875 20-140132 3,300,000 EUR 3,285,447.00 3,466,237.50 0.24%
CREDIT AGRICOLE S.A. 1,625 20-050630 2,600,000 EUR 2,599,870.00 2,716,428.00 0.19%
CREDIT AGRICOLE S.A. 2,625 15-170327 1,500,000 EUR 1,617,916.66 1,687,537.50 0.12%
CRH FINANCE B.V. 3,125 13-030423 3,000,000 EUR 3,383,400.00 3,225,420.00 0.22%
CRH FINANCE B.V. BV 1,625 20-050530 1,200,000 EUR 1,194,300.00 1,349,214.00 0.09%
CRH FINANCE DAC 1,375 16-181028 1,500,000 EUR 1,490,124.23 1,641,727.50 0.11%
CTP B.V. 2,125 20-011025 2,500,000 EUR 2,631,685.00 2,647,850.00 0.18%
DAIMLER A.G. 0,75 20-100930 2,100,000 EUR 2,082,948.00 2,186,530.50 0.15%
DAIMLER A.G. 2,625 20-070425 8,000,000 EUR 8,231,019.50 8,873,120.00 0.61%
DAIMLER INTERNATIONAL FINANCE 0,25 18-110522 2,000,000 EUR 1,993,600.00 2,014,340.00 0.14%
DAIMLER INTERNATIONAL FINANCE 0,625 19-060527 6,000,000 EUR 5,922,964.00 6,150,870.00 0.42%
DAIMLER INTERNATIONAL FINANCE 1,00 18-111125 3,500,000 EUR 3,511,030.00 3,661,140.00 0.25%
DANAHER CORP. 2,10 20-300926 2,500,000 EUR 2,492,925.00 2,790,750.00 0.19%
DANAHER CORP. 2,50 20-300330 1,350,000 EUR 1,366,621.00 1,614,647.25 0.11%
DANONE 0,395 20-100629 1,000,000 EUR 1,000,000.00 1,031,600.00 0.07%
DANONE FRN 17-PERPETUAL 3,000,000 EUR 3,017,750.00 3,090,330.00 0.21%
DEUTSCHE BOERSE FRN 20-160647 1,200,000 EUR 1,200,000.00 1,233,552.00 0.08%
DEUTSCHE POST 0,75 20-200529 4,000,000 EUR 3,995,160.00 4,255,540.00 0.29%
DEUTSCHE POST 1,00 17-131227 2,000,000 EUR 1,983,780.00 2,136,330.00 0.15%

DPAM L
Securities portfolio statement as at 31 December 2020
The accompanying notes form an integral part of these Financial Statements
66
DPAM L BONDS EUR QUALITY SUSTAINABLE
Investment Quantity CCY Cost
(in EUR) Evaluation value
(in EUR)
% Total Net
Assets
DEUTSCHE POST 1,625 18-051228 4,000,000 EUR 4,079,900.00 4,511,460.00 0.31%
DEUTSCHE TELEKOM A.G 1,375 19-050734 3,000,000 EUR 3,048,650.00 3,374,505.00 0.23%
DEUTSCHE WOHNEN SE 1,00 20-300425 1,000,000 EUR 989,100.00 1,046,360.00 0.07%
DEUTSCHE WOHNEN SE 1,50 20-300430 1,000,000 EUR 982,110.00 1,111,375.00 0.08%
DH EUROPE FINANCE 1,20 17-300627 4,000,000 EUR 4,148,456.20 4,279,460.00 0.29%
DH EUROPE FINANCE 1,80 19-180949 2,000,000 EUR 2,001,230.00 2,272,570.00 0.16%
DIAGEO CAPITAL 0,125 20-280928 3,000,000 EUR 2,984,760.00 3,008,205.00 0.21%
DIAGEO FINANCE PLC 1,00 18-220425 2,500,000 EUR 2,480,875.00 2,619,412.50 0.18%
DIGITAL DUTCH FINCO 1,00 20-150132 1,700,000 EUR 1,683,289.00 1,763,537.50 0.12%
DNB BANK ASA FRN 18-200328 1,500,000 EUR 1,494,060.00 1,538,602.50 0.11%
DSV PANALPINA 0,375 20-260227 2,000,000 EUR 1,995,180.00 2,021,390.00 0.14%
EDENRED 1,875 18-060326 3,500,000 EUR 3,486,525.00 3,836,455.00 0.26%
EDF 1,00 16-131026 1,500,000 EUR 1,479,890.00 1,590,765.00 0.11%
EDF 4,625 09-110924 1,500,000 EUR 1,808,250.00 1,765,230.00 0.12%
EDF 4,625 10-260430 5,500,000 EUR 6,976,813.85 7,746,420.00 0.53%
EDF S.A. 2,00 18-021030 1,500,000 EUR 1,470,210.00 1,749,450.00 0.12%
EDP FINANCE B.V. 0,375 19-160926 1,000,000 EUR 996,350.00 1,016,960.00 0.07%
EDP FINANCE B.V. 1,125 16-120224 2,500,000 EUR 2,482,056.25 2,587,900.00 0.18%
EDP FINANCE B.V. 1,875 18-131025 3,000,000 EUR 2,983,650.00 3,267,690.00 0.22%
EDP FINANCE B.V. 2,375 16-230323 1,000,000 EUR 1,017,492.88 1,057,035.00 0.07%
ELIA TRANSMISSION 0,875 20-280430 2,300,000 EUR 2,270,813.00 2,426,143.50 0.17%
ELI ELLY & CO 1,625 15-020626 3,000,000 EUR 3,072,615.00 3,279,285.00 0.23%
ELI LILLY & CO 0,625 19-011131 2,000,000 EUR 2,028,100.00 2,117,230.00 0.15%
ENAGAS FINANCIACIONES 0,375 20-051132 2,500,000 EUR 2,490,650.00 2,523,100.00 0.17%
ENBW INTERNATIONAL 0,625 20-170425 1,200,000 EUR 1,194,240.00 1,240,872.00 0.09%
ENECO HLDG FRN 14-PERPETUAL 4,000,000 EUR 4,074,900.00 4,108,520.00 0.28%
ENEL 5,625 07-210627 2,500,000 EUR 3,217,653.00 3,399,412.50 0.23%
ENEL FINANCE INTERNATIONAL 0,375 19-170627 3,000,000 EUR 2,977,710.00 3,063,240.00 0.21%
ENEL FINANCE INTERNATIONAL 1,00 17-160924 1,600,000 EUR 1,584,016.00 1,667,936.00 0.11%
ENEL FINANCE INTERNATIONAL 1,375 16-010626 3,445,000 EUR 3,467,700.26 3,705,941.52 0.26%
ENEL FINANCE INTERNATIONAL 1,50 19-210725 2,000,000 EUR 1,971,300.00 2,140,250.00 0.15%
ENEL FINANCE INTERNATIONAL 1,966 15-270125 1,500,000 EUR 1,615,500.00 1,624,920.00 0.11%
ENEL SpA FRN 18-24112100 7,000,000 EUR 7,344,069.99 7,769,160.00 0.53%
ENEL SpA FRN 20-PERPETUAL 1,400,000 EUR 1,389,668.00 1,462,181.00 0.10%
ENERGY BADEN-WUERTT FRN 20-290680 1,500,000 EUR 1,489,500.00 1,557,150.00 0.11%
ENEXIS HLDG N.V. 0,625 20-170632 3,000,000 EUR 2,993,790.00 3,156,150.00 0.22%
ERSTE GROUP BANK 0,05 20-160925 1,000,000 EUR 997,010.00 1,005,740.00 0.07%
ERSTE GROUP BANK FRN 20-080931 5,000,000 EUR 5,098,640.00 5,220,750.00 0.36%
EUROCLEAR BANK 0,125 20-070725 5,000,000 EUR 4,984,412.00 5,069,400.00 0.35%
EUROCLEAR BANK 0,25 18-070922 1,500,000 EUR 1,493,040.00 1,514,302.50 0.10%
EUROCLEAR BANK 0,50 18-100723 3,500,000 EUR 3,490,375.00 3,575,722.50 0.25%
EUROCLEAR INVESTMENT 1,125 16-071226 3,000,000 EUR 3,009,351.00 3,233,310.00 0.22%
EUTELSAT 1,50 20-131028 2,000,000 EUR 1,992,380.00 2,033,710.00 0.14%
EWE A.G. 0,375 20-221032 3,000,000 EUR 2,962,650.00 3,026,190.00 0.21%
FASTIGHETS AB BALD 1,125 19-290127 2,500,000 EUR 2,551,500.00 2,537,087.50 0.17%
FCC MEDIO AMBIENTE 0,815 19-041223 1,500,000 EUR 1,500,000.00 1,531,222.50 0.11%
FERROVIAL EMISIONES 0,54 20-121128 2,400,000 EUR 2,400,000.00 2,427,000.00 0.17%
FIDELITY NATIONAL 0,625 19-031225 1,500,000 EUR 1,498,590.00 1,544,790.00 0.11%
FIDELITY NATIONAL INFORMATION SERVICES 1,50 19-210527 5,000,000 EUR 5,038,200.00 5,395,700.00 0.37%
FLUVIUS SYSTEM 0,25 20-021230 1,700,000 EUR 1,698,657.00 1,725,134.50 0.12%
FRESENIUS MEDICAL CARE 1,00 20-290526 1,000,000 EUR 994,050.00 1,045,180.00 0.07%

DPAM L
Securities portfolio statement as at 31 December 2020
The accompanying notes form an integral part of these Financial Statements
67
DPAM L BONDS EUR QUALITY SUSTAINABLE
Investment Quantity CCY Cost
(in EUR) Evaluation value
(in EUR)
% Total Net
Assets
FRESENIUS SE & CO 1,625 20-081027 1,500,000 EUR 1,485,315.00 1,641,322.50 0.11%
GENERAL ELECTRIC CO 4,125 05-190935 4,000,000 EUR 5,115,513.23 5,253,780.00 0.36%
GIVAUDAN NEDERLAND 1,625 20-220432 3,000,000 EUR 3,030,230.00 3,426,465.00 0.24%
GLAXOSMITHKLINE CAPITAL 1,25 18-210526 2,000,000 EUR 2,010,727.14 2,137,720.00 0.15%
GLAXOSMITHKLINE CAPITAL 1,375 14-021224 2,000,000 EUR 2,070,690.00 2,122,160.00 0.15%
GLOBALWORTH REAL ESTATE 3,00 18-290325 4,000,000 EUR 4,183,959.29 4,248,060.00 0.29%
GOLDMAN SACHS 0,125 19-190824 3,000,000 EUR 2,984,670.00 3,013,605.00 0.21%
GOLDMAN SACHS 0,875 20-210130 2,500,000 EUR 2,514,340.00 2,627,750.00 0.18%
GOLDMAN SACHS 1,375 17-150524 2,000,000 EUR 2,004,400.00 2,065,630.00 0.14%
GOLDMAN SACHS GROUP 1,375 15-260722 2,000,000 EUR 2,037,260.00 2,051,970.00 0.14%
GOLDMAN SACHS GROUP 2,875 14-030626 4,000,000 EUR 4,478,417.67 4,587,560.00 0.32%
GOLDMAN SACHS GROUP 3,25 13-010223 2,000,000 EUR 2,083,023.00 2,144,100.00 0.15%
GOLDMAN SACHS GROUP 4,75 06-121021 1,500,000 EUR 1,648,800.00 1,553,895.00 0.11%
GRAND CITY PROPERTIES FRN 20-PERPETUAL 2,500,000 EUR 2,467,575.00 2,471,862.50 0.17%
GRAND CITY PROPERTIES S.A. 1,375 17-030826 2,000,000 EUR 1,936,400.00 2,129,360.00 0.15%
HANNOVER RUECK FRN 20-081040 3,000,000 EUR 2,978,130.00 3,222,480.00 0.22%
HEIDELBERGCEMENT A.G. 1,625 17-070426 3,000,000 EUR 2,986,440.00 3,226,155.00 0.22%
HEIDELBERGCEMENT A.G. 2,50 20-091024 2,000,000 EUR 1,992,100.00 2,183,570.00 0.15%
HEIMSTADEN BOSTAD 1,125 20-210126 6,000,000 EUR 5,874,160.00 6,220,500.00 0.43%
HEIMSTADEN BOSTAD 1,375 20-030327 1,000,000 EUR 992,890.00 1,052,470.00 0.07%
HEINEKEN N.V. 1,25 20-070533 3,000,000 EUR 2,992,500.00 3,298,650.00 0.23%
HEINEKEN N.V. 1,625 20-300325 1,200,000 EUR 1,196,976.00 1,288,386.00 0.09%
HEINEKEN N.V. 3,50 12-190324 2,000,000 EUR 2,310,570.00 2,239,900.00 0.15%
HELVETIA EUROPE FRN 20-300941 2,000,000 EUR 1,981,680.00 2,205,510.00 0.15%
HERA SpA 0,25 20-031230 3,000,000 EUR 2,971,140.00 3,015,900.00 0.21%
HERA SpA 0,875 19-050727 1,500,000 EUR 1,476,105.00 1,582,590.00 0.11%
HOCHTIEF A.G. 1,75 18-030725 2,000,000 EUR 1,991,000.00 2,142,800.00 0.15%
HOLCIM FINANCE 0,50 20-230431 4,000,000 EUR 3,977,400.00 4,021,920.00 0.28%
HSBC FRANCE S.A. 0,25 19-170524 2,900,000 EUR 2,888,951.00 2,942,673.50 0.20%
HSBC FRANCE S.A. 0,60 18-200323 1,500,000 EUR 1,496,760.00 1,528,860.00 0.11%
HSBC HLDG PLC FRN 20-131126 2,000,000 EUR 2,000,000.00 2,025,700.00 0.14%
IBERDROLA FINANZAS 0,875 20-160625 2,000,000 EUR 1,995,680.00 2,084,010.00 0.14%
IBERDROLA FINANZAS 1,00 16-070324 1,500,000 EUR 1,487,655.00 1,552,747.50 0.11%
IBERDROLA FINANZAS 1,00 17-070325 3,000,000 EUR 2,980,800.00 3,138,435.00 0.22%
IBERDROLA INTERNATIONAL B.V. 16-210426 1,000,000 EUR 994,930.00 1,064,985.00 0.07%
IBERDROLA INTERNATIONAL B.V. FRN 17-PERPETUAL 3,000,000 EUR 2,917,650.00 3,084,570.00 0.21%
IBERDROLA INTERNATIONAL B.V. FRN 18-PERPETUAL 2,000,000 EUR 2,037,120.00 2,120,450.00 0.15%
IBERDROLA INTERNATIONAL B.V. FRN 19-PERPETUAL 1,500,000 EUR 1,518,875.00 1,647,255.00 0.11%
IBERDROLA INTERNATIONAL B.V. FRN 20-PERPETUAL 3,000,000 EUR 3,000,000.00 3,156,540.00 0.22%
IBM CORP. 0,65 20-110232 3,000,000 EUR 2,990,700.00 3,106,635.00 0.21%
IBM CORP. 0,95 17-230525 3,000,000 EUR 3,005,550.00 3,151,275.00 0.22%
IBM CORP. 1,25 19-290127 1,700,000 EUR 1,691,415.00 1,832,200.50 0.13%
IBM CORP. 1,50 17-230529 1,000,000 EUR 1,026,100.00 1,116,835.00 0.08%
IBM CORP. 1,75 19-310131 2,000,000 EUR 1,979,080.00 2,296,660.00 0.16%
ICADE SANTE 1,375 20-170930 1,500,000 EUR 1,498,890.00 1,607,805.00 0.11%
ILLINOIS TOOL WORKS 0,625 19-051227 3,000,000 EUR 2,980,290.00 3,132,975.00 0.22%
ILLINOIS TOOL WORKS 2,125 15-220530 3,000,000 EUR 2,979,090.00 3,586,170.00 0.25%
IMMOBILIA COLONIAL 1,35 20-141028 1,500,000 EUR 1,494,135.00 1,553,355.00 0.11%
IMMOBILIARIA COL SOC 1,45 16-281024 1,600,000 EUR 1,596,540.00 1,672,144.00 0.12%
IN'LI 1,125 19-020729 2,000,000 EUR 1,993,800.00 2,149,560.00 0.15%
ING BANK FRN 14-250226 3,000,000 EUR 3,137,010.55 3,015,915.00 0.21%

DPAM L
Securities portfolio statement as at 31 December 2020
The accompanying notes form an integral part of these Financial Statements
68
DPAM L BONDS EUR QUALITY SUSTAINABLE
Investment Quantity CCY Cost
(in EUR) Evaluation value
(in EUR)
% Total Net
Assets
ING GROUP N.V. FRN 19-030925 1,000,000 EUR 999,750.00 1,004,510.00 0.07%
ING GROUP N.V. FRN 19-131130 2,500,000 EUR 2,495,650.00 2,533,225.00 0.17%
ING GROUP N.V. FRN 20-260531 3,700,000 EUR 3,763,186.00 3,958,130.50 0.27%
INMOBILIARIA COLONIAL 1,625 17-281125 2,000,000 EUR 1,973,816.00 2,119,380.00 0.15%
INMOBILIARIA COLONIAL 2,00 18-170426 4,000,000 EUR 3,966,887.00 4,310,860.00 0.30%
INTERNATIONAL FLAVOR & FRAGRA 1,75 16-140324 2,000,000 EUR 2,094,510.00 2,110,410.00 0.15%
INTESA SAN PAOLO SpA 0,75 19-041224 3,000,000 EUR 3,028,110.00 3,079,110.00 0.21%
INTESA SAN PAOLO SpA 1,75 18-200328 2,000,000 EUR 1,929,783.63 2,171,180.00 0.15%
INTESA SAN PAOLO SpA 1,75 19-040729 8,000,000 EUR 8,415,704.44 8,747,000.00 0.60%
INTESA SAN PAOLO SpA 3,50 14-170122 2,000,000 EUR 2,251,380.00 2,078,400.00 0.14%
INTESA SAN PAOLO SpA 4,00 13-301023 2,000,000 EUR 2,296,898.09 2,226,740.00 0.15%
INVESTOR AB 1,50 18-120930 1,500,000 EUR 1,496,730.00 1,705,567.50 0.12%
IREN SpA 0,875 16-041124 3,500,000 EUR 3,343,802.50 3,616,042.50 0.25%
IREN SpA 0,875 19-141029 1,500,000 EUR 1,490,175.00 1,585,860.00 0.11%
IREN SpA 1,00 20-010730 3,000,000 EUR 2,944,320.00 3,178,680.00 0.22%
IREN SpA 1,50 17-241027 4,000,000 EUR 3,860,000.00 4,361,080.00 0.30%
ITALGAS SpA 1,625 17-180129 4,000,000 EUR 3,832,921.33 4,508,540.00 0.31%
ITALGAS SpA 1,625 17-190127 3,277,000 EUR 3,168,897.51 3,613,236.59 0.25%
JP MORGAN CHASE & CO 0,625 16-250124 4,500,000 EUR 4,439,943.00 4,595,355.00 0.32%
JP MORGAN CHASE & CO 1,5 15-270125 3,000,000 EUR 3,061,198.39 3,192,285.00 0.22%
JP MORGAN CHASE & CO 2,75 13-010223 3,000,000 EUR 3,052,440.00 3,189,750.00 0.22%
JP MORGAN CHASE & CO FRN 17-180528 2,000,000 EUR 2,006,520.00 2,192,720.00 0.15%
JP MORGAN CHASE & CO FRN 19-110327 3,000,000 EUR 3,000,000.00 3,157,515.00 0.22%
JP MORGAN CHASE & CO FRN 19-250731 6,000,000 EUR 6,070,529.97 6,415,740.00 0.44%
JP MORGAN CHASE & CO FRN 20-240228 2,000,000 EUR 2,000,000.00 2,034,090.00 0.14%
JP MORGAN FRN 19-041132 3,000,000 EUR 3,000,000.00 3,234,945.00 0.22%
KBC GROUP 0,75 16-181023 2,500,000 EUR 2,490,880.41 2,566,475.00 0.18%
KBC GROUPE 0,75 20-240130 2,400,000 EUR 2,393,088.00 2,522,616.00 0.17%
KBC GROUP FRN 19-031229 4,000,000 EUR 3,962,830.00 3,981,180.00 0.27%
KBC GROUP FRN 20-160627 2,000,000 EUR 1,985,620.00 2,040,580.00 0.14%
KBC GROUP S.A. FRN 15-110327 8,500,000 EUR 8,677,000.49 8,673,697.50 0.60%
KERING 0,25 20-130523 2,000,000 EUR 1,997,140.00 2,020,900.00 0.14%
KERRY GROUP FINANCE SER 0,625 19-200929 3,000,000 EUR 2,969,730.00 3,102,405.00 0.21%
KLEPIERRE S.A. 0,875 20-170231 2,400,000 EUR 2,393,688.00 2,447,448.00 0.17%
KONINKLIJKE AHOLD 0,25 19-260625 2,000,000 EUR 1,985,440.00 2,041,790.00 0.14%
KONINKLIJKE AHOLD DELHAIZE 1,75 20-020427 2,200,000 EUR 2,294,390.00 2,443,386.00 0.17%
KONINKLIJKE DSM 0,625 20-230632 3,000,000 EUR 3,002,030.00 3,131,430.00 0.22%
KONINKLIJKE DSM 2,375 14-030424 2,000,000 EUR 2,197,000.00 2,161,320.00 0.15%
KONINKLIJKE PHILIPS 1,375 20-300325 1,100,000 EUR 1,095,050.00 1,166,214.50 0.08%
LA BANQUE POSTALE FNR 20-260131 2,500,000 EUR 2,496,700.00 2,524,587.50 0.17%
LA POSTE 1,375 20-210432 1,000,000 EUR 997,800.00 1,110,395.00 0.08%
LA POSTE S.A. 0,375 19-170927 5,000,000 EUR 4,997,650.00 5,136,075.00 0.35%
LA POSTE S.A. 1,45 18-301128 2,000,000 EUR 1,996,480.00 2,236,490.00 0.15%
LEGRAND S.A. 0,75 20-200530 2,000,000 EUR 1,991,960.00 2,122,820.00 0.15%
LINDE FINANCE B.V. 0,25 20-190527 2,500,000 EUR 2,498,950.00 2,551,812.50 0.18%
LLOYDS BANK CORP. 2,375 20-090426 4,000,000 EUR 4,404,039.92 4,477,360.00 0.31%
LLOYDS BANK CORP. MARKETS 0,25 19-041022 1,250,000 EUR 1,248,287.50 1,258,775.00 0.09%
LLOYDS BANK GROUP 0,375 20-280125 1,500,000 EUR 1,506,000.00 1,521,075.00 0.10%
LLOYDS BANK GROUP 1,50 17-120927 2,000,000 EUR 2,105,000.00 2,193,110.00 0.15%
LLOYDS BANK GROUP FRN 18-070928 2,000,000 EUR 2,013,092.00 2,062,130.00 0.14%
LLOYDS BANK GROUP FRN 19-121125 2,000,000 EUR 1,988,700.00 2,025,290.00 0.14%

DPAM L
Securities portfolio statement as at 31 December 2020
The accompanying notes form an integral part of these Financial Statements
69
DPAM L BONDS EUR QUALITY SUSTAINABLE
Investment Quantity CCY Cost
(in EUR) Evaluation value
(in EUR)
% Total Net
Assets
LLOYDS BANK GROUP FRN 20-010426 2,700,000 EUR 2,972,641.00 3,073,558.50 0.21%
LONDON STOCK EXCHANGE GROUP 1,75 18-061227 4,000,000 EUR 4,248,531.01 4,419,320.00 0.30%
LONDON STOXK EXCHANGE GROUP 0,875 17-190924 3,000,000 EUR 2,990,451.00 3,101,160.00 0.21%
LONZA FINANCE INTERNATIONAL 1,625 20-210427 1,000,000 EUR 994,240.00 1,096,395.00 0.08%
LVMH 0,00 20-110226 3,000,000 EUR 2,987,790.00 3,027,225.00 0.21%
LVMH 0,75 17-260524 4,000,000 EUR 4,027,194.00 4,129,920.00 0.28%
LVMH 0,75 20-070425 1,000,000 EUR 997,170.00 1,038,875.00 0.07%
MC DONALD'S CORP. 1,60 19-150331 4,300,000 EUR 4,388,164.00 4,853,281.00 0.33%
MC DONALD'S CORP. 1,75 16-030528 3,500,000 EUR 3,863,500.00 3,924,410.00 0.27%
MEDIOBANCA 0,625 17-270922 4,000,000 EUR 3,786,360.91 4,056,000.00 0.28%
MEDIOBANCA 0,875 19-150126 2,600,000 EUR 2,595,060.00 2,670,083.00 0.18%
MEDIOBANCA 1,00 20-080927 1,600,000 EUR 1,593,024.00 1,659,000.00 0.11%
MEDIOBANCA 1,125 19-150725 2,000,000 EUR 1,992,620.00 2,077,290.00 0.14%
MEDIOBANCA 1,625 19-070125 500,000 EUR 499,465.00 528,540.00 0.04%
MEDTRONIC GLOBAL HL 1,625 20-151050 3,500,000 EUR 3,404,030.00 3,911,687.50 0.27%
MEDTRONIC GLOBAL HLDG 1,125 19-070327 6,000,000 EUR 6,248,110.00 6,418,380.00 0.44%
MEDTRONIC GLOBAL HLDG 1,625 19-070331 1,100,000 EUR 1,090,518.00 1,254,269.50 0.09%
MEDTRONIC GLOBAL HLDG 1,75 19-020749 1,000,000 EUR 1,032,160.00 1,162,070.00 0.08%
MEDTRONIC GLOBAL HLDG 2,25 19-070339 3,500,000 EUR 3,506,135.00 4,348,365.00 0.30%
MERCK FINANCIAL 0,50 20-160728 1,700,000 EUR 1,693,812.00 1,772,547.50 0.12%
MERCK FRN 20-090980 2,000,000 EUR 2,000,000.00 2,050,700.00 0.14%
MERLIN PROPERTIES 1,875 19-041234 6,000,000 EUR 5,906,230.00 6,112,800.00 0.42%
MERLIN PROPERTIES 2,375 20-130727 1,000,000 EUR 990,860.00 1,079,840.00 0.07%
MICHELIN 0,875 18-030925 2,000,000 EUR 1,981,980.00 2,097,200.00 0.14%
MITSUBISHI UFJ FINANCIAL 0,872 17-070924 3,800,000 EUR 3,787,220.00 3,932,392.00 0.27%
MITSUBISHI UFJ FINANCIAL 0,98 18-091023 2,000,000 EUR 2,000,000.00 2,064,970.00 0.14%
MITSUBISHI UFJ FINANCIAL GROUP 0,978 20-090624 1,000,000 EUR 1,000,000.00 1,036,645.00 0.07%
MONDELEZ INTL 0,875 19-011031 2,500,000 EUR 2,463,725.00 2,659,912.50 0.18%
MONDELEZ INTL 1,625 15-080327 2,000,000 EUR 2,022,890.00 2,187,720.00 0.15%
MOODY'S CORP. 0,95 19-250230 4,000,000 EUR 4,061,004.00 4,257,340.00 0.29%
MORGAN STANLEY 1,75 15-300125 3,500,000 EUR 3,548,440.00 3,746,942.50 0.26%
MORGAN STANLEY 1,875 14-300323 3,000,000 EUR 3,128,386.00 3,139,485.00 0.22%
MORGAN STANLEY FRN 17-231026 4,000,000 EUR 4,218,788.00 4,246,720.00 0.29%
MORGAN STANLEY FRN 19-260724 2,000,000 EUR 2,000,000.00 2,036,370.00 0.14%
MORGAN STANLEY FRN 20-261029 3,500,000 EUR 3,500,000.00 3,559,692.50 0.24%
MUNICH RE 1,25 20-260541 2,000,000 EUR 1,976,940.00 2,079,890.00 0.14%
MUNICH RE FRN 18-260549 4,000,000 EUR 4,061,200.00 4,755,700.00 0.33%
NASDAQ INC. 0,875 20-130230 1,500,000 EUR 1,495,140.00 1,560,960.00 0.11%
NASDAQ INC. 1,75 19-280329 4,000,000 EUR 4,142,155.00 4,458,800.00 0.31%
NATIONAL GRID 0,553 20-180929 1,500,000 EUR 1,500,000.00 1,540,290.00 0.11%
NATWEST MARKETS 1,125 18-140623 3,000,000 EUR 2,992,677.50 3,090,540.00 0.21%
NEDERLANDSE GASUNIE 0,375 19-031031 2,000,000 EUR 1,980,660.00 2,048,050.00 0.14%
NESTLE FINANCE INTERNATIONAL 0,00 20-030333 2,500,000 EUR 2,458,725.00 2,466,562.50 0.17%
NESTLE FINANCE INTERNATIONAL 0,125 20-121127 2,000,000 EUR 1,986,020.00 2,033,170.00 0.14%
NESTLE FINANCE INTERNATIONAL 0,375 20-120532 3,000,000 EUR 2,944,710.00 3,109,035.00 0.21%
NESTLE FINANCE INTERNATIONAL 1,125 20-010426 1,500,000 EUR 1,491,285.00 1,602,277.50 0.11%
NESTLE HLDG 0,875 17-180725 2,000,000 EUR 2,025,260.00 2,099,580.00 0.14%
NISSAN MOTOR 1,94 20-150923 1,500,000 EUR 1,516,470.00 1,564,680.00 0.11%
NN GROUP N.V. 1,625 17-070727 2,000,000 EUR 2,050,100.00 2,195,850.00 0.15%
NN GROUP N.V. FRN 14-PERPETUAL 3,000,000 EUR 3,266,234.01 3,469,665.00 0.24%
NORDEA BANK 0,50 20-140527 2,000,000 EUR 1,984,840.00 2,069,740.00 0.14%

DPAM L
Securities portfolio statement as at 31 December 2020
The accompanying notes form an integral part of these Financial Statements
70
DPAM L BONDS EUR QUALITY SUSTAINABLE
Investment Quantity CCY Cost
(in EUR) Evaluation value
(in EUR)
% Total Net
Assets
NORDEA BANK FRN 16-070926 2,500,000 EUR 2,507,370.00 2,514,587.50 0.17%
NORTEGAS ENERGIA 2,065 17-280927 3,500,000 EUR 3,497,879.00 3,826,952.50 0.26%
NYKREDIT REALKRED 0,25 20-130126 2,500,000 EUR 2,496,700.00 2,502,575.00 0.17%
ORANGE 0,125 20-160929 2,000,000 EUR 1,984,680.00 2,017,350.00 0.14%
ORANGE 0,50 19-040932 1,200,000 EUR 1,191,600.00 1,230,870.00 0.08%
ORANGE 1,25 20-070727 2,500,000 EUR 2,497,275.00 2,707,750.00 0.19%
ORANGE 1,375 18-200328 1,500,000 EUR 1,494,720.00 1,648,305.00 0.11%
ORANGE 2,00 19-150129 2,500,000 EUR 2,496,175.00 2,886,012.50 0.20%
ORANGE FRN 14-PERPETUAL 4,000,000 EUR 4,802,125.00 4,856,720.00 0.33%
ORANGE FRN 14-PERPETUAL 1,500,000 EUR 1,685,400.00 1,711,050.00 0.12%
ORANGE FRN 19-PERPETUAL 3,000,000 EUR 3,011,872.50 3,171,885.00 0.22%
ORANGE FRN 20-PERPETUAL 2,000,000 EUR 1,992,620.00 2,073,210.00 0.14%
ORSTED A/SA.S. FRN 19-PERPETUAL 1,500,000 EUR 1,486,185.00 1,542,405.00 0.11%
PARKER-HANNIFINANCE 1,125 17-010325 3,700,000 EUR 3,722,960.00 3,857,842.00 0.27%
PEPSICO INC. 0,40 20-091032 2,000,000 EUR 1,997,200.00 2,030,910.00 0.14%
PEPSICO INC. 0,75 19-180327 3,000,000 EUR 2,994,450.00 3,156,180.00 0.22%
PEPSICO INC. 1,05 20-091050 2,000,000 EUR 1,996,420.00 2,125,030.00 0.15%
PERNOD RICARD 0,50 19-241027 3,000,000 EUR 3,012,000.00 3,116,235.00 0.21%
PERNOD RICARD 0,875 19-241031 2,000,000 EUR 1,975,000.00 2,139,110.00 0.15%
POSTE ITALIANE 0,50 20-101228 2,000,000 EUR 2,005,459.98 2,012,350.00 0.14%
PROCTER & GAMBLE 0,625 18-301024 2,000,000 EUR 1,994,600.00 2,067,710.00 0.14%
PROCTER & GAMBLE 1,20 18-301028 2,000,000 EUR 1,993,080.00 2,203,650.00 0.15%
PROLOGIS EURO FINANCE 0,375 20-060228 1,750,000 EUR 1,745,607.50 1,792,883.75 0.12%
PROLOGIS EURO FINANCE 1,50 19-100949 1,000,000 EUR 975,390.00 1,094,635.00 0.08%
PROLOGIS INTERNATIONAL FUND 1,625 20-170632 2,000,000 EUR 1,992,660.00 2,262,880.00 0.16%
RABOBANK NEDERLAND 2,375 13-220523 4,500,000 EUR 4,465,260.00 4,791,240.00 0.33%
RABOBANK NEDERLAND 3,875 13-250723 4,500,000 EUR 4,790,295.86 4,951,687.50 0.34%
RABOBANK UA 0,74 18-290823 3,500,000 EUR 3,488,245.00 3,588,742.50 0.25%
RBS 0,625 18-020322 2,500,000 EUR 2,487,610.00 2,521,700.00 0.17%
RBS FRN 17-080323 2,000,000 EUR 2,049,249.88 2,049,730.00 0.14%
RCI BANQUE S.A. 0,75 17-260922 2,000,000 EUR 1,961,880.00 2,022,310.00 0.14%
RCI BANQUE S.A. 1,00 16-170523 2,000,000 EUR 2,003,280.00 2,032,190.00 0.14%
RCI BANQUE S.A. 1,125 20-150127 7,000,000 EUR 6,865,567.33 7,157,465.00 0.49%
RCI BANQUE S.A. 1,75 19-100426 3,000,000 EUR 2,943,110.00 3,170,730.00 0.22%
RCI BANQUE S.A. 2,00 19-110724 1,000,000 EUR 1,024,628.71 1,048,785.00 0.07%
RED ELECTRICA FINANCE 0,375 20-240728 1,400,000 EUR 1,385,482.00 1,444,016.00 0.10%
RENTOKIL INITIAL 0,50 20-141028 1,800,000 EUR 1,793,124.00 1,822,815.00 0.13%
RICHEMONT INTERNATIONAL 0,75 20-260528 1,500,000 EUR 1,498,260.00 1,586,842.50 0.11%
ROYAL BANK OF CANADA 0,125 19-230724 2,000,000 EUR 1,994,340.00 2,018,690.00 0.14%
ROYAL BANK OF CANADA 0,25 19-020524 3,500,000 EUR 3,481,660.00 3,550,785.00 0.24%
ROYAL PHILIPS 0,50 19-220526 2,000,000 EUR 1,989,880.00 2,065,910.00 0.14%
ROYAL SCHIPHOL GROUP 1,50 18-051130 1,500,000 EUR 1,480,185.00 1,682,197.50 0.12%
RTE EDF TRANSPORT 0,625 20-080732 3,500,000 EUR 3,483,900.00 3,656,327.50 0.25%
RTE EDF TRANSPORT 1,625 15-271125 1,000,000 EUR 995,520.00 1,085,195.00 0.07%
SAINT-GOBAIN 1,125 18-230326 1,500,000 EUR 1,493,970.00 1,587,742.50 0.11%
SAINT-GOBAIN 1,375 17-140627 3,500,000 EUR 3,523,322.50 3,807,405.00 0.26%
SAMPO PLC FRN 20-030952 7,000,000 EUR 7,317,960.00 7,587,125.00 0.52%
SANOFI S.A. 0,625 16-050424 4,000,000 EUR 4,026,880.00 4,121,660.00 0.28%
SANOFI S.A. 1,00 20-010425 1,200,000 EUR 1,196,676.00 1,262,100.00 0.09%
SAP SE 0,125 20-180526 2,500,000 EUR 2,484,375.00 2,542,237.50 0.17%
SAP SE 1,00 18-130326 3,000,000 EUR 3,049,500.00 3,182,700.00 0.22%

DPAM L
Securities portfolio statement as at 31 December 2020
The accompanying notes form an integral part of these Financial Statements
71
DPAM L BONDS EUR QUALITY SUSTAINABLE
Investment Quantity CCY Cost
(in EUR) Evaluation value
(in EUR)
% Total Net
Assets
SAP SE 1,375 18-130330 4,000,000 EUR 4,231,680.00 4,501,420.00 0.31%
SBB TREASURY 0,75 20-141228 4,000,000 EUR 3,959,680.00 3,960,400.00 0.27%
SCANIA CV 0,00 20-231122 1,500,000 EUR 1,500,750.00 1,501,365.00 0.10%
SCHNEIDER ELECTRIC 0,25 20-110329 3,000,000 EUR 2,979,030.00 3,068,280.00 0.21%
SCHNEIDER ELECTRIC 0,875 17-131226 2,500,000 EUR 2,482,625.00 2,651,962.50 0.18%
SCHNEIDER ELECTRIC 1,00 20-090427 3,700,000 EUR 3,745,791.00 3,956,891.00 0.27%
SCHNEIDER ELECTRIC 1,375 18-210627 1,700,000 EUR 1,683,510.00 1,861,228.00 0.13%
SCHNEIDER ELECTRIC 1,50 19-150128 3,500,000 EUR 3,499,125.00 3,888,482.50 0.27%
SELP FINANCE 1,50 19-201226 3,000,000 EUR 2,998,440.00 3,226,470.00 0.22%
SIEMENS FINANCE 0,25 20-200229 3,000,000 EUR 2,995,200.00 3,084,000.00 0.21%
SIEMENS FINANCE 0,375 20-050626 2,000,000 EUR 1,998,940.00 2,060,260.00 0.14%
SIEMENS FINANCE 1,375 18-060930 2,000,000 EUR 1,990,580.00 2,278,290.00 0.16%
SIEMENS FINANCE 1,75 19-280239 1,300,000 EUR 1,288,950.00 1,625,591.50 0.11%
SIGNIFY N.V. 2,00 20-110524 7,000,000 EUR 7,098,030.00 7,406,665.00 0.51%
SIGNIFY N.V. 2,375 20-110527 2,000,000 EUR 2,059,600.00 2,218,930.00 0.15%
SOCIETE DES AUTOROUTES PARIS-RHIN-RHONE 1,125 16-090126 3,500,000 EUR 3,472,035.00 3,722,180.00 0.26%
SOCIETE DES AUTOROUTES PARIS-RHIN-RHONE 1,25 19-180128 3,500,000 EUR 3,469,655.00 3,813,740.00 0.26%
SOCIETE DES AUTOROUTES PARIS-RHIN-RHONE 1,50 18-250130 2,000,000 EUR 1,980,540.00 2,265,100.00 0.16%
SOCIETE DES AUTOROUTES PARIS-RHIN-RHONE 1,875 14-150125 1,000,000 EUR 994,990.00 1,080,350.00 0.07%
SOCIETE FONC LYON IM 1,50 20-050627 600,000 EUR 597,474.00 640,053.00 0.04%
SOCIETE GENERAL 0,875 19-240929 2,200,000 EUR 2,200,000.00 2,259,840.00 0.16%
SOCIETE GENERALE 0,75 20-250127 2,500,000 EUR 2,499,650.00 2,564,862.50 0.18%
SOCIETE GENERALE 0,875 20-220928 500,000 EUR 498,180.00 516,455.00 0.04%
SOCIETE GENERALE 1,25 19-150224 3,000,000 EUR 2,982,000.00 3,115,320.00 0.21%
SOCIETE GENERALE FRN 20-241130 2,500,000 EUR 2,488,625.00 2,508,025.00 0.17%
SODEXHO 0,50 20-170124 1,000,000 EUR 999,030.00 1,019,165.00 0.07%
SODEXHO 0,75 20-270425 2,000,000 EUR 1,996,580.00 2,069,900.00 0.14%
SODEXHO 1,00 20-170728 1,500,000 EUR 1,494,270.00 1,590,382.50 0.11%
STATKRAFT A/S 1,125 17-200325 5,000,000 EUR 5,066,228.00 5,246,175.00 0.36%
STEDIN HLDG 0,50 19-141129 7,000,000 EUR 6,996,470.00 7,216,650.00 0.50%
STE FONCIERE LYONNAIS 1,5 18-290525 2,000,000 EUR 1,976,600.00 2,113,260.00 0.15%
STORA ENSO OYJ 0,625 20-021230 1,500,000 EUR 1,488,165.00 1,527,375.00 0.11%
SUMITOMO MITSUI FINANCE 0,465 19-300524 1,500,000 EUR 1,500,000.00 1,530,585.00 0.11%
SUMITOMO MITSUI FINANCE 0,819 18-230723 3,000,000 EUR 3,000,000.00 3,077,625.00 0.21%
SVENSKA HANDELSBANKEN 0,01 20-021227 2,000,000 EUR 1,999,160.00 1,999,550.00 0.14%
SVENSKA HANDELSBANKEN 0,375 18-030723 2,200,000 EUR 2,187,636.00 2,239,193.00 0.15%
SVENSKA HANDELSBANKEN FRN 18-050329 2,000,000 EUR 1,999,240.00 2,087,980.00 0.14%
SWISS RE FINANCE FRN 20-040652 5,000,000 EUR 5,075,006.01 5,600,000.00 0.39%
SWISS RE FINANCE LUX FRN 19-300450 3,000,000 EUR 3,000,000.00 3,381,690.00 0.23%
TAKEDA PHARMACEUTICAL 1,375 20-090732 3,500,000 EUR 3,496,150.00 3,763,637.50 0.26%
TAKEDA PHARMACEUTICAL 2,25 18-211126 3,000,000 EUR 3,060,393.00 3,378,030.00 0.23%
TAKEDA PHARMACEUTICAL 3,00 18-211130 2,000,000 EUR 2,153,040.00 2,464,960.00 0.17%
TELEFONICA EMISIONE 0,664 20-030230 2,000,000 EUR 2,000,000.00 2,057,760.00 0.14%
TELEFONICA EMISIONE 1,069 19-050224 3,300,000 EUR 3,300,000.00 3,419,691.00 0.24%
TELEFONICA EMISIONE 1,201 20-210827 3,500,000 EUR 3,500,175.00 3,745,875.00 0.26%
TELEFONICA EMISIONE 1,715 17-120128 2,500,000 EUR 2,500,075.00 2,774,750.00 0.19%
TELEFONICA EMISIONE 2,318 17-171028 1,000,000 EUR 1,155,740.00 1,165,130.00 0.08%
TELEKOM FINANZ 1,50 16-071226 3,000,000 EUR 2,998,350.00 3,273,870.00 0.23%
TELEPERFORMANCE 0,25 20-261127 2,000,000 EUR 1,984,260.00 1,993,500.00 0.14%
TELSTRA CORP. 1,00 20-230430 1,000,000 EUR 992,740.00 1,077,000.00 0.07%
TELSTRA CORP. 1,375 19-260329 1,500,000 EUR 1,499,025.00 1,661,640.00 0.11%

DPAM L
Securities portfolio statement as at 31 December 2020
The accompanying notes form an integral part of these Financial Statements
72
DPAM L BONDS EUR QUALITY SUSTAINABLE
Investment Quantity CCY Cost
(in EUR) Evaluation value
(in EUR)
% Total Net
Assets
TESCO CORP. TREASURY 0,875 19-290526 4,000,000 EUR 3,999,986.40 4,129,440.00 0.28%
THERMO FISHER 2,375 20-150432 2,600,000 EUR 2,572,440.00 3,157,778.00 0.22%
THERMO FISHER SCIENTIFIC 0,875 19-011031 1,500,000 EUR 1,488,645.00 1,583,422.50 0.11%
THERMO FISHER SCIENTIFIC 1,40 17-230126 4,000,000 EUR 3,992,471.25 4,286,320.00 0.29%
THERMO FISHER SCIENTIFIC 1,50 19-011039 2,000,000 EUR 1,902,860.00 2,203,180.00 0.15%
THERMO FISHER SCIENTIFIC 1,875 19-011049 1,500,000 EUR 1,474,890.00 1,740,600.00 0.12%
THERMO FISHER SCIENTIFIC 2,875 17-240737 2,000,000 EUR 2,080,600.00 2,656,730.00 0.18%
TLG IMMOBILIEN 1,50 19-280526 2,000,000 EUR 2,070,300.00 2,117,670.00 0.15%
TOTAL CAPITAL INTERNATIONAL 0,75 16-120728 4,800,000 EUR 4,738,944.00 5,092,488.00 0.35%
TOTAL CAPITAL INTERNATIONAL 1,491 20-080427 2,500,000 EUR 2,500,000.00 2,743,300.00 0.19%
TOTAL CAPITAL INTERNATIONAL 1,535 19-310539 1,500,000 EUR 1,500,000.00 1,760,032.50 0.12%
TOTAL CAPITAL INTERNATIONAL FRN 16-PERPETUAL 2,500,000 EUR 2,630,823.22 2,624,437.50 0.18%
TOYOTA FINANCE AUSTRALIA 0,50 18-060423 2,500,000 EUR 2,488,200.00 2,543,225.00 0.17%
TOYOTA MOTOR CREDIT 0,25 20-160726 2,500,000 EUR 2,494,225.00 2,545,162.50 0.18%
TOYOTA MOTOR FINANCE 0,625 18-260923 2,000,000 EUR 1,993,920.00 2,049,830.00 0.14%
UBS A.G. LONDON 0,625 18-230123 6,000,000 EUR 6,001,020.00 6,106,410.00 0.42%
UBS GROUP A.G. 0FRN 20-051128 2,500,000 EUR 2,479,825.00 2,511,987.50 0.17%
UBS GROUP FRN 20-290126 2,700,000 EUR 2,685,042.00 2,722,113.00 0.19%
UBS GROUP FUNDING 1,75 15-161122 1,000,000 EUR 993,300.00 1,038,070.00 0.07%
UNIBAIL RODAMCO SE 1,375 20-041231 2,300,000 EUR 2,293,951.00 2,317,687.00 0.16%
UNICREDIT SpA 0,50 19-090425 1,000,000 EUR 999,190.00 1,013,855.00 0.07%
UNICREDIT SpA 1,00 18-180123 7,000,000 EUR 6,847,208.24 7,139,580.00 0.49%
UNICREDIT SpA 1,80 20-200130 5,000,000 EUR 5,088,706.50 5,244,625.00 0.36%
UNICREDIT SpA FRN 20-220727 3,000,000 EUR 2,995,650.00 3,189,150.00 0.22%
UNILEVER N.V. 1,125 18-120227 1,600,000 EUR 1,619,216.00 1,724,248.00 0.12%
UPM-KYMMENE 0,125 20-191128 1,900,000 EUR 1,882,406.00 1,895,164.50 0.13%
VEOLIA ENVIRONNEMENT 0,892 19-140124 2,000,000 EUR 2,000,000.00 2,060,110.00 0.14%
VEOLIA ENVIRONNEMENT 1,94 18-070130 3,500,000 EUR 3,500,000.00 4,028,045.00 0.28%
VERIZON COMMUNICATIONS INC. 1,25 19-080430 3,000,000 EUR 2,977,320.00 3,266,535.00 0.22%
VERIZON COMMUNICATIONS INC.1,30 20-180533 3,000,000 EUR 3,040,196.00 3,266,835.00 0.22%
VERIZON COMMUNICATIONS INC.1,50 19-190939 2,000,000 EUR 1,976,460.00 2,204,540.00 0.15%
VERIZON COMMUNICATIONS INC.1,875 17-261029 4,000,000 EUR 4,344,900.00 4,573,680.00 0.31%
VERIZON COMMUNICATIONS INC. 2,625 14-011231 5,000,000 EUR 5,336,450.00 6,207,850.00 0.43%
VERIZON COMMUNICATIONS INC.2,875 17-150138 1,000,000 EUR 1,329,321.00 1,316,450.00 0.09%
VESTEDA FINANCE 1,50 19-240527 1,000,000 EUR 992,250.00 1,083,010.00 0.07%
VF CORP. 0,25 20-250228 4,000,000 EUR 3,966,900.00 4,047,460.00 0.28%
VINCI S.A. 0,00 20-271128 2,700,000 EUR 2,712,771.00 2,707,816.50 0.19%
VINCI S.A. 1,625 19-180129 4,000,000 EUR 3,961,360.00 4,520,340.00 0.31%
VINCI S.A. 1,75 18-260930 1,700,000 EUR 1,693,268.00 1,977,380.50 0.14%
VIVENDI 0,625 19-110625 3,000,000 EUR 2,997,360.00 3,092,940.00 0.21%
VODAFONE GROUP 0,90 19-241126 2,000,000 EUR 2,074,500.00 2,108,280.00 0.15%
VODAFONE GROUP 1,125 17-201125 2,000,000 EUR 1,983,340.00 2,113,460.00 0.15%
VODAFONE GROUP 1,625 19-241130 2,500,000 EUR 2,696,459.00 2,799,637.50 0.19%
VOLVO TREASURY 0,125 20-170924 1,000,000 EUR 996,580.00 1,005,780.00 0.07%
VONOVIA FINANCE 0,625 19-071027 2,000,000 EUR 1,978,820.00 2,073,020.00 0.14%
VONOVIA FINANCE 0,625 20-090726 3,000,000 EUR 2,990,520.00 3,100,770.00 0.21%
VONOVIA FINANCE 0,75 18-150124 1,000,000 EUR 993,300.00 1,027,025.00 0.07%
VONOVIA FINANCE 0,875 18-030723 2,000,000 EUR 2,045,600.00 2,051,200.00 0.14%
VONOVIA FINANCE 1,625 20-070424 1,500,000 EUR 1,497,465.00 1,581,105.00 0.11%
VONOVIA FINANCE 2,75 18-220338 1,300,000 EUR 1,272,648.00 1,685,482.50 0.12%
VONOVIA FINANCE FRN 14-PERPETUAL 5,000,000 EUR 5,216,562.02 5,176,300.00 0.36%

DPAM L
Securities portfolio statement as at 31 December 2020
The accompanying notes form an integral part of these Financial Statements
73
DPAM L BONDS EUR QUALITY SUSTAINABLE
Investment Quantity CCY Cost
(in EUR) Evaluation value
(in EUR)
% Total Net
Assets
WORLDLINE S.A. 0,50 20-300623 1,500,000 EUR 1,498,755.00 1,523,760.00 0.10%
WPC EUROBOND B.V. 2,125 18-150427 3,000,000 EUR 2,979,720.00 3,273,885.00 0.23%
WPC EUROBOND B.V. 2,25 18-090426 2,500,000 EUR 2,481,300.00 2,744,937.50 0.19%
Total EURO
1,356,307,183.79
1,426,708,794.26
98.17% Total Bonds
1,356,307,183.79
1,426,708,794.26
98.17% Total Transferable securities admitted to an official stock exchange or dealt in on another regulated market
1,356,307,183.79
1,426,708,794.26
98.17%
Total Portfolio
1,356,307,183.79
1,426,708,794.26
98.17%

DPAM L
Securities portfolio statement as at 31 December 2020
The accompanying notes form an integral part of these Financial Statements
74
DPAM L BONDS UNIVERSALIS UNCONSTRAINED
Investment Quantity CCY Cost
(in EUR) Evaluation value
(in EUR)
% Total Net
Assets
Transferable securities admitted to an official stock exchange or dealt in on another regulated market
Bonds
AUSTRALIA 1,00 19-211230 8,800,000 AUD 5,370,566.39 5,558,440.97 0.45%
AUSTRALIA 2,00 17-211221 17,500,000 AUD 11,752,872.92 11,243,772.07 0.91%
AUSTRALIA -INFLATION LINKED- 0,75 17-211127 55,000,000 AUD 38,015,344.21 41,067,545.57 3.32%
Total AUSTRALIAN DOLLAR
55,138,783.52
57,869,758.61
4.68%
CANADA -INFLATION LINKED- 4,25 95-011226 10,000,000 CAD 13,631,960.81 13,282,030.38 1.07%
CANADIAN GOVT 2,25 14-010625 6,800,000 CAD 4,836,690.30 4,727,806.01 0.38%
Total CANADIAN DOLLAR
18,468,651.11
18,009,836.39
1.46%
COCA-COLA CO 1,00 15-021028 8,000,000 CHF 7,826,747.53 8,018,972.77 0.65%
CREDIT SUISSE GROUP FINANCE Ltd 1,00 15-140423 6,500,000 CHF 6,008,326.57 6,160,230.68 0.50%
VERIZON COMMUNICATIONS INC. 0,375 17-310523 3,500,000 CHF 3,182,430.09 3,294,750.59 0.27%
Total SWISS FRANC
17,017,504.19
17,473,954.04
1.41%
CZECH 1,00 15-260626 260,000,000 CZK 9,932,871.13 9,968,201.20 0.81%
CZECH 1,50 20-240440 70,000,000 CZK 2,618,773.48 2,631,983.48 0.21%
CZECH 2,50 13-250828 200,000,000 CZK 7,952,148.80 8,437,552.36 0.68%
Total CZECH KORUNA
20,503,793.41
21,037,737.04
1.70%
AB INBEV 2,125 20-021227 3,000,000 EUR 2,994,900.00 3,418,380.00 0.28%
ADIDAS A.G. 0,625 20-100935 2,000,000 EUR 1,987,200.00 2,099,810.00 0.17%
ANHEUSER BUSCH INBEV 1,65 19-280331 10,000,000 EUR 10,089,946.00 11,262,350.00 0.91%
AT&T INC. 3,15 17-040936 8,000,000 EUR 8,032,208.00 10,144,880.00 0.82%
BANK OF AMERICA 1,776 17-040527 2,500,000 EUR 2,500,000.00 2,723,675.00 0.22%
BARCLAYS PLC 1,375 18-240126 2,000,000 EUR 1,996,160.00 2,098,920.00 0.17%
BARCLAYS PLC 1,875 16-081223 2,500,000 EUR 2,491,575.00 2,637,262.50 0.21%
BARCLAYS PLC FRN 17-070228 5,000,000 EUR 4,880,000.00 5,116,050.00 0.41%
BMW FINANCE N.V. 0,875 20-140132 1,600,000 EUR 1,592,752.00 1,724,864.00 0.14%
BMW FINANCE N.V. 1,50 19-060229 5,000,000 EUR 4,979,436.00 5,583,625.00 0.45%
BNP PARIBAS S.A. 0,625 20-031232 4,500,000 EUR 4,495,860.00 4,550,107.50 0.37%
BNP PARIBAS S.A. 1,50 17-230528 1,000,000 EUR 995,890.00 1,094,835.00 0.09%
BNP PARIBAS S.A. FRN 18-190123 5,000,000 EUR 4,996,370.00 5,027,450.00 0.41%
BNP PARIBAS S.A. FRN 19-040626 2,500,000 EUR 2,495,150.00 2,548,025.00 0.21%
CHINA 0,25 20-251130 23,000,000 EUR 22,872,260.00 23,009,200.00 1.86%
CHINA 0,625 20-251135 12,000,000 EUR 11,933,400.00 12,016,440.00 0.97%
CHINA GVT 0,50 19-121131 6,750,000 EUR 6,750,625.00 6,807,037.50 0.55%
CHUBB INA 0,875 19-150627 2,000,000 EUR 1,997,380.00 2,103,790.00 0.17%
CHUBB INA 0,875 19-151229 1,500,000 EUR 1,498,425.00 1,591,665.00 0.13%
COFIROUTE 1,00 20-190531 600,000 EUR 599,070.00 648,600.00 0.05%
COOP RABOBANK 0,25 19-301026 2,000,000 EUR 1,992,800.00 2,042,380.00 0.17%
COOP RABOBANK 0,625 19-270224 3,000,000 EUR 2,994,246.75 3,073,440.00 0.25%
CREDIT AGRICOLE 1,75 19-050329 4,000,000 EUR 3,994,206.00 4,478,600.00 0.36%
CREDIT AGRICOLE S.A. 0,375 19-211025 3,000,000 EUR 2,999,522.00 3,055,605.00 0.25%

DPAM L
Securities portfolio statement as at 31 December 2020
The accompanying notes form an integral part of these Financial Statements
75
DPAM L BONDS UNIVERSALIS UNCONSTRAINED
Investment Quantity CCY Cost
(in EUR) Evaluation value
(in EUR)
% Total Net
Assets
CREDIT AGRICOLE S.A. 0,875 20-140132 1,500,000 EUR 1,493,385.00 1,575,562.50 0.13%
CREDIT SUISSE GROUP FRN 19-240627 1,500,000 EUR 1,514,473.64 1,563,532.50 0.13%
DAIMLER A.G. 0,75 20-100930 2,000,000 EUR 1,983,760.00 2,082,410.00 0.17%
DAIMLER A.G. 1,125 19-080834 9,500,000 EUR 9,284,749.86 10,137,212.50 0.82%
DAIMLER A.G. 2,625 20-070425 6,200,000 EUR 6,175,076.00 6,876,668.00 0.56%
DAIMLER INTERNATIONAL FINANCE 0,625 19-060527 2,000,000 EUR 1,987,060.00 2,050,290.00 0.17%
DEUTSCHE TELEKOM A.G 1,375 19-050734 10,000,000 EUR 10,070,620.00 11,248,350.00 0.91%
DEUTSCHE TELEKOM A.G 1,75 19-250331 2,000,000 EUR 2,008,900.00 2,311,460.00 0.19%
DEUTSCHLAND -INFLATION LINKED- 0,10 15-150426 15,000,000 EUR 17,116,828.80 17,168,240.63 1.39%
ESSILOR LUXOTTICA 0,125 19-270525 1,400,000 EUR 1,390,382.00 1,413,601.00 0.11%
FRANCE OAT -INFLATION LINKED- 0,10 16-250747 7,000,000 EUR 8,355,264.58 10,069,232.36 0.81%
FRANCE OAT -INFLATION LINKED- 0,10 19-010329 23,000,000 EUR 25,866,706.61 26,149,613.52 2.11%
FRANCE OAT -INFLATION LINKED- 1,80 07-250740 12,000,000 EUR 21,237,242.97 23,869,280.63 1.93%
GERMANY -INFLATION LINKED- 0,10 12-150423 7,000,000 EUR 8,028,705.91 7,795,443.03 0.63%
GERMANY -INFLATION LINKED- 0,50 14-150430 20,000,000 EUR 25,025,283.35 25,388,367.39 2.05%
GOLDMAN SACHS GROUP FRN 20-210423 2,000,000 EUR 2,005,120.00 2,005,240.00 0.16%
HSBC HLDG PLC FRN 20-131131 3,000,000 EUR 3,000,000.00 3,107,385.00 0.25%
IBERDROLA FINANZAS 0,875 20-160625 1,600,000 EUR 1,596,544.00 1,667,208.00 0.13%
INTERNATIONAL BANK FOR RECONSTRUCTION & DEVELOPMENT 0,10 20-170935
2,700,000 EUR 2,693,979.00 2,765,664.00 0.22%
JP MORGAN CHASE & CO FRN 17-180528 2,000,000 EUR 2,000,000.00 2,192,720.00 0.18%
JP MORGAN CHASE & CO FRN 18-120629 2,800,000 EUR 2,800,000.00 3,148,698.00 0.25%
KBC GROUP 0,125 20-100926 5,000,000 EUR 4,983,350.00 5,013,975.00 0.41%
KONINKLIJKE AHOLD 0,25 19-260625 600,000 EUR 596,676.00 612,537.00 0.05%
KONINKLIJKE DSM 0,25 20-230628 3,200,000 EUR 3,188,896.00 3,270,448.00 0.26%
LINDE FINANCE B.V. 0,55 20-190532 3,000,000 EUR 2,983,020.00 3,134,880.00 0.25%
MEXICO BONOS 1,75 18-170428 15,000,000 EUR 14,370,000.00 15,808,875.00 1.28%
MEXICO BONOS 4,00 15-150315 20,000,000 EUR 20,977,050.00 23,090,500.00 1.87%
MITSUBISHI UFJ FINANCIAL 0,872 17-070924 2,500,000 EUR 2,500,000.00 2,587,075.00 0.21%
MONDELEZ INTL 0,375 20-220929 2,000,000 EUR 1,991,652.80 2,032,910.00 0.16%
MOODY'S CORP. 0,95 19-250230 5,000,000 EUR 4,990,614.00 5,321,675.00 0.43%
MORGAN STANLEY FRN 17-231026 5,000,000 EUR 5,022,717.00 5,308,400.00 0.43%
NESTLE FINANCE INTERNATIONAL 0,375 20-120532 3,000,000 EUR 2,944,710.00 3,109,035.00 0.25%
ORANGE 0,50 19-040932 700,000 EUR 695,100.00 718,007.50 0.06%
ORANGE 1,375 19-040949 10,000,000 EUR 9,724,797.33 11,359,800.00 0.92%
PORTUGAL 0,475 20-181030 32,000,000 EUR 31,951,120.00 33,403,680.00 2.70%
PORTUGAL 4,10 06-150437 15,000,000 EUR 21,412,293.85 23,742,450.00 1.92%
ROMANIA 2,00 20-280132 4,000,000 EUR 4,000,000.00 4,202,240.00 0.34%
ROMANIA 2,375 17-190427 2,000,000 EUR 1,957,500.00 2,188,340.00 0.18%
ROMANIA 2,625 20-021240 12,000,000 EUR 12,036,960.00 12,825,540.00 1.04%
SANTANDER CONSUMER 0,50 20-040227 6,000,000 EUR 5,967,520.00 6,102,810.00 0.49%
SIEMENS FINANCE 1,75 19-280239 7,500,000 EUR 7,499,131.00 9,378,412.50 0.76%
SPAIN KINGDOM 0,60 19-311029 12,800,000 EUR 12,865,828.57 13,561,024.00 1.10%
SPAIN KINGDOM 1,00 20-311050 14,000,000 EUR 13,681,925.00 14,511,630.00 1.17%
SPAIN KINGDOM 2,90 16-311046 10,000,000 EUR 10,482,400.98 14,999,250.00 1.21%
SPAIN KINGDOM -INFLATION LINKED- 0,70 17-301133 32,000,000 EUR 38,145,911.24 39,560,204.16 3.20%
TELEFONICA EMISIONE 0,664 20-030230 3,800,000 EUR 3,800,000.00 3,909,744.00 0.32%
TELEFONICA EMISIONE 2,932 14-171029 4,000,000 EUR 4,364,700.00 4,940,320.00 0.40%
TELEFONICA EUROPE FRN 18-PERPETUAL 7,000,000 EUR 6,863,250.00 7,198,415.00 0.58%
TELEFONICA EUROPE FRN 18-PERPETUAL 7,000,000 EUR 7,097,457.76 7,569,870.00 0.61%
TENNET HLDG 0,125 20-301132 2,500,000 EUR 2,481,025.00 2,489,050.00 0.20%

DPAM L
Securities portfolio statement as at 31 December 2020
The accompanying notes form an integral part of these Financial Statements
76
DPAM L BONDS UNIVERSALIS UNCONSTRAINED
Investment Quantity CCY Cost
(in EUR) Evaluation value
(in EUR)
% Total Net
Assets
UBS GROUP FUNDING 1,25 16-010926 8,750,000 EUR 8,669,078.16 9,324,218.75 0.75%
UNITED MEXICAN STATE 1,125 20-170130 1,500,000 EUR 1,483,725.00 1,496,272.50 0.12%
VERIZON COMMUNICATIONS INC.1,85 20-180540 10,000,000 EUR 10,330,491.20 11,509,900.00 0.93%
VINCI S.A. 1,75 18-260930 1,000,000 EUR 996,040.00 1,163,165.00 0.09%
VODAFONE GROUP FRN 20-270880 4,000,000 EUR 4,000,000.00 4,120,380.00 0.33%
VOLVO CAR AB 2,125 19-020424 5,000,000 EUR 5,057,682.82 5,170,575.00 0.42%
Total EURO
557,906,087.18
598,178,778.97
48.34%
BARCLAYS PLC FRN 17-061023 6,600,000 GBP 7,445,121.91 7,585,502.18 0.61%
ENEL FINANCE INTERNATIONAL 1,00 20-201027 2,200,000 GBP 2,432,277.34 2,497,138.87 0.20%
ENEL FINANCE INTERNATIONAL 5,75 09-140940 2,750,000 GBP 2,986,425.56 5,049,757.01 0.41%
SIEMENS FINANCE 1,00 20-200225 1,700,000 GBP 2,012,420.99 1,955,484.30 0.16%
UK TREASURY GILT 0,375 20-221030 2,700,000 GBP 3,020,896.79 3,064,685.51 0.25%
VODAFONE GROUP 3,375 16-080849 3,000,000 GBP 3,104,158.90 4,156,831.64 0.34%
Total BRITISH POUND
21,001,301.49
24,309,399.51
1.96%
JAPAN 0,40 19-200339 550,000,000 JPY 4,632,965.71 4,382,090.07 0.35%
JAPAN -INFLATION LINKED- 0,10 19-100329 600,000,000 JPY 5,074,785.11 4,770,841.95 0.39%
JAPAN -INFLATION LINKED- 0,20 20-100330 2,650,000,00
0 JPY 21,982,092.33 21,240,417.91 1.72%
JAPAN TREASURY 0,40 20-200340 775,000,000 JPY 6,483,489.42 6,145,376.88 0.50%
Total JAPANESE YEN
38,173,332.57
36,538,726.81
2.95%
MEXICO 7,75 11-131142 700,000 MXN 3,153,836.68 3,310,850.97 0.27%
MEXICO BONOS 5,75 15-050326 4,450,000 MXN 17,570,453.39 19,113,488.18 1.54%
MEXICO BONOS 8,50 08-310529 500,000 MXN 2,329,992.51 2,499,266.82 0.20%
Total NEW MEXICAN PESO
23,054,282.58
24,923,605.97
2.01%
NEW ZEALAND 1,75 20-150541 10,000,000 NZD 5,905,184.14 5,807,637.99 0.47%
NEW ZEALAND 3,00 18-200429 23,000,000 NZD 15,398,017.69 15,913,092.86 1.29%
NEW ZEALAND 4,50 14-150427 25,500,000 NZD 17,976,994.36 18,640,779.10 1.51%
NEW ZEALAND 5,50 11-150423 3,500,000 NZD 2,426,828.55 2,303,977.87 0.19%
Total NEW ZEALAND DOLLAR
41,707,024.74
42,665,487.82
3.45%
SWEDISH GOVT 2,25 12-010632 187,000,000 SEK 22,138,593.08 23,209,233.71 1.88%
Total SWEDISH KRONA
22,138,593.08
23,209,233.71
1.88%
ABB FINANCE USA INC. 2,875 12-080522 5,000,000 USD 3,969,937.13 4,226,656.04 0.34%
ALPHABET INC. 1,998 16-150826 10,000,000 USD 8,888,170.08 8,758,571.37 0.71%
ASIAN DEVELOPMENT BANK 0,75 20-081030 15,000,000 USD 12,489,974.83 11,936,986.63 0.96%
AT&T INC. 4,30 18-150230 4,026,000 USD 3,423,042.07 3,934,822.31 0.32%
BANK OF AMERICA FRN 17-240428 3,000,000 USD 2,396,534.59 2,797,192.59 0.23%
BANK OF AMERICA FRN 19-150350 16,000,000 USD 16,128,017.79 17,109,623.64 1.38%
BARCLAYS PLC 4,836 17-090528 5,000,000 USD 4,098,543.09 4,707,286.18 0.38%
CHINA GOVT INTERNATIONAL 1,20 20-211030 10,000,000 USD 8,444,232.60 8,143,026.44 0.66%
CHINA GOVT INTERNATIONAL 2,25 20-21102050 5,000,000 USD 4,220,477.06 4,020,064.57 0.32%
COMCAST 3,375 15-150825 5,000,000 USD 4,680,626.73 4,559,989.38 0.37%

DPAM L
Securities portfolio statement as at 31 December 2020
The accompanying notes form an integral part of these Financial Statements
77
DPAM L BONDS UNIVERSALIS UNCONSTRAINED
Investment Quantity CCY Cost
(in EUR) Evaluation value
(in EUR)
% Total Net
Assets
COOP RABOBANK UA 4,00 17-100429 4,000,000 USD 3,603,314.06 3,526,361.82 0.28%
ENEL FINANCE INTERNATIONAL 6,80 07-150937 3,250,000 USD 3,749,564.10 3,910,106.86 0.32%
EUROPEAN INVESTMENT BANK 0,75 20-230930 10,000,000 USD 8,312,130.41 7,979,731.11 0.64%
GOLDMAN SACHS GROUP 3,75 16-250226 5,000,000 USD 4,662,898.67 4,648,175.39 0.38%
GOLDMAN SACHS GROUP 6,25 11-010241 5,000,000 USD 3,739,744.51 6,443,300.23 0.52%
GRUPO TELEVISA 5,00 14-130545 7,000,000 USD 5,577,455.04 6,932,348.49 0.56%
INTERNATIONAL BANK FOR RECONSTRUCTION & DEVELOPMENT 0,875 20-140530
24,000,000 USD 21,022,214.64 19,395,758.24 1.57%
JP MORGAN CHASE & CO 5,60 11-150741 7,000,000 USD 6,332,891.33 8,647,693.19 0.70%
MAROCCO KINGDOM 3,00 20-151232 2,500,000 USD 2,054,938.71 2,075,569.04 0.17%
MEXICO BONOS 4,50 19-220429 7,000,000 USD 6,775,802.37 6,719,753.99 0.54%
MICROSOFT CORP. 3,50 15-120235 10,000,000 USD 10,158,376.06 10,068,039.72 0.81%
ORACLE CORP. 2,50 12-151022 5,000,000 USD 4,047,775.93 4,248,477.79 0.34%
SCHLUMBERGER FINANCE 3,90 19-170528 5,171,000 USD 4,489,642.92 4,768,895.64 0.39%
SUMITOMO MITSUI 4,306 18-161028 2,500,000 USD 2,167,786.69 2,442,646.40 0.20%
TENCENT HLDG LTD 3,80 15-110225 5,000,000 USD 4,114,818.26 4,495,280.13 0.36%
US TREASURY 0,625 20-150830 25,000,000 USD 20,264,485.64 19,916,750.85 1.61%
US TREASURY 1,125 20-150840 10,000,000 USD 7,833,618.27 7,735,559.48 0.63%
US TREASURY BONDS -INFLATION LINKED- 0,75 15-150245 40,000,000 USD 42,961,535.26 46,644,803.64 3.77%
US TREASURY -INFLATION LINKED- 0,375 13-150723 22,500,000 USD 21,147,467.35 21,809,724.16 1.76%
US TREASURY -INFLATION LINKED- 0,50 19-150424 36,000,000 USD 32,820,152.91 32,556,210.32 2.63%
US TREASURY -INFLATION LINKED- 0,75 18-150728 17,000,000 USD 16,533,831.92 16,165,882.64 1.31%
Total U.S. DOLLAR
301,110,001.02
311,325,288.28
25.16%
SOUTH AFRICA 7,75 12-280223 194,000,000 ZAR 12,891,345.80 11,501,487.55 0.93%
SOUTH AFRICA 8,5 13-310137 400,000,000 ZAR 20,820,011.18 18,485,960.46 1.49%
Total SOUTH AFRICAN RAND
33,711,356.98
29,987,448.01
2.42% Total Bonds
1,149,930,711.87
1,205,529,255.16
97.42% Total Transferable securities admitted to an official stock exchange or dealt in on another regulated market
1,149,930,711.87
1,205,529,255.16
97.42%
Options
CALL US TREASURY LG BD FÉVRIER 21 ST 173 -300 USD -500,653.25 -344,795.88 -0.03%
Total U.S. DOLLAR
-500,653.25
-344,795.88
-0.03% Total Options
-500,653.25
-344,795.88
-0.03% Total Portfolio
1,149,430,058.62
1,205,184,459.28
97.39%

DPAM L
Securities portfolio statement as at 31 December 2020
The accompanying notes form an integral part of these Financial Statements
78
DPAM L BONDS HIGHER YIELD
Investment Quantity CCY Cost
(in EUR) Evaluation value
(in EUR)
% Total Net
Assets
Transferable securities admitted to an official stock exchange or dealt in on another regulated market
Bonds
BRAZIL -INFLATION LINKED- 6,00 20-150525 3,000 BRL 1,945,640.36 1,903,380.79 0.94%
Total BRAZILIAN REAL
1,945,640.36
1,903,380.79
0.94%
ACCOR CV 0,70 20-071227 9,591 EUR 461,518.92 501,882.64 0.25%
AGEAS FRN 19-PERPETUAL 2,000,000 EUR 2,000,000.00 2,130,780.00 1.05%
AKELIUS RESIDENTIAL PROPERTY FRN 20-170581 1,285,000 EUR 1,285,000.00 1,300,580.63 0.64%
ALTICE FINCO 4,75 17-150128 2,000,000 EUR 1,865,000.00 1,940,330.00 0.95%
ALTICE FRANCE S.A. 3,375 19-150128 2,000,000 EUR 2,000,000.00 1,983,350.00 0.98%
ARAMARK INTERNATIONAL FINANCE 3,125 17-010425 1,000,000 EUR 1,019,365.00 1,007,650.00 0.50%
ARDAGH PKG FINANCE 2,125 20-150826 1,300,000 EUR 1,287,244.00 1,306,259.50 0.64%
ARD FINANCE S.A. 5,00 19-300627 1,000,000 EUR 1,000,000.00 1,022,920.00 0.50%
ARENA LUXEMBOURG 1,875 20-010228 1,500,000 EUR 1,500,000.00 1,432,237.50 0.70%
ASSICURAZIONI GENERALI FRN 16-080648 1,500,000 EUR 1,596,750.00 1,819,582.50 0.89%
AVANTOR FUNDING 2,625 20-011125 1,500,000 EUR 1,500,000.00 1,539,067.50 0.76%
AVANTOR FUNDING 3,875 20-150728 1,000,000 EUR 1,000,000.00 1,052,750.00 0.52%
AXALTA COATING SYSTEMS 3,75 16-150125 1,100,000 EUR 1,125,450.00 1,124,398.00 0.55%
BELFIUS BANQUE FRN 18-PERPETUAL 2,000,000 EUR 1,809,000.00 1,956,560.00 0.96%
BLITZ -F- 6,00 18-300726 1,000,000 EUR 996,541.43 1,052,255.00 0.52%
CAIXABANK S.A. FRN 18-PERPETUAL 2,000,000 EUR 1,905,000.00 2,055,370.00 1.01%
CASINO GUICHARD-PERRACHON 4,498 14-070324 1,000,000 EUR 958,812.50 980,865.00 0.48%
CEMEX 3,125 19-190326 1,000,000 EUR 1,008,358.00 1,032,245.00 0.51%
CENTRAL BANK TUNISIA 6,375 19-150726 1,000,000 EUR 989,450.00 917,075.00 0.45%
CHEPLAPHARMACEUTICAL 3,50 20-110227 1,000,000 EUR 1,012,500.00 1,006,405.00 0.49%
CMA CGM 7,50 20-150126 2,000,000 EUR 1,956,960.00 2,149,440.00 1.06%
CONSTANTIN INVESTMENT 5,375 17-150425 1,300,000 EUR 1,266,102.00 1,329,724.50 0.65%
CONSTELLIUM 4,25 17-150226 1,000,000 EUR 1,004,250.00 1,024,805.00 0.50%
COOP RABOBANK FRN 18-PERPETUAL 1,000,000 EUR 1,089,975.00 1,093,990.00 0.54%
COOP RABOBANK FRN 20-PERPETUAL 2,600,000 EUR 2,600,000.00 2,881,853.00 1.42%
DKT FINANCE APS 7,00 18-170623 1,000,000 EUR 1,040,000.00 1,034,800.00 0.51%
DUFRY ONE B.V. 2,00 19-150227 1,000,000 EUR 1,000,000.00 941,905.00 0.46%
EDF FRN 20-PERPETUAL 3,000,000 EUR 2,954,250.00 3,162,300.00 1.56%
ENEL SpA FRN 20-PERPETUAL 1,100,000 EUR 1,091,882.00 1,148,856.50 0.56%
ENERGIAS DE PORTUGAL FRN 19-300479 1,000,000 EUR 1,043,500.00 1,100,925.00 0.54%
ENERGIAS DE PORTUGAL FRN 20-200780 1,000,000 EUR 997,440.00 999,545.00 0.49%
ERSTE GROUP BANK FRN 20-PERPETUAL 2,000,000 EUR 2,000,000.00 2,073,460.00 1.02%
FAURECIA 2,375 19-150627 1,000,000 EUR 1,000,000.00 1,012,190.00 0.50%
FAURECIA 3,75 20-150628 1,000,000 EUR 1,000,000.00 1,054,025.00 0.52%
FEDERAL-MOGUL 5,00 17-150724 1,000,000 EUR 1,003,500.00 1,015,450.00 0.50%
FORTIS BANK FRN 07-PERPETUAL CONV 2,000,000 EUR 1,598,750.00 1,683,330.00 0.83%
GRIFOLS S.A. 2,25 19-151127 1,000,000 EUR 1,029,800.00 1,016,165.00 0.50%
HEIMSTADEN BOSTAD FRN 19-PERPETUAL 1,000,000 EUR 1,000,000.00 1,032,530.00 0.51%
HEIMSTADEN FRN 20-PERPETUAL 2,300,000 EUR 2,286,177.00 2,392,782.00 1.18%
HSBC HLDG FRN 14-PERPETUAL 2,000,000 EUR 2,035,200.00 2,092,000.00 1.03%
HT TROPLAST GMBH 9,25 20-150725 1,000,000 EUR 1,040,562.50 1,116,435.00 0.55%
INEOS FINANCE 3,375 20-310326 2,500,000 EUR 2,500,000.00 2,583,662.50 1.27%
INTERTRUST GROUP B.V. 3,375 18-151125 1,000,000 EUR 1,000,000.00 1,024,685.00 0.50%

DPAM L
Securities portfolio statement as at 31 December 2020
The accompanying notes form an integral part of these Financial Statements
79
DPAM L BONDS HIGHER YIELD
Investment Quantity CCY Cost
(in EUR) Evaluation value
(in EUR)
% Total Net
Assets
INTESA SAN PAOLO SpA FRN 17-PERPETUAL 2,500,000 EUR 3,001,250.00 2,998,762.50 1.47%
IQVIA INC. 2,25 19-150128 2,000,000 EUR 2,030,510.00 2,023,930.00 1.00%
KBC GROUP FRN 18-PERPETUAL 3,000,000 EUR 2,948,636.30 3,150,255.00 1.55%
LA POSTE S.A. FRN 18-PERPETUAL 1,500,000 EUR 1,530,275.00 1,615,867.50 0.79%
LEVI STRAUSS & CO 3,375 17-150327 650,000 EUR 672,805.00 674,794.25 0.33%
LINCOLN FINANCING 3,625 19-010424 1,000,000 EUR 1,000,000.00 1,013,440.00 0.50%
LOXAM SAS 3,75 19-150726 1,000,000 EUR 1,000,000.00 1,020,415.00 0.50%
LOXAM SAS 5,75 19-150727 1,500,000 EUR 1,446,120.00 1,519,012.50 0.75%
MAXEDA DIY HLDG 5,875 20-011026 1,000,000 EUR 1,000,000.00 1,045,935.00 0.51%
MEXICO BONOS 4,00 15-150315 3,000,000 EUR 2,675,296.87 3,463,575.00 1.70%
MONTENEGRO 2,55 19-031029 1,800,000 EUR 1,761,228.00 1,708,929.00 0.84%
NOKIA CORP. 3,125 20-150528 500,000 EUR 498,955.00 551,122.50 0.27%
NORTH MACEDONIA 3,675 20-060326 500,000 EUR 492,780.00 561,400.00 0.28%
OI EUROPEAN GROUP 2,875 19-150225 1,000,000 EUR 1,000,000.00 1,018,230.00 0.50%
ORANO S.A. 2,75 20-080328 1,000,000 EUR 991,640.00 1,052,450.00 0.52%
PAPREC HLDG S.A. 4,00 18-310325 1,000,000 EUR 1,002,618.33 1,002,195.00 0.49%
PEACH PROPERTY FINANCE 4,375 20-151125 2,000,000 EUR 2,000,000.00 2,094,440.00 1.03%
PIAGGIO 3,625 18-300425 700,000 EUR 714,700.00 717,370.50 0.35%
PICARD BONDCO 5,50 17-301124 1,000,000 EUR 1,018,750.00 1,027,385.00 0.51%
PPF TELECOM 3,25 20-290927 1,000,000 EUR 992,320.00 1,076,855.00 0.53%
RCS & RDS S.A. 2,50 20-050225 2,000,000 EUR 2,000,000.00 1,987,680.00 0.98%
ROSSINI FRN 19-301025 2,000,000 EUR 2,000,000.00 1,995,320.00 0.98%
SARENS FINANCE CO N.V. 5,75 20-240227 1,500,000 EUR 1,500,000.00 1,397,385.00 0.69%
SHUNSHINE MID B.V. 6,50 18-150526 800,000 EUR 791,066.40 833,040.00 0.41%
SIGMA HOLDCO B.V. 5,75 18-150526 1,000,000 EUR 984,000.00 992,565.00 0.49%
SISAL PAY SpA FRN 19-171226 2,000,000 EUR 2,000,000.00 2,006,450.00 0.99%
SOLVAY FINANCE FRN 13-PERPETUAL 2,852,000 EUR 3,070,372.97 3,167,973.08 1.56%
SPIE S.A. 2,625 19-180626 1,500,000 EUR 1,500,000.00 1,573,965.00 0.77%
STARFRUIT US STAR 6,50 18-011026 500,000 EUR 431,750.00 530,235.00 0.26%
SYNLAB BONDCO FRN 20-010725 4,500,000 EUR 4,485,000.00 4,598,235.00 2.26%
TELECOM ITALIA SpA 3,625 16-250526 2,100,000 EUR 2,105,930.00 2,318,316.00 1.14%
TELECOM ITALIA SpA 5,25 05-170355 3,000,000 EUR 3,510,827.00 3,827,520.00 1.88%
TELECOM ITALIA SpA 7,75 03-240133 2,000,000 EUR 3,008,960.00 2,960,620.00 1.46%
TELEFONICA EUROPE FRN 18-PERPETUAL 1,500,000 EUR 1,444,940.00 1,542,517.50 0.76%
TELEFONICA EUROPE FRN 19-PERPETUAL 3,000,000 EUR 3,000,000.00 3,262,800.00 1.60%
TELENET FINANCE LUX NOTE 3,50 17-010328 3,900,000 EUR 3,887,413.50 4,056,117.00 1.99%
TEREOS FINANCE 7,50 20-301025 100,000 EUR 97,962.00 106,204.00 0.05%
THREEAB OPTIQUE DEVELOPMENT 4,00 17-011023 500,000 EUR 480,870.00 508,205.00 0.25%
TITAN GLOBAL FINANCE 2,75 20-090727 2,500,000 EUR 2,500,000.00 2,596,437.50 1.28%
UNICREDIT SpA FRN 19-311249 1,000,000 EUR 1,115,871.66 1,161,405.00 0.57%
UNILABS SUBHOLDING 5,75 17-150525 2,700,000 EUR 2,701,110.37 2,773,359.00 1.36%
UNIPOL GRUPPO FINANZIARO SpA 3,25 20-230930 2,000,000 EUR 1,995,120.00 2,114,740.00 1.04%
UNITED GROUP B.V. 4,875 17-010724 1,000,000 EUR 1,000,000.00 1,024,730.00 0.50%
UPC HLDG B.V. 3,875 17-150629 1,000,000 EUR 1,037,000.00 1,030,075.00 0.51%
VERISURE MIDHLDG AB 5,75 17-011223 2,000,000 EUR 2,004,200.00 2,028,440.00 1.00%
VIRGIN MEDIA 3,75 20-150730 500,000 EUR 500,000.00 510,705.00 0.25%
VMED O2 UK FINANCING 3,25 20-310131 2,000,000 EUR 2,000,000.00 2,058,050.00 1.01%
VZ VENDOR FINANCE 2,875 20-150129 1,500,000 EUR 1,500,000.00 1,499,497.50 0.74%
WIENERBERGER A.G. 2,75 20-040625 500,000 EUR 497,125.00 534,485.00 0.26%

DPAM L
Securities portfolio statement as at 31 December 2020
The accompanying notes form an integral part of these Financial Statements
80
DPAM L BONDS HIGHER YIELD
Investment Quantity CCY Cost
(in EUR) Evaluation value
(in EUR)
% Total Net
Assets
ZF FINANCE GMBH 3,00 20-210925 1,000,000 EUR 994,300.00 1,036,510.00 0.51%
Total EURO
141,780,041.75
147,497,367.10
72.54%
INDONESIA 8,25 15-150536 98,000,000,0
00 IDR 6,389,875.25 6,659,212.71 3.27%
Total INDONESIAN RUPIAH
6,389,875.25
6,659,212.71
3.27%
MEXICAN BONOS 7,75 11-290531 1,200,000 MXN 5,645,146.37 5,786,270.22 2.85%
MEXICO BONOS 8,00 17-071147 400,000 MXN 1,787,662.90 1,936,591.07 0.95%
Total NEW MEXICAN PESO
7,432,809.27
7,722,861.29
3.80%
ALTICE FRANCE HLDG 6,00 20-150228 1,000,000 USD 922,876.23 832,757.14 0.41%
ALTICE FRANCE S.A. 7,375 16-010526 2,000,000 USD 1,931,896.79 1,714,658.17 0.84%
ARAMARK SERVICES 5,00 18-010228 1,000,000 USD 818,703.01 862,179.72 0.42%
ARCELORMITTAL FRN 11-010341 1,500,000 USD 1,586,955.52 1,709,022.92 0.84%
ARMENIA 3,95 19-260929 1,000,000 USD 886,139.37 824,731.31 0.41%
AT SECURITIES B.V. FRN 17-PERPETUAL 1,500,000 USD 1,278,799.78 1,287,237.96 0.63%
AUTOPISTAS DEL ND 9,39 06-150424 2,000,000 USD 865,928.53 939,202.26 0.46%
COSAN OVERSEAS 8,25 10-PERPETUAL 2,000,000 USD 1,443,943.17 1,682,530.34 0.83%
CREDIT AGRICOLE FRN 14-PERPETUAL 1,000,000 USD 1,055,016.47 931,257.41 0.46%
CREDIT SUISSE FRN 17-PERPETUAL 1,000,000 USD 896,251.21 864,447.72 0.43%
CSC HLDG LLC 6,50 19-010229 2,000,000 USD 1,969,611.54 1,845,972.78 0.91%
DARLING INGREDIENTS 5,25 19-150427 1,000,000 USD 902,958.54 869,367.83 0.43%
IHO VERWALTUNGS 4,75 16-150926 1,000,000 USD 827,040.25 849,086.68 0.42%
IRON MOUNTAIN 5,25 17-150328 1,000,000 USD 952,229.45 862,486.21 0.42%
MILLICOM INTERNATIONAL CELL 5,125 17-150128 750,000 USD 627,431.30 652,317.03 0.32%
MILLICOM INTERNATIONAL CELL 6,25 19-250329 1,000,000 USD 884,212.38 923,660.66 0.45%
SOFTBK GROUP CORP. FRN 17-PERPETUA 1,000,000 USD 822,444.43 802,460.05 0.39%
SPCM S.A. 4,875 17-150925 1,500,000 USD 1,392,130.72 1,269,020.47 0.62%
TESLA INC. 5,30 17-150825 1,000,000 USD 925,053.42 851,244.33 0.42%
TRIVIUM PACKAGING 8,50 19-150827 1,500,000 USD 1,390,540.91 1,353,647.17 0.67%
UBS GROUP FRN 20-PERPETUAL 1,000,000 USD 862,589.49 875,542.48 0.43%
UBS GROUP FUNDING FRN 19-PERPETUAL 500,000 USD 437,234.92 448,371.54 0.22%
VM HLDG S.A. 5,375 17-030527 2,000,000 USD 1,822,997.29 1,825,646.68 0.90%
VODAFONE GROUP FRN 19-040479 1,500,000 USD 1,495,907.33 1,530,323.65 0.75%
Total U.S. DOLLAR
26,998,892.05
26,607,172.51
13.08%
SOUTH AFRICA 8,5 13-310137 120,000,000 ZAR 5,334,780.67 5,545,788.14 2.73%
Total SOUTH AFRICAN RAND
5,334,780.67
5,545,788.14
2.73% Total Bonds
189,882,039.35
195,935,782.54
96.36% Total Transferable securities admitted to an official stock exchange or dealt in on another regulated market
189,882,039.35
195,935,782.54
96.36%
Other Transferable Securities
CIE FONCIERE FID 0,10 94-311222 492,680 EUR 0.01 0.00 0.00%
CIE FONCIERE FID STEP UP 93-311222 460,508 EUR 0.01 0.00 0.00%

DPAM L
Securities portfolio statement as at 31 December 2020
The accompanying notes form an integral part of these Financial Statements
81
DPAM L BONDS HIGHER YIELD
Investment Quantity CCY Cost
(in EUR) Evaluation value
(in EUR)
% Total Net
Assets
LYONDELLBASELL INDUSTRIES 8,375 05-150815-DEFAULT- 9,000,000 EUR 7,651,013.53 0.00 0.00%
UNICREDIT-MITSUBISHI FRN 09-151250 2,000,000 EUR 1,383,000.00 1,023,000.00 0.50%
Total EURO
9,034,013.55
1,023,000.00
0.50% Total Other Transferable Securities
9,034,013.55
1,023,000.00
0.50% Total Portfolio
198,916,052.90
196,958,782.54
96.86%

DPAM L
Securities portfolio statement as at 31 December 2020
The accompanying notes form an integral part of these Financial Statements
82
DPAM L BONDS GOVERNMENT SUSTAINABLE HEDGED
Investment Quantity CCY Cost
(in EUR) Evaluation value
(in EUR)
% Total Net
Assets
Transferable securities admitted to an official stock exchange or dealt in on another regulated market
Bonds
AUSTRALIA 1,00 20-211131 14,250,000 AUD 8,730,525.56 8,932,851.91 1.13%
AUSTRALIA 2,75 15-211127 31,000,000 AUD 20,844,748.87 22,371,379.92 2.82%
AUSTRALIA 3,00 16-210347 13,500,000 AUD 10,250,568.15 10,463,095.99 1.32%
AUSTRALIA 3,25 13-210425 23,000,000 AUD 15,486,071.98 16,360,664.74 2.07%
AUSTRALIA GOVT 2,75 18-210541 4,250,000 AUD 3,104,827.88 3,148,232.53 0.40%
AUSTRALIA -INFLATION LINKED- 2,50 10-200930 12,100,000 AUD 11,188,316.17 12,405,094.58 1.57%
Total AUSTRALIAN DOLLAR
69,605,058.61
73,681,319.67
9.30%
CANADA 1,00 16-010627 57,000,000 CAD 37,461,377.31 37,819,909.55 4.77%
CANADA 2,75 11-010622 16,000,000 CAD 11,060,155.40 10,640,338.72 1.34%
CANADA 3,50 11-011245 12,250,000 CAD 11,320,825.76 11,872,904.64 1.50%
CANADIAN GOVT 1,25 19-010630 27,000,000 CAD 18,300,898.99 18,227,338.34 2.30%
Total CANADIAN DOLLAR
78,143,257.46
78,560,491.25
9.92%
SWISS CONFEDERATION 0,50 15-270530 14,500,000 CHF 14,816,557.08 14,807,214.18 1.87%
SWITZERLAND 1,50 13-240725 2,500,000 CHF 2,640,726.76 2,555,360.37 0.32%
Total SWISS FRANC
17,457,283.84
17,362,574.55
2.19%
DENMARK KINGDOM 0,50 18-151129 240,000,000 DKK 34,585,509.99 35,046,168.11 4.42%
DENMARK KINGDOM 1,50 11-151123 60,000,000 DKK 8,759,638.43 8,559,740.45 1.08%
DENMARK KINGDOM -INFLATION LINKED- 0,10 11-151123 13,300,000 DKK 1,997,275.69 2,012,518.44 0.25%
DENMARK KINGDOM -INFLATION LINKED- 0,10 18-151130 13,700,000 DKK 1,964,233.97 2,180,285.58 0.28%
Total DANISH KRONE
47,306,658.08
47,798,712.58
6.03%
AUSTRIA 0,75 18-200228 23,000,000 EUR 24,515,780.00 25,218,810.00 3.18%
AUSTRIA 0,85 20-30062120 500,000 EUR 490,050.00 661,295.00 0.08%
AUSTRIA 1,50 16-200247 3,125,000 EUR 3,895,438.75 4,325,500.00 0.55%
AUSTRIA 2,40 13-230534 4,500,000 EUR 6,029,841.67 6,139,350.00 0.78%
BELGIUM KINGDOM OLO 88 1,7 19-22062050 6,500,000 EUR 8,324,108.00 9,007,407.50 1.14%
BELGIUM OLO 0,20 16-221023 15,000,000 EUR 15,411,600.00 15,388,125.00 1.94%
BELGIUM OLO 87 0,90 19-220629 23,000,000 EUR 25,385,465.58 25,691,690.00 3.24%
DEUTSCHLAND -INFLATION LINKED- 0,10 15-150426 2,700,000 EUR 3,122,263.18 3,090,283.32 0.39%
EXPORT DEVELOPMENT 0,00 20-270125 4,600,000 EUR 4,652,808.00 4,684,870.00 0.59%
FINLAND 1,125 18-150434 9,500,000 EUR 10,613,241.66 11,269,707.50 1.42%
FINLAND 2,75 12-040728 20,500,000 EUR 25,122,939.09 25,757,430.00 3.25%
FRANCE OAT 1,25 17-250534 19,000,000 EUR 22,289,233.12 22,636,315.00 2.86%
FRANCE OAT 1,50 18-250550 3,000,000 EUR 3,908,710.00 3,999,705.00 0.50%
FRANCE OAT -INFLATION LINKED- 0,10 19-010329 27,000,000 EUR 30,030,757.87 30,697,372.39 3.88%
IRELAND 1,35 18-180331 21,500,000 EUR 24,166,647.50 25,224,445.00 3.18%
IRISH TREASURY 1,00 16-150526 14,000,000 EUR 14,900,200.40 15,216,530.00 1.92%
IRISH TREASURY 1,50 19-150550 7,500,000 EUR 8,898,750.00 10,077,225.00 1.27%
KFW 0,625 17-220227 23,500,000 EUR 24,586,305.49 25,233,830.00 3.19%
KFW 1,25 16-040736 11,500,000 EUR 12,765,725.49 13,903,500.00 1.76%

DPAM L
Securities portfolio statement as at 31 December 2020
The accompanying notes form an integral part of these Financial Statements
83
DPAM L BONDS GOVERNMENT SUSTAINABLE HEDGED
Investment Quantity CCY Cost
(in EUR) Evaluation value
(in EUR)
% Total Net
Assets
LUXEMBOURG 0,625 17-010227 700,000 EUR 697,640.00 750,624.00 0.09%
NETHERLANDS GOVT 0,50 19-150140 8,000,000 EUR 8,952,590.48 9,194,440.00 1.16%
REPUBLIKA SLOVENIJA 1,25 17-220327 24,000,000 EUR 25,723,654.55 26,467,440.00 3.34%
REPUBLIKA SLOVENIJA 1,50 15-250335 16,000,000 EUR 17,512,984.50 19,368,960.00 2.45%
SLOVENIA 0,488 20-201050 1,500,000 EUR 1,497,705.00 1,584,285.00 0.20%
Total EURO
323,494,440.33
335,589,139.71
42.36%
UK TREASURY 1,25 17-220727 46,000,000 GBP 55,370,053.47 55,543,805.16 7.01%
UK TREASURY 3,50 14-220145 8,500,000 GBP 14,110,165.31 15,306,789.75 1.93%
Total BRITISH POUND
69,480,218.78
70,850,594.91
8.94%
JAPAN 0,10 19-200929 300,000,000 JPY 2,542,913.83 2,401,440.09 0.30%
JAPAN -INFLATION LINKED- 0,10 19-100329 1,721,200,00
0 JPY 14,661,287.61 13,685,955.28 1.73%
JAPAN TREASURY 0,10 17-200927 900,000,000 JPY 7,585,940.22 7,217,001.80 0.91%
Total JAPANESE YEN
24,790,141.66
23,304,397.17
2.94%
NORWAY 1,75 15-130325 40,000,000 NOK 4,298,826.49 4,006,032.84 0.51%
NORWAY 2,00 18-260428 170,000,000 NOK 17,787,784.99 17,573,725.66 2.22%
NORWAY 3,75 10-250521 25,000,000 NOK 3,068,674.85 2,419,363.30 0.31%
Total NORWEGIAN KRONE
25,155,286.33
23,999,121.80
3.03%
NEW ZEALAND 1,50 19-150531 18,000,000 NZD 10,670,008.51 11,125,597.27 1.40%
NEW ZEALAND 1,75 20-150541 8,200,000 NZD 4,931,737.85 4,762,263.15 0.60%
NEW ZEALAND 2,75 16-150437 8,000,000 NZD 5,260,181.00 5,545,345.42 0.70%
NEW ZEALAND 4,50 14-150427 35,000,000 NZD 24,617,397.74 25,585,383.08 3.23%
NEW ZEALAND 5,50 11-150423 19,400,000 NZD 13,266,828.57 12,770,620.22 1.61%
NEW ZEALAND -INFLATION LINKED- 2,00 12-200925 2,700,000 NZD 1,907,696.08 1,975,381.91 0.25%
Total NEW ZEALAND DOLLAR
60,653,849.75
61,764,591.05
7.80%
SWEDEN 0,125 19-120531 50,000,000 SEK 4,944,797.52 5,028,835.15 0.63%
SWEDEN 1,00 14-121126 100,000,000 SEK 10,185,247.42 10,670,398.57 1.35%
SWEDEN 3,50 09-300339 61,000,000 SEK 8,362,649.23 9,480,450.82 1.20%
SWEDEN -INFLATION LINKED- 0,125 17-011227 70,700,000 SEK 8,324,245.72 8,367,063.71 1.06%
SWEDEN -INFLATION LINKED- 0,25 11-010622 13,700,000 SEK 1,645,595.06 1,502,248.58 0.19%
Total SWEDISH KRONA
33,462,534.95
35,048,996.83
4.42% Total Bonds
749,548,729.79
767,959,939.52
96.95% Total Transferable securities admitted to an official stock exchange or dealt in on another regulated market
749,548,729.79
767,959,939.52
96.95%
Total Portfolio
749,548,729.79
767,959,939.52
96.95%

DPAM L
Securities portfolio statement as at 31 December 2020
The accompanying notes form an integral part of these Financial Statements
84
DPAM L EQUITIES CONVICTION RESEARCH
Investment Quantity CCY Cost
(in EUR) Evaluation value
(in EUR)
% Total Net
Assets
Transferable securities admitted to an official stock exchange or dealt in on another regulated market
Shares & Related Securities
LONZA GROUP A.G. -REG- 23,500 CHF 7,036,506.49 12,358,929.31 3.76%
NESTLE -REG- 135,000 CHF 11,941,501.99 13,013,822.75 3.96%
NOVARTIS -REG- 167,000 CHF 12,301,139.27 12,916,231.33 3.93%
Total SWISS FRANC
31,279,147.75
38,288,983.39
11.66%
DSV PANALPINA 65,000 DKK 6,016,158.54 8,907,159.99 2.71%
Total DANISH KRONE
6,016,158.54
8,907,159.99
2.71%
AIR LIQUIDE 90,000 EUR 9,488,724.74 12,082,500.00 3.68%
ALD S.A. 800,000 EUR 9,381,423.58 9,200,000.00 2.80%
AMADEUS IT GROUP S.A. 160,000 EUR 10,431,370.88 9,529,600.00 2.90%
AMUNDI S.A. 125,000 EUR 7,276,797.83 8,350,000.00 2.54%
BEIERSDORF A.G. 120,000 EUR 11,877,096.13 11,332,800.00 3.45%
CELLNEX TELECOM S.A. 180,000 EUR 7,968,584.06 8,841,600.00 2.69%
FERRARI N.V. 50,000 EUR 7,270,860.22 9,432,500.00 2.87%
FERROVIAL S.A. 353,500 EUR 9,868,876.16 7,989,100.00 2.43%
GRIFOLS S.A. 500,000 EUR 13,048,682.11 11,940,000.00 3.64%
IBERDROLA S.A. 750,000 EUR 6,910,885.76 8,775,000.00 2.67%
INTERPUMP GROUP SpA 270,000 EUR 7,434,709.29 10,891,800.00 3.32%
KERRY GROUP PLC 100,000 EUR 10,595,900.28 11,850,000.00 3.61%
KONINKLIJKE KPN 3,650,000 EUR 9,177,485.97 9,077,550.00 2.76%
MEDIOBANCA 1,100,000 EUR 8,545,270.26 8,294,000.00 2.53%
NESTE CORP. 160,000 EUR 4,484,463.18 9,465,600.00 2.88%
SAMPO OYJ 210,000 EUR 7,834,152.05 7,259,700.00 2.21%
SAP A.G. 85,000 EUR 8,541,961.79 9,113,700.00 2.78%
SCHNEIDER ELECTRIC SE 80,000 EUR 6,094,173.90 9,464,000.00 2.88%
SODEXO 170,000 EUR 13,794,097.79 11,767,400.00 3.58%
TELEPERFORMANCE 33,000 EUR 5,653,696.45 8,952,900.00 2.73%
Total EURO
175,679,212.43
193,609,750.00
58.95%
ASTRAZENECA PLC 140,000 GBP 10,313,570.98 11,455,256.40 3.49%
BEAZLEY PLC 1,800,000 GBP 10,349,453.80 7,331,918.22 2.23%
BURBERRY GROUP PLC 601,000 GBP 11,710,015.03 12,015,299.97 3.66%
CRODA INTERNATIONAL PLC 190,000 GBP 9,911,697.64 14,001,117.19 4.26%
Total BRITISH POUND
42,284,737.45
44,803,591.78
13.64%
EQUINOR ASA 600,000 NOK 7,874,519.21 8,301,832.76 2.53%
ORKLA ASA 1,500,000 NOK 11,396,351.82 12,457,044.67 3.79%
Total NORWEGIAN KRONE
19,270,871.03
20,758,877.43
6.32%
ATLAS COPCO AB -REG -A- 220,000 SEK 7,251,716.35 9,219,485.50 2.81%

DPAM L
Securities portfolio statement as at 31 December 2020
The accompanying notes form an integral part of these Financial Statements
85
DPAM L EQUITIES CONVICTION RESEARCH
Investment Quantity CCY Cost
(in EUR) Evaluation value
(in EUR)
% Total Net
Assets
INTRUM AB 370,000 SEK 7,755,071.01 7,982,883.02 2.43%
Total SWEDISH KRONA
15,006,787.36
17,202,368.52
5.24% Total Shares & Related Securities
289,536,914.56
323,570,731.11
98.52% Total Transferable securities admitted to an official stock exchange or dealt in on another regulated market
289,536,914.56
323,570,731.11
98.52%
Other Transferable Securities
CHINA DIAMOND CORP. 4,500,000 USD 214,411.18 0.00 0.00%
Total U.S. DOLLAR
214,411.18
0.00
0.00% Total Other Transferable Securities
214,411.18
0.00
0.00% Total Portfolio
289,751,325.74
323,570,731.11
98.52%

DPAM L
Securities portfolio statement as at 31 December 2020
The accompanying notes form an integral part of these Financial Statements
86
DPAM L BONDS EUR HIGH YIELD SHORT TERM
Investment Quantity CCY Cost
(in EUR) Evaluation value
(in EUR)
% Total Net
Assets
Transferable securities admitted to an official stock exchange or dealt in on another regulated market
Bonds
ADLER REAL ESTATE A.G. 1,50 17-061221 4,180,000 EUR 4,220,445.42 4,187,294.10 1.22%
ADLER REAL ESTATE A.G. 1,50 19-170422 6,500,000 EUR 6,508,250.00 6,494,962.50 1.89%
ARCELORMITTAL 2,25 19-170124 5,000,000 EUR 4,941,355.15 5,220,175.00 1.52%
AREVA S.A. 4,875 09-230924 6,000,000 EUR 6,846,417.00 6,894,120.00 2.01%
BALL CORP. 4,375 15-151223 6,800,000 EUR 7,691,190.00 7,506,180.00 2.19%
CASINO GUICHARD-PERRACHON 1,865 17-130622 7,000,000 EUR 6,773,750.00 7,098,385.00 2.07%
CMA CGM 6,50 17-150722 8,350,000 EUR 8,443,000.00 8,507,564.50 2.48%
CROWN EUROPEAN HLDG 0,75 19-150223 4,500,000 EUR 4,502,070.00 4,497,682.50 1.31%
CROWN EUROPEAN HLDG 2,25 18-010223 11,500,000 EUR 11,986,888.77 11,782,095.00 3.43%
DKT FINANCE APS 7,00 18-170623 2,900,000 EUR 3,180,091.67 3,000,920.00 0.87%
EIRCOM FINANCE 1,75 19-011124 5,000,000 EUR 4,933,000.00 4,927,825.00 1.44%
ELIS S.A. 1,875 18-150223 16,400,000 EUR 16,755,176.96 16,742,104.00 4.88%
FCE BANK PLC 1,615 16-110523 1,400,000 EUR 1,408,120.00 1,406,580.00 0.41%
FIAT CHRYSLER AUTO 3,375 20-070723 2,800,000 EUR 2,921,195.00 2,989,490.00 0.87%
FIAT CHRYSLER AUTO 3,75 16-290324 12,700,000 EUR 13,842,303.50 13,967,968.00 4.07%
FNAC DARTY S.A. 1,875 19-300524 7,400,000 EUR 7,376,916.00 7,516,328.00 2.19%
FORD MOTOR CREDIT 1,514 19-170223 7,500,000 EUR 7,306,315.00 7,504,237.50 2.19%
FORD MOTOR CREDIT 3,021 19-060324 4,000,000 EUR 4,092,500.00 4,153,500.00 1.21%
GESTAMP FUND LUX S.A. 3,50 16-150523 700,000 EUR 705,915.00 706,321.00 0.21%
GRUPO-ANTOLIN IRAUSA 3,25 17-300424 4,000,000 EUR 3,736,250.00 3,964,380.00 1.16%
HIPERCOR 3,875 15-190122 2,000,000 EUR 2,125,000.00 2,068,800.00 0.60%
HJ HEINZ CO 2,00 15-300623 1,500,000 EUR 1,516,585.00 1,553,910.00 0.45%
IMMOFINANZ A.G. 2,625 19-270123 1,000,000 EUR 1,060,645.00 1,033,075.00 0.30%
INEOS GROUP HLDG 5,375 16-010824 1,750,000 EUR 1,769,682.50 1,775,751.25 0.52%
INTERNATIONAL GAME TECHNOLOGY 3,50 18-150724 2,000,000 EUR 2,075,866.00 2,091,300.00 0.61%
INTERNATIONAL GAME TECHNOLOGY 4,75 15-150223 11,000,000 EUR 12,127,132.69 11,547,085.00 3.37%
LIMACORPORATE SpA FRN 17-150823 970,000 EUR 944,601.00 964,912.35 0.28%
LKQ ITALIA BONDCO 3,875 16-010424 5,000,000 EUR 5,403,750.00 5,416,975.00 1.58%
LOXAM SAS 3,50 16-030523 8,550,000 EUR 8,736,960.01 8,639,091.00 2.52%
LOXAM SAS 3,50 17-150422 2,000,000 EUR 2,042,940.00 2,028,500.00 0.59%
MATTERHORN TELECOM 2,625 19-150924 4,000,000 EUR 4,056,800.00 4,051,600.00 1.18%
NEXANS 2,75 17-050424 3,500,000 EUR 3,689,500.00 3,703,822.50 1.08%
NEXANS 3,25 16-260521 100,000 EUR 108,884.48 100,557.50 0.03%
NEXANS 3,75 18-080823 4,200,000 EUR 4,609,460.54 4,518,906.00 1.32%
NOKIA OYJ 2,00 17-150324 5,000,000 EUR 5,163,800.00 5,192,575.00 1.51%
NOMAD FOODS 3,25 17-150524 4,235,000 EUR 4,300,219.00 4,296,640.42 1.25%
OCI N.V. 3,125 19-011124 4,000,000 EUR 4,129,160.00 4,126,780.00 1.20%
OI EUROPEAN GROUP 3,125 16-151124 4,000,000 EUR 4,147,000.00 4,151,340.00 1.21%
PEACH PROPERTY FINANCE 3,50 19-150223 4,500,000 EUR 4,455,330.00 4,613,062.50 1.34%
PICARD BONDCO 5,50 17-301124 2,000,000 EUR 2,058,100.00 2,054,770.00 0.60%
PICARD GROUPE SAS FRN 17-301123 11,000,000 EUR 10,686,340.00 11,009,570.00 3.21%
PPF TELECOM 3,50 20-200524 5,000,000 EUR 5,269,250.00 5,310,025.00 1.55%
RENAULT S.A. S.A. 1,00 17-080323 8,000,000 EUR 7,798,360.00 8,018,400.00 2.34%
SAGAX AB 2,00 18-170124 1,000,000 EUR 988,565.00 1,045,530.00 0.30%
SCHAEFFLER FINANCE B.V. 1,875 19-260324 7,000,000 EUR 7,222,925.00 7,238,840.00 2.11%
SIG COMBIBLOC 1,875 20-180623 5,000,000 EUR 5,000,000.00 5,173,750.00 1.51%

DPAM L
Securities portfolio statement as at 31 December 2020
The accompanying notes form an integral part of these Financial Statements
87
DPAM L BONDS EUR HIGH YIELD SHORT TERM
Investment Quantity CCY Cost
(in EUR) Evaluation value
(in EUR)
% Total Net
Assets
SOFTBK GROUP CORP. 4,00 15-300722 2,450,000 EUR 2,629,592.35 2,548,318.50 0.74%
SOFTBK GROUP CORP.4,00 18-200423 13,550,000 EUR 14,572,841.65 14,157,920.75 4.13%
SPIE S.A. 3,125 17-220324 8,000,000 EUR 8,296,684.00 8,475,960.00 2.47%
TDC A/S FRN 12-020322 12,400,000 EUR 13,592,896.83 13,081,194.00 3.81%
TELECOM ITALIA SpA 1,125 15-260322 8,100,000 EUR 7,838,748.05 8,080,276.50 2.35%
TELECOM ITALIA SpA 3,625 16-190124 8,100,000 EUR 8,789,228.80 8,694,540.00 2.53%
TESSENDERLO CHEMIE 2,875 15-150722 1,000,000 EUR 1,042,500.00 1,029,415.00 0.30%
UNITED GROUP B.V. 4,875 17-010724 1,500,000 EUR 1,537,500.00 1,537,095.00 0.45%
VERISURE HLDG AB 3,50 18-150523 3,000,000 EUR 2,932,200.00 3,048,240.00 0.89%
VERISURE MIDHLDG AB 5,75 17-011223 10,000,000 EUR 10,163,140.00 10,142,200.00 2.96%
VILMORIN ET CIE 2,375 14-260521 3,000,000 EUR 3,144,521.25 3,017,685.00 0.88%
WIENERBERGER A.G. 2,00 18-020524 4,000,000 EUR 4,061,250.00 4,186,840.00 1.22%
ZF EUROPE FINANCE 1,25 19-231023 2,000,000 EUR 1,986,100.00 1,987,170.00 0.58%
ZF NORTH AMERICA CAP 2,75 15-270423 5,500,000 EUR 5,554,400.00 5,645,117.50 1.65%
Total EURO
325,799,608.62
326,425,652.87
95.13% Total Bonds
325,799,608.62
326,425,652.87
95.13% Total Transferable securities admitted to an official stock exchange or dealt in on another regulated market
325,799,608.62
326,425,652.87
95.13%
Other Transferable Securities
ARGAN 3,25 17-040723 700,000 EUR 722,050.00 738,458.00 0.22%
Total EURO
722,050.00
738,458.00
0.22% Total Other Transferable Securities
722,050.00
738,458.00
0.22% Total Portfolio
326,521,658.62
327,164,110.87
95.35%

DPAM L
Securities portfolio statement as at 31 December 2020
The accompanying notes form an integral part of these Financial Statements
88
DPAM L PATRIMONIAL FUND
Investment Quantity CCY Cost
(in EUR) Evaluation value
(in EUR)
% Total Net
Assets
Transferable securities admitted to an official stock exchange or dealt in on another regulated market
Shares & Related Securities
LONZA GROUP A.G. -REG- 1,750 CHF 764,929.07 920,345.80 0.47%
SIG COMBIBLOC A.G. 33,000 CHF 628,791.26 626,711.66 0.32%
Total SWISS FRANC
1,393,720.33
1,547,057.46
0.79%
AMADEUS IT GROUP S.A. 19,000 EUR 1,059,011.65 1,131,640.00 0.58%
ASML HLDG N.V. 2,200 EUR 659,480.75 874,610.00 0.45%
CELLNEX TELECOM S.A. 17,400 EUR 849,075.26 854,688.00 0.44%
CONTINENTAL A.G. 8,400 EUR 1,001,574.54 1,018,500.00 0.52%
CORBION 6,800 EUR 302,992.60 313,820.00 0.16%
DANONE 19,000 EUR 1,031,082.74 1,021,440.00 0.52%
EDP ENERGIAS -REG- 150,000 EUR 708,560.74 773,400.00 0.39%
HELLOFRESH SE 15,000 EUR 649,067.01 948,000.00 0.48%
INFINEON TECHNOLOGIES 40,843 EUR 1,015,689.85 1,282,061.77 0.65%
MEDIOBANCA 124,433 EUR 963,085.54 938,224.82 0.48%
MERCK KGAA 8,900 EUR 1,102,319.94 1,249,115.00 0.64%
SAP A.G. 8,700 EUR 806,036.03 932,814.00 0.48%
UCB 12,000 EUR 976,228.95 1,013,760.00 0.52%
UMICORE S.A. 24,750 EUR 910,315.62 972,427.50 0.50%
Total EURO
12,034,521.22
13,324,501.09
6.79%
ALIBABA GROUP HLDG LTD 30,000 HKD 839,939.45 714,010.91 0.36%
HONG KONG EXCHANGES & CLEARING 22,000 HKD 780,123.16 1,008,258.45 0.51%
Total HONG KONG DOLLAR
1,620,062.61
1,722,269.36
0.88%
EAST JAPAN RAILWAY COMPANY 8,100 JPY 488,263.91 425,629.20 0.22%
KEYENCE CORP. 2,200 JPY 718,885.67 999,466.06 0.51%
NIDEC CORP. 9,400 JPY 583,579.63 974,039.67 0.50%
SONY CORP. 14,500 JPY 929,758.75 1,194,889.87 0.61%
SYSMEX CORP. 9,700 JPY 727,186.53 964,813.50 0.49%
Total JAPANESE YEN
3,447,674.49
4,558,838.30
2.32%
DNB NOR ASA -A- 60,000 NOK 941,154.49 962,199.31 0.49%
LEROY SEAFOOD GROUP ASA 137,000 NOK 770,353.95 791,974.04 0.40%
Total NORWEGIAN KRONE
1,711,508.44
1,754,173.35
0.89%
ASSA ABLOY AB -B- 35,000 SEK 665,466.88 705,329.15 0.36%
BOLIDEN AB 33,000 SEK 891,663.85 956,978.65 0.49%
Total SWEDISH KRONA
1,557,130.73
1,662,307.80
0.85%
SATS LTD 280,021 SGD 675,100.50 683,991.68 0.35%
Total SINGAPORE DOLLAR
675,100.50
683,991.68
0.35%

DPAM L
Securities portfolio statement as at 31 December 2020
The accompanying notes form an integral part of these Financial Statements
89
DPAM L PATRIMONIAL FUND
Investment Quantity CCY Cost
(in EUR) Evaluation value
(in EUR)
% Total Net
Assets
A.O.SMITH CORP. 16,000 USD 772,233.06 716,864.86 0.37%
ACCENTURE PLC -A- 4,000 USD 675,009.66 853,941.40 0.44%
ACTIVISION BLIZZARD INC. 12,000 USD 718,281.92 910,628.91 0.46%
AGILENT TECHNOLOGIES INC. 10,000 USD 818,704.80 968,411.59 0.49%
ALPHABET INC. -C- 690 USD 824,842.83 987,942.63 0.50%
AUTOMATIC DATA PROCESSING INC. 5,000 USD 686,879.65 720,035.96 0.37%
BOOKING HLDG INC. 590 USD 970,483.30 1,073,997.22 0.55%
COMCAST CORP. -A- 17,500 USD 674,072.03 749,458.54 0.38%
DANAHER CORP. 4,800 USD 794,668.54 871,457.64 0.44%
INTUITIVE SURGICAL INC. 1,300 USD 815,470.00 869,216.62 0.44%
MARSH & MC LENNAN 7,062 USD 603,862.26 675,292.39 0.34%
MASTERCARD INC. -A- 2,750 USD 668,474.26 802,243.47 0.41%
MERCK & CO INC.-NEW- 9,000 USD 541,752.97 601,691.80 0.31%
NORFOLK SOUTHERN CORP. 4,800 USD 749,697.59 932,146.62 0.48%
PARKER-HANNIFINANCE CORP. 4,500 USD 869,470.66 1,001,875.69 0.51%
PNC FINANCIAL SERVICES GROUP 9,000 USD 1,022,288.41 1,095,991.17 0.56%
PROGRESSIVE CORP.-OHIO 11,000 USD 845,404.12 888,954.27 0.45%
ROSS STORES INC. 8,800 USD 761,098.75 883,272.44 0.45%
SYSCO CORP. 15,000 USD 904,923.81 910,383.72 0.46%
Total U.S. DOLLAR
14,717,618.62
16,513,806.94
8.42% Total Shares & Related Securities
37,157,336.94
41,766,945.98
21.29% Bonds
AUSTRALIA 4,25 13-210426 2,700,000 AUD 2,108,443.02 2,047,528.38 1.04%
AUSTRALIA -INFLATION LINKED- 2,00 13-210835 1,500,000 AUD 1,394,753.18 1,478,951.19 0.75%
Total AUSTRALIAN DOLLAR
3,503,196.20
3,526,479.57
1.80%
CANADA 2,25 18-010629 3,700,000 CAD 2,717,148.12 2,697,441.94 1.38%
CANADIAN GOVT 1,25 19-010630 1,800,000 CAD 1,226,891.18 1,215,155.89 0.62%
Total CANADIAN DOLLAR
3,944,039.30
3,912,597.83
1.99%
ALLIANZ SE FRN 13-PERPETUAL 1,700,000 EUR 1,848,651.00 1,904,841.50 0.97%
APPLE INC. 1,00 14-101122 3,500,000 EUR 3,582,278.00 3,588,077.50 1.83%
AT&T INC. 0,25 19-040326 1,700,000 EUR 1,709,219.50 1,715,334.00 0.87%
BANCO SANTANDER S.A. 1,375 17-090222 2,100,000 EUR 2,145,633.30 2,138,976.00 1.09%
BANK OF AMERICA 0,75 16-260723 1,737,000 EUR 1,763,761.86 1,778,349.29 0.91%
BTPS 3,45 17-010348 600,000 EUR 861,750.00 884,745.00 0.45%
CASINO GUICHARD-PERRACHON 5,976 11-260521 1,000,000 EUR 1,069,242.50 1,024,685.00 0.52%
CORP ANDINA FOMENTO 0,75 18-130623 2,700,000 EUR 2,745,743.00 2,749,464.00 1.40%
DEUTSCHLAND -INFLATION LINKED- 0,10 15-150426 4,610,000 EUR 5,254,152.60 5,276,372.62 2.69%
EDF FRN 13-PERPETUAL 1,400,000 EUR 1,551,606.50 1,609,979.00 0.82%
ENGIE S.A. 6,375 09-180121 1,900,000 EUR 1,911,457.00 1,904,674.00 0.97%
FRANCE OAT 2,25 13-250524 3,540,000 EUR 3,934,999.94 3,901,876.50 1.99%
FRANCE OAT -INFLATION LINKED- 0,70 13-250730 1,100,000 EUR 1,400,524.54 1,400,721.98 0.71%
GERMANY -INFLATION LINKED- 0,10 12-150423 3,773,000 EUR 4,179,627.36 4,201,743.79 2.14%
GLENCORE FINANCE 1,875 16-130923 1,000,000 EUR 1,036,251.50 1,045,385.00 0.53%
GOLDMAN SACHS GROUP 4,75 06-121021 2,000,000 EUR 2,097,745.00 2,071,860.00 1.06%

DPAM L
Securities portfolio statement as at 31 December 2020
The accompanying notes form an integral part of these Financial Statements
90
DPAM L PATRIMONIAL FUND
Investment Quantity CCY Cost
(in EUR) Evaluation value
(in EUR)
% Total Net
Assets
GRAND CITY PROPERTIES S.A. 1,50 18-220227 1,100,000 EUR 1,134,953.50 1,177,555.50 0.60%
ING BANK FRN 14-250226 1,249,000 EUR 1,291,145.25 1,255,625.94 0.64%
ITALY BTP 1,65 20-011230 1,400,000 EUR 1,550,396.50 1,554,231.00 0.79%
ITALY BTP 2,15 14-151221 4,000,000 EUR 4,107,600.00 4,102,360.00 2.09%
ITALY BTP 3,75 10-010321 2,000,000 EUR 2,053,500.00 2,013,510.00 1.03%
ITALY BTP -INFLATION LINKED- 3,10 11-150926 1,100,000 EUR 1,451,098.84 1,485,639.01 0.76%
KBC GROUP 0,75 17-010322 2,000,000 EUR 2,026,110.00 2,025,010.00 1.03%
KBC GROUP S.A. FRN 19-PERPETUAL 1,200,000 EUR 1,293,220.00 1,279,746.00 0.65%
KFW 0,00 18-250521 5,000,000 EUR 5,013,900.00 5,011,925.00 2.55%
KFW 1,625 14-150121 4,700,000 EUR 4,708,765.50 4,702,420.50 2.40%
LOGICOR FINANCING 1,625 19-150727 1,150,000 EUR 1,216,666.25 1,223,847.25 0.62%
MERLIN PROPERTIES SOCIMI 2,225 16-250423 1,000,000 EUR 1,032,217.50 1,044,450.00 0.53%
MEXICO BONOS 4,00 15-150315 1,100,000 EUR 1,138,220.68 1,269,977.50 0.65%
MORGAN STANLEY 1,75 15-300125 800,000 EUR 858,681.50 856,444.00 0.44%
NESTLE FINANCE INTERNATIONAL 0,125 20-121127 1,400,000 EUR 1,414,923.50 1,423,219.00 0.73%
NETHERLANDS GOVT 3,25 11-150721 2,000,000 EUR 2,051,234.55 2,041,580.00 1.04%
NOVARTIS FINANCE S.A. 0,75 14-091121 2,000,000 EUR 2,021,020.00 2,019,870.00 1.03%
OMV A.G. FRN 15-PERPETUAL 2,000,000 EUR 2,139,463.00 2,093,420.00 1.07%
ORANGE 2,50 12-010323 1,700,000 EUR 1,806,394.50 1,802,110.50 0.92%
PERNOD RICARD 1,50 16-180526 600,000 EUR 612,852.00 651,252.00 0.33%
PORTUGAL 0,475 20-181030 1,000,000 EUR 1,039,182.50 1,043,865.00 0.53%
PROCTER & GAMBLE 2,00 13-051121 1,700,000 EUR 1,736,771.00 1,734,671.50 0.88%
RELX FINANCE B.V. 1,375 16-120526 480,000 EUR 477,966.70 515,383.20 0.26%
RENAULT S.A. S.A. 1,00 17-281125 1,550,000 EUR 1,516,939.10 1,507,847.75 0.77%
ROMANIA 2,375 17-190427 1,000,000 EUR 1,091,151.00 1,094,170.00 0.56%
SIEMENS FINANCE 0,90 19-280228 1,700,000 EUR 1,785,403.00 1,828,902.50 0.93%
SIEMENS FINANCE 2,875 13-100328 1,400,000 EUR 1,601,052.00 1,714,034.00 0.87%
SPAIN KINGDOM 0,60 19-311029 1,400,000 EUR 1,483,097.00 1,483,237.00 0.76%
SPAIN KINGDOM 2,35 17-300733 800,000 EUR 1,008,771.00 1,010,516.00 0.52%
SPAIN KINGDOM -INFLATION LINKED- 1,00 15-301130 500,000 EUR 628,349.51 627,169.29 0.32%
TOTAL CAPITAL INTERNATIONAL FRN 16-PERPETUAL 1,100,000 EUR 1,166,570.00 1,154,752.50 0.59%
UBS GROUP FUNDING 1,75 15-161122 1,300,000 EUR 1,353,209.00 1,349,491.00 0.69%
UNICREDIT SpA 2,731 20-150132 800,000 EUR 812,584.00 810,892.00 0.41%
UNILEVER N.V. 0,00 17-310721 5,500,000 EUR 5,507,673.98 5,511,027.50 2.81%
Total EURO
97,223,726.46
97,617,237.62
49.76%
UK TREASURY -INFLATION LINKED- GILT 0,125 12-220324 2,000,000 GBP 2,979,076.63 2,984,611.92 1.52%
Total BRITISH POUND
2,979,076.63
2,984,611.92
1.52%
INDONESIA 6,125 12-150528 12,000,000,0
00 IDR 746,110.63 706,260.57 0.36%
INDONESIA 8,25 11-150632 5,000,000,00
0 IDR 361,450.84 335,868.51 0.17%
Total INDONESIAN RUPIAH
1,107,561.47
1,042,129.08
0.53%
JAPAN -INFLATION LINKED- 0,20 20-100330 150,000,000 JPY 1,207,756.45 1,202,287.81 0.61%
Total JAPANESE YEN
1,207,756.45
1,202,287.81
0.61%

DPAM L
Securities portfolio statement as at 31 December 2020
The accompanying notes form an integral part of these Financial Statements
91
DPAM L PATRIMONIAL FUND
Investment Quantity CCY Cost
(in EUR) Evaluation value
(in EUR)
% Total Net
Assets
MEXICO BONOS 8,50 08-310529 230,000 MXN 1,221,867.84 1,149,662.74 0.59%
Total NEW MEXICAN PESO
1,221,867.84
1,149,662.74
0.59%
NEW ZEALAND 2,75 16-150437 1,000,000 NZD 711,915.53 693,168.17 0.35%
Total NEW ZEALAND DOLLAR
711,915.53
693,168.17
0.35%
PERU 6,35 16-120828 2,100 PEN 591,662.33 603,137.64 0.31%
Total PERUVIAN SOL
591,662.33
603,137.64
0.31%
SWEDEN 1,50 11-131123 11,000,000 SEK 1,231,773.84 1,154,203.61 0.59%
SWEDEN -INFLATION LINKED- 0,125 17-011227 10,000,000 SEK 1,185,538.44 1,183,460.21 0.60%
SWEDISH TREASURY 0,75 16-120528 13,220,000 SEK 1,379,049.06 1,402,634.31 0.72%
Total SWEDISH KRONA
3,796,361.34
3,740,298.13
1.91%
APPLE INC. 3,85 13-040543 990,000 USD 942,052.10 1,030,201.17 0.53%
COMCAST 3,375 15-150825 1,300,000 USD 1,192,384.15 1,185,597.24 0.60%
EMD FINANCIAL LLC 2,95 15-190322 1,400,000 USD 1,183,764.66 1,175,036.57 0.60%
GOLDMAN SACHS 3,85 17-260127 1,100,000 USD 1,053,195.93 1,027,228.55 0.52%
JP MORGAN CHASE & CO 5,60 11-150741 800,000 USD 944,017.57 988,307.79 0.50%
PFIZER INC. 2,75 16-030626 1,200,000 USD 1,087,378.21 1,084,746.85 0.55%
TOTAL CAPITAL INTERNATIONAL 2,875 12-170222 900,000 USD 762,928.20 756,984.19 0.39%
US TREASURY 2,25 17-1502827 2,000,000 USD 1,965,906.75 1,813,166.60 0.92%
US TREASURY -INFLATION LINKED- 0,125 20-150130 2,500,000 USD 2,328,035.01 2,307,032.43 1.18%
US TREASURY -INFLATION LINKED- 1,375 14-150244 1,100,000 USD 1,350,046.69 1,447,090.95 0.74%
Total U.S. DOLLAR
12,809,709.27
12,815,392.34
6.53% Total Bonds
129,096,872.82
129,287,002.85
65.91% Total Transferable securities admitted to an official stock exchange or dealt in on another regulated market
166,254,209.76
171,053,948.83
87.20%
Investment funds
DPAM INVESTMENT B EQUITIES SUS FOOD TREND -P- 3,400 EUR 507,738.46 662,082.00 0.34%
DPAM INVESTMENT B REAL ESTATE EUR SUSTAINABLE -P- 1,100 EUR 598,752.00 616,759.00 0.31%
DPAM L BONDS EMERGING MARKETS SUSTAINABLE -P- 11,000 EUR 1,558,920.00 1,557,600.00 0.79%
DPAM L BONDS EUR CORPORATE HIGH YIELD -P- 50,000 EUR 7,825,857.14 7,985,000.00 4.07%
Total EURO
10,491,267.60
10,821,441.00
5.52% Total Investment funds
10,491,267.60
10,821,441.00
5.52% Other Transferable Securities
WISDOMTREE PHYSICAL GOLD 47,000 USD 6,735,186.27 6,896,444.77 3.52%
Total U.S. DOLLAR 6,735,186.27 6,896,444.77 3.52%
Total Other Transferable Securities
6,735,186.27
6,896,444.77
3.52% Total Portfolio
183,480,663.63
188,771,834.60
96.23%

DPAM L
Securities portfolio statement as at 31 December 2020
The accompanying notes form an integral part of these Financial Statements
92
DPAM L BONDS EMERGING MARKETS SUSTAINABLE
Investment Quantity CCY Cost
(in EUR) Evaluation value
(in EUR)
% Total Net
Assets
Transferable securities admitted to an official stock exchange or dealt in on another regulated market
Bonds
BRASIL TREASURY BILLS 0,01 19-010723 100,000 BRL 14,310,982.20 13,968,192.15 0.52%
BRAZIL 10,00 16-010127 25,000 BRL 4,509,035.87 4,643,590.24 0.17%
BRAZIL 10,00 18-010129 200,000 BRL 47,065,393.38 37,951,623.44 1.41%
BRAZIL 10,00 20-010131 100,000 BRL 19,024,035.76 19,134,070.51 0.71%
BRAZIL -INFLATION LINKED- 6,00 11-150822 30,000 BRL 24,195,070.72 18,046,528.80 0.67%
BRAZIL -INFLATION LINKED- 6,00 20-150525 10,000 BRL 6,309,075.12 6,363,199.31 0.24%
Total BRAZILIAN REAL
115,413,593.05
100,107,204.45
3.73%
CHILE 2,30 20-011028 16,000,000,000 CLP 17,758,254.39 18,465,664.26 0.69%
CHILE 4,70 18-010930 17,000,000,000 CLP 22,262,692.56 23,301,823.67 0.87%
CHILE 5,00 15-010335 20,000,000,000 CLP 28,624,743.66 28,270,659.59 1.05%
Total CHILEAN PESO
68,645,690.61
70,038,147.52
2.61%
COLOMBIA 3,30 -INFLATION LINKED- 16-170327 150,000,000 COP 11,521,888.59 11,032,309.74 0.41%
COLOMBIA 5,75 20-031127 35,000,000,000 COP 8,605,730.06 8,855,094.77 0.33%
COLOMBIA 6,00 12-280428 150,000,000,000 COP 39,900,954.38 38,301,468.62 1.43%
COLOMBIA 6,25 17-261125 35,000,000,000 COP 9,769,775.86 9,164,898.28 0.34%
COLOMBIA 7,00 16-300632 70,000,000,000 COP 18,082,460.35 18,423,879.13 0.69%
COLOMBIA 7,25 19-181034 25,000,000,000 COP 6,753,204.64 6,687,987.53 0.25%
COLOMBIA 7,50 11-260826 50,000,000,000 COP 15,342,294.65 13,788,803.49 0.51%
COLOMBIA 7,75 14-180930 70,000,000,000 COP 18,975,031.00 19,648,625.33 0.73%
COLUMBIA -INFLATION LINKED- 4,75 06-230223 50,000,000 COP 3,301,526.62 3,588,574.21 0.13%
Total COLOMBIAN PESO
132,252,866.15
129,491,641.10
4.82%
CZECH 0,25 17-100227 900,000,000 CZK 32,436,172.03 32,875,257.04 1.22%
CZECH 2,50 13-250828 150,000,000 CZK 6,146,666.05 6,328,164.27 0.24%
CZECH 2,75 18-230729 450,000,000 CZK 18,708,729.01 19,408,241.95 0.72%
CZECH 4,85 07-261157 625,000,000 CZK 38,664,477.15 39,846,784.34 1.48%
Total CZECH KORUNA
95,956,044.24
98,458,447.60
3.67%
BANK CENT OF TUNISIA 6,75 18-311023 15,995,000 EUR 16,078,637.84 15,246,593.95 0.57%
CENTRAL BANK TUNISIA 6,375 19-150726 9,000,000 EUR 8,643,855.00 8,253,675.00 0.31%
IVORY COAST 4,875 20-300132 2,500,000 EUR 2,475,050.00 2,572,950.00 0.10%
IVORY COAST 5,25 18-220330 14,000,000 EUR 14,122,427.01 15,051,330.00 0.56%
IVORY COAST 5,875 19-171031 7,000,000 EUR 6,877,160.00 7,752,500.00 0.29%
IVORY COAST 6,625 18-220348 7,000,000 EUR 7,117,500.00 7,773,850.00 0.29%
IVORY COAST 6,875 19-171040 9,000,000 EUR 8,665,500.00 10,283,040.00 0.38%
KINGDOM OF MOROCCO 1,375 20-300326 3,000,000 EUR 3,016,500.00 3,029,565.00 0.11%
MACEDONIA 2,75 18-180125 500,000 EUR 514,250.00 530,445.00 0.02%
MACEDONIA 5,625 16-260723 3,600,000 EUR 3,971,750.00 4,034,394.00 0.15%
MEXICO BONOS 4,00 15-150315 252,000 EUR 285,768.00 290,940.30 0.01%
MOROCCO 1,50 19-271131 3,000,000 EUR 2,784,000.00 2,930,700.00 0.11%
MOROCCO KINGDOM 2,00 20-300930 7,900,000 EUR 7,841,054.00 8,029,520.50 0.30%

DPAM L
Securities portfolio statement as at 31 December 2020
The accompanying notes form an integral part of these Financial Statements
93
DPAM L BONDS EMERGING MARKETS SUSTAINABLE
Investment Quantity CCY Cost
(in EUR) Evaluation value
(in EUR)
% Total Net
Assets
NORTH MACEDONIA 3,675 20-060326 5,000,000 EUR 5,123,450.00 5,614,000.00 0.21%
ROMANIA 1,375 20-021229 2,600,000 EUR 2,579,746.00 2,652,767.00 0.10%
ROMANIA 2,50 18-080230 3,000,000 EUR 2,912,700.00 3,288,060.00 0.12%
ROMANIA 2,625 20-021240 2,000,000 EUR 1,992,320.00 2,137,590.00 0.08%
ROMANIA 2,875 16-260528 5,000,000 EUR 4,919,500.00 5,620,150.00 0.21%
ROMANIA 3,375 18-080238 3,835,000 EUR 4,314,452.50 4,419,338.95 0.16%
ROMANIA 3,624 20-260530 15,000,000 EUR 15,736,650.00 17,941,050.00 0.67%
ROMANIA 4,625 19-030449 2,750,000 EUR 2,751,375.00 3,713,765.00 0.14%
SENEGAL 4,75 18-130328 7,000,000 EUR 6,870,150.00 7,493,080.00 0.28%
UKRAINE 4,375 20-270130 5,000,000 EUR 4,820,300.00 4,798,375.00 0.18%
UKRAINE 6,75 19-200626 7,000,000 EUR 7,331,000.00 7,732,165.00 0.29%
Total EURO
141,745,095.35
151,189,844.70
5.63%
GHANA 19,00 16-021126 25,000,000 GHS 3,363,011.98 3,384,840.76 0.13%
GHANA 24,75 16-190721 25,000,000 GHS 3,817,230.04 3,604,265.52 0.13%
GHANA GOVT 16,50 18-060223 47,000,000 GHS 6,643,466.70 6,283,007.60 0.23%
GHANA GOVT 19,25 20-181223 20,000,000 GHS 2,782,425.78 2,781,115.22 0.10%
GHANA GOVT 19,75 19-150424 25,000,000 GHS 4,063,230.01 3,502,365.47 0.13%
GHANA GOVT 20,75 20-060323 15,000,000 GHS 2,211,270.79 2,151,251.02 0.08%
GHANA GOVT 20,75 20-200123 15,000,000 GHS 2,402,827.87 2,149,442.95 0.08%
Total GHANAIAN CEDI
25,283,463.17
23,856,288.54
0.89%
HUNGARY 2,00 20-230529 2,000,000,000 HUF 5,541,603.65 5,544,756.47 0.21%
HUNGARY 3,00 19-210830 6,500,000,000 HUF 19,173,767.88 19,477,239.20 0.73%
HUNGARY 3,00 20-250441 5,000,000,000 HUF 14,190,265.15 14,899,775.29 0.56%
HUNGARY 3,25 15-221031 5,200,000,000 HUF 16,165,982.33 15,939,942.37 0.59%
HUNGARY GOVT 1,50 20-220426 3,000,000,000 HUF 8,462,030.75 8,327,846.48 0.31%
HUNGARY GOVT 2,25 20-200433 8,500,000,000 HUF 23,438,464.41 23,725,753.75 0.88%
HUNGARY GOVT 2,75 17-221226 2,250,000,000 HUF 6,630,232.38 6,678,781.17 0.25%
HUNGARY GOVT 3,00 18-271038 1,140,000,000 HUF 3,529,315.50 3,483,037.35 0.13%
Total HUNGARIAN FORINT
97,131,662.05
98,077,132.08
3.65%
EUROPEAN BANK FOR RECONSTRUCTION & DEVELOPMENT 6,45 17-131222
250,000,000,000 IDR 14,760,619.38 15,109,611.32 0.56%
EUROPEAN INVESTMENT BANK 5,20 12-010322 42,500,000,000 IDR 2,532,131.64 2,504,553.43 0.09%
IA -DEUTSCHE BANK 7,875 16-140323 110,000,000,000 IDR 7,476,308.17 6,857,787.78 0.26%
INDONESIA 6,125 12-150528 674,000,000,000 IDR 38,582,979.03 39,668,302.01 1.48%
INDONESIA 7,00 11-150527 200,000,000,000 IDR 12,605,818.56 12,481,386.20 0.46%
INDONESIA 7,50 16-150832 437,000,000,000 IDR 26,247,314.30 27,715,161.63 1.03%
INDONESIA 8,25 11-150632 300,000,000,000 IDR 19,477,677.08 20,152,110.90 0.75%
INDONESIA 8,25 15-150536 300,000,000,000 IDR 20,067,815.19 20,385,345.04 0.76%
INDONESIA 8,375 10-150926 450,000,000,000 IDR 29,304,957.65 30,100,816.83 1.12%
INDONESIA 8,375 13-150334 122,000,000,000 IDR 8,020,500.00 8,314,169.39 0.31%
INDONESIA 8,375 19-150439 100,000,000,000 IDR 6,646,311.96 6,888,013.11 0.26%
INDONESIA 8,75 15-150531 170,000,000,000 IDR 11,885,739.13 11,807,226.37 0.44%
INDONESIA 8,875 16-151131 120,000,000,000 IDR 7,125,239.59 8,324,181.68 0.31%
INDONESIA 9,00 13-150329 690,000,000,000 IDR 47,993,955.09 47,782,966.77 1.78%
INDONESIA GOVT 6,50 19-150625 50,000,000,000 IDR 3,053,854.20 3,064,081.25 0.11%
INDONESIA GOVT 8,25 18-150529 75,000,000,000 IDR 5,008,427.89 5,010,869.42 0.19%

DPAM L
Securities portfolio statement as at 31 December 2020
The accompanying notes form an integral part of these Financial Statements
94
DPAM L BONDS EMERGING MARKETS SUSTAINABLE
Investment Quantity CCY Cost
(in EUR) Evaluation value
(in EUR)
% Total Net
Assets
INTERNATIONAL BANK FOR RECONSTRUCTION & DEVELOPMENT 7,45 18-200821
170,000,000,000 IDR 10,684,295.33 10,114,680.58 0.38%
REPUBLIC INDONESIA 6,625 12-150533 100,000,000,000 IDR 5,872,280.36 5,921,628.56 0.22%
Total INDONESIAN RUPIAH
277,346,224.55
282,202,892.27
10.51%
ASIAN DEVELOPMENT 6,45 16-080821 680,000,000 INR 7,682,568.85 7,691,303.59 0.29%
ASIAN DEVELOPMENT BANK 5,90 17-201222 150,000,000 INR 1,901,692.17 1,711,073.89 0.06%
ASIAN DEVELOPMENT BANK 6,20 16-061026 900,000,000 INR 12,290,155.13 10,493,452.31 0.39%
INDIA 6,19 20-160934 300,000,000 INR 3,452,736.72 3,346,310.33 0.12%
INDIA 7,17 18-080128 400,000,000 INR 4,887,187.25 4,851,582.88 0.18%
INDIA 7,26 19-140129 1,200,000,000 INR 15,121,002.81 14,575,822.07 0.54%
INDIA 7,59 16-110126 700,000,000 INR 8,992,436.10 8,653,286.99 0.32%
INDIA 7,72 15-250525 700,000,000 INR 9,230,422.40 8,628,466.45 0.32%
INTERNATIONAL FINANCE CORP. 6,30 14-251124 2,150,000,000 INR 28,575,060.03 24,906,324.54 0.93%
INTERNATIONAL FINANCE CORP. 8,25 14-100621 350,000,000 INR 4,465,612.62 3,970,073.29 0.15%
Total INDIAN RUPEE
96,598,874.08
88,827,696.34
3.31%
KENYA 10,90 20-110831 600,000,000 KES 4,662,210.80 4,522,824.17 0.17%
KENYA 11,75 19-081035 1,100,000,000 KES 9,502,272.06 8,577,276.00 0.32%
KENYA 12,50 18-100133 100,000,000 KES 996,777.91 820,968.83 0.03%
KENYA TREASURY BOND 11,95 18-251038 500,000,000 KES 4,141,963.49 3,943,930.04 0.15%
Total KENYAN SHILLING
19,303,224.26
17,864,999.04
0.67%
KOREA 1,00 -INFLATION LINKED- 16-100626 5,300,000,000 KRW 4,085,294.99 4,284,174.40 0.16%
KOREA 1,25 19-101222 6,000,000,000 KRW 4,609,443.42 4,550,663.65 0.17%
KOREA 1,375 19-101229 30,000,000,000 KRW 22,116,309.39 21,969,429.31 0.82%
KOREA 2,375 18-100323 6,000,000,000 KRW 4,700,133.45 4,687,579.00 0.17%
KOREA 3,75 13-101233 3,000,000,000 KRW 2,870,660.08 2,775,481.39 0.10%
KOREA TREASURY 3,00 14-100924 12,000,000,000 KRW 9,730,386.16 9,714,941.00 0.36%
KOREA TREASURY -INFLATION LINKED- 1,125 20-100630 5,700,000,000 KRW 4,244,108.57 4,434,159.20 0.17%
Total SOUTH KOREAN WON
52,356,336.06
52,416,427.95
1.95%
MEXICAN BONOS 7,75 11-290531 15,000,000 MXN 69,243,741.17 72,328,377.73 2.69%
MEXICAN UDIBONOS -INFLATION LINKED- 4,00 16-301128 1,400,000 MXN 43,799,542.67 43,993,133.16 1.64%
MEXICO 7,75 13-231134 10,000,000 MXN 45,514,999.42 48,341,765.85 1.80%
MEXICO BONOS 8,00 17-071147 4,250,000 MXN 18,557,044.48 20,576,280.21 0.77%
MEXICO BONOS 8,50 08-181138 6,000,000 MXN 29,945,342.59 30,536,201.00 1.14%
MEXICO BONOS 8,50 08-310529 10,000,000 MXN 49,534,843.87 49,985,336.25 1.86%
Total NEW MEXICAN PESO
256,595,514.20
265,761,094.20
9.90%
MALAYSIA 3,757 18-200423 10,000,000 MYR 2,205,017.36 2,116,665.82 0.08%
MALAYSIA 3,757 19-220540 30,000,000 MYR 6,498,117.16 6,439,416.87 0.24%
MALAYSIA 3,844 13-150433 150,000,000 MYR 32,735,356.39 32,485,091.68 1.21%
MALAYSIA 4,254 15-310535 30,000,000 MYR 7,553,680.56 6,794,473.51 0.25%
MALAYSIA 4,498 10-150430 43,900,000 MYR 10,392,300.05 10,262,882.11 0.38%
MALAYSIA 4,762 17-070437 40,000,000 MYR 8,408,591.28 9,529,049.63 0.35%
MALAYSIA GOVT 3,828 19-050734 50,000,000 MYR 10,775,918.86 10,887,895.57 0.41%
MALAYSIA GOVT 3,882 17-100322 20,000,000 MYR 4,217,137.00 4,161,446.64 0.16%
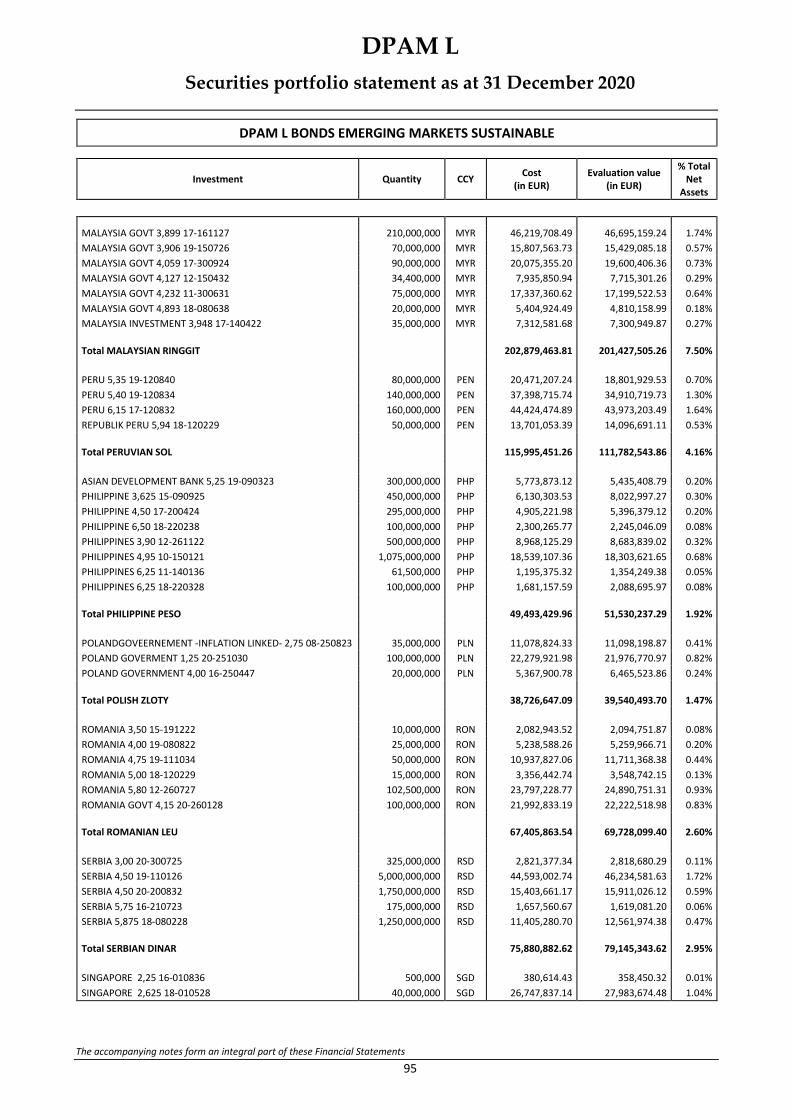
DPAM L
Securities portfolio statement as at 31 December 2020
The accompanying notes form an integral part of these Financial Statements
95
DPAM L BONDS EMERGING MARKETS SUSTAINABLE
Investment Quantity CCY Cost
(in EUR) Evaluation value
(in EUR)
% Total Net
Assets
MALAYSIA GOVT 3,899 17-161127 210,000,000 MYR 46,219,708.49 46,695,159.24 1.74%
MALAYSIA GOVT 3,906 19-150726 70,000,000 MYR 15,807,563.73 15,429,085.18 0.57%
MALAYSIA GOVT 4,059 17-300924 90,000,000 MYR 20,075,355.20 19,600,406.36 0.73%
MALAYSIA GOVT 4,127 12-150432 34,400,000 MYR 7,935,850.94 7,715,301.26 0.29%
MALAYSIA GOVT 4,232 11-300631 75,000,000 MYR 17,337,360.62 17,199,522.53 0.64%
MALAYSIA GOVT 4,893 18-080638 20,000,000 MYR 5,404,924.49 4,810,158.99 0.18%
MALAYSIA INVESTMENT 3,948 17-140422 35,000,000 MYR 7,312,581.68 7,300,949.87 0.27%
Total MALAYSIAN RINGGIT
202,879,463.81
201,427,505.26
7.50%
PERU 5,35 19-120840 80,000,000 PEN 20,471,207.24 18,801,929.53 0.70%
PERU 5,40 19-120834 140,000,000 PEN 37,398,715.74 34,910,719.73 1.30%
PERU 6,15 17-120832 160,000,000 PEN 44,424,474.89 43,973,203.49 1.64%
REPUBLIK PERU 5,94 18-120229 50,000,000 PEN 13,701,053.39 14,096,691.11 0.53%
Total PERUVIAN SOL
115,995,451.26
111,782,543.86
4.16%
ASIAN DEVELOPMENT BANK 5,25 19-090323 300,000,000 PHP 5,773,873.12 5,435,408.79 0.20%
PHILIPPINE 3,625 15-090925 450,000,000 PHP 6,130,303.53 8,022,997.27 0.30%
PHILIPPINE 4,50 17-200424 295,000,000 PHP 4,905,221.98 5,396,379.12 0.20%
PHILIPPINE 6,50 18-220238 100,000,000 PHP 2,300,265.77 2,245,046.09 0.08%
PHILIPPINES 3,90 12-261122 500,000,000 PHP 8,968,125.29 8,683,839.02 0.32%
PHILIPPINES 4,95 10-150121 1,075,000,000 PHP 18,539,107.36 18,303,621.65 0.68%
PHILIPPINES 6,25 11-140136 61,500,000 PHP 1,195,375.32 1,354,249.38 0.05%
PHILIPPINES 6,25 18-220328 100,000,000 PHP 1,681,157.59 2,088,695.97 0.08%
Total PHILIPPINE PESO
49,493,429.96
51,530,237.29
1.92%
POLANDGOVEERNEMENT -INFLATION LINKED- 2,75 08-250823 35,000,000 PLN 11,078,824.33 11,098,198.87 0.41%
POLAND GOVERMENT 1,25 20-251030 100,000,000 PLN 22,279,921.98 21,976,770.97 0.82%
POLAND GOVERNMENT 4,00 16-250447 20,000,000 PLN 5,367,900.78 6,465,523.86 0.24%
Total POLISH ZLOTY
38,726,647.09
39,540,493.70
1.47%
ROMANIA 3,50 15-191222 10,000,000 RON 2,082,943.52 2,094,751.87 0.08%
ROMANIA 4,00 19-080822 25,000,000 RON 5,238,588.26 5,259,966.71 0.20%
ROMANIA 4,75 19-111034 50,000,000 RON 10,937,827.06 11,711,368.38 0.44%
ROMANIA 5,00 18-120229 15,000,000 RON 3,356,442.74 3,548,742.15 0.13%
ROMANIA 5,80 12-260727 102,500,000 RON 23,797,228.77 24,890,751.31 0.93%
ROMANIA GOVT 4,15 20-260128 100,000,000 RON 21,992,833.19 22,222,518.98 0.83%
Total ROMANIAN LEU
67,405,863.54
69,728,099.40
2.60%
SERBIA 3,00 20-300725 325,000,000 RSD 2,821,377.34 2,818,680.29 0.11%
SERBIA 4,50 19-110126 5,000,000,000 RSD 44,593,002.74 46,234,581.63 1.72%
SERBIA 4,50 20-200832 1,750,000,000 RSD 15,403,661.17 15,911,026.12 0.59%
SERBIA 5,75 16-210723 175,000,000 RSD 1,657,560.67 1,619,081.20 0.06%
SERBIA 5,875 18-080228 1,250,000,000 RSD 11,405,280.70 12,561,974.38 0.47%
Total SERBIAN DINAR
75,880,882.62
79,145,343.62
2.95%
SINGAPORE 2,25 16-010836 500,000 SGD 380,614.43 358,450.32 0.01%
SINGAPORE 2,625 18-010528 40,000,000 SGD 26,747,837.14 27,983,674.48 1.04%

DPAM L
Securities portfolio statement as at 31 December 2020
The accompanying notes form an integral part of these Financial Statements
96
DPAM L BONDS EMERGING MARKETS SUSTAINABLE
Investment Quantity CCY Cost
(in EUR) Evaluation value
(in EUR)
% Total Net
Assets
SINGAPORE 2,75 12-010442 1,000,000 SGD 817,712.22 792,647.33 0.03%
SINGAPORE 2,875 10-010930 5,000,000 SGD 3,695,804.32 3,667,614.87 0.14%
SINGAPORE 2,875 14-010729 20,000,000 SGD 14,449,815.04 14,446,849.30 0.54%
SINGAPORE 3,00 09-010924 5,000,000 SGD 3,516,040.35 3,388,782.38 0.13%
SINGAPORE 3,375 13-010933 20,000,000 SGD 15,734,696.90 15,744,604.54 0.59%
SINGAPORE 3,50 07-010327 65,000,000 SGD 44,389,390.35 47,025,817.82 1.75%
Total SINGAPORE DOLLAR
109,731,910.75
113,408,441.04
4.22%
THAILAND 1,60 19-171229 600,000,000 THB 16,885,630.21 17,045,820.03 0.64%
THAILAND GOVT 1,585 20-171235 202,500,000 THB 5,554,271.45 5,649,166.41 0.21%
THAILAND GOVT 4,875 09-220629 550,000,000 THB 19,333,464.84 19,535,907.34 0.73%
THAILAND -INFLATION LINKED- 1,25 13-120328 100,000,000 THB 3,067,374.79 2,849,645.50 0.11%
Total THAI BAHT
44,840,741.29
45,080,539.28
1.68%
ARGENTINA 1,00 20-090729 188,113 USD 79,705.03 67,059.90 0.00%
ARGENTINA FRN 20-090735 9,850,000 USD 3,658,053.21 2,954,476.73 0.11%
BAHAMAS 8,95 20-151032 3,500,000 USD 2,968,633.04 3,120,522.25 0.12%
BQ CENTRAL TUNISIA 8,25 97-190927 3,868,000 USD 3,398,671.58 3,044,309.31 0.11%
CENTRAL BANK TUNISIA 5,75 15-300125 13,839,000 USD 10,916,431.18 10,355,978.58 0.39%
DOMINICAN 4,875 20-230932 3,000,000 USD 2,654,270.03 2,717,126.39 0.10%
ECUADOR FRN 20-310735 12,500,000 USD 6,498,492.30 5,582,270.86 0.21%
EL SALVADOR 7,75 02-240123 9,412,000 USD 7,467,927.43 7,626,600.79 0.28%
GEORGIA 6,875 11-120421 5,547,000 USD 5,294,359.62 4,606,813.99 0.17%
GHANA 6,375 20-110227 6,000,000 USD 4,886,683.83 5,113,497.61 0.19%
GHANA 7,625 18-160529 700,000 USD 587,755.64 610,036.37 0.02%
GHANA 7,875 19-260327 6,000,000 USD 4,553,184.20 5,409,586.86 0.20%
GHANA 7,875 20-110235 3,000,000 USD 2,402,425.17 2,528,282.46 0.09%
GHANA 8,125 14-180126 5,000,000 USD 4,456,540.23 4,589,636.71 0.17%
GHANA 8,125 19-260332 3,100,000 USD 2,471,920.67 2,690,492.42 0.10%
GUATEMALA 4,50 16-030526 5,000,000 USD 4,640,307.53 4,544,215.60 0.17%
ISRAEL STATE 3,80 20-130560 3,500,000 USD 3,257,691.09 3,403,714.60 0.13%
KENYA 6,875 14-240624 3,000,000 USD 2,739,624.09 2,692,889.54 0.10%
KENYA 7,00 19-220527 15,600,000 USD 13,494,459.00 14,083,413.02 0.52%
KENYA 8,00 19-220532 5,800,000 USD 5,108,666.28 5,537,813.74 0.21%
LEBANESE 6,10 10-041022 -DEFAULT- 1,000,000 USD 665,275.96 116,333.62 0.00%
LEBANESE 6,85 17-230327 -DEFAULT- 2,000,000 USD 662,817.65 231,956.19 0.01%
LEBANESE 8,25 06-120421 -DEFAULT- 3,400,000 USD 2,610,966.58 418,445.51 0.02%
MAROCCO KINGDOM 3,00 20-151232 6,000,000 USD 4,931,852.89 4,981,365.70 0.19%
MONGOLIA 5,125 12-051222 2,000,000 USD 1,743,019.56 1,702,341.54 0.06%
MOZAMBIQUE 5,00 19-150931 6,000,000 USD 4,500,047.58 4,487,090.84 0.17%
NAMIBIA 5,25 15-291025 5,000,000 USD 4,247,232.08 4,407,870.54 0.16%
NIGERIA 6,50 17-281127 5,000,000 USD 4,371,491.75 4,412,243.07 0.16%
NIGERIA 7,625 18-211125 1,300,000 USD 1,225,535.68 1,224,160.03 0.05%
NIGERIA 7,696 18-230238 8,000,000 USD 6,576,110.46 6,969,490.42 0.26%
NIGERIA 8,747 18-210131 5,800,000 USD 5,260,711.74 5,510,888.81 0.21%
PAKISTAN ISLAMIC 8,25 14-150424 6,000,000 USD 5,429,299.40 5,359,127.13 0.20%
SENEGAL 6,25 17-230533 13,000,000 USD 11,151,160.68 11,958,767.52 0.45%
SENEGAL 6,75 18-130348 3,000,000 USD 2,661,257.42 2,703,739.12 0.10%
SERBIA 2,125 20-011230 4,000,000 USD 3,317,003.00 3,240,227.21 0.12%
SRI LANKA 7,55 19-280330 10,000,000 USD 5,089,770.12 4,729,598.30 0.18%

DPAM L
Securities portfolio statement as at 31 December 2020
The accompanying notes form an integral part of these Financial Statements
97
DPAM L BONDS EMERGING MARKETS SUSTAINABLE
Investment Quantity CCY Cost
(in EUR) Evaluation value
(in EUR)
% Total Net
Assets
THIRD PAKISTAN INTERNATIONAL 5,625 17-051222 2,000,000 USD 1,698,732.60 1,678,656.37 0.06%
UKRAINE 7,304 20-150333 13,725,000 USD 12,020,406.43 12,261,975.90 0.46%
UKRAINE 7,75 15-010926 3,000,000 USD 2,631,144.40 2,773,580.97 0.10%
UKRAINE 8,994 18-010224 5,000,000 USD 4,668,776.13 4,638,796.95 0.17%
UKRAINE FRN 15-310540 7,000,000 USD 5,207,937.63 5,913,800.01 0.22%
UKRAINE GOVT 7,75 15-010924 3,000,000 USD 2,820,227.23 2,730,807.89 0.10%
UKRAINE GOVT 7,75 15-010925 3,000,000 USD 2,671,516.37 2,754,247.88 0.10%
UKRAINE GOVT 9,75 18-011128 3,000,000 USD 3,072,252.08 3,021,037.14 0.11%
Total U.S. DOLLAR
190,770,346.57
189,505,286.39
7.06%
URUGUAY -INFLATION LINKED- 3,875 20-020740 1,275,000,000 UYU 29,665,338.64 29,508,585.79 1.10%
URUGUAY -INFLATION LINKED- 4,375 11-151228 200,000,000 UYU 9,647,568.25 9,171,924.52 0.34%
Total URUGUAYAN PESO
39,312,906.89
38,680,510.31
1.44%
ASIAN DEVELOPMENT BANK 0,00 19-010829 100,000,000 ZAR 2,718,260.48 2,743,699.38 0.10%
SOUTH AFRICA 7,00 10-280231 400,000,000 ZAR 16,361,585.52 19,091,331.46 0.71%
SOUTH AFRICA 8,00 13-310130 291,000,000 ZAR 13,636,248.20 15,449,394.49 0.58%
SOUTH AFRICA 8,25 14-310332 700,000,000 ZAR 37,163,099.25 35,142,259.40 1.31%
SOUTH AFRICA 8,5 13-310137 1,200,000,000 ZAR 60,994,552.39 55,457,881.37 2.07%
SOUTH AFRICA 8,75 12-280248 625,000,000 ZAR 27,142,497.45 28,548,556.26 1.06%
SOUTH AFRICA 8,75 14-310144 95,000,000 ZAR 5,519,178.04 4,331,953.91 0.16%
SOUTH AFRICA 8,875 15-280235 1,349,000,000 ZAR 67,455,377.79 66,175,680.28 2.47%
SOUTH AFRICA 9,00 15-310140 500,000,000 ZAR 29,532,143.68 23,731,878.52 0.88%
Total SOUTH AFRICAN RAND
260,522,942.80
250,672,635.07
9.34% Total Bonds
2,574,189,174.35
2,568,793,451.01
95.69% Total Transferable securities admitted to an official stock exchange or dealt in on another regulated market
2,574,189,174.35
2,568,793,451.01
95.69%
Other Transferable Securities
BRAZIL -INFLATION LINKED- 6,00 16-150826 12,650 BRL 11,226,853.00 8,271,605.27 0.31%
Total BRAZILIAN REAL
11,226,853.00
8,271,605.27
0.31% Total Other Transferable Securities
11,226,853.00
8,271,605.27
0.31% Total Portfolio
2,585,416,027.35
2,577,065,056.28
96.00%

DPAM L
Securities portfolio statement as at 31 December 2020
The accompanying notes form an integral part of these Financial Statements
98
DPAM L BONDS EUR CORPORATE HIGH YIELD
Investment Quantity CCY Cost
(in EUR) Evaluation value
(in EUR)
% Total Net
Assets
Transferable securities admitted to an official stock exchange or dealt in on another regulated market
Bonds
ABERTIS INFRAEST. FRN 20-PERPETUAL 3,600,000 EUR 3,631,000.00 3,740,940.00 0.85%
ACCOR 1,75 19-040226 2,000,000 EUR 2,070,000.00 2,092,030.00 0.48%
ACCOR FRN 19-PERPETUAL 1,700,000 EUR 1,563,110.00 1,585,131.00 0.36%
ADEVINTA ASA 3,00 20-151127 500,000 EUR 500,000.00 517,717.50 0.12%
ADIENT GLOBAL HLDG 3,50 16-150824 1,500,000 EUR 1,342,500.00 1,501,485.00 0.34%
ALTICE FINANCING 3,00 20-150128 1,000,000 EUR 957,145.00 966,200.00 0.22%
ALTICE FINCO 4,75 17-150128 2,180,000 EUR 1,965,125.13 2,114,959.70 0.48%
ALTICE FRANCE HLDG 8,00 20-150527 3,000,000 EUR 3,044,625.00 3,265,620.00 0.75%
ALTICE FRANCE OAT 4,125 20-150129 1,000,000 EUR 1,000,000.00 1,022,530.00 0.23%
ALTICE FRANCE S.A. 2,50 19-150125 1,000,000 EUR 1,000,000.00 983,335.00 0.22%
ALTICE FRANCE S.A. 3,375 19-150128 1,000,000 EUR 1,000,000.00 991,675.00 0.23%
ALTICE FRANCE S.A. 5,875 18-010227 6,100,000 EUR 6,685,395.00 6,508,212.00 1.48%
ARDAGH PKG FINANCE 2,125 19-150826 1,000,000 EUR 930,000.00 1,004,870.00 0.23%
ARDAGH PKG FINANCE 2,125 20-150826 2,200,000 EUR 2,123,000.00 2,210,593.00 0.50%
ARD FINANCE S.A. 5,00 19-300627 3,000,000 EUR 2,959,325.00 3,068,760.00 0.70%
ARENA LUXEMBOURG 1,875 20-010228 700,000 EUR 700,000.00 668,377.50 0.15%
ASHLAND SERVICES 2,00 20-300128 2,000,000 EUR 2,000,000.00 2,002,940.00 0.46%
AVANTOR FUNDING 2,625 20-011125 1,500,000 EUR 1,500,000.00 1,539,067.50 0.35%
AVANTOR FUNDING 3,875 20-150728 1,000,000 EUR 1,000,000.00 1,052,750.00 0.24%
AVIS BUDGET FINANCE 4,50 17-150525 500,000 EUR 411,980.00 491,975.00 0.11%
AVIS BUDGET FINANCE 4,75 18-300126 550,000 EUR 447,920.00 540,053.25 0.12%
AVIS BUDGET FINANCE PLC 4,125 16-151124 500,000 EUR 490,996.67 492,967.50 0.11%
AXALTA COATING SYSTEMS 3,75 16-150125 650,000 EUR 677,850.00 664,417.00 0.15%
BALL CORP. 4,375 15-151223 50,000 EUR 57,622.36 55,192.50 0.01%
BELDEN INC. 3,375 17-150727 400,000 EUR 400,000.00 411,264.00 0.09%
BLITZ -F- 6,00 18-300726 2,600,000 EUR 2,630,552.50 2,735,863.00 0.62%
BRITISH TELECOM FRN 20-180880 3,000,000 EUR 2,650,106.90 2,954,025.00 0.67%
BURGERKING FRANCE 6,00 17-010524 550,000 EUR 525,108.47 564,445.75 0.13%
CANPACK S.A. 2,375 20-011127 1,000,000 EUR 1,000,000.00 1,034,785.00 0.24%
CASINO GUICHARD-PERRACHON 3,311 13-250123 1,900,000 EUR 1,736,500.00 1,987,105.50 0.45%
CASINO GUICHARD-PERRACHON 3,58 14-070225 400,000 EUR 320,000.00 362,134.00 0.08%
CASINO GUICHARD-PERRACHON 4,048 14-050826 400,000 EUR 320,800.00 355,894.00 0.08%
CASINO GUICHARD-PERRACHON 4,498 14-070324 1,400,000 EUR 1,259,650.00 1,373,211.00 0.31%
CATALENT PHARMACEUTICAL SOL 2,375 20-010328 5,000,000 EUR 5,005,000.00 5,027,675.00 1.15%
CHEPLAPHARMACEUTICAL ARZNEI 4,375 20-150128 2,000,000 EUR 2,000,000.00 2,055,740.00 0.47%
CIRSA FINANCE 4,75 19-220525 600,000 EUR 585,000.00 590,967.00 0.13%
CMA CGM 5,25 17-150125 10,100,000 EUR 9,409,718.12 10,102,727.00 2.30%
CMA CGM 7,50 20-150126 1,000,000 EUR 978,480.00 1,074,720.00 0.25%
CONSTANTIN INVESTMENT 5,375 17-150425 3,000,000 EUR 2,813,000.00 3,068,595.00 0.70%
CONSTELLIUM 4,25 17-150226 2,700,000 EUR 2,658,701.45 2,766,973.50 0.63%
CROWN EUROPEAN HLDG 2,875 18-010226 3,000,000 EUR 3,099,900.00 3,221,610.00 0.74%
DIEBOLD NIXDORF 9,00 20-150725 2,000,000 EUR 2,084,510.00 2,180,800.00 0.50%
DKT FINANCE APS 7,00 18-170623 1,450,000 EUR 1,554,562.80 1,500,460.00 0.34%
DOUGLAS GMBH 6,25 15-150722 500,000 EUR 472,250.00 454,992.50 0.10%
DRAX FINCO PLC 2,625 20-011125 1,500,000 EUR 1,500,000.00 1,546,027.50 0.35%
DUFRY ONE B.V. 2,00 19-150227 1,000,000 EUR 1,000,000.00 941,905.00 0.21%
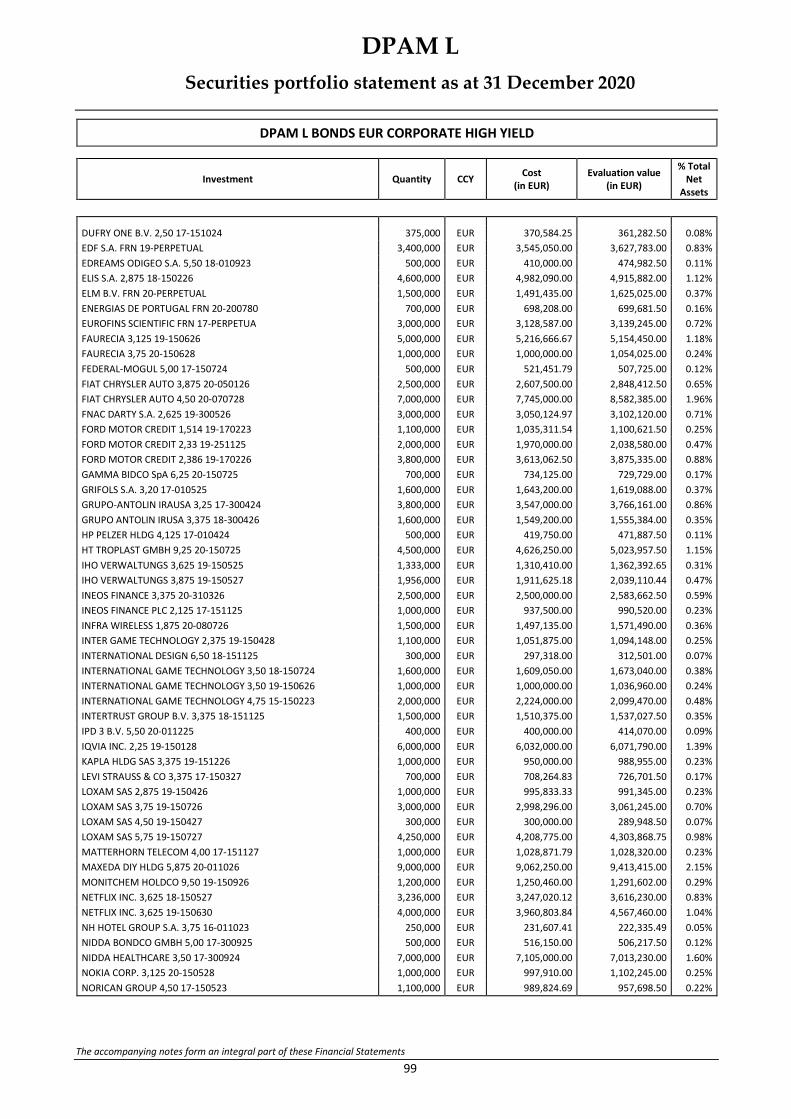
DPAM L
Securities portfolio statement as at 31 December 2020
The accompanying notes form an integral part of these Financial Statements
99
DPAM L BONDS EUR CORPORATE HIGH YIELD
Investment Quantity CCY Cost
(in EUR) Evaluation value
(in EUR)
% Total Net
Assets
DUFRY ONE B.V. 2,50 17-151024 375,000 EUR 370,584.25 361,282.50 0.08%
EDF S.A. FRN 19-PERPETUAL 3,400,000 EUR 3,545,050.00 3,627,783.00 0.83%
EDREAMS ODIGEO S.A. 5,50 18-010923 500,000 EUR 410,000.00 474,982.50 0.11%
ELIS S.A. 2,875 18-150226 4,600,000 EUR 4,982,090.00 4,915,882.00 1.12%
ELM B.V. FRN 20-PERPETUAL 1,500,000 EUR 1,491,435.00 1,625,025.00 0.37%
ENERGIAS DE PORTUGAL FRN 20-200780 700,000 EUR 698,208.00 699,681.50 0.16%
EUROFINS SCIENTIFIC FRN 17-PERPETUA 3,000,000 EUR 3,128,587.00 3,139,245.00 0.72%
FAURECIA 3,125 19-150626 5,000,000 EUR 5,216,666.67 5,154,450.00 1.18%
FAURECIA 3,75 20-150628 1,000,000 EUR 1,000,000.00 1,054,025.00 0.24%
FEDERAL-MOGUL 5,00 17-150724 500,000 EUR 521,451.79 507,725.00 0.12%
FIAT CHRYSLER AUTO 3,875 20-050126 2,500,000 EUR 2,607,500.00 2,848,412.50 0.65%
FIAT CHRYSLER AUTO 4,50 20-070728 7,000,000 EUR 7,745,000.00 8,582,385.00 1.96%
FNAC DARTY S.A. 2,625 19-300526 3,000,000 EUR 3,050,124.97 3,102,120.00 0.71%
FORD MOTOR CREDIT 1,514 19-170223 1,100,000 EUR 1,035,311.54 1,100,621.50 0.25%
FORD MOTOR CREDIT 2,33 19-251125 2,000,000 EUR 1,970,000.00 2,038,580.00 0.47%
FORD MOTOR CREDIT 2,386 19-170226 3,800,000 EUR 3,613,062.50 3,875,335.00 0.88%
GAMMA BIDCO SpA 6,25 20-150725 700,000 EUR 734,125.00 729,729.00 0.17%
GRIFOLS S.A. 3,20 17-010525 1,600,000 EUR 1,643,200.00 1,619,088.00 0.37%
GRUPO-ANTOLIN IRAUSA 3,25 17-300424 3,800,000 EUR 3,547,000.00 3,766,161.00 0.86%
GRUPO ANTOLIN IRUSA 3,375 18-300426 1,600,000 EUR 1,549,200.00 1,555,384.00 0.35%
HP PELZER HLDG 4,125 17-010424 500,000 EUR 419,750.00 471,887.50 0.11%
HT TROPLAST GMBH 9,25 20-150725 4,500,000 EUR 4,626,250.00 5,023,957.50 1.15%
IHO VERWALTUNGS 3,625 19-150525 1,333,000 EUR 1,310,410.00 1,362,392.65 0.31%
IHO VERWALTUNGS 3,875 19-150527 1,956,000 EUR 1,911,625.18 2,039,110.44 0.47%
INEOS FINANCE 3,375 20-310326 2,500,000 EUR 2,500,000.00 2,583,662.50 0.59%
INEOS FINANCE PLC 2,125 17-151125 1,000,000 EUR 937,500.00 990,520.00 0.23%
INFRA WIRELESS 1,875 20-080726 1,500,000 EUR 1,497,135.00 1,571,490.00 0.36%
INTER GAME TECHNOLOGY 2,375 19-150428 1,100,000 EUR 1,051,875.00 1,094,148.00 0.25%
INTERNATIONAL DESIGN 6,50 18-151125 300,000 EUR 297,318.00 312,501.00 0.07%
INTERNATIONAL GAME TECHNOLOGY 3,50 18-150724 1,600,000 EUR 1,609,050.00 1,673,040.00 0.38%
INTERNATIONAL GAME TECHNOLOGY 3,50 19-150626 1,000,000 EUR 1,000,000.00 1,036,960.00 0.24%
INTERNATIONAL GAME TECHNOLOGY 4,75 15-150223 2,000,000 EUR 2,224,000.00 2,099,470.00 0.48%
INTERTRUST GROUP B.V. 3,375 18-151125 1,500,000 EUR 1,510,375.00 1,537,027.50 0.35%
IPD 3 B.V. 5,50 20-011225 400,000 EUR 400,000.00 414,070.00 0.09%
IQVIA INC. 2,25 19-150128 6,000,000 EUR 6,032,000.00 6,071,790.00 1.39%
KAPLA HLDG SAS 3,375 19-151226 1,000,000 EUR 950,000.00 988,955.00 0.23%
LEVI STRAUSS & CO 3,375 17-150327 700,000 EUR 708,264.83 726,701.50 0.17%
LOXAM SAS 2,875 19-150426 1,000,000 EUR 995,833.33 991,345.00 0.23%
LOXAM SAS 3,75 19-150726 3,000,000 EUR 2,998,296.00 3,061,245.00 0.70%
LOXAM SAS 4,50 19-150427 300,000 EUR 300,000.00 289,948.50 0.07%
LOXAM SAS 5,75 19-150727 4,250,000 EUR 4,208,775.00 4,303,868.75 0.98%
MATTERHORN TELECOM 4,00 17-151127 1,000,000 EUR 1,028,871.79 1,028,320.00 0.23%
MAXEDA DIY HLDG 5,875 20-011026 9,000,000 EUR 9,062,250.00 9,413,415.00 2.15%
MONITCHEM HOLDCO 9,50 19-150926 1,200,000 EUR 1,250,460.00 1,291,602.00 0.29%
NETFLIX INC. 3,625 18-150527 3,236,000 EUR 3,247,020.12 3,616,230.00 0.83%
NETFLIX INC. 3,625 19-150630 4,000,000 EUR 3,960,803.84 4,567,460.00 1.04%
NH HOTEL GROUP S.A. 3,75 16-011023 250,000 EUR 231,607.41 222,335.49 0.05%
NIDDA BONDCO GMBH 5,00 17-300925 500,000 EUR 516,150.00 506,217.50 0.12%
NIDDA HEALTHCARE 3,50 17-300924 7,000,000 EUR 7,105,000.00 7,013,230.00 1.60%
NOKIA CORP. 3,125 20-150528 1,000,000 EUR 997,910.00 1,102,245.00 0.25%
NORICAN GROUP 4,50 17-150523 1,100,000 EUR 989,824.69 957,698.50 0.22%

DPAM L
Securities portfolio statement as at 31 December 2020
The accompanying notes form an integral part of these Financial Statements
100
DPAM L BONDS EUR CORPORATE HIGH YIELD
Investment Quantity CCY Cost
(in EUR) Evaluation value
(in EUR)
% Total Net
Assets
OCI N.V. 3,125 19-011124 1,000,000 EUR 1,000,000.00 1,031,695.00 0.24%
OCI N.V. 3,625 20-151025 4,500,000 EUR 4,500,000.00 4,686,300.00 1.07%
OI EUROPEAN GROUP 2,875 19-150225 1,500,000 EUR 1,500,000.00 1,527,345.00 0.35%
OI EUROPEAN GROUP 3,125 16-151124 3,400,000 EUR 3,475,500.00 3,528,639.00 0.81%
PAPREC HLDG S.A. 4,00 18-310325 2,400,000 EUR 2,282,555.00 2,405,268.00 0.55%
PARTS EUROPE 6,50 20-160725 2,150,000 EUR 2,183,220.00 2,247,244.50 0.51%
PIAGGIO 3,625 18-300425 1,100,000 EUR 1,113,750.00 1,127,296.50 0.26%
PICARD BONDCO 5,50 17-301124 1,000,000 EUR 958,631.21 1,027,385.00 0.23%
PLT VII FINANCE 4,625 20-050126 500,000 EUR 500,000.00 521,055.00 0.12%
PPF TELECOM 3,25 20-290927 3,000,000 EUR 2,976,960.00 3,230,565.00 0.74%
PROGROUP A.G. 3,00 18-310326 700,000 EUR 652,330.00 712,474.00 0.16%
QUATRIM SAS 5,875 19-150124 2,000,000 EUR 2,026,450.00 2,082,020.00 0.48%
RCI BANQUE S.A. FRN 19-180230 3,400,000 EUR 3,161,745.00 3,442,483.00 0.79%
REBECCA BIDCO GMBH 5,75 20-150725 2,000,000 EUR 2,000,000.00 2,111,620.00 0.48%
RENAULT S.A. S.A. 1,25 19-240625 2,000,000 EUR 1,820,480.00 1,962,680.00 0.45%
REPSOL INTERNATIONAL FINANCE 4,50 15-250375 2,000,000 EUR 2,255,241.79 2,200,070.00 0.50%
REPSOL INTERNATIONAL FINANCE FRN 20-PERPETUAL 3,000,000 EUR 3,114,200.00 3,342,420.00 0.76%
REXEL S.A. 2,75 19-150626 7,000,000 EUR 7,188,650.00 7,167,405.00 1.64%
ROSSINI SARL 6,75 18-301025 2,800,000 EUR 2,894,619.58 2,995,776.00 0.68%
RUBIS TERMINAL INF 5,625 20-150525 3,000,000 EUR 3,077,500.00 3,206,085.00 0.73%
SARENS FINANCE CO N.V. 5,75 20-240227 500,000 EUR 500,000.00 465,795.00 0.11%
SCHAEFFLER A.G. 3,375 20-121028 7,500,000 EUR 8,106,500.00 8,272,837.50 1.89%
SCHAEFFLER FINANCE B.V. 3,75 16-150926 900,000 EUR 912,535.71 928,035.00 0.21%
SHUNSHINE MID B.V. 6,50 18-150526 2,200,000 EUR 2,148,960.69 2,290,860.00 0.52%
SIG COMBIBLOC 2,125 20-180625 1,500,000 EUR 1,566,795.00 1,580,295.00 0.36%
SIGMA HOLDCO B.V. 5,75 18-150526 6,000,000 EUR 6,029,994.94 5,955,390.00 1.36%
SILGAN HLDG INC. 3,25 17-150325 500,000 EUR 500,000.00 506,950.00 0.12%
SMURFIT KAPPA TREASURY 1,50 19-150927 3,250,000 EUR 3,250,000.00 3,410,826.25 0.78%
SOFTBK GROUP CORP.3,125 17-190925 2,700,000 EUR 2,636,500.00 2,776,923.00 0.63%
SOFTBK GROUP CORP.4,00 17-190929 8,300,000 EUR 8,627,166.27 8,832,154.50 2.02%
SOFTBK GROUP CORP.4,50 18-200425 1,000,000 EUR 1,033,160.00 1,081,420.00 0.25%
SOFTBK GROUP CORP.5,00 18-150428 3,850,000 EUR 4,212,920.00 4,303,472.25 0.98%
SOLVAY FINANCE FRN 13-PERPETUAL 3,100,000 EUR 3,455,585.98 3,443,449.00 0.79%
SOLVAY FRN 20-PERPETUAL 2,000,000 EUR 2,034,390.00 2,058,580.00 0.47%
SOLVAY S.A. FRN 18-PERPETUAL 1,500,000 EUR 1,644,375.00 1,625,490.00 0.37%
SPCM S.A. 2,00 20-010226 3,000,000 EUR 3,000,000.00 3,052,245.00 0.70%
SPCM S.A. 2,625 20-010229 2,000,000 EUR 2,000,000.00 2,059,680.00 0.47%
SPIE S.A. 2,625 19-180626 8,000,000 EUR 8,145,542.17 8,394,480.00 1.92%
STARFRUIT US STAR 6,50 18-011026 5,700,000 EUR 5,835,774.97 6,044,679.00 1.38%
SUMMER BIDCO B.V. 9,00 19-151125 2,000,000 EUR 2,114,800.00 2,079,600.00 0.47%
SYNTHOMER PLC 3,875 20-010725 3,000,000 EUR 3,000,000.00 3,153,000.00 0.72%
TELECOM ITALIA SpA 2,375 17-121027 2,800,000 EUR 2,795,552.00 2,923,984.00 0.67%
TELECOM ITALIA SpA 2,75 19-150425 1,000,000 EUR 1,066,267.00 1,049,320.00 0.24%
TELECOM ITALIA SpA 3,625 16-250526 2,100,000 EUR 2,286,469.39 2,318,316.00 0.53%
TELECOM ITALIA SpA 5,25 05-170355 1,200,000 EUR 1,392,106.70 1,531,008.00 0.35%
TELECOM ITALIA SpA 7,75 03-240133 6,000,000 EUR 8,800,823.08 8,881,860.00 2.03%
TELEFONICA EUROPE FRN 18-PERPETUAL 700,000 EUR 738,932.35 756,987.00 0.17%
TELEFONICA EUROPE FRN 18-PERPETUAL 8,800,000 EUR 8,854,905.00 9,049,436.00 2.06%
TELEFONICA EUROPE FRN 19-PERPETUAL 1,000,000 EUR 1,075,300.00 1,087,600.00 0.25%
TELENET FINANCE LUX NOTE 3,50 17-010328 1,600,000 EUR 1,624,018.79 1,664,048.00 0.38%
TENDAM BRANDS SAU 5,00 17-150924 400,000 EUR 388,970.00 371,896.00 0.08%

DPAM L
Securities portfolio statement as at 31 December 2020
The accompanying notes form an integral part of these Financial Statements
101
DPAM L BONDS EUR CORPORATE HIGH YIELD
Investment Quantity CCY Cost
(in EUR) Evaluation value
(in EUR)
% Total Net
Assets
TEREOS FINANCE 7,50 20-301025 1,500,000 EUR 1,558,000.00 1,593,060.00 0.36%
THREEAB OPTIQUE DEVELOPMENT 4,00 17-011023 3,600,000 EUR 3,562,717.95 3,659,076.00 0.83%
TIM SpA 4,00 19-110424 1,900,000 EUR 1,909,374.00 2,059,942.00 0.47%
TITAN GLOBAL FINANCE 2,75 20-090727 2,000,000 EUR 2,000,000.00 2,077,150.00 0.47%
TRIVIUM PACKAGING 3,75 19-150826 4,900,000 EUR 5,007,384.61 5,058,368.00 1.15%
UGI INTERNATIONAL ENTERP 3,25 18-011125 500,000 EUR 500,000.00 516,285.00 0.12%
UNILABS SUBHOLDING 5,75 17-150525 4,000,000 EUR 3,950,638.00 4,108,680.00 0.94%
UNITED GROUP B.V. 3,125 20-150226 3,000,000 EUR 3,000,000.00 2,946,615.00 0.67%
UNITED GROUP B.V. 3,625 20-150228 3,000,000 EUR 3,000,000.00 2,949,675.00 0.67%
UPC HLDG B.V. 3,875 17-150629 1,700,000 EUR 1,703,550.00 1,751,127.50 0.40%
VERISURE MIDHLDG AB 5,75 17-011223 4,250,000 EUR 4,175,476.31 4,310,435.00 0.98%
VIRGIN MEDIA 3,75 20-150730 1,000,000 EUR 1,000,000.00 1,021,410.00 0.23%
VMED O2 UK FINANCING 3,25 20-310131 6,000,000 EUR 6,000,000.00 6,174,150.00 1.41%
VODAFONE GROUP FRN 18-031078 9,000,000 EUR 9,731,716.66 10,245,960.00 2.34%
VOLVO CAR AB 2,50 20-071027 4,300,000 EUR 4,300,000.00 4,553,807.50 1.04%
VZ VENDOR FINANCE 2,875 20-150129 1,500,000 EUR 1,500,000.00 1,499,497.50 0.34%
WIENERBERGER A.G. 2,75 20-040625 2,000,000 EUR 2,014,997.50 2,137,940.00 0.49%
WMG ACQUISITION 2,75 20-150728 3,000,000 EUR 3,000,000.00 3,094,320.00 0.71%
WMG ACQUISITION 3,625 18-151026 1,950,000 EUR 1,952,337.50 2,018,513.25 0.46%
ZF EUROPE FINANCE 2,00 19-230226 2,000,000 EUR 1,828,250.00 1,984,530.00 0.45%
ZF EUROPE FINANCE 3,00 19-231029 1,000,000 EUR 985,000.00 1,025,110.00 0.23%
ZF EUROPE FINANCE 3,75 20-210928 5,000,000 EUR 5,280,000.00 5,384,400.00 1.23%
ZF FINANCE GMBH 3,00 20-210925 1,500,000 EUR 1,491,450.00 1,554,765.00 0.35%
ZIGGO BOND CO B.V. 3,375 20-280230 1,000,000 EUR 979,850.00 1,008,335.00 0.23%
Total EURO
415,689,306.46
429,774,054.28
98.05% Total Bonds
415,689,306.46
429,774,054.28
98.05% Total Transferable securities admitted to an official stock exchange or dealt in on another regulated market
415,689,306.46
429,774,054.28
98.05%
Total Portfolio
415,689,306.46
429,774,054.28
98.05%

DPAM L
Securities portfolio statement as at 31 December 2020
The accompanying notes form an integral part of these Financial Statements
102
DPAM L GLOBAL TARGET INCOME
Investment Quantity CCY Cost
(in EUR) Evaluation value
(in EUR)
% Total Net
Assets
Investment funds
DPAM BONDS GOVT GLOBAL -P- -CAP- 455 EUR 12,445,525.34 12,489,285.90 18.18%
DPAM CAP B EQUITIES US DIVIDENDE SUSTAINABLE -P- -CAP- 172 EUR 5,586,138.10 5,990,231.96 8.72%
DPAM CAPITAL B EQUITIES US BEHAVIORAL VALUE -P- 73 EUR 1,237,237.37 1,388,772.44 2.02%
DPAM HORIZON B BONDS GLOBAL INFLATION -P- HEDGED 1,313 EUR 160,666.12 169,077.46 0.25%
DPAM INVESTMENT B BONDS EUR IG -P- 14,477 EUR 1,116,952.16 1,135,394.33 1.65%
DPAM INVESTMENT B EQUITIES EUROLAND -P- 5,804 EUR 1,485,170.36 1,547,636.60 2.25%
DPAM INVESTMENT B EQUITIES EUROPE SUSTAINABLE -F- 911 EUR 290,282.87 341,069.29 0.50%
DPAM INVESTMENT B EQUITIES EUR SM CAP SUSTAINABLE -P- 1,341 EUR 329,355.04 391,652.46 0.57%
DPAM INVESTMENT B EQUITIES WORLD SUSTAINABLE -P- 825 EUR 235,839.81 268,950.00 0.39%
DPAM INVESTMENT B REAL ESTATE EUR DIVIDENDE SUSTAINABLE -P-
19,156 EUR 4,273,230.04 4,499,935.96 6.55%
DPAM L BOND EUR QUALITY SUSTAINABLE -F- 1,108 EUR 683,974.32 697,330.88 1.01%
DPAM L BONDS EMERGING MARKETS SUSTAINABLE -P- 56,318 EUR 7,819,503.74 8,002,224.62 11.65%
DPAM L BONDS EUR CORPORATE HIGH YIELD -P- 23,667 EUR 3,675,497.76 3,779,582.69 5.50%
DPAM L BONDS EUR HIGH YIELD SHORT-TERM -P- 87,949 EUR 12,537,294.81 12,823,843.69 18.66%
DPAM L BONDS GOVERNEMENT SUSTAINABLE -P- 479 EUR 841,155.42 838,451.18 1.22%
DPAM L BONDS HIGHER YIELD -P- 33,452 EUR 9,848,862.40 10,300,874.36 14.99%
Total EURO
62,566,685.66
64,664,313.82
94.12% Total Investment funds
62,566,685.66
64,664,313.82
94.12% Total Portfolio
62,566,685.66
64,664,313.82
94.12%

DPAM L
Securities portfolio statement as at 31 December 2020
The accompanying notes form an integral part of these Financial Statements
103
DPAM L BALANCED CONSERVATIVE SUSTAINABLE
Investment Quantity CCY Cost
(in EUR) Evaluation value
(in EUR)
% Total Net
Assets
Transferable securities admitted to an official stock exchange or dealt in on another regulated market
Shares & Related Securities
CSL LTD 1,150 AUD 139,967.16 206,704.09 0.36%
Total AUSTRALIAN DOLLAR
139,967.16
206,704.09
0.36%
LOGITECH INTERNATIONAL S.A. -REG- 2,620 CHF 95,073.70 208,136.84 0.36%
NESTLE -REG- 1,700 CHF 127,580.87 163,877.77 0.29%
PARTNERS GROUP HLDG A.G. 220 CHF 160,733.36 211,548.24 0.37%
SIG COMBIBLOC A.G. 11,150 CHF 208,894.52 211,752.58 0.37%
Total SWISS FRANC
592,282.45
795,315.43
1.39%
DSV PANALPINA 1,400 DKK 130,686.99 191,846.52 0.34%
NOVO NORDISK -B- 5,715 DKK 229,867.81 327,577.23 0.57%
Total DANISH KRONE
360,554.80
519,423.75
0.91%
ADYEN N.V. 115 EUR 89,834.03 219,075.00 0.38%
AIR LIQUIDE 1,727 EUR 171,523.44 231,849.75 0.40%
AKZO NOBEL N.V. - ORDSHR 2,430 EUR 206,483.32 213,499.80 0.37%
ALD S.A. 10,500 EUR 119,234.16 120,750.00 0.21%
ALLIANZ A.G. -REG- 1,460 EUR 258,546.86 293,022.00 0.51%
AMADEUS IT GROUP S.A. 3,717 EUR 226,223.13 221,384.52 0.39%
AMUNDI S.A. 3,270 EUR 184,672.48 218,436.00 0.38%
ANHEUSER-BUSCH INBEV 3,040 EUR 174,416.95 173,310.40 0.30%
APERAM -REG- 7,005 EUR 185,603.88 239,150.70 0.42%
APPLUS SERVICES S.A. 21,000 EUR 168,493.61 189,420.00 0.33%
AROUNDTOWN S.A. 22,324 EUR 170,443.55 136,622.88 0.24%
ASML HLDG N.V. 895 EUR 136,325.11 355,807.25 0.62%
BANCO SANTANDER S.A. -REG- 69,391 EUR 154,618.80 176,114.36 0.31%
BARCO N.V. 7,500 EUR 132,907.90 133,650.00 0.23%
BEIERSDORF A.G. 1,740 EUR 177,859.16 164,325.60 0.29%
BMW-BAYERISCHE MOTOREN WERKE A.G. 2,300 EUR 160,654.39 166,129.00 0.29%
BREMBO SpA 13,200 EUR 137,127.48 142,560.00 0.25%
CAPGEMINI SE 1,540 EUR 150,993.33 195,272.00 0.34%
CELLNEX TELECOM S.A. 5,150 EUR 201,075.84 252,968.00 0.44%
CTS EVENTIM A.G. & CO. KGAA 3,970 EUR 168,158.10 215,968.00 0.38%
DASSAULT SYSTEMES S.A. 1,181 EUR 158,732.80 196,223.15 0.34%
DAVIDE CAMPARI-MILANO N.V. 20,000 EUR 150,027.54 186,800.00 0.33%
DERMAPHARMACEUTICAL HLDG SE 4,000 EUR 184,000.00 227,840.00 0.40%
DEUTSCHE BOERSE A.G. 1,250 EUR 193,303.20 174,062.50 0.30%
DEUTSCHE TELEKOM A.G. -REG- 10,600 EUR 159,166.98 158,523.00 0.28%
DEUTSCHE WOHNEN SE 3,500 EUR 149,721.00 152,915.00 0.27%
EDP ENERGIAS -REG- 56,862 EUR 199,144.28 293,180.47 0.51%
ELIOR SCA 26,500 EUR 142,913.55 146,280.00 0.26%
ENEL AZ 33,100 EUR 189,125.08 273,935.60 0.48%
FINECOBANK SpA 18,200 EUR 233,094.87 243,880.00 0.43%
GRIFOLS S.A. 9,500 EUR 258,095.32 226,860.00 0.40%

DPAM L
Securities portfolio statement as at 31 December 2020
The accompanying notes form an integral part of these Financial Statements
104
DPAM L BALANCED CONSERVATIVE SUSTAINABLE
Investment Quantity CCY Cost
(in EUR) Evaluation value
(in EUR)
% Total Net
Assets
HANNOVER RUECK SE 1,200 EUR 171,691.15 156,360.00 0.27%
HELLOFRESH SE 3,000 EUR 154,648.48 189,600.00 0.33%
IBERDROLA S.A. 28,987 EUR 229,464.42 339,147.90 0.59%
IMCD N.V. 2,320 EUR 148,617.85 241,860.00 0.42%
INFINEON TECHNOLOGIES 10,400 EUR 190,148.92 326,456.00 0.57%
ING GROUP N.V. 32,500 EUR 284,976.11 248,332.50 0.43%
INTESA SAN PAOLO SpA 154,000 EUR 297,704.42 294,540.40 0.51%
KBC GROUP S.A. 6,600 EUR 382,320.62 378,048.00 0.66%
KERRY GROUP PLC 2,480 EUR 236,171.58 293,880.00 0.51%
KINGSPAN GROUP PLC 2,300 EUR 112,059.55 132,020.00 0.23%
KONINKLIJKE AHOLD DELHAIZE N.V. 7,300 EUR 163,134.25 168,703.00 0.29%
KONINKLIJKE DSM N.V. 1,876 EUR 149,301.39 264,140.80 0.46%
KONINKLIJKE KPN 68,000 EUR 161,647.77 169,116.00 0.30%
L'OREAL 700 EUR 198,477.31 217,560.00 0.38%
LVMH MOET HENNESSY.LOUIS VUITTON SE 500 EUR 182,101.47 255,450.00 0.45%
MEDIOBANCA 32,200 EUR 270,158.67 242,788.00 0.42%
MERCK KGAA 2,200 EUR 209,348.67 308,770.00 0.54%
MONCLER SpA 4,150 EUR 151,547.39 208,081.00 0.36%
NN GROUP N.V. 8,897 EUR 305,655.33 316,110.41 0.55%
PEUGEOT 8,000 EUR 156,496.31 178,960.00 0.31%
PIRELLI & CO SpA 45,000 EUR 207,238.19 199,485.00 0.35%
PLASTIC OMNIUM 7,250 EUR 155,100.98 204,595.00 0.36%
PROSUS N.V. 2,280 EUR 186,406.75 201,460.80 0.35%
PRYSMIAN SpA 9,200 EUR 158,968.08 267,536.00 0.47%
RANDSTAD N.V. 3,600 EUR 156,352.30 191,664.00 0.33%
SAP A.G. 3,490 EUR 314,831.97 374,197.80 0.65%
SCHNEIDER ELECTRIC SE 2,850 EUR 185,431.35 337,155.00 0.59%
SODEXO 3,300 EUR 232,546.87 228,426.00 0.40%
SOLVAY & CIE 2,050 EUR 181,615.36 198,604.00 0.35%
TELENET GROUP HLDG 6,000 EUR 194,064.98 210,480.00 0.37%
TERNA SpA 17,300 EUR 97,657.57 108,125.00 0.19%
UCB 3,450 EUR 254,300.10 291,456.00 0.51%
UMICORE S.A. 4,300 EUR 172,391.36 168,947.00 0.30%
WAREHOUSES DE PAUW N.V. 6,793 EUR 155,898.98 191,970.18 0.34%
Total EURO
12,200,996.64
14,443,840.77
25.22%
3I GROUP PLC 15,423 GBP 195,047.78 199,528.92 0.35%
ASTRAZENECA PLC 2,520 GBP 168,549.82 206,194.62 0.36%
BEAZLEY PLC 45,000 GBP 183,905.20 183,297.96 0.32%
CRODA INTERNATIONAL PLC 3,420 GBP 184,361.90 252,020.11 0.44%
DS SMITH PLC 47,000 GBP 154,839.82 196,695.34 0.34%
INTERCONTINENTAL A.G.HOTELS GROUP PLC 3,500 GBP 158,676.82 183,387.33 0.32%
SPIRAX SARCO ENGINEERING PLC 1,700 GBP 183,959.48 214,517.93 0.37%
UNILEVER PLC 3,533 GBP 172,990.94 173,354.22 0.30%
Total BRITISH POUND
1,402,331.76
1,608,996.43
2.81%
NIDEC CORP. 3,100 JPY 170,953.43 321,225.85 0.56%
SONY CORP. 4,200 JPY 197,629.81 346,106.03 0.60%
Total JAPANESE YEN
368,583.24
667,331.88
1.17%

DPAM L
Securities portfolio statement as at 31 December 2020
The accompanying notes form an integral part of these Financial Statements
105
DPAM L BALANCED CONSERVATIVE SUSTAINABLE
Investment Quantity CCY Cost
(in EUR) Evaluation value
(in EUR)
% Total Net
Assets
DNB NOR ASA -A- 9,000 NOK 127,901.82 144,329.90 0.25%
ORKLA ASA 19,500 NOK 151,523.55 161,941.58 0.28%
TOMRA SYSTEMS - NEW 10,495 NOK 226,342.11 423,366.46 0.74%
Total NORWEGIAN KRONE
505,767.48
729,637.94
1.27%
ATLAS COPCO AB -REG -A- 5,450 SEK 191,808.59 228,391.80 0.40%
NIBE INDUSTRIER AB -B- 10,200 SEK 117,669.75 273,766.23 0.48%
Total SWEDISH KRONA
309,478.34
502,158.03
0.88%
ADOBE INC. 435 USD 115,199.36 177,804.09 0.31%
AGILENT TECHNOLOGIES INC. 2,890 USD 192,429.63 279,870.95 0.49%
BOSTON SCIENTIFIC CORP. 6,700 USD 218,197.02 196,857.50 0.34%
DANAHER CORP. 1,680 USD 208,624.74 305,010.18 0.53%
DOLLAR GENERAL CORP. 1,175 USD 198,411.95 201,955.38 0.35%
DOLLAR TREE INC. 2,190 USD 169,211.33 193,377.96 0.34%
MARSH & MC LENNAN 2,500 USD 192,676.54 239,058.48 0.42%
MASTERCARD INC. -A- 970 USD 194,811.29 282,973.15 0.49%
MEDTRONIC PLC 3,230 USD 268,863.76 309,233.13 0.54%
MICROSOFT CORP. 2,430 USD 223,608.64 441,731.52 0.77%
NIKE INC. -B- 1,710 USD 127,246.69 197,714.60 0.35%
NVIDIA CORP. 590 USD 79,399.00 251,806.63 0.44%
PNC FINANCIAL SERVICES GROUP 1,550 USD 179,078.71 188,754.04 0.33%
PTC INC. 2,250 USD 171,761.19 219,952.19 0.38%
ROSS STORES INC. 2,080 USD 153,909.75 208,773.49 0.36%
S&P GLOBAL INC. 715 USD 206,554.08 192,098.36 0.34%
SERVICENOW INC. 505 USD 92,355.12 227,180.87 0.40%
SPLUNK INC. 1,340 USD 152,016.41 186,059.09 0.32%
THERMO FISHER SCIENTIFIC INC. 650 USD 198,811.45 247,441.46 0.43%
TRANE TECHNOLOGIES PLC 2,860 USD 195,446.05 339,305.79 0.59%
WALT DISNEY CO 1,620 USD 160,720.18 239,885.25 0.42%
ZOETIS INC. -A- 1,400 USD 158,606.41 189,367.01 0.33%
Total U.S. DOLLAR
3,857,939.30
5,316,211.12
9.28% Total Shares & Related Securities
19,737,901.17
24,789,619.44
43.29% Bonds
AUSTRALIA 2,75 15-211127 500,000 AUD 352,885.89 360,828.71 0.63%
AUSTRALIA 3,25 13-210425 600,000 AUD 417,622.72 426,799.95 0.75%
Total AUSTRALIAN DOLLAR
770,508.61
787,628.66
1.38%
CANADA 1,00 16-010627 1,020,000 CAD 678,348.52 676,777.33 1.18%
Total CANADIAN DOLLAR
678,348.52
676,777.33
1.18%
ABN AMRO BANK 0,875 19-150124 350,000 EUR 351,981.00 361,627.00 0.63%
ANZ BANKING GROUP FRN 19-211129 300,000 EUR 294,349.20 306,006.00 0.53%
AT&T INC. 1,05 18-050923 230,000 EUR 230,460.00 237,001.20 0.41%

DPAM L
Securities portfolio statement as at 31 December 2020
The accompanying notes form an integral part of these Financial Statements
106
DPAM L BALANCED CONSERVATIVE SUSTAINABLE
Investment Quantity CCY Cost
(in EUR) Evaluation value
(in EUR)
% Total Net
Assets
ATLAS COPCO AB 0,625 16-300826 200,000 EUR 193,446.00 208,392.00 0.36%
BANCO BILBAO VIZCAYA FRN 20-160130 200,000 EUR 198,782.00 200,015.00 0.35%
BECTON DICKINSON 1,00 16-151222 125,000 EUR 125,155.62 127,246.88 0.22%
BELGIUM KINGDOM OLO 85 18-220628 300,000 EUR 301,819.50 330,588.00 0.58%
BELGIUM OLO 73 3,00 14-220634 140,000 EUR 202,102.60 200,638.90 0.35%
BELGIUM OLO 81 0,80 17-220627 520,000 EUR 569,995.60 568,110.40 0.99%
BMW FINANCE N.V. 1,25 14-050922 140,000 EUR 143,300.50 143,626.70 0.25%
BNP PARIBAS S.A. 2,375 15-170225 500,000 EUR 504,967.50 538,792.50 0.94%
BPCE S.A. 1,00 19-010425 300,000 EUR 300,180.00 312,232.50 0.55%
BPCE S.A. 1,125 17-180123 300,000 EUR 300,825.00 308,019.00 0.54%
BPOST S.A. 1,25 18-110726 400,000 EUR 388,496.00 429,264.00 0.75%
COFIROUTE 1,00 20-190531 100,000 EUR 99,845.00 108,100.00 0.19%
COOP RABOBANK 0,625 19-270224 200,000 EUR 199,608.00 204,896.00 0.36%
CRH FINANCE B.V. 1,875 15-090124 150,000 EUR 156,190.50 158,499.00 0.28%
DEUTSCHE TELEKOM A.G. 0,875 19-250326 300,000 EUR 302,433.00 315,652.50 0.55%
DEUTSCHLAND -INFLATION LINKED- 0,10 15-150426 250,000 EUR 285,762.57 286,137.35 0.50%
ECOLAB INC. 1,00 16-150124 450,000 EUR 451,154.25 464,721.75 0.81%
EDF 1,00 16-131026 300,000 EUR 291,069.00 318,153.00 0.56%
EDP FINANCE B.V. 1,875 18-131025 300,000 EUR 315,000.00 326,769.00 0.57%
ENEL FINANCE INTERNATIONAL 1,375 16-010626 500,000 EUR 478,957.50 537,872.50 0.94%
FLEMISH COMMUNITY 0,375 20-150430 300,000 EUR 305,400.00 315,330.00 0.55%
FRANCE OAT 0,25 15-251126 600,000 EUR 593,013.00 630,789.00 1.10%
FRANCE OAT 0,75 17-250528 580,000 EUR 628,220.10 635,804.70 1.11%
FRANCE OAT 0,75 17-251128 255,000 EUR 256,595.02 280,688.70 0.49%
FRANCE OAT 1,00 16-250527 300,000 EUR 336,555.00 331,024.50 0.58%
FRANCE OAT 2,10 08-250723 430,000 EUR 560,302.52 531,212.46 0.93%
FRANCE OAT -INFLATION LINKED- 0,10 19-010329 320,000 EUR 369,718.41 363,820.71 0.64%
GECINA 1,375 17-300627 200,000 EUR 195,157.00 218,362.00 0.38%
GERMANY 0,00 20-150230 400,000 EUR 417,672.00 422,596.00 0.74%
GERMANY 0,50 18-150228 240,000 EUR 256,485.39 261,034.80 0.46%
GERMANY 1,50 14-150524 135,000 EUR 147,888.45 145,490.17 0.25%
GERMANY -INFLATION LINKED- 0,10 12-150423 270,000 EUR 306,057.30 300,681.37 0.53%
GRAND CITY PROPERTIES S.A. FRN 15-170425 200,000 EUR 191,025.00 212,601.00 0.37%
HEINEKEN N.V. 1,25 20-070533 300,000 EUR 299,616.00 329,865.00 0.58%
IBERDROLA FINANZAS 1,00 17-070325 900,000 EUR 896,706.00 941,530.50 1.64%
IBERDROLA INTERNATIONAL B.V. 16-210426 500,000 EUR 493,962.50 532,492.50 0.93%
INTESA SAN PAOLO SpA 1,00 19-040724 120,000 EUR 119,826.00 123,827.40 0.22%
INTESA SAN PAOLO SpA 1,75 18-200328 300,000 EUR 265,311.00 325,677.00 0.57%
IRELAND 1,35 18-180331 370,000 EUR 429,997.40 434,095.10 0.76%
IRISH TREASURY 1,00 16-150526 1,000,000 EUR 1,030,040.00 1,086,895.00 1.90%
ITALY BTP 0,95 20-010830 220,000 EUR 229,792.20 230,100.20 0.40%
ITALY BTP 3,85 18-010949 400,000 EUR 608,654.00 632,806.00 1.11%
ITALY TREASURY BONDS 2,80 18-011228 520,000 EUR 614,821.80 621,361.00 1.09%
KBC GROUP FRN 17-241122 100,000 EUR 98,486.50 100,722.50 0.18%
KERRY GROUP FINANCE SER 0,625 19-200929 200,000 EUR 196,076.00 206,827.00 0.36%
LONZA FINANCE INTERNATIONAL 1,625 20-210427 200,000 EUR 203,548.00 219,279.00 0.38%
MERCK FRN 20-090980 200,000 EUR 200,750.00 205,070.00 0.36%
MORGAN STANLEY 1,75 16-110324 650,000 EUR 663,520.00 687,771.50 1.20%
NESTLE FINANCE INTERNATIONAL 0,375 20-120532 300,000 EUR 294,471.00 310,903.50 0.54%
NETHERLAND 0,25 19-150729 450,000 EUR 473,143.50 481,693.50 0.84%
NETHERLANDS GOVT 0,50 19-150140 150,000 EUR 167,157.00 172,395.75 0.30%

DPAM L
Securities portfolio statement as at 31 December 2020
The accompanying notes form an integral part of these Financial Statements
107
DPAM L BALANCED CONSERVATIVE SUSTAINABLE
Investment Quantity CCY Cost
(in EUR) Evaluation value
(in EUR)
% Total Net
Assets
NETHERLANDS GOVT 0,75 18-150728 180,000 EUR 185,934.60 198,713.70 0.35%
NETHERLANDS GOVT 2,00 14-150724 180,000 EUR 201,090.60 197,595.00 0.35%
NN GROUP N.V. 0,875 17-130123 350,000 EUR 350,661.50 356,945.75 0.62%
PERNOD RICARD 2,125 14-270924 200,000 EUR 213,676.00 216,429.00 0.38%
PORTUGAL 2,125 18-171028 330,000 EUR 357,902.50 389,134.35 0.68%
PORTUGAL 2,25 18-180434 390,000 EUR 443,883.80 491,860.20 0.86%
PORTUGAL 2,875 16-210726 320,000 EUR 352,944.00 378,094.40 0.66%
PORTUGAL 4,125 17-140427 380,000 EUR 461,963.85 486,705.90 0.85%
SAP SE 1,375 18-130330 300,000 EUR 329,250.00 337,606.50 0.59%
SLOVENIA 0,275 20-140130 280,000 EUR 282,991.80 292,341.00 0.51%
SODEXHO 0,75 20-270425 300,000 EUR 298,887.00 310,485.00 0.54%
SOLVAY FINANCE 2,75 15-021227 100,000 EUR 108,246.00 117,319.00 0.20%
SPAIN KINGDOM 0,60 19-311029 375,000 EUR 393,945.00 397,295.62 0.69%
SPAIN KINGDOM 1,50 17-300427 685,000 EUR 705,186.12 764,912.10 1.34%
SPAIN KINGDOM 1,95 16-300426 500,000 EUR 532,042.50 563,465.00 0.98%
SPAIN KINGDOM -INFLATION LINKED- 1,00 15-301130 350,000 EUR 419,932.23 439,018.50 0.77%
SPAIN KINGDOM -INFLATION LINKED- 1,80 13-301124 200,000 EUR 236,907.01 236,226.48 0.41%
STATKRAFT A/S 1,125 17-200325 300,000 EUR 311,544.00 314,770.50 0.55%
STEDIN HLDG 0,50 19-141129 300,000 EUR 298,017.00 309,285.00 0.54%
SWISSCOM FINANCE B.V. 0,375 20-141128 100,000 EUR 99,127.00 103,314.50 0.18%
TAKEDA PHARMACEUTICAL 2,25 18-211126 310,000 EUR 344,180.50 349,215.00 0.61%
THERMO FISHER SCIENTIFIC 0,75 16-120924 450,000 EUR 436,020.75 463,702.50 0.81%
UNICREDIT SpA 1,00 18-180123 300,000 EUR 275,152.50 305,982.00 0.53%
VEOLIA ENVIRONNEMENT 0,927 16-040129 500,000 EUR 468,197.50 530,847.50 0.93%
Total EURO
26,643,532.19
27,836,373.54
48.61%
NEW ZEALAND 4,50 14-150427 700,000 NZD 506,953.19 511,707.66 0.89%
Total NEW ZEALAND DOLLAR
506,953.19
511,707.66
0.89% Total Bonds
28,599,342.51
29,812,487.19
52.06% Total Transferable securities admitted to an official stock exchange or dealt in on another regulated market
48,337,243.68
54,602,106.63
95.35%
Total Portfolio
48,337,243.68
54,602,106.63
95.35%

DPAM L
Securities portfolio statement as at 31 December 2020
The accompanying notes form an integral part of these Financial Statements
108
DPAM L BONDS CLIMATE TRENDS SUSTAINABLE
Investment Quantity CCY Cost
(in EUR) Evaluation value
(in EUR)
% Total Net
Assets
Transferable securities admitted to an official stock exchange or dealt in on another regulated market
Bonds
CHILE 4,50 15-010326 500,000,000 CLP 710,677.80 668,780.44 0.41%
Total CHILEAN PESO
710,677.80
668,780.44
0.41%
A2A SpA 1,00 19-160729 800,000 EUR 789,544.00 861,624.00 0.53%
ACTIVIDADES DE CONSTRUCCION Y SERVICIOS 1,875 18-200426 1,300,000 EUR 1,366,394.00 1,400,490.00 0.86%
ADIDAS A.G. 0,00 20-051028 600,000 EUR 596,460.00 605,130.00 0.37%
ADIF ALTA VELOCIDAD 0,95 19-300427 600,000 EUR 626,781.00 641,667.00 0.40%
ADIF ALTA VELOCIDAD 1,25 18-040526 600,000 EUR 639,060.00 647,796.00 0.40%
AIB GROUP PLC 2,875 20-300531 1,500,000 EUR 1,531,838.00 1,600,185.00 0.99%
ALLIANDER N.V. 0,875 16-220426 600,000 EUR 630,768.00 633,492.00 0.39%
ALLIANDER N.V. 0,875 19-240632 725,000 EUR 758,586.35 791,388.25 0.49%
ARKEMA 0,125 20-141026 500,000 EUR 497,320.00 505,497.50 0.31%
ASSICURAZIONI GENERALI 2,124 19-011030 1,900,000 EUR 1,958,766.00 2,024,972.50 1.25%
ASSICURAZIONI GENERALI 2,429 20-140731 1,000,000 EUR 1,001,590.00 1,097,850.00 0.68%
BANCO BILBAO VIZCAYA 1,00 19-210626 1,000,000 EUR 1,021,078.00 1,053,035.00 0.65%
BANCO BILBAO VIZCAYA 1,375 18-140525 900,000 EUR 947,590.00 956,781.00 0.59%
BANCO DE SABADELL FRN 20-110327 1,200,000 EUR 1,211,304.00 1,242,006.00 0.77%
BANCO SANTANDER S.A. 0,30 19-041026 900,000 EUR 904,410.00 918,846.00 0.57%
BANKINTER S.A. 0,625 20-061027 1,100,000 EUR 1,079,993.00 1,123,529.00 0.69%
BARCLAYS PLC 0,625 17-141123 1,500,000 EUR 1,498,712.00 1,517,835.00 0.93%
BELGIUM KINGDOM OLO 1,25 18-220433 2,100,000 EUR 2,400,654.68 2,493,351.00 1.54%
BFCM 0,10 20-081027 500,000 EUR 499,375.00 503,722.50 0.31%
BNP PARIBAS S.A. FRN 19-040626 1,000,000 EUR 998,060.00 1,019,210.00 0.63%
BNP PARIBAS S.A. FRN 20-141027 2,000,000 EUR 1,995,620.00 2,025,280.00 1.25%
CA-IMMOBILIEN ANLAGEN 1,0 20-271025 1,000,000 EUR 997,322.00 1,017,270.00 0.63%
CAIXABANK S.A.. FRN 20-181126 800,000 EUR 797,864.00 803,592.00 0.50%
CHANEL CERES 1,00 20-310731 600,000 EUR 596,400.00 618,825.00 0.38%
CHANEL CERES PLC 0,50 20-310726 500,000 EUR 498,630.00 507,895.00 0.31%
CHILE 0,83 19-020731 700,000 EUR 704,900.00 732,977.00 0.45%
CIE SAINT GOBAIN 0,625 19-150324 600,000 EUR 607,442.00 615,444.00 0.38%
CIE SAINT GOBAIN 1,875 19-150331 1,000,000 EUR 1,090,170.00 1,154,990.00 0.71%
CITYCON OYJ FRN 19-PERPETUAL 800,000 EUR 713,500.00 802,408.00 0.49%
COFINIMMO -SICAFI- S.A. 0,875 20-021230 500,000 EUR 496,110.00 508,850.00 0.31%
COMMERZBANK FRN 20-240326 800,000 EUR 802,694.00 812,332.00 0.50%
COVIVIO 1,125 19-170931 1,000,000 EUR 997,112.00 1,028,975.00 0.63%
CPI PROPERTY 1,625 19-230427 1,000,000 EUR 975,747.50 1,028,730.00 0.63%
CTP B.V. 0,625 20-271123 900,000 EUR 898,506.00 907,591.50 0.56%
CTP B.V. 2,125 20-011025 2,050,000 EUR 2,058,514.50 2,171,237.00 1.34%
DAIMLER A.G. 0,75 20-100930 1,300,000 EUR 1,314,500.00 1,353,566.50 0.83%
DANONE 0,571 20-170327 800,000 EUR 807,802.00 835,092.00 0.51%
DANONE FRN 17-PERPETUAL 1,300,000 EUR 1,317,504.00 1,339,143.00 0.82%
DIGITAL DUTCH FINCO 1,00 20-150132 1,000,000 EUR 996,536.00 1,037,375.00 0.64%
DONG ENERGY FRN 13-PERPETUAL 500,000 EUR 597,150.00 568,157.50 0.35%
DRAX FINCO PLC 2,625 20-011125 500,000 EUR 500,000.00 515,342.50 0.32%
DS SMITH PLC 0,875 19-120926 1,000,000 EUR 993,788.00 1,021,435.00 0.63%
DS SMITH PLC 1,375 17-260724 500,000 EUR 503,190.00 518,432.50 0.32%

DPAM L
Securities portfolio statement as at 31 December 2020
The accompanying notes form an integral part of these Financial Statements
109
DPAM L BONDS CLIMATE TRENDS SUSTAINABLE
Investment Quantity CCY Cost
(in EUR) Evaluation value
(in EUR)
% Total Net
Assets
EDF 4,125 12-250327 900,000 EUR 1,140,994.00 1,131,763.50 0.70%
ENBW FRN 19-050879 1,000,000 EUR 996,250.00 1,015,340.00 0.63%
ENEL FINANCE INTERNATIONAL 0,375 19-170627 700,000 EUR 701,123.00 714,756.00 0.44%
ENEL FINANCE INTERNATIONAL 1,125 18-160926 925,000 EUR 967,122.75 987,511.50 0.61%
ENERGIAS DE PORTUGAL 1,625 20-150427 700,000 EUR 740,243.00 763,483.00 0.47%
ENERGIAS DE PORTUGAL FRN 19-300479 1,100,000 EUR 1,218,547.00 1,211,017.50 0.75%
ENERGIAS DE PORTUGAL FRN 20-200780 700,000 EUR 687,202.00 699,681.50 0.43%
ENGIE S.A. FRN 20-PERPETUAL 1,000,000 EUR 996,270.00 1,019,635.00 0.63%
ERG SpA 0,50 20-110927 1,000,000 EUR 1,001,075.00 1,011,045.00 0.62%
EUROFIMA 0,10 20-200530 1,100,000 EUR 1,114,142.00 1,122,896.50 0.69%
EUROPEAN INVESTMENT BANK 0,01 20-151135 700,000 EUR 701,925.00 715,606.50 0.44%
FERROVIE DELLO STAT 0,875 17-071223 550,000 EUR 554,840.00 564,564.00 0.35%
FERROVIE DELLO STAT 1,125 19-090726 1,000,000 EUR 999,670.00 1,054,645.00 0.65%
FLUVIUS SYSTEM 0,25 20-021230 800,000 EUR 799,368.00 811,828.00 0.50%
GERMANY 0,00 20-150830 1,000,000 EUR 1,047,170.00 1,060,525.00 0.65%
GLOBALWORTH REAL ESTATE 2,95 20-290726 1,500,000 EUR 1,465,410.00 1,580,835.00 0.97%
HERA SpA 0,875 19-050727 550,000 EUR 551,771.00 580,283.00 0.36%
HUNGARY 1,75 20-050635 1,400,000 EUR 1,421,274.00 1,553,230.00 0.96%
HYPO VORARLBERG 0,625 17-190922 300,000 EUR 303,750.00 303,147.00 0.19%
IBERDROLA FINANZAS 0,875 20-160625 800,000 EUR 810,917.00 833,604.00 0.51%
IBERDROLA FINANZAS 1,25 17-130927 900,000 EUR 972,863.00 981,301.50 0.60%
IBERDROLA INTER FRN 20-PERPETUAL 1,000,000 EUR 1,000,000.00 1,031,860.00 0.64%
IBERDROLA INTERNATIONAL B.V. FRN 17-PERPETUAL 1,000,000 EUR 1,023,238.00 1,028,190.00 0.63%
IBERDROLA INTERNATIONAL B.V. FRN 20-PERPETUAL 800,000 EUR 800,000.00 841,744.00 0.52%
ICADE 1,50 17-130927 600,000 EUR 634,100.00 654,819.00 0.40%
INTESA SAN PAOLO SpA 0,75 19-041224 1,400,000 EUR 1,400,820.00 1,436,918.00 0.89%
IRELAND 1,35 18-180331 1,500,000 EUR 1,712,006.00 1,759,845.00 1.08%
IREN SpA 0,25 20-170131 1,000,000 EUR 990,300.00 988,910.00 0.61%
IREN SpA 0,875 19-141029 1,100,000 EUR 1,110,600.00 1,162,964.00 0.72%
IREN SpA 1,50 17-241027 850,000 EUR 866,487.40 926,729.50 0.57%
KBC GROUP FRN 20-160627 1,100,000 EUR 1,100,323.00 1,122,319.00 0.69%
KFW 0,00 20-150928 1,600,000 EUR 1,656,374.00 1,659,232.00 1.02%
KFW 0,50 18-280926 725,000 EUR 768,171.04 770,907.00 0.47%
KINGDOM OF MOROCCO 1,375 20-300326 2,500,000 EUR 2,494,390.00 2,524,637.50 1.56%
KONINKLIJKE DSM 0,25 20-230628 500,000 EUR 498,265.00 511,007.50 0.31%
KONINKLIJKE DSM 0,625 20-230632 1,100,000 EUR 1,099,519.00 1,148,191.00 0.71%
KONINKLIJKE DSM 0,75 16-280926 500,000 EUR 523,440.71 527,625.00 0.33%
LA BANQUE POSTALE 1,375 19-240429 700,000 EUR 734,906.00 767,273.50 0.47%
LA POSTE S.A. 1,45 18-301128 500,000 EUR 541,655.00 559,122.50 0.34%
LEASEPLAN CORP. 1,375 19-070324 925,000 EUR 943,188.75 964,705.63 0.59%
LEASEPLAN CORP. 3,50 20-090425 500,000 EUR 569,795.00 570,317.50 0.35%
LEGRAND S.A. 0,75 20-200530 800,000 EUR 812,020.00 849,128.00 0.52%
LEGRAND S.A. 1,875 17-060732 400,000 EUR 452,108.00 474,300.00 0.29%
MADRID 0,827 20-300727 1,100,000 EUR 1,118,161.10 1,168,634.50 0.72%
MEDIOBANCA 1,00 20-080927 1,500,000 EUR 1,521,844.00 1,555,312.50 0.96%
MITSUBISHI UFJ FINANCIAL 0,848 19-190729 500,000 EUR 500,000.00 530,400.00 0.33%
MUNICH RE 1,25 20-260541 1,300,000 EUR 1,287,035.00 1,351,928.50 0.83%
NATIONAL GRID 0,553 20-180929 500,000 EUR 500,000.00 513,430.00 0.32%
NATIONAL GRID N AM 1,00 17-120724 1,000,000 EUR 1,037,858.00 1,038,925.00 0.64%
NE PROPERTY B.V. 3,375 20-140727 1,000,000 EUR 1,000,299.00 1,087,370.00 0.67%
NETHERLANDS GOVT 0,50 19-150140 500,000 EUR 546,728.00 574,652.50 0.35%

DPAM L
Securities portfolio statement as at 31 December 2020
The accompanying notes form an integral part of these Financial Statements
110
DPAM L BONDS CLIMATE TRENDS SUSTAINABLE
Investment Quantity CCY Cost
(in EUR) Evaluation value
(in EUR)
% Total Net
Assets
OI EUROPEAN GROUP 2,875 19-150225 2,000,000 EUR 2,023,293.00 2,036,460.00 1.25%
ORANGE 0,125 20-160929 500,000 EUR 496,170.00 504,337.50 0.31%
ORSTED A/SA.S. FRN 19-PERPETUAL 500,000 EUR 495,395.00 514,135.00 0.32%
PAPREC HLDG S.A. 4,00 18-310325 1,200,000 EUR 1,181,437.50 1,202,634.00 0.74%
PROLOGIS EURO FINANCE 0,375 20-060228 600,000 EUR 586,841.50 614,703.00 0.38%
PROLOGIS INTERNATIONAL FUND 1,625 20-170632 600,000 EUR 615,847.50 678,864.00 0.42%
PROLOGIS INTERNATIONAL FUND 1,75 18-150328 700,000 EUR 755,397.99 784,304.50 0.48%
PROLOGIS INTERNATIONAL FUND 2,375 18-141130 600,000 EUR 683,274.00 724,029.00 0.45%
RED ELECTRICA FINANCE 0,375 20-240728 900,000 EUR 908,087.00 928,296.00 0.57%
ROYAL PHILIPS 0,50 19-220526 800,000 EUR 816,353.00 826,364.00 0.51%
ROYAL SCHIPHOL GROUP 0,875 20-080932 500,000 EUR 495,765.00 526,932.50 0.32%
SATO OYJ 1,375 20-240228 1,200,000 EUR 1,200,624.00 1,233,678.00 0.76%
SCHNEIDER ELECTRIC 1,00 20-090427 1,200,000 EUR 1,254,368.99 1,283,316.00 0.79%
SCHNEIDER ELECTRICCV 0,00 20-150626 3,870 EUR 735,845.70 740,901.83 0.46%
SIEMENS FINANCE 0,50 19-050934 700,000 EUR 696,681.00 736,918.00 0.45%
SIGNIFY N.V. 2,375 20-110527 1,000,000 EUR 1,043,500.00 1,109,465.00 0.68%
SNCF RESEAU 1,00 16-091131 600,000 EUR 639,570.00 666,621.00 0.41%
SOCIETE GENERALE 0,875 20-220928 1,500,000 EUR 1,512,681.80 1,549,365.00 0.95%
SOLVAY FINANCE FRN 13-PERPETUAL 900,000 EUR 1,027,128.00 999,711.00 0.62%
SOLVAY FINANCE FRN 15-PERPETUAL 500,000 EUR 573,650.00 572,782.50 0.35%
SOLVAY FRN 20-PERPETUAL 1,100,000 EUR 1,099,138.00 1,132,219.00 0.70%
SOLVAY S.A. 0,5 19-060929 800,000 EUR 791,644.00 816,836.00 0.50%
SPAREBANK VEST BOLIGKR 0,01 20-280627 500,000 EUR 505,825.00 511,417.50 0.32%
SSE PLC 1,75 20-160430 1,000,000 EUR 1,084,610.00 1,121,725.00 0.69%
SSE PLC FRN 20-PERPETUAL 600,000 EUR 624,250.20 639,858.00 0.39%
STEDIN HLDG 0,50 19-141129 900,000 EUR 901,534.00 927,855.00 0.57%
STORA ENSO OYJ 0,625 20-021230 300,000 EUR 297,633.00 305,475.00 0.19%
SVENSKA HANDELSBANKEN 0,01 20-021227 1,000,000 EUR 999,580.00 999,775.00 0.62%
SWISSCOM FINANCE B.V. 0,375 20-141128 1,100,000 EUR 1,116,187.00 1,136,459.50 0.70%
SYMRISE 1,375 20-010727 1,100,000 EUR 1,126,571.00 1,161,325.00 0.72%
TELEFONICA EUROPE FRN 20-PERPETUAL 1,400,000 EUR 1,397,988.00 1,432,522.00 0.88%
TELIA CO FRN 20-110581 800,000 EUR 792,800.00 813,232.00 0.50%
TENNET HLDG 0,125 20-301132 900,000 EUR 893,169.00 896,058.00 0.55%
TENNET HLDG FRN 20-PERPETUAL 950,000 EUR 952,190.00 991,947.25 0.61%
TERNA SpA 0,75 20-240732 750,000 EUR 747,172.50 792,033.75 0.49%
TERNA SpA 1,00 19-100426 425,000 EUR 440,393.50 448,921.12 0.28%
TORNATOR OYJ 1,25 20-141026 800,000 EUR 799,312.00 823,832.00 0.51%
UMICORE S.A. 0,00 20-230625 1,800,000 EUR 1,764,440.00 1,817,361.00 1.12%
UNIPOL GRUPPO FINANZIARO SpA 3,25 20-230930 600,000 EUR 615,276.00 636,672.00 0.39%
UNIPOL GRUPPO FINANZIARO SpA 3,25 20-230930 2,000,000 EUR 1,995,120.00 2,114,740.00 1.30%
UPM-KYMMENE 0,125 20-191128 1,000,000 EUR 992,672.00 997,455.00 0.61%
VATTENFALL AB 0,05 20-151025 800,000 EUR 802,763.00 805,976.00 0.50%
VATTENFALL FRN 15-190377 1,300,000 EUR 1,379,400.00 1,404,793.00 0.87%
VEOLIA ENVIRONNEMENT FRN 20-PERPETUAL 700,000 EUR 700,000.00 714,668.50 0.44%
VEOLIA ENVIRONNEMENT FRN 20-PERPETUAL 1,500,000 EUR 1,500,000.00 1,519,987.50 0.94%
VF CORP. 0,25 20-250228 1,400,000 EUR 1,378,785.00 1,416,611.00 0.87%
VINCI S.A. 0,00 20-271128 300,000 EUR 301,419.00 300,868.50 0.19%
VODAFONE GROUP 0,90 19-241126 1,025,000 EUR 1,060,525.10 1,080,493.50 0.67%
VOLVO CAR AB 2,50 20-071027 1,500,000 EUR 1,502,100.00 1,588,537.50 0.98%
Total EURO
136,959,253.06
140,964,917.83
86.83%

DPAM L
Securities portfolio statement as at 31 December 2020
The accompanying notes form an integral part of these Financial Statements
111
DPAM L BONDS CLIMATE TRENDS SUSTAINABLE
Investment Quantity CCY Cost
(in EUR) Evaluation value
(in EUR)
% Total Net
Assets
BARCLAYS FRN 20-031126 1,000,000 GBP 1,105,752.46 1,154,938.00 0.71%
ENEL FINANCE INTERNATIONAL 1,00 20-201027 500,000 GBP 551,484.49 567,531.56 0.35%
SIEMENS FINANCE 0,875 20-050623 700,000 GBP 776,634.20 793,683.95 0.49%
Total BRITISH POUND
2,433,871.15
2,516,153.51
1.55%
KFW 1,25 19-280823 15,000,000 NOK 1,435,263.90 1,457,545.82 0.90%
Total NORWEGIAN KRONE
1,435,263.90
1,457,545.82
0.90%
PERU 8,20 06-120826. 2,000,000 PEN 664,694.60 613,599.34 0.38%
Total PERUVIAN SOL
664,694.60
613,599.34
0.38%
SWEDEN 0,125 20-090930 16,000,000 SEK 1,569,747.26 1,616,066.08 1.00%
Total SWEDISH KRONA
1,569,747.26
1,616,066.08
1.00%
BANCO NACIONAL 4,75 17-090524 1,300,000 USD 1,215,731.41 1,159,677.99 0.71%
EDP FINANCE B.V. 1,71 20-240128 1,500,000 USD 1,269,870.85 1,233,449.80 0.76%
ING GROUP N.V. 4,625 18-060126 1,300,000 USD 1,262,941.58 1,248,814.92 0.77%
JOHNSON CONTROLS 1,75 20-150930 1,000,000 USD 845,359.34 834,530.67 0.51%
MOROCCO 2,375 20-151227 1,500,000 USD 1,235,353.12 1,231,298.27 0.76%
MOROCCO 5,50 12-111242 800,000 USD 814,889.31 818,304.11 0.50%
VERIZON COMMUNICATIONS INC. 3,875 19-080229 700,000 USD 683,726.51 672,112.71 0.41%
XYLEM INC. 1,95 20-300128 1,100,000 USD 992,107.55 947,152.55 0.58%
Total U.S. DOLLAR
8,319,979.67
8,145,341.02
5.02% Total Bonds
152,093,487.44
155,982,404.04
96.08% Total Transferable securities admitted to an official stock exchange or dealt in on another regulated market
152,093,487.44
155,982,404.04
96.08%
Total Portfolio
152,093,487.44
155,982,404.04
96.08%

DPAM L
Securities portfolio statement as at 31 December 2020
The accompanying notes form an integral part of these Financial Statements
112
DPAM L BONDS GOVERNMENT SUSTAINABLE
Investment Quantity CCY Cost
(in EUR) Evaluation value
(in EUR)
% Total Net
Assets
Transferable securities admitted to an official stock exchange or dealt in on another regulated market
Bonds
AUSTRALIA 1,00 20-211131 1,000,000 AUD 614,230.73 626,866.80 0.72%
AUSTRALIA 2,75 15-211127 8,000,000 AUD 5,562,531.86 5,773,259.34 6.64%
AUSTRALIA 3,00 16-210347 550,000 AUD 434,558.75 426,274.28 0.49%
AUSTRALIA GOVT 2,75 18-210541 750,000 AUD 547,910.81 555,570.44 0.64%
AUSTRALIA -INFLATION LINKED- 2,50 10-200930 900,000 AUD 884,777.98 922,692.99 1.06%
Total AUSTRALIAN DOLLAR
8,044,010.13
8,304,663.85
9.55%
CANADA 1,00 16-010627 10,000,000 CAD 6,731,418.08 6,635,071.85 7.63%
CANADA 3,50 11-011245 950,000 CAD 945,664.71 920,755.87 1.06%
CANADIAN GOVT 1,25 19-010630 500,000 CAD 336,849.90 337,543.30 0.39%
Total CANADIAN DOLLAR
8,013,932.69
7,893,371.02
9.08%
SWISS CONFEDERATION 0,50 15-270530 2,500,000 CHF 2,610,196.15 2,552,967.96 2.94%
Total SWISS FRANC
2,610,196.15
2,552,967.96
2.94%
DENMARK KINGDOM 0,50 18-151129 32,000,000 DKK 4,631,045.69 4,672,822.42 5.37%
DENMARK KINGDOM -INFLATION LINKED- 0,10 11-151123 1,200,000 DKK 184,490.29 181,580.61 0.21%
DENMARK KINGDOM -INFLATION LINKED- 0,10 18-151130 1,300,000 DKK 211,279.63 206,888.41 0.24%
Total DANISH KRONE
5,026,815.61
5,061,291.44
5.82%
AUSTRIA 0,75 18-200228 600,000 EUR 643,500.00 657,882.00 0.76%
AUSTRIA 2,40 13-230534 2,500,000 EUR 3,308,850.00 3,410,750.00 3.92%
BELGIUM KINGDOM OLO 88 1,7 19-22062050 600,000 EUR 758,377.00 831,453.00 0.96%
BELGIUM OLO 87 0,90 19-220629 2,250,000 EUR 2,486,900.00 2,513,317.50 2.89%
DEUTSCHLAND -INFLATION LINKED- 0,10 15-150426 5,300,000 EUR 6,135,333.03 6,066,111.69 6.98%
EXPORT DEVELOPMENT 0,00 20-270125 400,000 EUR 406,140.00 407,380.00 0.47%
FINLAND 1,125 18-150434 2,500,000 EUR 2,869,745.83 2,965,712.50 3.41%
FRANCE OAT 1,50 18-250550 250,000 EUR 333,877.50 333,308.75 0.38%
FRANCE OAT -INFLATION LINKED- 0,10 19-010329 750,000 EUR 827,850.54 852,704.79 0.98%
IRELAND 1,35 18-180331 5,500,000 EUR 6,303,112.50 6,452,765.00 7.42%
KFW 0,625 17-220227 1,600,000 EUR 1,699,374.85 1,718,048.00 1.98%
KFW 1,25 16-040736 2,800,000 EUR 3,303,831.75 3,385,200.00 3.89%
NETHERLANDS GOVT 0,50 19-150140 200,000 EUR 225,429.00 229,861.00 0.26%
REPUBLIKA SLOVENIJA 1,25 17-220327 6,000,000 EUR 6,568,790.77 6,616,860.00 7.61%
REPUBLIKA SLOVENIJA 1,50 15-250335 550,000 EUR 637,545.00 665,808.00 0.77%
SLOVENIA 0,488 20-201050 150,000 EUR 149,770.50 158,428.50 0.18%
Total EURO
36,658,428.27
37,265,590.73
42.86%
UK TREASURY 1,25 17-220727 3,000,000 GBP 3,732,659.02 3,622,422.08 4.17%
UK TREASURY 3,50 14-220145 1,000,000 GBP 1,823,423.21 1,800,798.80 2.07%
Total BRITISH POUND
5,556,082.23
5,423,220.88
6.24%
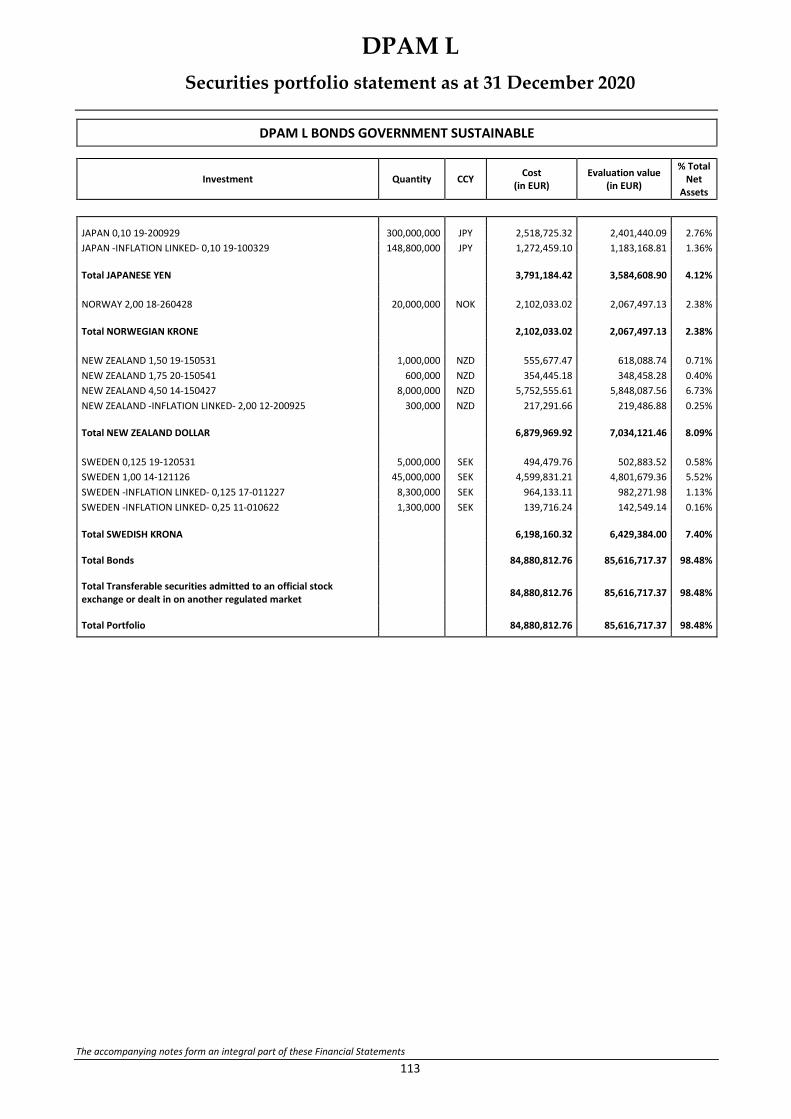
DPAM L
Securities portfolio statement as at 31 December 2020
The accompanying notes form an integral part of these Financial Statements
113
DPAM L BONDS GOVERNMENT SUSTAINABLE
Investment Quantity CCY Cost
(in EUR) Evaluation value
(in EUR)
% Total Net
Assets
JAPAN 0,10 19-200929 300,000,000 JPY 2,518,725.32 2,401,440.09 2.76%
JAPAN -INFLATION LINKED- 0,10 19-100329 148,800,000 JPY 1,272,459.10 1,183,168.81 1.36%
Total JAPANESE YEN
3,791,184.42
3,584,608.90
4.12%
NORWAY 2,00 18-260428 20,000,000 NOK 2,102,033.02 2,067,497.13 2.38%
Total NORWEGIAN KRONE
2,102,033.02
2,067,497.13
2.38%
NEW ZEALAND 1,50 19-150531 1,000,000 NZD 555,677.47 618,088.74 0.71%
NEW ZEALAND 1,75 20-150541 600,000 NZD 354,445.18 348,458.28 0.40%
NEW ZEALAND 4,50 14-150427 8,000,000 NZD 5,752,555.61 5,848,087.56 6.73%
NEW ZEALAND -INFLATION LINKED- 2,00 12-200925 300,000 NZD 217,291.66 219,486.88 0.25%
Total NEW ZEALAND DOLLAR
6,879,969.92
7,034,121.46
8.09%
SWEDEN 0,125 19-120531 5,000,000 SEK 494,479.76 502,883.52 0.58%
SWEDEN 1,00 14-121126 45,000,000 SEK 4,599,831.21 4,801,679.36 5.52%
SWEDEN -INFLATION LINKED- 0,125 17-011227 8,300,000 SEK 964,133.11 982,271.98 1.13%
SWEDEN -INFLATION LINKED- 0,25 11-010622 1,300,000 SEK 139,716.24 142,549.14 0.16%
Total SWEDISH KRONA
6,198,160.32
6,429,384.00
7.40% Total Bonds
84,880,812.76
85,616,717.37
98.48% Total Transferable securities admitted to an official stock exchange or dealt in on another regulated market
84,880,812.76
85,616,717.37
98.48%
Total Portfolio
84,880,812.76
85,616,717.37
98.48%

DPAM L
Securities portfolio statement as at 31 December 2020
The accompanying notes form an integral part of these Financial Statements
114
DPAM L CONVERTIBLE WORLD SUSTAINABLE
Investment Quantity CCY Cost
(in EUR) Evaluation value
(in EUR)
% Total Net
Assets
Transferable securities admitted to an official stock exchange or dealt in on another regulated market
Shares & Related Securities
ENDEAVOUR MINING CORP. 11,000 CAD 210,624.15 209,019.76 0.72%
Total CANADIAN DOLLAR
210,624.15
209,019.76
0.72%
KORIAN S.A. 10,000 EUR 291,733.34 313,400.00 1.09%
Total EURO
291,733.34
313,400.00
1.09% Total Shares & Related Securities
502,357.49
522,419.76
1.81% Bonds
FLIGHT CENTRE TRAVEL 2,50 20-171127 400,000 AUD 264,993.64 283,171.04 0.98%
Total AUSTRALIAN DOLLAR
264,993.64
283,171.04
0.98%
SIKA A.G. CONV 0,15 18-050625 360,000 CHF 436,694.54 450,729.79 1.56%
Total SWISS FRANC
436,694.54
450,729.79
1.56%
ACCOR CV 0,70 20-071227 17,398 EUR 920,591.76 910,411.24 3.15%
ADIDAS A.G. 0,05 18-120923 200,000 EUR 245,800.00 252,525.00 0.87%
AIR FRANCE KLM 0,125 19-250326 7,000 EUR 87,500.00 101,661.00 0.35%
AKKA TECHNOLOGIES 3,5 19-PERPETUAL 200,000 EUR 158,500.00 156,124.00 0.54%
AMADEUS IT GROUP CONV 1,50 20-090425 300,000 EUR 402,830.00 419,926.50 1.45%
ATOS SE 0,00 19-061124 100,000 EUR 127,000.00 132,486.00 0.46%
DELIVERY HERO 0,875 20-150725 200,000 EUR 217,700.00 226,919.00 0.79%
DELIVERY HERO SE 0,25 20-230124 200,000 EUR 244,000.00 281,955.00 0.98%
DEUTSCHE LUFTHANSA 2,00 20-171125 800,000 EUR 900,816.00 935,592.00 3.24%
EDF 0,00 20-140924 55,000 EUR 803,920.00 864,242.50 2.99%
HELLOFRESH SE CV 0,75 20-130525 100,000 EUR 125,250.00 146,003.50 0.51%
IBERDROLA INTERNATIONAL B.V. 0,00 15-11112 100,000 EUR 124,750.00 138,257.50 0.48%
JUST EAT TAKEAWAY 1,25 20-300426 200,000 EUR 235,500.00 224,429.00 0.78%
ORPEA S.A. 0,375 19-170527 1,200 EUR 176,160.00 178,201.20 0.62%
RAG-STIFTUNG CV 0,00 20-170626 200,000 EUR 203,688.00 226,017.00 0.78%
SYMRISE 0,238 17-200624 100,000 EUR 126,500.00 127,189.00 0.44%
TAG IMMOBILIEN A.G. 0,625 20-270826 100,000 EUR 106,890.00 103,991.00 0.36%
TAKEWAY.COM 2,25 19-250124 400,000 EUR 567,850.00 582,124.00 2.02%
ZALANDO SE 0,05 20-060825 400,000 EUR 488,846.90 513,086.00 1.78%
Total EURO
6,264,092.66
6,521,140.44
22.59%
CHINA CONCH VENTURE 0,00 18-050923 2,000,000 HKD 250,270.67 244,785.37 0.85%
CHINA EDUCATION CONVERTIBLE 2,00 19-280324 4,000,000 HKD 505,895.61 512,548.95 1.78%
HARVEST INTERNAT CONVERTIBLE 0,0 17-211122 2,000,000 HKD 247,972.77 343,373.47 1.19%
KINGSOFT CORP. CV 0,625 20-290425 2,000,000 HKD 293,582.04 343,642.26 1.19%
Total HONG KONG DOLLAR
1,297,721.09
1,444,350.05
5.00%

DPAM L
Securities portfolio statement as at 31 December 2020
The accompanying notes form an integral part of these Financial Statements
115
DPAM L CONVERTIBLE WORLD SUSTAINABLE
Investment Quantity CCY Cost
(in EUR) Evaluation value
(in EUR)
% Total Net
Assets
KANSAI PAINT CV 0,00 16-170622 40,000,000 JPY 350,105.89 351,919.59 1.22%
MITSUMI ELECTRIC CV 0,00 15-030822 50,000,000 JPY 474,584.10 455,027.07 1.58%
NAGOYA RAILROAD 0,00 14-111224 40,000,000 JPY 355,033.03 340,061.33 1.18%
SBI HLDG INC. 0,00 20-250725 70,000,000 JPY 644,979.60 609,619.84 2.11%
TEIJIN LTD CONVERTIBLE 0,00 14-101221 30,000,000 JPY 264,604.16 260,372.71 0.90%
Total JAPANESE YEN
2,089,306.78
2,017,000.54
6.99%
SINGAPORE AIRLINES 1,625 20-031225 750,000 SGD 478,194.88 505,372.27 1.75%
Total SINGAPORE DOLLAR
478,194.88
505,372.27
1.75%
AKAMAI TECHNO CONVERTIBLE 0,125 18-010525 700,000 USD 713,207.82 708,653.10 2.45%
AKAMAI TECHNOLOGIES INC. 0,375 19-010927 110,000 USD 103,010.29 100,259.53 0.35%
AMERICAN AIRLINES 6,50 20-010725 200,000 USD 186,969.08 206,144.42 0.71%
BIOMARIN PHARMACEUTICAL CONVERTIBLE 0,599 17-010824 100,000 USD 88,610.83 88,092.03 0.31%
BIOMARIN PHARMACEUTICAL CONVERTIBLE 1,25 20-150527 50,000 USD 41,471.94 42,700.13 0.15%
BOOKING HLDG CONVERTIBLE 0,75 20-010525 300,000 USD 350,479.77 358,558.29 1.24%
BURLINGTON STOR CONVERTIBLE 2,25 20-150425 150,000 USD 151,066.80 170,584.78 0.59%
CHEGG INC. CONVERTIBLE 0,00 20-010926 150,000 USD 133,696.38 137,461.08 0.48%
COUPA SOFTWARE CONVERTIBLE 0,375 20-150626 50,000 USD 50,396.74 55,064.57 0.19%
CYBERARK SOFTWARE 0,00 19-151124 150,000 USD 126,427.36 149,308.57 0.52%
DATADOG INC. CONVERTIBLE 0,125 20-150625 580,000 USD 627,160.86 622,996.94 2.16%
DEXCOM INC. CONVERTIBLE 0,25 15-151125 110,000 USD 93,126.12 90,732.58 0.31%
EVERBRIDGE 0,125 CV 19-151224 100,000 USD 100,271.75 121,029.38 0.42%
FTI CONSULTING CV 2,00 19-150823 600,000 USD 614,176.06 615,939.69 2.13%
GUARDANT HEALTH CV 0,00 20-151127 200,000 USD 169,813.72 191,296.64 0.66%
ILLUMINA CV 0,00 18-150823 500,000 USD 452,395.05 459,617.51 1.59%
ILLUMINA INC. CV 0,50 14-150621 400,000 USD 449,993.82 477,825.99 1.66%
INSULET CORP. CONVERTIBLE 0,375 20-010926 300,000 USD 334,592.22 326,633.57 1.13%
JAZZ INVESTMENTS CV 2,00 20-150626 800,000 USD 824,984.17 857,396.91 2.97%
JP MORGAN CHASE CONVERTIBLE 0,125 20-010123 800,000 USD 819,175.77 752,969.64 2.61%
MONGO -DEUTSCHE BANK INC. CONVERTIBLE 0,25 20-150126 300,000 USD 384,052.38 443,110.22 1.53%
NICE LTD CONVERTIBLE 0,00 20-150925 100,000 USD 88,197.97 92,433.08 0.32%
OKTA INC. CV 0,375 20-150626 400,000 USD 410,567.37 420,198.60 1.46%
ON SEMICONDUCTOR 1,625 17-151023 150,000 USD 188,900.47 207,513.79 0.72%
PALO ALTO CV 0,75 18-010723 200,000 USD 206,719.44 231,505.87 0.80%
PALO ALTO NETWORKS 0,375 20-010625 70,000 USD 62,746.69 75,836.05 0.26%
PINDUODUO CV 0,00 20-011225 200,000 USD 186,522.76 202,255.73 0.70%
PIONEER NATURAL CONVERTIBLE 0,25 20-150525 400,000 USD 388,504.79 432,459.65 1.50%
QIAGEN N.V. 1,00 18-131124 800,000 USD 815,364.73 832,273.31 2.88%
SOUTHWEST AIR CONVERTIBLE 1,25 20-010525 750,000 USD 924,263.86 894,501.65 3.10%
SPLUNK INC. CONVERTIBLE 1,125 20-150627 150,000 USD 140,970.73 128,026.24 0.44%
STMICROELECTRONICS 0,00 20-040825 1,200,000 USD 1,240,895.71 1,193,100.40 4.13%
TELADOC HEALTH CONVERTIBLE 1,25 20-010627 460,000 USD 451,866.49 448,570.96 1.55%
UNDER ARMOUR CONVERTIBLE 1,50 20-010624 240,000 USD 323,251.99 324,119.16 1.12%
VIAVI SOLUTIONS CONVERTIBLE 1,00 18-010324 500,000 USD 509,293.55 527,785.95 1.83%
VIVA BIOTECH CONVERTIBLE 1,00 20-301225 200,000 USD 163,766.64 169,259.12 0.59%
WIX.COM CONVERTIBLE 0,00 20-150825 150,000 USD 131,407.35 122,849.70 0.43%
XERO INVESTMENTS CV 0,00 20-021225 200,000 USD 168,877.66 178,271.42 0.62%
XIAOMI BEST TIME CV 0,00 20-171227 400,000 USD 355,952.62 422,943.08 1.47%
YANDEX N.V. CV 0,75 20-030325 400,000 USD 427,237.19 423,464.51 1.47%

DPAM L
Securities portfolio statement as at 31 December 2020
The accompanying notes form an integral part of these Financial Statements
116
DPAM L CONVERTIBLE WORLD SUSTAINABLE
Investment Quantity CCY Cost
(in EUR) Evaluation value
(in EUR)
% Total Net
Assets
ZENDESK INC. CONVERTIBLE 0,625 20-150625 60,000 USD 68,796.18 72,075.52 0.25%
ZILLOW GROUP CONVERTIBLE 1,50 18-010723 80,000 USD 91,271.71 111,555.72 0.39%
ZSCALER INC. CONVERTIBLE 0,125 20-010725 150,000 USD 149,998.51 182,752.23 0.63%
ZYNGA CV 0,25 20-010624 570,000 USD 598,368.01 623,317.39 2.16%
Total U.S. DOLLAR
14,908,821.35
15,293,444.70
52.98%
SAPPI SOUTH AFRICA 5,25 20-261125 400 ZAR 250,022.01 261,658.26 0.91%
Total SOUTH AFRICAN RAND
250,022.01
261,658.26
0.91% Total Bonds
25,989,846.95
26,776,867.09
92.76% Total Transferable securities admitted to an official stock exchange or dealt in on another regulated market
26,492,204.44
27,299,286.85
94.57%
Options
CALL BNP PARIBAS SA MARS 21 ST 44 150 EUR 47,250.00 39,750.00 0.14%
CALL DJ EURO STOXX 50 WK JANVIER 21 ST 3625 40 EUR 15,800.00 13,240.00 0.05%
CALL VINCI SA JUIN 21 ST 88 20 EUR 9,600.00 8,880.00 0.03%
CALL VINCI SA MARS 21 ST 88 30 EUR 13,810.00 8,700.00 0.03%
Total EURO
86,460.00
70,570.00
0.24%
CALL FTSE 100 JANVIER 21 ST 6700 20 GBP 13,445.75 5,250.81 0.02%
Total BRITISH POUND
13,445.75
5,250.81
0.02% Total Options
99,905.75
75,820.81
0.26% Total Portfolio
26,592,110.19
27,375,107.66
94.83%

DPAM L
Geographical allocation of the securities portfolio as at 31 December 2020
ets invested in investment funds, these distributions, for technical reasons, reflect the nature of the products and the legal domicile of the funds and not the actual exposures of the underlyings of the assets that have been selected.
117
Geographi cal allocation of the se curities portfolio a s at 31 Dece mber 2020
ets invested in invest ment funds, t hese distri butions, for technical reas ons, reflect t he nature of the pr oduct s and the legal domi cile of the funds and not the actual ex pos ures of the underlyings of the as sets that have bee n selecte d.
(Content)
DPAM L BONDS EUR QUALITY SUSTAINABLE % TOTAL NET ASSETS
FRANCE 21.38 % UNITED STATES OF AMERICA 16.79 % NETHERLANDS 15.57 % ITALY 6.78 % UNITED KINGDOM 5.78 % GERMANY 5.31 % BELGIUM 5.21 % LUXEMBURG 4.94 % SPAIN 4.75 % MEXICO 2.03 % SWEDEN 1.82 % JAPAN 1.81 % IRELAND 1.62 % FINLAND 1.03 % AUSTRIA 0.79 % AUSTRALIA 0.57 % NORWAY 0.47 % DENMARK 0.42 % CANADA 0.38 % SWITZERLAND 0.36 % GUERNSEY 0.29 % JERSEY 0.07 %
Total Portfolio 98.17 %
(Content)
DPAM L BONDS UNIVERSALIS UNCONSTRAINED % TOTAL NET ASSETS
UNITED STATES OF AMERICA 24.59 % SPAIN 8.02 % FRANCE 7.53 % GERMANY 6.88 % MEXICO 6.38 % NETHERLANDS 5.42 % AUSTRALIA 4.68 % PORTUGAL 4.62 % CHINA 4.36 % NEW ZEALAND 3.45 % JAPAN 3.36 % UNITED KINGDOM 3.32 % SOUTH AFRICA 2.42 % SWEDEN 2.29 % CZECH REPUBLIC 1.70 % BELGIUM 1.59 % ROMANIA 1.55 % CANADA 1.46 % PHILIPPINES 0.96 % LUXEMBURG 0.90 % JERSEY 0.75 % GUERNSEY 0.50 % CAYMAN ISLANDS 0.36 % MOROCCO 0.17 % SWITZERLAND 0.13 %
Total Portfolio 97.39 %
(Content)

DPAM L
Geographical allocation of the securities portfolio as at 31 December 2020
ets invested in investment funds, these distributions, for technical reasons, reflect the nature of the products and the legal domicile of the funds and not the actual exposures of the underlyings of the assets that have been selected.
118
DPAM L BONDS HIGHER YIELD % TOTAL NET ASSETS
FRANCE 13.61 % NETHERLANDS 11.83 % LUXEMBURG 10.62 % ITALY 8.91 % UNITED KINGDOM 7.85 % MEXICO 6.01 % UNITED STATES OF AMERICA 5.96 % BELGIUM 5.07 % SWEDEN 4.69 % GERMANY 3.52 % INDONESIA 3.27 % SOUTH AFRICA 2.73 % BRAZIL 1.83 % SPAIN 1.51 % CAYMAN ISLANDS 1.29 % AUSTRIA 1.28 % SWITZERLAND 1.08 % PORTUGAL 1.03 % ROMANIA 0.98 % MONTENEGRO 0.84 % IRELAND 0.64 % DENMARK 0.51 % TUNISIA 0.45 % ARMENIA 0.41 % JAPAN 0.39 % MACEDONIA 0.28 % FINLAND 0.27 %
Total Portfolio 96.86 %
(Content)
DPAM L BONDS GOVERNMENT SUSTAINABLE HEDGED % TOTAL NET ASSETS
CANADA 10.53 % AUSTRALIA 9.30 % UNITED KINGDOM 8.94 % NEW ZEALAND 7.80 % FRANCE 7.24 % IRELAND 6.38 % BELGIUM 6.32 % DENMARK 6.03 % SLOVENIA 5.99 % GERMANY 5.33 % FINLAND 4.67 % AUSTRIA 4.59 % SWEDEN 4.42 % NORWAY 3.03 % JAPAN 2.94 % SWITZERLAND 2.19 % NETHERLANDS 1.16 % LUXEMBURG 0.09 %
Total Portfolio 96.95 %
(Content)

DPAM L
Geographical allocation of the securities portfolio as at 31 December 2020
ets invested in investment funds, these distributions, for technical reasons, reflect the nature of the products and the legal domicile of the funds and not the actual exposures of the underlyings of the assets that have been selected.
119
DPAM L EQUITIES CONVICTION RESEARCH % TOTAL NET ASSETS
FRANCE 18.21 % SPAIN 14.33 % UNITED KINGDOM 13.64 % SWITZERLAND 11.66 % NORWAY 6.32 % GERMANY 6.23 % ITALY 5.84 % NETHERLANDS 5.64 % SWEDEN 5.24 % FINLAND 5.09 % IRELAND 3.61 % DENMARK 2.71 %
Total Portfolio 98.52 %
(Content)
DPAM L BONDS EUR HIGH YIELD SHORT TERM % TOTAL NET ASSETS
FRANCE 33.01 % NETHERLANDS 9.93 % UNITED STATES OF AMERICA 7.68 % ITALY 6.75 % GERMANY 6.57 % UNITED KINGDOM 5.64 % LUXEMBURG 5.53 % JAPAN 4.87 % DENMARK 4.69 % SWEDEN 4.15 % SPAIN 1.76 % AUSTRIA 1.52 % FINLAND 1.51 % IRELAND 1.44 % BELGIUM 0.30 %
Total Portfolio 95.35 %
(Content)

DPAM L
Geographical allocation of the securities portfolio as at 31 December 2020
ets invested in investment funds, these distributions, for technical reasons, reflect the nature of the products and the legal domicile of the funds and not the actual exposures of the underlyings of the assets that have been selected.
120
DPAM L PATRIMONIAL FUND % TOTAL NET ASSETS
UNITED STATES OF AMERICA 20.13 % GERMANY 13.52 % FRANCE 8.53 % LUXEMBURG 8.38 % NETHERLANDS 7.16 % ITALY 6.01 % SPAIN 4.23 % JERSEY 4.20 % BELGIUM 3.35 % JAPAN 2.94 % SWEDEN 2.75 % CANADA 1.99 % AUSTRALIA 1.80 % UNITED KINGDOM 1.52 % PANAMA 1.40 % MEXICO 1.23 % AUSTRIA 1.07 % PORTUGAL 0.93 % NORWAY 0.89 % SWITZERLAND 0.79 % ROMANIA 0.56 % INDONESIA 0.53 % HONG-KONG 0.51 % IRELAND 0.44 % CAYMAN ISLANDS 0.36 % NEW ZEALAND 0.35 % SINGAPORE 0.35 % PERU 0.31 %
Total Portfolio 96.23 %
(Content)
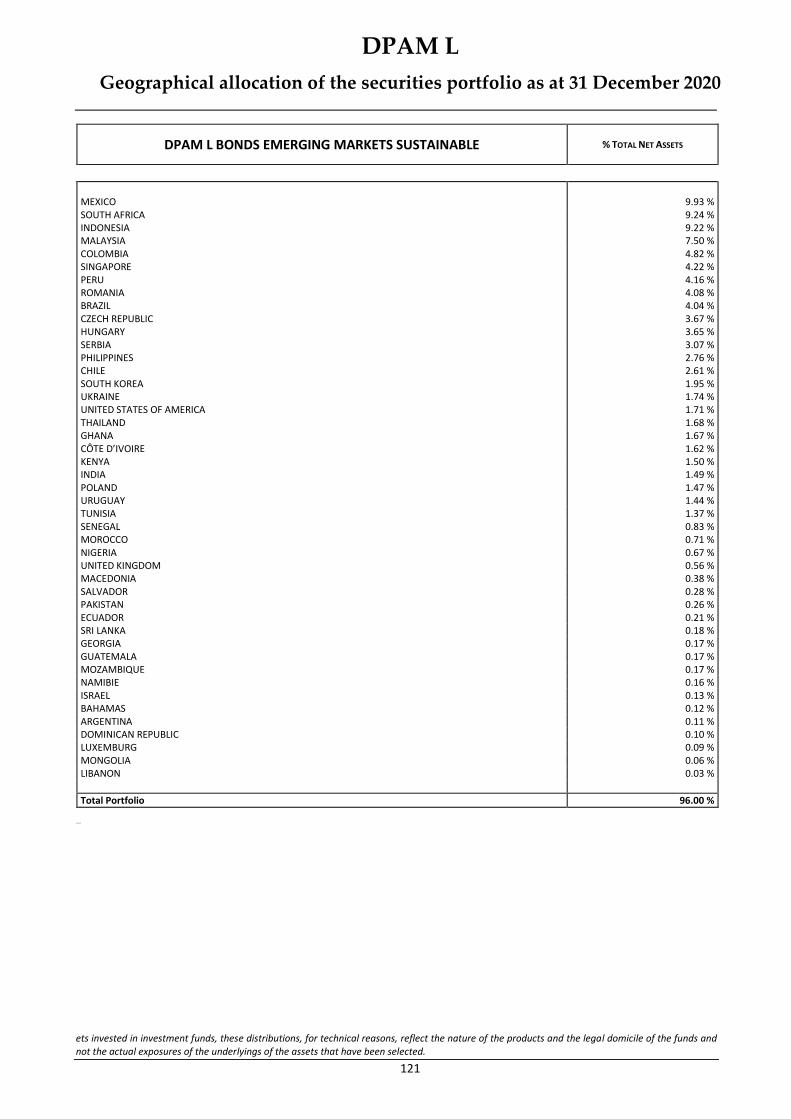
DPAM L
Geographical allocation of the securities portfolio as at 31 December 2020
ets invested in investment funds, these distributions, for technical reasons, reflect the nature of the products and the legal domicile of the funds and not the actual exposures of the underlyings of the assets that have been selected.
121
DPAM L BONDS EMERGING MARKETS SUSTAINABLE % TOTAL NET ASSETS
MEXICO 9.93 % SOUTH AFRICA 9.24 % INDONESIA 9.22 % MALAYSIA 7.50 % COLOMBIA 4.82 % SINGAPORE 4.22 % PERU 4.16 % ROMANIA 4.08 % BRAZIL 4.04 % CZECH REPUBLIC 3.67 % HUNGARY 3.65 % SERBIA 3.07 % PHILIPPINES 2.76 % CHILE 2.61 % SOUTH KOREA 1.95 % UKRAINE 1.74 % UNITED STATES OF AMERICA 1.71 % THAILAND 1.68 % GHANA 1.67 % CÔTE D’IVOIRE 1.62 % KENYA 1.50 % INDIA 1.49 % POLAND 1.47 % URUGUAY 1.44 % TUNISIA 1.37 % SENEGAL 0.83 % MOROCCO 0.71 % NIGERIA 0.67 % UNITED KINGDOM 0.56 % MACEDONIA 0.38 % SALVADOR 0.28 % PAKISTAN 0.26 % ECUADOR 0.21 % SRI LANKA 0.18 % GEORGIA 0.17 % GUATEMALA 0.17 % MOZAMBIQUE 0.17 % NAMIBIE 0.16 % ISRAEL 0.13 % BAHAMAS 0.12 % ARGENTINA 0.11 % DOMINICAN REPUBLIC 0.10 % LUXEMBURG 0.09 % MONGOLIA 0.06 % LIBANON 0.03 %
Total Portfolio 96.00 %
(Content)

DPAM L
Geographical allocation of the securities portfolio as at 31 December 2020
ets invested in investment funds, these distributions, for technical reasons, reflect the nature of the products and the legal domicile of the funds and not the actual exposures of the underlyings of the assets that have been selected.
122
DPAM L BONDS EUR CORPORATE HIGH YIELD % TOTAL NET ASSETS
FRANCE 24.51 % NETHERLANDS 23.15 % UNITED STATES OF AMERICA 9.76 % UNITED KINGDOM 8.36 % GERMANY 8.04 % LUXEMBURG 6.91 % JAPAN 3.88 % ITALY 3.79 % SWEDEN 2.96 % SPAIN 1.72 % IRELAND 1.51 % BELGIUM 0.95 % JERSEY 0.69 % DENMARK 0.56 % AUSTRIA 0.49 % FINLAND 0.25 % POLAND 0.24 % PORTUGAL 0.16 % NORWAY 0.12 %
Total Portfolio 98.05 %
(Content)
DPAM L GLOBAL TARGET INCOME % TOTAL NET ASSETS
LUXEMBURG 71.22 % BELGIUM 22.90 %
Total Portfolio 94.12 %
(Content)
(Content)

DPAM L
Geographical allocation of the securities portfolio as at 31 December 2020
ets invested in investment funds, these distributions, for technical reasons, reflect the nature of the products and the legal domicile of the funds and not the actual exposures of the underlyings of the assets that have been selected.
123
DPAM L BALANCED CONSERVATIVE SUSTAINABLE % TOTAL NET ASSETS
FRANCE 14.27 % NETHERLANDS 14.20 % UNITED STATES OF AMERICA 11.61 % GERMANY 9.05 % ITALY 7.37 % BELGIUM 7.03 % SPAIN 7.00 % IRELAND 4.89 % PORTUGAL 3.56 % UNITED KINGDOM 2.81 % AUSTRALIA 2.27 % NORWAY 1.82 % JAPAN 1.78 % LUXEMBURG 1.57 % SWITZERLAND 1.39 % SWEDEN 1.24 % CANADA 1.18 % DENMARK 0.91 % NEW ZEALAND 0.89 % SLOVENIA 0.51 %
Total Portfolio 95.35 %
(Content)
DPAM L BONDS CLIMATE TRENDS SUSTAINABLE % TOTAL NET ASSETS
NETHERLANDS 17.87 % FRANCE 15.12 % ITALY 10.63 % SPAIN 7.82 % GERMANY 6.93 % UNITED KINGDOM 5.67 % BELGIUM 5.36 % SWEDEN 4.45 % LUXEMBURG 3.03 % UNITED STATES OF AMERICA 2.89 % MOROCCO 2.82 % IRELAND 2.58 % FINLAND 2.56 % PORTUGAL 1.65 % GUERNSEY 0.97 % HUNGARY 0.96 % CHILE 0.86 % AUSTRIA 0.81 % BRAZIL 0.71 % SWITZERLAND 0.69 % DENMARK 0.67 % PERU 0.38 % JAPAN 0.33 % NORWAY 0.32 %
Total Portfolio 96.08 %
(Content)

DPAM L
Geographical allocation of the securities portfolio as at 31 December 2020
ets invested in investment funds, these distributions, for technical reasons, reflect the nature of the products and the legal domicile of the funds and not the actual exposures of the underlyings of the assets that have been selected.
124
DPAM L BONDS GOVERNMENT SUSTAINABLE % TOTAL NET ASSETS
GERMANY 12.85 % AUSTRALIA 9.55 % CANADA 9.55 % SLOVENIA 8.56 % NEW ZEALAND 8.09 % IRELAND 7.42 % SWEDEN 7.40 % UNITED KINGDOM 6.24 % DENMARK 5.82 % AUSTRIA 4.68 % JAPAN 4.12 % BELGIUM 3.85 % FINLAND 3.41 % SWITZERLAND 2.94 % NORWAY 2.38 % FRANCE 1.36 % NETHERLANDS 0.26 %
Total Portfolio 98.48 %
(Content)
DPAM L CONVERTIBLE WORLD SUSTAINABLE % TOTAL NET ASSETS
UNITED STATES OF AMERICA 37.15 % NETHERLANDS 11.76 % GERMANY 9.75 % FRANCE 8.66 % JAPAN 6.99 % CAYMAN ISLANDS 5.58 % BERMUDA 2.97 % SINGAPORE 1.75 % SWITZERLAND 1.56 % HONG-KONG 1.47 % SPAIN 1.45 % BRITISH VIRGIN ISLANDS 1.43 % ISRAEL 1.26 % AUSTRALIA 0.98 % SOUTH AFRICA 0.91 % NEW ZEALAND 0.62 % BELGIUM 0.54 %
Total Portfolio 94.83 %

DPAM L
Economic Allocation of the securities portfolio as at 31 December 2020
For assets invested in investment funds, these distributions, for technical reasons, reflect the nature of the products and the legal domicile of the funds and not the actual exposures of the underlyings of the assets that have been selected.
125
Economi c Allocation of the se curities portfolio a s at 31 Dece mber 2020
For assets invested in inve stme nt funds, these di stributions , for technical reasons, reflect the nat ure of the products and the legal domicile of the funds and not the actual exposures of the underlying s of the assets t hat have been selected.
DPAM L BONDS EUR QUALITY SUSTAINABLE % TOTAL NET ASSETS
BANKS 25.47 % FINANCIAL SERVICES - HOLDINGS 20.40 % TELECOMMUNICATIONS 8.17 % REAL ESTATE 5.67 % ENERGY SOURCES 5.54 % INSURANCE COMPANIES 4.13 % PHARMACOLOGY & PERSONAL CARE 3.94 % ELECTRIC & ELECTRONIC COMPONENTS 2.85 % ROAD VEHICLES 2.67 % TOBACCO & SPIRITS 2.49 % IT & INTERNET 2.45 % BUILDING MATERIALS 2.07 % ELECTRIC & ELECTRONIC COMPONENTS 1.51 % FOOD & CLEANING MATERIALS 1.32 % CHEMICAL PRODUCTS 1.18 % MECHANICAL CONSTRUCTION 1.03 % TEXTILE & GARMENTS 0.91 % OIL & DERIVED 0.88 % ASSET & MORTGAGE BACKED SECURITIES 0.83 % DISTRIBUTION 0.74 % OTHER SERVICES 0.71 % LEISURES & TOURISM 0.60 % INFORMATION, TECHNOLOGY & COPIERS 0.58 % AIR TRANSPORT 0.42 % MISCELLANEOUS CONSUMER GOODS 0.41 % TYRES & RUBBER 0.35 % UNIT TRUSTS, UCITS 0.29 % FOREST PRODUCTS & PAPER INDUSTRY 0.24 % PUBLISHING & BROADCASTING 0.21 % UTILITIES 0.11 %
Total Portfolio 98.17 %
DPAM L BONDS UNIVERSALIS UNCONSTRAINED % TOTAL NET ASSETS
STATE 62.58 % BANKS 9.59 % TELECOMMUNICATIONS 7.54 % FINANCIAL SERVICES - HOLDINGS 5.84 % EUROPEAN ORGANIZATIONS 3.40 % IT & INTERNET 2.23 % ROAD VEHICLES 2.01 % TOBACCO & SPIRITS 1.19 % ASSET & MORTGAGE BACKED SECURITIES 0.92 % FOOD & CLEANING MATERIALS 0.65 % OIL & DERIVED 0.39 % PUBLISHING & BROADCASTING 0.37 % CHEMICAL PRODUCTS 0.26 % TEXTILE & GARMENTS 0.17 % PHARMACOLOGY & PERSONAL CARE 0.11 % BUILDING MATERIALS 0.09 % DISTRIBUTION 0.05 %
Total Portfolio 97.39 %

DPAM L
Economic Allocation of the securities portfolio as at 31 December 2020
For assets invested in investment funds, these distributions, for technical reasons, reflect the nature of the products and the legal domicile of the funds and not the actual exposures of the underlyings of the assets that have been selected.
126
DPAM L BONDS HIGHER YIELD % TOTAL NET ASSETS
FINANCIAL SERVICES - HOLDINGS 26.26 % STATE 13.96 % BANKS 13.92 % TELECOMMUNICATIONS 8.78 % OTHER SERVICES 4.36 % ENERGY SOURCES 4.10 % CHEMICAL PRODUCTS 3.23 % ROAD VEHICLES 2.99 % BUILDING MATERIALS 2.51 % REAL ESTATE 2.32 % INSURANCE COMPANIES 1.93 % PHARMACOLOGY & PERSONAL CARE 1.61 % DISTRIBUTION 1.50 % HEALTH CARE & SERVICES 1.42 % INTERMEDIARY INDUSTRIAL PRODUCTIONS 1.34 % ELECTRIC & ELECTRONIC COMPONENTS 1.14 % PRECIOUS METALS & STONES 0.90 % AGRICULTURE & FISHING 0.88 % MECHANICAL CONSTRUCTION 0.85 % PACKAGING INDUSTRY 0.64 % BIOTECHNOLOGY 0.50 % FOOD & CLEANING MATERIALS 0.49 % IT & INTERNET 0.39 % TEXTILE & GARMENTS 0.33 % MISCELLANEOUS 0.26 % LEISURES & TOURISM 0.25 %
Total Portfolio 96.86 %
DPAM L BONDS GOVERNMENT SUSTAINABLE HEDGED % TOTAL NET ASSETS
STATE 91.42 % BANKS 4.94 % FINANCIAL SERVICES - HOLDINGS 0.59 %
Total Portfolio 96.95 %
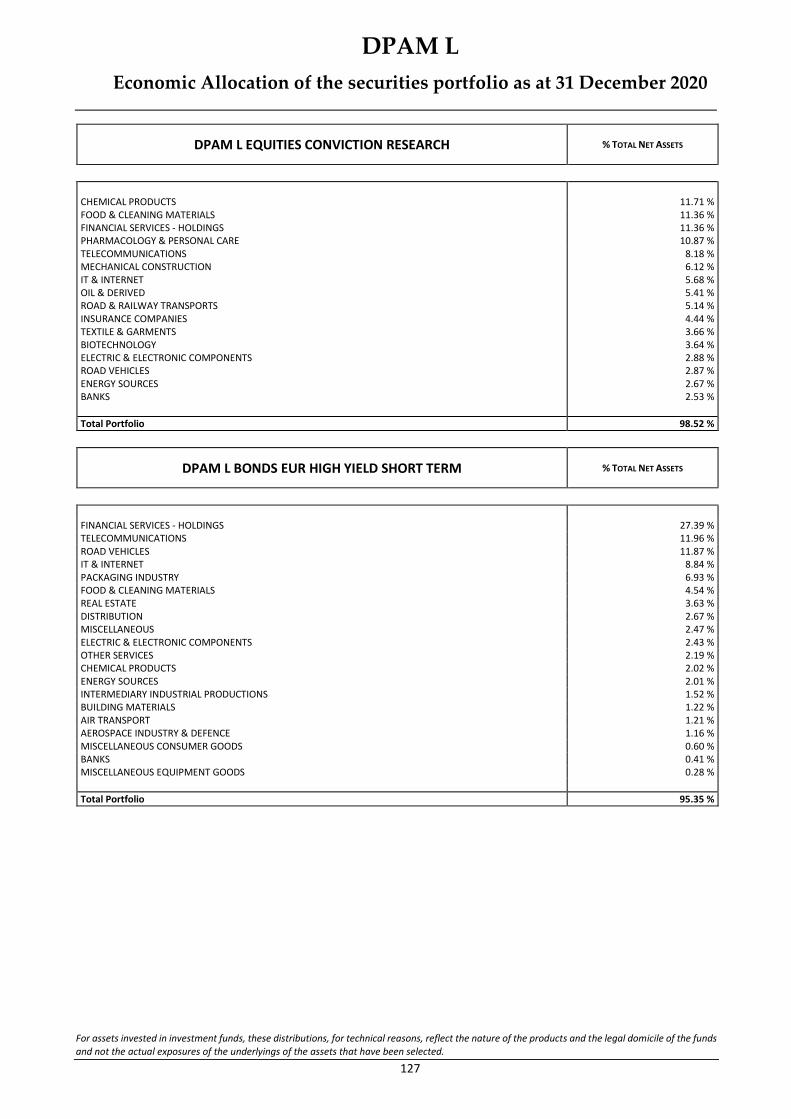
DPAM L
Economic Allocation of the securities portfolio as at 31 December 2020
For assets invested in investment funds, these distributions, for technical reasons, reflect the nature of the products and the legal domicile of the funds and not the actual exposures of the underlyings of the assets that have been selected.
127
DPAM L EQUITIES CONVICTION RESEARCH % TOTAL NET ASSETS
CHEMICAL PRODUCTS 11.71 % FOOD & CLEANING MATERIALS 11.36 % FINANCIAL SERVICES - HOLDINGS 11.36 % PHARMACOLOGY & PERSONAL CARE 10.87 % TELECOMMUNICATIONS 8.18 % MECHANICAL CONSTRUCTION 6.12 % IT & INTERNET 5.68 % OIL & DERIVED 5.41 % ROAD & RAILWAY TRANSPORTS 5.14 % INSURANCE COMPANIES 4.44 % TEXTILE & GARMENTS 3.66 % BIOTECHNOLOGY 3.64 % ELECTRIC & ELECTRONIC COMPONENTS 2.88 % ROAD VEHICLES 2.87 % ENERGY SOURCES 2.67 % BANKS 2.53 %
Total Portfolio 98.52 %
DPAM L BONDS EUR HIGH YIELD SHORT TERM % TOTAL NET ASSETS
FINANCIAL SERVICES - HOLDINGS 27.39 % TELECOMMUNICATIONS 11.96 % ROAD VEHICLES 11.87 % IT & INTERNET 8.84 % PACKAGING INDUSTRY 6.93 % FOOD & CLEANING MATERIALS 4.54 % REAL ESTATE 3.63 % DISTRIBUTION 2.67 % MISCELLANEOUS 2.47 % ELECTRIC & ELECTRONIC COMPONENTS 2.43 % OTHER SERVICES 2.19 % CHEMICAL PRODUCTS 2.02 % ENERGY SOURCES 2.01 % INTERMEDIARY INDUSTRIAL PRODUCTIONS 1.52 % BUILDING MATERIALS 1.22 % AIR TRANSPORT 1.21 % AEROSPACE INDUSTRY & DEFENCE 1.16 % MISCELLANEOUS CONSUMER GOODS 0.60 % BANKS 0.41 % MISCELLANEOUS EQUIPMENT GOODS 0.28 %
Total Portfolio 95.35 %

DPAM L
Economic Allocation of the securities portfolio as at 31 December 2020
For assets invested in investment funds, these distributions, for technical reasons, reflect the nature of the products and the legal domicile of the funds and not the actual exposures of the underlyings of the assets that have been selected.
128
DPAM L PATRIMONIAL FUND % TOTAL NET ASSETS
STATE 29.48 % BANKS 14.22 % FINANCIAL SERVICES - HOLDINGS 11.29 % UNIT TRUSTS, UCITS 5.20 % MISCELLANEOUS CONSUMER GOODS 4.51 % TELECOMMUNICATIONS 4.06 % PHARMACOLOGY & PERSONAL CARE 2.95 % ELECTRIC & ELECTRONIC COMPONENTS 2.20 % ENERGY SOURCES 2.19 % IT & INTERNET 1.88 % INSURANCE COMPANIES 1.77 % OIL & DERIVED 1.66 % REAL ESTATE 1.45 % EUROPEAN ORGANIZATIONS 1.40 % MECHANICAL CONSTRUCTION 1.31 % ROAD VEHICLES 1.13 % FOOD & CLEANING MATERIALS 1.08 % ROAD & RAILWAY TRANSPORTS 1.04 % INFORMATION, TECHNOLOGY & COPIERS 1.03 % DISTRIBUTION 0.97 % PHOTOGRAPHY & OPTICAL 0.85 % ASSET & MORTGAGE BACKED SECURITIES 0.69 % PUBLISHING & BROADCASTING 0.60 % TYRES & RUBBER 0.52 % ELECTRIC & ELECTRONIC COMPONENTS 0.50 % NONFERROUS METALS 0.50 % INTERMEDIARY INDUSTRIAL PRODUCTIONS 0.49 % CHEMICAL PRODUCTS 0.47 % DIVERSIFIED COMPANIES 0.46 % TOBACCO & SPIRITS 0.33 %
Total Portfolio 96.23 %
DPAM L BONDS EMERGING MARKETS SUSTAINABLE % TOTAL NET ASSETS
STATE 91.16 % EUROPEAN ORGANIZATIONS 3.41 % BANKS 1.37 % FINANCIAL SERVICES - HOLDINGS 0.06 %
Total Portfolio 96.00 %

DPAM L
Economic Allocation of the securities portfolio as at 31 December 2020
For assets invested in investment funds, these distributions, for technical reasons, reflect the nature of the products and the legal domicile of the funds and not the actual exposures of the underlyings of the assets that have been selected.
129
DPAM L BONDS EUR CORPORATE HIGH YIELD % TOTAL NET ASSETS
FINANCIAL SERVICES - HOLDINGS 31.48 % TELECOMMUNICATIONS 11.15 % ROAD VEHICLES 10.40 % IT & INTERNET 7.32 % CHEMICAL PRODUCTS 4.97 % PHARMACOLOGY & PERSONAL CARE 4.10 % OTHER SERVICES 3.72 % DISTRIBUTION 3.31 % BUILDING MATERIALS 3.10 % HEALTH CARE & SERVICES 2.99 % ELECTRIC & ELECTRONIC COMPONENTS 2.26 % PACKAGING INDUSTRY 1.83 % MISCELLANEOUS 1.50 % FOOD & CLEANING MATERIALS 1.36 % ENERGY SOURCES 1.34 % MISCELLANEOUS CONSUMER GOODS 1.17 % LEISURES & TOURISM 1.02 % AEROSPACE INDUSTRY & DEFENCE 0.86 % AIR TRANSPORT 0.81 % BANKS 0.79 % INTERMEDIARY INDUSTRIAL PRODUCTIONS 0.63 % DIVERSIFIED COMPANIES 0.51 % MECHANICAL CONSTRUCTION 0.37 % BIOTECHNOLOGY 0.37 % AGRICULTURE & FISHING 0.36 % TEXTILE & GARMENTS 0.17 % FOREST PRODUCTS & PAPER INDUSTRY 0.16 %
Total Portfolio 98.05 %
DPAM L GLOBAL TARGET INCOME % TOTAL NET ASSETS
UNIT TRUSTS, UCITS 87.57 % REAL ESTATE 6.55 %
Total Portfolio 94.12 %

DPAM L
Economic Allocation of the securities portfolio as at 31 December 2020
For assets invested in investment funds, these distributions, for technical reasons, reflect the nature of the products and the legal domicile of the funds and not the actual exposures of the underlyings of the assets that have been selected.
130
DPAM L BALANCED CONSERVATIVE SUSTAINABLE % TOTAL NET ASSETS
STATE 27.52 % BANKS 9.56 % FINANCIAL SERVICES - HOLDINGS 9.35 % PHARMACOLOGY & PERSONAL CARE 5.45 % IT & INTERNET 5.32 % ENERGY SOURCES 3.80 % ELECTRIC & ELECTRONIC COMPONENTS 3.72 % ELECTRIC & ELECTRONIC COMPONENTS 3.53 % MECHANICAL CONSTRUCTION 3.48 % CHEMICAL PRODUCTS 3.04 % TELECOMMUNICATIONS 2.81 % INSURANCE COMPANIES 2.70 % TOBACCO & SPIRITS 1.58 % FOOD & CLEANING MATERIALS 1.38 % REAL ESTATE 1.33 % TEXTILE & GARMENTS 1.15 % PUBLISHING & BROADCASTING 1.06 % ROAD VEHICLES 1.04 % BIOTECHNOLOGY 0.76 % OTHER SERVICES 0.75 % DISTRIBUTION 0.72 % CONSUMER GOODS 0.63 % INFORMATION, TECHNOLOGY & COPIERS 0.60 % PROVINCE 0.55 % BUILDING MATERIALS 0.50 % INTERMEDIARY INDUSTRIAL PRODUCTIONS 0.42 % MISCELLANEOUS CONSUMER GOODS 0.36 % TYRES & RUBBER 0.35 % PACKAGING INDUSTRY 0.34 % ROAD & RAILWAY TRANSPORTS 0.34 % PHOTOGRAPHY & OPTICAL 0.33 % LEISURES & TOURISM 0.32 % NONFERROUS METALS 0.30 % UNIT TRUSTS, UCITS 0.26 %
Total Portfolio 95.35 %

DPAM L
Economic Allocation of the securities portfolio as at 31 December 2020
For assets invested in investment funds, these distributions, for technical reasons, reflect the nature of the products and the legal domicile of the funds and not the actual exposures of the underlyings of the assets that have been selected.
131
DPAM L BONDS CLIMATE TRENDS SUSTAINABLE % TOTAL NET ASSETS
BANKS 17.68 % FINANCIAL SERVICES - HOLDINGS 14.33 % ENERGY SOURCES 13.88 % STATE 9.64 % ELECTRIC & ELECTRONIC COMPONENTS 4.53 % INSURANCE COMPANIES 4.45 % CHEMICAL PRODUCTS 4.19 % REAL ESTATE 4.12 % ROAD VEHICLES 4.06 % TELECOMMUNICATIONS 3.41 % OTHER SERVICES 1.95 % OIL & DERIVED 1.61 % FOOD & CLEANING MATERIALS 1.34 % BUILDING MATERIALS 1.28 % TEXTILE & GARMENTS 1.25 % ASSET & MORTGAGE BACKED SECURITIES 1.24 % EUROPEAN ORGANIZATIONS 1.13 % NONFERROUS METALS 1.12 % UNIT TRUSTS, UCITS 0.97 % PACKAGING INDUSTRY 0.95 % FOREST PRODUCTS & PAPER INDUSTRY 0.80 % PROVINCE 0.72 % MISCELLANEOUS CONSUMER GOODS 0.51 % ELECTRIC & ELECTRONIC COMPONENTS 0.51 % COMMERCIAL SERVICES - PUBLIC 0.41 %
Total Portfolio 96.08 %
DPAM L BONDS GOVERNMENT SUSTAINABLE % TOTAL NET ASSETS
STATE 92.14 % BANKS 5.87 % FINANCIAL SERVICES - HOLDINGS 0.47 %
Total Portfolio 98.48 %

DPAM L
Economic Allocation of the securities portfolio as at 31 December 2020
For assets invested in investment funds, these distributions, for technical reasons, reflect the nature of the products and the legal domicile of the funds and not the actual exposures of the underlyings of the assets that have been selected.
132
DPAM L CONVERTIBLE WORLD SUSTAINABLE % TOTAL NET ASSETS
IT & INTERNET 21.87 % FINANCIAL SERVICES - HOLDINGS 15.91 % ROAD VEHICLES 11.32 % ELECTRIC & ELECTRONIC COMPONENTS 6.68 % PHARMACOLOGY & PERSONAL CARE 5.36 % CHEMICAL PRODUCTS 4.12 % HEALTH CARE & SERVICES 3.95 % BIOTECHNOLOGY 3.34 % LEISURES & TOURISM 3.15 % ENERGY SOURCES 2.99 % TEXTILE & GARMENTS 2.65 % DISTRIBUTION 2.49 % ELECTRIC & ELECTRONIC COMPONENTS 2.06 % OTHER SERVICES 1.95 % REAL ESTATE 1.55 % OIL & DERIVED 1.50 % MISCELLANEOUS 0.91 % INTERMEDIARY INDUSTRIAL PRODUCTIONS 0.78 % PRECIOUS METALS & STONES 0.72 % PUBLISHING & BROADCASTING 0.70 % FOOD & CLEANING MATERIALS 0.51 % TELECOMMUNICATIONS 0.32 %
Total Portfolio 94.83 %

DPAM L
Allocation by Currency of the securities portfolio as at 31 December 2020
For assets invested in investment funds, these distributions, for technical reasons, reflect the nature of the products and the legal domicile of the funds and not the actual exposures of the underlyings of the assets that have been selected.
133
Allocation by Currency of the securities portfolio as at 31 De ce mber 20 20
For assets invested in inve stme nt funds, these di stributions , for technical reasons, reflect the nat ure of the products and the legal domicile of the funds and not the actual exposures of the underlying s of the assets t hat have been selected.
DPAM L BONDS EUR QUALITY SUSTAINABLE % TOTAL NET ASSETS
EURO 98.17 %
Total Portfolio 98.17 %
DPAM L BONDS UNIVERSALIS UNCONSTRAINED % TOTAL NET ASSETS
EURO 48.31 % U.S. DOLLAR 25.16 % AUSTRALIAN DOLLAR 4.68 % NEW ZEALAND DOLLAR 3.45 % JAPANESE YEN 2.95 % SOUTH AFRICAN RAND 2.42 % NEW MEXICAN PESO 2.01 % BRITISH POUND 1.96 % SWEDISH KRONA 1.88 % CZECH KORUNA 1.70 % CANADIAN DOLLAR 1.46 % SWISS FRANC 1.41 %
Total Portfolio 97.39 %
DPAM L BONDS HIGHER YIELD % TOTAL NET ASSETS
EURO 73.04 % U.S. DOLLAR 13.08 % NEW MEXICAN PESO 3.80 % INDONESIAN RUPIAH 3.27 % SOUTH AFRICAN RAND 2.73 % BRAZILIAN REAL 0.94 %
Total Portfolio 96.86 %
DPAM L BONDS GOVERNMENT SUSTAINABLE HEDGED % TOTAL NET ASSETS
EURO 42.38 % CANADIAN DOLLAR 9.92 % AUSTRALIAN DOLLAR 9.30 % BRITISH POUND 8.94 % NEW ZEALAND DOLLAR 7.80 % DANISH KRONE 6.03 % SWEDISH KRONA 4.42 % NORWEGIAN KRONE 3.03 % JAPANESE YEN 2.94 % SWISS FRANC 2.19 %
Total Portfolio 96.95 %

DPAM L
Allocation by Currency of the securities portfolio as at 31 December 2020
For assets invested in investment funds, these distributions, for technical reasons, reflect the nature of the products and the legal domicile of the funds and not the actual exposures of the underlyings of the assets that have been selected.
134
DPAM L EQUITIES CONVICTION RESEARCH % TOTAL NET ASSETS
EURO 58.95 % BRITISH POUND 13.64 % SWISS FRANC 11.66 % NORWEGIAN KRONE 6.32 % SWEDISH KRONA 5.24 % DANISH KRONE 2.71 %
Total Portfolio 98.52 %
DPAM L BONDS EUR HIGH YIELD SHORT TERM % TOTAL NET ASSETS
EURO 95.35 %
Total Portfolio 95.35 %
DPAM L PATRIMONIAL FUND % TOTAL NET ASSETS
EURO 62.07 % U.S. DOLLAR 18.47 % JAPANESE YEN 2.94 % SWEDISH KRONA 2.75 % CANADIAN DOLLAR 1.99 % AUSTRALIAN DOLLAR 1.80 % BRITISH POUND 1.52 % NORWEGIAN KRONE 0.89 % HONG KONG DOLLAR 0.88 % SWISS FRANC 0.79 % NEW MEXICAN PESO 0.59 % INDONESIAN RUPIAH 0.53 % NEW ZEALAND DOLLAR 0.35 % SINGAPORE DOLLAR 0.35 % PERUVIAN SOL 0.31 %
Total Portfolio 96.23 %

DPAM L
Allocation by Currency of the securities portfolio as at 31 December 2020
For assets invested in investment funds, these distributions, for technical reasons, reflect the nature of the products and the legal domicile of the funds and not the actual exposures of the underlyings of the assets that have been selected.
135
DPAM L BONDS EMERGING MARKETS SUSTAINABLE % TOTAL NET ASSETS
INDONESIAN RUPIAH 10.52 % NEW MEXICAN PESO 9.90 % SOUTH AFRICAN RAND 9.34 % MALAYSIAN RINGGIT 7.50 % U.S. DOLLAR 7.06 % EURO 5.63 % COLOMBIAN PESO 4.82 % SINGAPORE DOLLAR 4.22 % PERUVIAN SOL 4.16 % BRAZILIAN REAL 4.04 % CZECH KORUNA 3.67 % HUNGARIAN FORINT 3.65 % INDIAN RUPEE 3.31 % SERBIAN DINAR 2.95 % CHILEAN PESO 2.61 % ROMANIAN LEU 2.60 % SOUTH KOREAN WON 1.95 % PHILIPPINE PESO 1.92 % THAI BAHT 1.68 % POLISH ZLOTY 1.47 % URUGUAYAN PESO 1.44 % GHANAIAN CEDI 0.89 % KENYAN SHILLING 0.67 %
Total Portfolio 96.00 %
DPAM L BONDS EUR CORPORATE HIGH YIELD % TOTAL NET ASSETS
EURO 98.05 %
Total Portfolio 98.05 %
DPAM L GLOBAL TARGET INCOME % TOTAL NET ASSETS
EURO 94.12 %
Total Portfolio 94.12 %

DPAM L
Allocation by Currency of the securities portfolio as at 31 December 2020
For assets invested in investment funds, these distributions, for technical reasons, reflect the nature of the products and the legal domicile of the funds and not the actual exposures of the underlyings of the assets that have been selected.
136
DPAM L BALANCED CONSERVATIVE SUSTAINABLE % TOTAL NET ASSETS
EURO 73.83 % U.S. DOLLAR 9.28 % BRITISH POUND 2.81 % AUSTRALIAN DOLLAR 1.74 % SWISS FRANC 1.39 % NORWEGIAN KRONE 1.27 % CANADIAN DOLLAR 1.18 % JAPANESE YEN 1.17 % DANISH KRONE 0.91 % NEW ZEALAND DOLLAR 0.89 % SWEDISH KRONA 0.88 %
Total Portfolio 95.35 %
DPAM L BONDS CLIMATE TRENDS SUSTAINABLE % TOTAL NET ASSETS
EURO 86.82 % U.S. DOLLAR 5.02 % BRITISH POUND 1.55 % SWEDISH KRONA 1.00 % NORWEGIAN KRONE 0.90 % CHILEAN PESO 0.41 % PERUVIAN SOL 0.38 %
Total Portfolio 96.08 %
DPAM L BONDS GOVERNMENT SUSTAINABLE % TOTAL NET ASSETS
EURO 42.86 % AUSTRALIAN DOLLAR 9.55 % CANADIAN DOLLAR 9.08 % NEW ZEALAND DOLLAR 8.09 % SWEDISH KRONA 7.40 % BRITISH POUND 6.24 % DANISH KRONE 5.82 % JAPANESE YEN 4.12 % SWISS FRANC 2.94 % NORWEGIAN KRONE 2.38 %
Total Portfolio 98.48 %

DPAM L
Allocation by Currency of the securities portfolio as at 31 December 2020
For assets invested in investment funds, these distributions, for technical reasons, reflect the nature of the products and the legal domicile of the funds and not the actual exposures of the underlyings of the assets that have been selected.
137
DPAM L CONVERTIBLE WORLD SUSTAINABLE % TOTAL NET ASSETS
U.S. DOLLAR 53.24 % EURO 23.68 % JAPANESE YEN 6.99 % HONG KONG DOLLAR 5.00 % SINGAPORE DOLLAR 1.75 % SWISS FRANC 1.56 % AUSTRALIAN DOLLAR 0.98 % SOUTH AFRICAN RAND 0.91 % CANADIAN DOLLAR 0.72 %
Total Portfolio 94.83 %

DPAM L
Changes occuring in the number of shares
138
Change s occuring i n the number of shares
DPAM L LIQUIDITY EUR &FRN*
Shares outstanding at the beginning of the exercise - A 36.015,888 - B 5.365,857 - F 42.430,649 - M 11.882,206 - N 769,991
Shares issued during the exercise - A 0,000 0,000 - B 0,000 0,000 - F 0,000 3.835,000 - M 0,000 4.773,000 - N 0,000 0,000
Shares redeemed during the exercise - A 36.015,888 39.757,634 - B 5.365,857 12.766,867 - F 42.430,649 248.547,333 - M 11.882,206 15.932,206 - N 769,991 1.449,964
Shares outstanding at the end of the exercise - A 0,000 - B 0,000 - F 0,000 - M 0,000 - N 0,000
*Cfr note 14

DPAM L
Changes occuring in the number of shares
139
DPAM L BONDS EUR QUALITY SUSTAINABLE
Shares outstanding at the beginning of the exercise - A 153.580,271 - B 50.194,884 - E 10.983,693 - F 434.604,339 - J 14.155,881 - L 0,000 - M 488.592,691 - N 3.265,523 - P 500.810,000 - W 6.365,583
Shares issued during the exercise - A 56.996,620 - B 21.463,569 - E 11.070,000 - F 376.119,184 - J 7.175,000 - L 3.020,000 - M 171.339,440 - N 1.740,827 - P 60.550,000 - W 5.146,423
Shares redeemed during the exercise - A 35.536,297 - B 15.384,793 - E 2.000,000 - F 133.134,266 - J 1.238,000 - L 1.107,000 - M 51.519,554 - N 833,615 - P 80.661,000 - W 4.601,125
Shares outstanding at the end of the exercise - A 175.040,594 - B 56.273,660 - E 20.053,693 - F 677.589,257 - J 20.092,881 - L 1.913,000 - M 608.412,577 - N 4.172,735 - P 480.699,000 - W 6.910,881

DPAM L
Changes occuring in the number of shares
140
DPAM L BONDS UNIVERSALIS UNCONSTRAINED
Shares outstanding at the beginning of the exercise - A 394.574,174 - B 383.675,964 - B CHF 328,000 - E 292.002,406 - F 1.895.720,751 - J 6.594,702 - M 613.052,741 - N 31.578,308 - P 693.610,000 - V 1.208,632 - W 117.100,224
Shares issued during the exercise - A 34.276,487 - B 199.190,476 - B CHF 0,000 - E 5.921,699 - F 1.655.510,295 - J 1.211,000 - M 176.810,864 - N 4.860,000 - P 20.930,000 - V 2.535,992 - W 163.104,813
Shares redeemed during the exercise - A 35.762,900 - B 118.129,847 - B CHF 0,000 - E 126.110,952 - F 643.314,426 - J 40,000 - M 46.971,279 - N 1.696,385 - P 30.650,000 - V 846,992 - W 63.679,604
Shares outstanding at the end of the exercise - A 393.087,761 - B 464.736,593 - B CHF 328,000 - E 171.813,153 - F 2.907.916,620 - J 7.765,702 - M 742.892,326 - N 34.741,923 - P 683.890,000 - V 2.897,632 - W 216.525,433

DPAM L
Changes occuring in the number of shares
141
DPAM L BONDS HIGHER YIELD
Shares outstanding at the beginning of the exercise - A 980.576,507 - B 127.659,524 - B CHF 123,392 - E 189.890,858 - F 24.262,776 - M 160.180,842 - N 4.893,381 - P 36.486,000 - V 8.627,772 - W 3.330,452
Shares issued during the exercise - A 132.333,464 - B 35.563,127 - B CHF 120,375 - E 0,000 - F 87.829,272 - M 6.609,917 - N 369,000 - P 79.789,000 - V 722,647 - W 709,983
Shares redeemed during the exercise - A 101.430,308 - B 43.059,981 - B CHF 55,868 - E 0,000 - F 13.762,373 - M 21.423,227 - N 814,892 - P 82.823,000 - V 4.693,417 - W 244,354
Shares outstanding at the end of the exercise - A 1.011.479,663 - B 120.162,670 - B CHF 187,899 - E 189.890,858 - F 98.329,675 - M 145.367,532 - N 4.447,489 - P 33.452,000 - V 4.657,002 - W 3.796,081

DPAM L
Changes occuring in the number of shares
142
DPAM L BONDS GOVERNMENT SUSTAINABLE HEDGED
Shares outstanding at the beginning of the exercise - A 2.807,837 - B 23.188,122 - E 6.659,713 - F 210.850,617 - J 4.926,841 - L 641,634 - M 5.134,775 - N 110,000 - P 10.021,000 - V 656,951 - W 11.034,319
Shares issued during the exercise - A 8.840,031 - B 16.021,124 - E 11.862,995 - F 182.898,340 - J 3.388,000 - L 1.518,539 - M 15.211,204 - N 105,000 - P 18.173,000 - V 1.925,169 - W 19.991,203
Shares redeemed during the exercise - A 3.664,122 - B 13.835,683 - E 9.380,713 - F 118.732,429 - J 1.962,000 - L 768,534 - M 1.116,394 - N 45,000 - P 14.145,000 - V 488,564 - W 6.576,226
Shares outstanding at the end of the exercise - A 7.983,746 - B 25.373,563 - E 9.141,995 - F 275.016,528 - J 6.352,841 - L 1.391,639 - M 19.229,585 - N 170,000 - P 14.049,000 - V 2.093,556 - W 24.449,296

DPAM L
Changes occuring in the number of shares
143
DPAM L EQUITIES CONVICTION RESEARCH
Shares outstanding at the beginning of the exercise - A 3,619.590 - B 15,870.395 - F 13,807.887 - J 5,090.659 - M 20,369.620 - N 5,171.705 - P 2,629.000
Shares issued during the exercise - A 434.727 - B 1,605.572 - F 28,350.000 - J 2,248.000 - M 5,960.401 - N 722.800 - P 92.000
Shares redeemed during the exercise - A 1,632.447 - B 2,477.942 - F 16,000.000 - J 264.000 - M 3,829.450 - N 2,117.863 - P 13.000
Shares outstanding at the end of the exercise - A 2,421.870 - B 14,998.025 - F 26,157.887 - J 7,074.659 - M 22,500.571 - N 3,776.642 - P 2,708.000

DPAM L
Changes occuring in the number of shares
144
DPAM L BONDS EUR HIGH YIELD SHORT TERM
Shares outstanding at the beginning of the exercise - A 216,508.330 - B 287,362.455 - E 186,623.563 - F 2,037,637.520 - F CHF 2,300.000 - J 2,421.153 - L 19,439.771 - M 143,975.996 - N 104,395.209 - P 197,397.000 - V 1,416.557 - W 167,760.683
Shares issued during the exercise - A 17,294.314 - B 24,053.547 - E 23,387.000 - F 823,418.608 - F CHF 0.000 - J 185.000 - L 487.220 - M 5,498.846 - N 34,406.634 - P 32,732.000 - V 0.000 - W 53,421.334
Shares redeemed during the exercise - A 43,716.458 - B 137,278.625 - E 45,959.654 - F 1,705,487.796 - F CHF 700.000 - J 81.000 - L 15,843.588 - M 30,773.903 - N 45,260.054 - P 115,241.000 - V 579.170 - W 136,928.125
Shares outstanding at the end of the exercise - A 190,086.186 - B 174,137.377 - E 164,050.909 - F 1,155,568.332 - F CHF 1,600.000 - J 2,525.153 - L 4,083.403 - M 118,700.939 - N 93,541.789 - P 114,888.000 - V 837.387 - W 84,253.892
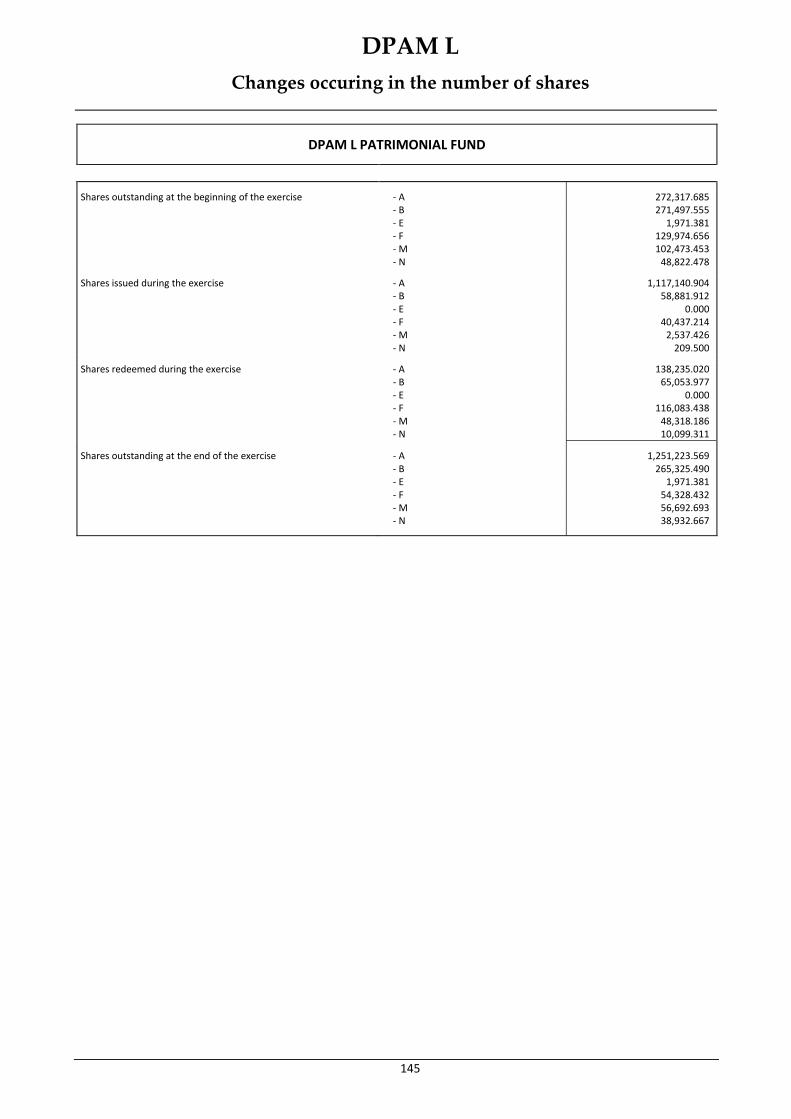
DPAM L
Changes occuring in the number of shares
145
DPAM L PATRIMONIAL FUND
Shares outstanding at the beginning of the exercise - A 272,317.685 - B 271,497.555 - E 1,971.381 - F 129,974.656 - M 102,473.453 - N 48,822.478
Shares issued during the exercise - A 1,117,140.904 - B 58,881.912 - E 0.000 - F 40,437.214 - M 2,537.426 - N 209.500
Shares redeemed during the exercise - A 138,235.020 - B 65,053.977 - E 0.000 - F 116,083.438 - M 48,318.186 - N 10,099.311
Shares outstanding at the end of the exercise - A 1,251,223.569 - B 265,325.490 - E 1,971.381 - F 54,328.432 - M 56,692.693 - N 38,932.667

DPAM L
Changes occuring in the number of shares
146
DPAM L BONDS EMERGING MARKETS SUSTAINABLE
Shares outstanding at the beginning of the exercise - A 669.594,387 - B 1.071.096,164 - B CHF 1.371,268 - B EUR HEDGED 27.509,276 - B USD 184.421,901 - E 2.084.820,366 - F 6.104.651,980 - F CHF 35.410,469 - F USD 101.040,162 - J 9.056,809 - L 23.678,337 - M 355.179,584 - N 23.056,684 - N USD 115.891,750 - P 625.204,000 - V 108.026,000 - V EUR HEDGED 9.200,000 - W 1.540.340,996 - W CHF 11.416,000 - W EUR HEDGED 52.422,901 - W USD 1.652,070
Shares issued during the exercise - A 347.469,232 - B 898.301,498 - B CHF 845,000 - B EUR HEDGED 672,835 - B USD 27.879,562 - E 964.337,127 - F 5.020.796,079 - F CHF 77.085,078 - F USD 2.464.003,194 - J 1.750,000 - L 31.021,616 - M 68.469,218 - N 9.749,000 - N USD 84.932,502 - P 316.608,000 - V 45.630,000 - V EUR HEDGED 1.519,795 - W 1.000.874,941 - W CHF 2.875,000 - W EUR HEDGED 1.965,838 - W USD 502.040,716
Shares redeemed during the exercise - A 149.687,276 - B 512.202,364 - B CHF 685,000 - B EUR HEDGED 28.182,111 - B USD 64.108,850 - E 444.835,861 - F 2.585.643,832 - F CHF 16.475,563 - F USD 244.345,188 - J 1.932,000 - L 32.482,428 - M 49.430,882 - N 2.254,077 - N USD 31.635,000 - P 449.299,000 - V 4.341,000 - V EUR HEDGED 10.719,795 - W 724.410,245 - W CHF 6.926,000 - W EUR HEDGED 54.388,739 - W USD 18.233,660

DPAM L
Changes occuring in the number of shares
147
Shares outstanding at the end of the exercise - A 867.376,343 - B 1.457.195,298 - B CHF 1.531,268 - B EUR HEDGED 0,000 - B USD 148.192,613 - E 2.604.321,632 - F 8.539.804,227 - F CHF 96.019,984 - F USD 2.320.698,168 - J 8.874,809 - L 22.217,525 - M 374.217,920 - N 30.551,607 - N USD 169.189,252 - P 492.513,000 - V 149.315,000 - V EUR HEDGED 0,000 - W 1.816.805,692 - W CHF 7.365,000 - W EUR HEDGED 0,000 - W USD 485.459,126

DPAM L
Changes occuring in the number of shares
148
DPAM L BONDS EUR CORPORATE HIGH YIELD
Shares outstanding at the beginning of the exercise - A 130,316.513 - B 170,439.712 - E 57,943.841 - F 849,273.726 - J 3,771.000 - L 1,254.141 - M 154,156.261 - N 50.000 - P 68,014.767 - V 204,425.000 - W 6,206.195
Shares issued during the exercise - A 27,842.033 - B 75,678.505 - E 7,939.000 - F 1,374,918.414 - J 348.000 - L 55.000 - M 34,202.318 - N 70.000 - P 202,258.000 - V 126,934.000 - W 44,742.268
Shares redeemed during the exercise - A 32,075.689 - B 103,373.048 - E 9,150.000 - F 756,813.736 - J 702.000 - L 1,104.000 - M 32,192.719 - N 0.000 - P 182,006.000 - V 26,738.000 - W 10,009.150
Shares outstanding at the end of the exercise - A 126,082.857 - B 142,745.169 - E 56,732.841 - F 1,467,378.404 - J 3,417.000 - L 205.141 - M 156,165.860 - N 120.000 - P 88,266.767 - V 304,621.000 - W 40,939.313

DPAM L
Changes occuring in the number of shares
149
DPAM L GLOBAL TARGET INCOME
Shares outstanding at the beginning of the exercise - A 193,642.633 - B 66,520.566 - E 12,500.000 - F 434,772.626 - M 15,495.101
Shares issued during the exercise - A 161,231.522 - B 34,783.615 - E 0.000 - F 27,971.627 - M 0.000
Shares redeemed during the exercise - A 110,380.628 - B 61,964.764 - E 2,500.000 - F 130,168.827 - M 0.000
Shares outstanding at the end of the exercise - A 244,493.527 - B 39,339.417 - E 10,000.000 - F 332,575.426 - M 15,495.101
DPAM L BONDS EUR GOVERNMENT 1-5*
Shares outstanding at the beginning of the exercise - A 32.956,000 - B 11.735,000 - F 10.348,056 - M 26.937,006 - N 3.825,364 - P 0,000
Shares issued during the exercise - A 0,000 - B 0,000 - F 32.180,000 - M 1.541,000 - N 0,000 - P 0,000
Shares redeemed during the exercise - A 32.956,000 44.768,000 - B 11.735,000 99.068,000 - F 42.528,056 200.526,505 - M 28.478,006 34.054,989 - N 3.825,364 3.825,364 - P 0,000 52.000,000
Shares outstanding at the end of the exercise - A 0,000 - B 0,000 - F 0,000 - M 0,000 - N 0,000 - P 0,000
*Cfr note 14

DPAM L
Changes occuring in the number of shares
150
DPAM L BALANCED CONSERVATIVE SUSTAINABLE
Shares outstanding at the beginning of the exercise - A 71,083.675 - B 294,500.131 - F 39.600 - V 2,823.354 - W 1,408.649
Shares issued during the exercise - A 252.429 - B 58,554.286 - F 333.993 - V 10,403.209 - W 0.000
Shares redeemed during the exercise - A 4,866.000 - B 107,391.434 - F 32.750 - V 552.194 - W 0.000
Shares outstanding at the end of the exercise - A 66,470.104 - B 245,662.983 - F 340.843 - V 12,674.369 - W 1,408.649
DPAM L BONDS CLIMATE TRENDS SUSTAINABLE
Shares outstanding at the beginning of the exercise - A 3.000,000 - B 1.500,000 - F 31.500,000 - J 713,000 - M 26.415,000 - P 1.060,000 - W 0,000
Shares issued during the exercise - A 0,000 - B 3.008,456 - F 13.100,241 - J 3.648,000 - M 26.659,000 - P 0,000 - W 113.579,657
Shares redeemed during the exercise - A 0,000 - B 135,198 - F 5.760,726 - J 0,000 - M 1.400,000 - P 60,000 - W 6.378,482
Shares outstanding at the end of the exercise - A 3.000,000 - B 4.373,258 - F 38.839,515 - J 4.361,000 - M 51.674,000 - P 1.000,000 - W 107.201,175

DPAM L
Changes occuring in the number of shares
151
DPAM L BONDS GOVERNMENT SUSTAINABLE*
Shares outstanding at the beginning of the exercise - B 0,000 - F 0,000 - J 0,000 - M 0,000 - P 0,000
Shares issued during the exercise - B 950,000 - F 249.767,805 - J 3.135,000 - M 3.440,000 - P 52,000
Shares redeemed during the exercise - B 0,000 - F 163.025,000 - J 42,000 - M 1.125,000 - P 52,000
Shares outstanding at the end of the exercise - B 950,000 - F 86.742,805 - J 3.093,000 - M 2.315,000 - P 0,000
*Cfr note 14
DPAM L CONVERTIBLE WORLD SUSTAINABLE*
Shares outstanding at the beginning of the exercise - B 0,000 - F 0,000 - P 0,000
Shares issued during the exercise - B 100.000,000 0,000 - F 106.850,000 62.650,000 - P 330,000 68,000
Shares redeemed during the exercise - B 0,000 - F 15.150,000 - P 0,000
Shares outstanding at the end of the exercise - B 100.000,000 - F 91.700,000 - P 330,000
*Cfr note 14

DPAM L
Changes in capital, total net assets and share value
152
Change s in capital, total net assets and share value
SUB-FUND VALUATION DATE TOTAL NET ASSETS SHARE CLASS SHARES
OUTSTANDING SHARE VALUE CCY
DPAM L LIQUIDITY EUR &FRN (EUR)
31.12.2018 95.419.061,20 - A 39.757,634 117,25 EUR
- B 12.766,867 333,22 EUR
- F 244.712,333 343,37 EUR
- M 11.159,206 117,43 EUR
- N 1.449,964 333,68 EUR
31.12.2019 22.541.115,30 - A 36.015,888 118,54 EUR
- B 5.365,857 337,60 EUR
- F 42.430,649 348,48 EUR
- M 11.882,206 118,94 EUR
- N 769,991 338,53 EUR
07.12.2020* 16.708.498,82 - A 26.649,888 117,68 EUR
- B 4.607,755 335,04 EUR
- F 30.959,470 346,36 EUR
- M 8.856,144 118,18 EUR
- N 769,991 336,33 EUR
DPAM L BONDS EUR QUALITY SUSTAINABLE (EUR)
31.12.2018 922.377.588,13 - A 201.996,335 142,08 EUR
- B 67.279,250 554,22 EUR
- E 13.598,693 419,91 EUR
- F 368.613,530 574,20 EUR
- J 12.648,881 24.330,01 EUR
- M 509.720,850 142,38 EUR
- N 4.195,896 555,50 EUR
- P 422.072,000 601,21 EUR
- W 4.633,888 564,92 EUR
31.12.2019 1.098.285.247,17 - A 153.580,271 150,10 EUR
- B 50.194,884 591,84 EUR
- E 10.983,693 445,37 EUR
- F 434.604,339 615,58 EUR
- J 14.155,881 26.122,70 EUR
- M 488.592,691 150,95 EUR
- N 3.265,523 595,31 EUR
- P 500.810,000 646,47 EUR
- W 6.365,583 605,39 EUR
31.12.2020 1.453.281.534,99 - A 175.040,594 151,89 EUR
- B 56.273,660 602,85 EUR
- E 20.053,693 452,50 EUR
- F 677.589,257 629,36 EUR
- J 20.092,881 26.747,59 EUR
- L 1.913,000 552,04 EUR
- M 608.412,577 153,30 EUR
- N 4.172,735 608,38 EUR
- P 480.699,000 662,93 EUR
- W 6.910,881 618,70 EUR
*Date of liquidation of the Sub-Fund

DPAM L
Changes in capital, total net assets and share value
153
SUB-FUND VALUATION DATE TOTAL NET ASSETS SHARE CLASS SHARES
OUTSTANDING SHARE VALUE CCY
DPAM L BONDS UNIVERSALIS UNCONSTRAINED (EUR)
31.12.2018 521.833.607,57 - A 394.157,432 128,71 EUR
- B 310.872,125 155,76 EUR
- B CHF 328,000 164,61 CHF
- E 37.357,518 111,58 EUR
- F 780.484,668 161,70 EUR
- J 5.686,702 24.828,01 EUR
- M 433.691,415 129,14 EUR
- N 32.698,658 156,27 EUR
- P 511.210,000 170,80 EUR
- V 1.191,000 137,16 EUR
- W 15.539,041 158,98 EUR
31.12.2019 953.418.774,25 - A 394.574,174 144,06 EUR
- B 383.675,964 177,72 EUR
- B CHF 328,000 181,25 CHF
- E 292.002,406 125,44 EUR
- F 1.895.720,751 185,29 EUR
- J 6.594,702 28.507,10 EUR
- M 613.052,741 145,16 EUR
- N 31.578,308 179,04 EUR
- P 693.610,000 196,50 EUR
- V 1.208,632 154,13 EUR
- W 117.100,224 182,08 EUR
31.12.2020 1.237.465.035,52 - A 393.087,761 145,65 EUR
- B 464.736,593 181,30 EUR
- B CHF 328,000 184,01 CHF
- E 171.813,153 127,43 EUR
- F 2.907.916,620 189,79 EUR
- J 7.765,702 29.257,42 EUR
- M 742.892,326 147,42 EUR
- N 34.741,923 183,35 EUR
- P 683.890,000 202,08 EUR
- V 2.897,632 156,49 EUR
- W 216.525,433 186,42 EUR

DPAM L
Changes in capital, total net assets and share value
154
SUB-FUND VALUATION DATE TOTAL NET ASSETS SHARE CLASS SHARES
OUTSTANDING SHARE VALUE CCY
DPAM L BONDS HIGHER YIELD (EUR)
31.12.2018 167.533.062,34 - A 1.057.928,580 83,80 EUR
- B 135.155,551 248,05 EUR
- B CHF 123,392 275,07 CHF
- E 219.108,391 94,65 EUR
- F 13.887,677 258,57 EUR
- M 179.821,999 84,11 EUR
- N 5.165,315 248,92 EUR
- P 136,000 260,17 EUR
- V 9.696,622 91,72 EUR
- W 3.689,402 254,10 EUR
31.12.2019 180.673.248,02 - A 980.576,507 91,34 EUR
- B 127.659,524 278,87 EUR
- B CHF 123,392 298,34 CHF
- E 189.890,858 103,64 EUR
- F 24.262,776 292,01 EUR
- M 160.180,842 92,07 EUR
- N 4.893,381 281,00 EUR
- P 36.486,000 295,01 EUR
- V 8.627,772 100,39 EUR
- W 3.330,452 286,86 EUR
31.12.2020 203.342.180,07 - A 1.011.479,663 91,28 EUR
- B 120.162,670 288,74 EUR
- B CHF 187,899 306,88 CHF
- E 189.890,858 104,13 EUR
- F 98.329,675 303,57 EUR
- M 145.367,532 92,46 EUR
- N 4.447,489 292,02 EUR
- P 33.452,000 307,93 EUR
- V 4.657,002 100,82 EUR
- W 3.796,081 298,09 EUR

DPAM L
Changes in capital, total net assets and share value
155
SUB-FUND VALUATION DATE TOTAL NET ASSETS SHARE CLASS SHARES
OUTSTANDING SHARE VALUE CCY
DPAM L BONDS GOVERNMENT SUSTAINABLE HEDGED (EUR)
31.12.2018 338.651.013,80 - A 3.795,718 1.295,66 EUR
- B 8.699,518 1.306,46 EUR
- E 4.983,000 1.322,12 EUR
- F 151.793,187 1.578,85 EUR
- J 1.794,841 25.354,32 EUR
- L 329,866 1.292,48 EUR
- M 833,465 1.298,22 EUR
- N 284,974 1.309,07 EUR
- P 11.797,590 1.619,05 EUR
- V 164,725 1.331,81 EUR
- W 7.124,556 1.321,16 EUR
31.12.2019 562.120.308,41 - A 2.807,837 1.341,67 EUR
- B 23.188,122 1.356,20 EUR
- E 6.659,713 1.372,63 EUR
- F 210.850,617 1.643,96 EUR
- J 4.926,841 26.426,26 EUR
- L 641,634 1.339,83 EUR
- M 5.134,775 1.347,07 EUR
- N 110,000 1.362,65 EUR
- P 10.021,000 1.689,24 EUR
- V 656,951 1.382,07 EUR
- W 11.034,319 1.375,07 EUR
31.12.2020 792.148.003,56 - A 7.983,746 1.383,82 EUR
- B 25.373,563 1.399,45 EUR
- E 9.141,995 1.419,50 EUR
- F 275.016,528 1.700,10 EUR
- J 6.352,841 27.356,05 EUR
- L 1.391,639 1.379,48 EUR
- M 19.229,585 1.392,39 EUR
- N 170,000 1.408.61 EUR
- P 14.049,000 1.750,42 EUR
- V 2.093,556 1.428,59 EUR
- W 24.449,296 1.421,39 EUR
DPAM L EQUITIES CONVICTION RESEARCH (EUR)
31.12.2018 63.244.879,19 - A 5.951,310 950,99 EUR
- B 20.826,336 1.090,38 EUR
- F 9.307,887 91,90 EUR
- J 316,659 23.099,64 EUR
- M 20.193,219 956,96 EUR
- N 6.732,280 1.096,57 EUR
31.12.2019 277.846.817,78 - A 3.619,590 1.156,38 EUR
- B 15.870,395 1.362,75 EUR
- F 13.807,887 115,46 EUR
- J 5.090,659 29.078,86 EUR
- M 20.369,620 1.169,90 EUR
- N 5.171,705 1.377,19 EUR
- P 2.629,000 27.179,96 EUR
31.12.2020 328.420.264,83 - A 2.421,870 1.088,33 EUR
- B 14.998,025 1.323,42 EUR
- F 26.157,887 112,60 EUR
- J 7.074,659 28.410,50 EUR
- M 22.500,571 1.105,43 EUR
- N 3.776,642 1.342,54 EUR
- P 2.708,000 26.607,39 EUR
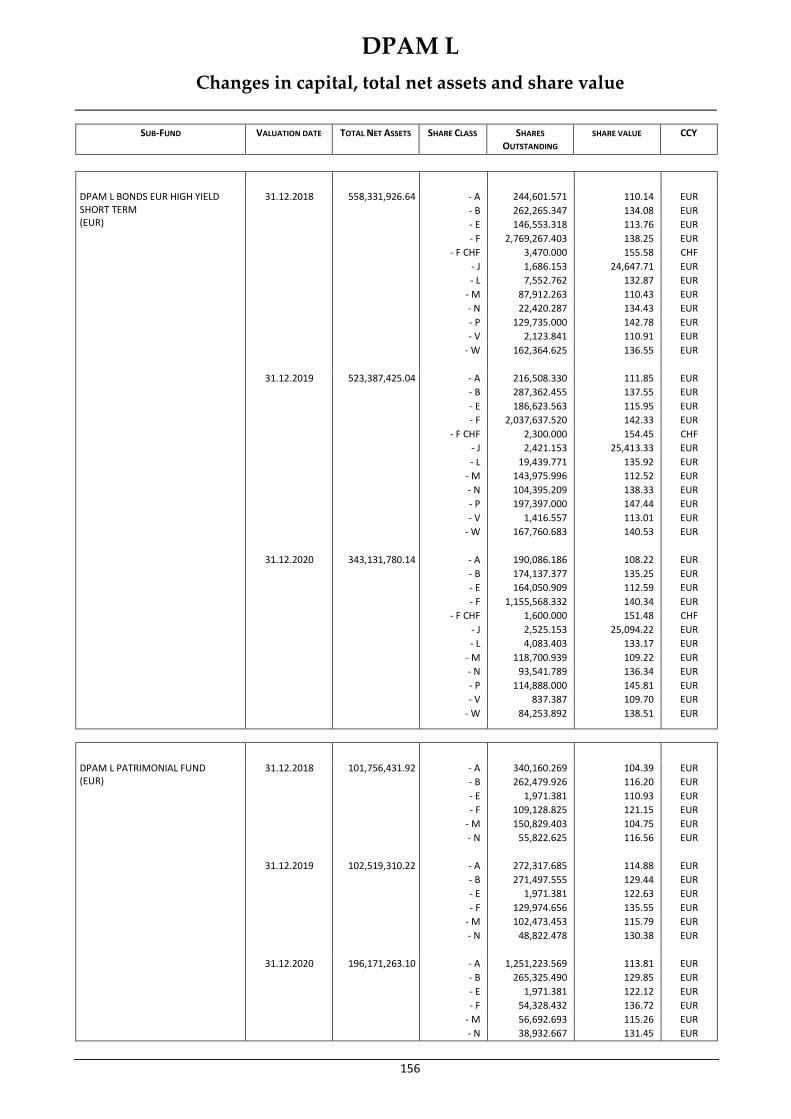
DPAM L
Changes in capital, total net assets and share value
156
SUB-FUND VALUATION DATE TOTAL NET ASSETS SHARE CLASS SHARES
OUTSTANDING SHARE VALUE CCY
DPAM L BONDS EUR HIGH YIELD SHORT TERM (EUR)
31.12.2018 558,331,926.64 - A 244,601.571 110.14 EUR
- B 262,265.347 134.08 EUR
- E 146,553.318 113.76 EUR
- F 2,769,267.403 138.25 EUR
- F CHF 3,470.000 155.58 CHF
- J 1,686.153 24,647.71 EUR
- L 7,552.762 132.87 EUR
- M 87,912.263 110.43 EUR
- N 22,420.287 134.43 EUR
- P 129,735.000 142.78 EUR
- V 2,123.841 110.91 EUR
- W 162,364.625 136.55 EUR
31.12.2019 523,387,425.04 - A 216,508.330 111.85 EUR
- B 287,362.455 137.55 EUR
- E 186,623.563 115.95 EUR
- F 2,037,637.520 142.33 EUR
- F CHF 2,300.000 154.45 CHF
- J 2,421.153 25,413.33 EUR
- L 19,439.771 135.92 EUR
- M 143,975.996 112.52 EUR
- N 104,395.209 138.33 EUR
- P 197,397.000 147.44 EUR
- V 1,416.557 113.01 EUR
- W 167,760.683 140.53 EUR
31.12.2020 343,131,780.14 - A 190,086.186 108.22 EUR
- B 174,137.377 135.25 EUR
- E 164,050.909 112.59 EUR
- F 1,155,568.332 140.34 EUR
- F CHF 1,600.000 151.48 CHF
- J 2,525.153 25,094.22 EUR
- L 4,083.403 133.17 EUR
- M 118,700.939 109.22 EUR
- N 93,541.789 136.34 EUR
- P 114,888.000 145.81 EUR
- V 837.387 109.70 EUR
- W 84,253.892 138.51 EUR
DPAM L PATRIMONIAL FUND (EUR)
31.12.2018 101,756,431.92 - A 340,160.269 104.39 EUR
- B 262,479.926 116.20 EUR
- E 1,971.381 110.93 EUR
- F 109,128.825 121.15 EUR
- M 150,829.403 104.75 EUR
- N 55,822.625 116.56 EUR
31.12.2019 102,519,310.22 - A 272,317.685 114.88 EUR
- B 271,497.555 129.44 EUR
- E 1,971.381 122.63 EUR
- F 129,974.656 135.55 EUR
- M 102,473.453 115.79 EUR
- N 48,822.478 130.38 EUR
31.12.2020 196,171,263.10 - A 1,251,223.569 113.81 EUR
- B 265,325.490 129.85 EUR
- E 1,971.381 122.12 EUR
- F 54,328.432 136.72 EUR
- M 56,692.693 115.26 EUR
- N 38,932.667 131.45 EUR

DPAM L
Changes in capital, total net assets and share value
157
SUB-FUND VALUATION DATE TOTAL NET ASSETS SHARE CLASS SHARES
OUTSTANDING SHARE VALUE CCY
DPAM L BONDS EMERGING MARKETS SUSTAINABLE (EUR)
31.12.2018 1.344.452.672,28 - A 326.604,905 99,55 EUR
- B 354.620,856 120,85 EUR
- B CHF 1.292,453 134,03 CHF
- B EUR HEDGED 88.431,699 99,74 EUR
- B USD 219.576,801 106,10 USD
- E 1.710.482,891 102,20 EUR
- F 5.098.830,720 124,88 EUR
- F CHF 75.633,843 140,30 CHF
- F USD 109.221,067 113,33 USD
- J 7.365,809 24.925,02 EUR
- L 25.369,909 119,84 EUR
- M 137.439,966 99,96 EUR
- N 25.772,294 121,34 EUR
- N USD 119.387,000 106,11 USD
- P 651.515,000 128,36 EUR
- V EUR HEDGED 6.790,000 100,56 EUR
- W 396.411,547 124,79 EUR
- W EUR HEDGED 591.129,025 100,56 EUR
- W USD 1.468,698 106,34 USD
31.12.2019 1.965.768.653,09 - A 669.594,387 105,92 EUR
- B 1.071.096,164 134,33 EUR
- B CHF 1.371,268 143,28 CHF
- B EUR HEDGED 27.509,276 104,04 EUR
- B USD 184.421,901 115,84 USD
- E 2.084.820,366 109,30 EUR
- F 6.104.651,980 139,47 EUR
- F CHF 35.410,469 151,01 CHF
- F USD 101.040,162 124,29 USD
- J 9.056,809 27.892,51 EUR
- L 23.678,337 132,82 EUR
- M 355.179,584 106,83 EUR
- N 23.056,684 135,46 EUR
- N USD 115.891,750 116,32 USD
- P 625.204,000 143,93 EUR
- V EUR HEDGED 108.026,000 111,00 EUR
- W 9.200,000 100,67 EUR
- W EUR HEDGED 1.540.340,996 139,30 EUR
- W USD 11.416,000 143,66 USD
31.12.2020 2.684.377.276,46 - A 867.376,343 98,07 EUR
- B 1.457.195,298 131,52 EUR
- B CHF 1.531,268 139,37 CHF
- B USD 148.192,613 123,61 USD
- E 2.604.321,632 101,69 EUR
- F 8.539.804,227 137,13 EUR
- F CHF 96.019,984 148,07 CHF
- F USD 2.320.698,168 133,21 USD
- J 8.874,809 27.481,08 EUR
- L 22.217,525 129,51 EUR
- M 374.217,920 99,30 EUR
- N 30.551,607 133,14 EUR
- N USD 169.189,252 124,62 USD
- P 492.513,000 142,09 EUR
- V 149.315,000 109,10 EUR
- W 1.816.805,692 136,92 EUR
- W CHF 7.365,000 140,57 CHF
- W USD 485.459,126 124,85 USD

DPAM L
Changes in capital, total net assets and share value
158
SUB-FUND VALUATION DATE TOTAL NET ASSETS SHARE CLASS SHARES
OUTSTANDING SHARE VALUE CCY
DPAM L BONDS EUR CORPORATE HIGH YIELD (EUR)
31.12.2018 76.104.903,15 - A 48.360,752 117,40 EUR
- B 25.930,155 130,82 EUR
- F 335.891,603 133,99 EUR
- L 150,141 95,80 EUR
- M 47.825,262 117,93 EUR
- N 325,000 131,34 EUR
- P 114.210,767 139,84 EUR
- W 2.728,415 131,69 EUR
31.12.2019 336.882.124,78 - A 130.316,513 127,32 EUR
- B 170.439,712 145,76 EUR
- E 57.943,841 150,04 EUR
- F 849.273,726 150,04 EUR
- J 3.771,000 27.893,04 EUR
- L 1.254,141 106,37 EUR
- M 154.156,261 128,54 EUR
- N 50,000 133,80 EUR
- P 68.014,767 157,22 EUR
- V 204.425,000 110,46 EUR
- W 6.206,195 147,40 EUR
31.12.2020 438.302.145,99 - A 126.082,857 124,22 EUR
- B 142.745,169 146,88 EUR
- E 56.732,841 147,21 EUR
- F 1.467.378,404 151,81 EUR
- J 3.417,000 28.278,73 EUR
- L 205,141 106,75 EUR
- M 156.165,860 125,93 EUR
- N 120,000 135,37 EUR
- P 88.266,767 159,70 EUR
- V 304.621,000 111,72 EUR
- W 40.939,313 149,07 EUR
DPAM L GLOBAL TARGET INCOME (EUR)
31.12.2018 74.271.386,59 - A 125.173,248 94,55 EUR
- B 103.393,449 106,89 EUR
- E 12.500,000 92,02 EUR
- F 471.098,853 103,30 EUR
- M 16.495,101 95,04 EUR
31.12.2019 81.828.024,87 - A 193.642,633 103,59 EUR
- B 66.520,566 120,47 EUR
- E 12.500,000 101,32 EUR
- F 434.772,626 116,99 EUR
- M 15.495,101 104,67 EUR
31.12.2020 68.706.805,65 - A 244.493,527 97,19 EUR
- B 39.339,417 116,76 EUR
- E 10.000,000 95,46 EUR
- F 332.575,426 113,86 EUR
- M 15.495,101 98,65 EUR

DPAM L
Changes in capital, total net assets and share value
159
SUB-FUND VALUATION DATE TOTAL NET ASSETS SHARE CLASS SHARES
OUTSTANDING SHARE VALUE CCY
DPAM L BONDS EUR GOVERNMENT 1-5 (EUR)
31.12.2018 36.741.384,61 - A 44.768,000 99,68 EUR
- B 98.373,000 100,20 EUR
- F 142.705,885 101,23 EUR
- M 32.513,988 99,85 EUR
- N 3.825,364 100,40 EUR
31.12.2019 8.599.230,85 - A 32.956,000 99,73 EUR
- B 11.735,000 100,47 EUR
- F 10.348,056 101,62 EUR
- M 26.937,006 100,10 EUR
- N 3.825,364 100,76 EUR
07.12.2020* 9.691.502,05 - A 31.035,000 99,22 EUR
- B 8.915,000 100,05 EUR
- F 32.630,000 101,22 EUR
- M 23.455,992 99,64 EUR
- N 799,880 100,30 EUR
DPAM L BALANCED CONSERVATIVE SUSTAINABLE (EUR)
31.12.2018 57.657.308,66 - A 90.601,337 98,67 EUR
- B 378.810,068 128,61 EUR
31.12.2019 52.340.166,46 - A 71.083,675 110,61 EUR
- B 294.500,131 145,53 EUR
- F 39,600 27.826,47 EUR
- V 2.823,354 110,87 EUR
- W 1.408,649 145,88 EUR
31.12.2020 57.263.570,42 - A 66.470,104 115,82 EUR
- B 245.662,983 153,76 EUR
- F 340,843 29.606,64 EUR
- V 12.674,369 116,90 EUR
- W 1.408,649 155,16 EUR
DPAM L BONDS CLIMATE TRENDS SUSTAINABLE (EUR)
28.06.2019 43.990.000,00 - A 4.800,000 100,00 EUR
- F 31.500,000 100,00 EUR
- J 516,000 25.000,00 EUR
- M 9.600,000 100,00 EUR
- P 1.060,000 25.000,00 EUR
31.12.2019 51.326.850,94 - A 3.000,000 101,13 EUR
- B 1.500,000 101,12 EUR
- F 31.500,000 101,36 EUR
- J 713,000 25.366,54 EUR
- M 26.415,000 101,33 EUR
- P 1.060,000 25.392,23 EUR
31.12.2020 162.338.262,33 - A 3.000,000 103,92 EUR
- B 4.373,258 103,83 EUR
- F 38.839,515 104,62 EUR
- J 4.361,000 26.232,56 EUR
- M 51.674,000 104,54 EUR
- P 1.000,000 26.312,20 EUR
- W 107.201,175 106,30 EUR
*Date of liquidation of the Sub-Fund
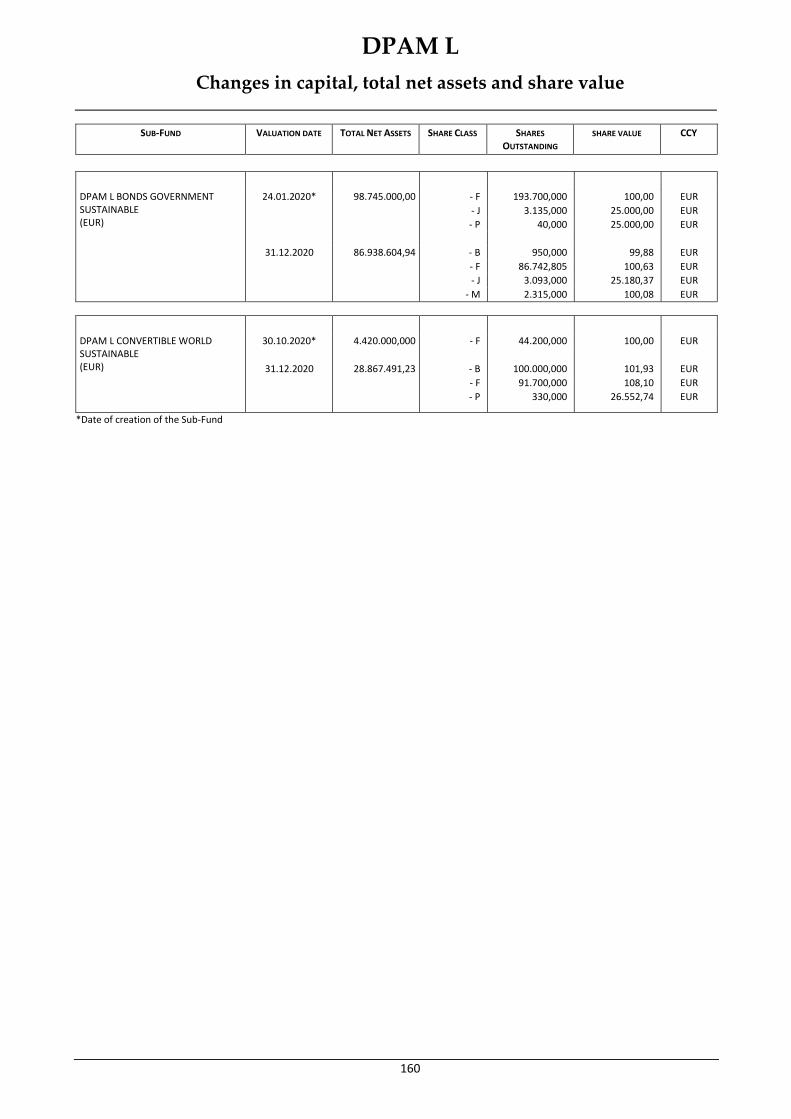
DPAM L
Changes in capital, total net assets and share value
160
SUB-FUND VALUATION DATE TOTAL NET ASSETS SHARE CLASS SHARES
OUTSTANDING SHARE VALUE CCY
DPAM L BONDS GOVERNMENT SUSTAINABLE (EUR)
24.01.2020* 98.745.000,00 - F 193.700,000 100,00 EUR
- J 3.135,000 25.000,00 EUR
- P 40,000 25.000,00 EUR
31.12.2020 86.938.604,94 - B 950,000 99,88 EUR
- F 86.742,805 100,63 EUR
- J 3.093,000 25.180,37 EUR
- M 2.315,000 100,08 EUR
DPAM L CONVERTIBLE WORLD SUSTAINABLE (EUR)
30.10.2020* 4.420.000,000 - F 44.200,000 100,00 EUR
31.12.2020 28.867.491,23 - B 100.000,000 101,93 EUR
- F 91.700,000 108,10 EUR
- P 330,000 26.552,74 EUR
*Date of creation of the Sub-Fund

DPAM L
Notes to the financial statements as at 31 December 2020
161
Notes to the financial stateme nts as at 31 December 2020
NOTE 1 - ACCOUNTING PRINCIPLES AND METHODS The financial statements are prepared in accordance with Luxembourg generally accepted accounting principles. a) Securities portfolio valuation 1) The value of cash on hand or on deposit, bills and notes payable on sight and accounts receivable, prepaid expenses, dividends and interest declared or matured and not yet received shall be the nominal value of such assets, except where it is unlikely that such value can be received; in the latter case, the value shall be determined by deducting such amount as the SICAV considers appropriate to reflect the real value of such assets. 2) The value of all transferable securities, money market instruments and derivative financial instruments which are listed on an exchange or traded on any other regulated market, which operates on a regular basis, is recognised and open to the public shall be determined according to their last available price. 3) In cases where investments of the SICAV are listed on a stock exchange or traded on another regulated market, which operates on a regular basis, is recognised and open to the public and traded by market makers outside the stock exchange on which the investments are listed or the market on which they are traded, the Board of Directors may determine the principal market for the investments in question, which will then be valued at the last price available on that market. 4) Derivative financial instruments that are not listed on an official stock exchange or traded on any other regulated market, which operates on a regular basis and is recognised and open to the public, will be valued in accordance with market practice, as further described in the Prospectus. 5) The value of the representative securities of any open-ended Collective Investment Scheme shall be determined according to the last official Net Asset Value per unit or according to the last estimated Net Asset Value if the latter is more recent than the official Net Asset Value, provided that the SICAV is satisfied that the valuation method used for this estimate is consistent with that used to calculate the official Net Asset Value. 6) To the extent that: - the transferable securities, money market instruments and/or derivative financial instruments in the portfolio on the Valuation Day are not listed or traded on a stock exchange or other regulated market that operates regularly, is recognised and open to the public or, - for transferable securities, time deposits, money market instruments, derivative financial instruments and/or securities representing Collective Investment Schemes listed and traded on an exchange or other market but for which the price determined in accordance with paragraphs 1) and 2) is not, in the opinion of the Board of Directors, representative of the real value of such transferable securities, time deposits, money market instruments, derivative financial instruments and/or securities representing Collective Investment Schemes the Board of Directors assesses the value with prudence and good faith. b) Net realised profit or loss on investments The net realised profit or loss on sales of securities are calculated based on the average cost of the securities sold. c) Acquisition cost of the securities in the portfolio For securities denominated in currencies other than the sub-fund's currency, the acquisition cost is calculated on the basis of the exchange rate in force on the day of purchase.

DPAM L
Notes to the financial statements as at 31 December 2020
162
d) Change in the net unrealised appreciation or depreciation The change in the net unrealised appreciation or depreciation on investments at the end of the financial year is included in operating income. e) Income, expenditure and related provisions Interest is recorded daily and dividends are recorded on the "ex-date". Interest and income are recorded net of non-recoverable withholding taxes. f) Formation expenses Formation expenses are amortized on a straight-line basis over a period of five years. If a sub-fund is launched after the launch date of the SICAV, the formation expenses relating to the launch of the new sub-fund will be charged to that sub-fund alone and may be amortised over a maximum period of five years from the date of launch of that sub-fund. g) Change in the securities portfolio The table of changes in the sub-funds' securities portfolio is available free of charge at the Sicav's registered office. h) Conversion of foreign currencies The SICAV’s accounts are kept in euro. Bank deposits, other net assets and the stock market value of securities in the portfolio in currencies other than the euro are converted into euro at the exchange rate valid on the closing date. Revenue and expenditure in currencies other than the euro are translated into euros at the exchange rate in force on the date of payment. i) Combined financial statements The combined financial statements of the SICAV are drawn up in EUR and are equal to the sum of the corresponding headings in the financial statements of each sub-fund. j) Crossed Investments Cross-investments between the Sub-Funds of the SICAV have not been subtracted from the combined statement of net assets. As at 31 December 2020, the total amount of cross-investments is EUR 45,984,907.42 and therefore the combined net assets without cross-investments is EUR 8,034,769,312.81. NOTE 2 - EXCHANGE RATE
1 EUR = 1.08155 CHF 1 EUR = 1.22355 USD
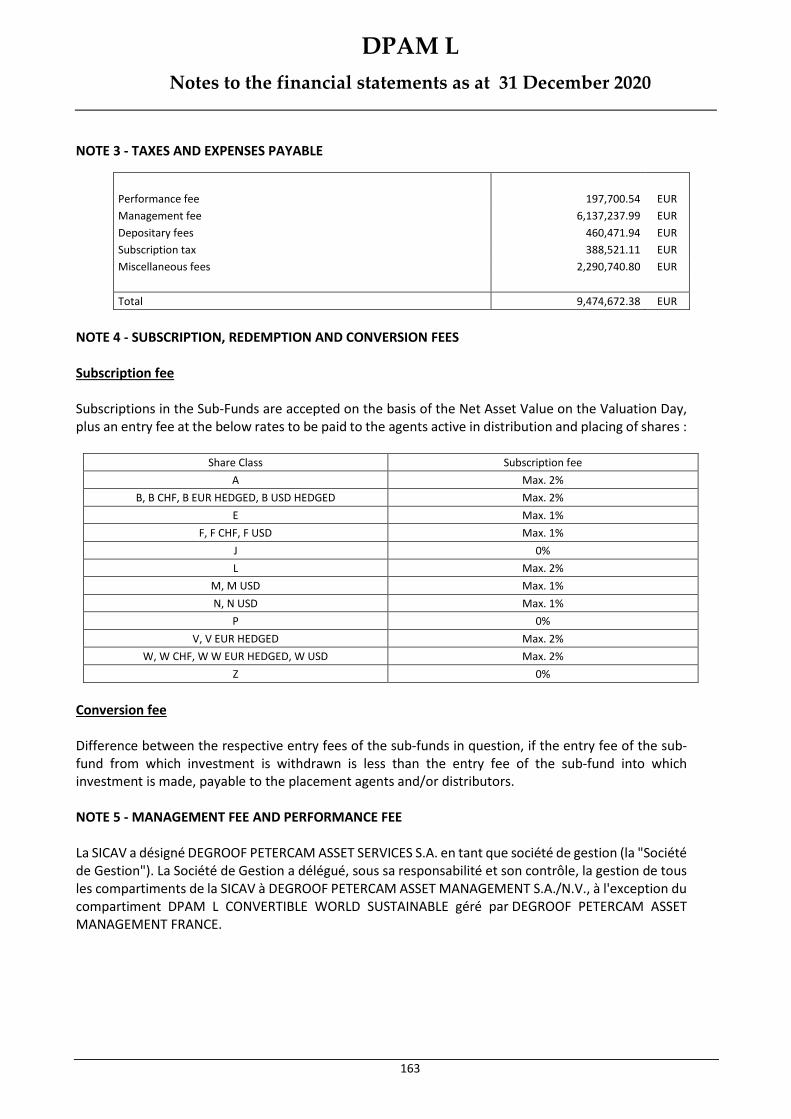
DPAM L
Notes to the financial statements as at 31 December 2020
163
NOTE 3 - TAXES AND EXPENSES PAYABLE
Performance fee 197,700.54 EUR
Management fee 6,137,237.99 EUR
Depositary fees 460,471.94 EUR
Subscription tax 388,521.11 EUR
Miscellaneous fees 2,290,740.80 EUR
Total 9,474,672.38 EUR
NOTE 4 - SUBSCRIPTION, REDEMPTION AND CONVERSION FEES Subscription fee Subscriptions in the Sub-Funds are accepted on the basis of the Net Asset Value on the Valuation Day, plus an entry fee at the below rates to be paid to the agents active in distribution and placing of shares :
Share Class Subscription fee
A Max. 2%
B, B CHF, B EUR HEDGED, B USD HEDGED Max. 2%
E Max. 1%
F, F CHF, F USD Max. 1%
J 0%
L Max. 2%
M, M USD Max. 1%
N, N USD Max. 1%
P 0%
V, V EUR HEDGED Max. 2%
W, W CHF, W W EUR HEDGED, W USD Max. 2%
Z 0%
Conversion fee Difference between the respective entry fees of the sub-funds in question, if the entry fee of the sub-fund from which investment is withdrawn is less than the entry fee of the sub-fund into which investment is made, payable to the placement agents and/or distributors. NOTE 5 - MANAGEMENT FEE AND PERFORMANCE FEE La SICAV a désigné DEGROOF PETERCAM ASSET SERVICES S.A. en tant que société de gestion (la "Société de Gestion"). La Société de Gestion a délégué, sous sa responsabilité et son contrôle, la gestion de tous les compartiments de la SICAV à DEGROOF PETERCAM ASSET MANAGEMENT S.A./N.V., à l'exception du compartiment DPAM L CONVERTIBLE WORLD SUSTAINABLE géré par DEGROOF PETERCAM ASSET MANAGEMENT FRANCE.

DPAM L
Notes to the financial statements as at 31 December 2020
164
Le Gestionnaire perçoit mensuellement une commission de gestion (commission à charge du compartiment) aux taux indiqués ci-dessous :
Sub-Funds Share Classes Issued Management Fees (%)
DPAM L LIQUIDITY EUR&FRN A, B, B CHF Max. 0,200% p.a.
(until 7 December 2020) E, F, F CHF, M, N, V, W Max. 0,100% p.a.
J Max. 0,050% p.a.
P 0% p.a.
DPAM L BALANCED CONSERVATIVE SUSTAINABLE
A, B Max. 1,000% p.a.
E, F, M, N, V, W Max. 0,500% p.a.
DPAM L BONDS CLIMATE TRENDS SUSTAINABLE
A, B, Max. 0,800% p.a.
E, F, M, N, V, W, Max. 0,400% p.a.
J Max. 0,200% p.a.
L Max. 1,200% p.a.
P 0% p.a.
DPAM L BONDS EMERGING MARKETS SUSTAINABLE
A, B, B CHF, B EUR Hedged, B USD
Max. 0,800% p.a.
E, F, F CHF, F USD, M, M USD, N, N USD, V, V EUR Hedged, W, W CHF, W EUR Hedged, W USD
Max. 0,400% p.a.
J Max. 0,200% p.a.
L Max. 1,200% p.a.
P 0% p.a.
DPAM L BONDS EUR CORPORATE HIGH YIELD A, B Max. 0,800 % p.a.
E, F, M, N, V, W Max. 0,400 % p.a.
J Max. 0,200% p.a.
L Max. 1,200% p.a.
P 0% p.a.
DPAM L BONDS EUR HIGH YIELD SHORT TERM A, B, B CHF Max. 0,600% p.a.
B LC Max 1,200% p.a.
E, F, F CHF, M, N, V, W Max. 0,300% p.a.
F LC Max 0,600% p.a.
J Max. 0,150% p.a.
L Max. 0,900% p.a.
P 0% p.a.
DPAM L BONDS EUR QUALITY SUSTAINABLE A, B, B CHF, B USD Hedged
Max. 0,600% p.a.
B LC Max. 1,200% p.a.
E, F, F CHF, M, N, V et W
Max. 0,300% p.a.
F LC Max. 0,600% p.a.
J Max. 0,150% p.a.
L Max. 0,900% p.a.
P 0% p.a.
DPAM L BONDS GOVERNMENT SUSTAINABLE A, B, B CHF Max. 0,400% p.a.
B LC Max. 1,200% p.a.
E, F, F CHF, M, N, V, W Max. 0,200% p.a.
F LC Max. 0,600% p.a.
L Max. 0,600% p.a.
J, Z Max. 0,100% p.a.
P 0% p.a.
DPAM L BONDS GOVERNMENT SUSTAINABLE HEDGED
A, B, B CHF
Max. 0,400% p.a.
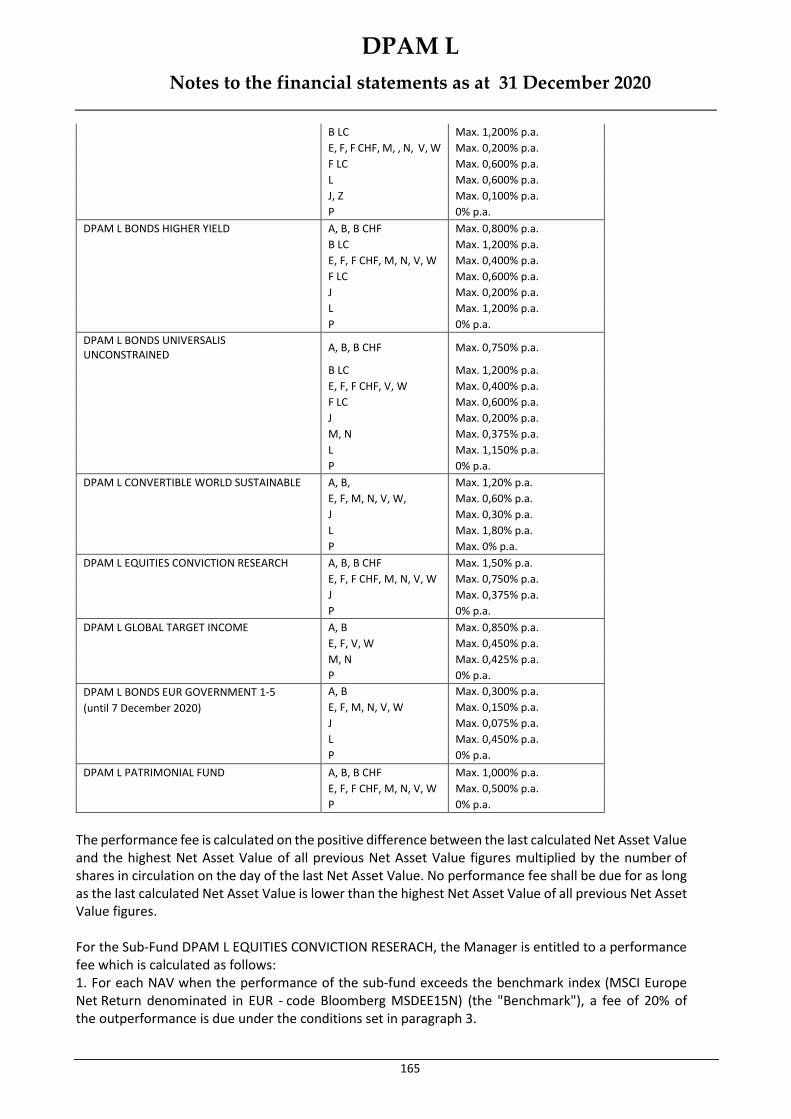
DPAM L
Notes to the financial statements as at 31 December 2020
165
B LC Max. 1,200% p.a.
E, F, F CHF, M, , N, V, W Max. 0,200% p.a.
F LC Max. 0,600% p.a.
L Max. 0,600% p.a.
J, Z Max. 0,100% p.a.
P 0% p.a.
DPAM L BONDS HIGHER YIELD A, B, B CHF Max. 0,800% p.a.
B LC Max. 1,200% p.a.
E, F, F CHF, M, N, V, W Max. 0,400% p.a.
F LC Max. 0,600% p.a.
J Max. 0,200% p.a.
L Max. 1,200% p.a.
P 0% p.a.
DPAM L BONDS UNIVERSALIS UNCONSTRAINED
A, B, B CHF Max. 0,750% p.a.
B LC Max. 1,200% p.a.
E, F, F CHF, V, W Max. 0,400% p.a.
F LC Max. 0,600% p.a.
J Max. 0,200% p.a.
M, N Max. 0,375% p.a.
L Max. 1,150% p.a.
P 0% p.a.
DPAM L CONVERTIBLE WORLD SUSTAINABLE A, B, Max. 1,20% p.a.
E, F, M, N, V, W, Max. 0,60% p.a.
J Max. 0,30% p.a.
L Max. 1,80% p.a.
P Max. 0% p.a.
DPAM L EQUITIES CONVICTION RESEARCH A, B, B CHF Max. 1,50% p.a.
E, F, F CHF, M, N, V, W Max. 0,750% p.a.
J Max. 0,375% p.a.
P 0% p.a.
DPAM L GLOBAL TARGET INCOME A, B Max. 0,850% p.a.
E, F, V, W Max. 0,450% p.a.
M, N Max. 0,425% p.a.
P 0% p.a.
DPAM L BONDS EUR GOVERNMENT 1-5 A, B Max. 0,300% p.a.
(until 7 December 2020) E, F, M, N, V, W Max. 0,150% p.a.
J Max. 0,075% p.a.
L Max. 0,450% p.a.
P 0% p.a.
DPAM L PATRIMONIAL FUND A, B, B CHF Max. 1,000% p.a.
E, F, F CHF, M, N, V, W Max. 0,500% p.a.
P 0% p.a.
The performance fee is calculated on the positive difference between the last calculated Net Asset Value and the highest Net Asset Value of all previous Net Asset Value figures multiplied by the number of shares in circulation on the day of the last Net Asset Value. No performance fee shall be due for as long as the last calculated Net Asset Value is lower than the highest Net Asset Value of all previous Net Asset Value figures. For the Sub-Fund DPAM L EQUITIES CONVICTION RESERACH, the Manager is entitled to a performance fee which is calculated as follows: 1. For each NAV when the performance of the sub-fund exceeds the benchmark index (MSCI Europe Net Return denominated in EUR - code Bloomberg MSDEE15N) (the "Benchmark"), a fee of 20% of the outperformance is due under the conditions set in paragraph 3.

DPAM L
Notes to the financial statements as at 31 December 2020
166
2. The performance of the sub-fund is equivalent to the difference between the latest NAV calculated and the highest NAV (plus the latest performance fee, and, where applicable, adjusted for any distribution) of all previous NAVs. 3. The performance fee is due only if the performance of the sub-fund per share, as defined above, is positive and exceeds that of the Benchmark, adjusted, as necessary, for any distribution. In this case, in order to determine the performance fee, the performance fee rate is applied to the difference between (i) the latest NAV per share calculated and (ii) the higher of (ii.a) the highest NAV (plus the latest performance fee, and, where applicable, adjusted for any distribution) of all previous NAVs or (ii.b) the Benchmark, adjusted, where applicable, for any distribution, multiplied by the number of shares in issue at the date of the latest NAV. The performance fee calculated during each calculation of the Net Asset Value is due to the Manager and payable in the month following the end of each month. For the Sub-Fund DPAM L PATRIMONIAL FUND, the Manager is entitled, where applicable, to a performance fee calculated as follows: 1. For each NAV when the performance of the sub-fund exceeds the benchmark index (EURIBOR 3M, Bloomberg code EUR003M) (the "hurdle rate"), a fee of 10% of the outperformance is due under the conditions set in paragraph 3. 2. The performance of the sub-fund is equivalent to the difference between the latest NAV calculated and the highest NAV (plus the latest performance fee, and, where applicable, adjusted for any distribution) of all previous NAVs. 3. The performance fee is due only if the performance of the sub-fund per share, as defined above, is positive and exceeds the hurdle rate, adjusted, as necessary, for any distribution. In this case, in order to determine the performance fee, the performance fee rate is applied to the difference between (i) the latest NAV per share calculated and (ii) the higher of (ii.a) the highest NAV (plus the latest performance fee, and, where applicable, adjusted for any distribution) of all previous NAVs or (ii.b) the hurdle rate, adjusted, where applicable, for any distribution, multiplied by the number of shares in issue at the date of the latest NAV. The performance fee calculated during each calculation of the Net Asset Value is due to the Manager and payable in the month following the end of each month. NOTE 6 - SUBSCRIPTION TAX The SICAV is governed by Luxembourg law. Pursuant to the legislation and regulations in force, the SICAV is subject to an annual subscription tax ("taxe d’abonnement") of 0.05% which is payable quarterly and calculated on the basis of the net assets of each Sub-Fund on the last day of each quarter. However, for the relevant Sub-Funds, a reduced rate of 0.01% is applied to classes of shares reserved for institutional investors. Pursuant to Article 175(a) of the law of 17 December 2010, the net assets invested in Undertakings for Collective Investment already subject to the "taxe d’abonnement" are exempt from this tax.

DPAM L
Notes to the financial statements as at 31 December 2020
167
NOTE 7 - BELGIAN ANNUAL TAX Articles 161 to 162 of the Belgian inheritance tax code, as amended by the Belgian Law of 22 December 2003, impose the payment on Undertakings for Collective Investment formally authorised to market their services in Belgium of an annual tax of 0.08% on the total net amount subscribed in Belgium as at 31 December of the preceding year, starting at the date of their registration with the "Autorité des Services et Marchés Financiers" ("FSMA"). The aforementioned amended Articles 161 to 162 came into force on 1 January 2004. The SICAV is required to pay this tax on 31 March of each year. On 13 May 2004, the SICAV made a complaint against the Belgian state to European Commission to ask for the cancellation of the obligation to pay the annual fee and the refund of taxes already paid. On 16 December 2010, the SICAV made an updated complaint to the European Commission. The legal costs of this complaint are borne by the SICAV. On 9 February 2006, the SICAV has summoned the Belgian state for the restitution fee in front of the Court of First Instance in Brussels. The SICAV continued to instruct the Belgian state in order to obtain the refund of this tax paid for the following exercises, without favourable continuation. From then on, it prepares cases quotations in front of the court for these exercises. In two similar cases, the Court of First Instance in Brussels ruled at the end of 2011 and during 2012 that this tax infringes an article of the Double Tax Avoidance Agreement between Belgium and Luxembourg and infers from this that it may not be imposed. The Belgian government has appealed against these rulings. In accordance with the judgement delivered by the Brussels Court of Appeal on 23 October 2014, the Court of Appeal shall stay proceedings and submit various preliminary matters to the European Court of Justice. The Law of 17 June 2013 relating to fiscal and financial provisions, and provisions relating to sustainable development (Belgian Moniteur 28 June 2013) changed the rate of the annual tax on undertakings for collective investment, established by Article 161a of the Inheritance Tax Code, to 0.0965% with effect from 1 January 2013 and 0.0925% with effect from 1 January 2014. NOTE 8 - "SWING PRICING" Swing pricing has been identified as a possible means of protecting a fund’s performance and thus the interest of existing investors from the dilution effect of frequent trading implied by large net in- or outflows. Swing pricing protects the long-term investors in a fund as an investor can only be impacted by the swing pricing the day he subscribes or redeems. Only one NAV is reported for all external performance and comparison purposes, as well as for execution of subscription, redemption and switch orders. Therefore if swing pricing is activated it is the swung price that is reported. The benefit of swinging the NAV is realized by the fund and in the case of a multi-share class fund, is attributed to all of the fund’s share classes on the same basis as with any fund level revenue or capital item. The swing mechanism applied is the partial swing (swing pricing with a trigger threshold). The NAV is swung but only when the pre-defined swing threshold is exceeded.

DPAM L
Notes to the financial statements as at 31 December 2020
168
Swing threshold The net value of subscription, redemption and switch orders received by the transfer agent for a single fund on any one trading day, expressed as a percentage of the NAV, required to trigger the NAV swing process. The Board of Directors of the fund determines by Circular Resolution the applicable threshold, taking into account the impact of adjustment on the volatility of the NAV. The threshold is reviewed periodically. Swing factor A swing factor is the amount, expressed as a percentage, by which the NAV is adjusted in order to protect existing investors in a fund from the cost of trading securities as a result of capital activity. The swing factor is triggered as a result of capital activity exceeding a pre-defined threshold for partial swing. The swing factor value will be determined by the Board of Directors and may vary from one sub-fund to the next without, however, exceeding 3% of the unadjusted NAV. The swing factor is monitored and calculated on an ongoing basis by the Risk Management department of DPAS. The factor is determined under normal and usual market conditions on the basis of the weighted average of the bid-ask spread of each individual portfolio position. The applicable swing factor will be amended when the most recent calculated swing factor exceeds the previous swing factor validated by the Board of Directors by more than the fixed threshold of 10 bps. In this case the escalation procedure will be applied and the swing factor will be approved by the fund's Board of Directors by a Circular Resolution and updated for the funds concerned. All the data related to the determination and review of the swing factors and thresholds is archived electronically on the DPAS database. The direction of the swing depends on the net flow of capital applicable to a NAV. In the case of a net inflow of capital, the swing factor linked to subscriptions of shares in the sub-fund will be added to the NAV. For net redemptions, the swing factor linked to redemptions of shares in the sub-fund in question will be deducted from the NAV. In both cases, all entering/exiting investors on a given date will have the same NAV applied. The fees generated are included in the item "Fees and commissions on subscriptions and redemptions" in the Statement of Operations and Other Changes in Net Assets. For the current period, swing pricing was applied to the net asset values of the following sub-funds:
Sub-Funds
DPAM L LIQUIDITY EUR&FRN
DPAM L BONDS EUR QUALITY SUSTAINABLE
DPAM L BONDS HIGHER YIELD
DPAM L BONDS UNIVERSALIS UNCONSTRAINED
DPAM L BONDS GOVERNMENT SUSTAINABLE HEDGED
DPAM L BONDS EUR HIGH YIELD SHORT TERM
DPAM L BONDS EMERGING MARKETS SUSTAINABLE
DPAM L BONDS EUR CORPORATE HGH YIELD
DPAM L BONDS EUR GOVERNMENT 1-5
DPAM L BALANCED CONSERVATIVE SUSTAINABLE
DPAM L BONDS CLIMATE TRENDS SUSTAINABLE
DPAM L BONDS GOVERNMENT SUSTAINABLE
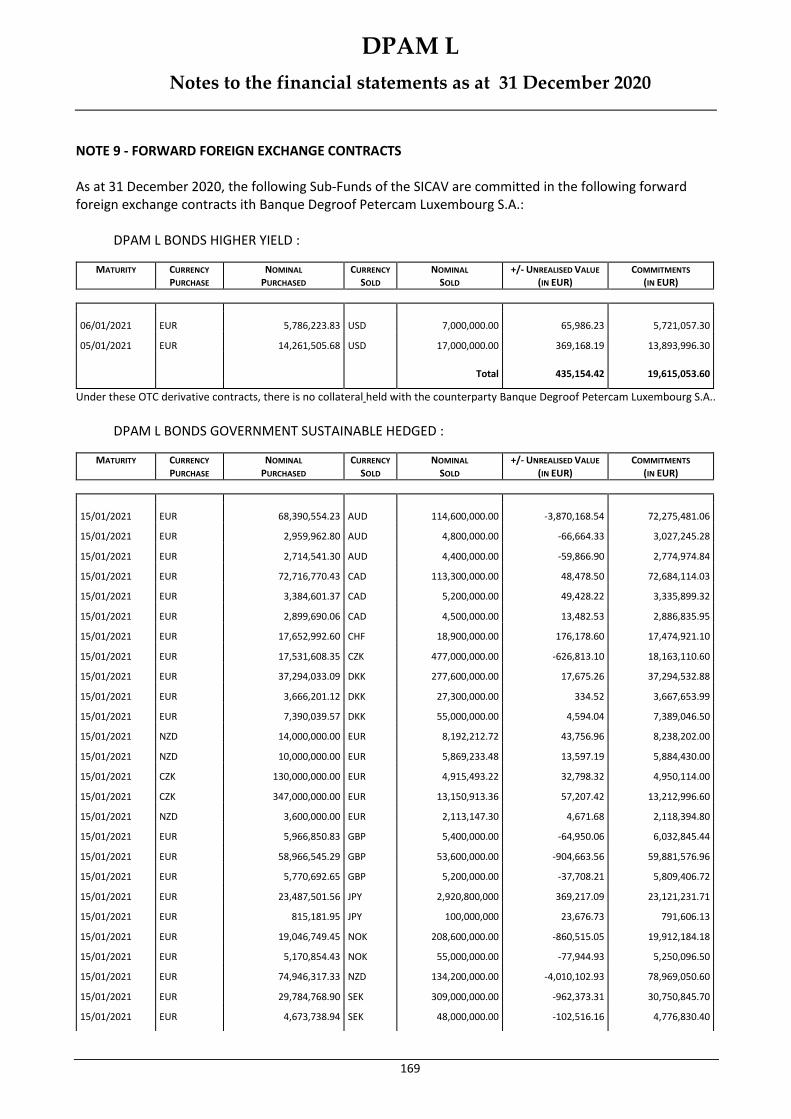
DPAM L
Notes to the financial statements as at 31 December 2020
169
NOTE 9 - FORWARD FOREIGN EXCHANGE CONTRACTS As at 31 December 2020, the following Sub-Funds of the SICAV are committed in the following forward foreign exchange contracts ith Banque Degroof Petercam Luxembourg S.A.:
DPAM L BONDS HIGHER YIELD :
MATURITY CURRENCY PURCHASE
NOMINAL PURCHASED
CURRENCY SOLD
NOMINAL SOLD
+/- UNREALISED VALUE (IN EUR)
COMMITMENTS (IN EUR)
06/01/2021 EUR 5,786,223.83 USD 7,000,000.00 65,986.23 5,721,057.30
05/01/2021 EUR 14,261,505.68 USD 17,000,000.00 369,168.19 13,893,996.30
Total 435,154.42 19,615,053.60
Under these OTC derivative contracts, there is no collateral held with the counterparty Banque Degroof Petercam Luxembourg S.A..
DPAM L BONDS GOVERNMENT SUSTAINABLE HEDGED :
MATURITY CURRENCY PURCHASE
NOMINAL PURCHASED
CURRENCY SOLD
NOMINAL SOLD
+/- UNREALISED VALUE (IN EUR)
COMMITMENTS (IN EUR)
15/01/2021 EUR 68,390,554.23 AUD 114,600,000.00 -3,870,168.54 72,275,481.06
15/01/2021 EUR 2,959,962.80 AUD 4,800,000.00 -66,664.33 3,027,245.28
15/01/2021 EUR 2,714,541.30 AUD 4,400,000.00 -59,866.90 2,774,974.84
15/01/2021 EUR 72,716,770.43 CAD 113,300,000.00 48,478.50 72,684,114.03
15/01/2021 EUR 3,384,601.37 CAD 5,200,000.00 49,428.22 3,335,899.32
15/01/2021 EUR 2,899,690.06 CAD 4,500,000.00 13,482.53 2,886,835.95
15/01/2021 EUR 17,652,992.60 CHF 18,900,000.00 176,178.60 17,474,921.10
15/01/2021 EUR 17,531,608.35 CZK 477,000,000.00 -626,813.10 18,163,110.60
15/01/2021 EUR 37,294,033.09 DKK 277,600,000.00 17,675.26 37,294,532.88
15/01/2021 EUR 3,666,201.12 DKK 27,300,000.00 334.52 3,667,653.99
15/01/2021 EUR 7,390,039.57 DKK 55,000,000.00 4,594.04 7,389,046.50
15/01/2021 NZD 14,000,000.00 EUR 8,192,212.72 43,756.96 8,238,202.00
15/01/2021 NZD 10,000,000.00 EUR 5,869,233.48 13,597.19 5,884,430.00
15/01/2021 CZK 130,000,000.00 EUR 4,915,493.22 32,798.32 4,950,114.00
15/01/2021 CZK 347,000,000.00 EUR 13,150,913.36 57,207.42 13,212,996.60
15/01/2021 NZD 3,600,000.00 EUR 2,113,147.30 4,671.68 2,118,394.80
15/01/2021 EUR 5,966,850.83 GBP 5,400,000.00 -64,950.06 6,032,845.44
15/01/2021 EUR 58,966,545.29 GBP 53,600,000.00 -904,663.56 59,881,576.96
15/01/2021 EUR 5,770,692.65 GBP 5,200,000.00 -37,708.21 5,809,406.72
15/01/2021 EUR 23,487,501.56 JPY 2,920,800,000 369,217.09 23,121,231.71
15/01/2021 EUR 815,181.95 JPY 100,000,000 23,676.73 791,606.13
15/01/2021 EUR 19,046,749.45 NOK 208,600,000.00 -860,515.05 19,912,184.18
15/01/2021 EUR 5,170,854.43 NOK 55,000,000.00 -77,944.93 5,250,096.50
15/01/2021 EUR 74,946,317.33 NZD 134,200,000.00 -4,010,102.93 78,969,050.60
15/01/2021 EUR 29,784,768.90 SEK 309,000,000.00 -962,373.31 30,750,845.70
15/01/2021 EUR 4,673,738.94 SEK 48,000,000.00 -102,516.16 4,776,830.40

DPAM L
Notes to the financial statements as at 31 December 2020
170
Total -10,789,190.02 510,673,627.28
Under these OTC derivative contracts, the sub-fund maintained a collateral of EUR 8,540,000.00 with Banque Degroof Petercam Luxembourg S.A. in favour of the counterparty at the end of the year. The purpose of this cash collateral is to fully cover the counterparty against the risk of a possible default by the sub-fund, as there is no margin call.
DPAM L PATRIMONIAL FUND :
MATURITY CURRENCY PURCHASE
NOMINAL PURCHASED
CURRENCY SOLD
NOMINAL SOLD
+/- UNREALISED VALUE (IN EUR)
COMMITMENTS (IN EUR)
31/03/2021 EUR 11,391,931.26 USD 14,000,000.00 -25,890.05 11,442,114.60
Total -25,890.05 11,442,114.60
Under these OTC derivative contracts, there is no collateral held with the counterparty Banque Degroof Petercam Luxembourg S.A..
DPAM L BONDS EMERGING MARKETS SUSTAINABLE :
MATURITY CURRENCY PURCHASE
NOMINAL PURCHASED
CURRENCY SOLD
NOMINAL SOLD
+/- UNREALISED VALUE (IN EUR)
COMMITMENTS (IN EUR)
0/40/2012 EUR 54,800.30 CHF 59,272.00 -4.84 54,802.83
28/05/2021 USD 5,960,630.04 GHS 40,000,000.00 -359,546.16 10,445,606.57
17/03/2021 EUR 7,023,655.67 HUF 2,500,000,000.00 143,852.67 6,893,000.00
17/03/2021 EUR 28,071,751.40 HUF 10,000,000,000.00 552,539.40 27,572,000.00
13/01/2021 USD 36,411,784.18 IDR 550,000,000,000.00 -2,195,260.36 61,769,129.10
13/01/2021 USD 29,701,941.02 MXN 600,000,000.00 -304,222.82 48,885,715.21
13/01/2021 USD 24,804,663.28 PHP 1,200,000,000.00 -129,088.80 40,695,019.99
17/03/2021 EUR 21,938,388.23 PLN 100,000,000.00 28,543.65 21,934,880.00
17/03/2021 EUR 25,470,179.51 RON 125,000,000.00 -42,983.73 25,680,800.00
13/01/2021 USD 19,736,842.11 THB 600,000,000.00 -233,087.68 32,498,500.66
13/01/2021 BRL 180,000,000.00 USD 32,944,707.80 1,380,080.99 55,248,094.72
13/01/2021 IDR 100,000,000,000.00 USD 7,027,406.89 66,265.56 11,563,456.78
17/03/2021 BRL 75,000,000.00 USD 14,250,969.07 131,318.75 23,448,307.59
13/01/2021 PHP 1,200,000,000.00 USD 24,919,013.21 34,784.56 40,788,477.49
17/03/2021 BRL 125,000,000.00 USD 24,630,541.87 -500,866.56 39,798,854.12
17/03/2021 EUR 24,754,517.70 USD 30,000,000.00 279,665.60 24,518,817.00
13/01/2021 BRL 50,000,000.00 USD 9,106,141.18 420,293.48 15,309,778.64
17/03/2021 INR 1,500,000,000.00 USD 20,123,693.64 169,606.03 33,225,222.06
17/03/2021 BRL 125,000,000.00 USD 24,141,061.05 -100,042.95 39,398,804.44
13/01/2021 COP 40,000,000,000.00 USD 10,632,303.06 848,144.35 18,245,716.43
13/01/2021 COP 40,000,000,000.00 USD 10,468,217.18 982,555.31 18,111,610.05
13/01/2021 MXN 400,000,000.00 USD 19,559,041.41 399,754.54 32,392,485.23
13/01/2021 MXN 200,000,000.00 USD 9,070,747.29 779,941.70 15,616,966.43
13/01/2021 BRL 45,000,000.00 USD 8,442,301.56 176,449.47 13,980,488.07
28/05/2021 GHS 40,000,000.00 USD 6,389,776.36 6,784.15 10,796,345.24
13/01/2021 JPY 4,000,000,000 USD 38,246,036.75 410,551.74 62,922,497.55
20/01/2021 EUR 2,021,304.55 ZAR 40,000,000.00 -196,340.67 2,225,628.00
17/03/2021 EUR 10,620,474.68 ZAR 200,000,000.00 -386,243.90 11,128,140.00
13/01/2021 EUR 18,068,992.58 ZAR 350,000,000.00 -1,359,800.09 19,474,245.00

DPAM L
Notes to the financial statements as at 31 December 2020
171
13/01/2021 USD 24,329,420.35 ZAR 400,000,000.00 -2,327,104.09 42,140,566.84
13/01/2021 USD 12,050,443.16 ZAR 200,000,000.00 -1,256,941.78 20,976,893.69
Total -2,580,402.48 827,740,849.74
Under these OTC derivative contracts, there is no collateral held with the counterparty Banque Degroof Petercam Luxembourg S.A..
DPAM L BONDS GOVERNMENT SUSTAINABLE :
MATURITY CURRENCY PURCHASE
NOMINAL PURCHASED
CURRENCY SOLD
NOMINAL SOLD
+/- UNREALISED VALUE (IN EUR)
COMMITMENTS (IN EUR)
15/01/2021 EUR 2,327,427.24 AUD 3,900,000.00 -131,707.30 2,459,636.79
15/01/2021 EUR 308,470.60 AUD 500,000.00 -6,803.06 315,338.05
15/01/2021 EUR 2,567,229.32 CAD 4,000,000.00 1,711.51 2,566,076.40
15/01/2021 EUR 322,187.78 CAD 500,000.00 1,498.05 320,759.55
15/01/2021 JPY 350,000,000 EUR 2,814,511.62 -44,448.43 2,770,621.44
15/01/2021 CHF 2,550,000.00 EUR 2,381,752.97 -23,807.25 2,357,727.45
15/01/2021 NZD 1,500,000.00 EUR 877,362.30 5,063.12 882,664.50
15/01/2021 NZD 3,000,000.00 EUR 1,760,770.04 4,079.16 1,765,329.00
15/01/2021 EUR 3,212,356.57 GBP 2,920,000.00 -49,283.91 3,262,205.31
15/01/2021 EUR 517,085.44 NOK 5,500,000.00 -7,794.50 525,009.65
15/01/2021 EUR 3,909,271.40 NZD 7,000,000.00 -209,170.79 4,119,101.00
Total -460,663.40 21,344,469.14
Under these OTC derivative contracts, there is no collateral held with the counterparty Banque Degroof Petercam Luxembourg S.A..
DPAM L CONVERTIBLE WORLD SUSTAINABLE :
MATURITY CURRENCY PURCHASE
NOMINAL PURCHASED
CURRENCY SOLD
NOMINAL SOLD
+/- UNREALISED VALUE (IN EUR)
COMMITMENTS (IN EUR)
31/03/2021 EUR 958,007.34 HKD 9,000,000.00 11,392.20 948,641.40
31/03/2021 EUR 434,027.78 HKD 4,000,000.00 13,309.94 421,618.40
31/03/2021 EUR 265,530.90 HKD 2,500,000.00 2,582.25 263,511.50
31/03/2021 EUR 1,186,690.08 JPY 150,000,000 105.63 1,187,409.19
31/03/2021 EUR 1,027,083.40 JPY 130,000,000 -1,289.79 1,029,087.96
31/03/2021 EUR 246,820.13 USD 300,000.00 2,152.53 245,188.17
31/03/2021 EUR 1,258,568.76 USD 1,500,000.00 35,230.76 1,225,940.85
31/03/2021 EUR 2,533,783.78 USD 3,000,000.00 87,107.78 2,451,881.70
31/03/2021 EUR 818,819.75 USD 1,000,000.00 3,261.08 817,293.90
31/03/2021 EUR 1,681,110.21 USD 2,000,000.00 49,992.88 1,634,587.80
31/03/2021 EUR 81,990.06 USD 100,000.00 434.19 81,729.39
31/03/2021 EUR 492,845.53 USD 600,000.00 3,510.33 490,376.34
31/03/2021 EUR 1,263,402.60 USD 1,500,000.00 40,064.60 1,225,940.85
31/03/2021 EUR 4,115,395.70 USD 5,000,000.00 37,602.37 4,086,469.50
31/03/2021 EUR 1,026,825.82 USD 1,200,000.00 48,155.42 980,752.68
31/03/2021 EUR 416,198.44 USD 500,000.00 8,419.11 408,646.95
Total 342,031.28 17,499,076.58
Under these OTC derivative contracts, there is no collateral held with the counterparty Banque Degroof Petercam Luxembourg S.A..

DPAM L
Notes to the financial statements as at 31 December 2020
172
NOTE 10 - FUTURES As at 31 December 2020, the following futures contracts are open with the counterparty Banque Degroof Petercam Luxembourg S.A.and Société Générale. As at 31 December 2020, the collateral, in cash, held by the Fund consists of the initial margin call and amounts to EUR 8,267,124.38.
DPAM L BONDS EUR QUALITY SUSTAINABLE :
CCY NUMBER OF
CONTRACTS DESCRIPTION
+/- UNREALISED VALUE (IN EUR)
COMMITMENTS (IN EUR)
EUR -235 EURO BUND FUTURE MARS 2021 44,000.00 24,827,520.64
EUR -125 EURO-BUXL 30YR FUTURE MARS 2021 -70,520.00 21,547,375.00
EUR -250 EURO BOBL FUTURE MARS 2021 67,500.00 25,902,000.00
Total 40,980.00 72,276,895.64
In respect of these futures contracts, the sub-fund maintained a guarantee deposit of EUR 1,775,146.30 with Société Générale in favour of the counterparty at the end of the financial year. This deposit, in cash, is intended to cover market risks in the event of unfavourable daily price movements in the futures contracts purchased or sold.
DPAM L BONDS UNIVERSALIS UNCONSTRAINED :
CCY NUMBER OF
CONTRACTS DESCRIPTION
+/- UNREALISED VALUE (IN EUR)
COMMITMENTS (IN EUR)
EUR -160 EURO-BUXL 30YR FUTURE MARS 2021 -240,000.00 27,580,640.00
EUR -200 EURO-OAT FUTURE MARS 2021 -98,600.00 25,557,200.00
GBP -50 LONG GILT FUTURE MARS 2021 -87,141.10 8,087,141.03
JPY -70 JGB 10YR FUTURE MARS 2021 -9,736.76 56,142,855.87
Total -435,477.86 117,367,836.90
In respect of these futures contracts, the sub-fund maintained a guarantee deposit of EUR 3,520,427.59 with Société Générale in favour of the counterparty at the end of the financial year. This deposit, in cash, is intended to cover market risks in the event of unfavourable daily price movements in the futures contracts purchased or sold.
DPAM L BONDS GOVERNMENT SUSTAINABLE HEDGED :
CCY NUMBER OF
CONTRACTS DESCRIPTION
+/- UNREALISED VALUE (IN EUR)
COMMITMENTS (IN EUR)
EUR 85 EURO BUND FUTURE MARS 2021 -7,650.00 8,980,165.00
EUR 6 EURO-BUXL 30YR FUTURE MARS 2021 480.00 1,034,274.00
Total -7,170.00 10,014,439.00
In respect of these futures contracts, the sub-fund maintained a guarantee deposit of EUR 247,035.50 with Société Générale in favour of the counterparty at the end of the financial year. This deposit, in cash, is intended to cover market risks in the event of unfavourable daily price movements in the futures contracts purchased or sold.

DPAM L
Notes to the financial statements as at 31 December 2020
173
DPAM L PATRIMONIAL FUND :
CCY NUMBER OF
CONTRACTS DESCRIPTION
+/- UNREALISED VALUE (IN EUR)
COMMITMENTS (IN EUR)
AUD 17 AUSTRALIAN 10YR BOND FUTURE MARS 2021 0.00 1,109,202.85
EUR -15 EURO BUND FUTURE MARS 2021 760.00 1,584,733.96
EUR -28 EURO-SCHATZ FUTURE MARS 2021 2,860.00 2,839,310.81
EUR 125 EURO STOXX BANK FUTURE MARS 2021 -7,500.00 463,125.00
EUR 80 STOXX EUROPE 600 FUTURE MARS 2021 29,600.00 1,594,000.00
EUR -30 EURO BOBL FUTURE MARS 2021 5,400.00 3,108,240.00
GBP 31 LONG GILT FUTURE MARS 2021 35,794.88 5,014,027.38
USD 16 ULTRA 10YR US TREAS FUTURE MARS 2021 1,123.78 1,274,672.00
USD 6 ULTRA T-BOND FUTURE MARS 2021 4,782.44 641,166.74
USD 12 US TREASURY LONG BOND FUTURE MARS 2021 -408.65 1,536,102.66
USD 67 MSCI EMERGING MKT FUTURE MARS 2021 80,237.83 3,527,007.32
USD 25 SP 500 E-MINI FUTURE MARS 2021 62,625.15 3,829,839.22
USD 15 RUSSELL 2000 EMIN FUTURE MARS 2021 39,475.30 1,210,494.00
Total 254,750.73 27,731,921.92
In respect of these futures contracts, the sub-fund maintained a guarantee deposit of EUR 1,073,801.41 with Société Générale in favour of the counterparty at the end of the financial year. This deposit, in cash, is intended to cover market risks in the event of unfavourable daily price movements in the futures contracts purchased or sold.
DPAM L BONDS EMERGING MARKETS SUSTAINABLE :
CCY NUMBER OF
CONTRACTS DESCRIPTION
+/- UNREALISED VALUE (IN EUR)
COMMITMENTS (IN EUR)
EUR -50 EURO-BUXL 30YR FUTURE MARS 2021 -38,000.00 8,618,950.00
USD -175 US 10YR TREASURY NOTE FUTURE MARS 2021 -38,438.36 15,878,168.80
USD -24 US TREASURY LONG BOND FUTURE MARS 2021 16,550.20 3,072,207.77
Total -59,888.16 27,569,326.57
In respect of these futures contracts, the sub-fund maintained a guarantee deposit of EUR 669,632.03 with Société Générale in favour of the counterparty at the end of the financial year. This deposit, in cash, is intended to cover market risks in the event of unfavourable daily price movements in the futures contracts purchased or sold.
DPAM L GLOBAL TARGET INCOME :
CCY NUMBER OF
CONTRACTS DESCRIPTION
+/- UNREALISED VALUE (IN EUR)
COMMITMENTS (IN EUR)
EUR 16 EURO-BUXL 30YR FUTURE MARS 2021 16,640.00 2,758,064.00
EUR -118 EURO BUND FUTURE MARS 2021 -15,340.00 12,466,582.00
JPY 19 TOPIX INDEX FUTURE MARS 2021 77,308.25 2,714,061.18
USD 1 US 2YR TREASURY FUTURE MARS 2021 178.78 168,247.61
USD 82 ULTRA 10YR US TREAS FUTURE MARS 2021 -11,518.74 6,532,693.99
USD 1 US 5YR TREASURY NOTE FUTURE MARS 2021 242.64 81,567.67
USD 1 ULTRA T-BOND FUTURE MARS 2021 -791.75 106,861.18
USD 1 US TREASURY LONG BOND FUTURE MARS 2021 -670.43 128,008.34
USD 92 US 10YR TREASURY NOTE FUTURE MARS 2021 17,622.90 8,347,380.17
Total 83,671.65 33,303,466.14
In respect of these futures contracts, the sub-fund maintained a guarantee deposit of EUR 627,338.60 with Société Générale in favour of the counterparty at the end of the financial year. This deposit, in cash, is intended to cover market risks in the event of unfavourable daily price movements in the futures contracts purchased or sold.

DPAM L
Notes to the financial statements as at 31 December 2020
174
DPAM L BONDS CLIMATE TRENDS SUSTAINABLE : Fnote
CCY NUMBER OF
CONTRACTS DESCRIPTION
+/- UNREALISED VALUE (IN EUR)
COMMITMENTS (IN EUR)
EUR -30 EURO BUND FUTURE MARS 2021 -24,900.00 3,169,470.00
Total -24,900.00 3,169,470.00
In respect of these futures contracts, the sub-fund maintained a guarantee deposit of EUR 82,190.50 with Société Générale in favour of the counterparty at the end of the financial year. This deposit, in cash, is intended to cover market risks in the event of unfavourable daily price movements in the futures contracts purchased or sold.
DPAM L BONDS GOVERNMENT SUSTAINABLE :
CCY NUMBER OF
CONTRACTS DESCRIPTION
+/- UNREALISED VALUE (IN EUR)
COMMITMENTS (IN EUR)
EUR 1 EURO-BUXL 30YR FUTURE MARS 2021 60.00 172,379.00
EUR 21 EURO-OAT FUTURE MARS 2021 2,100.00 2,683,506.00
EUR -6 EURO BUND FUTURE MARS 2021 660.00 633,894.00
GBP 7 LONG GILT FUTURE MARS 2021 11,104.90 1,132,199.74
Total 13,924.90 4,621,978.74
In respect of these futures contracts, the sub-fund maintained a guarantee deposit of EUR 65,682.81 with Société Générale in favour of the counterparty at the end of the financial year. This deposit, in cash, is intended to cover market risks in the event of unfavourable daily price movements in the futures contracts purchased or sold.
DPAM L CONVERTIBLE WORLD SUSTAINABLE :
CCY NUMBER OF
CONTRACTS DESCRIPTION
+/- UNREALISED VALUE (IN EUR)
COMMITMENTS (IN EUR)
JPY 3 NIKKEI 225 FUTURE MARS 2021 21,135.88 651,650.16
USD -14 NASDAQ 100 E-MINI FUTURE MARS 2021 -111,855.67 2,948,747.33
Total -90,719.79 3,600,397.49
In respect of these futures contracts, the sub-fund maintained a guarantee deposit of EUR 205,869.64 with Banque Degroof Petercam Luxembourg S.A. in favour of the counterparty at the end of the financial year. This deposit, in cash, is intended to cover market risks in the event of unfavourable daily price movements in the futures contracts purchased or sold.
NOTE 11 - IRS
As at 31 December 2020, the following Sub-Funds of the SICAV are committed in the following : Interest Rate Swap
Sub-Fund DPAM L BONDS EMERGING MARKETS SUSTAINABLE : CCY MATURITY COUNTERPARTY NOTIONAL BUYER LEG /
PAYER LEG +/- UNREALISED
VALUE (IN EUR)
COMMITMENTS (IN EUR)
CZK 01/12/2022 Banque Degroof Luxembourg 250.000.000,00 0.575/PRIBOR6M 5,853,93 9.519.450,00
PLN 15/09/2022 Banque Degroof Luxembourg 100.000.000,00 0.278/PLN_MM6M -31,028,59 21.934.880,00

DPAM L
Notes to the financial statements as at 31 December 2020
175
PLN 13/08/2024 Banque Degroof Luxembourg 100.000.000,00 0.430/PLN_MM6M -63,081,40 21.934.880,00
Total -86,256.06 53,389,210.00
Under these OTC derivative contracts, the sub-fund maintained a collateral of EUR 2,100,000.00 with Banque Degroof Petercam Luxembourg S.A. in favour of the counterparty at the end of the year. The purpose of this cash collateral is to fully cover the counterparty against the risk of a possible default by the sub-fund, as there is no margin call.
Credit Default Swaps
Sub-Fund DPAM L BONDS EUR QUALITY SUSTAINABLE :
CCY MATURITY COUNTERPART NOTIONAL UNDERLYING +/- UNREALISED VALUE (IN EUR)
EUR 20/12/2025 BNP PARIBAS LONDON 100,000,000.00 IT EU S34 -2,605,098.00
Total -2,605,098.00
Under these OTC derivative contracts, the sub-fund maintained a collateral of EUR 2,410,000.00 with Banque Degroof Petercam Luxembourg S.A. in favour of the counterparty at the end of the year. The purpose of this cash collateral is to fully cover the counterparty against the risk of a possible default by the sub-fund, as there is no margin call.
Sub-Fund DPAM L BONDS UNIVERSALIS UNCONSTRAINED :
CCY MATURITY COUNTERPART NOTIONAL UNDERLYING +/- UNREALISED VALUE (IN EUR)
EUR 20/12/2025 JP MORGAN 100,000,000.00 IT EU S34 -2,605,098.00
EUR 20/12/2025 JP MORGAN 40,000,000.00 IT EU S34 229,571.00
EUR 20/12/2025 JP MORGAN 40,000,000.00 IT EU S34 -1,042,039.00
EUR 20/12/2025 JP MORGAN 20,000,000.00 IT EU S34 114,785.00
EUR 20/12/2025 JP MORGAN 20,000,000.00 IT EU S34 114,785.00
Total -3,187,996.00
Under these OTC derivative contracts, the sub-fund maintained a collateral of EUR 3,230,000.00 with Banque Degroof Petercam Luxembourg S.A. in favour of the counterparty at the end of the year. The purpose of this cash collateral is to fully cover the counterparty against the risk of a possible default by the sub-fund, as there is no margin call.
NOTE 12 - DIVIDENDS The General shareholders' meeting of 8 April 2020 approved the payment of a dividend for the exercice 2019. Shares were quoted ex-dividend since 12 May 2020. The payment was made on 19 May 2020.
SUB-FUNDS CLASS ISIN CURRENCY AMOUNT / SHARE
DPAM L BALANCED CONSERVATIVE SUSTAINABLE A LU1499202692 EUR 0,90
DPAM L BALANCED CONSERVATIVE SUSTAINABLE V LU1867119478 EUR 0,90
DPAM L BONDS EMERGING MARKETS SUSTAINABLE A LU0907927171 EUR 5,30
DPAM L BONDS EMERGING MARKETS SUSTAINABLE E LU0907927841 EUR 5,46
DPAM L BONDS EMERGING MARKETS SUSTAINABLE M LU1518617094 EUR 5,34
DPAM L BONDS EUR CORPORATE HIGH YIELD A LU0966248915 EUR 3,60
DPAM L BONDS EUR CORPORATE HIGH YIELD E LU0966249483 EUR 4,10
DPAM L BONDS EUR CORPORATE HIGH YIELD M LU1518617334 EUR 3,64
DPAM L BONDS EUR HIGH YIELD SHORT TERM A LU0517221833 EUR 1,55
DPAM L BONDS EUR HIGH YIELD SHORT TERM E LU0517222302 EUR 1,61
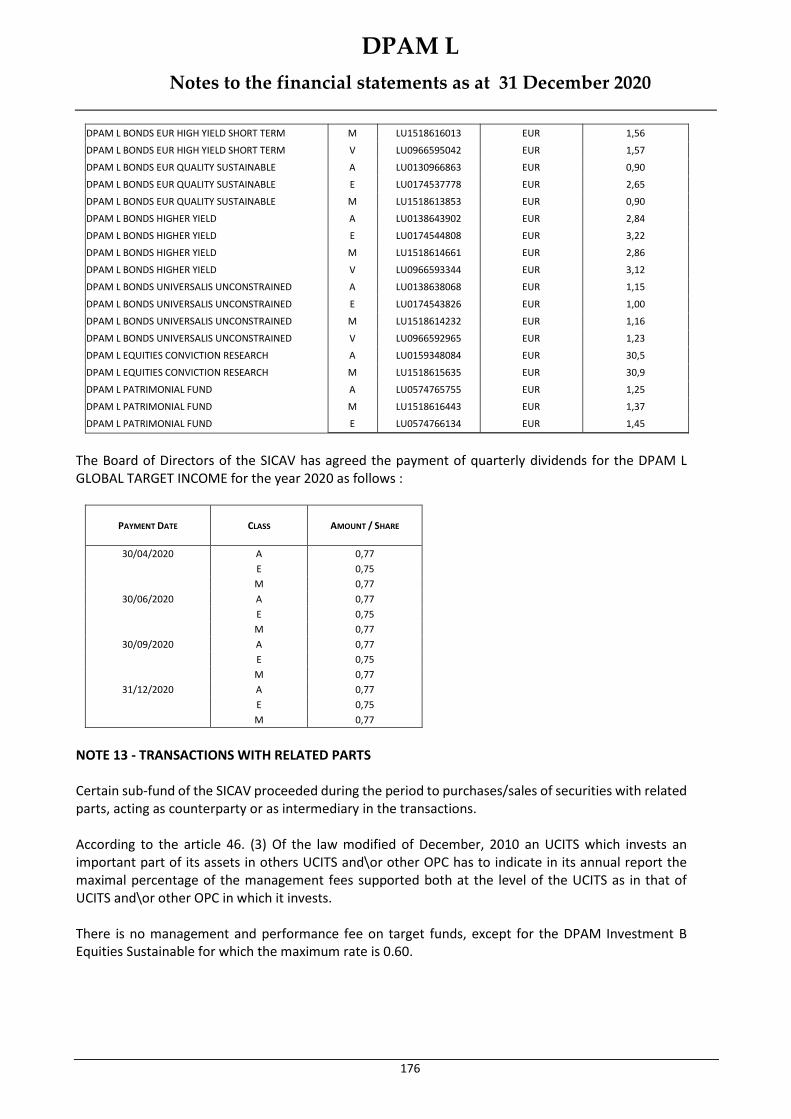
DPAM L
Notes to the financial statements as at 31 December 2020
176
DPAM L BONDS EUR HIGH YIELD SHORT TERM M LU1518616013 EUR 1,56
DPAM L BONDS EUR HIGH YIELD SHORT TERM V LU0966595042 EUR 1,57
DPAM L BONDS EUR QUALITY SUSTAINABLE A LU0130966863 EUR 0,90
DPAM L BONDS EUR QUALITY SUSTAINABLE E LU0174537778 EUR 2,65
DPAM L BONDS EUR QUALITY SUSTAINABLE M LU1518613853 EUR 0,90
DPAM L BONDS HIGHER YIELD A LU0138643902 EUR 2,84
DPAM L BONDS HIGHER YIELD E LU0174544808 EUR 3,22
DPAM L BONDS HIGHER YIELD M LU1518614661 EUR 2,86
DPAM L BONDS HIGHER YIELD V LU0966593344 EUR 3,12
DPAM L BONDS UNIVERSALIS UNCONSTRAINED A LU0138638068 EUR 1,15
DPAM L BONDS UNIVERSALIS UNCONSTRAINED E LU0174543826 EUR 1,00
DPAM L BONDS UNIVERSALIS UNCONSTRAINED M LU1518614232 EUR 1,16
DPAM L BONDS UNIVERSALIS UNCONSTRAINED V LU0966592965 EUR 1,23
DPAM L EQUITIES CONVICTION RESEARCH A LU0159348084 EUR 30,5
DPAM L EQUITIES CONVICTION RESEARCH M LU1518615635 EUR 30,9
DPAM L PATRIMONIAL FUND A LU0574765755 EUR 1,25
DPAM L PATRIMONIAL FUND M LU1518616443 EUR 1,37
DPAM L PATRIMONIAL FUND E LU0574766134 EUR 1,45
The Board of Directors of the SICAV has agreed the payment of quarterly dividends for the DPAM L GLOBAL TARGET INCOME for the year 2020 as follows :
PAYMENT DATE CLASS AMOUNT / SHARE
30/04/2020 A 0,77
E 0,75
M 0,77
30/06/2020 A 0,77
E 0,75
M 0,77
30/09/2020 A 0,77
E 0,75
M 0,77
31/12/2020 A 0,77
E 0,75
M 0,77
NOTE 13 - TRANSACTIONS WITH RELATED PARTS Certain sub-fund of the SICAV proceeded during the period to purchases/sales of securities with related parts, acting as counterparty or as intermediary in the transactions. According to the article 46. (3) Of the law modified of December, 2010 an UCITS which invests an important part of its assets in others UCITS and\or other OPC has to indicate in its annual report the maximal percentage of the management fees supported both at the level of the UCITS as in that of UCITS and\or other OPC in which it invests. There is no management and performance fee on target funds, except for the DPAM Investment B Equities Sustainable for which the maximum rate is 0.60.

DPAM L
Notes to the financial statements as at 31 December 2020
177
NOTE 14 - EVENTS DURING THE YEAR The Board of Directors of DPAM L has decided to liquidate the following share classes of the DPAM L BONDS EMERGING MARKETS SUSTAINABLE Sub-Fund by means of a compulsory redemption of all outstanding shares of these share classes at the net asset value of 28 February 2020. B EUR Hedged V EUR Hedged W EUR Hedged This Share Classes has been suspended since February 17, 2020. As from 20 January 2020, the Sub-Fund DPAM L BONDS GOVERNMENT SUSTAINABLE has been renamed DPAM L BONDS GOVERNMENT SUSTAINABLE HEDGED. DPAM L BONDS GOVERNMENT SUSTAINABLE Sub-Fund was created as a clone of the one that existed before 20 January 2020. The first net asset value calculation was dated 27 January 2020. The Sub-Fund DPAM L CONVERTIBLE WORLD SUSTAINABLE has been launched on 30 October 2020. The Sub-Funds DPAM L LIQUIDITY EUR&FRN et DPAM L BONDS EUR GOV1-5 have been liquidated on 7 December 2020. As at 31 December 2020, these 2 sub-funds are still in the process of being liquidated, with a cash amount of EUR 31,840.28 and EUR 28,351.74 respectively withheld to meet the contractual costs of the fourth quarter 2020. The Sub-Fund DPAM Asymmetric L Diversified from SICAV DPAM Asymmetric L has merged with the Sub-Fund DPAM L PATRIMONIAL FUND on 15 Decembre 2020. The COVID-19 (coronavirus) pandemic is seriously threatening the health of the world's population and has severely disrupted people's daily lives for more than one year. This obviously has a major impact on the global economy although finance in its specific sector is not the most disadvantaged sector impacted. Most sectors of the economy are affected and some are being hit extremely hard. Fiscal year 2020 has been marked by some negative impacts on the valuation of equities, bonds, funds and other investments and year 2021 is expected to suffer the same fate according to current forecasts of the evolving pandemic. The current measures and the new proposals taken by health authorities to contain the spread of the virus, while necessary, have and will also have a significant impact on economic activity. It remains to be hoped that although these effects are significant, they will ultimately be temporary. Authorities around the world have taken and continue to take strong and necessary measures to contain the spread of the virus and to support individuals and businesses in these very difficult times. We can hope that vaccination will offer a glimmer of hope for 2021. The Board of Directors is currently not in a position to accurately estimate the consequences of this event, but is closely monitoring the situation.
DPAM L
Additional information (unaudited) as at 31 December 2020
178
Additional infor mation (una udited) as at 31 De cember 202 0
OVERALL RISK ASSESSMENT Each sub-fund of the SICAV must ensure that its overall exposure to financial derivative instruments does not exceed its total net assets. Overall exposure is a measurement designed to limit the leverage generated for each subfund by using derivatives. The method used to calculate overall exposure for each Sub-Fund of the SICAV is the ‘commitment method’. The commitment method entails converting positions on derivatives into equivalent positions on underlying assets and then aggregating the market value of these equivalent positions.
Remuneration
DEGROOF PETERCAM ASSET SERVICES LUXEMBOURG 1) General Degroof Petercam Asset Services S.A. (“DPAS”) has implemented a Remuneration Policy that is designed as not to encourage taking excessive risks. In that context, it integrates in its performance management system, risk criteria specific to the activities of the business units concerned. DPAS has implemented a series of safeguards that refrain staff from taking undue risk compared to the activity profile. The governance structure of the Remuneration Policy (“the Policy”) aims at preventing internal conflicts of interest. The Policy is formulated by the Remuneration Policy and approved by the Management Board. The Policy follows a defined process establishing the principles, the approval, the communication, the implementation, the review and the update of the Policy involving the Management Board, Human Resources, Internal Audit and other control functions. Performance is assessed at Group and DPAS level. Individual staff assessments are based on a weighting of financial and non-financial targets linked to the specific job scope and role. As such, the principle of individual performance assessment is based on an assessment of objectives reached as well as an appreciation of the employee’s long-term value creation. Furthermore, the performance reflects an assessment of business and interpersonal skills and is linked to the achievement of the individual. The criteria applied to establish fixed remuneration are job complexity, level of responsibility, performance and local market conditions. 2) Methodology DPAS is dual-licenced as a chapter 15 Management Company under law of 17 December 2010 relating to Undertakings for Collective Investment in Transferable Securities, and as an AIFM under law of 12 July 2013 on Alternative Investment Fund Manager. In line with those regulations, the responsibilities of DPAS in its two roles are very similar. DPAS considers a fair assumption to state that its staff is remunerated similarly for tasks related to Undertakings for Collective Investment in Transferable Securities (“UCITS”) and Alternative Investment Funds (“AIF”). The Remuneration Policy is available at https://www.dpas.lu (Tab Investor Information - ‘Remuneration Policy’). As a consequence, the remuneration as stated above is the ratio between the Assets under Management (“AuM”) of all UCITS under the responsibility of DPAS and the total AuM plus the Assets

DPAM L
Additional information (unaudited) as at 31 December 2020
179
Under Administration ("AUA"). Based on the AuM and AUA as of 31 December 2020, this ratio equals 58.62% (71.82% in 2019). As of 31 December 2020, DPAS is Management Company for a total AuM of 30,493 billion EUR for the UCITS. Would it be necessary to assess the proportion of the remuneration of the staff of the Management Company attributable to all the UCITS it manages, the above ratio is applied to the yearly remuneration of the concerned staff. Would it be necessary to assess the proportion of the remuneration of the staff of the Management Company attributable to this UCITS, the ratio between the AuM of this UCITS and the total AuM for all UCITS is applied to the yearly remuneration of the concerned staff. 3) Allocated remuneration by category of staff The table below represents the allocation of total remuneration of the employees of the Management Company based on the AuM of all UCITS, by category of staff:
Type of staff
Number of
beneficiaries
(*)
Total remuneration
(in EUR)
Fixed remuneration
paid
(in EUR)
Variable remuneration
paid
(in EUR)
Senior Management
(**) 4 635,917 472,780 163,137
Identified staff (***) 2 130,661 112,955 17,696
Other staff 121 4,503,655 3,836,094 667,561
5,270,223 4,421,829 848,394
(*) No proportionality applied (**) Management Board (***) Identified staff not already reported in Senior Management
All figures refer to the 2020 calendar year. 4) Carried Interest paid by the UCITS No employee of the Management Company receives Carried Interest paid by any UCITS. 5) Remuneration Policy review The remuneration policy of DPAS is subject to an annual review, as a minimum. It was reviewed and updated in 2020. The remuneration policy of DPAS was approved by the Board of Management on 19 January 2021.

DPAM L
Additional information (unaudited) as at 31 December 2020
180
DEGROOF PETERCAM ASSET MANAGEMENT S.A.
- Total amount of compensation for the year: Total paid by the
management company and the UCI to its staff
Number of beneficiaries
Other amount paid directly by the UCI
Performance fees
Fixed remuneration
12,349,326 € 157 / /
Variable remuneration
3,763,862 € 129 / /
- Aggregate amount of remuneration Identified Staff 7,865,397 €
Portfolio managers 4,774,336 €
- Description of how compensation and benefits were calculated This information is available in the Remuneration Policy established by Degroof Petercam Asset Management. The Remuneration Policy is available on the website www.dpamfunds.com (tab Regulatory information - 'Remuneration policy'). - Results of assessments in the annual review by the management company of the general principles of the remuneration policy and their implementation The annual review of the compensation policy has not led to the adoption of a new Remuneration Policy. - Significant change to the remuneration policy adopted The Remuneration Policy approved by the Board of Directors of the Management Company on February 14, 2017 was not amended in 2020. Details of the Remuneration Policy, including the composition of the Remuneration Committee, can be accessed via the website www.dpamfunds.com (Regulatory information tab - 'Remuneration policy').
DEGROOF PETERCAM MANAGEMENT FRANCE Gross remuneration as at 31 December 2019
Total gross remuneration paid in 2019 and number of employees concerned
*1.183.193,00
13 salariés et 2 stagiaires chargés (inclut Entheca 2S19)
Total gross amount of bonuses paid in 2019 278.021,00 Primes versées sur 2019 sur l'activité de 2018
Total gross remuneration for identified staff 384.832,00
Breakdown of gross remuneration between : N'inclut pas de stagiaire
Executive 1.096.671,00
Non-executive 77.433,00
* EUR 278.021,00 inclus

DPAM L
Additional information (unaudited) as at 31 December 2020
181
Transparency of securities financing transactions and reuse:
In accordance with Article 13 and Section A of the Annex to Regulation EU 2015/2365 (hereinafter the "Regulation"), the SICAV must inform investors of its use of securities financing transactions and total return swaps in the annual and semi-annual reports. The portfolio does not contain any assets on loan as of the date of this report.