Downtown Palo Alto Commute Survey
38
Palo Alto TMA Steering Committee Meeting #4: Thursday, June 18, 2015
-
Upload
paloaltoforward -
Category
Government & Nonprofit
-
view
201 -
download
0
Transcript of Downtown Palo Alto Commute Survey
Palo Alto TMA Steering Committee
Meeting #4: Thursday, June 18, 2015
Agenda
I. Welcome and introductions
II. Meeting purpose
III. Presentation of Data
A. Business Registry
B. Downtown Employee Mode Split Survey
IV. Discussion: How Does Data Inform TMA
Activities/Pilot Ideas?
V. Action Item: Approve Mission Statement
VI. Information: VTA Proposed Sales Tax
VII. Next Steps
VIII.Public Comments
City of Palo Alto Business
Registry
Downtown Employee Mode
Split Survey

1,173 surveys conducted with employees at businesses located within an area of
Downtown Palo Alto bound by El Camino Real, Webster Street, Everett Avenue, and
Forest Avenue.
The survey participation rate was 44%, which represents the total number of
completed surveys compared to the total number of employees at participating
businesses. The overall response rate was 12%, which represents the total number of
completed surveys compared to the total number of employees in Downtown Palo Alto.
A stratified random sample of worksites was pulled by worksite size, including small,
medium and large businesses. Sampled worksites were contacted directly to identify
and recruit an onsite survey coordinator who distributed the surveys to all employees
at their respective worksites.
The survey was offered in online and paper formats for employees of businesses with
5 or more employees, and was conducted by telephone with employees of businesses
with 4 or fewer employees.
Data collection began May 4th and ended the week of May 25th. Each respondent was
asked commute mode questions for one calendar week previous to the date on which
they took the survey.
Methodology

Downtown Palo Alto For this study, Downtown Palo Alto was defined as the area bound by El Camino
Real, Webster Street, Everett Avenue, and Forest Avenue.
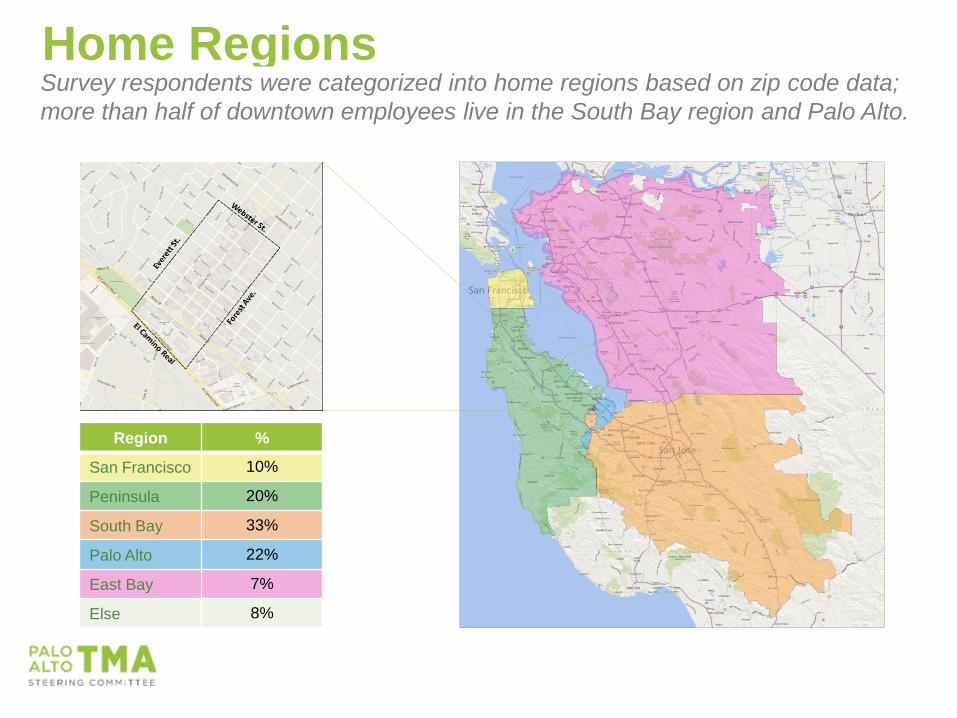
Home Regions Survey respondents were categorized into home regions based on zip code data;
more than half of downtown employees live in the South Bay region and Palo Alto.
Region %
San Francisco 10%
Peninsula 20%
South Bay 33%
Palo Alto 22%
East Bay 7%
Else 8%
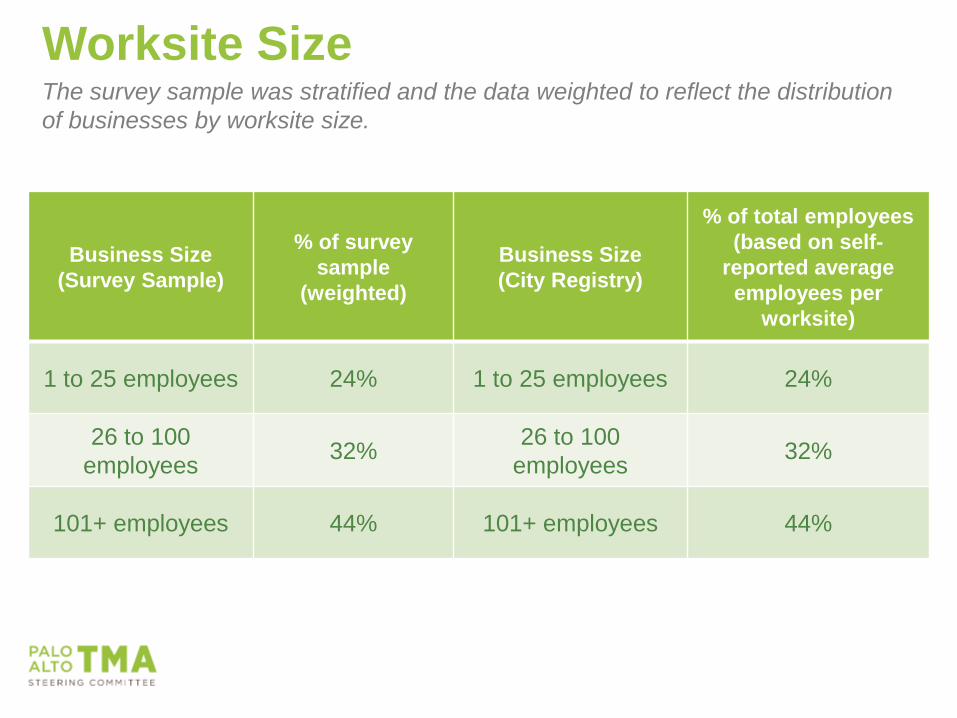
Worksite Size The survey sample was stratified and the data weighted to reflect the distribution
of businesses by worksite size.
Business Size
(Survey Sample)
% of survey
sample
(weighted)
Business Size
(City Registry)
% of total employees
(based on self-
reported average
employees per
worksite)
1 to 25 employees 24% 1 to 25 employees 24%
26 to 100
employees 32%
26 to 100
employees 32%
101+ employees 44% 101+ employees 44%
Modes of Transportation
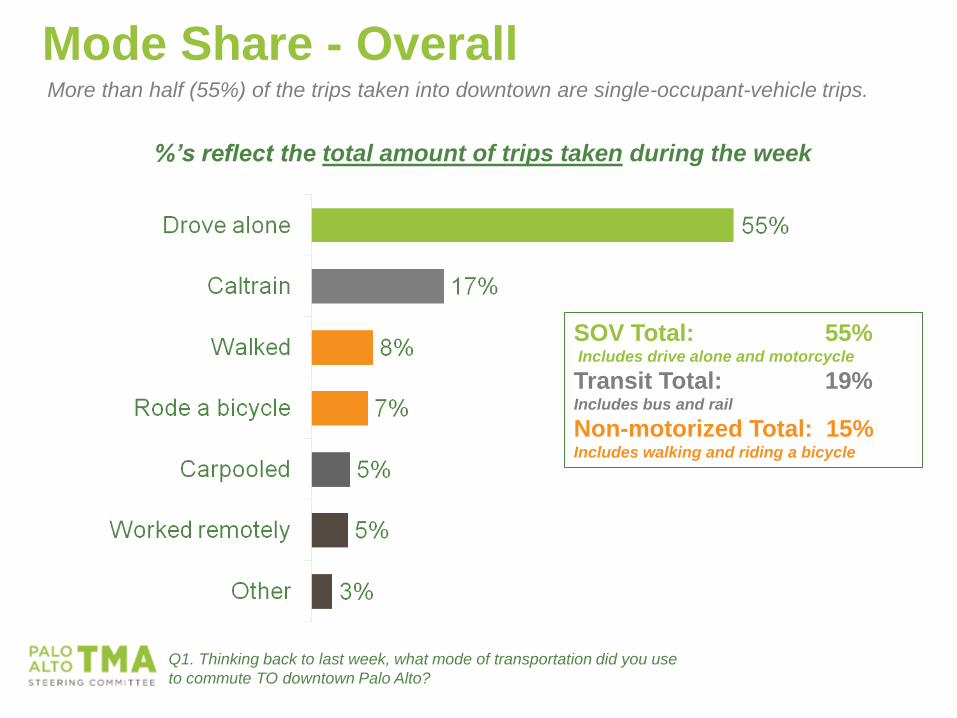
Mode Share - Overall More than half (55%) of the trips taken into downtown are single-occupant-vehicle trips.
Q1. Thinking back to last week, what mode of transportation did you use
to commute TO downtown Palo Alto?
SOV Total: 55% Includes drive alone and motorcycle
Transit Total: 19% Includes bus and rail
Non-motorized Total: 15% Includes walking and riding a bicycle
%’s reflect the total amount of trips taken during the week
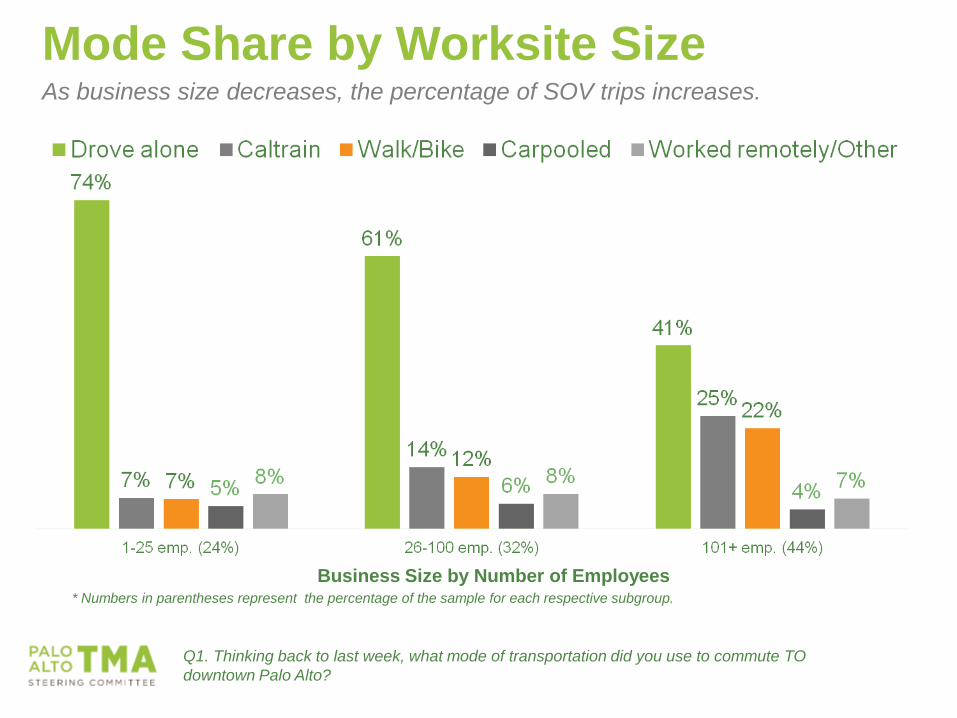
Mode Share by Worksite Size As business size decreases, the percentage of SOV trips increases.
Q1. Thinking back to last week, what mode of transportation did you use to commute TO
downtown Palo Alto?
Business Size by Number of Employees * Numbers in parentheses represent the percentage of the sample for each respective subgroup.

Mode Share by Self-Reported Commute Distance As the distance from Downtown increases, mode shifts toward transit.
Q1. Thinking back to last week, what mode of transportation did you use to
commute TO downtown Palo Alto?
Distance Traveled in Miles (self-reported)
Average Distance Traveled:
Overall = 15.8 miles | SOV = 15.9 miles | Transit = 23.5 miles
*Numbers in parentheses represent the percentage of the sample for each respective subgroup.

Mode Share by Home Geography Commuters from San Francisco are the least likely to drive.
Q1. Thinking back to last week, what mode of transportation did you use to
commute TO downtown Palo Alto?
Refused to report=8% * Numbers in parentheses represent the percentage of the sample for each respective subgroup.
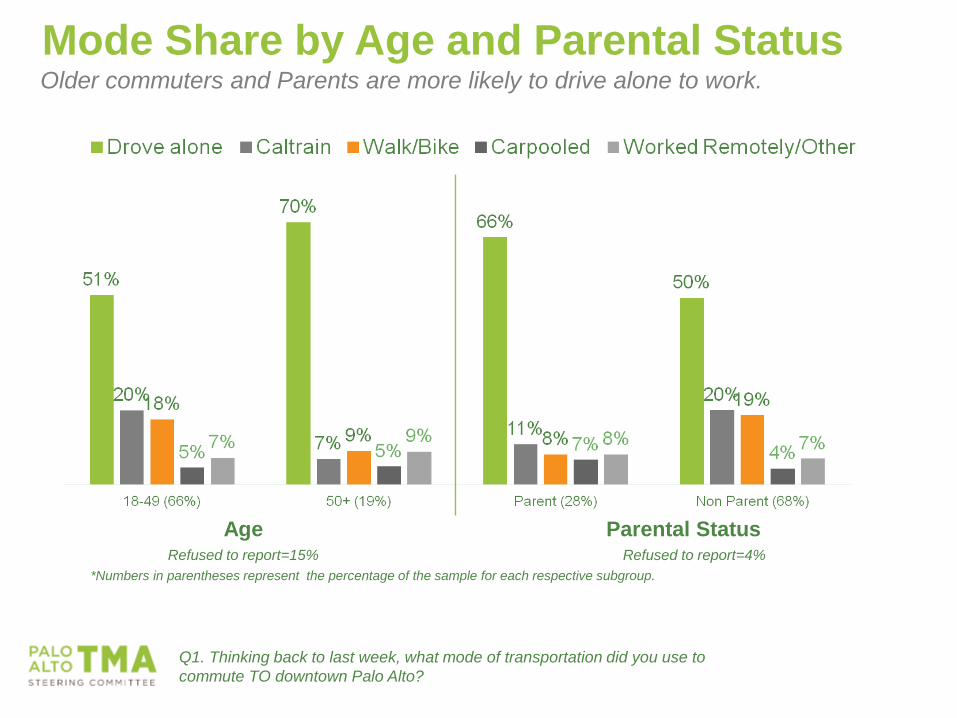
Mode Share by Age and Parental Status Older commuters and Parents are more likely to drive alone to work.
Q1. Thinking back to last week, what mode of transportation did you use to
commute TO downtown Palo Alto?
Age Parental Status Refused to report=15% Refused to report=4%
*Numbers in parentheses represent the percentage of the sample for each respective subgroup.
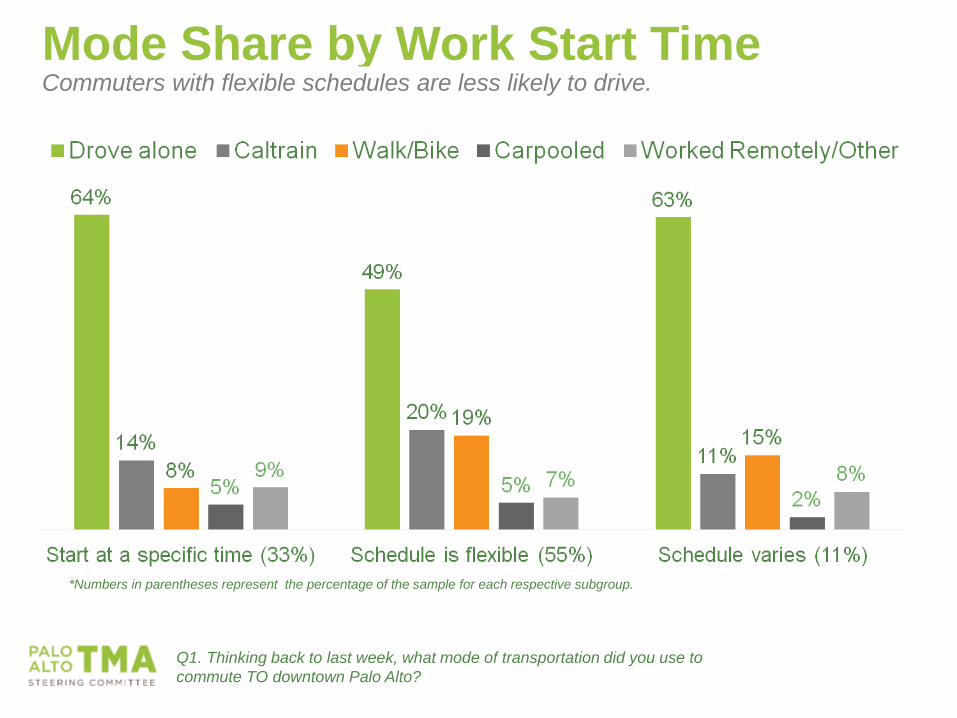
Mode Share by Work Start Time Commuters with flexible schedules are less likely to drive.
Q1. Thinking back to last week, what mode of transportation did you use to
commute TO downtown Palo Alto?
*Numbers in parentheses represent the percentage of the sample for each respective subgroup.

Mode Share by Job Status Part-time employees are more likely to drive.
Q1. Thinking back to last week, what mode of transportation did you use to
commute TO downtown Palo Alto?
* Numbers in parentheses represent the percentage of the sample for each respective subgroup.
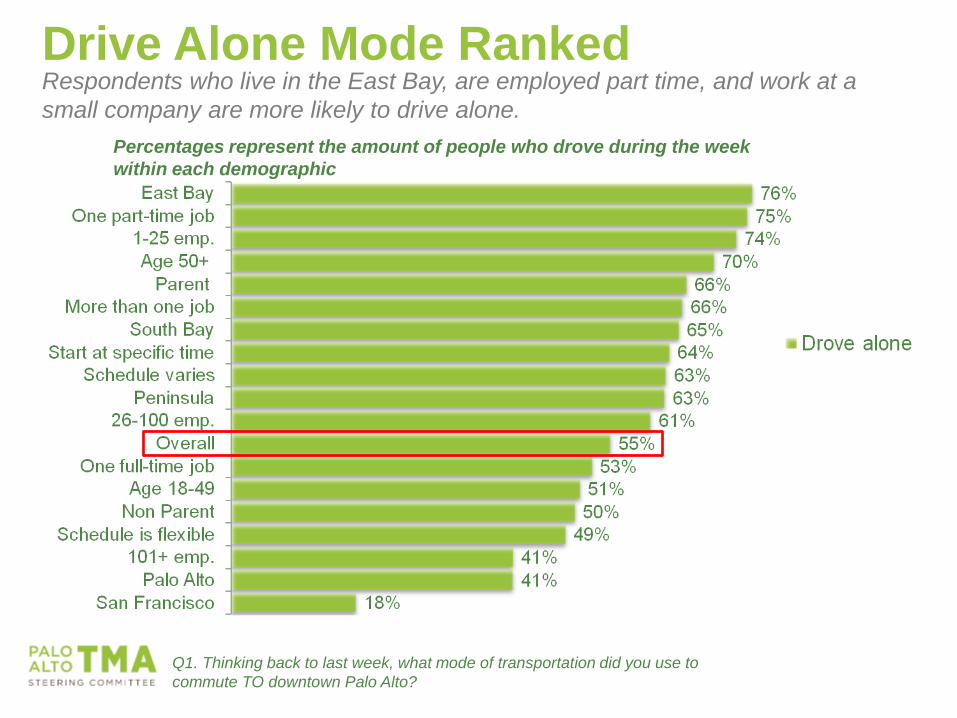
Drive Alone Mode Ranked Respondents who live in the East Bay, are employed part time, and work at a
small company are more likely to drive alone.
Q1. Thinking back to last week, what mode of transportation did you use to
commute TO downtown Palo Alto?
Percentages represent the amount of people who drove during the week
within each demographic
Transportation Attitudes

Driving Attitudes Two-thirds (67%) of drivers say they prefer to drive and plan on continuing to do so.
Q10-Q20. Please indicate whether you strongly agree, somewhat agree, somewhat
disagree, or strongly disagree with each of the following statements.
Among SOV Drivers, 772n
42%
35%
27%
23%
13%
24%
25%
23%
20%
22%
67%
60%
50%
44%
35%
I prefer to drive to work and plan on continuing to do so.
I need to drive to work because I make other stops, such as for school, kids, or other
errands, before or after work.
I would rather not drive to work, but I have no other good options.
I need to drive to work because I use my car for meetings, deliveries, or other work-related
tasks.
I would take a carpool or vanpool to work if it was convenient, safe, and easy to find.
Strongly agree
Somewhat agree
TotalAgree
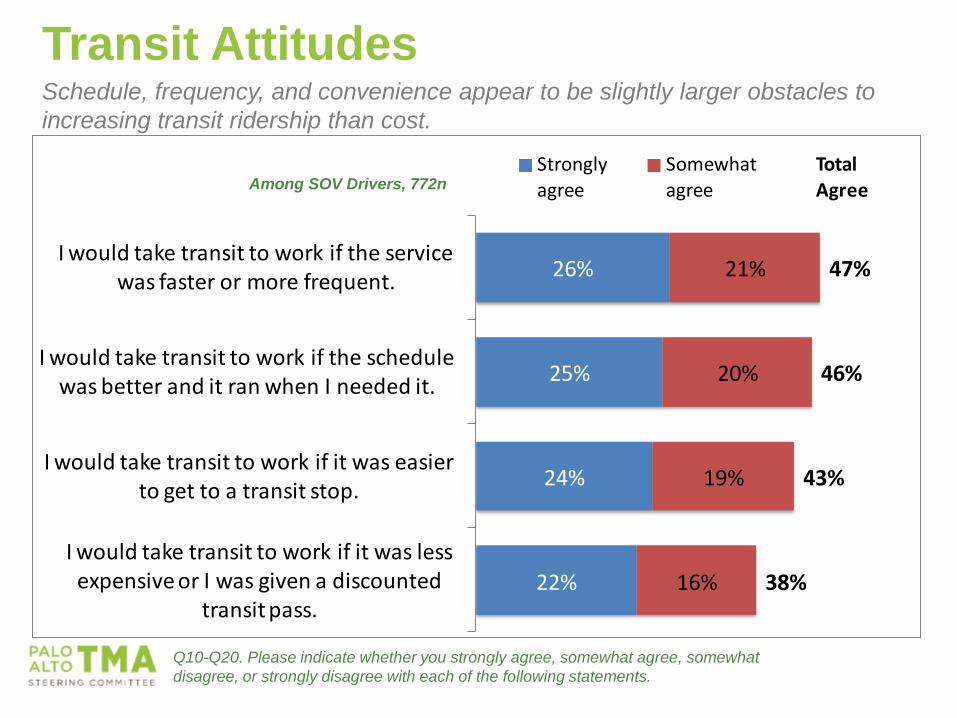
Transit Attitudes Schedule, frequency, and convenience appear to be slightly larger obstacles to
increasing transit ridership than cost.
Q10-Q20. Please indicate whether you strongly agree, somewhat agree, somewhat
disagree, or strongly disagree with each of the following statements.
26%
25%
24%
22%
21%
20%
19%
16%
47%
46%
43%
38%
I would take transit to work if the service was faster or more frequent.
I would take transit to work if the schedule was better and it ran when I needed it.
I would take transit to work if it was easier to get to a transit stop.
I would take transit to work if it was less expensive or I was given a discounted
transit pass.
Strongly agree
Somewhat agree
Total AgreeAmong SOV Drivers, 772n

Agree: Would Rather Not Drive Drivers who feel they have no other good options believe transit will not fit their
schedule or is not convenient for them.
Q10-Q20. Please indicate whether you strongly agree, somewhat agree, somewhat
disagree, or strongly disagree with each of the following statements.
Among the 50% of SOV Drivers who would prefer not to
drive but feel they have no other good options.
I would take transit if service was faster/more frequent 63%
I would take transit if the schedule was better/it ran when I need it 61%
I would take transit if it was easier to get to a stop 59%
I would take transit if it was less expensive or I received a
discounted pass 47%
Agree
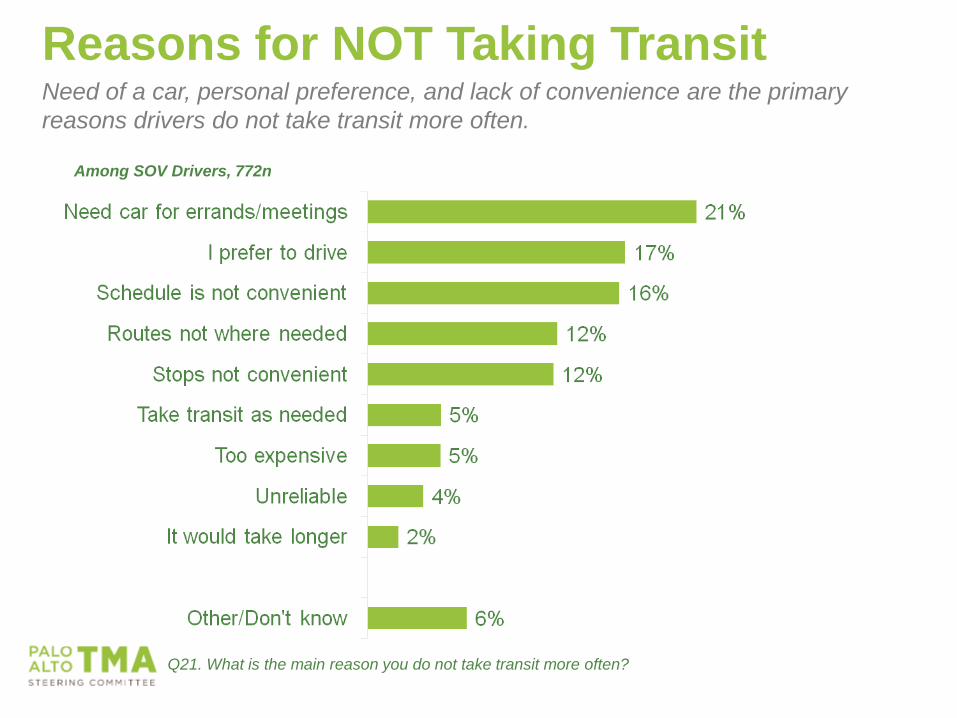
Reasons for NOT Taking Transit Need of a car, personal preference, and lack of convenience are the primary
reasons drivers do not take transit more often.
Q21. What is the main reason you do not take transit more often?
Among SOV Drivers, 772n

Biking and Walking Attitudes Better routes and better parking/storage options appear to be a factor for some
commuters who potentially live close enough to walk or bike to work.
Q10-Q20. Please indicate whether you strongly agree, somewhat agree, somewhat
disagree, or strongly disagree with each of the following statements.
23%
16%
17%
16%
40%
32%
I would walk or bike to work if there were better
paths, trails, and sidewalks.
I would bike to work if there was better parking or storage options for my bike
at my work location.
Strongly agree
Somewhat agree
Total Agree
Among respondents who live within
a 3 mile radius of Downtown Palo
Alto, 326n
%’s reflect the total amount of trips taken
during the week among those who live within a
3 mile radius

Parking
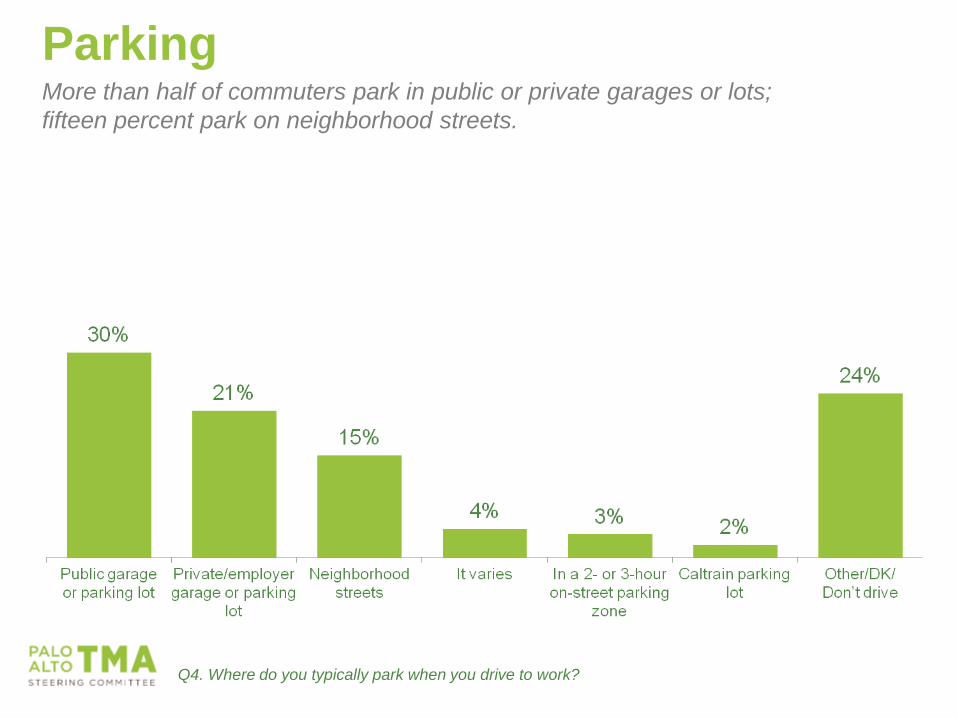
Parking More than half of commuters park in public or private garages or lots;
fifteen percent park on neighborhood streets.
Q4. Where do you typically park when you drive to work?

Parking by Worksite Size Commuters who park on neighborhood streets are most likely to work for a
medium-sized business.
Q4. Where do you typically park when you drive to work?
Business Size by Number of Employees
Commuter Segmentations
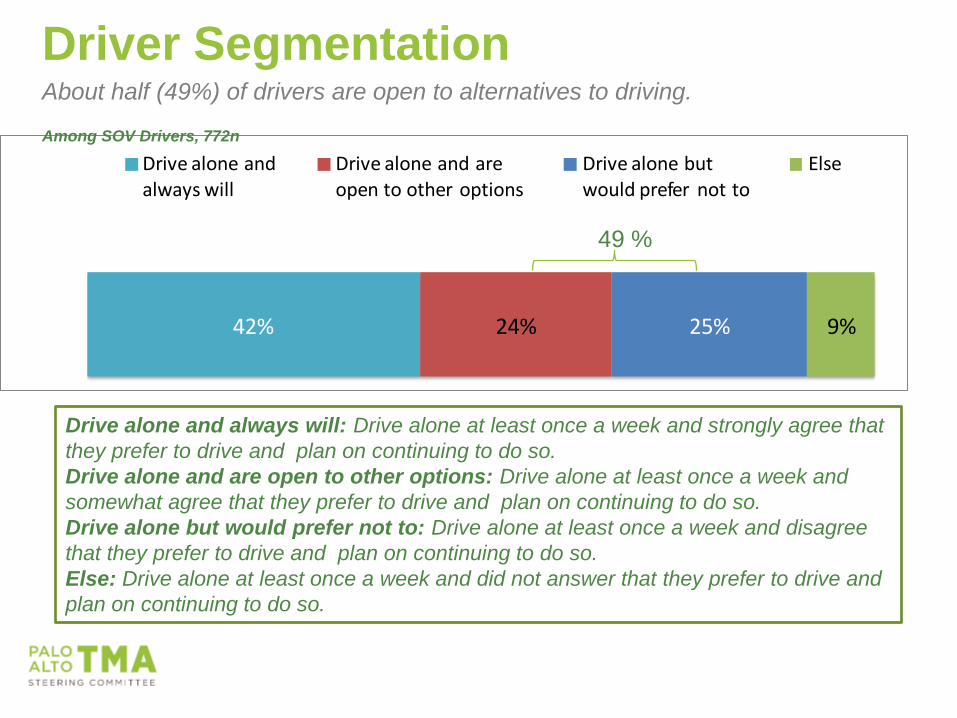
Driver Segmentation About half (49%) of drivers are open to alternatives to driving.
42% 24% 25% 9%
Drive alone and always will
Drive alone and are open to other options
Drive alone but would prefer not to
Else
Drive alone and always will: Drive alone at least once a week and strongly agree that
they prefer to drive and plan on continuing to do so.
Drive alone and are open to other options: Drive alone at least once a week and
somewhat agree that they prefer to drive and plan on continuing to do so.
Drive alone but would prefer not to: Drive alone at least once a week and disagree
that they prefer to drive and plan on continuing to do so.
Else: Drive alone at least once a week and did not answer that they prefer to drive and
plan on continuing to do so.
Among SOV Drivers, 772n
49 %

Demographics That Are Most Likely to Change Habits
Drivers in San Francisco, who work for a large company, have flexible work
schedules and are younger are more likely to consider other transportation
options. % of SOV drivers who would prefer not to drive, by demos

Conclusions
Conclusions
Currently just more than half (55%) of employee trips into Downtown Palo Alto are SOV trips.
• Nearly half (49%) of these SOV drivers expressed an interest in seeking alternative transportation options.
• Those most likely to seek alternative options are more likely to be younger, work for large companies (101+ employees), live more than 10 miles from Palo Alto, and have a flexible work schedule.
• They have concerns about transit as an alternative, with primary concerns being a real or perceived lack of convenience for routes, schedules, and locations of stops. Cost is also a concern for some.

Contact Information
Tom Patras
614.827.9677
Sara LaBatt
510.550.8924
Doug MacDowell
614.827.9673

Open Discussion:
How Does Data Inform Our
Activities? • What programs would be most helpful to YOUR
business?
• What’s hurting your ability to function better? What
are your transportation-related ‘problem
statements’?
• What do you see as the greatest opportunities to
move the needle in the short-term?
• What would a program designed for your business
look like?
• What might you be willing to support and fund?
• What role should the City play?

Palo Alto TMA
Mission Statement The Palo Alto TMA reduces Single Occupancy Vehicle (SOV) trips,
traffic congestion and demand for parking by delivering targeted
transportation solutions to the Downtown area’s diverse range of
employers, employees, visitors and residents. The TMA also
serves as a one-stop transportation information resource for the
broader community; it provides a forum for community dialogue,
and is an active voice in local and regional transportation issues.
While the primary focus of the TMA is the Downtown population
whose travel choices have the highest impacts, its programs and
services may extend beyond these constituents.
By encouraging and enabling more non-drive alone trips, the TMA
contributes to the overall quality of life both in Downtown and
throughout Palo Alto; it supports the City’s economic vitality and
helps achieve the City’s environmental goals.
Palo Alto TMA
Goals • Create and maintain a centralized source of information about
all available transportation alternatives
• Create and market options that encourage and enable
employees at all income levels to travel by non-SOV modes
• Leverage TMA membership to secure resources that improve
and increase the availability, affordability and quality of
transportation options and services
• Actively advocate for the development of local and regional
plans and policies that support TMA goals
• Work towards an 85% maximum occupancy for street,
garage/lot short term parking in order to maximize availability
for visitors and minimize circling/wait times
• Establish and grow an effective and sustainable organization
• Provide ongoing monitoring and evaluation; refine programs as
needed
Envision Silicon Valley
Proposed Sales Tax for
2016 Ballot
• Opportunities for Input
• Timing
Source: NHTS 2009
Next Steps
•Publish a State of the Commute
report
• Pilot Program Development
• Other
• Establish Next Meeting Dates
Thank you!