Downtown & Kalihi Draft TOD Framework Plans - Honolulu · 1 Downtown & Kalihi Draft TOD Framework...
25
1 Downtown & Kalihi Draft TOD Framework Plans February 2012 The framework plans, consisting of diagrams that are summarized here, will provide the fun- damental framework for development of the Downtown and Kalihi Neighborhood Transit- Oriented Development (TOD) Plans, which will guide development over the next 25 years. The plans synthesize feedback on the Emerging Vision articulated during the October 2011 workshops and advisory committee meetings. Community review and endorsement of the framework plans will provide direction for development of more detailed policies and stand- ards. Attached to this memo are the following maps and graphics: DOWNTOWN TOD PLANNING AREA FIGURES x Figure 1: Concept describes the vision for the Downtown TOD Planning Area, including generalized land uses, with Downtown Honolulu shown as the region’s premier employ- ment center, a revitalized Aloha Tower complex, a vibrant, historic Chinatown, and a new high intensity mixed-used Iwilei district as an extension of Downtown and transition to Kalihi. An accessible and activated waterfront, featuring a promenade that links uses and stations and improving pedestrian and bicycle circulation. x Figure 2: Existing Land Use illustrates existing land use in the Planning Area and is shown for comparison purposes. x Figure 3: Framework Plan Land Use illustrates proposed land use designations, which are defined in the following section in Table 1. The Downtown and Chinatown stations maintain mixed use designations, but the Iwilei station is transformed from its current in- dustrial mixed use designation (which only permits incidental residential uses) to a new “Urban Mixed Use” designation which permits a wider range of uses, such as medium- and high-density residential, retail and office. x Figure 4: Existing Maximum Building Intensity illustrates existing allowable maximum building intensity, according to the Land Use Ordinance, measured as floor-area ratio (FAR), which expresses the ratio of building square footage to land square footage. (For example, an FAR of 5.0 means that for every square foot of land, a developer may build five square feet of building area. However, this does not necessitate a five-story building that covers the entire site. A ten story building that covers half of the site—among other options—would also be permitted.) x Figure 5: Framework Plan Maximum Building Intensity illustrates proposed maximum building intensities. The highest intensities in the framework plan are located Downtown in the central business district. The Iwilei station area contains the next highest intensities and represents the most substantial change over existing regulations. x Figure 6: Existing Maximum Building Heights illustrates existing allowable maximum building heights, according to the Land Use Ordinance, including Special District require- ments. x Figure 7: Framework Plan Maximum Building Heights illustrates proposed maximum building heights. The tallest building heights will continue to be located in the Downtown
Transcript of Downtown & Kalihi Draft TOD Framework Plans - Honolulu · 1 Downtown & Kalihi Draft TOD Framework...
1
Downtown & Kalihi Draft TOD Framework Plans February 2012
The framework plans, consisting of diagrams that are summarized here, will provide the fun-damental framework for development of the Downtown and Kalihi Neighborhood Transit-Oriented Development (TOD) Plans, which will guide development over the next 25 years. The plans synthesize feedback on the Emerging Vision articulated during the October 2011 workshops and advisory committee meetings. Community review and endorsement of the framework plans will provide direction for development of more detailed policies and stand-ards. Attached to this memo are the following maps and graphics:
DOWNTOWN TOD PLANNING AREA FIGURES
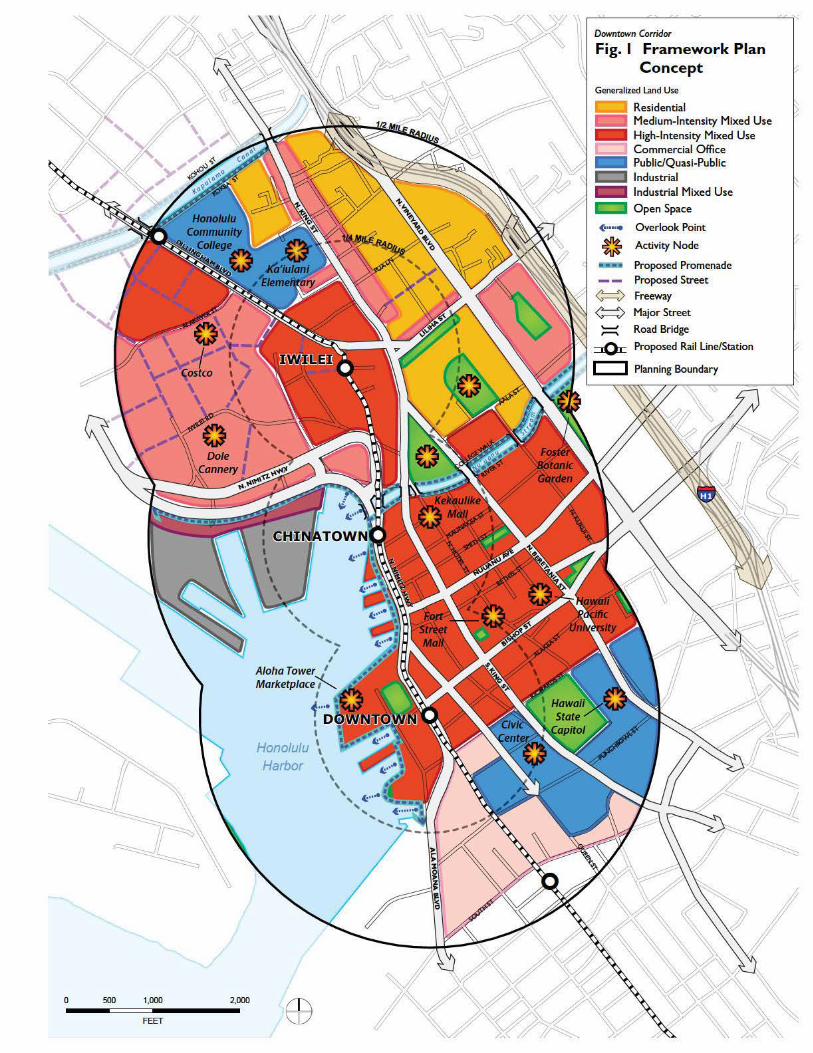
Figure 1: Concept describes the vision for the Downtown TOD Planning Area, including generalized land uses, with Downtown Honolulu shown as the region’s premier employ-ment center, a revitalized Aloha Tower complex, a vibrant, historic Chinatown, and a new high intensity mixed-used Iwilei district as an extension of Downtown and transition to Kalihi. An accessible and activated waterfront, featuring a promenade that links uses and stations and improving pedestrian and bicycle circulation.
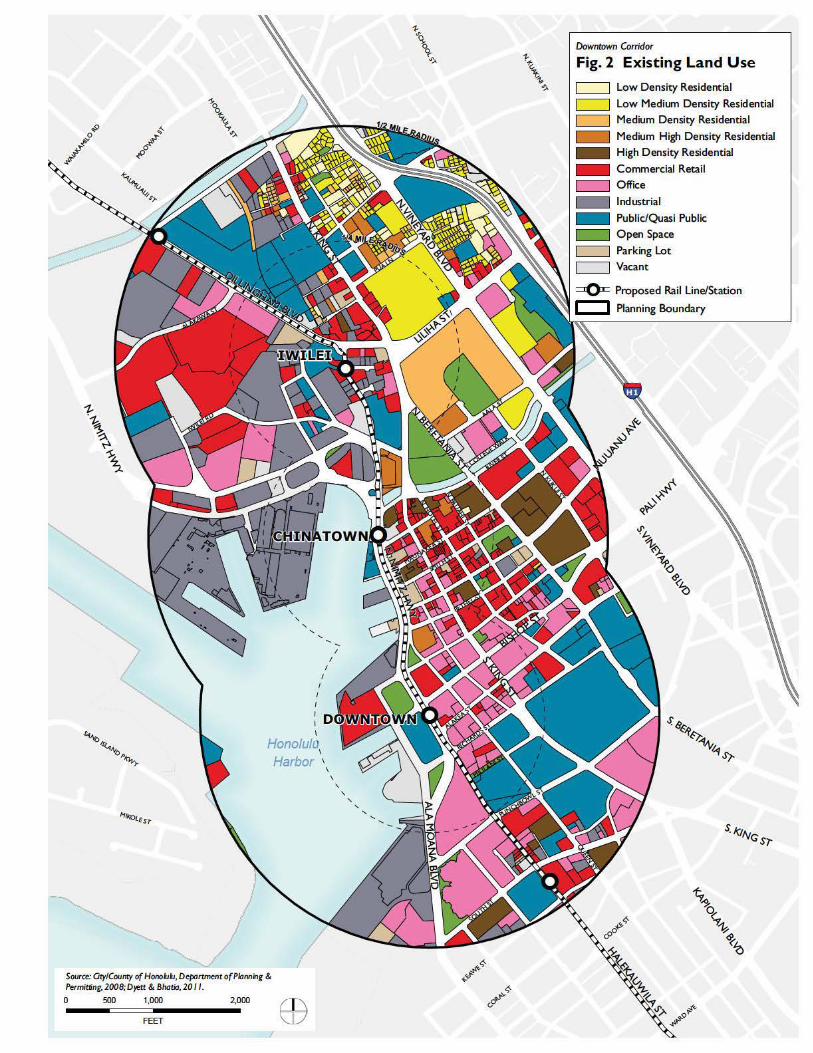
Figure 2: Existing Land Use illustrates existing land use in the Planning Area and is shown for comparison purposes.
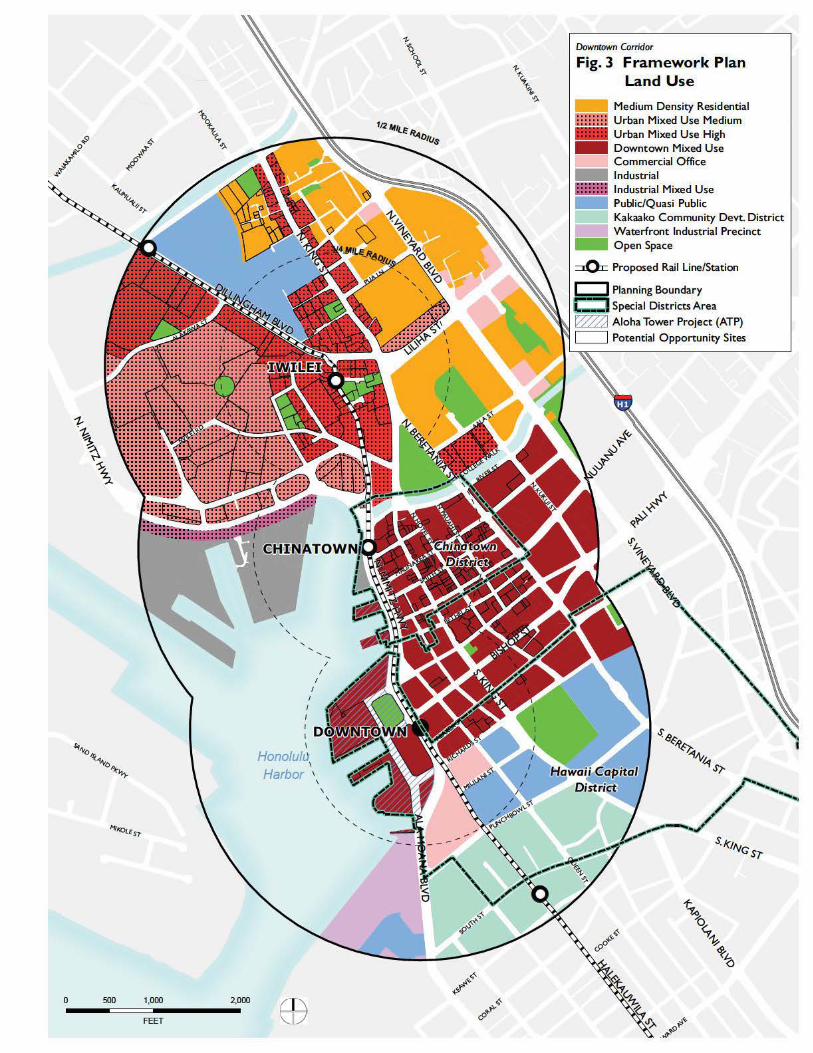
Figure 3: Framework Plan Land Use illustrates proposed land use designations, which are defined in the following section in Table 1. The Downtown and Chinatown stations maintain mixed use designations, but the Iwilei station is transformed from its current in-dustrial mixed use designation (which only permits incidental residential uses) to a new “Urban Mixed Use” designation which permits a wider range of uses, such as medium- and high-density residential, retail and office.
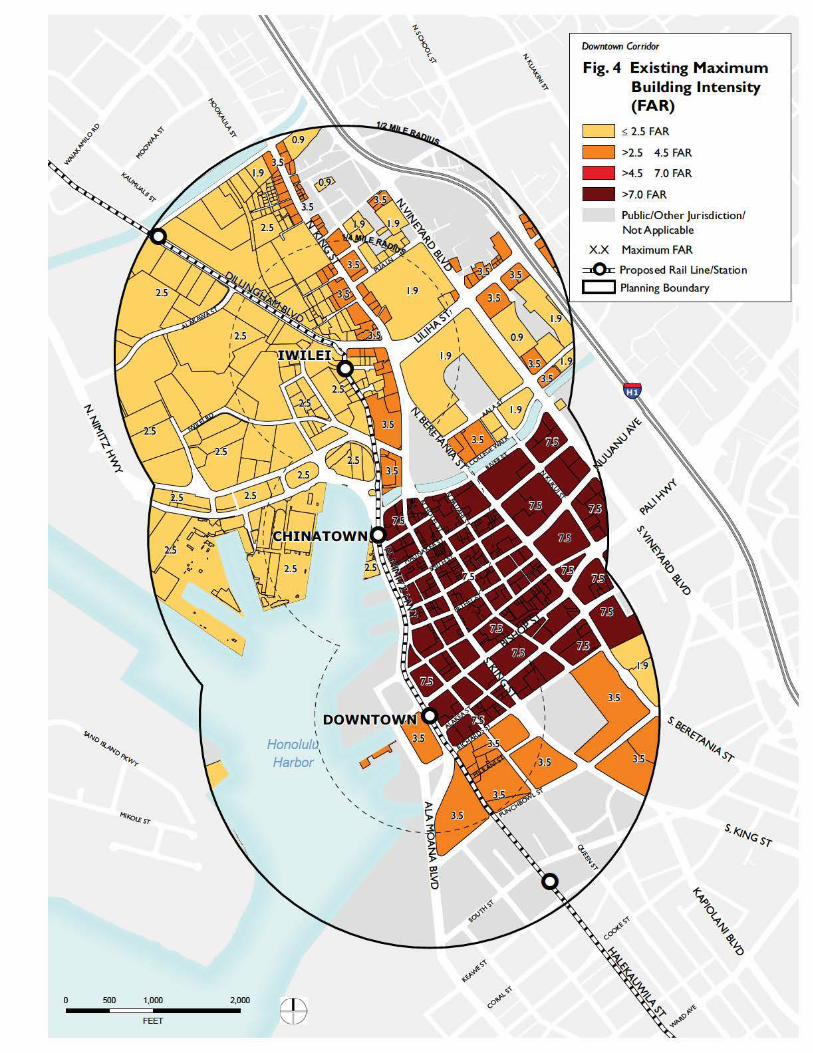
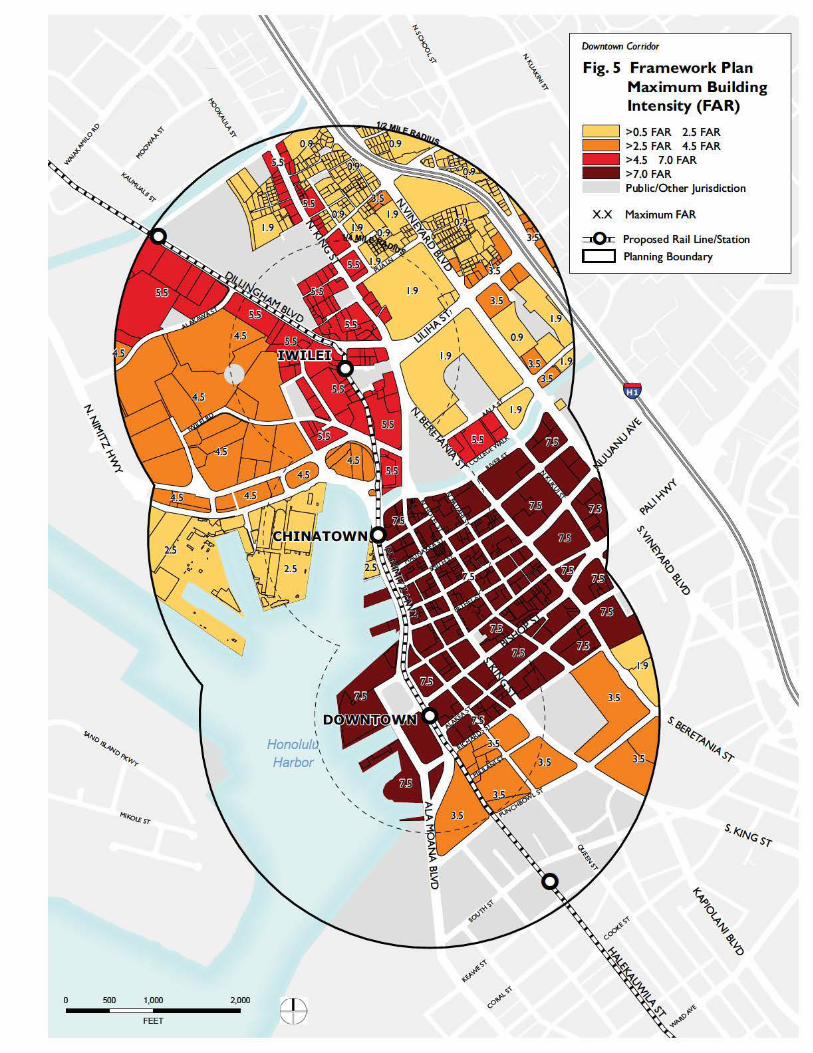
Figure 4: Existing Maximum Building Intensity illustrates existing allowable maximum building intensity, according to the Land Use Ordinance, measured as floor-area ratio (FAR), which expresses the ratio of building square footage to land square footage. (For example, an FAR of 5.0 means that for every square foot of land, a developer may build five square feet of building area. However, this does not necessitate a five-story building that covers the entire site. A ten story building that covers half of the site—among other options—would also be permitted.)
Figure 5: Framework Plan Maximum Building Intensity illustrates proposed maximum building intensities. The highest intensities in the framework plan are located Downtown in the central business district. The Iwilei station area contains the next highest intensities and represents the most substantial change over existing regulations.
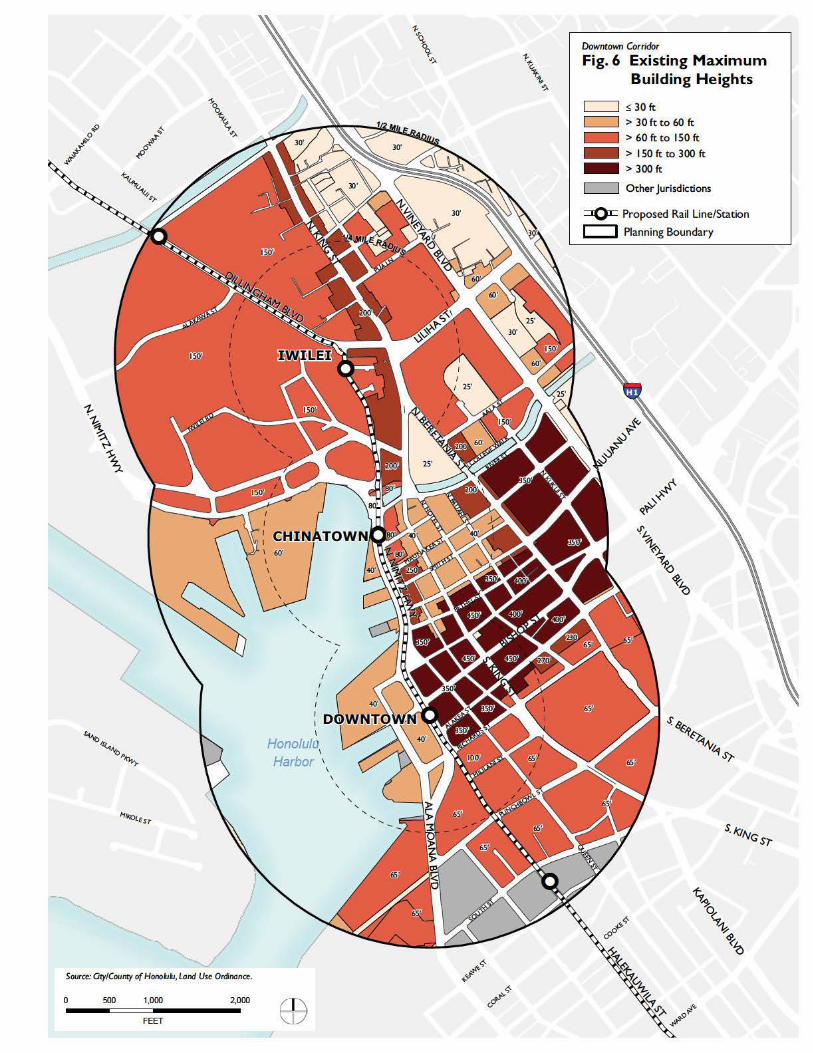
Figure 6: Existing Maximum Building Heights illustrates existing allowable maximum building heights, according to the Land Use Ordinance, including Special District require-ments.
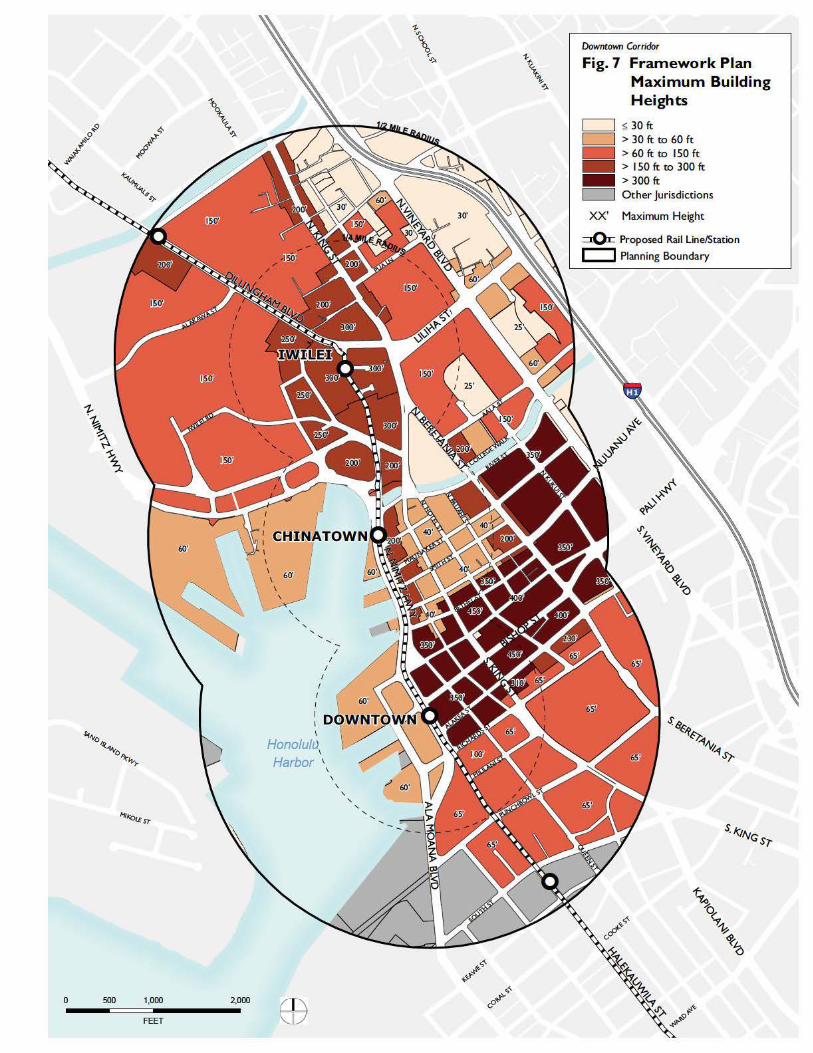
Figure 7: Framework Plan Maximum Building Heights illustrates proposed maximum building heights. The tallest building heights will continue to be located in the Downtown
2
core. Low building heights are shown in the Chinatown core and in the Capitol area, con-sistent with the existing requirements of those Special Districts. Taller heights are pro-posed along Nimitz Highway, immediately adjacent to the planned Chinatown station, and surrounding the Iwilei station, with heights stepping down makai of the station and toward the waterfront.
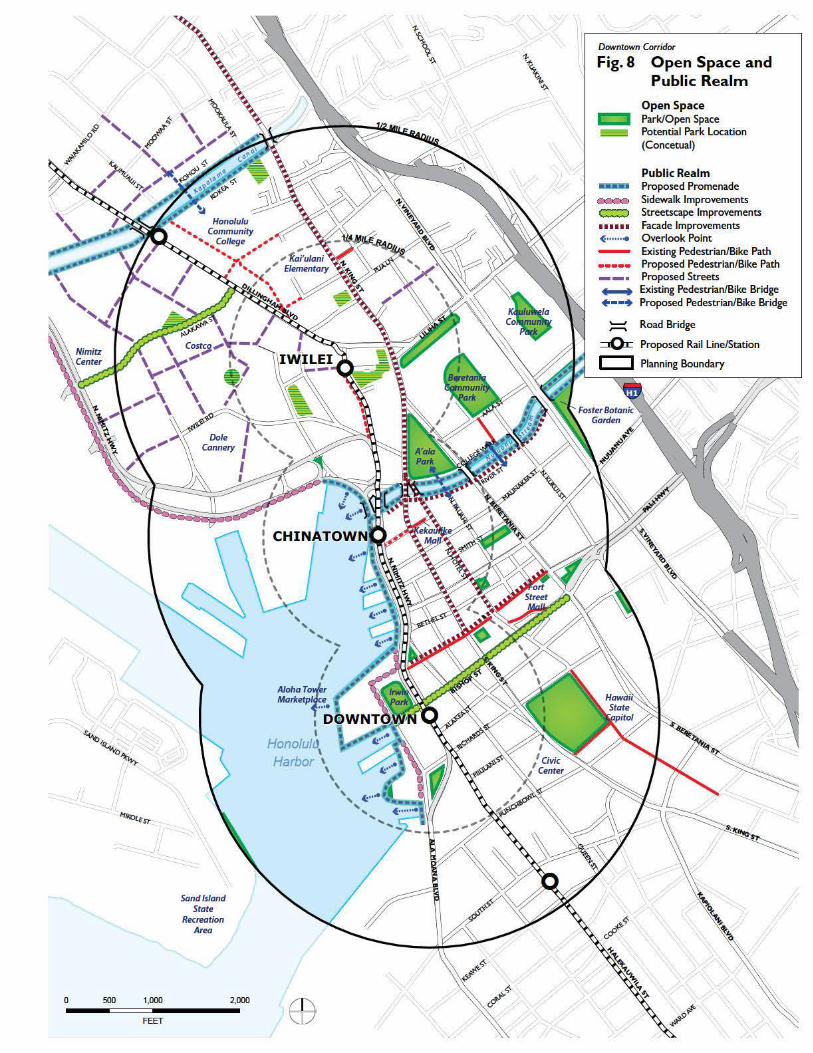
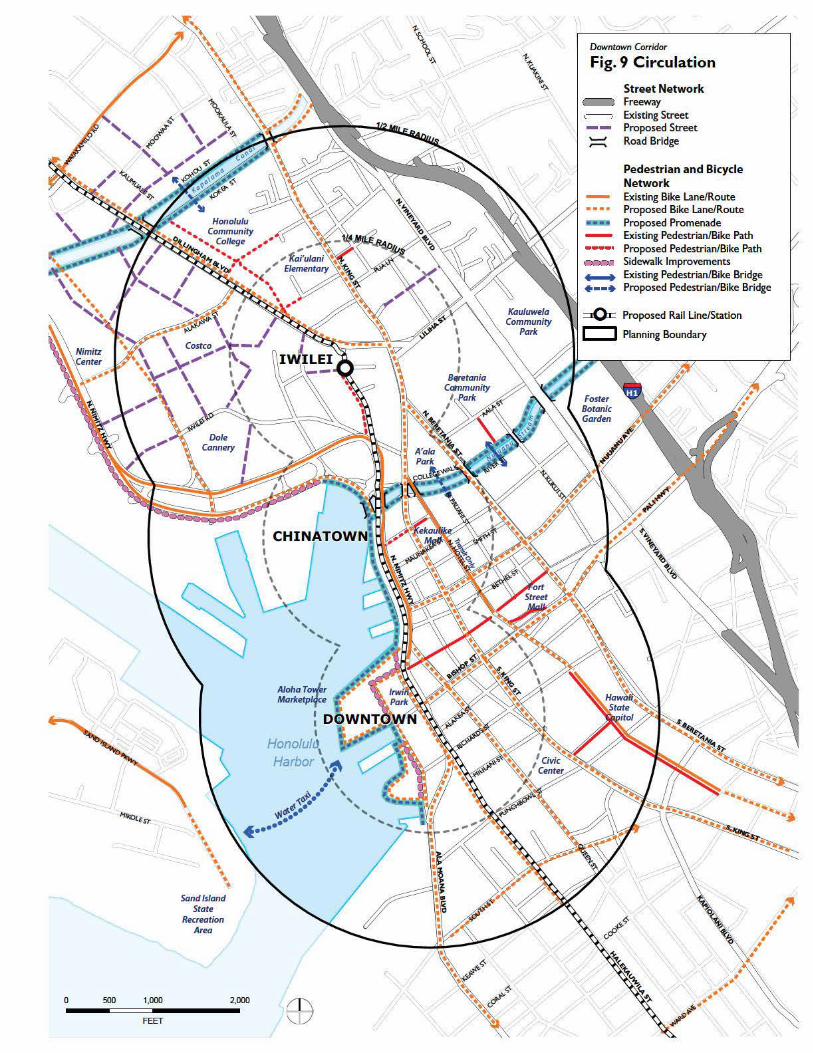
Figure 8: Open Space and Public Realm illustrates proposed existing and new open spaces in the Planning Area, including the redevelopment of Irwin Park and new parks to balance the proposed density of, and serve residents living and working within the Iwilei station. This diagram also shows a promenade along the Honolulu Harbor waterfront, providing an active recreation and walking/biking path and supporting access to destina-tions in and around the Aloha Tower complex.
Figure 9: Circulation depicts the proposed multi-modal transportation network. This in-cludes new streets (which generally follow existing property lines) that provide access to and within the redeveloped Iwilei station area; proposed bicycle routes (based on the Oahu Bike Master Plan); and pedestrian-only paths.
KALIHI TOD PLANNING AREA FIGURES
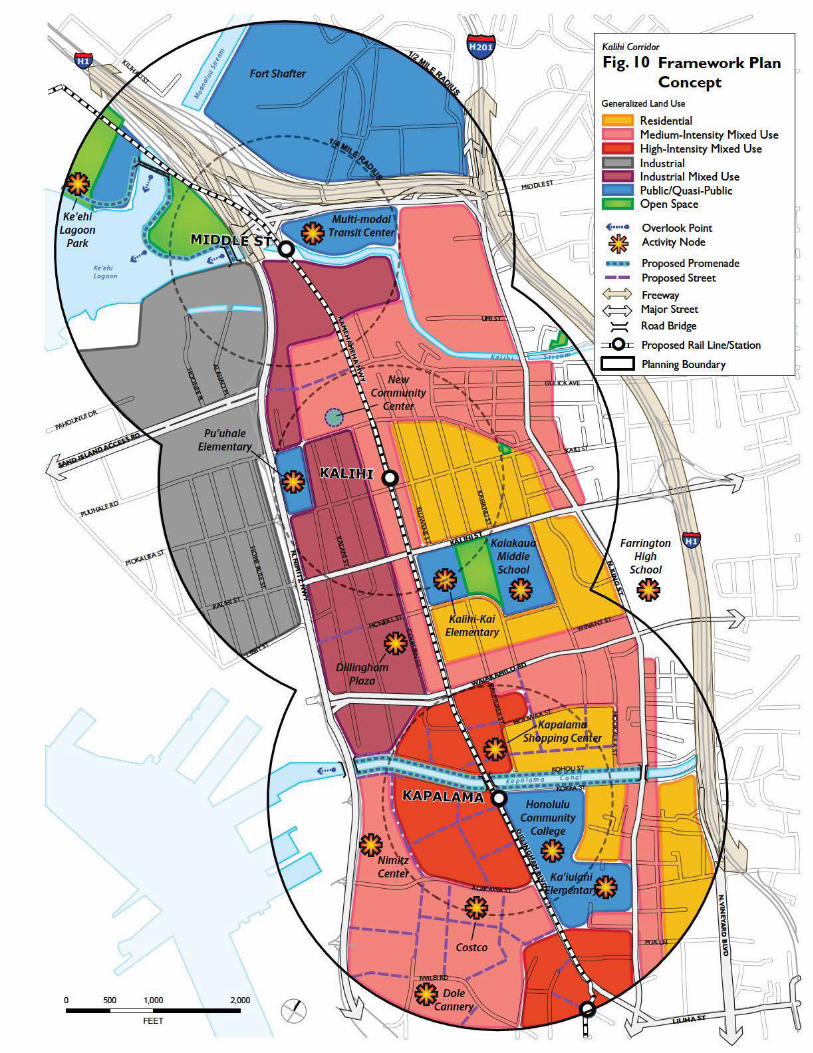
Figure 10: Concept shows the vision for the Kalihi TOD Planning Area, including gener-alized land uses for a revitalized district around Kapalama Station that features higher-intensity mixed-use development and capitalizes on the presence of Honolulu Community College. At the Kalihi station, diversity is maintained and enhanced through mixed-use de-velopment around the station including housing, commercial, education, and industrial us-es. The Middle Street area is identified as major multi-modal hub and—in the long-term—a revitalized district catalyzed by the possible transformation of Oahu Community Correc-tional Center (OCCC).
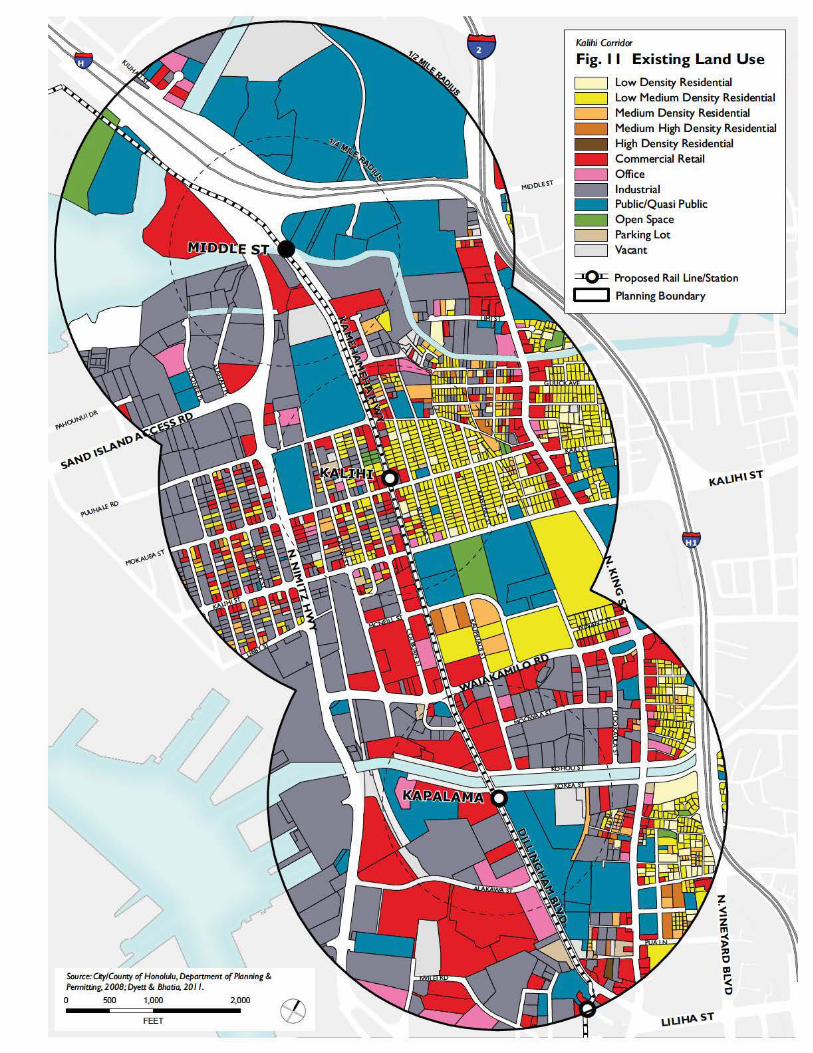
Figure 11: Existing Land Use illustrates existing land use in the Planning Area and is shown for comparison purposes.
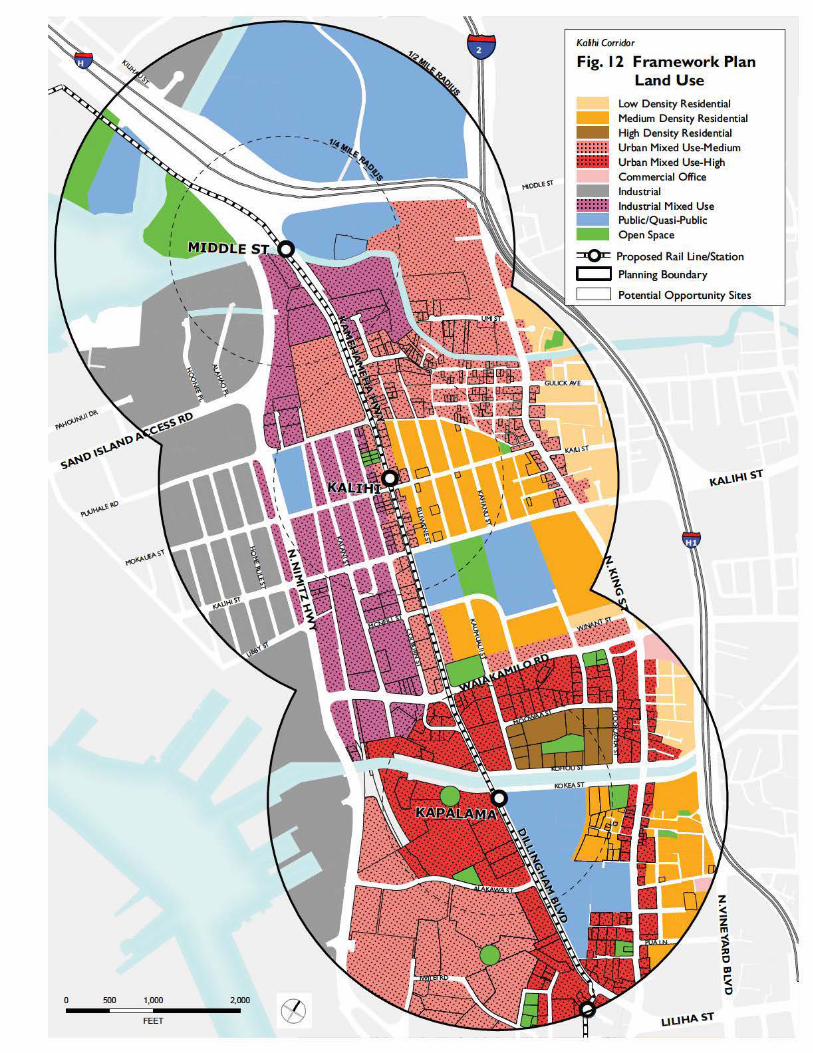
Figure 12: Framework Plan Land Use illustrates proposed land use designations, which are defined in the following section in Table 1. The most substantial land use changes are seen around Kapalama station, where new residential uses along the canal and a new mixed use district makai of the station are proposed. Around the Middle Street station, the Framework Plan maintains the industrial and commercial character, makai of the station, but allows for a greater mix of residential and commercial uses mauka of the station. One question for the Advisory Committee is whether the framework plan reflects the right mix of industrial/commercial use and residential neighborhood uses, particularly in the Bannis-ter Street/Gulick Avenue area and around Kalihi and Middle Street stations.
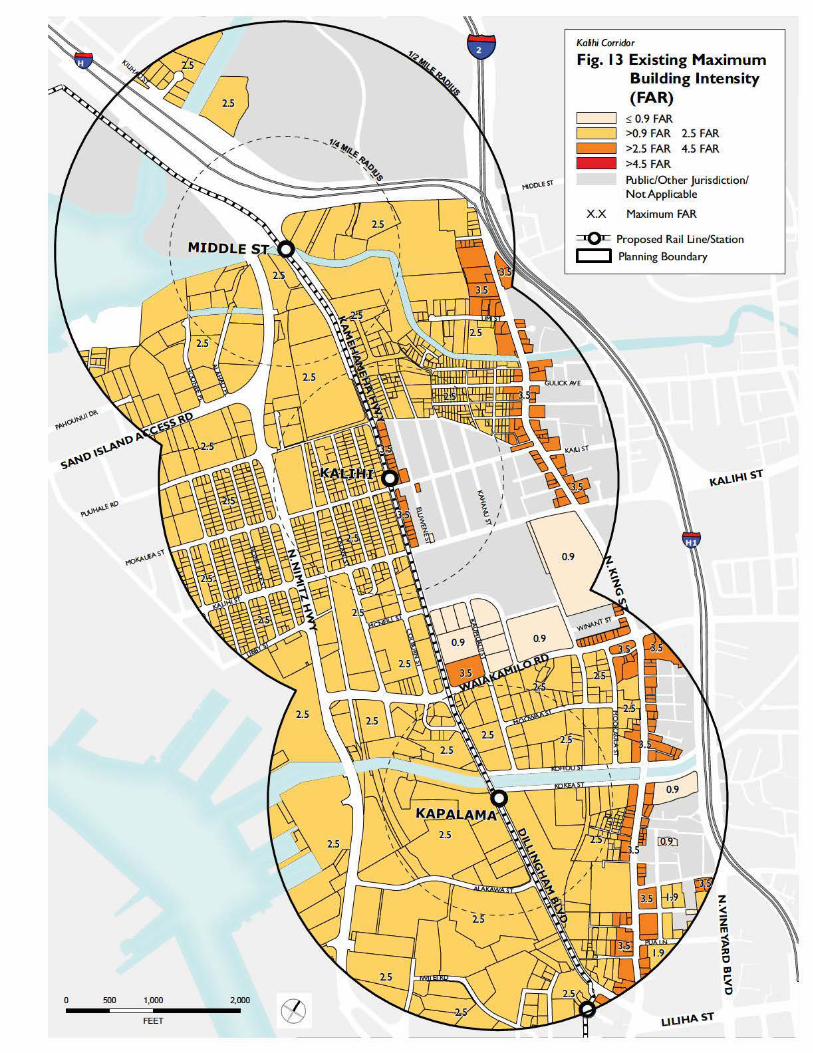
Figure 13: Existing Maximum Building Intensity illustrates existing allowable maxi-mum building intensity, according to the Land Use Ordinance, measured as FAR, which expresses the ratio of building square footage to land square footage.
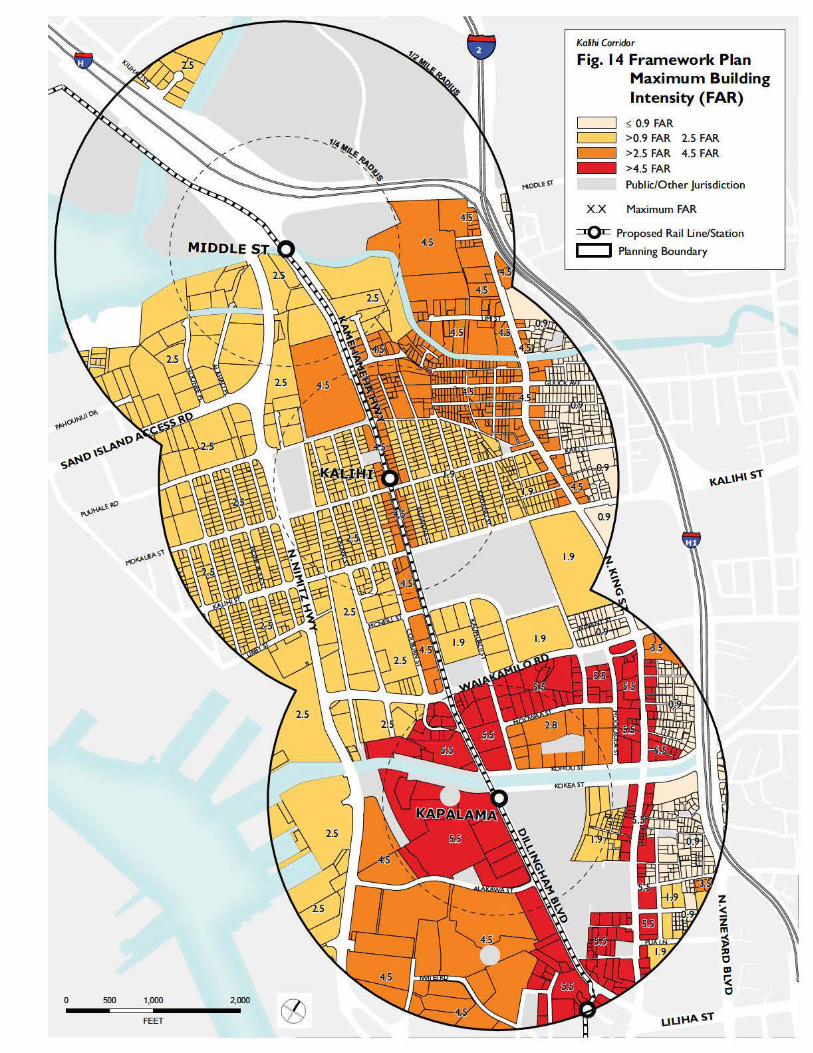
Figure 14: Framework Plan Maximum Building Intensity illustrates proposed maxi-mum building intensities. The highest intensities are proposed around Kapalama station. Moderate intensities are shown around Middle Street station, while the lowest intensities are depicted in the residential neighborhood mauka of the Kalihi station.
3
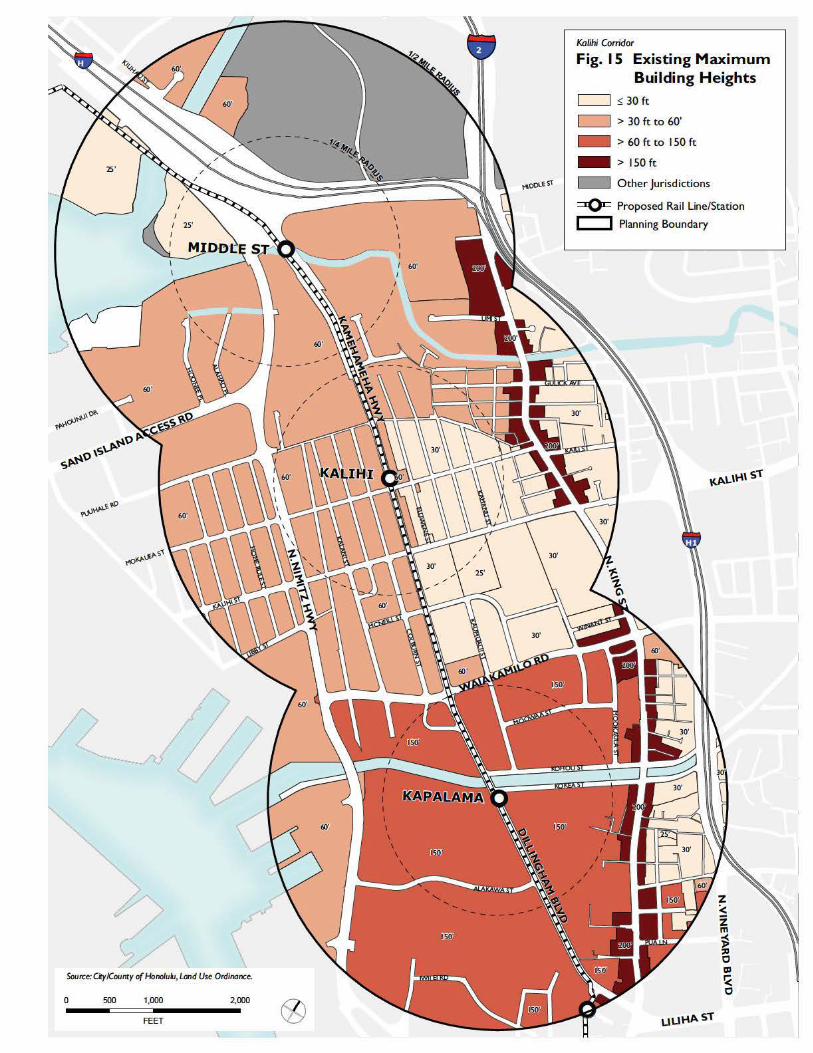
Figure 15: Existing Maximum Building Heights illustrates existing allowable maximum building heights, according to the Land Use Ordinance.
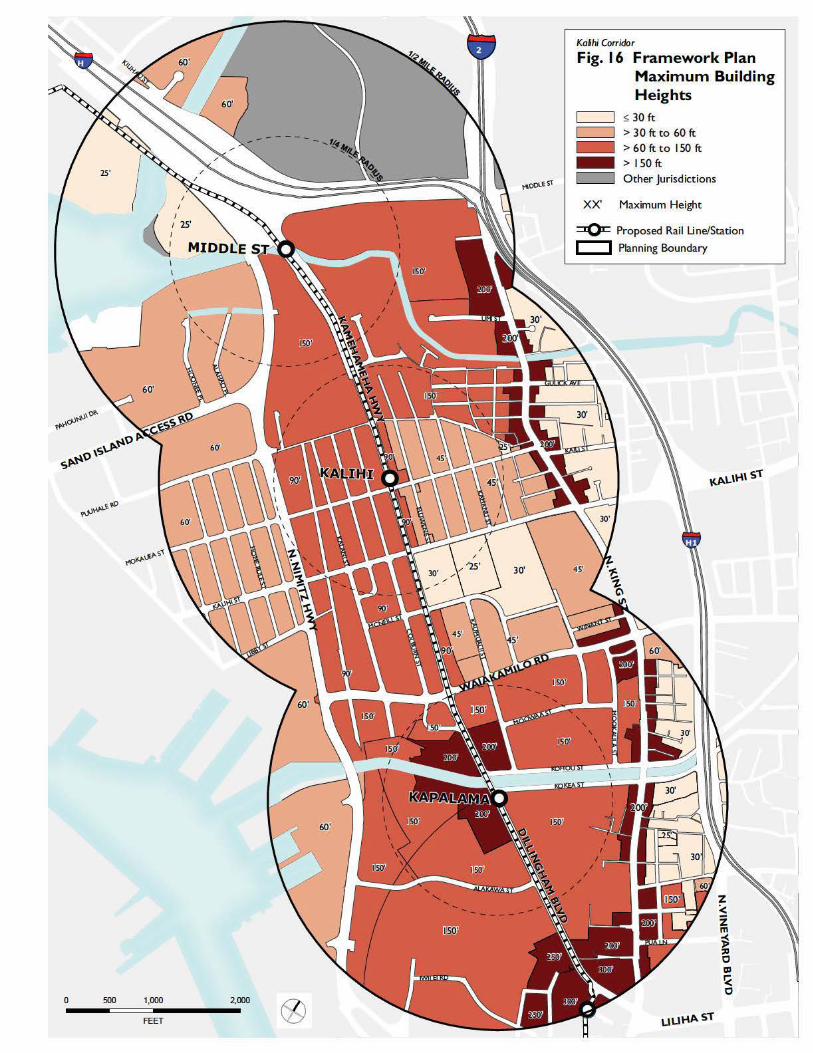
Figure 16: Framework Plan Maximum Building Heights illustrates proposed maximum building heights. The tallest building heights are proposed around Kapalama station, step-ping down away from the station and toward the waterfront. Building heights are also in-creased around Middle Street station where new uses are proposed.
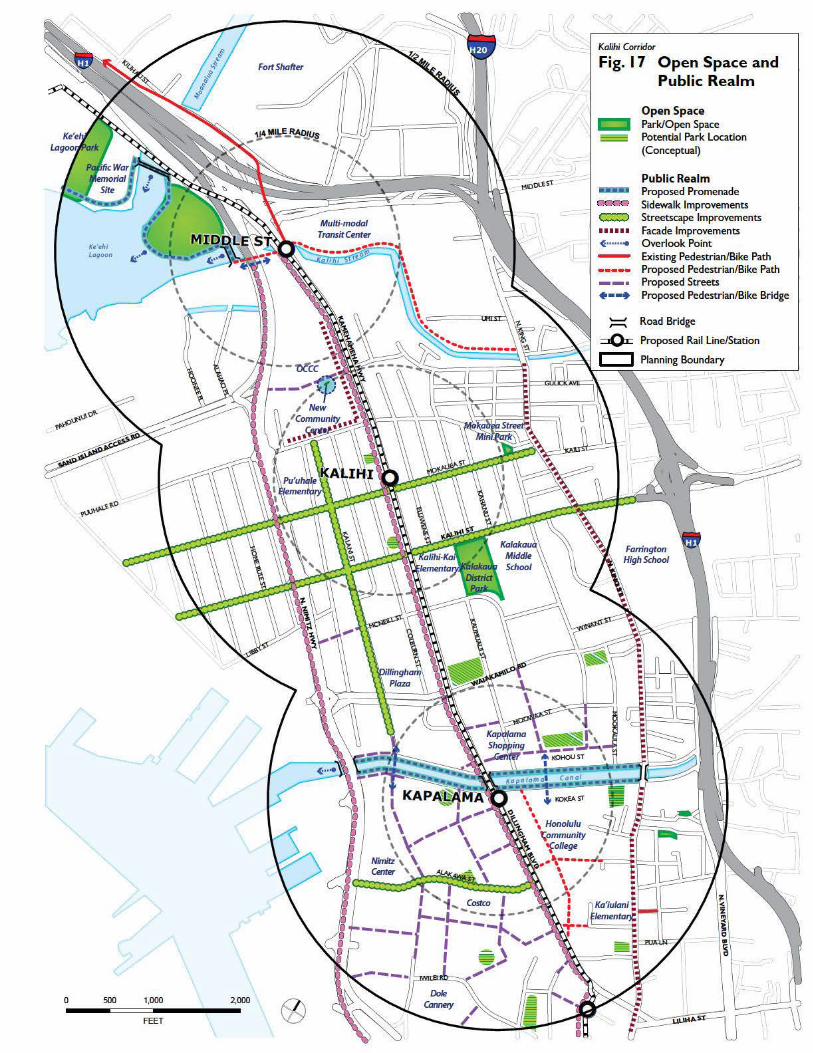
Figure 17: Open Space and Public Realm addresses streetscapes including sidewalk im-provements/provision, lighting, trees and landscaping, and waterfront connections; and provide safe and accessible parks and open spaces. New parks are also identified around the Kalihi and Kapalama stations, as is improved access to regional parks (i.e., Sand Island Recreation Area and Keehi Lagoon Park) around the Middle Street station. Along Kapalama Canal, a promenade enables a linear open space allowing passive activities and active recreation and creating a continuous mauka-makai route for pedestrians and cyclists.
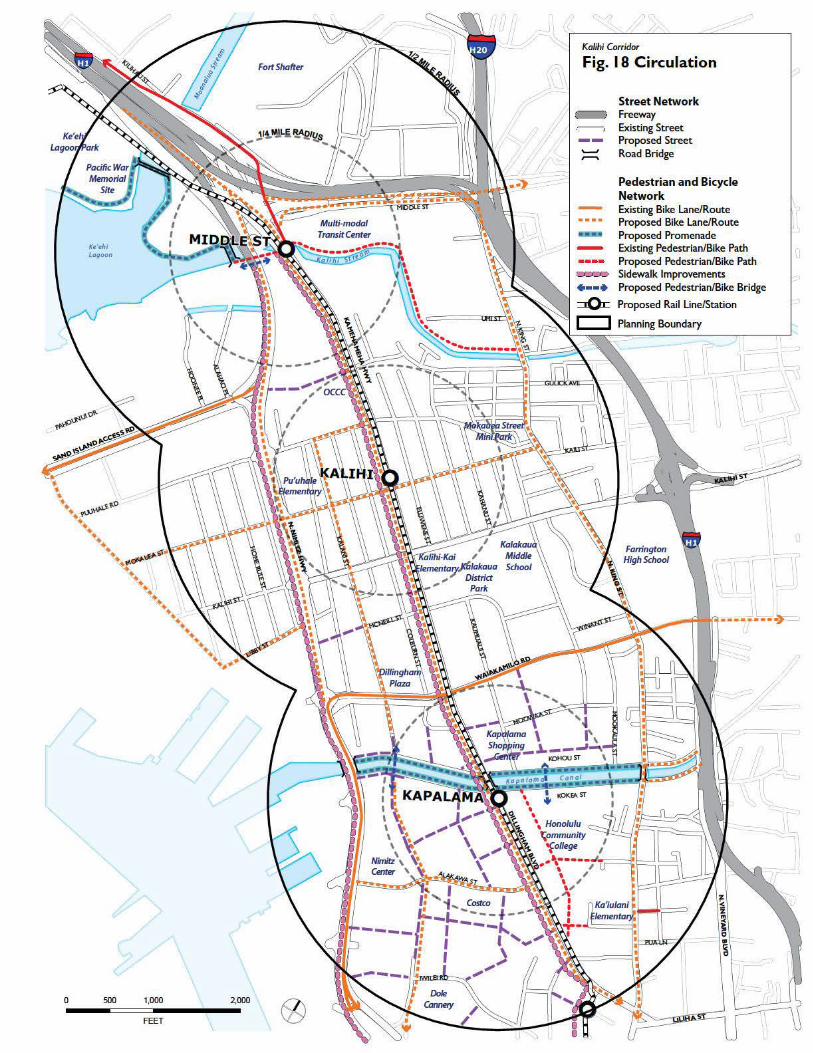
Figure 18: Circulation shows new streets around the Kapalama station providing access to and within the new redeveloped Iwilei station area, sidewalk improvements throughout the Planning Area, and new bike lanes and routes (based on the Oahu Bike Master Plan).
LAND USE ASSUMPTIONS AND DEVELOPMENT POTENTIAL
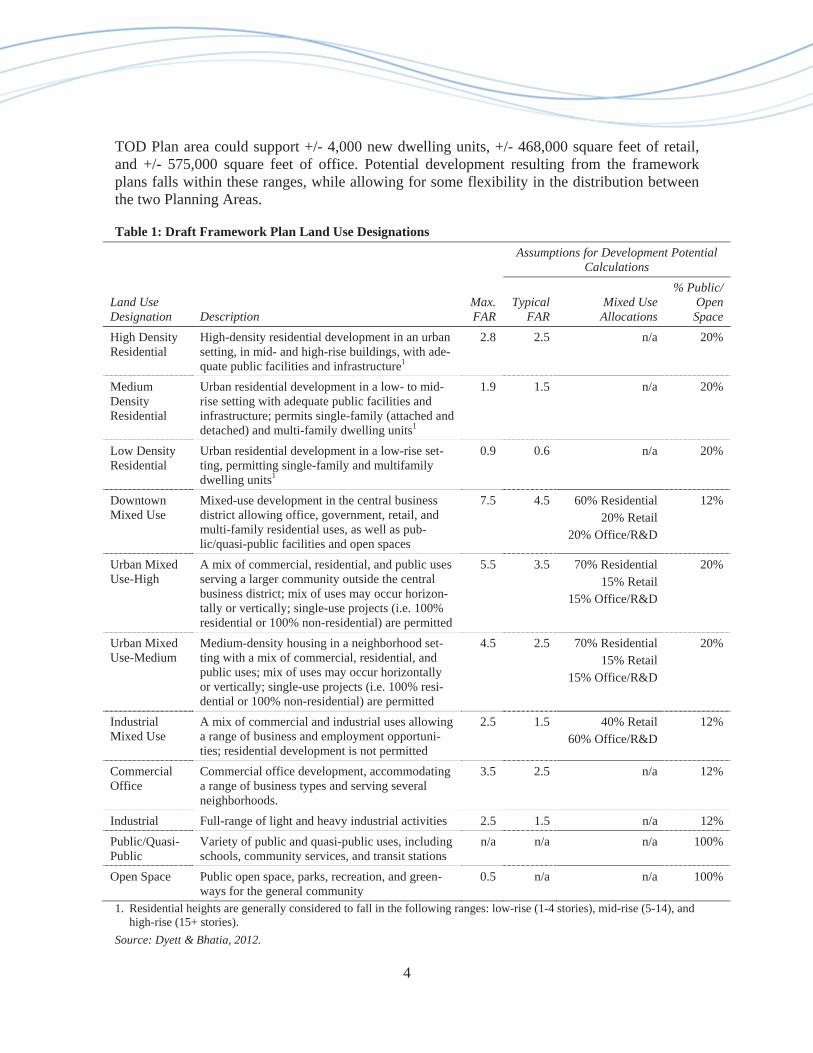
Table 1 shows the draft land use designations that have been applied to the Planning Areas, as shown on the land use maps. These designations will be refined and expanded upon through the planning process. Specific allowed uses will be refined through the Zoning Ordinance, which will also reflect the building intensity and heights established in the TOD plans.
Development opportunity sites were identified during the existing conditions analysis and are shown as outlines on the land use maps. These sites include vacant or underutilized parcels (i.e., sites with low building values compared to land values and sites with low building inten-sities). Although the half-mile radius is depicted on the maps for context and connectivity pur-poses, potential development opportunities are located within the 2,000-foot radius, about a seven minute walking distance from each station.
Development potential was estimated based on the existing land uses shown in the land use maps, average assumptions for intensity and use mix, as described in Table 1, and the likeli-hood of redevelopment (i.e., whether a site is currently vacant, underutilized or subject to site constraints). Depiction of a site as an “opportunity” does not necessarily mean that the site will undergo change over the next 20 to 30 years It is possible that a site with reuse potential may not undergo change while other sites that are not considered to have potential may undergo change; however, the purpose behind depicting sites as opportunities is to help evaluate likelyfuture development potential and impacts.
Potential development values reflect a realistic level of development that can be expected from transit-oriented development over the next 20 to 30 years, based on an assessment of market data and real estate conditions. As part of this planning process, Keyser Marston Associates estimated that the market in the Downtown TOD Plan area could support +/- 6,000 new dwell-ing units, +/- 485,000 square feet of retail, and +/- 910,000 square feet of office; and the Kalihi
4
TOD Plan area could support +/- 4,000 new dwelling units, +/- 468,000 square feet of retail, and +/- 575,000 square feet of office. Potential development resulting from the framework plans falls within these ranges, while allowing for some flexibility in the distribution between the two Planning Areas.
Table 1: Draft Framework Plan Land Use Designations Assumptions for Development Potential
Calculations
Land Use Designation Description
Max.FAR
TypicalFAR
Mixed Use Allocations
% Public/ OpenSpace
High Density Residential
High-density residential development in an urban setting, in mid- and high-rise buildings, with ade-quate public facilities and infrastructure1
2.8 2.5 n/a 20%
Medium Density Residential
Urban residential development in a low- to mid-rise setting with adequate public facilities and infrastructure; permits single-family (attached and detached) and multi-family dwelling units1
1.9 1.5 n/a 20%
Low Density Residential
Urban residential development in a low-rise set-ting, permitting single-family and multifamily dwelling units1
0.9 0.6 n/a 20%
Downtown Mixed Use
Mixed-use development in the central business district allowing office, government, retail, and multi-family residential uses, as well as pub-lic/quasi-public facilities and open spaces
7.5 4.5 60% Residential 20% Retail
20% Office/R&D
12%
Urban Mixed Use-High
A mix of commercial, residential, and public uses serving a larger community outside the central business district; mix of uses may occur horizon-tally or vertically; single-use projects (i.e. 100% residential or 100% non-residential) are permitted
5.5 3.5 70% Residential 15% Retail
15% Office/R&D
20%
Urban Mixed Use-Medium
Medium-density housing in a neighborhood set-ting with a mix of commercial, residential, and public uses; mix of uses may occur horizontally or vertically; single-use projects (i.e. 100% resi-dential or 100% non-residential) are permitted
4.5 2.5 70% Residential 15% Retail
15% Office/R&D
20%
IndustrialMixed Use
A mix of commercial and industrial uses allowing a range of business and employment opportuni-ties; residential development is not permitted
2.5 1.5 40% Retail 60% Office/R&D
12%
Commercial Office
Commercial office development, accommodating a range of business types and serving several neighborhoods.
3.5 2.5 n/a 12%
Industrial Full-range of light and heavy industrial activities 2.5 1.5 n/a 12% Public/Quasi-Public
Variety of public and quasi-public uses, including schools, community services, and transit stations
n/a n/a n/a 100%
Open Space Public open space, parks, recreation, and green-ways for the general community
0.5 n/a n/a 100%
1. Residential heights are generally considered to fall in the following ranges: low-rise (1-4 stories), mid-rise (5-14), and high-rise (15+ stories).
Source: Dyett & Bhatia, 2012.
5
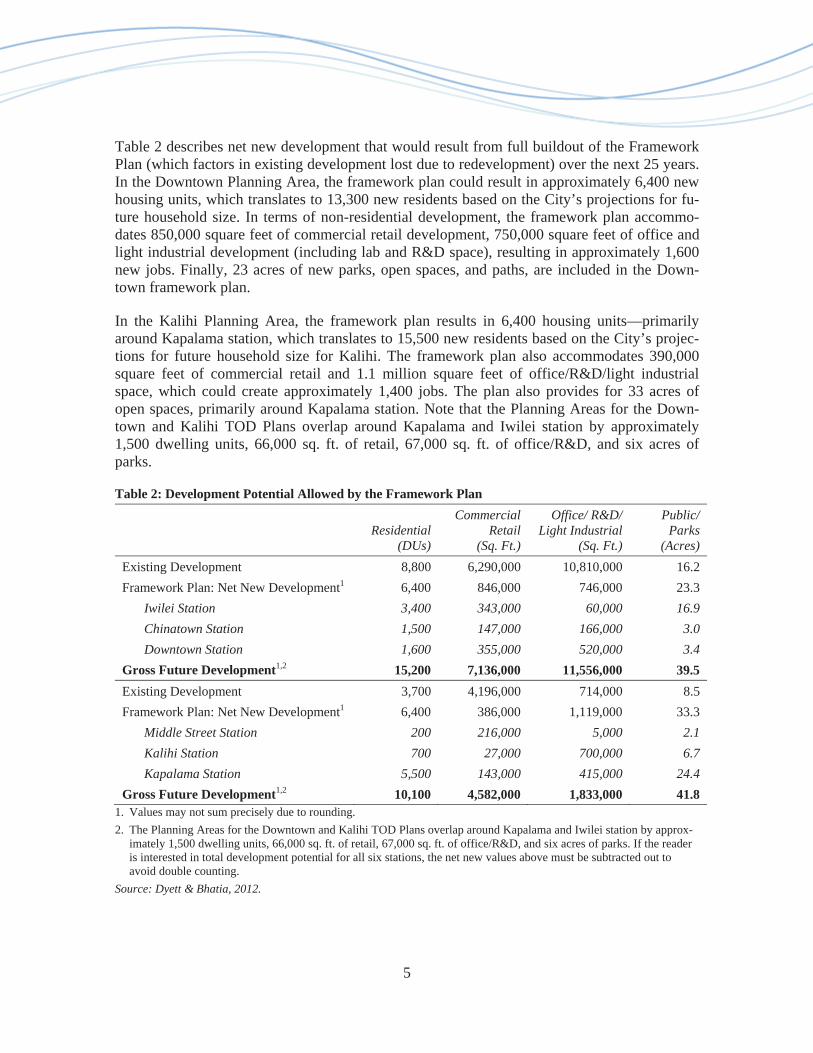
Table 2 describes net new development that would result from full buildout of the Framework Plan (which factors in existing development lost due to redevelopment) over the next 25 years. In the Downtown Planning Area, the framework plan could result in approximately 6,400 new housing units, which translates to 13,300 new residents based on the City’s projections for fu-ture household size. In terms of non-residential development, the framework plan accommo-dates 850,000 square feet of commercial retail development, 750,000 square feet of office and light industrial development (including lab and R&D space), resulting in approximately 1,600 new jobs. Finally, 23 acres of new parks, open spaces, and paths, are included in the Down-town framework plan.
In the Kalihi Planning Area, the framework plan results in 6,400 housing units—primarily around Kapalama station, which translates to 15,500 new residents based on the City’s projec-tions for future household size for Kalihi. The framework plan also accommodates 390,000 square feet of commercial retail and 1.1 million square feet of office/R&D/light industrial space, which could create approximately 1,400 jobs. The plan also provides for 33 acres of open spaces, primarily around Kapalama station. Note that the Planning Areas for the Down-town and Kalihi TOD Plans overlap around Kapalama and Iwilei station by approximately 1,500 dwelling units, 66,000 sq. ft. of retail, 67,000 sq. ft. of office/R&D, and six acres of parks.
Table 2: Development Potential Allowed by the Framework Plan
Residential (DUs)
CommercialRetail
(Sq. Ft.)
Office/ R&D/ Light Industrial
(Sq. Ft.)
Public/ Parks
(Acres)Existing Development 8,800 6,290,000 10,810,000 16.2 Framework Plan: Net New Development1 6,400 846,000 746,000 23.3
Iwilei Station 3,400 343,000 60,000 16.9 Chinatown Station 1,500 147,000 166,000 3.0 Downtown Station 1,600 355,000 520,000 3.4
Gross Future Development1,2 15,200 7,136,000 11,556,000 39.5 Existing Development 3,700 4,196,000 714,000 8.5 Framework Plan: Net New Development1 6,400 386,000 1,119,000 33.3
Middle Street Station 200 216,000 5,000 2.1 Kalihi Station 700 27,000 700,000 6.7 Kapalama Station 5,500 143,000 415,000 24.4
Gross Future Development1,2 10,100 4,582,000 1,833,000 41.8 1. Values may not sum precisely due to rounding. 2. The Planning Areas for the Downtown and Kalihi TOD Plans overlap around Kapalama and Iwilei station by approx-
imately 1,500 dwelling units, 66,000 sq. ft. of retail, 67,000 sq. ft. of office/R&D, and six acres of parks. If the reader is interested in total development potential for all six stations, the net new values above must be subtracted out to avoid double counting.
Source: Dyett & Bhatia, 2012.