Downloaded on 2017-02-12T08:01:33Z · intelligence was measured by a computerized version of the...
42
Title Influence of socio-cultural factors on SRAVEN performance Author(s) Murphy, Raegan; Cassimjee, Nafisa; Schur, Clare Publication date 2011-03 Original citation Murphy, R., Cassimjee, N. & Schur, C ; (2011) 'Influence of socio- cultural factors on SRAVEN performance'. Journal of Psychology in Africa, 21 (1):91-102. Type of publication Article (peer-reviewed) Rights Copyright 2011 Journal of Psychology in Africa. Item downloaded from http://hdl.handle.net/10468/623 Downloaded on 2017-02-12T08:01:33Z
Transcript of Downloaded on 2017-02-12T08:01:33Z · intelligence was measured by a computerized version of the...

Title Influence of socio-cultural factors on SRAVEN performance
Author(s) Murphy, Raegan; Cassimjee, Nafisa; Schur, Clare
Publication date 2011-03
Original citation Murphy, R., Cassimjee, N. & Schur, C ; (2011) 'Influence of socio-cultural factors on SRAVEN performance'. Journal of Psychology inAfrica, 21 (1):91-102.
Type of publication Article (peer-reviewed)
Rights Copyright 2011 Journal of Psychology in Africa.
Item downloadedfrom
http://hdl.handle.net/10468/623
Downloaded on 2017-02-12T08:01:33Z

Running head: Influence of socio-demographic factors
Influence of Socio-demographic Factors on SRAVEN
Performance
Raegan Murphy
University College Cork, Ireland
Nafisa Cassimjee
University of Pretoria, South Africa
Clare Schur
University of Pretoria, South Africa
* Corresponding author: Raegan Murphy, University College Cork, Ireland. E-mail:

Abstract
This exploratory study aimed to investigate the influence of specific socio-demographic
variables on a computerized test of non-verbal neuropsychological performance. Six
hundred and thirty South African first year students were assessed using the University of
Pennsylvania Computerized Neuropsychological Test Battery (PennCNP). Fluid
intelligence was measured by a computerized version of the Raven’s Progressive
Matrices (SRAVENS). Analysis of variance indicated that gender, home language, quality
of schooling, language of schooling and paternal education influenced performance on
the SRAVEN. Stepwise multiple regression evidenced the importance of language,
paternal education and high school language on SRAVENS responses. The assumption of
non-verbal test scores as being independent of socio-demographic factors needs to be
revisited as such independence cannot be maintained in light of such evidence.
Keywords: Non-verbal tests, neuropsychological performance, SRAVENS, socio-demographic
factors, culture-dependence
Non-verbal neuropsychological tests have been considered to be relatively culture
independent tests (Sherwood, 2005), however current international research indicates that
performance on non-verbal neuropsychological tests are significantly influenced by
various socio-demographic factors (Ardila & Keating, 2007; Coffey, Marmol, Schock, &
Adams, 2005; Dotson, Kitner-Triolo, Evans, & Zonderman, 2008; Dugbartey, Townes, &
Mahurin, 2000; Lynn, Backhoff, & Contreras, 2005; Mok, Tsang, Lee, & Llorente, 2008;
Razani, Burciaga, Madore, & Wong, 2007; Rosselli & Ardila, 2003; Shuttleworth-
Edwards, Kemp, Rust, Muirhead, Hartman, & Radloff, 2004b; Sugarman, 2007).
Performance on them may be influenced by language and parental education.
Language and parental education.
Razani et al. (2007) examined differences between English speaking ethnically diverse
individuals and monolingual English speaking Anglo-Americans and found that the latter
group scored significantly poorer on neuropsychological measures when compared to the
former group. Noble, Norman, and Farah (2005) found that language ability significantly
mediated the correlation between executive performance and aspects of socio-economic
status such as parental education. Parents with better education may provide a more
stimulating environment, more sophisticated verbal interaction, enhance contextual
factors conducive to educational performance and influence the nature and quality of
components of executive development (Braga, 2007; Hoff, 2003; Noble, McCandliss, &
Farah, 2007).

Language also appears to be integrated with elements of education and proficiency in
English (reading and speech ability), specifically better quality education (Nelson &
Pontón, 2007; Shuttleworth-Edwards, Donnelly, Reid, & Radloff, 2004a). Quality and
type of schooling as external socio-demographic environmental factors and parental
education levels as an internal socio-demographic environmental factor have been found
to influence cognitive performance (Ardila, Roselli, Matute, & Guajardo, 2005; Dotson et
al., 2008; Shuttleworth-Edwards et al., 2004a; Shuttleworth-Edwards et al., 2004b).
Lynn, Backhoff and Contreras (2005) investigated Raven Standard Progressive Matrices
(RSPM) performance on a multi-ethnic sample in Mexico and reported significant
correlations between mother’s education level and scores on the RSPM. The authors
considered this association as an indication of a complex interaction between socio-
demographic factors and performance on an intelligence measure. An alternative
explanation is that more intelligent mothers avail themselves of educational opportunities.
Raven’s Standard Progressive Matrices within diverse context.
The RSPM is considered to be one of the purest measures of general intellectual ability
(Raven, Raven, & Court, 2000). The test is considered a culture fair measure of non-
verbal intelligence (Grieve & Viljoen, 2000; Rushton, Skuy, & Fridjhon, 2002).
However, factor-analytic studies have indicated that the RSPM may not be a pure
measure of general intellectual functioning and that factors inherent in different
environments are of particular importance (Raven, Raven, & Court, 2003). Studies
utilising the RSPM have been conducted on school and university students from different

ethnic groups in South Africa (Grieve & Viljoen, 2000; Knoetze, Bass, & Steele, 2005;
Owen, 1992; Rushton & Skuy, 2000; Rushton, Skuy, & Fridjhon, 2002).
On a sample of first year university students, Rushton and Skuy (2000) found
performance differences between racially categorised groups. Differences in
neuropsychological performance within the racially categorized groups may reflect
conditions inherent in disadvantaged communities such as poor schooling, impoverished
environments and low levels of parental education (Griesel & Richter, 1987; Grieve &
Viljoen, 2000; Nell, 2000).
Shuttleworth-Jordan (1996) emphasized the powerful acculturative processes that would
parallel progress in South Africa and mediate socio-demographic influences (language
proficiency, parental education, quality of education and medium of education) on
cognitive test performance. Taking into account the changing demographics in a
developing democracy like South Africa, this study focuses on the dynamic socio-
demographic factors most likely to be pervasive in a changing environment.
The case for the independence from socio-demographic variables of certain non-verbal
intelligence and neuropsychological tests cannot rest due to the increasing evidence
attesting to the significant influence of multiple socio-demographic variables on these
performance batteries (Coffey, Marmol, Schock, & Adams, 2005; Mok, Tsang, Lee, &
Llorente, 2008; Shuttleworth-Edwards, et al., 2004b). In order to better serve and more
equitably assess candidates on non-verbal performance assessment tools, researchers not
only have to be mindful of the consequences of the moderating effects of these variables
but need to possibly adjust assessment strategies in order to more accurately assess
neuropsychological performance. However, this would depend on the purpose of the
assessment exercise. If the purpose is to compare individuals from different home
language groups as they present themselves, then adjustment may not be required and
may falsify the data. If the purpose is to check what a candidate is capable of learning,
then adjustment has to be made if it is believed that neuropsychological measures can
predict ability to improve by learning.
Group differences abound in South Africa, not so much due to inherent demographic
factors but more so due to past contextual differences, which resulted in varying quality
of education and access to facilities. These factors cannot be ignored when interpreting
neuropsychological test results. When summarily viewed, the South African sample’s
performance on the SRAVEN is on a par with that of the norm sample as evidenced by
Penn normative data (the mean correct responses on SRAVEN in our sample was 42.7
which was slightly higher than the norm group mean of 41.41). However, upon closer
inspection differences on test performance arise due to language use, school language
during primary and high school as well as father’s education. These socio-demographic
factors are directly linked to past social inequities and do bias performance on tests of
non-verbal intelligence. However, it cannot conclusively be shown that without the social
inequities there are no differences.

Goals of the study.
Considering that the RSPM is classified as a culture-fair test of non-verbal cognitive
ability (Raven, Court & Raven, 1990) the present study aimed to investigate socio-
demographic influences on a computerized version of RSPM performance in a diverse
South African university sample. To date, few studies in South Africa have included
large samples, a computerized test medium, a differentiation of parental education, and
differentiation of language of schooling and quality of primary and secondary education.
To this end a number of preliminary research questions were addressed. The performance
on the SRAVEN was investigated along with any gender effects. Various socio-
demographic factors such as home language, quality of schooling, language of schooling
and parental education were investigated for possible influence on the performance on the
SRAVEN. Possible interaction effects were also investigated. Lastly, the variable impact
of socio-demographic factors was investigated in order to build a preliminary predictive
model on SRAVEN’s performance.
Method
Participants
Six hundred and thirty first year students at a large residential university in South Africa
participated in this study in return for credits in a psychology semester module. Thirty
three cases were deleted due to incomplete records and questionable data. A realized
sample of 597 was utilized for the final data analyzes. Sixty-one percent of the sample
had fathers who had progressed beyond the level of high school education, and 66% of
the sample had mothers with the same progression.

At home, 28% of the sample spoke English, 47% spoke Afrikaans and the remaining 25%
spoke a black language. It must be noted that home language and language of schooling
is not always the same. Primary and high school education was received in either English
or Afrikaans.
Traditionally, quality of schooling is deemed better in privately funded schools as
opposed to the quality of education received in state and semi-state subsidized schools in
South Africa (Maree, Aldous, Hatting, Swanepoel, & van der Linde, 2006). Quality of
schooling for this study was operationalised as either state subsidized or privately funded.
Forty-seven percent of the sample attended private schools and 53% received state-
funded schooling during their primary school phase. The trend was reversed for high
school attendance, with 53% attending private schools and 47% attending state-
subsidized schools.
Measures.
The University of Pennsylvania Computerized Neuropsychological Test Battery
(PennCNP) was used for this study. The full battery of the PennCNP comprises the
Emotions battery, Executive Functioning and Abstract Reasoning battery and the
Memory battery. The computerized SRAVEN is a short version of the standard pencil
and paper RSPM. It comprises 9 questions from the standard 60 RSPM, which has 60
questions. The 9 questions were chosen based on statistical analyzes of the RSPM, which
demonstrated that the selected questions could predict the scores of the standard 60

question RSPM. In a study of 92 healthy individuals, Gur et al. (2001) reported a mean
performance of 47 (SD = 6.6 ) and a high reliability (0.88) on the computerized version
of the RSPM.
A self completion questionnaire was designed to capture basic data about respondents’
gender, age, handedness, language of schooling (primary and high), home language,
quality of education (primary and high) and parental education levels.
Procedure.
The choice of a computerized battery facilitated large scale data collection and group
administration (Gur, et al., 2001). Working in collaboration with the Brain-Behavior
Laboratory at the University of Pennsylvania, the researchers were able to set up a web-
interface between the South African site and the USA site. The computer laboratory at the
University of Pretoria was used for the group administration of tests. Participants were
required to choose a scheduled session and were assigned to groups. In total 30 group
sessions were scheduled. Each group comprised a maximum of 25 participants. In
addition to three attending researchers, eight research assistants were trained in the
administration of the battery. Each research assistant was responsible for the
simultaneous monitoring of 4 participants. The research assistants had to electronically
submit, upon completion of each task, the test status code (C-complete, I-incomplete) and
the number 1 (good data), 2 (questionable data) or 3 (bad data) at the end of the testing
session.
A measure of sensory-motor ability (MPRAXIS) was administered before the tests
commenced so as to allow participants to familiarize themselves with the use of the
computer mouse and the computer-based testing procedure. Prior to the commencement
of the SRAVEN test session, participants were given a practice trial to ensure that they
were familiar with the requirements of the test. Performance indices for the SRAVEN
were determined as follows: a) Total correct responses b) Total reaction time for correct
responses, c) Total reaction time for error responses.
Data Analysis.
The functioning of the SRAVEN was addressed by analyzing various descriptive
indicators such as percentiles, means and standard deviations and comparing these to
available normative samples. Gender effects were addressed by analyzing differences for
the two groups and, to this end, a non-parametric test was used due to unequal sample
distribution. Analysis of variance and tests of difference, including post-hoc tests of
difference, were employed to determine the possible influence of various socio-
demographic factors on the performance of the SRAVEN. A general linear univariate
model was tested in order to address possible interaction effects. Lastly, stepwise
multiple regression was employed to investigate the variable impact of socio-
demographic factors on SRAVEN’s performance.
Results
Descriptive Analysis. Table 1 illustrates the psychometric data for performance on the
SRAVEN. The sample achieved a mean of 42.7 (SD = 9.8) out of a total of 60. Table 2

gives further descriptive data for the SRAVEN with the Penn norm sample results added
for comparison. The Penn normative sample (n = 117) is more heterogeneous in terms of
age and has more males than females resulting in more variance in the range of scores.
The samples are similar in terms of scores within the percentiles, with lower norm sample
scores on the 25th percentile. The distribution of scores were skewed to the right
indicating a possible ceiling effect for all groups. The SRAVEN functioned normally for
this multi-ethnic sample.
INSERT TABLE 1 HERE
INSERT TABLE 2 HERE
Gender Effects.
A t-test for independent groups was performed to investigate differences in performance
between males and females. Males scored higher on the SRAVEN’s total number correct
(M = 45.05, SD = 8.8) versus the females (M = 42.24, SD = 9.9) resulting in t(592) =
2.595, p = 0.01 with a mean difference of 2.816, which represents a large effect size of
5.3. Due to the unequal gender distribution, a Mann-Whitney U test was conducted to
investigate any potential differences in the findings as inequality of variances may result
in effects on significance levels and the probability of incurring Type I errors. The results
mirrored those found on the t-test with the aforementioned tasks yielding z scores of
more than 2.5 standard deviations. Based on these findings it appears that that gender was
significant in mediating performance on these tasks.
Socio-demographic Influences.
In order to assess the degree to which home language, quality of schooling, language of
schooling and paternal education influenced performance on the SRAVEN, tests of
significance were conducted. Tables 3a through 6 show results of analysis of variance
and t-tests which are used to investigate differences on performance on the SRAVEN
based on the above-mentioned groupings. The ANOVA results are followed by
Bonferroni post-hoc analyzes to locate the differences between groups. All four socio-
demographic variables were significantly related to SRAVEN scores. Post-hoc analyzes
revealed that black language speakers performed significantly different on the SRAVEN
evidencing lower scores.
INSERT TABLE 3a HERE
INSERT TABLE 3b HERE
All language groups were significantly different from one another in terms of language
spoken during primary school, as indicated in Table 4a, as well as language spoken
during high school, as indicated in Table 5a. Individuals who received primary schooling
in a black language performed lower than either the English and Afrikaans groups.
Individuals schooled in Afrikaans during primary and high school scored significantly
higher than either English schooled individuals or black language schooled individuals.
Individuals whose fathers completed high school scored significantly higher on the
SRAVEN than individuals whose fathers had not completed high school as indicated in
Table 6.

INSERT TABLE 4a HERE
INSERT TABLE 4b HERE
INSERT TABLE 5a HERE
INSERT TABLE 5b HERE
INSERT TABLE 6 HERE
There was a significant difference between students who received private education and
state funded primary and high schooling on the SRAVEN performance (see Tables 7 and
8). Individuals attending privately funded primary schools obtained significantly higher
SRAVEN scores (t(592) = 2.155, p = 0.032) as did those who received privately funded
high schooling (t(592) = 1.971, p = 0.049).
INSERT TABLE 7 HERE
INSERT TABLE 8 HERE
Interaction Effects.
In order to determine if interaction effects were present, the performance on the
SRAVEN was analyzed with a general linear univariate model (see Table 9) with paternal
education and quality of education (in both primary and high school) entered as
independent variables. There were no significant interaction effects among the variables
therefore requiring no further analyzes. Gender differences were not investigated as the
skewed sample size would make for caution-bearing interpretation. However, there were
differences on the SRAVEN’s performance associated with these above-mentioned
variables. Table 10 highlights the results.
INSERT TABLE 9 HERE
Of note, individuals whose father had either completed high school and/or furthered his
education, generally scored higher than those whose fathers did not complete high school.
Also, individuals who received private schooling during primary and high school
generally outperformed students who underwent schooling in state funded schools. The
highest performers tended to have fathers who had completed high school and gone on to
further studies, and who had received private schooling during their primary and high
school years. The lowest performers on the SRAVENS tended to have fathers who had
not completed high school and who had received state funded schooling during their
primary and high school years. The mean SRAVENS score achieved for the former group
was 44.17 (SD = 9.8) in comparison to the latter whose mean was 38.64 (SD = 10.3).
Differences between the two groups have been highlighted in the tables.
INSERT TABLE 10 HERE
Contribution of Socio-demographic Influences.
In a stepwise multiple regression, the independent socio-demographic variables are
entered according to their statistical contribution in explaining the variance in SRAVEN’s
performance. Language used in primary school did not reach significance nor did quality

of education in either primary or high school and was thus not included in the model. The
order of entry of the variables evidences their relative importance in the model. In the
table of variables entered, paternal education was added to the regression equation in
model 2. The increase in R2 as a result of including this variable was 0.26 which was
statistically significant, F(1, 591) = 17.457, p < 0.001. Similarly, the increase in R2as a
result of including high school language was 0.23, which was statistically significant,
F(1, 590) = 15.838, p < 0.001. The order of importance is therefore home language,
paternal education and high school language. The negative Beta figures indicate that
SRAVEN’s performance increases when home language is either Afrikaans or English
but decreases if home language is one of the black languages. The results are shown in
Tables 11a-11c.
INSERT TABLE 11a HERE
INSERT TABLE 11b HERE
INSERT TABLE 11c HERE
Discussion.
Our findings evidence support for the influence of various socio-demographic variables
on performance of SRAVEN scores. Those who spoke an indigenous home language
fared less well than those whose home language was either English or Afrikaans. The
language in which education was received during both primary and high school
influenced SRAVEN scores. Lastly, paternal education appreciably influenced SRAVEN
scores with more educated fathers influencing their children’s SRAVEN scores. Our

findings are in accord with recent findings in this area, namely that of Gur, Richard,
Hughett, Calkins, Macy, Bilker, Brensinger, and Gur (2010) whose findings suggest that
higher parental education is associated with better performance across domains within
executive functioning, on the same neuropsychological test battery. Furthermore, in a
study on Philippine students who had diverse socio-demographic backgrounds, Vista and
Grantham (2010) found that parental education had a significant influence on fluid
intelligence. Lawlor, Najman, Batty, O’Callaghan, Williams, and Bor (2006) in their
study, via multivariable analyses, contend that among the strongest and most robust
predictors of intelligence are family income, parental education and education, with these
and other variables explaining 7.5% of the variation in intelligence at age 14. Moreover,
Brooks (2010) looked at the prevalence of low intelligence test scores on the WISC-IV
and concluded that the frequency base rates of low intelligence scores are related both to
a child’s level of intelligence and parental education.
Given the generational disparities in parental access to education in South Africa,
researchers should be cognizant of the variable effect that parental education levels have
on certain domains of cognitive functioning. In our findings paternal education was the
second-most important predictor of SRAVEN performance as evidenced in the regression
results. Socio-demographic variables are found to be salient moderators of potential
SRAVEN performance as these variables are repeatedly found to be influential in
affecting cognitive domain performance. There is comparatively less research focusing
on parental education as opposed to participant level of education as moderating the

effect on computerized neuropsychological performance in diverse contexts and our
findings add to this research area.
As evidenced from this study, significant group differences on performance are partly
attributable to home language, school language and paternal education. The results of this
study indicated substantial differences between these groups adding further support to
the findings in the literature, cf. Braga, 2007; Hoff, 2003; Noble, Norman and Farah,
2005. As with the Lynn, Backhoff and Contreras (2005) Raven’s research, our study
evidenced similar findings but with paternal education as opposed to maternal education
as being more important and significant a contribution to performance on the test. Further
investigations into interactions did not yield significant findings but this may be due to a
restricted sample range. Our study also added support to the idea that inherent
disadvantages exist within certain community groupings in South Africa due to
impoverished environments (Grieve & Viljoen, 2000; Nell, 2000).
Our study found significant differences in Raven’s performance between the different
groups when accounting for home language, quality of schooling, language of schooling
and paternal education. Individuals whose parents were better educated and who received
instruction in English performed significantly better than those whose parents were less
educated in addition to receiving school instruction in a language other than English or
Afrikaans. The quality of education received during primary and high school played a
significant role in differentiating individuals on Raven’s performance. In accordance with
previous research, our findings further underscore the complex relationship between

socio-demographic factors and measures of intelligence. The association between socio-
demographic factors and Raven’s performance is determined by the broader context. This
context includes varying degrees of accessibility to quality schooling in South Africa.
Language and parental education issues are significantly tied into neuropsychological
performance thus illustrating the deleterious effects of sub-optimal education. The net
result is lowered performance on non-verbal tests which are supposedly advocated as
being independent of such factors. These findings provide the impetus for future
researchers in South Africa to consider the stratification of the sociodemograhic variables
of interest. Quality of eduation, for example, is a complex construct/concept that has a
myriad of sociocontextual (urban-rural) related factors.
Limitations.
The sample utilized for this study was one of convenience and as such performance
indicators will reflect a restriction of range. The results are thus not generalizable. The
sample stratification can be considered a limitation of this research endeavor as it may
not be optimal in terms of teasing apart very difficult aspects surrounding quality of
education in South Africa. The biological underpinnings of cognitive functioning are not
addressed in the research and as such the discussion may not reflect the current debates
within the field. Due to the rapid rate of adaptation of black South Africans to
neuropsychological tests, what may have appeared to have been significant findings in
the early 1990’s may no longer be the case today.
Conclusion

Research indicates that non-verbal neuropsychological tests are significantly influenced
by a variety of socio-demographic factors. Language proficiency and language ability
have been shown to significantly impact on and moderate neuropsychological
performance. In addition to language fluency, parental education has also been cited as
playing a significant role in test performance. South Africa presents as a natural
experiment regarding the study of various socio-demographic influences where, due to
inequities of the past, differences between group performance based on the former
variables are evident.
Acknowledgement
This work was supported by a grant from the South African National Research
Foundation and the University of Pretoria Research and Development Programme.

References
Ardila, A., & Keating, K. (2007). Cognitive abilities in different cultural contexts. In B.
Uzzell, M. Ponton, & A. Ardila (Eds.), International Handbook of Cross-Cultural
Neuropsychology (pp. 109 - 125). London: Lawrence Erlbaum.
Ardila, A., Rosselli, M., Matute, E, & Guajardo, S. (2005). The influence of parents’
educational level on the development of executive functions. Developmental
Neuropsychology, 28, 539-560.
Braga, L.W. (2007). Developmental perspectives: Culture and neuropsychological
development during childhood. In B. Uzzell, M. Ponton, & A. Ardila (Eds.),
International Handbook of Cross-Cultural Neuropsychology (pp. 145-161). London:
Lawrence Erlbaum.
Brooks, B.L. (2010). Seeing the forest for the trees: Prevalence of low scores on the
Wechsler Intelligence Scale for Children, fourth edition (WISC-IV). Psychological
Assessment, 22(3), 650-656.
Coffey, D.M., Marmol, L., Schock, L., & Adams, W. (2005). The influence of
acculturation on the Wisconsin Card Sorting Test by Mexican Americans. Archives of
Clinical Neuropsychology, 20, 795-803.

Dotson, V.M., Kitner-Triolo, M., Evans, M.K., & Zonderman, A.B. (2008). Literacy-
based normative data for low socioeconomic status African Americans. The Clinical
Neuropsychologist, 22, 989-1017.
Dugbartey, A.T., Townes, B., & Mahurin, R. (2000). Equivalence of the Color Trails Test
and Trail Making Test in non-native English-speakers. Archives of Clinical
Neuropsychology, 15(5), 425-431.
Griesel, R.D., & Richter, L.M. (1987). Psycho-social studies of malnutrition in southern
Africa. World Review of Nutrition and dietetics, 54, 71-104.
Grieve, K. W., & Viljoen, S. (2000). An exploratory study of the use of the Austin Maze
in South Africa. South African Journal of Psychology, 30, 14–18.
Gur, R., Ragland, J., Moberg, P.J., Turner, T.H., Bilker, W.B., Kohler, C., Siegel, S.J, &
Gur, R.E. (2001). Computerized Neurocognitive Scanning: Methodology and validation
in healthy people. Neuropsychopharmacology, 25, 766-776.
Gur, R.C., Richard, J., Hughett, P., Calkins, M.E., Macy, L., Bilker, W.B., Brensinger,
C., & Gur. R.E. (2010). A cognitive neuroscience-based computerized battery for
efficient measurement of individual differences: Standardization and initial construct
validation. Journal of Neuroscience Methods, 187, 254–262.

Hoff, E. (2003). The specificity of environmental influence: Socioeconomic status affects
early development via maternal speech. Child Development, 74, 1368-1378.
Knoetze, J., Bass, N., & Steele, G. (2005). The Raven’s Coloured Progressive Matrices:
Pilot norms for isiXhosa-speaking primary school learners in peri-urban Eastern Cape.
South African Journal of Psychology, 35(2), 175-194.
Lawlor, D.A., Najman, J.M., Batty, G.D., O’Callaghan, M.J., Williams, G.M., & Bor, W.
(2006). Early life predictors of childhood intelligence: Findings from the Mater-
University study of pregnancy and its outcomes. Paediatric and Perinatal Epidemiology,
20, 148–162.
Lynn, R., Backhoff, E., & Contreras, L.A. (2005). Ethnic and racial differences on the
Standard Progressive Matrices in Mexico. Journal of Biosocial Science, 37, 107-113.
Maree, K., Aldous, C., Hatting, A., Swanepoel, A., & van der Linde, M., (2006).
Predictor of learner performance in mathematics and science according to a large-scale
study in Mpumalanga. South African Journal of Education, 22(2), 229-252.
Mok, N., Tsang, L., Lee, T.M., & Llorente, A.M. (2008). The impact of language on the
equivalence of trail making tests: Findings from three pediatric cohorts with different
language dominance. Applied Neuropsychology, 15, 123-130.

Nell, V. (2000). Cross-cultural neuropsychological assessment: theory and practice.
London: Lawrence Erlbaum.
Nelson, N. W., & Pontón, M. (2007). The art of clinical neuropsychology. In B. Uzzell,
M. Ponton, & A. Ardila (Eds.), International Handbook of Cross-Cultural
Neuropsychology (pp. 45-62). London: Lawrence Erlbaum.
Noble, K.G., Norman, M. F., & Farah, M. J. (2005). Neurocognitive correlates of
socioeconomic status in kindergarten children. Developmental Science, 8(1), 74-87.
Noble, K.G., McCandliss, B.D., & Farah, M.J. (2007). Socioeconomic gradients predict
individual differences in neurocognitive abilities. Developmental Science, 10(4), 464-
480.
Owen, K. (1992). The suitability of the Raven’s Standard Progressive Matrices for
various groups in South Africa. Personality and Individual Differences, 13, 149-159.
Raven, J. C., Court, J. H., & Raven, J. C. (1990). Manual for Raven’s Progressive
Matrices and Vocabulary Scales – Section 2: Coloured Progressive Matrices. Oxford:
Oxford Psychologists Press.
Raven, J., Raven, J.C., & Court, J.H. (2000). Manual for Raven’s Standard Progressive
Matrices. San Antonio Texas: Harcourt.

Razani, J., Burciaga, J., Madore, M., & Wong, J. (2007). Effects of acculturation on tests
of attention and information processing in an ethnically diverse group. Archives of
Clinical Neuropsychology, 22, 333-341.
Rosselli, M., & Ardila, A. (2003). The impact of culture and education on non-verbal
neuropsychological measurements: A critical review. Brain and Cognition, 52, 326 - 333.
Rushton, J.P., & Skuy, M. (2000). Performance on Raven’s Matrices by African and
white university students in South Africa. Intelligence, 28(4), 251-265.
Rushton, J.P., Skuy, M., & Fridjhon, P. (2002). Jensen effects among African, Indian, and
white engineering students in South Africa on Raven’s Standard Progressive Matrices.
Intelligence, 30, 409-423.
Sherwood, A.R. (2005). Neuropsychological test performance among Navajo native
Americans: A normative sample. Dissertation Abstracts International: Section B: The
Sciences and Engineering, 65(9-B) 4864.
Shuttleworth-Edwards, A., Donnelly, M., Reid, I., & Radloff, S. (2004a). A Cross-
cultural study with cultural fair normative indications on the WAIS-III Digit Symbol –
Incidental Learning. Journal of Clinical and Experimental Neuropsychology, 26 (7), 921-
932.

Shuttleworth-Edwards, A., Kemp, R., Rust, A., Muirhead, J., Hartman, N., & Radloff, S.
(2004b). Cross-cultural effects on IQ test performance: A review and preliminary
normative indications on WAIS-III test performance. Journal of Clinical and
Experimental Neuropsychology, 26 (7), 903-920.
Shuttleworth-Jordan, A.B. (1996). On not reinventing the wheel: A clinical perspective
on culturally relevant test usage in South Africa. South African Journal of
Psychology, 26 (2), 96–102.
Sugarman, R. (2002). Evolution and executive functions: Why our toolboxes are empty.
Revista Española de Neuropsicologia, 4, 351-377.
Sugarman, R. (2007). Visuospatial assessment in cross-cultural and non-western settings.
In B. Uzzell, M. Ponton, & A. Ardila (Eds.), International Handbook of Cross-Cultural
Neuropsychology (pp. 227-251). London: Lawrence Erlbaum.
Vista, A.D., & Grantham, T.C (2010). Effects of parental education levels on fluid
intelligence of Philippine public school students. Journal of Psychoeducational
Assessment, 28(3), 236-248.
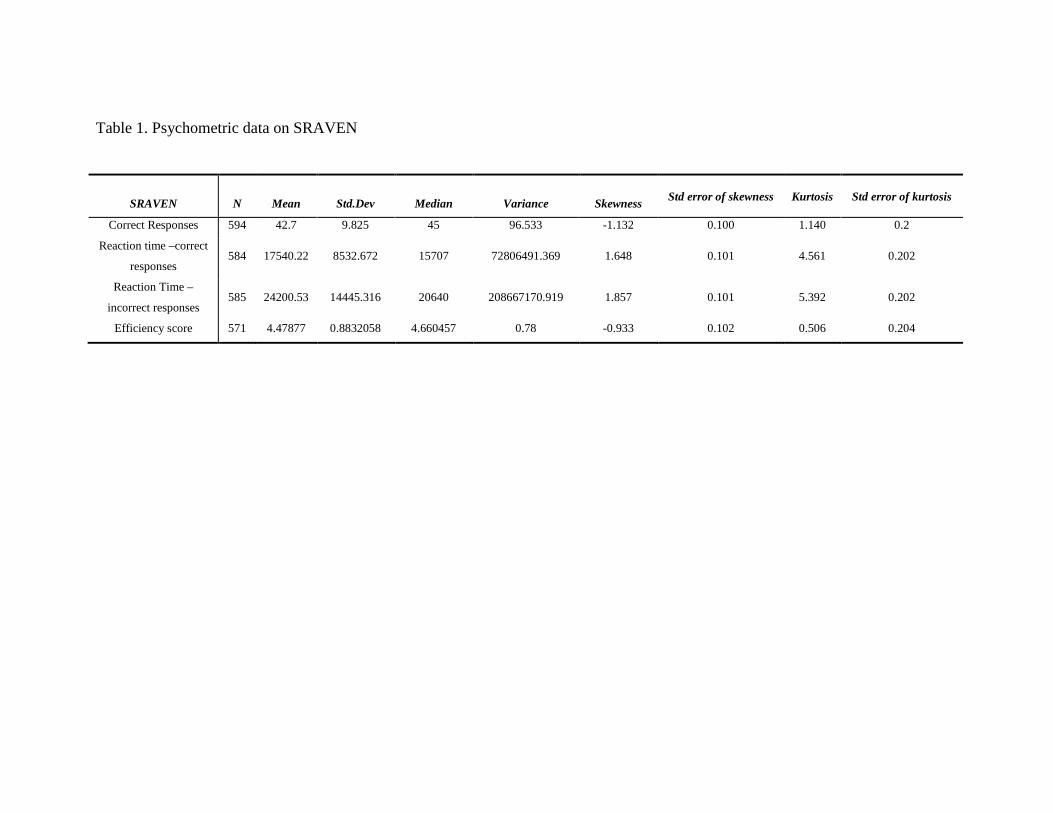
Table 1. Psychometric data on SRAVEN
SRAVEN
N
Mean
Std.Dev
Median
Variance
Skewness Std error of skewness
Kurtosis
Std error of kurtosis
Correct Responses 594 42.7 9.825 45 96.533 -1.132 0.100 1.140 0.2
Reaction time –correct
responses 584 17540.22 8532.672 15707 72806491.369 1.648 0.101 4.561 0.202
Reaction Time –
incorrect responses 585 24200.53 14445.316 20640 208667170.919 1.857 0.101 5.392 0.202
Efficiency score 571 4.47877 0.8832058 4.660457 0.78 -0.933 0.102 0.506 0.204

Table 2 Descriptive results on the SRAVEN
Correct responses Reaction time –correct responses Reaction Time –incorrect responses Efficiency score
N 594 (117) 584 (114) 585 (117) 571 (114) Mean age 19.76 (31.48) - - - Mean education 13.21 (14.76) - - - Gender 84% (36%*) f; 16%(54%) m Mean 42.7 (41.41) 17540.22 (15859.05) 24200.53 (28278.65) 4.47877 (4.52) Range Minimum Maximum Percentiles
25 50 75
46 (46) 69141 (88671) 59516 (112516) 4.3782 (4.80891) 10 (10) 3343 (4119.5) 5359 (5659) 1.6866 (1.58) 56 (56) 72484 (92790) 64875 (118175) 6.0648 (6.39) 38.00 (34) 11691.00 (7800) 14570.50 (13660) 4.003615 (3.6982) 45.00 (44) 15707.00 (10723) 20640.00 (22219) 4.660157 (4.84735) 50.00 (51) 21168.00 (16891) 29875.00 (36446) 5.145855 (5.54941)
University of Pennsylvania PennCNP battery norm results appear in parentheses.
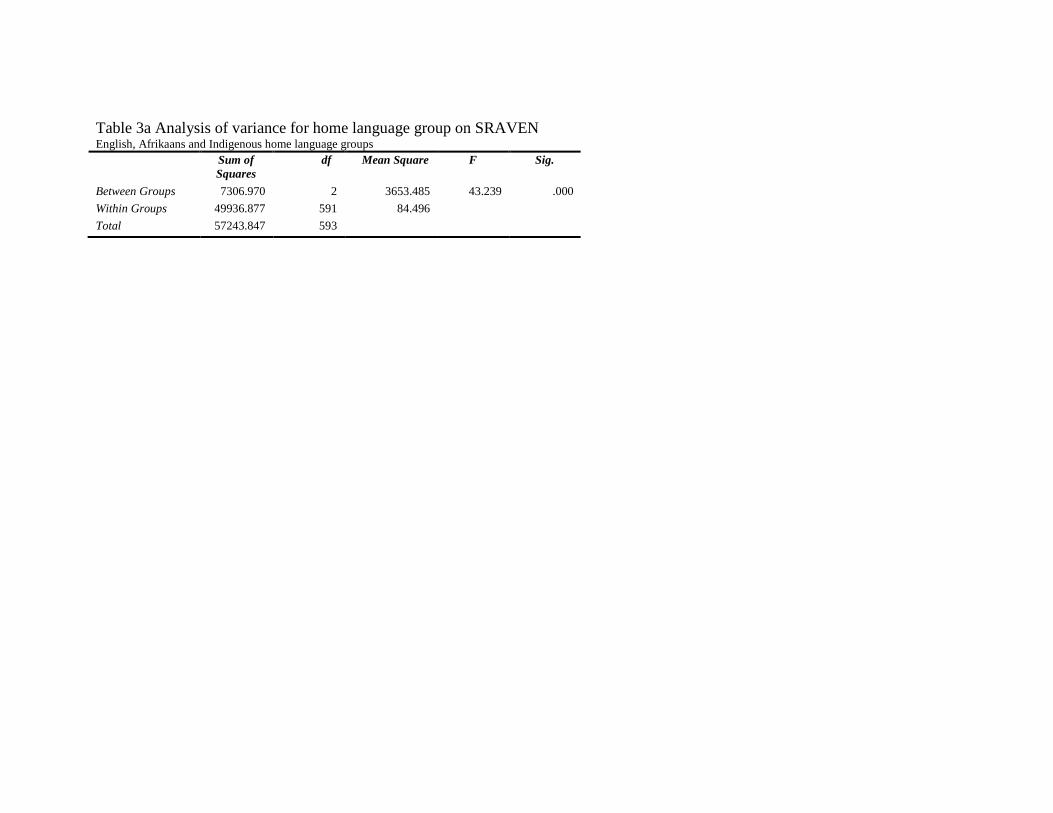
Table 3a Analysis of variance for home language group on SRAVEN English, Afrikaans and Indigenous home language groups Sum of
Squares df Mean Square F Sig.
Between Groups 7306.970 2 3653.485 43.239 .000 Within Groups 49936.877 591 84.496 Total 57243.847 593

Table 3b Bonferroni Post-hoc comparisons between home language groups on SRAVEN
English, Afrikaans and Indigenous home language groups (I) Language (J) Language Mean Difference
(I-J) Std. Error Sig. 95% Confidence Interval
Lower Bound Upper Bound
English Afr -.176 .903 1.000 -2.34 1.99 Ind 7.996(*) 1.042 .000 5.49 10.50 Afrikaans Eng .176 .903 1.000 -1.99 2.34 Ind 8.172(*) .933 .000 5.93 10.41 Indigenous Eng -7.996(*) 1.042 .000 -10.50 -5.49 Afr -8.172(*) .933 .000 -10.41 -5.93 * The mean difference is significant at the .05 level.
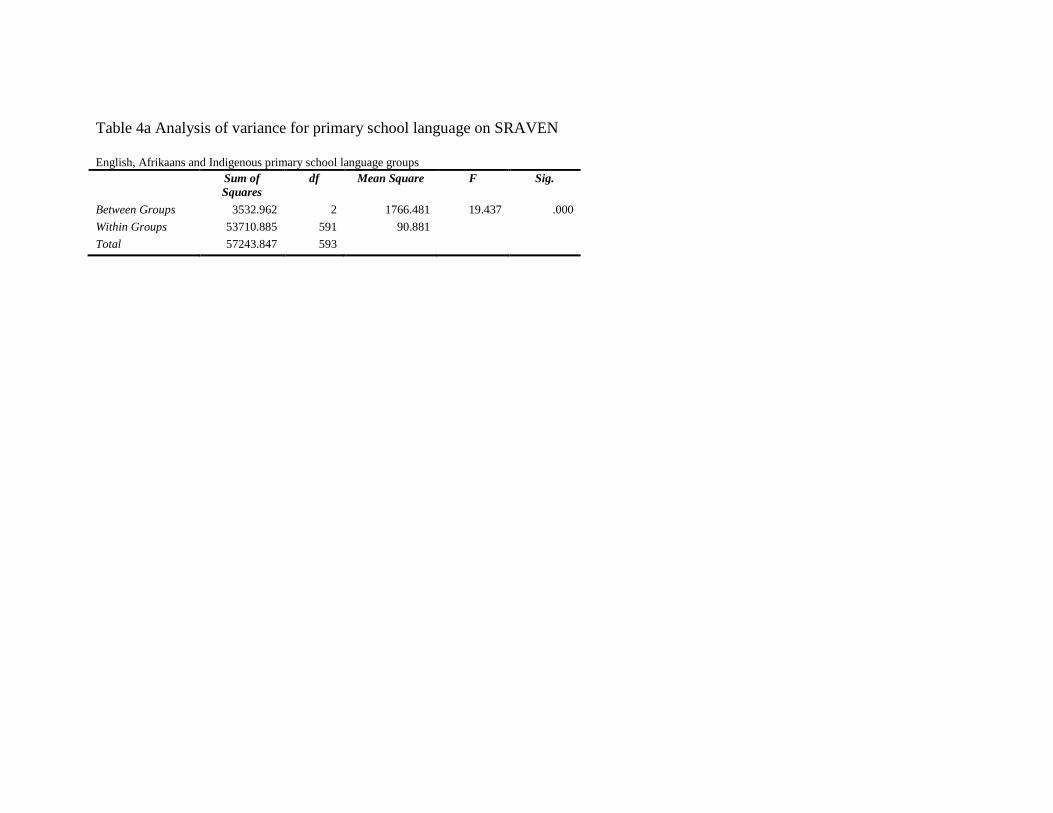
Table 4a Analysis of variance for primary school language on SRAVEN
English, Afrikaans and Indigenous primary school language groups Sum of
Squares df Mean Square F Sig.
Between Groups 3532.962 2 1766.481 19.437 .000 Within Groups 53710.885 591 90.881 Total 57243.847 593

Table 4b Bonferroni Post-hoc comparisons between primary school language groups on SRAVEN
English, Afrikaans and Indigenous primary school language groups (I) Primary school language
(J) Primary school language
Mean Difference (I-J)
Std. Error Sig. 95% Confidence Interval
Lower Bound Upper Bound
English Afr -2.983(*) .831 .001 -4.98 -.99 Ind 4.824(*) 1.303 .001 1.70 7.95 Afrikaans Eng 2.983(*) .831 .001 .99 4.98 Ind 7.807(*) 1.306 .000 4.67 10.94 Indigenous Eng -4.824(*) 1.303 .001 -7.95 -1.70 Afr -7.807(*) 1.306 .000 -10.94 -4.67 * The mean difference is significant at the .05 level.
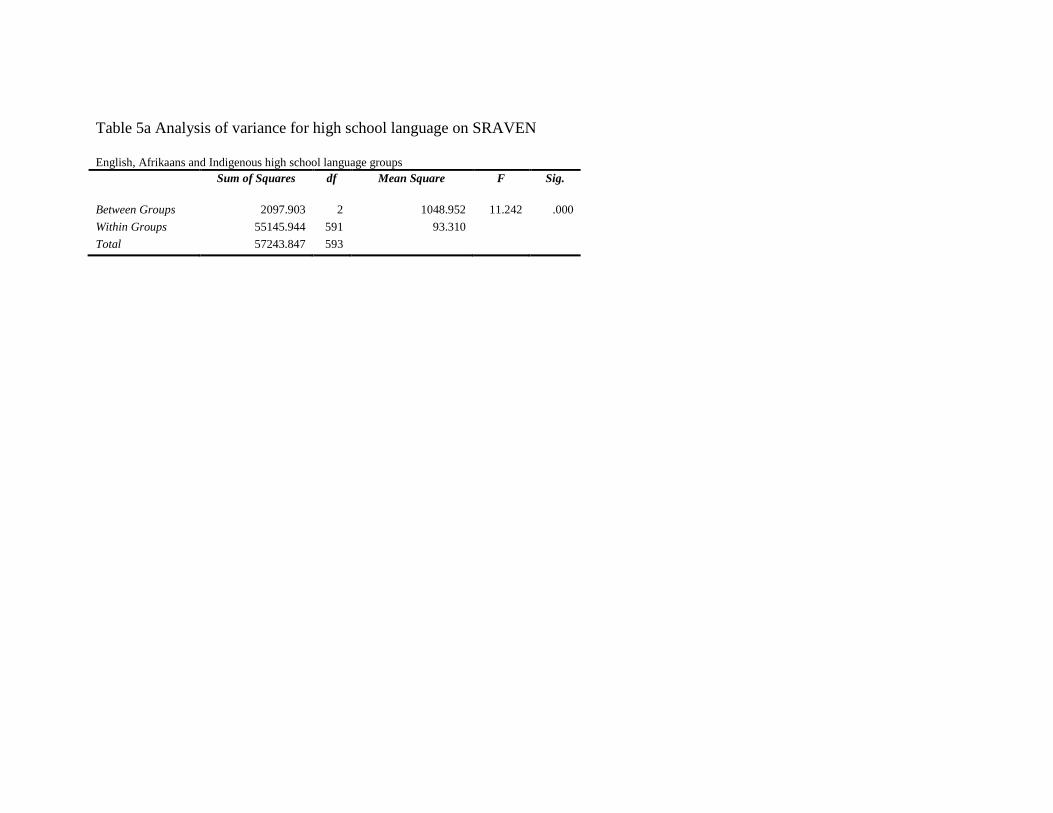
Table 5a Analysis of variance for high school language on SRAVEN
English, Afrikaans and Indigenous high school language groups Sum of Squares df Mean Square F Sig.
Between Groups 2097.903 2 1048.952 11.242 .000 Within Groups 55145.944 591 93.310 Total 57243.847 593

Table 5b Bonferroni Post-hoc comparisons between high school language groups on SRAVEN
English, Afrikaans and Indigenous high school language groups (I) High school language
(J) High school language
Mean Difference (I-J)
Std. Error Sig. 95% Confidence Interval
Lower Bound Upper Bound
English Afr -3.612(*) .818 .000 -5.58 -1.65 Ind 1.452 1.820 1.000 -2.92 5.82 Afrikaans Eng 3.612(*) .818 .000 1.65 5.58 Ind 5.064(*) 1.838 .018 .65 9.48 Indigenous Eng -1.452 1.820 1.000 -5.82 2.92 Afr -5.064(*) 1.838 .018 -9.48 -.65 * The mean difference is significant at the .05 level.

Table 6 Analysis of variance for paternal education on SRAVEN
Fathers who completed high school and fathers who did not complete high school
Sum of Squares df Mean Square
F Sig.
Between Groups 1623.317 1 1623.317 17.278 .000 Within Groups 55620.530 592 93.954 Total 57243.847 593

Table 7 Independent groups t test for primary school groups on the SRAVEN
Primary school either state-funded or privately funded
t-test for Equality of Means
t df Sig. (2-tailed) Mean Difference
Std. Error Difference
95% Confidence Interval of the Difference
Upper Lower
SRAVEN 2.155 592 .032 1.736 .805 .154 3.318

Table 8 Independent groups t test for high school groups on the SRAVEN
High school either state-funded or privately funded
t-test for Equality of Means
t df Sig. (2-tailed) Mean Difference
Std. Error Difference
95% Confidence Interval of the Difference
Upper Lower
SRAVEN 1.971 592 .049 1.588 .806 .006 3.171
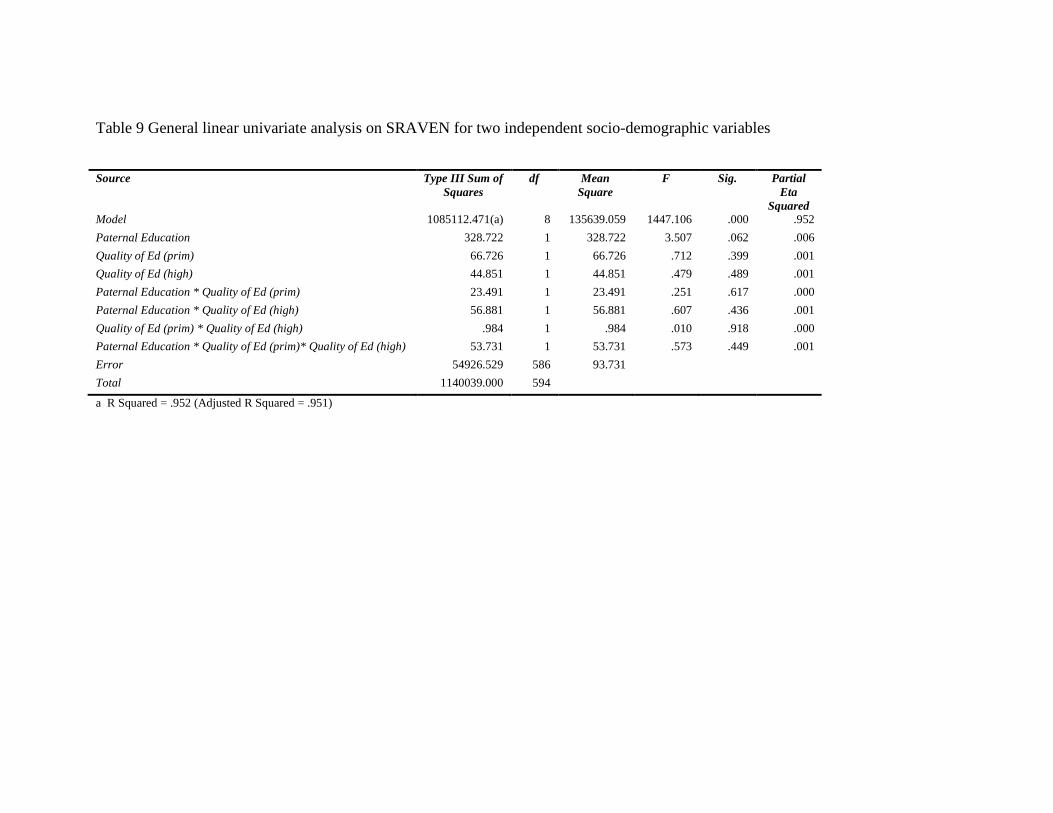
Table 9 General linear univariate analysis on SRAVEN for two independent socio-demographic variables
Source Type III Sum of
Squares df Mean
Square F Sig. Partial
Eta Squared
Model 1085112.471(a) 8 135639.059 1447.106 .000 .952 Paternal Education 328.722 1 328.722 3.507 .062 .006 Quality of Ed (prim) 66.726 1 66.726 .712 .399 .001 Quality of Ed (high) 44.851 1 44.851 .479 .489 .001 Paternal Education * Quality of Ed (prim) 23.491 1 23.491 .251 .617 .000 Paternal Education * Quality of Ed (high) 56.881 1 56.881 .607 .436 .001 Quality of Ed (prim) * Quality of Ed (high) .984 1 .984 .010 .918 .000 Paternal Education * Quality of Ed (prim)* Quality of Ed (high) 53.731 1 53.731 .573 .449 .001 Error 54926.529 586 93.731 Total 1140039.000 594
a R Squared = .952 (Adjusted R Squared = .951)

Table 10 Paternal Education X Quality of Education (primary) X Quality of Education (high) Dependent Variable: Correct responses on the Ravens Paternal Ed Quality of Ed
(prim) Quality of Ed (high)
Mean Std. Error 95% Confidence Interval
Lower Bound Upper Bound Below high school Private Private 42.382 1.174 40.076 44.688 State funded 41.571 3.659 34.385 48.758 State funded Private 41.739 2.019 37.774 45.704 State funded 38.647 .959 36.764 40.530
High school and above Private Private 44.174 .714 42.772 45.576 State funded 43.421 2.221 39.059 47.783 State funded Private 42.850 1.531 39.844 45.856 State funded 43.834 .788 42.287 45.382
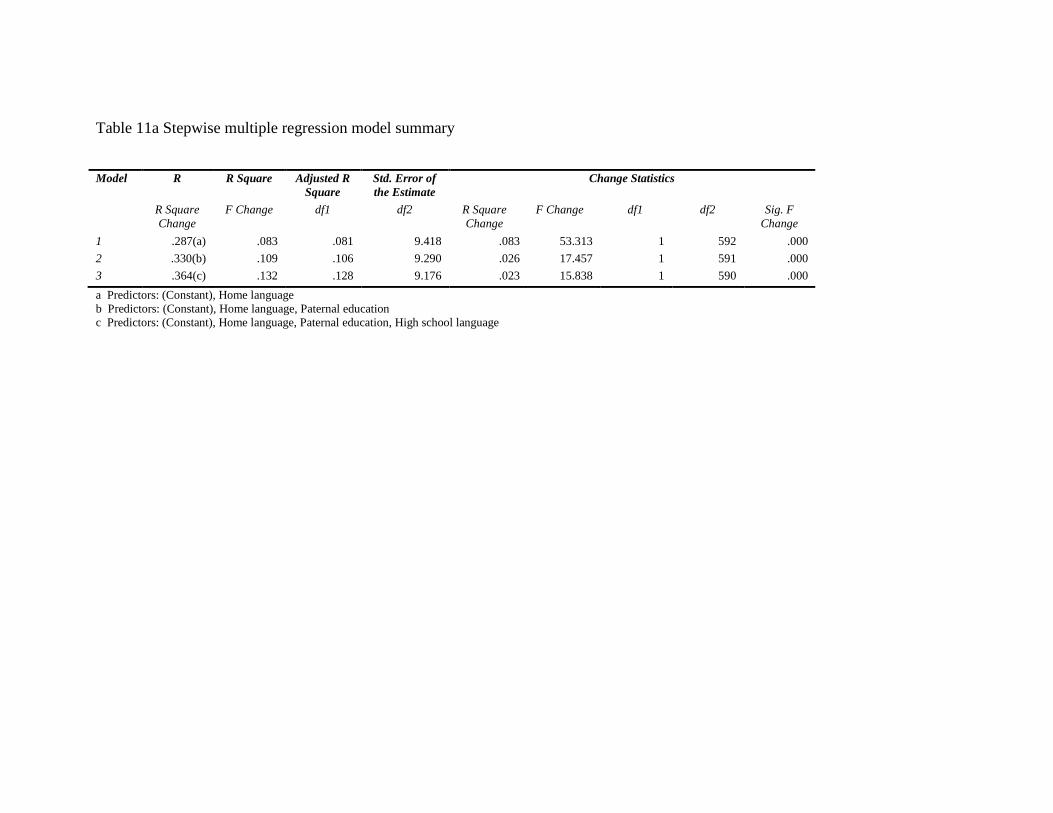
Table 11a Stepwise multiple regression model summary
Model R R Square Adjusted R
Square Std. Error of the Estimate
Change Statistics
R Square Change
F Change df1 df2 R Square Change
F Change df1 df2 Sig. F Change
1 .287(a) .083 .081 9.418 .083 53.313 1 592 .000 2 .330(b) .109 .106 9.290 .026 17.457 1 591 .000 3 .364(c) .132 .128 9.176 .023 15.838 1 590 .000 a Predictors: (Constant), Home language b Predictors: (Constant), Home language, Paternal education c Predictors: (Constant), Home language, Paternal education, High school language

Table 11b ANOVA for stepwise multiple regression
Model Sum of
Squares df Mean Square F Sig.
1 Regression 4729.268 1 4729.268 53.313 .000(a) Residual 52514.578 592 88.707 Total 57243.847 593 2 Regression 6235.906 2 3117.953 36.126 .000(b) Residual 51007.941 591 86.308 Total 57243.847 593 3 Regression 7569.410 3 2523.137 29.968 .000(c) Residual 49674.436 590 84.194 Total 57243.847 593 a Predictors: (Constant), Home language b Predictors: (Constant), Home language, Paternal education c Predictors: (Constant), Home language, Paternal education, High school language d Dependent Variable: SRAVEN

Table 11c Coefficients for stepwise multiple regression
Model Unstandardized
Coefficients Standar
dized Coeffici
ents
t Sig. Correlations
B Std. Error Beta Zero-order
Partial Zero-order Partial Part
1 (Constant) 50.382 1.121 44.925 .000 Home language -3.896 .534 -.287 -7.302 .000 -.287 -.287 -.287 2 (Constant) 44.682 1.756 25.439 .000 Home language -3.849 .526 -.284 -7.311 .000 -.287 -.288 -.284 Paternal Education 3.371 .807 .162 4.178 .000 .168 .169 .162 3 (Constant) 41.691 1.891 22.052 .000 Home language -4.225 .528 -.312 -7.994 .000 -.287 -.313 -.307 Paternal Education 3.254 .797 .157 4.081 .000 .168 .166 .157 Medium of language (high school) 2.563 .644 .155 3.980 .000 .105 .162 .153 a Dependent Variable: SRAVEN