Downloaded from dmd.aspetjournals.org at ASPET...
34
DMD # 77834 1 TITLE PAGE Evaluation of clinical drug interaction potential of clofazimine using static and dynamic modeling approaches Ramachandra Sangana, Helen Gu, Dung Yu Chun, and Heidi J. Einolf Novartis Healthcare Pvt. Ltd., Hyderabad, India (R.S.); Novartis Institutes for Biomedical Research, East Hanover, New Jersey, USA (H.G., D.Y.C., H.J.E.) Current affiliation (D.Y.C.): Insmed Inc., Bridgewater, New Jersey, USA This article has not been copyedited and formatted. The final version may differ from this version. DMD Fast Forward. Published on October 16, 2017 as DOI: 10.1124/dmd.117.077834 at ASPET Journals on August 28, 2018 dmd.aspetjournals.org Downloaded from
Transcript of Downloaded from dmd.aspetjournals.org at ASPET...
DMD # 77834
1
TITLE PAGE
Evaluation of clinical drug interaction potential of clofazimine using static and dynamic
modeling approaches
Ramachandra Sangana, Helen Gu, Dung Yu Chun, and Heidi J. Einolf
Novartis Healthcare Pvt. Ltd., Hyderabad, India (R.S.); Novartis Institutes for Biomedical
Research, East Hanover, New Jersey, USA (H.G., D.Y.C., H.J.E.)
Current affiliation (D.Y.C.): Insmed Inc., Bridgewater, New Jersey, USA
This article has not been copyedited and formatted. The final version may differ from this version.DMD Fast Forward. Published on October 16, 2017 as DOI: 10.1124/dmd.117.077834
at ASPE
T Journals on A
ugust 28, 2018dm
d.aspetjournals.orgD
ownloaded from
DMD # 77834
2
RUNNING TITLE PAGE
Running title:
Clinical drug interaction potential of clofazimine
Corresponding author:
Heidi J. Einolf, Ph.D
Novartis Pharmaceuticals Corporation
East Hanover, New Jersey, United States
Tel.: +1-862-778-3119
Email: [email protected]
Number of text pages: 32
Number of tables: 8
Number of figures: 0
References: 29
Number of words in Abstract: 219
Number of words in Introduction: 542
Number of words in Discussion: 827
This article has not been copyedited and formatted. The final version may differ from this version.DMD Fast Forward. Published on October 16, 2017 as DOI: 10.1124/dmd.117.077834
at ASPE
T Journals on A
ugust 28, 2018dm
d.aspetjournals.orgD
ownloaded from
DMD # 77834
3
Abbreviations:
ADMEt, absorption, distribution, metabolism, excretion, and toxicity; AUC, area under the
plasma concentration-time curve; AUCR, AUC ratio; AUCi, fold increase in the exposure of a
substrate after co-administration with a strong inhibitor; AUCinf, area under the plasma
concentration-time curve from 0 to infinity; B/P, blood-to-plasma ratio; Cmax, maximum plasma
concentration; CL, plasma clearance; CLint, intrinsic clearance; CLiv, in vivo intravenous
clearance; CYP, cytochrome P450; DDI, drug–drug interaction; DR-TB, drug-resistant TB;
ENL, erythema nodosum leprosum; Fa, fraction of dose absorbed from gastrointestinal tract;
FDA, Food and Drug Administration; Fg, fraction of dose that escapes intestinal first-pass
elimination; fm, fraction metabolized by an enzyme; fmCYP, fraction of total systemic clearance of
substrate that is metabolized by an individual CYP enzyme; fu, unbound fraction; fugut, fraction
unbound in the enterocyte; fup, fraction unbound in plasma; fumic, unbound fraction in
microsomes; g, gut; HIV, human immunodeficiency virus; HLM, human liver microsomes;
hPPB, human plasma protein binding; [I], inhibitor concentration; IC50, half maximal inhibitory
concentration; [Ient], enterocyte concentration; [Ih], hepatic concentration; iv, intravenous; ka,
first-order absorption rate constant in vivo; Ki, enzyme-inhibitor constant; Ki,u, unbound
inhibition constant; Km, Michaelis–Menten constant; kobs, observed rate of inactivation; l, liver;
LC-MS/MS, liquid chromatography–tandem mass spectrometry; logPo:w, logarithmic partition
coefficient octanol:water; MDR-TB, multidrug-resistant TB; NADPH, nicotinamide adenine
dinucleotide phosphate; PBPK, physiologically-based pharmacokinetics; Peff,man, effective
permeability in man; PK, pharmacokinetics; pKa, acid dissociation constant; PopPK, population
pharmacokinetics, Qent, enterocytic blood flow; RR-TB, rifampicin-resistant TB; TB,
tuberculosis; TDI, time-dependent inhibition; Tlag, lag time; Tmax, time to reach maximum plasma
This article has not been copyedited and formatted. The final version may differ from this version.DMD Fast Forward. Published on October 16, 2017 as DOI: 10.1124/dmd.117.077834
at ASPE
T Journals on A
ugust 28, 2018dm
d.aspetjournals.orgD
ownloaded from
DMD # 77834
4
concentration; Vsac, single adjusted compartment volume; Vss, volume of distribution at steady
state; XDR-TB, extensively drug-resistant TB.
This article has not been copyedited and formatted. The final version may differ from this version.DMD Fast Forward. Published on October 16, 2017 as DOI: 10.1124/dmd.117.077834
at ASPE
T Journals on A
ugust 28, 2018dm
d.aspetjournals.orgD
ownloaded from
DMD # 77834
5
ABSTRACT
The 2016 World Health Organization treatment recommendations for drug-resistant tuberculosis
(DR-TB) positioned clofazimine as a core second-line drug. Being identified as a cytochrome
P450 (CYP) inhibitor in vitro, a CYP-mediated drug interaction may be likely when clofazimine
is co-administered with substrates of these enzymes. The CYP-mediated drug interaction
potential of clofazimine was evaluated using both static (estimation of “R1” and area under the
plasma concentration-time curve ratio [AUCR] values) and dynamic (physiologically based
pharmacokinetic [PBPK]) modeling approaches. For static and dynamic predictions, midazolam,
repaglinide, and desipramine were used as probe substrates for CYP3A4/5, CYP2C8, and
CYP2D6, respectively. The AUCR static model estimations for clofazimine with the substrates
midazolam, repaglinide, and desipramine were 5.59, 1.34, and 1.69, respectively. The fold
increase in AUC predicted for midazolam, repaglinide, and desipramine with clofazimine based
upon PBPK modeling was 2.69, 1.60, and 1.47, respectively. Clofazimine was predicted to be a
moderate to strong CYP3A4/5 inhibitor and weak CYP2C8 and CYP2D6 inhibitor based on the
calculated AUCR by static and PBPK modeling. Additionally, for selected antiretroviral,
antitubercular, antihypertensive, antidiabetic, antileprotics, and antihyperlipidemic CYP3A4/5
substrate drugs, approximately 2- to 6-fold increases in the AUC were predicted with static
modeling when co-administered with 100 mg of clofazimine. Therefore, the possibility of an
increase in the AUC of CYP3A4/5 substrates when co-administered with clofazimine cannot be
ignored.
This article has not been copyedited and formatted. The final version may differ from this version.DMD Fast Forward. Published on October 16, 2017 as DOI: 10.1124/dmd.117.077834
at ASPE
T Journals on A
ugust 28, 2018dm
d.aspetjournals.orgD
ownloaded from
DMD # 77834
6
INTRODUCTION
Tuberculosis (TB) is an airborne infectious disease caused by organisms of the Mycobacterium
tuberculosis complex. Over the past two decades, the incidence of TB has declined in most
regions of the world; however, the emergence of resistance to anti-TB drugs is a threat to the
gains in TB control. Drug-resistant TB (DR-TB) cases are majorly of three types: a) rifampicin-
resistant TB (RR-TB), caused by bacteria that do not respond to rifampicin; b) multidrug-
resistant TB (MDR-TB), caused by bacteria that do not respond to, at least, isoniazid and
rifampicin; and c) extensively drug-resistant TB (XDR-TB), a form of MDR-TB that is also
resistant to fluoroquinolones and second-line injectable drugs (WHO MDR-TB factsheet, 2016).
Clofazimine is an antimycobacterial agent originally developed in the 1950s for TB and
currently approved for the treatment of lepromatous leprosy and its complication, erythema
nodosum leprosum (ENL) (Hwang et al., 2014; Fajardo et al., 1999). Clofazimine has been used
off-label as a second-line TB drug in a multidrug regimen for DR-TB (Companion hand book to
WHO guidelines, 2014). Publication of various drug regimens used by the Damien Foundation in
Bangladesh (Van Deun et al., 2010), which included clofazimine as part of the treatment
protocol, has drawn attention of researchers, and authors have continued to study clofazimine as
part of a multidrug regimen in the treatment of MDR-TB (Dooley et al., 2013). Among the five
different regimens used in Bangladesh, the regimen containing clofazimine for MDR-TB had a
low failure rate and a treatment default rate of 7.9% without any relapses up to2 years in cured
patients (Van Deun et al., 2010). In the follow-up study, 84.4% of patients had bacteriologically
favorable treatment outcomes after 2 years (Aung et al., 2014). A similar outcome has been
reported from countries in Africa (Piubello et al., 2014, Kuaban et al., 2015). The 2016 World
This article has not been copyedited and formatted. The final version may differ from this version.DMD Fast Forward. Published on October 16, 2017 as DOI: 10.1124/dmd.117.077834
at ASPE
T Journals on A
ugust 28, 2018dm
d.aspetjournals.orgD
ownloaded from
DMD # 77834
7
Health Organization (WHO) DR-TB treatment guidelines positioned clofazimine as a core
second-line drug (Group C) (WHO treatment guidelines: drug resistant tuberculosis, 2016).
In 2015, an estimated 10.4 million new (incident) TB cases were reported worldwide, and among
these, 1.2 million (11%) cases had been living with human immunodeficiency virus (HIV). In
addition to the 1.4 million TB deaths in 2015, 0.4 million deaths were reported among people
living with HIV (WHO Global tuberculosis report, 2016). TB is one of the most common
opportunistic infections and a leading cause of death in HIV patients (WHO Global tuberculosis
report, 2016). The augmented reports of MDR-TB and synergistic interactions with the HIV
epidemic are posing difficult challenges for effective management and control of TB (Zumla et
al., 2013).
Clofazimine is always prescribed as part of multidrug regimen for the treatment of DR-TB.
Given that TB is a known comorbidity in patients with HIV, concomitant administration of anti-
HIV drugs with clofazimine is most likely. In vitro cytochrome P450 (CYP) inhibition results
(Supplemental Table 1) suggested that clofazimine has reversible inhibitory effects on
CYP3A4/5, CYP2C8, and CYP2D6 at concentrations of up to 10 μM.
Therefore, it becomes imperative to evaluate the drug interaction potential of clofazimine with
drugs that are substrates for CYP3A4/5, CYP2C9, and CYP2D6. This study evaluated the
CYP3A4/5, CYP2C8 and CYP2D6 inhibition-mediated drug interaction potential of clofazimine
(as a perpetrator) using static and dynamic (i.e., physiologically based pharmacokinetic [PBPK])
models.
This article has not been copyedited and formatted. The final version may differ from this version.DMD Fast Forward. Published on October 16, 2017 as DOI: 10.1124/dmd.117.077834
at ASPE
T Journals on A
ugust 28, 2018dm
d.aspetjournals.orgD
ownloaded from
DMD # 77834
8
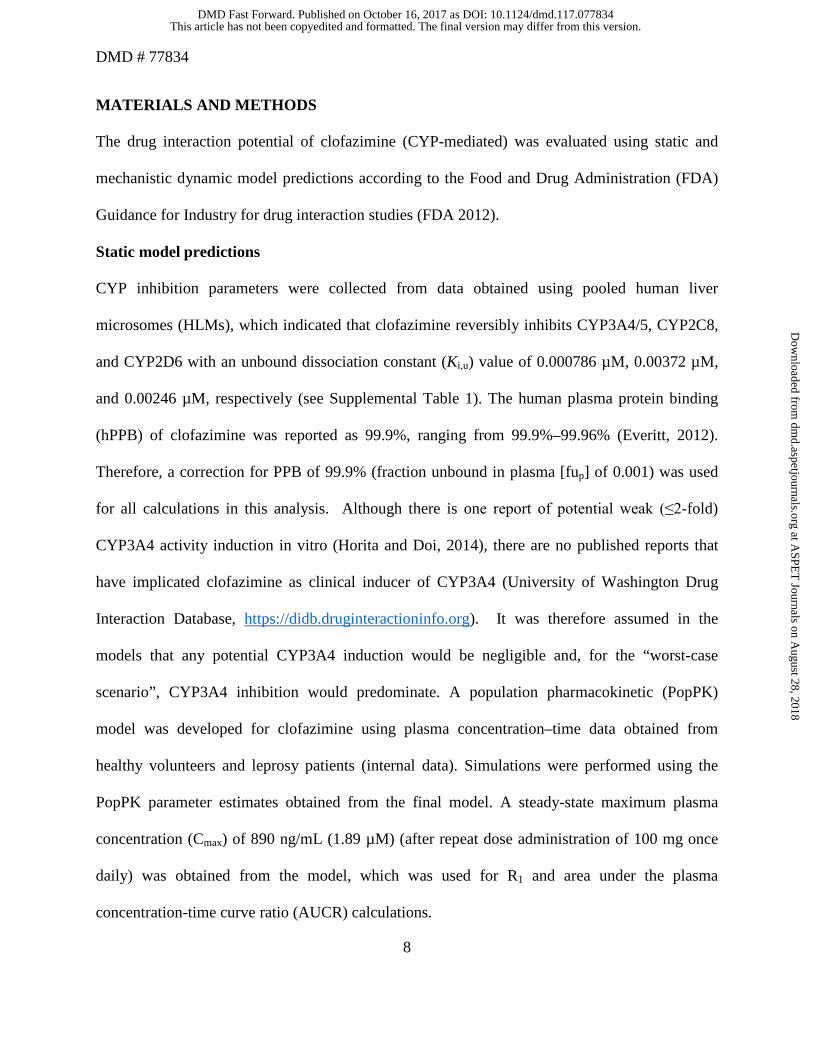
MATERIALS AND METHODS
The drug interaction potential of clofazimine (CYP-mediated) was evaluated using static and
mechanistic dynamic model predictions according to the Food and Drug Administration (FDA)
Guidance for Industry for drug interaction studies (FDA 2012).
Static model predictions
CYP inhibition parameters were collected from data obtained using pooled human liver
microsomes (HLMs), which indicated that clofazimine reversibly inhibits CYP3A4/5, CYP2C8,
and CYP2D6 with an unbound dissociation constant (Ki,u) value of 0.000786 µM, 0.00372 µM,
and 0.00246 µM, respectively (see Supplemental Table 1). The human plasma protein binding
(hPPB) of clofazimine was reported as 99.9%, ranging from 99.9%–99.96% (Everitt, 2012).
Therefore, a correction for PPB of 99.9% (fraction unbound in plasma [fup] of 0.001) was used
for all calculations in this analysis. Although there is one report of potential weak (≤2-fold)
CYP3A4 activity induction in vitro (Horita and Doi, 2014), there are no published reports that
have implicated clofazimine as clinical inducer of CYP3A4 (University of Washington Drug
Interaction Database, https://didb.druginteractioninfo.org). It was therefore assumed in the
models that any potential CYP3A4 induction would be negligible and, for the “worst-case
scenario”, CYP3A4 inhibition would predominate. A population pharmacokinetic (PopPK)
model was developed for clofazimine using plasma concentration–time data obtained from
healthy volunteers and leprosy patients (internal data). Simulations were performed using the
PopPK parameter estimates obtained from the final model. A steady-state maximum plasma
concentration (Cmax) of 890 ng/mL (1.89 µM) (after repeat dose administration of 100 mg once
daily) was obtained from the model, which was used for R1 and area under the plasma
concentration-time curve ratio (AUCR) calculations.
This article has not been copyedited and formatted. The final version may differ from this version.DMD Fast Forward. Published on October 16, 2017 as DOI: 10.1124/dmd.117.077834
at ASPE
T Journals on A
ugust 28, 2018dm
d.aspetjournals.orgD
ownloaded from
DMD # 77834
9
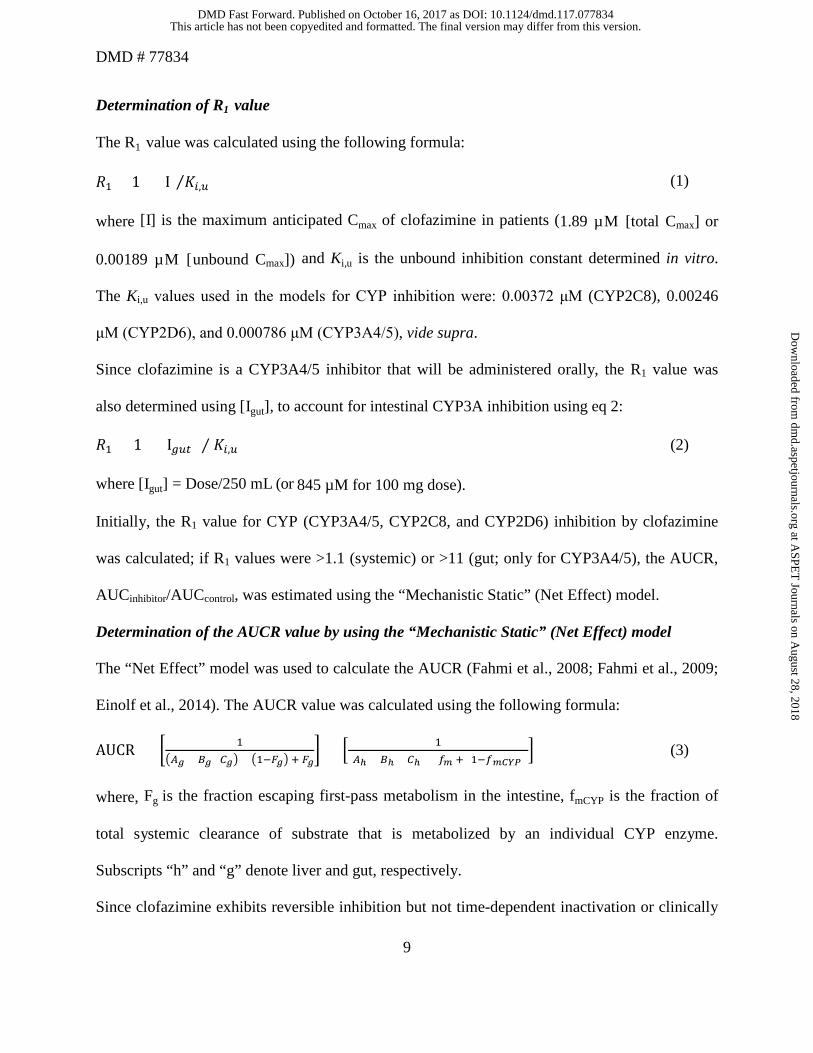
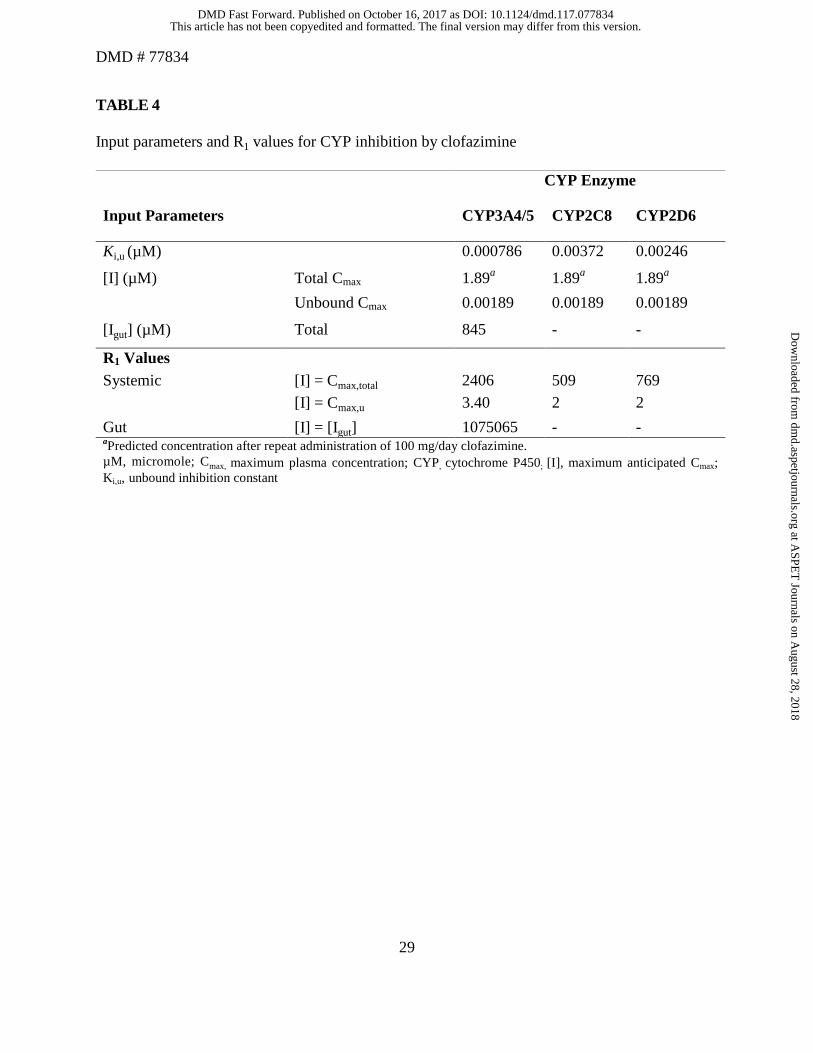
Determination of R1 value
The R1 value was calculated using the following formula:
𝑅𝑅1 = 1 + [I] 𝐾𝐾𝑖𝑖,𝑢𝑢⁄ (1)
where [I] is the maximum anticipated Cmax of clofazimine in patients (1.89 µM [total Cmax] or
0.00189 µM [unbound Cmax]) and Ki,u is the unbound inhibition constant determined in vitro.
The Ki,u values used in the models for CYP inhibition were: 0.00372 μM (CYP2C8), 0.00246
μM (CYP2D6), and 0.000786 μM (CYP3A4/5), vide supra.
Since clofazimine is a CYP3A4/5 inhibitor that will be administered orally, the R1 value was
also determined using [Igut], to account for intestinal CYP3A inhibition using eq 2:
𝑅𝑅1 = 1 + [I𝑔𝑔𝑢𝑢𝑔𝑔] ⁄ 𝐾𝐾𝑖𝑖,𝑢𝑢 (2)
where [Igut] = Dose/250 mL (or 845 µM for 100 mg dose).
Initially, the R1 value for CYP (CYP3A4/5, CYP2C8, and CYP2D6) inhibition by clofazimine
was calculated; if R1 values were >1.1 (systemic) or >11 (gut; only for CYP3A4/5), the AUCR,
AUCinhibitor/AUCcontrol, was estimated using the “Mechanistic Static” (Net Effect) model.
Determination of the AUCR value by using the “Mechanistic Static” (Net Effect) model
The “Net Effect” model was used to calculate the AUCR (Fahmi et al., 2008; Fahmi et al., 2009;
Einolf et al., 2014). The AUCR value was calculated using the following formula:
AUCR = � 1�𝐴𝐴𝑔𝑔 × 𝐵𝐵𝑔𝑔×𝐶𝐶𝑔𝑔� × �1−𝐹𝐹𝑔𝑔� + 𝐹𝐹𝑔𝑔
� × � 1(𝐴𝐴ℎ × 𝐵𝐵ℎ × 𝐶𝐶ℎ) × 𝑓𝑓𝑚𝑚 + (1−𝑓𝑓𝑚𝑚𝑚𝑚𝑚𝑚𝑚𝑚 )
� (3)
where, Fg is the fraction escaping first-pass metabolism in the intestine, fmCYP is the fraction of
total systemic clearance of substrate that is metabolized by an individual CYP enzyme.
Subscripts “h” and “g” denote liver and gut, respectively.
Since clofazimine exhibits reversible inhibition but not time-dependent inactivation or clinically
This article has not been copyedited and formatted. The final version may differ from this version.DMD Fast Forward. Published on October 16, 2017 as DOI: 10.1124/dmd.117.077834
at ASPE
T Journals on A
ugust 28, 2018dm
d.aspetjournals.orgD
ownloaded from
DMD # 77834
10
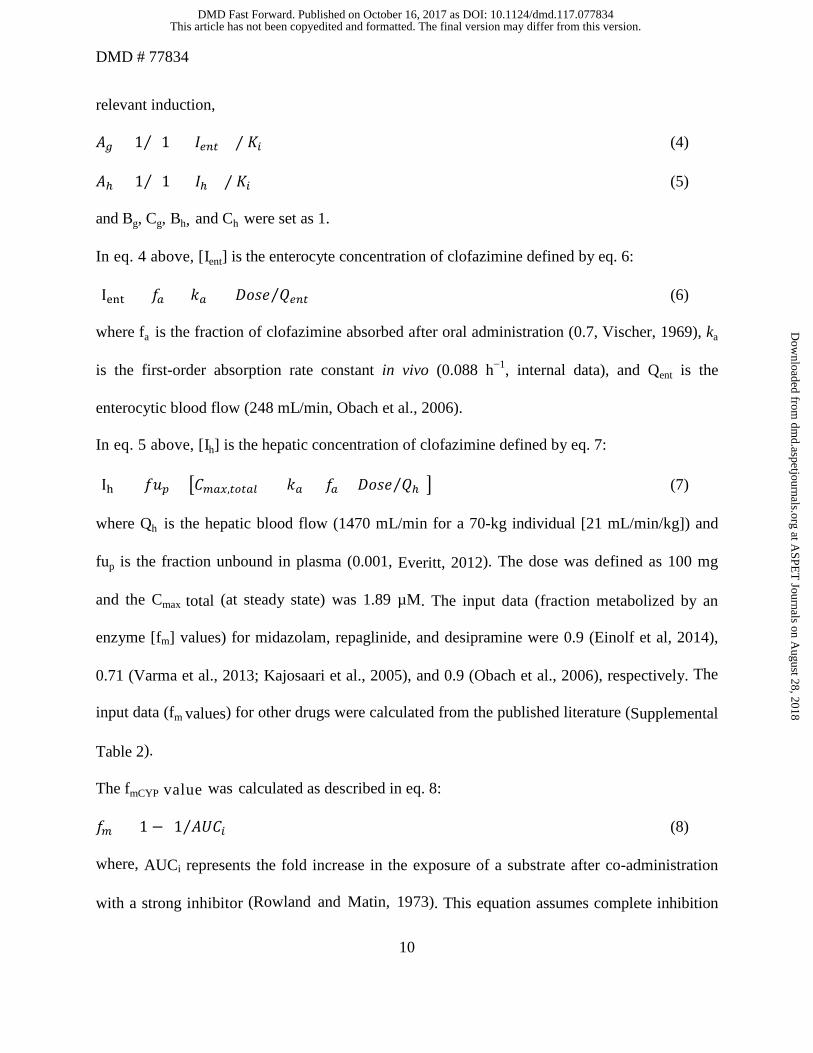
relevant induction,
𝐴𝐴𝑔𝑔 = 1 (⁄ 1 + [𝐼𝐼𝑒𝑒𝑒𝑒𝑔𝑔]) ⁄ 𝐾𝐾𝑖𝑖 (4)
𝐴𝐴ℎ = 1 (⁄ 1 + [𝐼𝐼ℎ]) ⁄ 𝐾𝐾𝑖𝑖 (5)
and Bg, Cg, Bh, and Ch were set as 1.
In eq. 4 above, [Ient] is the enterocyte concentration of clofazimine defined by eq. 6:
[Ient] = 𝑓𝑓𝑎𝑎 × 𝑘𝑘𝑎𝑎 × 𝐷𝐷𝐷𝐷𝐷𝐷𝐷𝐷 𝑄𝑄𝑒𝑒𝑒𝑒𝑔𝑔⁄ (6)
where fa is the fraction of clofazimine absorbed after oral administration (0.7, Vischer, 1969), ka
is the first-order absorption rate constant in vivo (0.088 h−1, internal data), and Qent is the
enterocytic blood flow (248 mL/min, Obach et al., 2006).
In eq. 5 above, [Ih] is the hepatic concentration of clofazimine defined by eq. 7:
[Ih] = 𝑓𝑓𝑓𝑓𝑝𝑝 × �𝐶𝐶𝑚𝑚𝑎𝑎𝑚𝑚,𝑔𝑔𝑡𝑡𝑔𝑔𝑎𝑎𝑡𝑡 + (𝑘𝑘𝑎𝑎 × 𝑓𝑓𝑎𝑎 × 𝐷𝐷𝐷𝐷𝐷𝐷𝐷𝐷 𝑄𝑄ℎ⁄ )� (7)
where Qh is the hepatic blood flow (1470 mL/min for a 70-kg individual [21 mL/min/kg]) and
fup is the fraction unbound in plasma (0.001, Everitt, 2012). The dose was defined as 100 mg
and the Cmax total (at steady state) was 1.89 µM. The input data (fraction metabolized by an
enzyme [fm] values) for midazolam, repaglinide, and desipramine were 0.9 (Einolf et al, 2014),
0.71 (Varma et al., 2013; Kajosaari et al., 2005), and 0.9 (Obach et al., 2006), respectively. The
input data (fm values) for other drugs were calculated from the published literature (Supplemental
Table 2).
The fmCYP value was calculated as described in eq. 8:
𝑓𝑓𝑚𝑚 = [1 − (1 𝐴𝐴𝐴𝐴𝐶𝐶𝑖𝑖⁄ )] (8)
where, AUCi represents the fold increase in the exposure of a substrate after co-administration
with a strong inhibitor (Rowland and Matin, 1973). This equation assumes complete inhibition
This article has not been copyedited and formatted. The final version may differ from this version.DMD Fast Forward. Published on October 16, 2017 as DOI: 10.1124/dmd.117.077834
at ASPE
T Journals on A
ugust 28, 2018dm
d.aspetjournals.orgD
ownloaded from
DMD # 77834
11
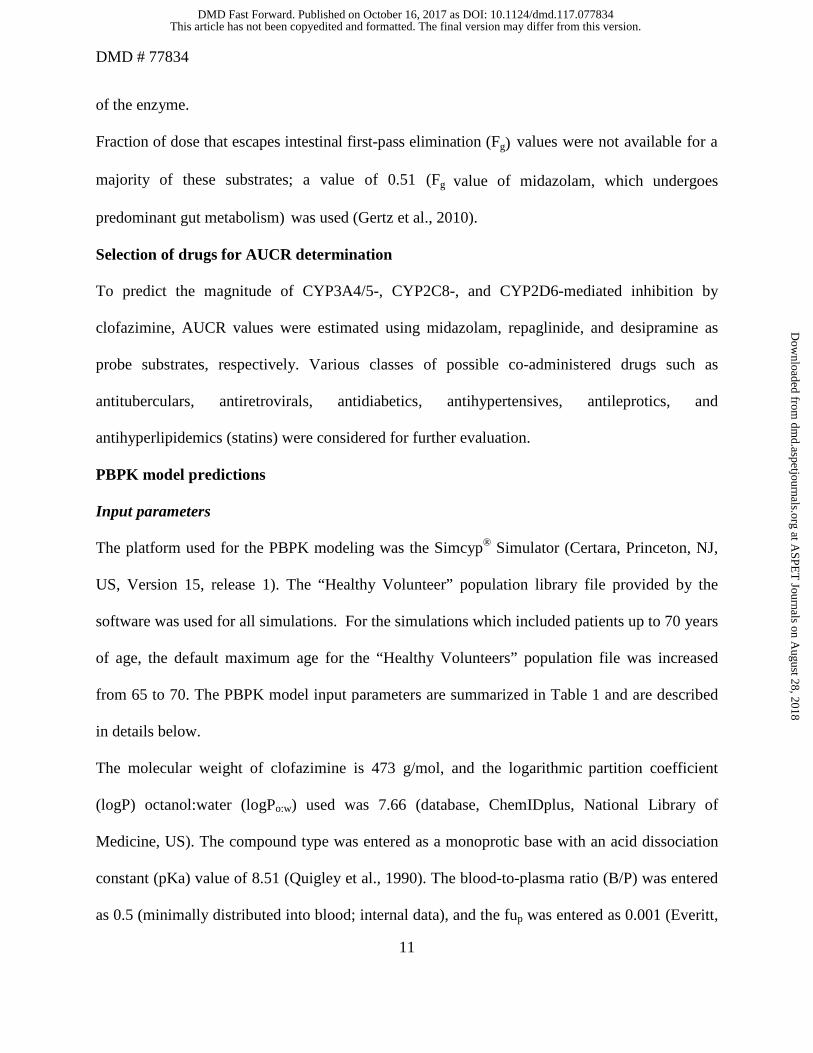
of the enzyme.
Fraction of dose that escapes intestinal first-pass elimination (Fg) values were not available for a
majority of these substrates; a value of 0.51 (Fg value of midazolam, which undergoes
predominant gut metabolism) was used (Gertz et al., 2010).
Selection of drugs for AUCR determination
To predict the magnitude of CYP3A4/5-, CYP2C8-, and CYP2D6-mediated inhibition by
clofazimine, AUCR values were estimated using midazolam, repaglinide, and desipramine as
probe substrates, respectively. Various classes of possible co-administered drugs such as
antituberculars, antiretrovirals, antidiabetics, antihypertensives, antileprotics, and
antihyperlipidemics (statins) were considered for further evaluation.
PBPK model predictions
Input parameters
The platform used for the PBPK modeling was the Simcyp® Simulator (Certara, Princeton, NJ,
US, Version 15, release 1). The “Healthy Volunteer” population library file provided by the
software was used for all simulations. For the simulations which included patients up to 70 years
of age, the default maximum age for the “Healthy Volunteers” population file was increased
from 65 to 70. The PBPK model input parameters are summarized in Table 1 and are described
in details below.
The molecular weight of clofazimine is 473 g/mol, and the logarithmic partition coefficient
(logP) octanol:water (logPo:w) used was 7.66 (database, ChemIDplus, National Library of
Medicine, US). The compound type was entered as a monoprotic base with an acid dissociation
constant (pKa) value of 8.51 (Quigley et al., 1990). The blood-to-plasma ratio (B/P) was entered
as 0.5 (minimally distributed into blood; internal data), and the fup was entered as 0.001 (Everitt,
This article has not been copyedited and formatted. The final version may differ from this version.DMD Fast Forward. Published on October 16, 2017 as DOI: 10.1124/dmd.117.077834
at ASPE
T Journals on A
ugust 28, 2018dm
d.aspetjournals.orgD
ownloaded from
DMD # 77834
12
2012). A first-order absorption model was used and the fraction of dose absorbed (fa) was
entered as 0.7 (Vischer, 1969). A parameter sensitivity analysis was performed on the impact of
the clofazamine fa value on the drug interaction with the sensitive CYP3A4 substrate, midazolam
(Supplemental Fig. 1A). Varying the fa value from 0.42 to 0.98 (0.7 ± 40% of value used in the
model) resulted in a predicted midazolam AUC ratio range of 2.2-3.7 and were within 38% of
the predicted AUC ratio of 2.7 with a fa value of 0.7. The results of this parameter sensitivity
analysis suggested that the CYP3A DDI was not highly sensitive to the clofazimine fa values
evaluated and would remain categorized as a moderate CYP3A4 inhibitor. The absorption rate
constant (ka) used was 0.25 h−1 and the lag time (Tlag) was entered as 0.55 h. These values were
optimized to predict the pharmacokinetic (PK) parameters (e.g. Cmax, Tmax). The effective
permeability in humans (Peff,man) was user defined as 4.38 × 10⁻⁴ cm/s, predicted based on the
clofazimine chemical structure by using the absorption, distribution, metabolism, excretion, and
toxicity (ADMEt) predictor in GastroPlus™ (Simulations Plus, Inc., Lancaster, CA, US). The
Qgut value was predicted as 12.7 L/h by the Simcyp® Simulator. The fraction unbound in the
enterocyte (fugut) value was set at 0.001 (assuming same as fup). The coefficient of variation
(CV, 30%) for input parameters was the default value in the Simcyp® Simulator. In addition,
sensitivity analyses of clofazimine fugut as well as the ka value were performed to determine the
impact of these values on the drug interaction with midazolam. The results of the sensitivity
analysis can be found in the Supplemental Fig. 1B and Fig. 1C. Variation of fugut (range of
0.001 to 1) resulted in minimal impact in the midazolam AUC ratio (range of 3.0 to 3.9) and
categorization of the DDI. The predicted DDI of clofazimine with midazolam was not sensitive
to ka values ranging from 0.088 to 0.25 h-1 (i.e. values used in either the static or PBPK models).
The minimal PBPK model in the Simcyp® Simulator was used with a single adjusting
This article has not been copyedited and formatted. The final version may differ from this version.DMD Fast Forward. Published on October 16, 2017 as DOI: 10.1124/dmd.117.077834
at ASPE
T Journals on A
ugust 28, 2018dm
d.aspetjournals.orgD
ownloaded from
DMD # 77834
13
compartment. The input parameters for distribution were optimized to best fit the PK data
obtained from the clinical trial (PopPK analysis, internal data); the volume of distribution at
steady state (Vss), inter-compartment clearance (Q), and single adjusted compartment volume
(Vsac) were estimated to be 47.5 L/kg, 42.6 L/h, and 32.7 L/kg, respectively. The in vivo
intravenous (iv) clearance (CLiv) was user defined as 4.18 L/h, also optimized to best fit of the
PK data from the clinical trial. Renal clearance (CLR) of clofazimine was deemed to be
negligible as less than 1% of the administered drug was reported to be eliminated in the urine
(Levy 1974). The inhibition parameters entered in the Simcyp® Simulator were already
corrected for microsomal protein binding (Supplemental Table 3).
Model performance and application
PK trial simulations
The PK parameter inputs for simulation were estimated using the clinical PK data of
clofazimine. The simulated data were qualified using the observed PK data from the same study
(Table 2).
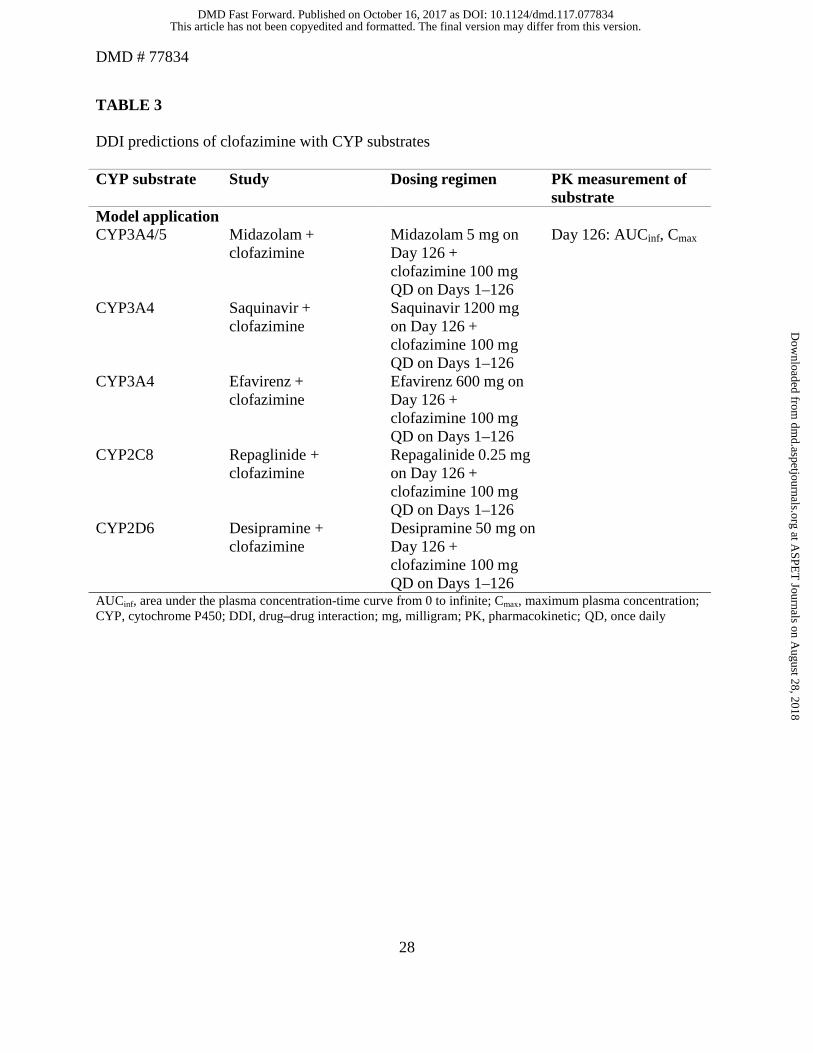
Drug–drug interaction (DDI) predictions of clofazimine as a perpetrator of CYP substrates
For DDI simulations using PBPK modeling, midazolam and selected antivirals such as
saquinavir or efavirenz were considered as CYP3A4/5 substrates. Repaglinide and desipramine
were used as CYP2C8 and CYP2D6 substrates, respectively. The supplemental information
contains details of the input parameters for the substrates used in the PBPK model (Supplemental
Tables 4–8). A total of 10 trials including 10 subjects were simulated; the age range of the
simulated subjects was 18–70 years, with 50% of the population as women (Table 3).
This article has not been copyedited and formatted. The final version may differ from this version.DMD Fast Forward. Published on October 16, 2017 as DOI: 10.1124/dmd.117.077834
at ASPE
T Journals on A
ugust 28, 2018dm
d.aspetjournals.orgD
ownloaded from
DMD # 77834
14
RESULTS
Static model predictions
R1 values for CYP3A4/5 inhibition
The R1 values for CYP inhibition by clofazimine are listed in Table 4. Since the calculated R1 values
of clofazimine were >1.1 for both total and unbound maximum anticipated Cmax ([I]) and >11 for
[Igut], the AUCR was determined using the “Mechanistic Static” (Net Effect) model and by
incorporating estimated fm and Fg values of the interacting substrates.
AUCR values for clofazimine with sensitive substrates
AUCR values were determined to estimate the extent of risk with respect to CYP inhibition in
vivo when clofazimine was co-administered with CYP substrates. AUCR values of midazolam,
repaglinide, and desipramine in presence of clofazimine were estimated as 5.59, 1.34, and 1.69,
respectively. Based on these calculated net effect values, clofazimine was predicted to be a
strong CYP3A4/5 inhibitor and weak CYP2C8 and CYP2D6 inhibitor in vivo.
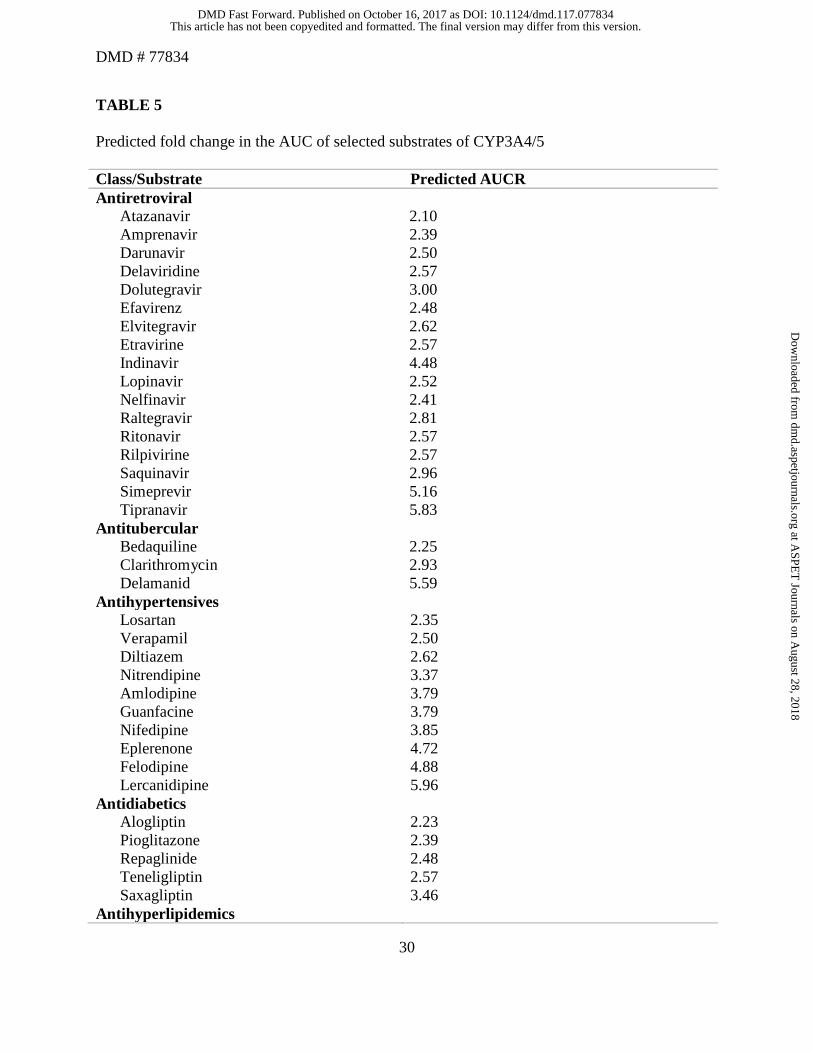
Predicted AUCR for inhibition of CYP3A4/5-mediated clearance
For the selected substrates evaluated, approximately 2- to 6-fold increase in the AUC was
predicted when co-administered with 100 mg once daily of clofazimine (Table 5).
PBPK model predictions
Simulations of clofazimine PK on Day 1 and Day 126
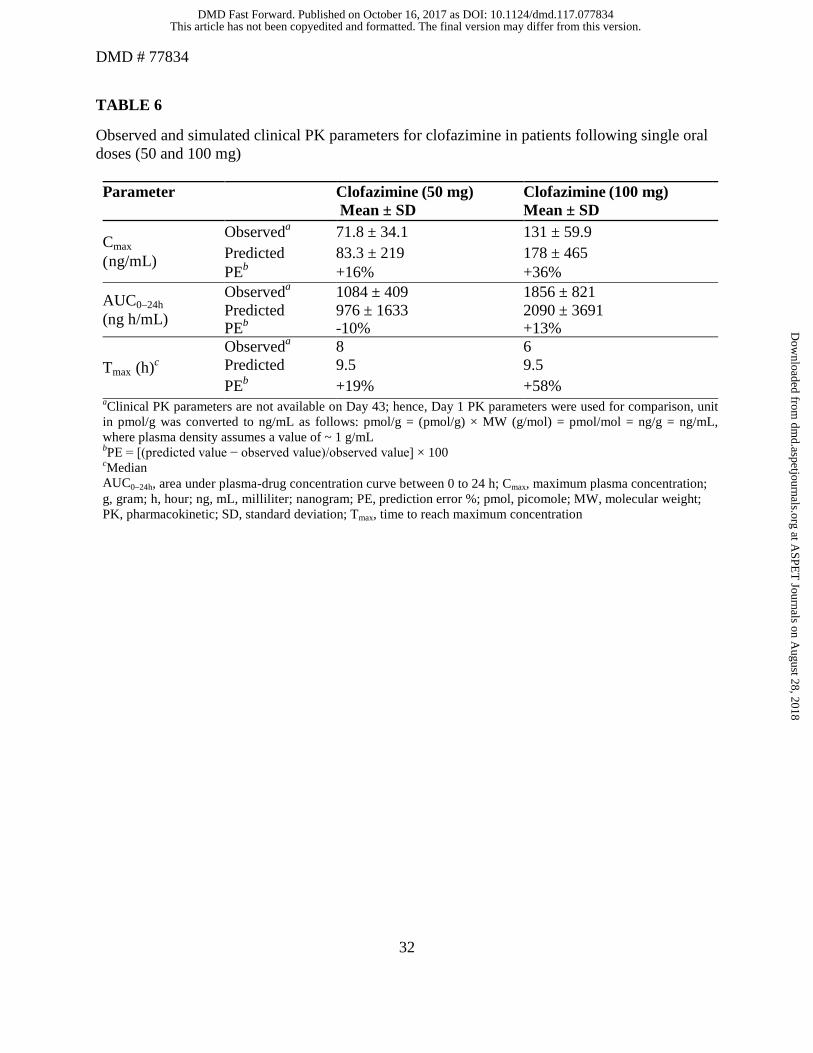
The predicted AUC, Cmax, and Tmax values on Day 1 using the PBPK model were within 2-fold
of the observed values. The observed and simulated clinical PK parameters on Day 1 for
clofazimine following single oral doses (50 and 100 mg) are summarized in Table 6. The
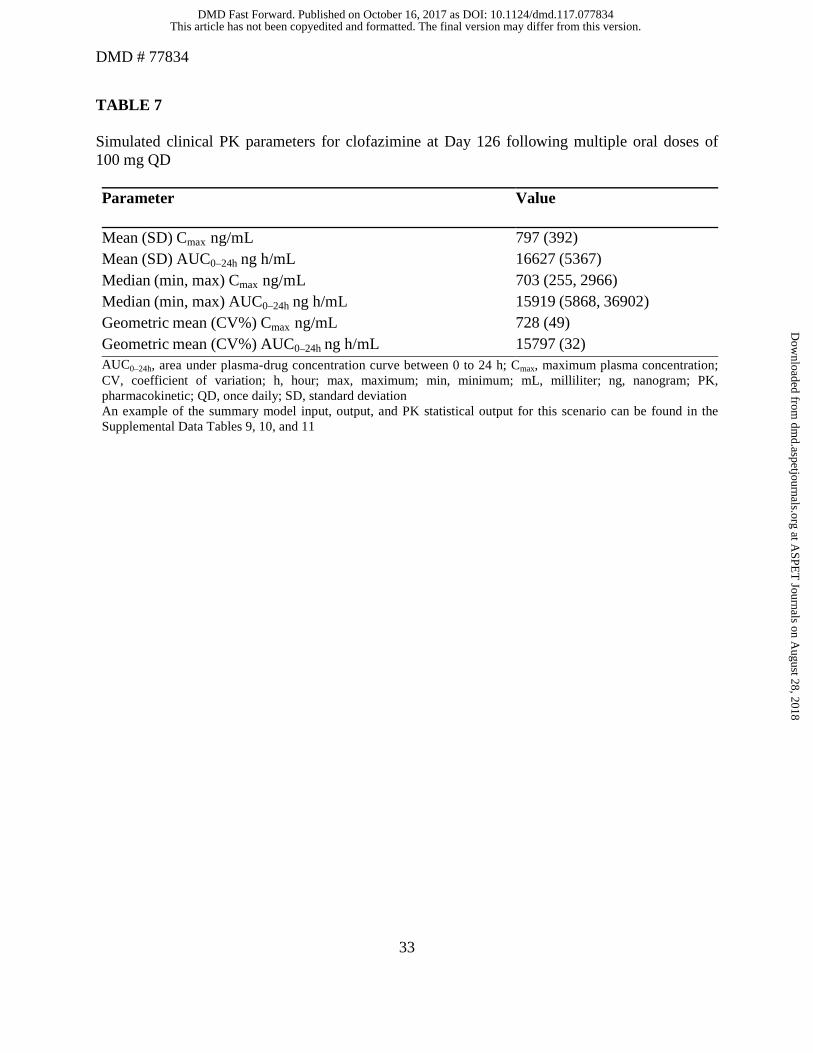
simulated clinical PK parameters for clofazimine at Day 126 following multiple oral doses of 100
mg QD can be found in Table 7. The predicted Cmax (797 ng/mL) on Day 126 after multiple
This article has not been copyedited and formatted. The final version may differ from this version.DMD Fast Forward. Published on October 16, 2017 as DOI: 10.1124/dmd.117.077834
at ASPE
T Journals on A
ugust 28, 2018dm
d.aspetjournals.orgD
ownloaded from
DMD # 77834
15
doses was comparable to the Cmax (890 ng/mL) predicted from the PopPK model, which was
used for the static model.
DDI simulations of CYP3A (midazolam, saquinavir, and efavirenz), CYP2C8 (repaglinide),
and CYP2D6 (desipramine) substrates with clofazimine
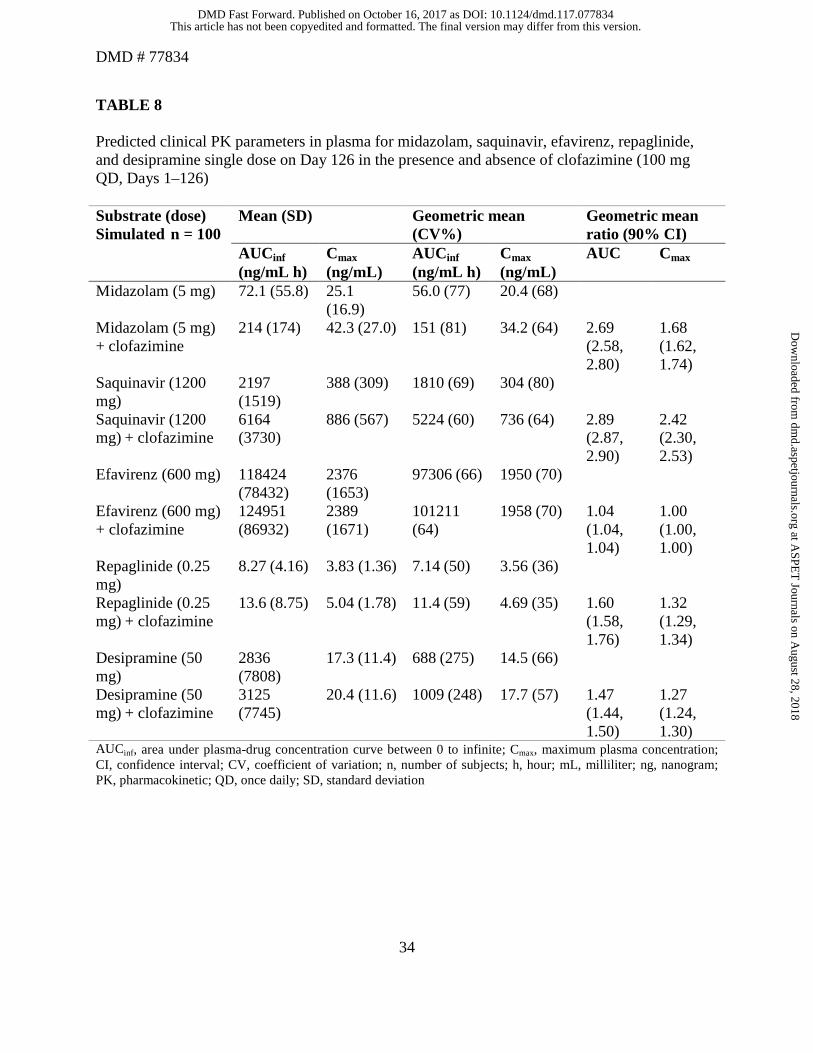
The predicted AUC and Cmax ratios for midazolam with clofazimine were predicted as 2.69 and
1.68, respectively. The predicted AUCR and Cmax ratios of saquinavir when co-administered with
clofazimine were predicted to be 2.89- and 2.42-fold, respectively. No change in AUC or Cmax
ratios was predicted by the PBPK model for efavirenz in the presence of clofazimine. In
addition, the predicted AUCRs for repaglidine (CYP2C8 substrate) and desipramine (CYP2D6
substrate) with clofazimine were 1.60 and 1.47, respectively (Table 8).
This article has not been copyedited and formatted. The final version may differ from this version.DMD Fast Forward. Published on October 16, 2017 as DOI: 10.1124/dmd.117.077834
at ASPE
T Journals on A
ugust 28, 2018dm
d.aspetjournals.orgD
ownloaded from
DMD # 77834
16
DISCUSSION
Clofazimine is currently being considered as a core second-line drug for treatment of DR-TB
(WHO, 2016). As per the WHO TB treatment guidelines, clofazimine is administered as part of a
multidrug regimen; therefore, evaluating the drug interaction potential of clofazimine will be
beneficial to arrive at appropriate dosing regimens for the co-administered drugs. In the absence
of clinical drug interaction studies, data derived from in vitro experiments and modeling was
used to predict the drug interaction potential of clofazimine.
In the static model, R1 value for clofazimine for CYP3A4/5, CYP2C8, and CYP2D6 was found
to be > 1.1 and > 11 for systemic [I] and [Igut], respectively. Therefore, the possibility of a CYP
inhibition-mediated interaction for clofazimine cannot be ruled out (FDA, 2012). The DDI
potential was further evaluated by a “Mechanistic Static” (Net Effect) model, where the AUCR
was determined using the probe substrates (midazolam, repaglinide and desipramine for
CYP3A4/5, CYP2C8 and CYP2D6, respectively). CYP inhibitors are typically classified as
strong, moderate, or weak inhibitors based on the magnitude of changes in plasma AUC of probe
substrates: ≥5-fold, strong inhibitor; between 2- and 5-fold, moderate inhibitor; and between
1.25- and 2-fold, weak inhibitor (FDA, 2012). The estimated AUCR values of clofazimine are
5.59, 1.34, and 1.69 for midazolam (CYP3A4/5), repaglinide (CYP2C8), and desipramine
(CYP2D6), respectively. Similar results were obtained for clofazimine when the DDI was
simulated using a PBPK model for repaglinide and desipramine. Thus, clofazimine can be
classified as a weak inhibitor of CYP2C8 and CYP2D6.
The fold increase in exposure predicted using the PBPK model (AUCR of 2.69) was
approximately 50% lower than that calculated using the mechanistic “Static” (Net Effect) model
(AUCR of 5.59) for midazolam. No change in AUC or Cmax was predicted by the PBPK model
This article has not been copyedited and formatted. The final version may differ from this version.DMD Fast Forward. Published on October 16, 2017 as DOI: 10.1124/dmd.117.077834
at ASPE
T Journals on A
ugust 28, 2018dm
d.aspetjournals.orgD
ownloaded from
DMD # 77834
17
for efavirenz in the presence of clofazimine; however, the static model predicted a 2.48-fold
increase in the AUC. Considering the fold increase in the AUC predicted using both the models,
clofazimine can be classified as a moderate to strong inhibitor of CYP3A4/5.
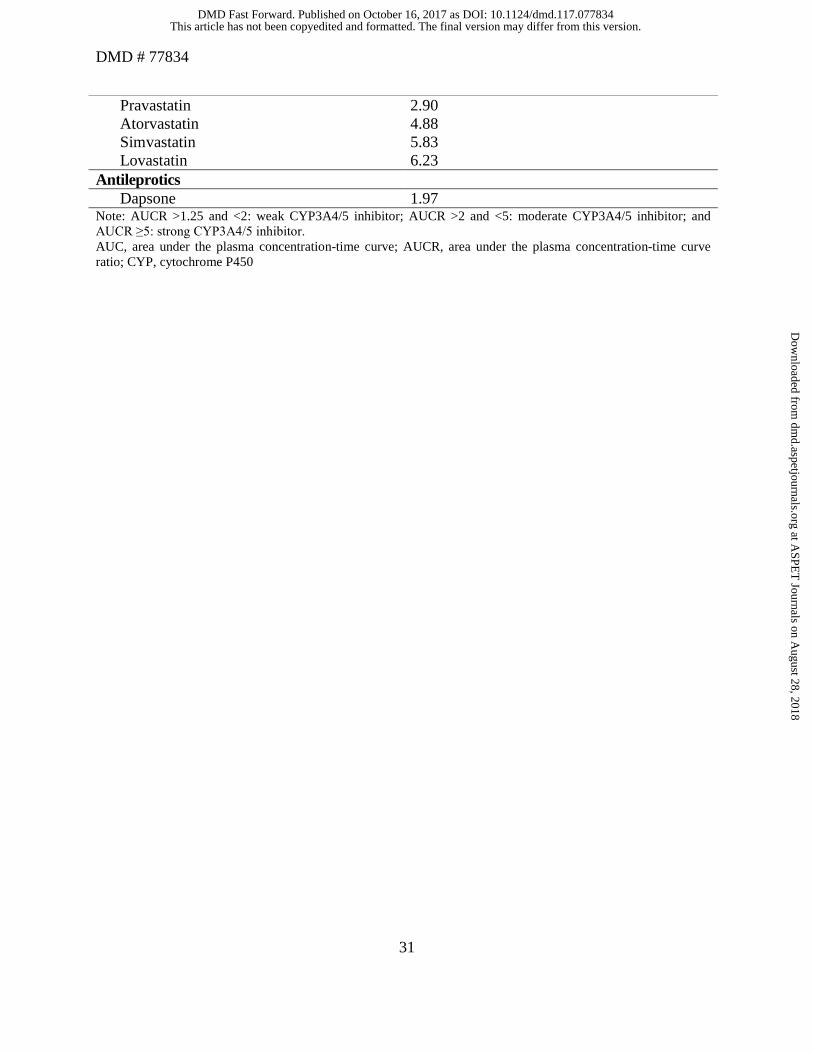
The findings from the drug interaction predictions were further qualified against the available
clinical evidence (Balakrishnan and Seshadri, 1981) where clofazimine was co-administered
with dapsone (a CYP3A4 substrate). The study concluded no significant effect on the exposure
of dapsone when administered with clofazimine (Balakrishnan and Seshadri, 1981). The AUCR
value for dapsone with clofazimine was estimated to be 1.97 and predicted weak inhibition by
clofazimine on dapsone pharmacokinetics. This is in agreement with the clinical data where no
interaction was observed. The minimal difference between the findings from the predicted and
observed value can be attributed to the fact that dapsone is also metabolized by CYP2C9 (Gill et
al., 1995).
In view of the most frequent comorbidities associated with TB and the multidrug regimen used
for DR-TB treatment, various classes of antituberculars, antiretrovirals, antidiabetics,
antihypertensives, antileprotics, and antihyperlipidemics (statins) that undergo metabolism by
CYP3A4/5 were considered for AUCR evaluation.
Clofazimine is always administered as part of a multidrug regimen, either as a shorter regimen or
conventional regimen (WHO guidelines). The shorter regimen contains kanamycin (an injectable
agent), moxifloxacin, prothionamide, clofazimine, isoniazid, pyrazinamide, and ethambutol,
given together in an initial phase of 4 months and followed by 5 months of treatment with four of
the medicines (moxifloxacin, clofazimine, pyrazinamide, and ethambutol).
For the conventional regimen, the intensive phase includes pyrazinamide and four second-line
drugs (fluoroquinolones: levofloxacin, moxifloxacin, and gatifloxacin; second-line injectables:
This article has not been copyedited and formatted. The final version may differ from this version.DMD Fast Forward. Published on October 16, 2017 as DOI: 10.1124/dmd.117.077834
at ASPE
T Journals on A
ugust 28, 2018dm
d.aspetjournals.orgD
ownloaded from
DMD # 77834
18
amikacin, capreomycin, kanamycin, and streptomycin; and core second-line agents: ethionamide/
prothionamide, cycloserine/terizidone, linezolid, and clofazimine). If the minimum of effective
TB medicines cannot be composed, either a group D2 drug (bedaquiline or delamanid), and
possibly “Group D3” agents (p-aminosalicylic acid, imipenem-cilastatin, meropenem,
amoxicillin-clavulanate, or thioacetazone) could be added. With the exception of bedaquiline
and delaminid, no CYP-mediated interaction was predicted for other antitubercular drugs
(fluroquinolones, second-line injectables, core second-line agents, and D1 and D3 agents) that
are currently recommended by WHO for treatment of DR-TB (both shorter and conventional
regimens).
For most of the tested antiretroviral drugs known to be metabolized by CYP3A4/5, moderate
interactions were assessed, with an estimation of between 2- and 5-fold increase of the AUC of
the antiretroviral drug (except simeprevir [5.13-fold] and tipranavir [5.83-fold]) when
administered concomitantly with clofazimine 100 mg /daily. Moderate inhibitions were predicted
for some of the dipeptidyl peptidase-4 inhibitors tested. Moderate to strong inhibitions were
predicted for antihypertensives and antihyperlipidemic drugs (pravastatin, atorvastatin,
simvastatin, and lovastatin) when administered concomitantly with clofazimine 100 mg/day.
In conclusion, clofazimine was predicted to be a weak CYP2C8 and CYP2D6 inhibitor and thus
the possibility of a clinically significant interaction when co-administered with CYP2C8 and
CYP2D6 substrate is minimal. Clofazimine is predicted to be a moderate to strong CYP3A4/5
inhibitor based on the net effect and PBPK modeling predictions. In the absence of a clinical
DDI study, the possibility of an increase in the AUC of CYP3A4/5 substrates when co-
administered with clofazimine cannot be ignored. Thus, a caution is recommended when
clofazimine is prescribed along with a CYP3A4/5 substrate.
This article has not been copyedited and formatted. The final version may differ from this version.DMD Fast Forward. Published on October 16, 2017 as DOI: 10.1124/dmd.117.077834
at ASPE
T Journals on A
ugust 28, 2018dm
d.aspetjournals.orgD
ownloaded from
DMD # 77834
19
ACKNOWLEDGMENTS
The authors acknowledge VS Muthuswamy (Novartis Healthcare Pvt. Ltd., Hyderabad, India)
for the literature review support for this study. The authors thank Jitendriya Mishra (Novartis
Healthcare Pvt. Ltd., Hyderabad, India) for providing medical writing assistance on this
manuscript.
This article has not been copyedited and formatted. The final version may differ from this version.DMD Fast Forward. Published on October 16, 2017 as DOI: 10.1124/dmd.117.077834
at ASPE
T Journals on A
ugust 28, 2018dm
d.aspetjournals.orgD
ownloaded from
DMD # 77834
20
AUTHOR CONTRIBUTIONS
Participated in research design: Sangana, Gu, Chun, and Einolf.
Conducted experiments: Sangana, Gu, and Chun.
Performed data analysis: Sangana, Gu, and Einolf.
Wrote or contributed to the writing of the manuscript: Sangana, Gu, Chun, and Einolf.
This article has not been copyedited and formatted. The final version may differ from this version.DMD Fast Forward. Published on October 16, 2017 as DOI: 10.1124/dmd.117.077834
at ASPE
T Journals on A
ugust 28, 2018dm
d.aspetjournals.orgD
ownloaded from
DMD # 77834
21
REFERENCES
Aung KJ, Van Deun A, Declercq E, Sarker MR, Das PK, Hossain MA, Rieder HL (2014)
Successful “9-month Bangladesh regimen” for multidrug-resistant tuberculosis among over
500 consecutive patients. Int J Tuberc Lung Dis 18:1180-1187.
Balakrishnan S, Seshadri PS (1981) Drug interactions-the influence of rifampicin and
clofazimine on the urinary excretion of DDS. Lepr India 53:17-22.
Companion Handbook to the WHO Guidelines for the Programmatic Management of Drug-
Resistant Tuberculosis. Geneva: World Health Organization; 2014. 5, Treatment strategies
for MDR-TB and XDR-TB. Available from:
https://www.ncbi.nlm.nih.gov/books/NBK247431. Accessed on July 8, 2017.
Dooley KE, Obuku EA, Durakovic N, Durakovic N, Belitsky V, Mitnick C, Nuermberger EL on
behalf of the Efficacy Subgroup, RESIST-TB (2013) World Health Organization Group 5
drugs for the treatment of drug-resistant tuberculosis: unclear efficacy or untapped potential?
J Infect Dis 207:1352-1358.
Einolf HJ, Chen L, Fahmi OA, Gibson CR, Obach RS, Shebley M, Silva J, Sinz MW, Unadkat
JD, Zhang L, and Zhao P (2014) Evaluation of various static and dynamic modeling methods
to predict clinical CYP3A induction using In Vitro CYP3A4 mRNA induction data. Clin
Pharmacol Ther 95:179-188.
Everitt D (2012) Clofazimine in clinical trials for tuberculosis: Resurrecting clofazimine. TB
alliance, Global Alliance for TB drug development, available at http://www.resisttb.org/wp-
content/uploads/2013/08/Global-Alliance-Clinical-Work-with-Clofazimine.pdf, last accessed
on 14 May 2017.
Fahmi OA, Maurer TS, Kish M, Cardenas E, Boldt S, and Nettleton D (2008) A combined model
This article has not been copyedited and formatted. The final version may differ from this version.DMD Fast Forward. Published on October 16, 2017 as DOI: 10.1124/dmd.117.077834
at ASPE
T Journals on A
ugust 28, 2018dm
d.aspetjournals.orgD
ownloaded from
DMD # 77834
22
for predicting CYP3A4 clinical net drug-drug interaction based on CYP3A4 inhibition,
inactivation, and induction determined in vitro. Drug Metab Dispos 36:1698-1708.
Fahmi OA, Hurst S, Plowchalk D, Cook J, Guo F, Youdim K, Dickins M, Phipps A, Darekar A,
Hyland R, Obach RS (2009) Comparison of different algorithms for predicting clinical drug–
drug interactions, based on the use of CYP3A4/5 in vitro data: predictions of compounds as
precipitants of interaction. Drug Metab Dispos 37:1658-1666.
Fajardo TT, Abalos RM, dela Cruz EC, Villahermosa LG, Walsh DS, Cellona RV, Balagon MV,
Tan EV, Walsh GP (1999) Clofazimine therapy for lepromatous leprosy: a historical
perspective. Int J Dermatol 38:70-74.
Food and Drug Administration (USA), Draft guidance for industry: Drug interaction studies
(2012). Available at https://www.fda.gov/downloads/drugs/guidances/ucm292362.pdf
Gertz M, Harrison A, Houston JB, Galetin A (2010) Prediction of human intestinal first-pass
metabolism of 25 CYP3A substrates from in vitro clearance and permeability data. Drug
Metab Dispos 38:1147-1158.
Gill HJ, Tingle MD, Park BK (1995) N-Hydroxylation of dapsone by multiple enzymes of
cytochrome P450: implications for inhibition of haemotoxicity. Br J Clin Pharmacol 40:531-
538.
Horita Y, Doi N (2014) Comparative study of the effects of antituberculosis drugs and
antiretroviral drugs on cytochrome P450 3A4 and P-glycoprotein. Antimicrob Agents
Chemother 58:3168-3176.Hwang TJ, Dotsenko S, Jafarov A, Weyer K, Falzon D, Lunte K,
Nunn P, Jaramillo E, Keshavjee S, Wares DF (2014) Safety and availability of clofazimine in
the treatment of multidrug and extensively drug-resistant tuberculosis: analysis of published
guidance and meta-analysis of cohort studies. BMJ Open 4:e004143.
This article has not been copyedited and formatted. The final version may differ from this version.DMD Fast Forward. Published on October 16, 2017 as DOI: 10.1124/dmd.117.077834
at ASPE
T Journals on A
ugust 28, 2018dm
d.aspetjournals.orgD
ownloaded from
DMD # 77834
23
Kajosaari LI, Laitila J, Neuvonen PJ, Backman JT (2005) Metabolism of repaglinide by CYP2C8
and CYP3A4 in vitro: effect of fibrates and rifampicin. Basic Clin Pharmacol Toxicol
97:249–256.
Kuaban C, Noeske J, Rieder HL, Aït-Khaled N, Abena Foe JL, Trebucq A (2015) High
effectiveness of a 12-month regimen for MDR-TB patients in Cameroon. Int J Tuberc Lung
Dis 19:517-524.
Levy L (1974) Phamacologic Studies of Clofazimine. Am J Trop Med Hyg 23:1097-1109.
Obach RS, Walsky RL, Venkatakrishnan K, Gaman EA, Houston JB, Tremaine LM (2006). The
utility of in vitro cytochrome P450 inhibition data in the prediction of drug-drug interactions.
J Pharmacol Exp Ther 316:336-348.
Pai M, Behr MA, Dowdy D, Dheda K, Divangahi M, Boehme CC, Ginsberg A, Swaminathan S,
Spigelman M, Getahun H, Menzies D, Raviglione M (2016) Tuberculosis. Nat Rev Dis
Primers 2:16076.
Piubello A, Harouna SH, Souleymane MB, Boukary I, Morou S, Daouda M, Hanki Y, Van Deun
A (2014) High cure rate with standardised short-course multidrug-resistant tuberculosis
treatment in Niger: no relapses. Int J Tuberc Lung Dis 18:1188-1194.
Quigley JM, Fahelelbom KMS, Timoney RF, Corrigan OI (1990) Temperature dependence and
thermodynamics of partitioning of clofazimine analogues in the n-octanol/water system. Int J
Pharm 58:107-113.
Rowland M, Matin SB (1973) Kinetics of drug-drug interactions. J Pharmacokinet Biopharma 1:
553-567.
Van Deun A, Maug AK, Salim MA, Das PK, Sarker MR, Daru P, Rieder HL (2010) Short,
highly effective, and inexpensive standardized treatment of multidrug-resistant tuberculosis.
This article has not been copyedited and formatted. The final version may differ from this version.DMD Fast Forward. Published on October 16, 2017 as DOI: 10.1124/dmd.117.077834
at ASPE
T Journals on A
ugust 28, 2018dm
d.aspetjournals.orgD
ownloaded from
DMD # 77834
24
Am J Respir Crit Care Med 182:684-692.
Varma MV, Lai Y, Kimoto E, Goosen TC, El-Kattan AF, Kumar V (2013) Mechanistic
modeling to predict the transporter- and enzyme-mediated drug-drug interactions of
repaglinide. Pharm Res 30:1188-1199.
Vischer WA (1969) The experimental properties of G 30 320 (B 663)-a new anti-leprotic agent.
Lepr Rev 40:107-110.
WHO MDR-TB factsheet, 2015 update
WHO Treatment Guidelines Drug Resistant TB, 2016, available at: http://www.who.int/tb/areas-
of-work/drug-resistant-tb/treatment/en/
WHO Global tuberculosis report 2016, available at
www.who.int/tb/publications/global_report/en/
Yawalkar SJ, Vischer WA (1984) Lamprene (clofazimine) in Leprosy. Basic Information,
Second Edition (Pharma Division, Ciba-Geigy Basle, Jan 1984) 1-11.
Zumla A, Raviglione M, Hafner R, von Reyn CF (2013) Tuberculosis. N Engl J Med 368:745-
755.
This article has not been copyedited and formatted. The final version may differ from this version.DMD Fast Forward. Published on October 16, 2017 as DOI: 10.1124/dmd.117.077834
at ASPE
T Journals on A
ugust 28, 2018dm
d.aspetjournals.orgD
ownloaded from
DMD # 77834
25
FOOTNOTES
The funding for writing assistance was provided by Novartis Pharma AG, Basel, Switzerland.
This article has not been copyedited and formatted. The final version may differ from this version.DMD Fast Forward. Published on October 16, 2017 as DOI: 10.1124/dmd.117.077834
at ASPE
T Journals on A
ugust 28, 2018dm
d.aspetjournals.orgD
ownloaded from
DMD # 77834
26
TABLES
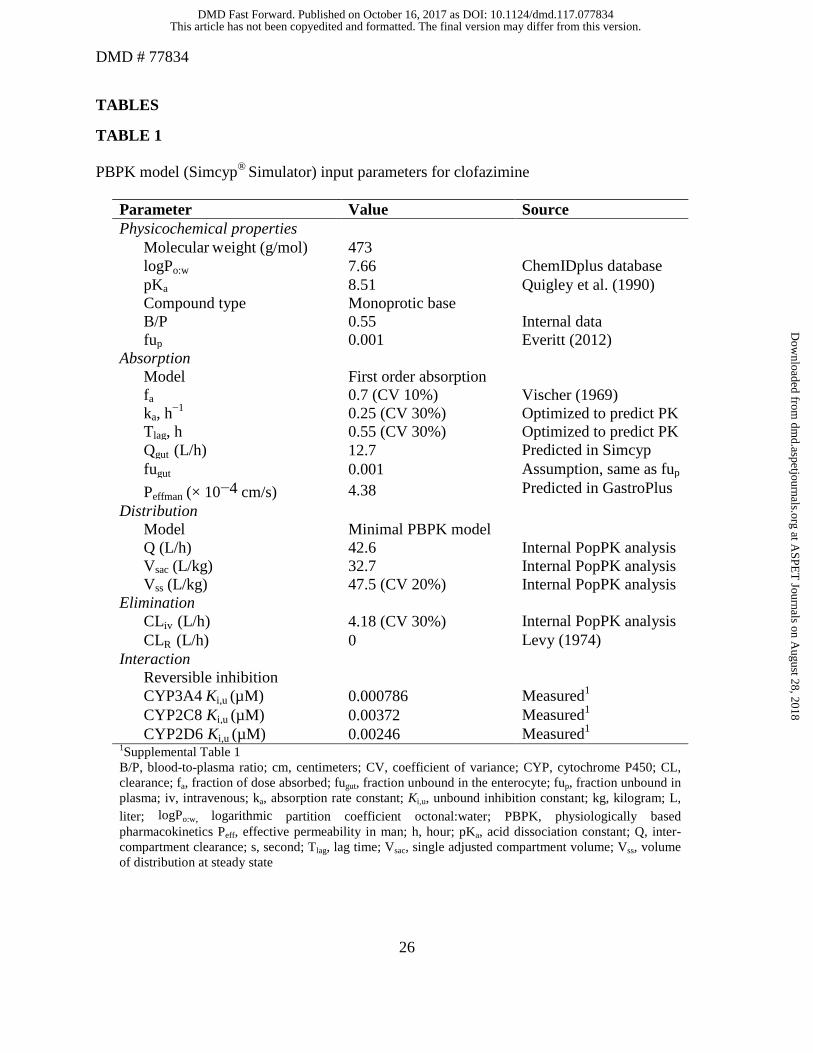
TABLE 1 PBPK model (Simcyp® Simulator) input parameters for clofazimine
Parameter Value Source Physicochemical properties
Molecular weight (g/mol) 473 logPo:w 7.66 ChemIDplus database pKa 8.51 Quigley et al. (1990) Compound type Monoprotic base B/P 0.55 Internal data fup 0.001 Everitt (2012)
Absorption Model First order absorption fa 0.7 (CV 10%) Vischer (1969) ka, h−1 0.25 (CV 30%) Optimized to predict PK Tlag, h 0.55 (CV 30%) Optimized to predict PK Qgut (L/h) 12.7 Predicted in Simcyp fugut 0.001 Assumption, same as fup Peffman (× 10−4 cm/s) 4.38 Predicted in GastroPlus
Distribution Model Minimal PBPK model Q (L/h) 42.6 Internal PopPK analysis Vsac (L/kg) 32.7 Internal PopPK analysis Vss (L/kg) 47.5 (CV 20%) Internal PopPK analysis
Elimination CLiv (L/h) 4.18 (CV 30%) Internal PopPK analysis CLR (L/h) 0 Levy (1974)
Interaction Reversible inhibition CYP3A4 Ki,u (µM) 0.000786 Measured1 CYP2C8 Ki,u (µM) 0.00372 Measured1 CYP2D6 Ki,u (µM) 0.00246 Measured1
1Supplemental Table 1 B/P, blood-to-plasma ratio; cm, centimeters; CV, coefficient of variance; CYP, cytochrome P450; CL, clearance; fa, fraction of dose absorbed; fugut, fraction unbound in the enterocyte; fup, fraction unbound in plasma; iv, intravenous; ka, absorption rate constant; Ki,u, unbound inhibition constant; kg, kilogram; L, liter; logPo:w, logarithmic partition coefficient octonal:water; PBPK, physiologically based pharmacokinetics Peff, effective permeability in man; h, hour; pKa, acid dissociation constant; Q, inter-compartment clearance; s, second; Tlag, lag time; Vsac, single adjusted compartment volume; Vss, volume of distribution at steady state
This article has not been copyedited and formatted. The final version may differ from this version.DMD Fast Forward. Published on October 16, 2017 as DOI: 10.1124/dmd.117.077834
at ASPE
T Journals on A
ugust 28, 2018dm
d.aspetjournals.orgD
ownloaded from
DMD # 77834
27
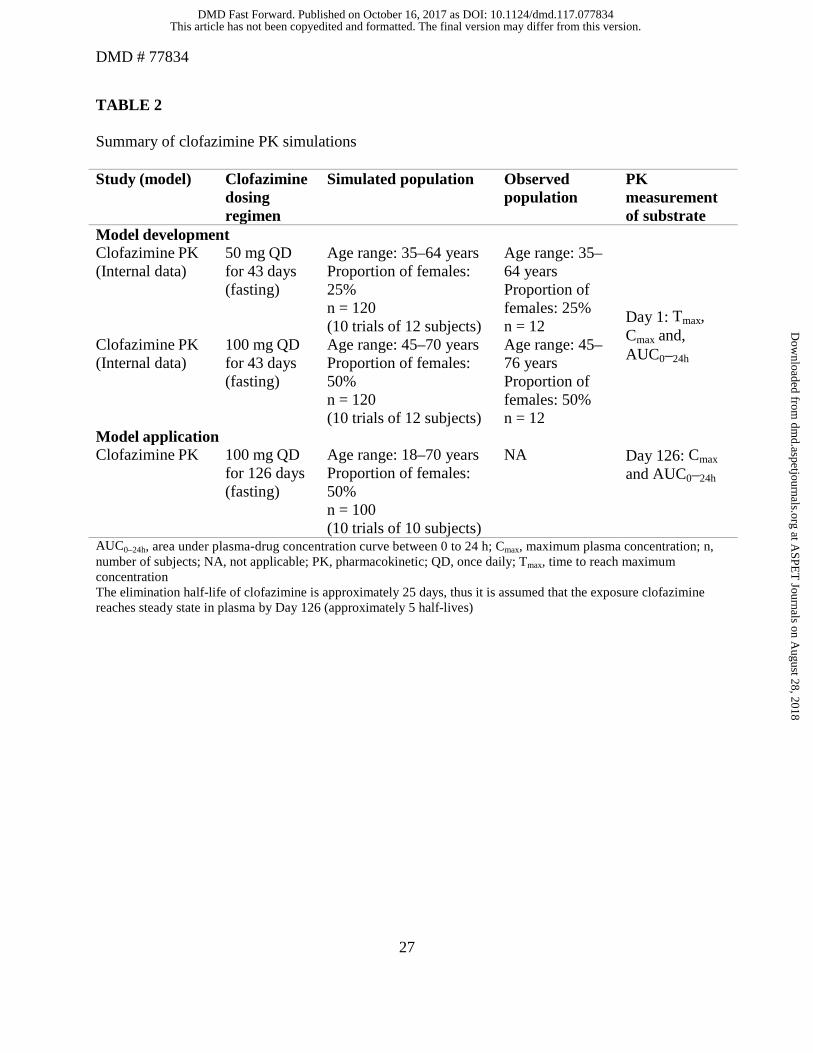
TABLE 2 Summary of clofazimine PK simulations Study (model) Clofazimine
dosing regimen
Simulated population Observed population
PK measurement of substrate
Model development Clofazimine PK (Internal data)
50 mg QD for 43 days (fasting)
Age range: 35–64 years Proportion of females: 25% n = 120 (10 trials of 12 subjects)
Age range: 35–64 years Proportion of females: 25% n = 12 Day 1: Tmax,
Cmax and, AUC0–24h
Clofazimine PK (Internal data)
100 mg QD for 43 days (fasting)
Age range: 45–70 years Proportion of females: 50% n = 120 (10 trials of 12 subjects)
Age range: 45–76 years Proportion of females: 50% n = 12
Model application Clofazimine PK 100 mg QD
for 126 days (fasting)
Age range: 18–70 years Proportion of females: 50% n = 100 (10 trials of 10 subjects)
NA Day 126: Cmax and AUC0–24h
AUC0–24h, area under plasma-drug concentration curve between 0 to 24 h; Cmax, maximum plasma concentration; n, number of subjects; NA, not applicable; PK, pharmacokinetic; QD, once daily; Tmax, time to reach maximum concentration The elimination half-life of clofazimine is approximately 25 days, thus it is assumed that the exposure clofazimine reaches steady state in plasma by Day 126 (approximately 5 half-lives)
This article has not been copyedited and formatted. The final version may differ from this version.DMD Fast Forward. Published on October 16, 2017 as DOI: 10.1124/dmd.117.077834
at ASPE
T Journals on A
ugust 28, 2018dm
d.aspetjournals.orgD
ownloaded from
DMD # 77834
28
TABLE 3 DDI predictions of clofazimine with CYP substrates CYP substrate Study Dosing regimen PK measurement of
substrate Model application CYP3A4/5 Midazolam +
clofazimine Midazolam 5 mg on Day 126 + clofazimine 100 mg QD on Days 1–126
Day 126: AUCinf, Cmax
CYP3A4 Saquinavir + clofazimine
Saquinavir 1200 mg on Day 126 + clofazimine 100 mg QD on Days 1–126
CYP3A4 Efavirenz + clofazimine
Efavirenz 600 mg on Day 126 + clofazimine 100 mg QD on Days 1–126
CYP2C8 Repaglinide + clofazimine
Repagalinide 0.25 mg on Day 126 + clofazimine 100 mg QD on Days 1–126
CYP2D6 Desipramine + clofazimine
Desipramine 50 mg on Day 126 + clofazimine 100 mg QD on Days 1–126
AUCinf, area under the plasma concentration-time curve from 0 to infinite; Cmax, maximum plasma concentration; CYP, cytochrome P450; DDI, drug–drug interaction; mg, milligram; PK, pharmacokinetic; QD, once daily
This article has not been copyedited and formatted. The final version may differ from this version.DMD Fast Forward. Published on October 16, 2017 as DOI: 10.1124/dmd.117.077834
at ASPE
T Journals on A
ugust 28, 2018dm
d.aspetjournals.orgD
ownloaded from
DMD # 77834
29
TABLE 4 Input parameters and R1 values for CYP inhibition by clofazimine CYP Enzyme
Input Parameters CYP3A4/5 CYP2C8 CYP2D6
Ki,u (µM) 0.000786 0.00372 0.00246
[I] (µM) Total Cmax 1.89a 1.89a 1.89a Unbound Cmax 0.00189 0.00189 0.00189
[Igut] (µM) Total 845 - -
R1 Values Systemic [I] = Cmax,total 2406 509 769
[I] = Cmax,u 3.40 2 2 Gut [I] = [Igut] 1075065 - - aPredicted concentration after repeat administration of 100 mg/day clofazimine. µM, micromole; Cmax, maximum plasma concentration; CYP, cytochrome P450; [I], maximum anticipated Cmax; Ki,u, unbound inhibition constant
This article has not been copyedited and formatted. The final version may differ from this version.DMD Fast Forward. Published on October 16, 2017 as DOI: 10.1124/dmd.117.077834
at ASPE
T Journals on A
ugust 28, 2018dm
d.aspetjournals.orgD
ownloaded from
DMD # 77834
30
TABLE 5 Predicted fold change in the AUC of selected substrates of CYP3A4/5 Class/Substrate Predicted AUCR Antiretroviral
Atazanavir 2.10 Amprenavir 2.39 Darunavir 2.50 Delaviridine 2.57 Dolutegravir 3.00 Efavirenz 2.48 Elvitegravir 2.62 Etravirine 2.57 Indinavir 4.48 Lopinavir 2.52 Nelfinavir 2.41 Raltegravir 2.81 Ritonavir 2.57 Rilpivirine 2.57 Saquinavir 2.96 Simeprevir 5.16 Tipranavir 5.83
Antitubercular Bedaquiline 2.25 Clarithromycin 2.93 Delamanid 5.59
Antihypertensives Losartan 2.35 Verapamil 2.50 Diltiazem 2.62 Nitrendipine 3.37 Amlodipine 3.79 Guanfacine 3.79 Nifedipine 3.85 Eplerenone 4.72 Felodipine 4.88 Lercanidipine 5.96
Antidiabetics Alogliptin 2.23 Pioglitazone 2.39 Repaglinide 2.48 Teneligliptin 2.57 Saxagliptin 3.46
Antihyperlipidemics
This article has not been copyedited and formatted. The final version may differ from this version.DMD Fast Forward. Published on October 16, 2017 as DOI: 10.1124/dmd.117.077834
at ASPE
T Journals on A
ugust 28, 2018dm
d.aspetjournals.orgD
ownloaded from
DMD # 77834
31
Pravastatin 2.90 Atorvastatin 4.88 Simvastatin 5.83 Lovastatin 6.23
Antileprotics Dapsone 1.97
Note: AUCR >1.25 and <2: weak CYP3A4/5 inhibitor; AUCR >2 and <5: moderate CYP3A4/5 inhibitor; and AUCR ≥5: strong CYP3A4/5 inhibitor. AUC, area under the plasma concentration-time curve; AUCR, area under the plasma concentration-time curve ratio; CYP, cytochrome P450
This article has not been copyedited and formatted. The final version may differ from this version.DMD Fast Forward. Published on October 16, 2017 as DOI: 10.1124/dmd.117.077834
at ASPE
T Journals on A
ugust 28, 2018dm
d.aspetjournals.orgD
ownloaded from
DMD # 77834
32
TABLE 6
Observed and simulated clinical PK parameters for clofazimine in patients following single oral doses (50 and 100 mg) Parameter Clofazimine (50 mg)
Mean ± SD Clofazimine (100 mg) Mean ± SD
Cmax (ng/mL)
Observeda 71.8 ± 34.1 131 ± 59.9 Predicted
83.3 ± 219
178 ± 465 PEb +16% +36%
AUC0–24h (ng h/mL)
Observeda 1084 ± 409 1856 ± 821 Predicted 976 ± 1633 2090 ± 3691 PEb -10% +13%
Tmax (h)c Observeda 8 6 Predicted 9.5 9.5 PEb +19% +58%
aClinical PK parameters are not available on Day 43; hence, Day 1 PK parameters were used for comparison, unit in pmol/g was converted to ng/mL as follows: pmol/g = (pmol/g) × MW (g/mol) = pmol/mol = ng/g = ng/mL, where plasma density assumes a value of ~ 1 g/mL bPE = [(predicted value − observed value)/observed value] × 100 cMedian AUC0–24h, area under plasma-drug concentration curve between 0 to 24 h; Cmax, maximum plasma concentration; g, gram; h, hour; ng, mL, milliliter; nanogram; PE, prediction error %; pmol, picomole; MW, molecular weight; PK, pharmacokinetic; SD, standard deviation; Tmax, time to reach maximum concentration
This article has not been copyedited and formatted. The final version may differ from this version.DMD Fast Forward. Published on October 16, 2017 as DOI: 10.1124/dmd.117.077834
at ASPE
T Journals on A
ugust 28, 2018dm
d.aspetjournals.orgD
ownloaded from
DMD # 77834
33
TABLE 7
Simulated clinical PK parameters for clofazimine at Day 126 following multiple oral doses of 100 mg QD Parameter Value
Mean (SD) Cmax ng/mL 797 (392) Mean (SD) AUC0–24h ng h/mL 16627 (5367) Median (min, max) Cmax ng/mL 703 (255, 2966) Median (min, max) AUC0–24h ng h/mL 15919 (5868, 36902) Geometric mean (CV%) Cmax ng/mL 728 (49) Geometric mean (CV%) AUC0–24h ng h/mL 15797 (32)
AUC0–24h, area under plasma-drug concentration curve between 0 to 24 h; Cmax, maximum plasma concentration; CV, coefficient of variation; h, hour; max, maximum; min, minimum; mL, milliliter; ng, nanogram; PK, pharmacokinetic; QD, once daily; SD, standard deviation An example of the summary model input, output, and PK statistical output for this scenario can be found in the Supplemental Data Tables 9, 10, and 11
This article has not been copyedited and formatted. The final version may differ from this version.DMD Fast Forward. Published on October 16, 2017 as DOI: 10.1124/dmd.117.077834
at ASPE
T Journals on A
ugust 28, 2018dm
d.aspetjournals.orgD
ownloaded from
DMD # 77834
34
TABLE 8 Predicted clinical PK parameters in plasma for midazolam, saquinavir, efavirenz, repaglinide, and desipramine single dose on Day 126 in the presence and absence of clofazimine (100 mg QD, Days 1–126) Substrate (dose) Simulated n = 100
Mean (SD) Geometric mean (CV%)
Geometric mean ratio (90% CI)
AUCinf (ng/mL h)
Cmax (ng/mL)
AUCinf (ng/mL h)
Cmax (ng/mL)
AUC Cmax
Midazolam (5 mg) 72.1 (55.8) 25.1 (16.9)
56.0 (77) 20.4 (68)
Midazolam (5 mg) + clofazimine
214 (174) 42.3 (27.0) 151 (81) 34.2 (64) 2.69 (2.58, 2.80)
1.68 (1.62, 1.74)
Saquinavir (1200 mg)
2197 (1519)
388 (309) 1810 (69) 304 (80)
Saquinavir (1200 mg) + clofazimine
6164 (3730)
886 (567) 5224 (60) 736 (64) 2.89 (2.87, 2.90)
2.42 (2.30, 2.53)
Efavirenz (600 mg) 118424 (78432)
2376 (1653)
97306 (66) 1950 (70)
Efavirenz (600 mg) + clofazimine
124951 (86932)
2389 (1671)
101211 (64)
1958 (70) 1.04 (1.04, 1.04)
1.00 (1.00, 1.00)
Repaglinide (0.25 mg)
8.27 (4.16) 3.83 (1.36) 7.14 (50) 3.56 (36)
Repaglinide (0.25 mg) + clofazimine
13.6 (8.75) 5.04 (1.78) 11.4 (59) 4.69 (35) 1.60 (1.58, 1.76)
1.32 (1.29, 1.34)
Desipramine (50 mg)
2836 (7808)
17.3 (11.4) 688 (275) 14.5 (66)
Desipramine (50 mg) + clofazimine
3125 (7745)
20.4 (11.6) 1009 (248) 17.7 (57) 1.47 (1.44, 1.50)
1.27 (1.24, 1.30)
AUCinf, area under plasma-drug concentration curve between 0 to infinite; Cmax, maximum plasma concentration; CI, confidence interval; CV, coefficient of variation; n, number of subjects; h, hour; mL, milliliter; ng, nanogram; PK, pharmacokinetic; QD, once daily; SD, standard deviation
This article has not been copyedited and formatted. The final version may differ from this version.DMD Fast Forward. Published on October 16, 2017 as DOI: 10.1124/dmd.117.077834
at ASPE
T Journals on A
ugust 28, 2018dm
d.aspetjournals.orgD
ownloaded from