Download (pdf, 2.33MB) - The International Council for Clean

OVERVIEW OF INDIA’S VEHICLE EMISSIONS CONTROL PROGRAM
PAST SUCCESSES AND FUTURE PROSPECTS
Gaurav Bansal and Anup Bandivadekar
www.theicct.org
BEIJING | BERLIN | BRUSSELS | SAN FRANCISCO | WASHINGTON

ACKNOWLEDGMENTSThe authors would like to thank Dr. Alan Lloyd, and Michael Walsh for steering the work that led to this report. The report has been reviewed by several ICCT colleagues and two outside reviewers, but the authors are responsible for any remaining errors. Funding for this work was provided by the Hewlett Foundation.
For additional information:1225 I Street NW Suite 900Washington DC 20005+1 202 534 1600
© 2013 International Council on Clean Transportation

i
OVERVIEW OF INDIA’S VEHICLE EMISSIONS CONTROL PROGRAM
1 EXECUTIVE SUMMARYRising transportation activity—the ever-increasing demand to move more people and goods further and faster—is both a cause and an effect of India’s rapid economic growth. The growth in personal as well as freight vehicles, and the corresponding surge in fuel use, is expected to continue for the next several decades. As necessary as the increase in mobility may be to boost the standard of living, there are some unpleasant consequences associated with it. These include growing reliance on imported fossil fuels, which are responsible for climate change, and increasing emissions of pollutants responsible for adverse human health effects.
Increased mobility will likely provide enhanced economic opportunities for all sectors of society. It is necessary to steer this growth in mobility in a manner that will minimize the harmful impacts of pollution from a burgeoning vehicle fleet.1 With that in mind, the International Council on Clean Transportation (ICCT) conducted an objective in-depth analysis of the past successes and future prospects of the vehicular emission control program in India.
1.1 REPORT OVERVIEWLeading policymakers have long realized that it is critical to treat vehicles and fuels as a single system when setting cost-effective performance standards for vehicle emissions and fuel quality. They have noted the necessity of controlling emissions from in-use vehicles as well. In addition, the importance of reducing conventional as well as greenhouse gas (GHG) emissions is well understood since the benefits of both measures are complementary. Therefore, this report evaluates India’s vehicular emission control program through the following six lenses:
» New vehicle and engine emission standards (Chapter 3)
» Fuel quality standards (Chapter 4)
» Vehicle compliance and enforcement program (Chapter 5)
» Fuel inspection and compliance program (Chapter 6)
» Alternative fuels and new energy vehicle policies (Chapter 7)
» Fuel efficiency standards and labeling (Chapter 8)
Each chapter compares and contrasts current standards and practices in India with the corresponding practices in the United States, the European Union, Japan, China, Brazil, and other countries or regions as appropriate. Based on that comparison, each chapter identifies barriers to progress on all fronts and offers recommendations for improvement.
This report also evaluates the impact of India’s vehicle emission control program quan-titatively. Specifically, it estimates the vehicle emissions avoided as a result of ambitious policy actions undertaken in India during the most recent decade. Since the primary motivation for reducing emissions is to protect public health, the report additionally gives a rather conservative estimate of the premature deaths avoided and the economic benefits realized as a result of those emission reductions.
In short, this report provides an in-depth review of India’s existing motor vehicle emissions control program—for both conventional and greenhouse gases (GHG). Based on a historic assessment and an analysis of international best practices, it makes recommendations about future policies. It is intended to be a comprehensive guide for policymakers and stakehold-ers to analyze India’s past and present in order to make informed decisions for the future.
1 Mahatma Gandhi once said, “Speed is irrelevant if you are going in the wrong direction.”
ii
INTERNATIONAL COUNCIL ON CLEAN TRANSPORTATION
1.2 FINDINGSThe findings of the report are summarized as they pertain to the past, present, and the future of India’s vehicular emission control program.
1.2.1 Past (2000–2010): A decade of accomplishmentsStarting with Supreme Court of India rulings in the late 1980s and 1990s, the country began to move toward mitigating the public health impacts of vehicle and fuel emis-sions. The initial steps consisted of eliminating lead in gasoline (petrol), switching to compressed natural gas (CNG) for autorickshaws and buses in Delhi and subsequently other cities, and establishing Euro 1/I–equivalent emission standards known as India-1 standards for new vehicles.
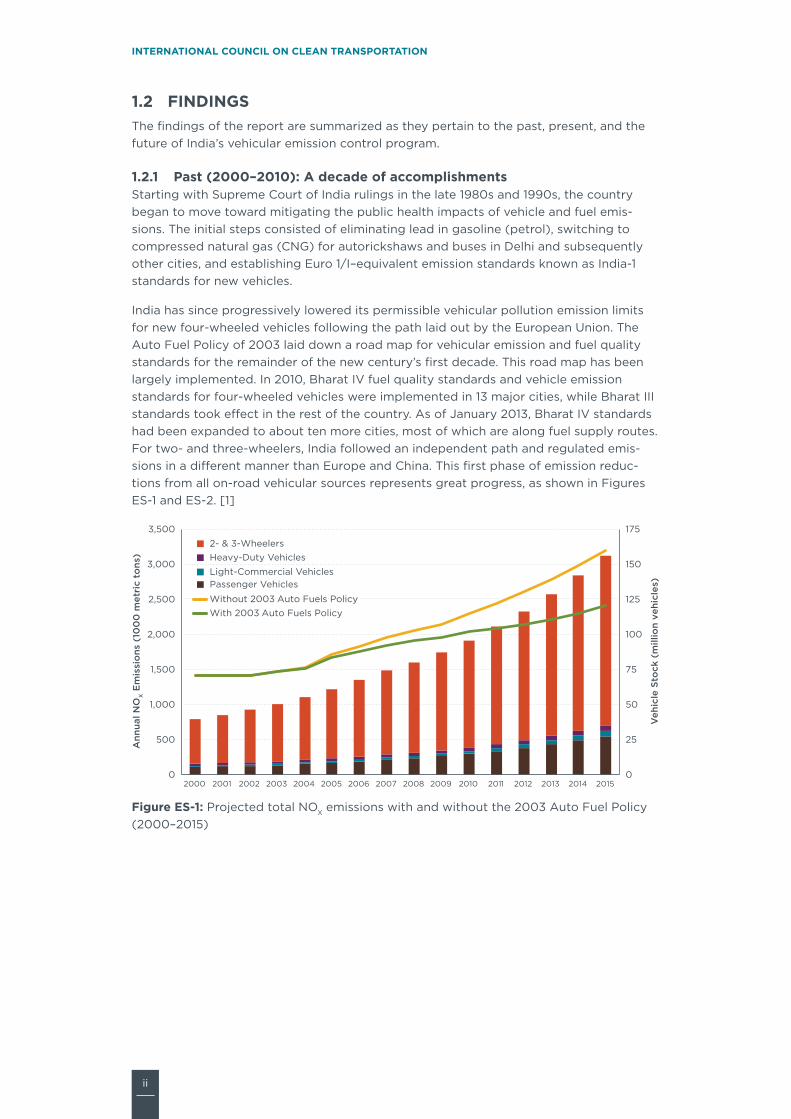
India has since progressively lowered its permissible vehicular pollution emission limits for new four-wheeled vehicles following the path laid out by the European Union. The Auto Fuel Policy of 2003 laid down a road map for vehicular emission and fuel quality standards for the remainder of the new century’s first decade. This road map has been largely implemented. In 2010, Bharat IV fuel quality standards and vehicle emission standards for four-wheeled vehicles were implemented in 13 major cities, while Bharat III standards took effect in the rest of the country. As of January 2013, Bharat IV standards had been expanded to about ten more cities, most of which are along fuel supply routes. For two- and three-wheelers, India followed an independent path and regulated emis-sions in a different manner than Europe and China. This first phase of emission reduc-tions from all on-road vehicular sources represents great progress, as shown in Figures ES-1 and ES-2. [1]
0
25
50
75
100
125
150
175
0
500
1,000
1,500
2,000
2,500
3,000
3,500
2000 2001 2002 2003 2004 2005 2006 2007 2008 2009 2010 2011 2012 2013 2014 2015
Veh
icle
Sto
ck (
mill
ion
vehi
cles
)
Ann
ual N
OX E
mis
sio
ns (
100
0 m
etri
c to
ns)
2- & 3-WheelersHeavy-Duty VehiclesLight-Commercial VehiclesPassenger Vehicles
Without 2003 Auto Fuels PolicyWith 2003 Auto Fuels Policy
Figure ES-1: Projected total NOX emissions with and without the 2003 Auto Fuel Policy (2000–2015)

iii
OVERVIEW OF INDIA’S VEHICLE EMISSIONS CONTROL PROGRAM
0
25
50
75
100
125
150
175
0
50
100
150
200
250
300
350
2000 2001 2002 2003 2004 2005 2006 2007 2008 2009 2010 2011 2012 2013 2014 2015
Veh
icle
Sto
ck (
mill
ion
vehi
cles
)
Ann
ual P
M10
Em
issi
ons
(10
00
met
ric
tons
)
2- & 3-WheelersHeavy-Duty VehiclesLight-Commercial VehiclesPassenger Vehicles
Without 2003 Auto Fuels PolicyWith 2003 Auto Fuels Policy
Figure ES-2: Projected total PM emissions with and without the 2003 Auto Fuel Policy (2000–2015)
In addition to the tighter emission standards, the number of buses and three-wheelers running on CNG increased steadily over the course of the decade, to more than 180,000 in 2010, and these CNG vehicles have contributed to particulate matter (PM) emission reductions in cities where they have been deployed. These are further benefits not captured in Figures ES-1 and ES-2.
The emission reductions in this phase have resulted in, and will continue to result in, tre-mendous health benefits. Taking into account the premature deaths avoided as a result of lower PM2.5 (fine particulate matter) emissions alone in the 337 largest Indian cities, this first phase of emission reductions saved almost 6,500 lives in 2010. The cumulative economic benefits stemming from averting premature deaths in the 2000–2010 time period were about Rs. (rupees) 150,000 crore2 (U.S. $30 billion), offering a payback for the investments made during this period. [2]
Yet, the benefits of this phase would have been even greater had the Auto Fuel Policy not decided to resort to two sets of standards—one for the major cities and a less stringent standard for the rest of the country. This particularly affects heavy commercial vehicles since commercial trucks are typically certified and purchased for operation across one or more states. As a result, even though Bharat IV standards are in effect for commercial vehicles in major cities after 2010, few Bharat IV trucks are being manufac-tured and purchased. As some cities are discovering, it is also difficult to prevent the registration of passenger vehicles in regions outside the city limits subject to Bharat III standards, even though those vehicles may largely ply their trade within Bharat IV–cov-ered cities.
Further, the lack of a comprehensive inspection and maintenance (I/M) program con-tinues to be a challenge in reducing air pollutants from vehicles. While the country has made significant investments in the National Automotive Testing and R&D Implementa-tion Project (NATRiP), which continues to develop state-of-the-art laboratory facilities for type-approval testing purposes, a similar commitment was not shown on the I/M front. While a conformity of production (COP) program ensures that all new vehicles meet standards, the lack of an in-use conformity testing program prevents India from
2 1 crore = 10 million

iv
INTERNATIONAL COUNCIL ON CLEAN TRANSPORTATION
testing a representative sample of vehicles on the road to ensure they are maintaining their original emission standards.
The 2000–2010 period represents a successful first step in developing a motor vehicle program based on the 2003 Auto Fuel Policy. Per vehicle emissions have fallen signifi-cantly, and fleetwide emissions have dropped or slowed as well. But in order to tackle the significant air quality challenges that remain, a similar and more ambitious road map should be established for the next decade. The next sections assess the magnitude of the current problem and identify needed policy improvements to match the tremendous growth in India’s transportation sector.
1.2.2 Present (2010–2012): Falling behind?Some of the major initiatives that have been undertaken during the current period are (i) the expansion of Bharat IV fuel quality to ten more cities in 2012 (shown in Figure ES-3) and a commitment to supply Bharat IV fuel to 63 cities by 2015, (ii) the establish-ment of six vehicle I/M testing centers, and (iii) a proposal for a fuel efficiency standard and labeling program for passenger vehicles. Other notable recent actions include the completion of emissions source apportionment studies for six cities by the Central Pollu-tion Control Board (CPCB) [3] and the announcement of a National Mission for Electric Mobility. While a review of the 2003 Auto Fuel Policy has been conducted, its findings have not been made public.
Figure ES-3: Current refineries and cities covered by the Bharat IV fuel standard in India
Despite all the progress, though, air pollution in urban areas often exceeds the National Ambient Air Quality Standards (NAAQS). The CPCB identified more than 70 cities that were not in compliance with the NAAQS in 2008. [4] And as CPCB source apportion-ment studies have demonstrated, vehicular emissions continue to be one of the main

v
OVERVIEW OF INDIA’S VEHICLE EMISSIONS CONTROL PROGRAM
sources of urban air pollution in India, accounting for up to 40 percent of PM10 and 90 percent of nitrogen oxide (NOX) emissions in some cities. [3] Continued growth in the overall vehicle population is likely to negate the gains of the past decade in the absence of further policy action, as shown in Figures ES-4 and ES-5.
0
1000
2000
3000
4000
5000
6000
2010 2015 2020 2025 2030 2035
NO
X E
mis
sio
ns (
100
0 m
etri
c to
ns)
Passenger Vehicles
Light-Commercial Vehicles
2- & 3-Wheelers
Heavy-Duty Vehicles
Figure ES-4: Projected total NOX emissions in the absence of further policy action (2010–2035)
0
50
100
150
200
250
300
350
400
2010 2015 2020 2025 2030 2035
PM
10 E
mis
sio
ns (
100
0 m
etri
c to
ns) Passenger Vehicles
Light-Commercial Vehicles
2- & 3-Wheelers
Heavy-Duty Vehicles
Figure ES-5: Projected total PM10 emissions in the absence of further policy action (2010–2035)
Thus, more intensive efforts are necessary to reduce the impact of transport vehicles on air quality. There is still a time lag between international and Indian schedules for the adoption of vehicle emission and fuel quality standards. Comparing Indian standards for four-wheeled vehicles with those in Europe, the gap varies, with major metropolitan areas in India about five years behind the latest Euro standards and the rest of the country almost a decade behind. The time lag for two- and three-wheelers is harder to compare, given that India and Europe do not have similar regulations. Nevertheless, Europe has plans to move to Euro 6 emission standards for this category of vehicles by the end of the decade, whereas India currently has no plans for further
vi
INTERNATIONAL COUNCIL ON CLEAN TRANSPORTATION
progress. Aside from Europe, countries at socioeconomic levels similar to India’s like China, Brazil, and Mexico also have plans to implement tighter vehicle emission standards in the coming years. In India, harmonizing emissions standards nationwide and moving to those that use the best available emission control technologies will yield significant environmental, economic, and public health benefits.
Since fuel sulfur limits in the rest of the country are much higher as compared with Bharat IV cities (350 parts per million vs. 50 ppm for diesel), vehicles that are designed to meet Bharat IV emissions standards, particularly diesel-powered ones, may not be in compliance if they are refueled in areas with higher fuel sulfur content. In the coming years, after-treatment emission control devices that require lower fuel sulfur content, such as selective catalytic reduction (SCR) systems and diesel particulate filters (DPFs), might in such circumstances fail or operate below optimum performance, thus failing to provide full air pollution and public health benefits. The dual regime for emis-sions norms and fuel quality—especially fuel sulfur—also continues to present logistical problems for vehicle manufacturers.
Another challenge is harmonizing test-cycle with real-world emissions. Currently, under Bharat IV specifications, fuel used to test emissions from vehicles is cleaner than commercially available fuel. Regulations specify that Bharat IV test diesel can have a maximum sulfur concentration of 10 ppm, while commercial diesel contains up to 50 ppm and 350 ppm in Bharat IV cities and in the rest of the country, respectively. The lower sulfur in test fuel means emissions measurements during testing are lower than actual emissions on the road, particularly for PM.
Another area in need of attention is the continuing dieselization of India’s passenger car fleet thanks to government subsidies for diesel fuel. This trend has led to increases in NOX and PM emissions because Euro-style emission standards—unlike the counter-part U.S. program—allow for higher NOX and PM emissions from diesel vehicles. Higher PM and NOX emissions from diesel cars have become a topic of public debate as the retail price differential between diesel and gasoline has led diesel car sales to spike. [5] Dieselization has continued in spite of the monthly price increases for diesel instituted in order gradually to eliminate the diesel fuel subsidy. While an additional excise tax on diesel cars has been proposed to make up for the tax revenue lost from selling diesel fuel to car owners, moving to Euro 6–equivalent standards will help alleviate the environmental and public health problem since it will close much of the gap in NOX and PM emission limits between gasoline and diesel vehicles. [6]
Aside from issues relating to tighter vehicle emission and fuel quality standards, there has been little progress on controlling emissions from in-use vehicles. Nor has there been a thorough study to analyze the feasibility of fueling vehicles, beyond buses and autorickshaws (three-wheelers), in India with alternatives to gasoline and diesel. While implementing stricter new vehicle regulations will be beneficial in the long term, instituting a strong in-use emissions control program can have immediate impacts. In many countries, a small subset of high-emitting vehicles is often responsible for the majority of vehicular air pollution. [7, 8] This may also be the case in India, and retrofit-ting those vehicles—if done correctly—may be the best way to reduce their emissions.
In terms of fuel efficiency, the 2003 Auto Fuel Policy recommended mandatory declaration of vehicle fuel economy. Most vehicle manufacturers only recently started disclosing the fuel efficiency of passenger cars and motorcycles. The Society of Indian Automobile Manufacturers (SIAM) and the Bureau of Energy Efficiency (BEE) have cooperated to start the process for labeling passenger car fuel efficiency. BEE has proposed standards for a 20 percent reduction in fuel consumption of new cars by 2020, though that proposal has inexplicably been delayed. As of yet, no policy

vii
OVERVIEW OF INDIA’S VEHICLE EMISSIONS CONTROL PROGRAM
action has been initiated on labeling or standards for fuel efficiency relating to other vehicle types.
Finally, the report of the 2003 Auto Fuel Policy Committee made an important recommendation with respect to creating an “institutional mechanism for addressing issues of vehicular emissions and fuel quality.” Some elements of such a mechanism exist independently today, and a Standing Committee on Implementation of Emission Standards (SCOE) functions within the Ministry of Road Transport and Highways (MoRTH). But a single, comprehensive institution responsible for vehicle emissions and fuel quality, such as the National Automobile Pollution and Fuel Authority that was recommended by the 2003 Auto Fuel Policy Committee, would simplify and streamline regulatory activities, as well as bringing a more farsighted vision of emissions regula-tions in India. In case the creation of such an agency is not feasible, all vehicle emission and related fuel quality regulatory responsibilities should be fully transferred to the MoRTH instead of being splintered among various agencies and ministries as under the current setup.
1.2.3 Future (2013–2035): A time for action and leadershipIn January 2013, the Ministry of Petroleum and Natural Gas (MoPNG) created an expert committee on “Auto Fuel Vision and Policy—2025”, charged with establishing a roadmap for fuel quality and vehicle emission standards through 2025. As of yet, the committee’s work is ongoing, and no significant plans to tighten vehicle emission and fuel quality standards further have been set, apart from continuing the policy of expanding the sup-ply of 50 ppm sulfur fuel to 60–70 cities by 2015. Aside from establishing a road map, the expert committee can make recommendations for programs to reduce emissions from in-use vehicles, institute recall policies for noncompliant vehicles and fuels, and move away from conventional gasoline and diesel to cleaner alternative fuels.
To evaluate what sort of future for vehicle emissions would be possible if the Expert Committee were to make headway on all these issues, an analysis of three scenarios was done, as shown in Table ES-1. Each scenario makes certain assumptions about standards pertaining to vehicle emissions, fuel quality, in-use emissions compliance and enforce-ment, and additional efforts that focus on dealing with a shift in fuel types used by various classes of vehicles on the road.

viii
INTERNATIONAL COUNCIL ON CLEAN TRANSPORTATION
Table ES-1: Scenarios for future of vehicular emissions in India
SCENARIOS EMISSION STANDARDS FUEL STANDARDS
ENFORCEMENT AND
COMPLIANCE1CHANGE IN FUEL
TYPE2
Business as usual (BAU)
Bharat IV in 50+ cities by 2015; Bharat III in rest of India; Bharat III for 2-/3-wheelers nationwide
Low-sulfur fuel (50 ppm) in 50+ cities by 2015; 150 ppm sulfur gasoline and 350 ppm sulfur diesel in rest of India
15% of vehicle fleet are gross emitters
60% of new LDV sales diesel by 2020
Continued Dual Standards Program
Bharat V 4-wheelers in 50+ cities, Bharat IV 4-wheelers in rest of India, Bharat IV 2-/3-wheelers nationwide in 2015; Bharat VI 4-wheelers in 50+ cities, Bharat V 4-wheelers in rest of India, Bharat V 2-/3-wheelers in 2020
Ultra-low-sulfur fuel (10 ppm) in 50+ cities, low-sulfur fuel (50 ppm) in rest of India by 2015; ultra-low-sulfur fuel nationwide (10 ppm) by 2020
By 2020, only 10% of vehicle fleet are gross emitters
5% of LDV sales CNG and LPG each by 2030; 25% of bus and 3-wheeler sales CNG by 2030
National Leapfrog Program
Leapfrog to Bharat VI by 2017 for all vehicles
Ultra-low-sulfur gasoline and diesel countrywide (10 ppm) by 2017
By 2020, only 5% of vehicle fleet are gross emitters
10% of LDV sales CNG and 5% LPG by 2030; 50% of bus and 3-wheeler sales CNG by 2030
World Class Program
Bharat V by 2015; Bharat VI by 2017; and Tier 3 by 2020 for all vehicles
Low-sulfur fuel (50 ppm) nationwide by 2015; ultra-low-sulfur fuel (10 ppm) nationwide by 2017
By 2020, only 3% of vehicle fleet are gross emitters
15% of LDV sales CNG and 10% LPG by 2030; 75% bus sales CNG by 2030; 50% of 3-wheeler sales CNG by 2030
1. Gross polluters are defined as vehicles where emission controls are nonfunctional.2. LDV means PC and U&MPV. Increases in CNG and LPG vehicle market share are assumed to happen at the expense of diesel market share.
As shown in Figures ES-6 and ES-7, the implementation of Bharat V/VI standards across the country could reduce net emissions of NOX and PM emissions significantly—by 86 percent under the World Class program, the most aggressive scenario, by 2035—compared with a situation in which no further policy action is taken. This holds true in spite of projections of more than five times as many vehicles traveling Indian roads in 2035 as today.
0
1
2
3
4
5
6
2000 2002 2004 2006 2008 2010 2012 2014 2016 2018 2020 2022 2024 2026 2028 2030 2032 2034
NO
X E
mis
sio
ns (
Tg
)
BAU Continued Dual Standards National Leapfrog World Class
Figure ES-6: Projected total NOX emissions with further policy action (2010–2035)

ix
OVERVIEW OF INDIA’S VEHICLE EMISSIONS CONTROL PROGRAM
0.00
0.05
0.10
0.15
0.20
0.25
0.30
0.35
0.40
0.45
2000 2002 2004 2006 2008 2010 2012 2014 2016 2018 2020 2022 2024 2026 2028 2030 2032 2034
PM
10 E
mis
sio
ns (
Tg
)
BAU Continued Dual Standards National Leapfrog World Class
Figure ES-7: Projected total PM10 emissions with further policy action (2010–2035)
The World Class program stands in contrast to the Continued Dual Standards program. While the latter, which would continue the bifurcated standards for emissions and fuel quality, does produce benefits when compared with a business-as-usual (BAU) scenario, emissions under such a program will nonetheless be higher in the long term than they are at present because of the expected explosion in vehicle populations. The middle-of-the-road National Leapfrog program—a jump to Euro VI emission standards by 2017—yields substantially greater benefits.
Such major reductions can reduce chronic and acute illnesses as well as mortality by tens of thousands per year, as shown in Figure ES-8. According to an ICCT health impacts model based on World Health Organization (WHO) studies, more than 56,000 premature deaths can be avoided under the World Class program in the year 2035 alone. [2] This is a conservative estimate that represents only urban areas and improvements from reductions in vehicular PM2.5 emissions alone.
0
10,000
20,000
30,000
40,000
50,000
60,000
2010 2015 2020 2025 2030 2035
Ann
ual A
vera
ge
Avo
ided
Dea
ths
Continued Dual Standards National Leapfrog World Class
Figure ES-8: Projected annual avoided premature deaths through 2035 for various scenarios

x
INTERNATIONAL COUNCIL ON CLEAN TRANSPORTATION
Moving toward cleaner vehicles and fuels will certainly involve major investments. On the vehicle side, stringent emission standards will likely increase two- and three-wheeler vehicle prices by Rs. 1500–2000 ($30–40), whereas gasoline-powered cars may have to incur additional costs of up to Rs. 3600 ($76). Diesel cars and trucks, on the other hand, will require after-treatment devices to be installed and thus will incur a cost of up to Rs. 40,000 ($800) for diesel passenger cars and light commercial vehicles and up to Rs. 1–1.5 lakh3 ($2,000–3,000) per heavy commercial vehicle. On the fuel side, supplying ultra-low-sulfur fuels (10 ppm sulfur) across the country will likely raise the price of gasoline and diesel fuels by about Rs. 0.30–0.44 (0.64 to 0.88 cents) per liter. [9]
These costs were compared with the health benefits from reduced premature mortality. The benefits in this analysis are derived solely from reduced mortality owing to re-duced direct vehicular PM emissions. Benefits from lower emissions of other pollutants, such as NOX and ozone, are not evaluated, though these have also been shown to have a negative impact on human health. Nor are benefits from reduced morbidity—such as lower health care costs and increased worker productivity—assessed. Concomitant benefits of lower air pollution, such as increased crop yields, were also not taken into account, though these can be substantial.
In 2025, the net cost of cleaner vehicles and fuels is forecast at Rs. 72,600 crore ($14.5 billion) under the World Class scenario, while the health benefits in 2025 under the same scenario are estimated at Rs. 218,800 crore ($43.8 billion). Looking a bit further into the future, in 2035, under the World Class scenario, the net cost of cleaner vehicles and fuels falls to Rs. 70,800 crore ($14.2 billion) due to economies of scale and learning, while the health benefits in that year are estimated at Rs. 537,000 crore ($107 billion). Thus, in 2025, the benefits are three times the cost, whereas in 2035, the benefit-to-cost ratio is eight.
When cumulative costs and benefits are considered by the year 2035, the net benefit-to-cost ratio for different scenarios ranges between four and five. Even when costs and benefits are estimated conservatively (i.e., higher cost estimates and lower health benefits), the cumulative benefits are up to five times as high as costs.
It should be noted that many of the technologies used to reduce air pollutants will also have a beneficial impact on vehicle fuel economy. As engines are upgraded to include technologies such as variable valve timing (VVT) and variable geometry turbochargers (VGTs), they will yield a side benefit in terms of lowering fuel consumption, thus increasing cost-effectiveness of using these technologies. When coupled with the fuel efficiency standards for vehicles as described in Table ES-2, major reductions in greenhouse gas emissions can be realized over the next 25 years. These GHG emission reductions, shown in Figure ES-9, will result in corresponding savings in petroleum consumption.
3 1 lakh = 100,000
xi
OVERVIEW OF INDIA’S VEHICLE EMISSIONS CONTROL PROGRAM
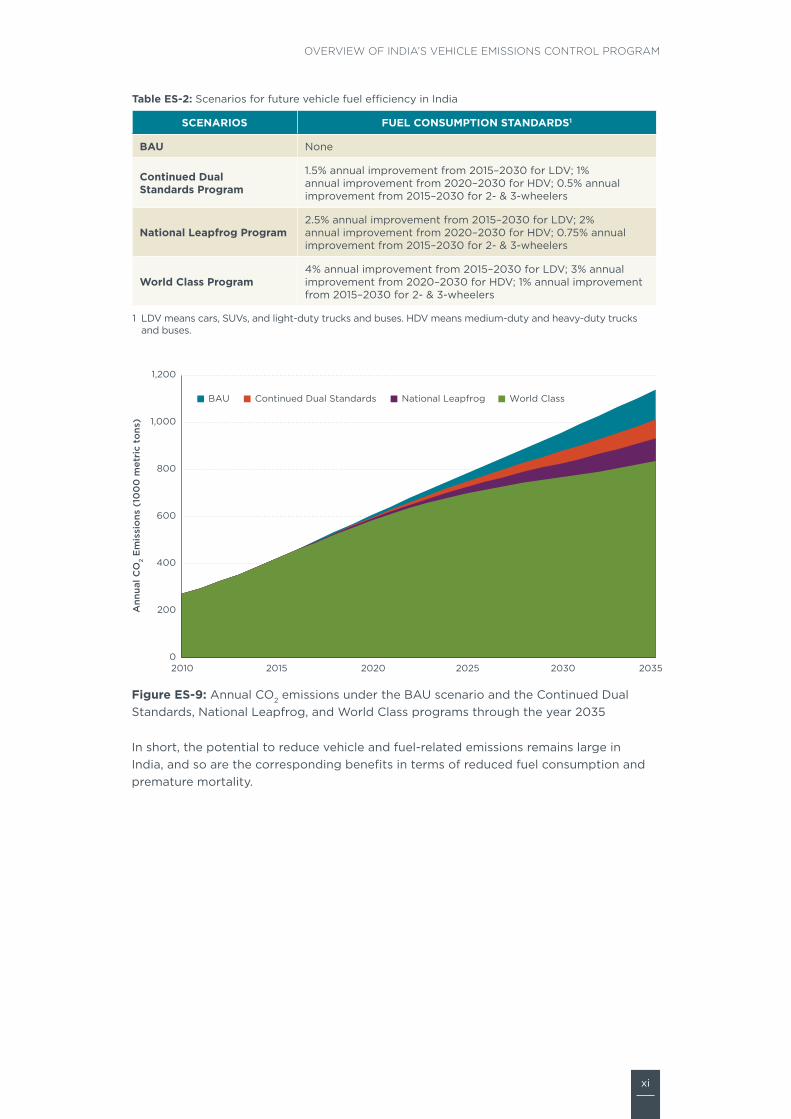
Table ES-2: Scenarios for future vehicle fuel efficiency in India
SCENARIOS FUEL CONSUMPTION STANDARDS1
BAU None
Continued Dual Standards Program
1.5% annual improvement from 2015–2030 for LDV; 1% annual improvement from 2020–2030 for HDV; 0.5% annual improvement from 2015–2030 for 2- & 3-wheelers
National Leapfrog Program2.5% annual improvement from 2015–2030 for LDV; 2% annual improvement from 2020–2030 for HDV; 0.75% annual improvement from 2015–2030 for 2- & 3-wheelers
World Class Program4% annual improvement from 2015–2030 for LDV; 3% annual improvement from 2020–2030 for HDV; 1% annual improvement from 2015–2030 for 2- & 3-wheelers
1 LDV means cars, SUVs, and light-duty trucks and buses. HDV means medium-duty and heavy-duty trucks and buses.
0
200
400
600
800
1,000
1,200
2010 2015 2020 2025 2030 2035
Ann
ual C
O2
Em
issi
ons
(10
00
met
ric
tons
)
BAU Continued Dual Standards National Leapfrog World Class
Figure ES-9: Annual CO2 emissions under the BAU scenario and the Continued Dual Standards, National Leapfrog, and World Class programs through the year 2035
In short, the potential to reduce vehicle and fuel-related emissions remains large in India, and so are the corresponding benefits in terms of reduced fuel consumption and premature mortality.

xii
INTERNATIONAL COUNCIL ON CLEAN TRANSPORTATION
1.3 SUMMARY OF FINDINGSDeveloping a comprehensive and stringent road map soon would not only create regulatory certainty for the oil and automotive sectors and their supplier base but would also, if followed closely, lock in critical pollutant reductions that could help many cities achieve better ambient air quality. The Auto Fuel Vision and Policy Expert Committee has an opportunity to close the gap between India and Europe in terms of emissions and fuel quality standards over the next decade. The technological know-how to achieve the needed improvements in vehicle and fuel quality is already available in the marketplace.
The availability of 50-ppm sulfur countrywide might also aid in leapfrogging to the strictest emission standards such as Euro VI since after-treatment devices would function properly with 50-ppm sulfur, although at a lower efficiency. A subsequent introduction of 10-ppm-sulfur fuels countrywide could further improve emission reduction performance.
With the market share of diesel passenger cars expected to approach 60 percent over the next few years, concern about diesel vehicle emissions persists. By implementing Bharat VI emission standards as soon as possible, the country would be able to take full advantage of the fuel savings offered by diesel technology without raising alarms about the increasing burden of air pollution.
Since the refining sector will need to make substantial investments in improving fuel quality nationwide to make the next stage of vehicle emission standards possible, it needs to be offered adequate incentives.
Apart from supplying low-sulfur fuels and mandating stricter vehicle emission standards, India can revamp its in-use emissions testing and controls program. The current Pollu-tion Under Control (PUC) program is lax and not linked to a vehicle’s original emission standard and predicted deterioration rate. Given that India is already putting in place many new vehicle testing centers, it can take advantage of these facilities to establish a national in-use testing program. The experience of other countries—particularly the United States—serves as an example of what is possible in India.
1.4 SUMMARY OF RECOMMENDATIONSNumerous specific recommendations follow from the ICCT’s comprehensive analysis of the policy context and options for vehicle emissions control in India.
1. Mandate lower sulfur content (10 ppm) for all road-vehicle fuels and tighten emission standards to Bharat VI and beyond for all vehicle types. Figure ES-10 below shows a feasible timeline.
2015 2016 2017 2018 2019 2020 2021 2022 2023 2024 2025
Fuel Sulfur content (ppm) 50 10
LDV Emission Standard BS Va BS Vb BS VI Euro 7/US Tier 3 equivalent
HDV Emission Standard BS V BS VI Euro VII/US2010 equivalent
2/3-Wheeler Emission Standard BS IV BS V BS VI
All implementation dates are for the beginning of the fiscal year (April 1)
Figure ES-10: Recommended implementation dates for fuel sulfur content and vehicle emission standards
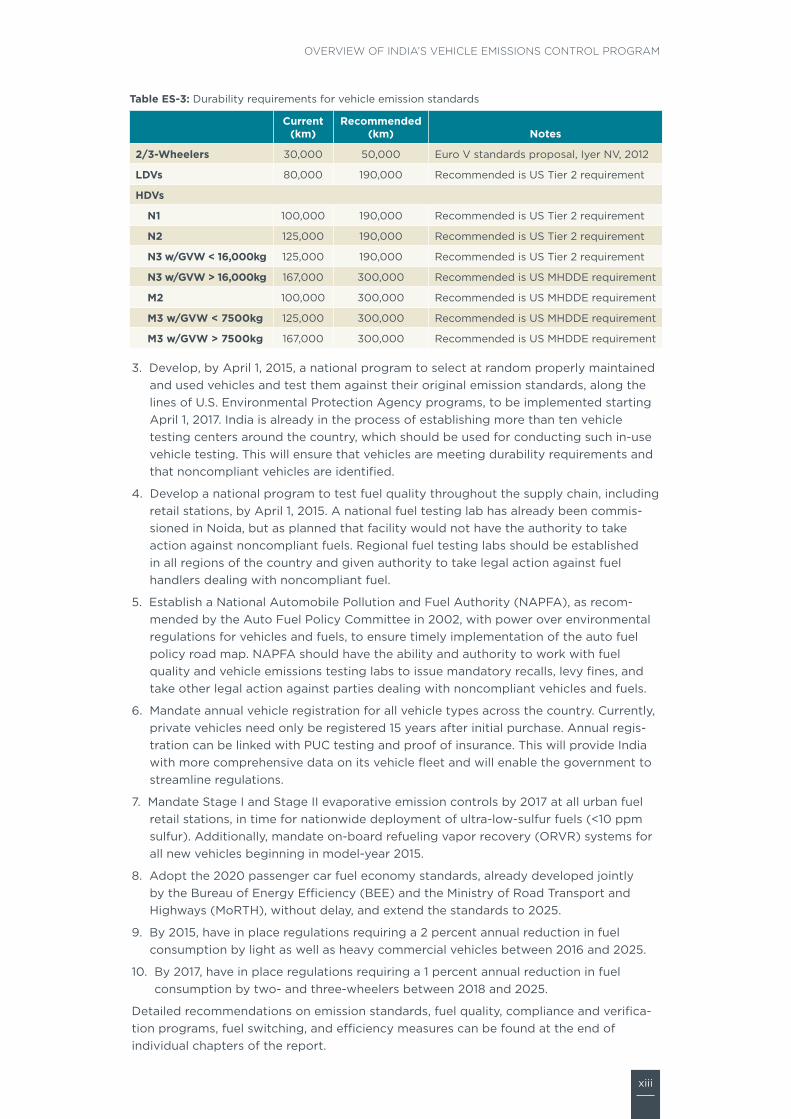
2. Increase the durability requirements of emission regulations to match levels that manufacturers have already demonstrated the ability to meet in other jurisdictions, such as the United States. Table ES-3 below summarizes current and recommended emissions durability.
xiii
OVERVIEW OF INDIA’S VEHICLE EMISSIONS CONTROL PROGRAM
Table ES-3: Durability requirements for vehicle emission standards
Current (km)
Recommended (km) Notes
2/3-Wheelers 30,000 50,000 Euro V standards proposal, Iyer NV, 2012
LDVs 80,000 190,000 Recommended is US Tier 2 requirement
HDVs
N1 100,000 190,000 Recommended is US Tier 2 requirement
N2 125,000 190,000 Recommended is US Tier 2 requirement
N3 w/GVW < 16,000kg 125,000 190,000 Recommended is US Tier 2 requirement
N3 w/GVW > 16,000kg 167,000 300,000 Recommended is US MHDDE requirement
M2 100,000 300,000 Recommended is US MHDDE requirement
M3 w/GVW < 7500kg 125,000 300,000 Recommended is US MHDDE requirement
M3 w/GVW > 7500kg 167,000 300,000 Recommended is US MHDDE requirement
3. Develop, by April 1, 2015, a national program to select at random properly maintained and used vehicles and test them against their original emission standards, along the lines of U.S. Environmental Protection Agency programs, to be implemented starting April 1, 2017. India is already in the process of establishing more than ten vehicle testing centers around the country, which should be used for conducting such in-use vehicle testing. This will ensure that vehicles are meeting durability requirements and that noncompliant vehicles are identified.
4. Develop a national program to test fuel quality throughout the supply chain, including retail stations, by April 1, 2015. A national fuel testing lab has already been commis-sioned in Noida, but as planned that facility would not have the authority to take action against noncompliant fuels. Regional fuel testing labs should be established in all regions of the country and given authority to take legal action against fuel handlers dealing with noncompliant fuel.
5. Establish a National Automobile Pollution and Fuel Authority (NAPFA), as recom-mended by the Auto Fuel Policy Committee in 2002, with power over environmental regulations for vehicles and fuels, to ensure timely implementation of the auto fuel policy road map. NAPFA should have the ability and authority to work with fuel quality and vehicle emissions testing labs to issue mandatory recalls, levy fines, and take other legal action against parties dealing with noncompliant vehicles and fuels.
6. Mandate annual vehicle registration for all vehicle types across the country. Currently, private vehicles need only be registered 15 years after initial purchase. Annual regis-tration can be linked with PUC testing and proof of insurance. This will provide India with more comprehensive data on its vehicle fleet and will enable the government to streamline regulations.
7. Mandate Stage I and Stage II evaporative emission controls by 2017 at all urban fuel retail stations, in time for nationwide deployment of ultra-low-sulfur fuels (<10 ppm sulfur). Additionally, mandate on-board refueling vapor recovery (ORVR) systems for all new vehicles beginning in model-year 2015.
8. Adopt the 2020 passenger car fuel economy standards, already developed jointly by the Bureau of Energy Efficiency (BEE) and the Ministry of Road Transport and Highways (MoRTH), without delay, and extend the standards to 2025.
9. By 2015, have in place regulations requiring a 2 percent annual reduction in fuel consumption by light as well as heavy commercial vehicles between 2016 and 2025.
10. By 2017, have in place regulations requiring a 1 percent annual reduction in fuel consumption by two- and three-wheelers between 2018 and 2025.
Detailed recommendations on emission standards, fuel quality, compliance and verifica-tion programs, fuel switching, and efficiency measures can be found at the end of individual chapters of the report.

xiv
INTERNATIONAL COUNCIL ON CLEAN TRANSPORTATION
1 TABLE OF CONTENTS
1 Executive Summary ............................................................................................................... i
1.1 Report Overview .................................................................................................................................i
1.2 Findings .................................................................................................................................................ii
1.2.1 Past (2000–2010): A decade of accomplishments ..................................................ii
1.2.2 Present (2010–2012): Falling behind? ......................................................................... iv
1.2.3 Future (2013–2035): A time for action and leadership ....................................... vii
1.3 Summary of findings ..................................................................................................................... xii
1.4 Summary of recommendations ............................................................................................... xii
2 Introduction ............................................................................................................................1
3 New vehicle and engine emission standards .................................................................... 3
3.1 Light-duty vehicles (LDVs) ...........................................................................................................4
3.2 Heavy-duty vehicles (HDVs)......................................................................................................... 5
3.3 Two- and three-wheelers ............................................................................................................... 7
3.4 Nonroad vehicles and equipment ............................................................................................. 8
3.5 Barriers to progress in India ......................................................................................................... 9
3.6 Recommendations ......................................................................................................................... 10
4 Fuel quality standards .........................................................................................................13
4.1 Gasoline fuel standards .................................................................................................................14
4.2 Diesel fuel standards ......................................................................................................................15
4.3 Nonroad diesel fuel standards ...................................................................................................16
4.4 Barriers to progress in India ........................................................................................................17
4.4.1 Policy and political barriers .............................................................................................17
4.5 Recommendations ..........................................................................................................................18
5 Vehicle compliance and enforcement program ............................................................. 19
5.1 EPA’s vehicle compliance and enforcement program .......................................................19
5.2 EPA light-duty vehicles (LDVs) compliance program ......................................................19
5.2.1 Preproduction certification testing ............................................................................ 20
5.2.2 Confirmatory testing ........................................................................................................21
5.2.3 Selective Enforcement Audit (SEA) ............................................................................21
5.2.4 In-use surveillance and recall testing program .......................................................22
5.2.5 In-Use Verification Program (IUVP) and In-Use Confirmatory Program (IUCP) ..................................................................................................................23
5.2.6 Recalls ....................................................................................................................................23
5.2.7 Warranty and defect reporting .....................................................................................24
5.3 EPA heavy-duty and nonroad engine compliance program ........................................24
5.3.1 Preproduction certification testing .............................................................................24

xv
OVERVIEW OF INDIA’S VEHICLE EMISSIONS CONTROL PROGRAM
5.3.2 Confirmatory testing .........................................................................................................25
5.3.3 Manufacturer production line testing .........................................................................25
5.3.4 Selective Enforcement Audit (SEA) ...........................................................................26
5.3.5 In-use testing by the EPA and manufacturers ........................................................26
5.4 Inspection and maintenance (I/M) programs ......................................................................27
5.5 Results and costs of the U.S. enforcement program ........................................................29
5.5.1 Costs and resources for the vehicle enforcement program ..............................29
5.6 Overview of China’s vehicle compliance program .......................................................... 30
5.7 China’s enforcement approach ................................................................................................ 30
5.7.1 New vehicle type approval ............................................................................................ 30
5.7.2 Conformity of production ................................................................................................31
5.7.3 In-use compliance testing and recall ..........................................................................32
5.7.4 Inspection and maintenance program .......................................................................33
5.8 Results of China’s enforcement program ..............................................................................34
5.9 Overview of India’s vehicle compliance program .............................................................34
5.10 India’s enforcement approach .................................................................................................35
5.10.1 New vehicle type approval ............................................................................................35
5.10.2 Conformity of production ..............................................................................................36
5.10.3 In-use compliance testing and I/M program ...........................................................37
5.11 Results of India’s enforcement program ..............................................................................38
5.12 Comparison of India’s program with international best practices ............................38
5.12.1 Policy and organizational issues ..................................................................................39
5.12.2 Technical capacity and testing capability................................................................ 40
5.12.3 Financial resources ........................................................................................................... 40
5.13 Recommendations .........................................................................................................................41
6 Fuel inspection and compliance programs ....................................................................43
6.1 Overview of the EPA’s fuel compliance program ...............................................................43
6.1.1 U.S. enforcement approach ............................................................................................43
6.1.2 Fuel and fuel additive registration ............................................................................ 44
6.1.3 Fuel testing and compliance reporting .....................................................................45
6.1.4 Industry-paid independent lab testing ......................................................................45
6.1.5 Presumptive liability and industry-funded field surveys .....................................45
6.1.6 EPA field audits and inspection .................................................................................. 46
6.1.7 Noncompliance penalty .................................................................................................. 46
6.1.8 Averaging, banking, and trading (ABT) system .................................................... 46
6.1.9 Fuel quality labeling ........................................................................................................ 46
6.1.10 Controlling evaporative emissions during refueling ............................................47
6.1.11 Results and costs of the enforcement program .................................................... 48
6.2 Overview of Japan’s fuel compliance program ................................................................ 48

xvi
INTERNATIONAL COUNCIL ON CLEAN TRANSPORTATION
6.2.1 Japan’s fuel quality enforcement approach ........................................................... 48
6.2.2 Quality assurance obligations of fuel importers and refiners ......................... 49
6.2.3 Retail outlet registration and testing requirements ............................................. 49
6.2.4 METI enforcement programs ........................................................................................ 50
6.2.5 Consumer information: Standard Quality (SQ) Mark .......................................... 50
6.2.6 Noncompliance penalty .................................................................................................. 50
6.2.7 Regulatory actions against mixing heavy oil into diesel .................................... 50
6.2.8 Results and costs of Japan’s enforcement program ........................................... 50
6.3 Overview of China’s fuel compliance program .................................................................. 50
6.3.1 Fuel quality enforcement approach ........................................................................... 50
6.3.2 Results and costs of China’s fuel enforcement program .....................................51
6.3.3 Costs of and resources devoted to running the compliance program ..........52
6.4 Overview of India’s fuel compliance program .....................................................................52
6.4.1 Fuel quality enforcement approach ............................................................................53
6.4.2 Controlling evaporative emissions during refueling .............................................53
6.4.3 Results and costs of India’s fuel enforcement program ......................................53
6.4.4 Fuel adulteration ................................................................................................................54
6.4.5 Costs of and resources devoted to running India’s compliance program ...54
6.5 Comparison of India’s program with international best practices .............................55
6.5.1 Poor quality control and divided authority ............................................................55
6.5.2 Problems with liability in India ......................................................................................55
6.5.3 Limited staff, resources, and funding ........................................................................56
6.6 Recommendations for India .......................................................................................................56
7 Alternative fuels and new energy vehicle policies .......................................................57
7.1 Natural gas vehicles.......................................................................................................................57
7.1.1 International experience ..................................................................................................59
7.1.2 India’s Experience ............................................................................................................. 60
7.1.3 Summary and recommendations ..................................................................................61
7.2 Liquefied petroleum gas vehicles ...........................................................................................61
7.2.1 International experience ..................................................................................................62
7.2.2 India’s experience ...............................................................................................................62
7.2.3 Summary and recommendations .................................................................................62
7.3 Biofuel vehicles ...............................................................................................................................62
7.3.1 Ethanol ...................................................................................................................................62
7.3.2 Biodiesel ................................................................................................................................63
7.3.3 Life cycle GHG emissions of biofuels .........................................................................63
7.3.4 International experience ................................................................................................. 64
7.3.5 India’s experience ...............................................................................................................67
7.3.6 Summary and recommendations .................................................................................69

xvii
OVERVIEW OF INDIA’S VEHICLE EMISSIONS CONTROL PROGRAM
7.4 New energy vehicles ....................................................................................................................69
7.4.1 International experience and policies .........................................................................71
7.4.2 India’s experience and policies .....................................................................................73
7.4.3 Summary and recommendations .................................................................................75
8 Fuel efficiency and greenhouse gas programs ..............................................................76
8.1 Vehicle efficiency standards versus GHG emission standards ......................................76
8.2 Weight-based versus size-based regulations ......................................................................76
8.3 International LDV standards ......................................................................................................77
8.3.1 The United States ...............................................................................................................78
8.3.2 Europe ....................................................................................................................................78
8.3.3 China .......................................................................................................................................79
8.4 International HDV standards ......................................................................................................79
8.4.1 Japan .......................................................................................................................................81
8.4.2 United States ........................................................................................................................81
8.4.3 Europe ....................................................................................................................................82
8.4.4 China .......................................................................................................................................82
8.5 International two- and three-wheeler experience .............................................................82
8.6 Compliance in the United States ..............................................................................................83
8.7 Labeling ..............................................................................................................................................86
8.7.1 EU labels ................................................................................................................................87
8.7.2 U.S. labels ..............................................................................................................................88
8.7.3 Labels in other countries .................................................................................................88
8.8 India’s fuel economy standards ................................................................................................89
8.8.1 LDVs and HDVs ...................................................................................................................89
8.8.2 Two- and three-wheelers ................................................................................................89
8.8.3 Labels in India ......................................................................................................................89
8.8.4 Future prospects ............................................................................................................... 90
8.9 Findings and recommendations ...............................................................................................92
9 Effects of new regulations on the environment, public health, and the economy in India ..................................................................................................93
9.1 Modeling vehicle emissions and corresponding health and economic impacts ....93
9.1.1 India’s vehicular emission control program over the past decade .................93
9.1.2 A look into the future .......................................................................................................97
9.2 Cost-Benefit Analysis .................................................................................................................. 103
9.2.1 Costs of manufacturing vehicles to meet more stringent standards ........... 103
9.2.2 Cost to upgrade refineries and produce cleaner fuels ......................................104
9.2.3 Analysis of costs and benefits.....................................................................................104
9.3 Conclusions .....................................................................................................................................106

xviii
INTERNATIONAL COUNCIL ON CLEAN TRANSPORTATION
Appendix A: ICCT India Emissions and Health Models Methodology, Data Sources, and Assumptions .......................................................................................... 107
ICCT India Health Assessment Model (IHAM) .......................................................................... 107
Health Impacts .............................................................................................................................. 107
Economic Benefits ........................................................................................................................ 110
ICCT India Emissions Model (IEM)................................................................................................... 111
Inputs .................................................................................................................................................. 111
Methodology ................................................................................................................................... 113
Appendix B: Emission Standards in the United States, European Union, India, China, and Japan .................................................................................................................... 116
Acronyms ................................................................................................................................................130
Appendix C: Technologies required to meet Euro 4/IV, 5/V, 6/VI ................................ 132
Light-Duty Vehicles (LDV) ............................................................................................................... 132
Heavy-Duty Vehicles (HDV) ............................................................................................................. 134
Appendix D: Impacts of fuel specifications on emission performance ....................... 136
Appendix E: Comparison of China, EU, U.S., California fuel specifications ................. 139
Appendix F: Cost of emission control technologies in India .......................................... 141
1. Cost Methodology ............................................................................................................................ 141
1.1 India Fleet Engine Size .......................................................................................................... 141
2. Technology Required for Each Indian Emission Level ...................................................... 142
2.1 Passenger Car and Utility and Multipurpose Vehicle Technology ................... 142
2.2 Commercial Vehicles .........................................................................................................144
2.3 Two- and Three-Wheelers ............................................................................................... 145
3. Cost Reductions ............................................................................................................................. 146
Appendix G: Acronyms and Definitions ............................................................................. 147
References .............................................................................................................................. 150

1
OVERVIEW OF INDIA’S VEHICLE EMISSIONS CONTROL PROGRAM
2 INTRODUCTIONIndia is the world’s second-largest country by population. It has a rapidly growing economy, of which the transportation sector is a key component. The number of vehicles on India’s roads increased by 240 percent over the past ten years and is expected to expand at a similar rate throughout the next two decades. Because of the magnitude of this growth, India’s decisions in managing its transportation sector will have important impacts on the environment, public health, global warming, and the international economy.
While making available a range personal transportation options for the general populace is necessary for both economic growth and the achievement of a high standard of living, there are negative externalities associated with following a pathway that relies on increasing numbers of vehicles. Vehicle emissions, in the form of conventional pollutants (CO, NOX, PM, HC, and others) and greenhouse gases (CO2, CH4, and others), can have adverse impacts such as premature mortality and morbidity from cardiopulmonary dis-eases, lower crop yields, environmental damage, and global warming. These problems, in turn, can set back the economy. Premature mortality and morbidity reduce productivity, and money and resources must be diverted to treating preventable diseases and clean-ing up the environment. [10–12]
In addition to averting the diversion of money and resources, controlling vehicular air pollution will generate benefits in terms of mitigating global warming. Many hydrocar-bons, such as methane, contribute to global warming, as does black carbon, which is a major component of vehicular particulate matter emissions. Nitrogen oxides and carbon monoxide do not directly affect global warming, but both can react with other particles in the atmosphere to become global warming contributors. Controlling vehicular emissions of conventional pollutants will therefore have a positive impact on reducing greenhouse gases, even if this is not the primary intent of vehicular emissions controls.
India has recognized the link between emissions and both health and climate issues. The country has taken steps to mitigate the harmful effects of its fast-growing transportation sector. Given the expected growth in vehicle stock and population, India will need to do much more to tackle its critical air pollution problem. This includes the conventional practices of tightening emission standards and introducing cleaner fuels but also policies promoting alternative fuels, electric-drive vehicles, sustainable urban planning, alterna-tives to driving, economic policies, and the management of in-use vehicles.
Even if India were to implement the world’s most stringent emission standards and cleanest fuels, overall vehicular emissions would continue to increase as long as private vehicles remained the most attractive transportation option for the public. Similarly, India will have to consider the effects of its fuel subsidy programs on vehicular emissions. Current policies reducing the price of certain fuels (such as diesel and kerosene) not only encourage the dieselization of India’s vehicle fleet but also give rise to the problem of fuel adulteration. India will have to reflect on all these issues as it develops transporta-tion policies for the future.
Discussing each and every policy item that relates to India’s transportation sector in detail is beyond the scope of this report. Undoubtedly, this means that some important issues are either omitted or discussed superficially. Nevertheless, India has a great opportunity to make progress on many of the issues discussed in this report. In Janu-ary 2013, an Expert Committee on Auto Fuel Vision and Policy—2025 was constituted under the leadership of Dr. Saumitra Chaudhuri of the Planning Commission. The Expert Committee is charged with establishing a road map for vehicle emission and fuel quality standards through 2025. It may also suggest mechanisms to retire or retrofit high-emit-ting vehicles, recommend financial schemes to upgrade oil refineries and promote clean

2
INTERNATIONAL COUNCIL ON CLEAN TRANSPORTATION
transportation, and encourage a shift away from liquid fuels toward gas and electricity in transport. This report serves as a comprehensive go-to guide for the Expert Committee as it works on these issues.
The report provides an in-depth analysis of India’s past, present, and possible future poli-cies regarding issues related to vehicle emissions. It starts with a look at India’s vehicle emission control policies (Chapter 3), which are compared with those of other countries for context and to highlight international best practices. The following chapter (Chapter 4) assesses India’s fuel quality control policies in the same way. Compliance programs in India to enforce vehicle emission and fuel quality policies are then discussed (Chapters 5 and 6). Chapter 7 looks at the advantages and disadvantages of various alternative fuels in India and internationally. Chapter 8 switches gears a bit to fuel economy and greenhouse gas emission standards internationally. The report concludes with in-depth modeling analyses of possible vehicular emissions reductions as a result of new regula-tions in India and their corresponding health and economic benefits (Chapter 9).

3
OVERVIEW OF INDIA’S VEHICLE EMISSIONS CONTROL PROGRAM
3 NEW VEHICLE AND ENGINE EMISSION STANDARDS
Emission standards, which set limits on the amount of various pollutants allowed to be released by new vehicles and engines over a predefined test cycle, are an essential element of all vehicle emission control programs. Vehicle emission standards go hand in hand with fuel quality requirements—especially limits on lead and sulfur in fuels—which enable advanced emission control technologies to be properly used and optimized.
Emission standards in regions with mature programs, such as the European Union (EU), the United States, and Japan, are generally set according to the reductions achievable by the best available technologies for the regulatory period considered. Other concerns, such as cost-effectiveness and safety, are also taken into consideration. For example, Section 202 of the U.S. Clean Air Act (CAA) [13] clearly states that, to protect public health and welfare, the U.S. Environmental Protection Agency (EPA) administrator should adopt “standards which reflect the greatest degree of emission reduction achievable through the application of technology which the administrator determines will be available for the model year to which such standards apply, giving appropriate consideration to cost, energy, and safety factors associated with the application of such technology.”
In India, the Air (Prevention and Control of Pollution) Act of 1981, established the right of the government to set vehicular emission standards. [14] That law stipulates that an Indian state’s Pollution Control Board may “lay down, in consultation with the Central Pollution Control Board (CPCB) and having regard to the standards for the quality of air laid down by the CPCB, standards for emission of air pollutants into the atmosphere from industrial plants and automobiles or for the discharge of any air pollutant into the atmosphere from any other source whatsoever not being a ship or an aircraft.…” The law also gives states the right to inspect, examine, and enforce air quality regulations set by their Pollution Control Boards. The Environment (Protection) Act, 1986, [15] then authorized the central government to regulate much of what previously had been in the realm of individual states.
One important difference between India’s approach and others in setting vehicle emission standards is that most other countries or regions do not form a committee to recommend a long-term road map for emission standards. Instead, the next generation of emission standards is set a few years in advance, based on the latest technology and policy developments. This makes it difficult to predict what regulations will be in place well in ahead of time.
It should be noted that standards only limit the rate at which pollutants are emitted and not the total amount of pollutants released into the atmosphere. Controlling total vehicular pollution entails also taking measures to limit the number of vehicles in the fleet and how much they are used, which requires coordination between those responsible for land-use planning, infrastructure development/maintenance, and monitoring vehicular emissions, as well as other policies. A detailed discussion of the full suite of transportation system policies, however, is beyond the scope of this report. Still, emission limits are an essential component of a comprehensive approach toward reducing vehicle pollution.
To outline India’s vehicle emission standards policy approach, the following sections have been organized by vehicle type: light-duty vehicles (LDVs), heavy-duty vehicles/engines (HDVs), two- and three-wheelers, nonroad construction equipment, and agricultural tractors. For each vehicle type, a timeline of the implementation of standards in various countries, in India as a whole, and in major Indian cities is presented and discussed. Also included are summaries of the technologies expected to be used to meet future stan-dards in India. The chapter ends with a discussion of barriers to progress and specific recommendations for regulatory improvements.

4
INTERNATIONAL COUNCIL ON CLEAN TRANSPORTATION
3.1 LIGHT-DUTY VEHICLES (LDVs)This category comprises passenger cars, utility vehicles, vans, and light commercial vehicles. Worldwide, LDVs generally run on gasoline, though diesel and compressed natural gas (CNG) are becoming increasingly popular. In India, diesel-operated LDV sales are growing rapidly because of government subsidies for diesel fuel.
Regulated pollutants include all hydrocarbons (HC), carbon monoxide (CO), and oxides of nitrogen (NOX). Diesel-operated LDVs also have particulate matter (PM) emission limits. Emissions are tested using a modified version of the New European Driving Cycle (NEDC). [16] The main difference between the European and Indian testing cycles is that the Indian test has a maximum speed of 90 kilometers per hour, while the European test goes up to 120 km/h. Tables with limits for all regulated pollutants are provided in Appendix B.
India is participating in the formulation of the Worldwide Harmonized Light Vehicles Test Procedure (WLTP), which is being developed with the aim of having test cycle that is much more comprehensive than the NEDC. In the future, the WLTP is expected to become the test cycle used for certification to standards in many countries.
India first began to lower permissible vehicle emission limits following court rulings in the late 1980s and 1990s. After 2000, India adopted the European template for vehicle emission standards. [17] Currently, new vehicles sold in 13 cities must meet Bharat IV (Euro 4–equivalent) standards, while the rest of the country mandates Bharat III standards. Figure 3.1.1 shows the timeline of standards implementation in India and other countries.
Among advanced countries, the United States has the world’s most stringent emission standards for LDVs. Even so, it will phase in stricter standards yet beginning in 2017, which shows that there is still much potential to reduce vehicle emissions. While it is difficult to compare Indian emission standards with those of the United States, since the Americans do not follow the Euro 1–6 path, India should ultimately strive to meet what the United States has accomplished.
The time gap between Indian LDV emission requirements and those of the European Union varies. Standards in major metropolitan areas in India lag about five years behind the latest Euro standards, while the rest of the country is almost a decade behind. [17, 18]
Even when compared with other developing nations and those with socioeconomic levels similar to India’s, India currently lags behind. China, Brazil, South Africa, and Thailand all have implemented at least Euro 4–equivalent standards nationwide. Many of these countries have plans to move on to Euro 5 and beyond in the next few years as well. Figure 3.1.1 shows the known timeline of implementation for new LDV emission standards in India and elsewhere.

5
OVERVIEW OF INDIA’S VEHICLE EMISSIONS CONTROL PROGRAM
2005 2006 2007 2008 2009 2010 2011 2012 2013 2014 2015 2016 2017 2018
India Bharat II Bharat III
India - Cities# Bharat III Bharat IV
United States Tier 2* Tier 3
Europe Euro 4 Euro 5 Euro 6
China China 2* China 3* China 4 (petrol only)* China 4 (all)* China 5
Brazil L-4 phase-in (Euro 3) L-4 (Euro 3) L-5 (Euro 4) L-6 (Euro 5)
South Africa Euro 1 Euro 2 Euro 4
Thailand Euro 2 Euro 3 Euro 4
* Some cities/regions have more stringent emission standards# As of January 2013 the following cities have Bharat IV standards: Delhi (NCR), Mumbai, Kolkata, Chennai, Bangalore, Hyderabad, Ahmedabad, Pune, Surat,
Kanpur, Agra, Solapur, Lucknow, Ankleshwar, Hisar, Bharatpur, Unnao, Raebareli, Aligarh, Jamnagar, Vapi, Puducherry, and Mathura. A total of 50-60 cities are planned to have Bharat IV standards by 2015.
Figure 3.1.1: Light-duty vehicle standard adoption timeline in India and other countries
While India’s standards have historically been based on those of Europe, there are lessons that can be learned from the analysis of other emissions control programs. One shortcoming of the Euro standards is that they have different requirements for diesel and gasoline vehicles, with a less stringent NOX requirement for diesel vehicles—even in the upcoming Euro 6 phase. Euro 3–5 NOX standards are three times as lax for diesel vehicles as for gasoline ones. For Euro 6, diesel limits are allowed to be 30 percent higher. (See Appendix B for full details.) In contrast, the U.S. approach sets the same standard across all fuel types. Many diesel vehicles in the U.S. market have been certified to these strict levels, showing that it is unnecessary for diesel vehicles to be granted more relaxed emissions requirements. Hong Kong has developed a unique system to ensure that this trade-off does not occur. It allows the sale of gasoline-powered passenger vehicles certified to the latest U.S., EU, or Japanese standards but only allows diesel passenger vehicles certified to U.S. Tier 2 Bin 5 standards. [19] Hong Kong’s example may be particularly useful for India, where nearly half of all passenger vehicle sales are diesel-operated vehicles and sales are growing rapidly because of government subsidies that lower the price of diesel fuel.
To move to stricter emission standards, gasoline-powered vehicles require continuous improvements in terms of air-fuel management and catalytic converters. These technolo-gies are already present in Euro 3 and 4 vehicles. For diesel vehicles, meeting Euro 5 and 6, with their particle mass and number limits, requires the use of diesel particulate filter (DPF) technology and lower-sulfur fuels (below 50 ppm required; 10 ppm recommend-ed). NOX is most likely to be controlled through in-cylinder measures such as exhaust gas recirculation (EGR) for Euro 5, while Euro 6 likely requires the use of lean NOX catalysts. Selective catalytic reduction (SCR) is not expected in passenger cars but might be used in larger light commercial vehicles. Tables C-1 and C-2 in Appendix C summarize the vehicle technology requirements to meet Euro 4, 5, and 6 standards.
3.2 HEAVY-DUTY VEHICLES (HDVs)Heavy-duty vehicles in India include commercial trucks, buses, and on-road vocational vehicles such as refuse haulers and cement mixers. Most HDVs operate on diesel, though a number of urban commuter buses operate on CNG.
Regulated pollutants are identical to those for light-duty vehicles. However, unlike the light-duty vehicle standards, which are measured directly using chassis dynamometer testing (and have units of grams per kilometer), heavy-duty vehicle emissions are certified in two cycles: the European Stationary Cycle (ESC) and the European Transient

6
INTERNATIONAL COUNCIL ON CLEAN TRANSPORTATION
Cycle (ETC). Diesel-operated HDVs must pass both tests to be certified. HDVs operating on CNG do not have to undergo the ESC test. Engine emission limits are set in terms of grams per kilowatt-hour. [20, 21] These are summarized in Appendix B.
Figure 3.2.1 shows the timelines for the adoption of HDV emission standards in India and other countries. [17, 18] Indian cities that mandate Bharat IV LDV emission stan-dards also do so for HDVs that operate only within their city limits, while the rest of India follows Bharat III.
As is the case with LDV emission standards, HDV standards in India as a whole lag well behind international best practices. The United States and Europe are about ten years ahead of India. Even developing countries at comparable socioeconomic levels are ahead. Most have moved up to Euro IV–equivalent standards nationwide. Brazil is already at the Euro V level. Furthermore, many countries are expected to move beyond what is shown in Figure 3.2.1 over the next few years, though they may not have officially declared an implementation date.
2005 2006 2007 2008 2009 2010 2011 2012 2013 2014 2015 2016 2017 2018
India Bharat II Bharat III
India - Cities# Bharat III Bharat IV
United States Tier 2* Tier 3
Europe Euro IV Euro V Euro VI
China China II* China III* China IV* China V
Brazil P-5 (Euro III) P-6 (Euro IV) P-7 (Euro V)
South Africa Euro I Euro II Euro III
Thailand Euro III Euro IV
* Some cities/regions have more stringent emission standards# As of January 2013 the following cities have Bharat IV standards: Delhi (NCR), Mumbai, Kolkata, Chennai, Bangalore, Hyderabad, Ahmedabad, Pune, Surat, Kanpur,
Agra, Solapur, Lucknow, Ankleshwar, Hisar, Bharatpur, Unnao, Raebareli, Aligarh, Jamnagar, Vapi, Puducherry, and Mathura. A total of 50-60 cities are planned to have Bharat IV standards by 2015.
Figure 3.2.1: Heavy-duty vehicle standard adoption timeline in India and other countries
A technology pathway overview is provided in Table C-4 of Appendix C, outlining various engine modification and after-treatment options for moving to Euro IV, V, and VI. For heavy-duty vehicles, Euro VI PM limits will require the use of DPFs and low-sulfur fuel. As in the LDV case, ultra-low-sulfur levels (<10 ppm) will enable DPFs to perform at their maximum potential, although fuels with 50 ppm will still allow DPFs to function with somewhat higher PM emission levels. To accelerate the environmental and health benefits beyond what can be achieved by strictly following the Euro IIIàIVàVàVI pathway, DPFs may be introduced early on through incentives, as was done in Germany, for example, through road tax pricing schemes or the establishment of Low-Emission Zones. This is a workable strategy for vehicles that are driven in urban areas where lower-sulfur fuels are already available. Accelerated health benefits could also be achieved by adopting emission standard limits that require DPFs ahead of the traditional schedule. For example, Bharat VI PM limits could be adopted for Bharat V when it comes into force in Indian cities. Such requirements would require DPFs on heavy-duty vehicles, while light-duty vehicles would be unaffected because PM standards are the same under Bharat V and Bharat VI for LDVs. A variation of this strategy is already in place in Santiago, Chile. The city requires all new Euro III buses to meet a tougher PM standard that requires them to be outfitted with DPFs verified by California’s Air Resources Board (ARB) or the European VERT (Verminderung der Emissionen von Realmaschinen im Tunnelbau) certification scheme. [19]
Experience in Europe suggests that meeting the NOX limits for Euro IV and Euro V requires the use of selective catalytic reduction or exhaust gas recirculation. Each system has its advantages and disadvantages. SCR systems reduce NOX emissions further than

7
OVERVIEW OF INDIA’S VEHICLE EMISSIONS CONTROL PROGRAM
EGR and allow HDV engines to be tuned for higher fuel efficiency, but they require urea as a reagent to function. Therefore, the development of an adequate urea supply infra-structure is critical for enabling the use of SCR technology. Another consideration is that SCR systems need to be coupled with fail-safe measures to make sure urea in the tank is replenished. Without urea, NOX emissions from a Euro IV or V vehicle can surpass even Euro I levels. Options to remind drivers to refill the urea tank include warning lights for tank levels, urea quality sensors to make sure the tank is filled with the proper substance, and inhibition of vehicle performance when the tank is empty (e.g., drastically reduced speeds or inability to start the engine).
Another concern regarding SCR systems is that recent research has called into question the extent to which Euro IV and Euro V standards translate to NOX reductions under urban driving conditions. In-use emissions measurements of NOX emissions from Euro IV and Euro V vehicles operating with low engine loads have shown emissions levels three times greater than the standard limit. [22, 23] The Euro IV and V emission control system is optimized to meet the standard limit over the relatively high-load and high-temperature European test cycle. As a consequence, at loads that are not covered by the test cycle, including the low engine loads seen in congested urban traffic, the SCR system either underperforms or is deactivated completely. Many SCR systems are known to stop urea dosing at low exhaust temperatures in order to minimize the release of ammonia.
In Europe, it is expected that the upcoming changes in the test procedures for Euro VI certification will require emissions control over a larger range of operating conditions and will therefore avoid the aforementioned problems with Euro IV and V vehicles. The test procedure for Euro VI will be the World Harmonized Heavy-duty Test Cycle (WHTC). Other changes include the addition of a cold-start testing component and in-use testing requirements.
One option to address the issue of excess NOX emissions from Euro IV and Euro V vehicles operating at low loads is modifying the current Euro V test procedure to adopt features of the Euro VI test procedure (cold-start, WHTC, and in-use testing requirements). Another option, for countries that have not yet implemented Euro V, is to leapfrog directly from Euro IV to Euro VI. Additional discussion of this issue and solutions can be found in another ICCT publication: Urban Off-Cycle NOX Emissions from Euro IV/V Trucks and Buses [24].
3.3 TWO- AND THREE-WHEELERSTwo- and three-wheelers include motorcycles, mopeds, autorickshaws, and small three-wheeled goods carriers. Gasoline is the most common fuel for two-wheelers, while three-wheeler autorickshaws tend to operate on diesel or CNG.
The number of two- and three-wheeler vehicles on India’s roads is high in both absolute terms and as a percentage of total vehicles. Two-wheelers alone represented more than 72 percent of registered vehicles in the country in 2005, up from 66 percent in 1991. [17] With more than 9.8 million units sold, they made up almost 80 percent of all new vehicle sales in the 2009–2010 fiscal year. [5]
With such an immense population of motorcycles and mopeds, regulations for this group of vehicles are an important part of India’s emissions control program. Regulated pollut-ants for these vehicles in India, as well as in Europe and China, are HC, CO, and NOX, with extra PM regulations for diesel-powered three-wheelers.4
4 Gasoline-powered vehicles typically have much lower engine-out emissions of particulate matter than their diesel counterparts.
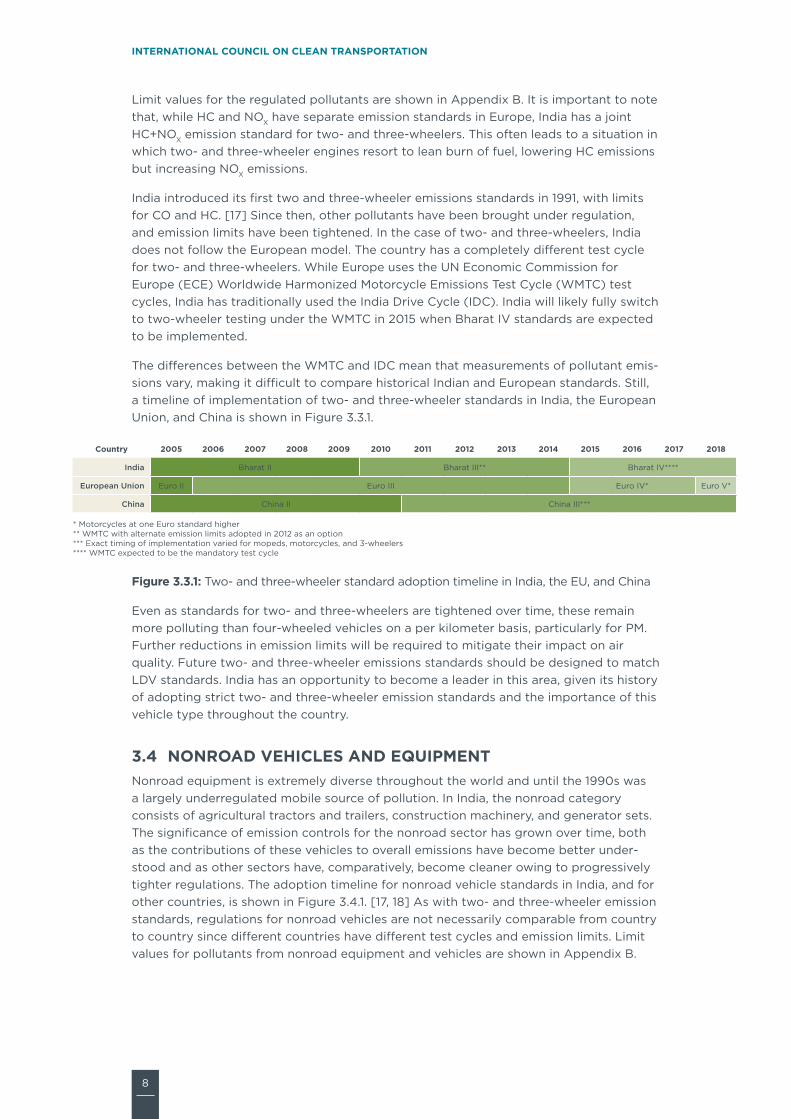
8
INTERNATIONAL COUNCIL ON CLEAN TRANSPORTATION
Limit values for the regulated pollutants are shown in Appendix B. It is important to note that, while HC and NOX have separate emission standards in Europe, India has a joint HC+NOX emission standard for two- and three-wheelers. This often leads to a situation in which two- and three-wheeler engines resort to lean burn of fuel, lowering HC emissions but increasing NOX emissions.
India introduced its first two and three-wheeler emissions standards in 1991, with limits for CO and HC. [17] Since then, other pollutants have been brought under regulation, and emission limits have been tightened. In the case of two- and three-wheelers, India does not follow the European model. The country has a completely different test cycle for two- and three-wheelers. While Europe uses the UN Economic Commission for Europe (ECE) Worldwide Harmonized Motorcycle Emissions Test Cycle (WMTC) test cycles, India has traditionally used the India Drive Cycle (IDC). India will likely fully switch to two-wheeler testing under the WMTC in 2015 when Bharat IV standards are expected to be implemented.
The differences between the WMTC and IDC mean that measurements of pollutant emis-sions vary, making it difficult to compare historical Indian and European standards. Still, a timeline of implementation of two- and three-wheeler standards in India, the European Union, and China is shown in Figure 3.3.1.
Country 2005 2006 2007 2008 2009 2010 2011 2012 2013 2014 2015 2016 2017 2018
India Bharat II Bharat III** Bharat IV****
European Union Euro II Euro III Euro IV* Euro V*
China China II China III***
* Motorcycles at one Euro standard higher** WMTC with alternate emission limits adopted in 2012 as an option*** Exact timing of implementation varied for mopeds, motorcycles, and 3-wheelers**** WMTC expected to be the mandatory test cycle
Figure 3.3.1: Two- and three-wheeler standard adoption timeline in India, the EU, and China
Even as standards for two- and three-wheelers are tightened over time, these remain more polluting than four-wheeled vehicles on a per kilometer basis, particularly for PM. Further reductions in emission limits will be required to mitigate their impact on air quality. Future two- and three-wheeler emissions standards should be designed to match LDV standards. India has an opportunity to become a leader in this area, given its history of adopting strict two- and three-wheeler emission standards and the importance of this vehicle type throughout the country.
3.4 NONROAD VEHICLES AND EQUIPMENT Nonroad equipment is extremely diverse throughout the world and until the 1990s was a largely underregulated mobile source of pollution. In India, the nonroad category consists of agricultural tractors and trailers, construction machinery, and generator sets. The significance of emission controls for the nonroad sector has grown over time, both as the contributions of these vehicles to overall emissions have become better under-stood and as other sectors have, comparatively, become cleaner owing to progressively tighter regulations. The adoption timeline for nonroad vehicle standards in India, and for other countries, is shown in Figure 3.4.1. [17, 18] As with two- and three-wheeler emission standards, regulations for nonroad vehicles are not necessarily comparable from country to country since different countries have different test cycles and emission limits. Limit values for pollutants from nonroad equipment and vehicles are shown in Appendix B.

9
OVERVIEW OF INDIA’S VEHICLE EMISSIONS CONTROL PROGRAM
2006 2007 2008 2009 2010 2011 2012 2013 2014 2015
India - Construction Equipment Stage II# Stage III+
India - Agricultural Tractors & Generator Sets Stage III+ Stage IIIA+
China Stage I Stage II
Europe Stage III Stage IV Stage V
United States* Tier 3
# Equivalent to Europe Stage I+ Equivalent to US Tier 2/3* Each Tier phased in over time. Year shown is the first year of each phase. See Appendix A for more detailed timeline
Figure 3.4.1: Nonroad standard adoption timeline in India, the United States, the EU, and China
India first regulated nonroad vehicles in 1999 with the implementation of emissions standards for agricultural tractors. These standards were tightened over the next decade, and India implemented separate emissions standards for construction equipment in 2007. With time, the country has worked to unify emissions limits for both categories, although differences remain for engines with power ratings lower than 19 kilowatts. In 2011, the central government tightened all of these standards and based them on the U.S. nonroad emission standards pattern. The test procedure followed is the U.S. 8178 C1 cycle. [27] Therefore, although India adopts the “stage” terminology used in Europe, in reality its standards follow the U.S. “tier” pattern.
Indian emission limits are slightly more lax than U.S. emission limits for heavier nonroad equipment and vehicles. Indian nonroad emission standards were mostly on a par with the United States until recently. But with the United States gradually implementing Tier 4 standards, which will require DPFs on all nonroad vehicles and equipment, India has fallen behind again.
Another unique aspect of India’s regulation of nonroad equipment is the separate regulation of emissions from generator sets.5 While there are some separate regulations for generator sets in the United States, there are none in the EU or China. Generator sets were first regulated in India in 2004, with a few changes made over the next year and a half to equalize emissions limits for all generator sets operating below 800 kW. Generator sets with power ratings above 800 kW are treated as power plants, and their emissions are regulated as such. [25] Emission standards for generator sets are specified in milligrams per normal cubic meter. Details are given in Appendix B.
3.5 BARRIERS TO PROGRESS IN INDIAThe biggest barrier to progress in India is the delay in establishing future vehicle emission standards. While Europe, China, and Brazil all have at least short-term plans to tighten emission standards, India did not convene a new Auto Fuel Policy Committee until 2013, a full three years after the previous Auto Fuel Policy road map was carried out. To make matters worse, many other regions have permanent government bodies that periodically revise and recommend emission standards, while India relies on an Expert Committee that is formed ad hoc at the will of the government. Given that the Mashelkar Committee had suggested in 2003 that there be a review of progress every five years, and that India’s air pollution problem continues to worsen, this is particularly grave.
Apart from new standards themselves, the poor representation of real-world driving con-ditions in current test cycles is something that India can tackle immediately. The country currently uses a modified version of the European NEDC test cycle for its four-wheeled
5 Generator sets are used to generate electricity in the absence of electric power from the grid. They are generally diesel powered.

10
INTERNATIONAL COUNCIL ON CLEAN TRANSPORTATION
vehicle emissions tests. Studies in Europe have shown that emissions measured under this test cycle are much lower than in real-world driving conditions, especially for NOX. [28, 29] This is shown in Figure 3.5.1, in which the red plume in the graphic is the legal limit for NOX emissions, while the gray plume is actual NOX emissions. [30]
Euro 32000
Euro 42005
Euro 52009
Euro 32000
Euro 42005
Euro 52009
Nitrogen oxide (NOX) emissions (in g/km)
GASOLINE DIESEL
Figure 3.5.1: Legal limit for NOX emissions (red plume) compared with real-world NOX emissions (gray plume) from LDVs in Europe
Adopting world harmonized test cycles such as the WMTC, WLTP, and WHTC, even with current emission limits, would help solve this problem because it could force more advanced NOX control technologies on diesel vehicles by requiring them to meet emis-sion limits across a broader range of driving conditions.
3.6 RECOMMENDATIONSThe Expert Committee should close the gap between Indian and European emission standards by 2025. The primary recommendation for the Expert Committee regarding vehicular emissions is to adopt stricter standards for all vehicle types and to implement the corresponding required fuel quality standards. Doing so would have tremendous benefits for public health and India’s economy (to be discussed further in Chapter 9). Apart from moving to Euro 6/VI–equivalent standards as soon as possible, it should be India’s goal to close the gap with international best practices during this time period. Figure 3.6.1 shows a feasible timeline for India to implement stricter vehicle emission standards, in conjunction with low-sulfur fuels.

11
OVERVIEW OF INDIA’S VEHICLE EMISSIONS CONTROL PROGRAM
2015 2016 2017 2018 2019 2020 2021 2022 2023 2024 2025
Fuel Sulfur content (ppm) 50 10
LDV Emission Standard BS Va BS Vb BS VI Euro 7/US Tier 3 equivalent
HDV Emission Standard BS V BS VI Euro VII/US2010 equivalent
2/3-Wheeler Emission Standard BS IV BS V BS VI
All implementation dates are for the beginning of the fiscal year (April 1)
Figure 3.6.1: Recommended implementation dates for fuel sulfur content and vehicle emission standards in India
To ensure that India does not again fall behind in the future, it would be ideal for the Ministry of Road Transport and Highways (MoRTH) to be responsible for developing the new auto fuel policy or establishing an auto fuel policy committee on its own every five years since it is ultimately responsible for enforcing vehicle emission regulations. But the MoRTH cannot take full responsibility in this matter because the authority to regulate various matters related to vehicle emissions is currently split among many ministries and agencies. For example, the Ministry of Petroleum and Natural Gas (MoPNG) regulates fuels, meaning that the MoRTH will have to cooperate with the MoPNG to ensure the required fuels for cleaner vehicles are supplied. This division of responsibility is discussed in detail in Chapters 5 and 6.
In addition to tightening emission standards and improving fuel quality, the following are other recommendations the Expert Committee can consider to reduce vehicular emissions:
Increase durability requirements for all vehicle types. Durability requirements should be increased to match levels that manufacturers have already demonstrated the ability to meet in other jurisdictions, such as the United States. Table 3.6.1 below summarizes current and recommended emissions durability.
Table 3.6.1: Durability requirements for vehicle emission standards
Current (km)
Recommended (km) Notes
2/3-Wheelers 30,000 50,000 Euro V standards proposal, Iyer NV, 2012
LDVs 80,000 190,000 Recommended is US Tier 2 requirement
HDVs
N1 100,000 190,000 Recommended is US Tier 2 requirement
N2 125,000 190,000 Recommended is US Tier 2 requirement
N3 w/GVW < 16,000kg 125,000 190,000 Recommended is US Tier 2 requirement
N3 w/GVW > 16,000kg 167,000 300,000 Recommended is US MHDDE requirement
M2 100,000 300,000 Recommended is US MHDDE requirement
M3 w/GVW < 7500kg 125,000 300,000 Recommended is US MHDDE requirement
M3 w/GVW > 7500kg 167,000 300,000 Recommended is US MHDDE requirement
Replacing current test cycles with world harmonized test cycles. The current modified NEDC and other test cycles used in India lead to emissions measurements that are not always representative of real-world driving conditions, particularly for NOX. India can mitigate this problem by replacing these procedures with world harmonized test cycles such as the Worldwide Harmonized Motorcycle Emissions Test Procedure (WMTC), Worldwide Harmonized Light Vehicles Test Procedure (WLTP) and World Harmonized Heavy-duty Test Cycle (WHTC). These cycles are much more comprehensive in their

12
INTERNATIONAL COUNCIL ON CLEAN TRANSPORTATION
requirements and hence make it more difficult for a vehicle to “beat” the cycle in the laboratory but emit much more in reality. Europe is already considering replacing its NEDC test cycle with world harmonized test cycles when Euro 6 and VI are implement-ed. India can follow suit and require world harmonized test cycles when it implements Bharat IV standards nationwide.
Use multiple test cycles for certification and compliance. In the absence of a strict test cycle, using multiple cycles can avoid a situation in which a vehicle is designed to “beat the cycle” while in reality emitting much more than expected. If vehicles must pass emis-sions tests on many cycles that have different characteristics, manufacturers will have to design vehicles that emit below set limits in multiple situations.
Removal or retrofitting of gross emitters. Even with stringent standards for new vehicles, old vehicles will be responsible for the largest share of vehicular emissions. While India will have to consider the economic implications of removing or retrofitting high-emitting vehicles, doing so will have a positive impact on air quality. Especially in severely pol-luted areas, India can implement policies that either remove the oldest, most polluting vehicles from roads or retrofit them with modern technologies to lower their emissions. Removal and retrofitting of gross emitters are further discussed in Chapter 5.
13
OVERVIEW OF INDIA’S VEHICLE EMISSIONS CONTROL PROGRAM
4 FUEL QUALITY STANDARDSExtensive studies have been carried out to understand better the linkage between vehicle technology, fuel quality, and emissions levels.6 These studies have shown that fuel quality improvements directly reduce pollutants formed during combustion and, more important, enable the use of more effective exhaust after-treatment devices. Superior emission controls can be achieved only if fuel and vehicle standards are implemented in parallel and if a compliance program is established to enforce both fuel and vehicle standards.
India’s fuel quality standards have been gradually tightened since the mid-1990s. Low-lead gasoline was introduced in 1994 in Delhi, Mumbai, Kolkata, and Chennai. On Feb 1, 2000, unleaded gasoline was mandated nationwide. Lead in fuel prevents the proper functioning of catalytic converters. Additionally, lead in fuel is emitted by vehicle tailpipes, which can have serious adverse health impacts. [31]
After lead, the next most important factor in fuels is sulfur. During combustion, sulfur in diesel fuel is converted into PM emissions via sulfuric acid and sulfur dioxide emissions that lead to secondary particle formation in the atmosphere. These chemicals can also cause acid rain.
Sulfur also inhibits the proper functioning of after-treatment systems designed to reduce tailpipe emissions and corrodes engines and pipes. The effect of fuel sulfur content is particularly damaging to three types of after-treatment systems: diesel particulate filters (DPFs), lean NOX traps (LNTs), and selective catalytic reduction (SCR). The impacts on each are discussed below:
DPFs can achieve an 85–95 percent reduction in PM emissions, but fuel sulfur content can diminish this efficiency in several ways: [18]
1. Operation with higher-sulfur fuels can cause the filter to be overloaded with soot and can result in engine damage (due to increased back pressure) or uncontrolled filter regeneration (removal of soot by heating) that can damage the filter through burning.
2. In DPFs with passive filter regeneration, sulfur in the exhaust can be oxidized to form sulfates, dramatically increasing the PM emissions. Sulfur oxides also decrease the efficiency of the filter by competing for sites on the catalyst needed for the critical nitric oxide to nitrogen dioxide reaction. This increases the regeneration temperature and lowers the efficiency of the filter.
3. In active-regeneration DPFs, higher sulfur leads to sulfate formation, resulting in an increase in PM emissions. Sulfate formation can also increase back pressure, requir-ing more frequent filter regeneration, which results in increased fuel consumption and shorter maintenance intervals.
Sulfur in fuels also limits the efficiency of two important NOX control technologies: SCR and lean NOX traps (LNTs). For an SCR system with an oxidation catalyst ahead of the SCR catalyst, high fuel sulfur restricts the efficacy of the oxidation catalyst, resulting in an increase in PM emissions. Sulfur’s reaction with urea-based SCR systems can also form ammonium bisulfate. In addition, SCR systems using zeolite catalysts that perform better in urban driving conditions (low-load, low-temperature operations) are sensitive to sulfur (cannot function well with 350 ppm sulfur). High-sulfur fuel will limit the effectiveness of zeolite catalysts for SCR systems, thus impairing their performance in urban settings. [32]
6 For example, the Auto/Oil Air Quality Improvement Research Program (AQIRP) established in the United States in 1989 included major oil companies, automakers, and four associate members. A test program called the European Programme on Emissions, Fuels and Engine Technologies (EPEFE) was initiated by the European Commission and joined by the auto and oil industry. The Japan Clean Air Program (JCAP) was formed by the Petroleum Energy Center as a joint research program of the auto and oil industries and supported by the Ministry of Economy, Trade and Industry.

14
INTERNATIONAL COUNCIL ON CLEAN TRANSPORTATION
LNTs, a NOX after-treatment technology still under development, can easily be deacti-vated by fuel sulfur because the chemistry of sulfur oxides is very similar to NOX. In fact, NOX absorption sites absorb sulfur oxides in preference to NOX. The effects are partially reversible, but the high temperatures required for this can contribute to catalyst aging, and the process can hurt vehicle fuel efficiency.
In India, fuel quality standards have been designed and implemented in conjunction with vehicle emissions standards, which has allowed the benefits of emissions reduction policies to be more fully realized. A problem remains, though, in that fuel sulfur limits in most of the country are more lax than the limits in a handful of cities. This means that vehicles designed to meet Bharat IV emissions standards, particularly diesel-powered ones, may have higher emissions than expected when and if they refuel in areas with higher fuel sulfur content.
The following sections review the current diesel and gasoline standards adopted in India. They also discuss obstacles to improving fuel standards and offer recommendations to overcome them.
4.1 GASOLINE FUEL STANDARDSGasoline properties that are the most relevant to vehicle emissions are sulfur content, volatility, and the levels of benzene, other aromatic hydrocarbons, olefins, and oxygen-ates. Tables D-1 and D-2 in Appendix D summarize the impacts of various gasoline fuel characteristics on vehicle emissions.
India’s current gasoline standards took effect on April 1, 2010. The new standards are marked improvements from pre-2010 levels. Benzene limits were cut down from 3 percent in cities previously governed by the Bharat III standard and 5 percent elsewhere to 1 percent nationwide. The aromatic content limit, which was unregulated under Bharat II, stands at 42 percent under Bharat III norms and 35 percent under Bharat IV. Olefins, which were also unregulated under Bharat II, now are restricted to 21 percent and 18 percent for regular unleaded and premium unleaded, respectively, under Bharat III and Bharat IV regulations. Higher olefin content, along with higher Reid vapor pressure (RVP), in fuels creates more evaporative emissions, which leads to the formation of ozone and other polluting gases in the atmosphere. The octane number was increased from 88 and 93 for regular and premium, respectively, under Bharat II. It was increased again, to 91 and 95 for regular and premium, under Bharat III and beyond. [17] Table E-1 in Appendix E lists selected gasoline quality parameters in India and compares them with those of other countries.
In terms of gasoline sulfur content, India still lags behind international best practices. At the start of 2013, 23 cities required no more than 50 ppm sulfur in gasoline, while in the rest of the country up to 150 ppm sulfur is allowed. By 2015, the number of cities with a maximum gasoline sulfur content of 50 ppm is to be expanded to about 60. In contrast, Japan and Europe have mandated 10-ppm-sulfur gasoline since 2008 and 2009, respectively. The US will mandate 10-ppm-sulfur gasoline in 2017, when it moves to Tier 3 vehicle emission standards.
Among developing countries, China will implement 50-ppm-sulfur gasoline in 2014 and 10 ppm in 2018. Brazil plans to leapfrog from 1,000-ppm-sulfur gasoline to 50 ppm by 2014. In both China and Brazil, gasoline with lower fuel sulfur content is already available in regions where more stringent vehicle emission standards are in place. South Africa mandated 50-ppm-sulfur gasoline in 2007 and will move to 10 ppm in 2017. Thailand required 50-ppm-sulfur gasoline in 2012. All this shows that countries at developmental levels similar to India can make significant progress without hurting economic develop-

15
OVERVIEW OF INDIA’S VEHICLE EMISSIONS CONTROL PROGRAM
ment. Moreover, gasoline sulfur content in these countries may further decrease in the coming years, as they do not usually lay out long-term road maps for fuel quality standards. Figure 4.1.1 below shows a timeline of gasoline sulfur content in India and other regions.
Country 2005 2006 2007 2008 2009 2010 2011 2012 2013 2014 2015 2016 2017 2018
India - Nationwide 500 150
India - Cities# 150 50
United States 30 10
European Union 50 10
Japan 50 10
China 500* 150* 50* 10
Brazil 1000* 50*
South Africa 500 50 10
Thailand 150 50
* Lower fuel sulfur content available for vehicles that require it# As of January 2013 the following cities have 50 ppm sulfur fuel: Delhi (NCR), Mumbai, Kolkata, Chennai, Bangalore, Hyderabad, Ahmedabad, Pune, Surat, Kanpur, Agra,
Solapur, Lucknow, Ankleshwar, Hisar, Bharatpur, Unnao, Raebareli, Aligarh, Jamnagar, Vapi, Puducherry, and Mathura. A total of 50-60 cities are planned to have Bharat IV standards by 2015.
Figure 4.1.1: Gasoline sulfur content standard adoption timeline in India and other countries
The higher sulfur content in non–Bharat IV areas will have to be dealt with in the future if India moves forward to Bharat VI emissions standards.
4.2 DIESEL FUEL STANDARDSSulfur is one of the most important fuel characteristics affecting NOX and PM emissions from diesel transport. For a diesel vehicle, PM emissions can bear a direct relation to the fuel sulfur content. [32] Therefore, reducing sulfur in fuels results in lower PM emissions from any diesel engine, regardless of which vehicle standard the engine is certified to.
Even more important, sulfur in diesel can damage or impede the performance of advanced after-treatment devices necessary for controlling PM and NOX emissions, including DPFs, some types of catalysts used in SCR technology, and possibly LNTs in the future.
India has reduced its diesel sulfur content from 10,000 ppm in most of the country in 1999 to a maximum of 350 ppm today. In 23 cities the level has fallen to 50 ppm over the same time period. A total of 63 cities (including those already subject to the 50-ppm-sulfur limit) are scheduled to receive supplies of 50-ppm-sulfur diesel by 2015. [17]
Figure 4.2.1 shows a timeline of diesel sulfur levels in India and other regions. Japan and Europe have mandated 10-ppm-sulfur diesel since 2007 and 2009, respectively. The United States has required 15-ppm-sulfur diesel since 2006.
Among developing countries, China will institute a 50-ppm ceiling for sulfur content in diesel in 2015 and 10 ppm in 2018. Brazil does not yet have plans that mandate only low-sulfur diesel, but it does make low-sulfur fuels available nationwide for vehicles that require them. South Africa tightened its limit to 50-ppm-sulfur diesel in 2007 and will reduce it further to 10 ppm in 2017. Thailand mandated 50-ppm-sulfur diesel nationwide in 2012. Mexico, not shown in Figure 4.2.1, is in the process of transitioning to 15-ppm-sulfur diesel throughout the country, and some regions already have it on offer. As is the case with gasoline, diesel sulfur content in these countries may decrease still more in the coming years because they do not customarily publish road maps for fuel quality standards well in advance.

16
INTERNATIONAL COUNCIL ON CLEAN TRANSPORTATION
Country 2005 2006 2007 2008 2009 2010 2011 2012 2013 2014 2015 2016 2017 2018
India - Nationwide 500 350
India - Cities# 350 50
United States 500 15
European Union 50 10
Japan 50 10
China 2000 350* 50* 10
Brazil 2000 1800* 500*
South Africa 500 50 10
Thailand 150 50
* Lower fuel sulfur content available for vehicles that require it# As of January 2013 the following cities have 50 ppm sulfur fuel: Delhi (NCR), Mumbai, Kolkata, Chennai, Bangalore, Hyderabad, Ahmedabad, Pune, Surat, Kanpur, Agra,
Solapur, Lucknow, Ankleshwar, Hisar, Bharatpur, Unnao, Raebareli, Aligarh, Jamnagar, Vapi, Puducherry, and Mathura. A total of 50-60 cities are planned to have Bharat IV standards by 2015.
Figure 4.2.1: Diesel sulfur content standard adoption timeline in India and other countries
Other diesel characteristics—including polyaromatic content, cetane number, density, distillation, ash and suspended solids content, and viscosity—also affect diesel emissions. The impacts of these qualities and sulfur on the performance and emissions of light- and heavy-duty engines are summarized in Tables D-3 and D-4 in Appendix D.
Diesel fuel quality is perhaps more important in India than in other countries because of the mushrooming numbers of diesel LDVs over the past decade. In 2002, about five liters of diesel were consumed for every liter of gasoline. [33] That year, diesel vehicles accounted for about 10 percent of new vehicle sales, with the figure increasing to 28 percent in 2010 and to more than 49 percent in fiscal year 2012–2013. [34] This is at least partly attributable to government subsidies for diesel, created because of the perceived importance of diesel in agriculture and goods transportation. The subsidies resulted in diesel being significantly cheaper (by about Rs. 20, or 40¢, per liter) than gasoline, in spite of the stepwise increases in diesel fuel prices, in January 2013. [35] Naturally, this encourages the production and sale of diesel passenger vehicles.
The difference in sulfur content between the fuel supplied to a few cities and the rest of the country is problematic because diesel-operated heavy-duty vehicles are in practice only meeting Bharat III standards, even the ones sold in Bharat IV–governed cities. Since they often refuel with high-sulfur diesel, their after-treatment systems will not function properly and thus their PM emissions cannot meet Bharat IV standards. Air quality in India could greatly improve if 50-ppm-sulfur diesel were sold throughout the country, before the eventual adoption of 10-ppm-sulfur diesel.
4.3 NONROAD DIESEL FUEL STANDARDSLike motor vehicle diesel, the most important characteristic of nonroad diesel affecting emissions is sulfur content. In many countries, standards for fuels for nonroad vehicles and equipment are often on different schedules than those for on-road vehicles. Usually standards for nonroad fuel quality have lagged behind on-road fuel quality standards.
Over the past decade, the United States, the European Union, and Japan have gradually tightened emissions standards for nonroad engines and equipment. To enable the use of emission control devices in nonroad applications, these countries have promulgated in parallel with transportation fuel regulations lower limits on nonroad diesel sulfur. The EU and Japan now have a maximum of 10-ppm sulfur in fuels for all off-road vehicles and equipment, while the United States requires 15-ppm diesel for nonroad engines. [36]

17
OVERVIEW OF INDIA’S VEHICLE EMISSIONS CONTROL PROGRAM
India currently does not have separate standards for commercial nonroad diesel. Firms in the 23 Bharat IV cities presumably use 50-ppm-sulfur diesel for construction equipment, and those in Bharat III areas use 350-ppm-sulfur diesel, because most diesel for nonroad vehicles and equipment is obtained from ordinary vehicle fuel stations. Agricultural tractors, most of which are in rural areas, also use the 350-ppm-sulfur diesel commercially available there. Test fuel for construction machinery is required to have a maximum of 500 ppm sulfur, while that for agricultural tractors must have less than 300 ppm sulfur. Table 4.3.1 shows the fuel sulfur limits adopted for nonroad vehicles in India and other countries/regions.
Table 4.3.1: Nonroad fuel requirements in the United States, EU, Japan, Brazil, China, and India
LIMITS UNITED STATES1 EU JAPAN CHINA INDIA
Current sulfur limits
15 ppm for nonroad (since 2010 for all except locomotive and marine vessels; since July 2012 for these as well)
10 ppm since 2011
10 ppm since 2008
2000 ppm
350 ppm in Bharat III areas and 50 ppm in Bharat IV cities
Adopted future limits
15 ppm since 2012 for nonroad, locomotive and marine applications
350 ppm by July
2013
1 Small refiners and importers are allowed more time to meet the diesel sulfur requirements, which will be 500 ppm by 2010 and 15 ppm by 2014.
4.4 BARRIERS TO PROGRESS IN INDIA
4.4.1 Policy and political barriersThe biggest barrier to progress in India is the delay in implementing the supply of ultra-low-sulfur fuels, which would enable the sale of vehicles meeting more stringent emission standards. While regions with advanced regulations such as Europe, the United States, and Japan implemented low-sulfur fuels years ago, and developing countries like China, South Africa, Mexico, and Brazil have plans to reduce fuel sulfur levels further in the near future, India is making minimal progress on this front. Apart from expanding the supply of 50-ppm sulfur fuel to about 60 cities by 2015, there is no plan as of yet to supply that essential fuel to the whole country, nor to reduce fuel sulfur content to 10 ppm. Supplying 50-ppm fuel only to urban areas will not benefit the majority of vehicles in India, especially as vehicle sales become dispersed away from large urban centers. The situation will not get better for commercial trucks—which are the largest emitters of NOX and PM— either since they often operate and refuel in rural areas.
Apart from the need for a road map to chart progress toward supplying ultra-low-sulfur fuels throughout India, there are other aspects of fuel quality and regulations that the Expert Committee should take into account. These are discussed below.
Fuel subsidies: Traditionally, to support agriculture, the transport of goods, and weaker sections of society, India’s central government has arranged for kerosene, diesel, and certain other fuels to be sold at a fixed rate lower than their market value. The downside of this has been that oil companies lose money in the process. This makes them reluctant to invest in clean fuel technologies, and it also leads to the problem of fuel adulteration (discussed below).
Recently, the government agreed to raise diesel prices by Rs. 0.50 (1 cent) every month until the full diesel subsidy is eliminated. This is a tremendous step forward for India’s oil industry. It will allow for investments in ultra-low-sulfur fuel production technologies.
Still, thanks to variations in sales taxes, the price of diesel will remain roughly Rs. 10 (20 cents) per liter cheaper than petrol. If this is not remedied, dieselization of India’s passen-ger car fleet will continue, and incentives for fuel adulteration will not be fully removed.

18
INTERNATIONAL COUNCIL ON CLEAN TRANSPORTATION
Fuel adulteration: Due to the lower cost of certain fuels, such as kerosene, with respect to gasoline, vehicle fuels are often mixed with cheaper ones. Depending on which fuels are mixed and the extent of adulteration, vehicular emissions can be higher and fuel economy can be hurt. India has attempted to control the problem by reforming kerosene subsidies and setting up committees and task forces to improve inspection of facilities and fuel transporters. Nevertheless, fuel adulteration persists.
Differences in emission test fuel and commercial fuel: Under Bharat IV specifications, fuel used to test emissions from vehicles is cleaner than commercially available fuel. For example, regulations specify that Bharat IV test diesel can have a maximum sulfur concentration of 10 ppm, whereas commercial diesel contains up to 50 ppm and 350 ppm sulfur in Bharat IV cities and the rest of the country, respectively. The lower sulfur in testing fuel leads to emissions test results that are unrealistically lower than actual emissions on the road.
4.5 RECOMMENDATIONSMandate a nationwide maximum fuel sulfur content of 50 ppm by 2015 and 10 ppm in 2017. Ultra-low-sulfur fuels are necessary to enable stricter vehicular emission standards. Even without new emission standards, lower fuel sulfur enhances the performance of emission control devices already in use. Therefore, creating a road map to reduce nationwide fuel sulfur content to a maximum of 50 ppm by April 2015 and 10 ppm by April 2017 will have an impact on vehicular emissions in India even in the near term, as well as enabling cleaner vehicles in the future.
Continue fuel price reforms. Fuel subsidy reforms can discourage fuel adulteration and allow oil companies to make a profit, which in turn will let them make the necessary invest-ments for low-sulfur fuels. The current policy of increasing diesel prices until the full diesel subsidy is removed should continue regardless of political considerations. Additionally, sales tax differences between gasoline and diesel fuels should be eliminated. [37]
19
OVERVIEW OF INDIA’S VEHICLE EMISSIONS CONTROL PROGRAM
5 VEHICLE COMPLIANCE AND ENFORCEMENT PROGRAM
To deliver on the promise of environmental and health benefits from new vehicle standards, an effective vehicle compliance and enforcement program has to be in place to ensure that regulations for new and in-use vehicles are effectively implemented.
This chapter summarizes critical elements of the vehicle compliance and enforcement programs in the United States, China, and India. India’s program is compared with the U.S. Environmental Protection Agency (EPA) program, which is one of the most comprehensive vehicle enforcement programs in the world, and with China, which is an emerging economy with many parallels to India. The chapter ends with recommenda-tions to enhance India’s vehicle compliance program.
5.1 EPA’S VEHICLE COMPLIANCE AND ENFORCEMENT PROGRAMThe U.S. vehicle compliance program is by far the most comprehensive and far-reach-ing compliance program in the world. Before the Clean Air Act (CAA) was passed in 1970, the United States had a vehicle compliance program that only covered prototypes for new vehicle certification. [13] The CAA changed that, adding authority for the EPA to ensure that all vehicles coming off the assembly lines meet standards. It also authorized the EPA to hold manufacturers responsible for vehicles meeting standards throughout their useful lives, provided that customers properly maintain them. Lastly, the CAA required manufacturers to warrant individual emissions control components on vehicles to protect consumers. Over the years, the EPA compliance program has grown and evolved from one that focused mainly on verifying that prototype and new production vehicles comply with standards to one that places strong emphasis on in-use testing and durability to ensure that emissions standards are met over the useful life of a vehicle. The development of portable emissions measurement systems (PEMS) and on-board diagnostic (OBD) systems makes in-use emission testing feasible. [38]
The EPA was able to shift resources to in-use vehicle testing programs over time because of its vigilant certification and Selective Enforcement Audit (SEA) programs. These initial programs deterred fraudulent reporting of certification results and com-pelled manufacturers to test new vehicles extensively, at their own cost, to guarantee production conformity.
The following sections review the compliance program for light-duty vehicles, heavy-duty and nonroad engines, and motorcycles. A section is devoted to a summary of inspection and maintenance programs and best practices as well. Results and costs of the U.S. compliance and enforcement program are also presented.
5.2 EPA LIGHT-DUTY VEHICLES (LDVs) COMPLIANCE PROGRAM7 The new vehicle compliance and enforcement program for LDVs (including two- and three-wheelers, the latter category comprising mainly all-terrain vehicles in the United States) consists of 1) Preproduction certification, 2) Confirmatory testing, 3) Selective En-forcement Audit , 4) In-use surveillance performed by the EPA, 5) Verification performed by the manufacturer under the EPA’s In-Use Verification Program (IUVP), 6) Recall in case of noncompliance, and 7) Warranties and defect reporting. The LDV compliance program is outlined in Figure 5.2.1.
7 For more information, please see: http://www.epa.gov/otaq/cert.htm

20
INTERNATIONAL COUNCIL ON CLEAN TRANSPORTATION
5.2.1 Preproduction certification testingUnder the CAA Section 206, [13] all engines and vehicles sold in the United States are required to be covered by a certificate of conformity before they can enter the market. The certification demonstrates that the engine or vehicle conforms to all applicable emissions and fuel economy requirements. A deterioration factor is applied to the test results before a vehicle passes or fails.8
Preproduction testing is conducted by manufacturers to support their applications for certificates of conformity.9 A manufacturer can establish its own testing facility to conduct the test or contract the services of independent laboratories. Test results, adjusted with deterioration factors, must be recorded in the certification applications to demonstrate compliance. Manufacturers must perform certification testing for all “test groups” that they choose to certify.
A test group, or engine family, is a basic classification unit used for demonstrating compliance with vehicle emissions requirements. It is a group of vehicles or engines having similar design and emission characteristics. These characteristics include engine displacement, cylinder number, arrangement of cylinders and combustion chambers (in-line vs. V-shaped), and being subject to the same type of emission standards. The manufacturer is required to select a vehicle configuration within every test group that is expected to generate the highest level of emissions and emissions deterioration as the test vehicle (the worst-case configuration). The selected configu-ration is called the emission data vehicle. [39]
Manufacturers submit certification applications through the EPA’s computer system, called VERIFY, which automatically validates all applications. Manual auditing is per-formed for some applications. The EPA issued more than 3,600 conformity certificates to vehicle and engine manufacturers annually in both 2007 and 2008. [40]
8 The deterioration factor is an essential part of testing for preproduction certification, as well as for selective enforcement audits and conformity of production discussed later in this chapter. The EPA has adopted a demonstration regulation on how to determine deterioration factors. Each manufacturer is required to design a durability process that predicts the in-use deterioration of the vehicles it produces. Most manufacturers determine deterioration factors using accelerated bench aging procedures for emission control components. The manufacturer-funded in-use testing program (In-Use Verification Program), also discussed later in this chapter, provides valuable data to validate manufacturers’ procedures for determining deterioration factors. If in-use testing shows larger deterioration factors, the manufacturer must revise its procedures for determining deterioration factors.
9 Certification testing in the United States comprises the following test procedures: federal test procedure (FTP), highway fuel economy test, US06 (high speed/acceleration cycle), SC03 (air conditioning test cycle), cold CO (FTP conducted at 20 degrees F), evaporative emissions, On-board refueling vapor recovery (ORVR), and running loss emissions test.

21
OVERVIEW OF INDIA’S VEHICLE EMISSIONS CONTROL PROGRAM
VEHICLE DESIGN AND BUILD
EPA ReviewsFinal Manufacturer
Application
Selective Enforcement Audit (SEA)
conduct if needed
EPA In-Use Surveillance Testing
EPA Issues Certificate
of Conformity
EPA Action Manufacturer Action
if failures of IUVP exceed threshold
In-Use Confirmatory Test Program (IUCP) conducted by manufacturer
Source: EPA. 2007 Progress Report-Vehicle and Engine Compliance Activities. Oct., 2008.
USEPA vehicle compliance programfor light-duty vehicles (LDVs)
0 Miles 20,000 Miles10,000 Miles 50,000 Miles
80,000km32,000km16,000km
90,000 Miles
144,000km
120,000 Miles
193,000km
EPA Confirmatory Testing, Random
and Targeted
EPA Reviews Initial
ManufacturerApplication
Manufacturer PrototypeVehicle Emissions and
Durability Testing(Representative of
Production)
Low-Mileage In-UseVerification Testing
Performed by Manufacturer
High-Mileage In-UseVerification Testing
Performed by Manufacturer
End of Useful Life(per CAA)
[Emission LevelsPredicted Via Certification
Durability Testing]In-Use Verification Program (IUVP)
Figure 5.2.1: EPA Vehicle compliance program for light-duty vehicles
5.2.2 Confirmatory testing Confirmatory tests are targeted and random tests performed by EPA to validate the emission and fuel economy results reported for certification. In recent years, EPA selected about 15 percent of all test groups for confirmatory testing; two-thirds of the selected test groups (10 percent of all test groups) are randomly selected, and the remaining one-third (5 percent of all test groups) are targeted test groups. [41] All LDV confirmatory tests are currently conducted at EPA’s Ann Arbor, Michigan, laboratory.10
The majority of vehicles targeted for confirmatory testing are those models that use new technology or new designs. Others are targeted because of potential emission concerns, in particular, models with certified emission levels close to the maximum permitted (those with only a small emission margin).
Manufacturers are invited to observe how the tests are performed. Every test vehicle is offered two attempts to pass. If the vehicle fails the first test, it is tested a second time. The manufacturer may also choose to inspect the test vehicle after the first failure to determine what went wrong. If a vehicle fails two valid tests, no certificate will be issued. The manufacturer may choose not to pursue certification or may make changes (recali-bration) and then submit a new application.
5.2.3 Selective Enforcement Audit (SEA)The SEA program came about in the mid-1970s, when the EPA found that manufactur-ers were occasionally producing classes of new vehicles that did not comply with standards, even though the certified prototypes met the standards. The SEA aims to identify cases where prototype vehicles supplied by manufacturers are not representa-tive of production.
10 The EPA can require additional confirmatory tests to be conducted by manufacturers in the future if need be.

22
INTERNATIONAL COUNCIL ON CLEAN TRANSPORTATION
Under the SEA program, the EPA can require manufacturers to test vehicles pulled straight off the assembly line, at the manufacturer’s expense, without prior notice. The SEA gives the EPA an opportunity to assess, early on, whether certified vehicles are actually being built adhering to the specifications of the prototype. It also serves as a check to see if manufacturers are allowing sufficient compliance margins, such that engine and emissions control equipment functions effectively to meet standards after deterioration factors are applied.
The SEA was designed based on the premise that testing a fixed percentage of all assembly line vehicles was not necessary. Rather, a program that focused on potentially suspect classes could achieve the same goal at a lower cost to the industry. To pick the target test groups for auditing, EPA used information from many different sources, including a manufacturer’s compliance history, compliance margin, certification data, inspection and maintenance data, technology reviews, and defect reports.
SEA audits can be performed at the manufacturer facility, following EPA requirements, or at any testing lab the EPA chooses. If a model fails SEA testing, the EPA has the power to revoke or suspend certification, which will restrict sales of the model until the manufacturer can demonstrate conformity with the standards.
Because penalties for failing the SEA tests are disruptive to manufacturers, many now routinely test their own vehicles. Soon after the program started, manufacturers began testing 100 times as many vehicles as the number audited by the EPA. By the mid-1980s, failed LDV audits were a rare occurrence, as individual vehicle failures under the SEA program became infrequent. This led the EPA to shift LDV SEA staff and resources to in-use vehicle testing programs and HDV SEA efforts. [38]
EPA has not conducted any SEA for LDVs in recent years, but the agency reserves the right to conduct SEA tests if problems such as reporting fraud or improper testing are suspected.
5.2.4 In-use surveillance and recall testing programThe LDV SEA program has largely been replaced with an in-use surveillance and recall testing program. This program targets either vehicle classes that are suspected of having emission-related problems or populations that are chosen to be sampled for other rea-sons. Similar to the way in which the SEA program uses external information to focus on potential problems, vehicle classes can be scrutinized based on 1) manufacturer defect reports; 2) information from state inspection and maintenance programs; 3) manufac-turer service bulletins; 4) certification test results (the EPA is more likely to test vehicle models that have had problems in certification); 5) newer technologies or engines; 6) sales volume; 7) In-Use Verification Program (IUVP) failures; 8) random selection; or 9) any other reason the EPA deems appropriate.
All selected vehicles are tested at the Ann Arbor laboratory (unless otherwise designated by the EPA), following the same test procedures and filling up with the same fuels (standard fuels) used for certification. Manufacturers are contacted if their vehicles are picked for in-use testing, and they are invited to watch the tests being conducted and maintenance being performed on the vehicles so that they can have confidence in the quality of the tests.
To conduct surveillance, the EPA typically recruits three to five vehicles that are two or three years old from the southeastern Michigan area (in proximity to the Ann Arbor lab). The agency’s contractor contacts vehicle owners from each of the groups selected by the EPA for testing. The owners are given small monetary awards (about $20 per day) and a loaner car (or $50 per day in lieu of a loaner car). The EPA ensures that the cars have been properly maintained and used or, if needed, performs required maintenance before testing. The maintenance performed depends on program requirements. Partici-pants are given a list of any parts that are replaced.

23
OVERVIEW OF INDIA’S VEHICLE EMISSIONS CONTROL PROGRAM
In 2007, a total of 142 vehicles were tested, representing 47 test groups. Nine vehicles (representing five test groups) failed the in-use tests, but only one test group showed failure to an extent that warranted further investigation. [40]
Testing enters the confirmatory phase if the surveillance results indicate that a sub-stantial number of vehicles in a class may exceed emission standards within their useful life and if the manufacturer declines to resolve the problem. This step could lead to an EPA-ordered recall if testing were to confirm the likelihood of a substantial number of vehicles failing within the class. The manufacturer can voluntarily recall the vehicles at any time or may come up with another method to fix the problem to avoid mandatory recalls. The EPA will work with manufacturers to agree on appropriate remedies to obviate a recall. However, it has the authority under Section 207(c) of the Clean Air Act to order a recall if voluntary measures are not agreed upon. [13]
Vehicle recruitment and testing in the confirmatory testing process are much more rigorous than in surveillance testing because vehicles must be shown to fail even when properly maintained and used. Usually, 10 randomly selected vehicles from within the class in question that have been kept in good condition are tested. The EPA reviews the results of the confirmatory testing and makes a determination whether the failure rate gives rise for concern. Generally, if more than two of the vehicles in the sample fail, there is risk of further action. The manufacturer has the opportunity to take voluntary action prior to the agency’s issuing an official finding. [42]
While initially most in-use surveillance testing was conducted by the EPA, it is now generally conducted by manufacturers, as discussed below. This allows EPA to save time and resources.
5.2.5 In-Use Verification Program (IUVP) and In-Use Confirmatory Program (IUCP)
The IUVP is manufacturer-conducted testing of both low-mileage (10,000 miles, or 16,000km) and high-mileage (50,000 miles, or 80,000km) in-use vehicles. Manufactur-ers are responsible for testing one to five vehicles per test group. About 2,000 industry-wide tests were performed in 2007. If 50 percent of vehicles in a test group fail and the average emission levels are greater than 1.3 times the standard limits, the manufacturer must automatically conduct an IUCP test. [39] In the IUCP, test vehicles are selected and tested in a more rigorous manner (in the same manner as confirmatory testing described above). Failure of IUCP tests can lead to recall.
Manufacturers are required to report all IUVP data to the EPA. This large database allows the EPA to concentrate on future vehicle design issues, particularly on the deterioration of emissions control devices under real-life driving conditions. IUVP data is also used to assess and update the deterioration factors and the procedures used to determine them.
In addition to manufacturer-conducted IUVP and IUCP tests, the EPA itself conducts in-use surveillance tests either at its Ann Arbor facility or at authorized testing centers. Vehicles can be selected at random, or they can be targeted based on data suggesting that particular vehicles require additional EPA testing.
5.2.6 RecallsThe Clean Air Act authorizes the EPA to require a manufacturer to recall vehicles or engines, at its own expense, if it is determined that a substantial number of vehicles or engines from that group do not meet the standards. Some recall campaigns involve de-fects that occur in a small number of vehicles within a class, wherein the malfunction is so evident to vehicle owners that they seek repair. These are termed “self-campaigning.”

24
INTERNATIONAL COUNCIL ON CLEAN TRANSPORTATION
If these defects result in emissions failures and occur outside of the warranty period for the emission-related component, manufacturers can conduct a warranty extension campaign, whereby owners are notified of the potential failure and told that the repair will be covered for a certain time and mileage span. The EPA deems these recalls to be voluntary service campaigns and encourages manufacturers to conduct them when a full-fledged recall is not appropriate.
5.2.7 Warranty and defect reportingThe CAA requires manufacturers to warranty certain emission control components on their vehicles. Such warranties protect vehicle owners from the cost of repairs for emission-related failures that cause the vehicle or engine to exceed emission standards.
There are two types of warranties: the Performance Warranty and the Design and Defect Warranty. The Performance Warranty covers any repair or adjustment that is necessary to make a vehicle pass an approved, locally required emissions test (like an inspection and maintenance test) during the first two years or 24,000 miles of vehicle use. However, some specific emission control components, like catalytic converters, electronic control units, and onboard diagnostic devices, are covered for the first eight years or 80,000 miles. The vehicle must have been properly maintained according to the manufacturer’s specifications and must not have been misused.
The Design and Defect Warranty covers repair of emissions-related parts that become defective because of a defect in materials or workmanship during the warranty period. The warranty period for all emission control and emissions related parts is two years or 24,000 miles of vehicle use. For some specific emission control components it is eight years or 80,000 miles of vehicle use. [43]
The EPA requires manufacturers to monitor known defects in emission control systems of properly maintained engines. They must submit defect reports to the EPA whenever 25 or more vehicles within the same model year are found to have particular emission-related defects. The defect reports must estimate the proportion of vehicles that contain a defective part and must assess the impact of the defect on emissions. A recall can be initiated if as little as 1 percent of an engine family has the same defective part, assuming that defect has a significant impact on emissions.
5.3 EPA HEAVY-DUTY AND NONROAD ENGINE COMPLIANCE PROGRAM
The primary components of the heavy-duty and nonroad engine enforcement and compliance program are 1) Preproduction certification, 2) Confirmatory testing, 3) Selective Enforcement Audit, 4) Manufacturer production line testing, 5) In-use testing performed by the EPA and manufacturers, 6) Warranties and defect reporting, and 7) Recall if necessary. Figure 5.3.1 illustrates how these procedures may be implemented during a vehicle’s useful life.
5.3.1 Preproduction certification testingSimilar to the LDV program, all heavy-duty vehicle (HDV) manufacturers are required to test new or modified engines to demonstrate compliance. They must submit test results as part of their certification application to the EPA prior to production.
HDV certification is based primarily on engine testing as opposed to chassis dynamometer testing of the entire vehicle. Using rationale similar to that applied to LDVs, certification tests are performed on an engine that represents the highest emissions level of an engine family (comparable to a vehicle test group). Deterioration factors are applied to the testing results before comparing test data with applicable standards and determining compliance.

25
OVERVIEW OF INDIA’S VEHICLE EMISSIONS CONTROL PROGRAM
5.3.2 Confirmatory testingThe EPA performs both targeted and random confirmatory tests at its Ann Arbor lab or at a contractor’s or manufacturer’s labs. Engines are selected for targeted confirmatory tests based on various criteria: 1) a manufacturer’s compliance history; 2) compliance margin of the engine in performance; 3) use of new technologies; 4) other information the agency might have regarding an engine family. The EPA does not issue a certificate of confirmation for any heavy-duty or nonroad engine that fails confirmatory tests.
The EPA started performing conformity testing for nonroad engines in 2006 and has expanded the test to categories such as lawn and garden equipment. [40] Among the 676 heavy-duty, land-based nonroad engine families (typically called agricultural and construc-tion engines) certified in model-year 2007, the EPA tested 11. In fact, its primary focus in 2007 was on nonroad engines. It did not test any on-road heavy-duty engines that year.
In 2008, the EPA issued seven confirmatory test orders for agricultural and construction engine families and 10 test orders for lawn and garden engine families. All agricultural and construction engine families passed the confirmatory tests. For the lawn and garden engine families, fewer than half passed, and many withdrew their applications for certifi-cation. In the cases where engines failed tests or had their applications withdrawn, they were not issued a certificate of conformity and were not allowed to be sold in the United States or imported. The EPA did not conduct conformity tests for on-road heavy-duty engines in 2008, either.
The EPA allows manufacturers to participate in an Averaging, Banking, and Trading (ABT) program. Under this program, manufacturers with vehicles well below set limits accrue positive emission credits and use those for other models that are having difficulty meeting limits. Manufacturers are also permitted to sell or swap credits among them-selves. [44] The ABT program allows for flexibility in compliance while still ensuring that fleetwide emission standards are met.
5.3.3 Manufacturer production line testingTo make certain that engine emissions are in line with prototypes, manufacturers are required to test engines as a matter of routine as they leave the assembly line. Produc-tion line testing is now used primarily done for nonroad engines because once an engine is installed into nonroad equipment, it is difficult and costly to remove it for testing. Another challenge is that in-use testing for nonroad equipment using portable emission measurement systems (PEMS) is not as well developed as for on-road HDVs.

26
INTERNATIONAL COUNCIL ON CLEAN TRANSPORTATION
ENGINE DESIGN AND BUILD
EPA ReviewsFinal Manufacturer
Application
Selective Enforcement
AuditEPA In-Use
Testing
EPA Issues Certificate of Conformity
EPA Action Manufacturer Action
Source: EPA. 2007 Progress Report-Vehicle and Engine Compliance Activities. Oct., 2008.
USEPA vehicle compliance program for heavy-duty vehicles (HD) highway and non-road engines
0 Miles / 0 hours 700,000km
EPA Confirmatory Testing
EPA Reviews Initial
ManufacturerApplication
Manufacturer Testingof Prototype Engine
Representativeof Production
ManufacturerProduction Line
Testing
Manufacturer In-Use Testing
End of Useful Life(per CAA)
Emission LevelsPredicted via Certification
Durability Testing
End of Useful Life435,000 Miles or 50 to 10,000 Hours Depending on the Engine/Application
Begin useful life
Tested against engine standards**Except HDVs certified using chassis dynamometer
Tested against in-use standards(NTE limits for HDVs)
Figure 5.3.1: EPA compliance program for heavy-duty highway and nonroad engines
5.3.4 Selective Enforcement Audit (SEA)EPA is planning to expand the use of SEA for nonroad engine testing. The SEA is a more useful tool for nonroad engines than for LDVs because compliance with nonroad new engine standards is verified by engine testing, and it is much easier to assess compliance of an engine before it is installed into equipment.
If a nonroad engine in a test group fails an SEA, the manufacturer needs to identify and correct the problems until the engine can pass. If the entire engine family fails, the EPA can pursue follow-up actions, such as forcing a manufacturer to stop production.
5.3.5 In-use testing by the EPA and manufacturersTraditional laboratory testing for HDV and nonroad engines over a specific test cycle requires the engine to be removed from the vehicle or equipment. That makes it prohibitively expensive and cumbersome to conduct in-use testing for engines of this type. In addition, HDV and nonroad engines operate over a wide range of conditions (load, speed) that cannot be fully represented in limited test cycles. Laboratory testing following a specific test cycle will not ensure that emissions from these vehicles and pieces of equipment are within the range of the applicable standards during normal operation. There has been a long-standing need for more accurate measurement of HDV and nonroad engine emissions under real-life operation (in-use emissions). The develop-ment of portable emissions measurement systems (PEMS) and the incorporation of such systems make it possible for the EPA to monitor and verify compliance of these engines during normal operation.

27
OVERVIEW OF INDIA’S VEHICLE EMISSIONS CONTROL PROGRAM
Collaborating with the Air Resources Board of California (ARB) and diesel engine manufacturers, the EPA launched an in-use testing program for heavy-duty trucks and buses in 2005. Under this program, the EPA, the ARB, and manufacturers measure in-use emissions of HDV engines using PEMS, and compliance is determined against not-to-exceed (NTE) standards.11
EPA in-use testing is conducted at the Ann Arbor lab and at the Department of De-fense testing lab at Aberdeen, Maryland. In 2007, the EPA tested 54 truck models and 72 types of nonroad equipment using PEMS. For HDVs, the majority of such tests are conducted by manufacturers as part of the requirements of the in-use testing rule. [45] Manufacturers are required to demonstrate compliance with the NTE limits, which are generally 1.25 or 1.5 times the applicable federal test procedure (FTP) standards. The EPA will designate no more than 25 percent of a given manufacturer’s engine families (with production volume greater than 1,500 engines) for in-use testing every year. Because of the wider variations of in-use testing measurements, the agency initiated a comprehensive research, development, and demonstration program designed to identify new accuracy measurement margins for PEMS.
The EPA established a pilot in-use testing program for gaseous pollutants in 2005 and 2006 and for particulate matter (PM) pollutants in 2007 and 2008. The program became fully enforceable for gaseous pollutants starting in 2007 and for PM in 2009.
Instances of exceeding the NTE limits during in-use testing do not necessarily repre-sent noncompliance or a violation because of the flexibility granted to manufacturers to comply with the standards. The EPA makes decisions on a case-by-case basis, and no action has been taken to date.
5.4 INSPECTION AND MAINTENANCE (I/M) PROGRAMSThe main goal of an I/M program is to identify gross polluters—vehicles that emit well beyond norms—and to get those vehicles repaired. In the United States, the Clean Air Act requires that any state with National Ambient Air Quality Standard (NAAQS) nonattainment areas implement a mandatory I/M program. Areas designated as serious or given an even worse rating for ozone pollution have to implement a more stringent inspection program called enhanced I/M.
Even so, the stringency of I/M programs varies from state to state. Most states do not have I/M programs for diesel vehicles; allowable emissions for vehicles without on-board diagnostic systems are usually much higher than for vehicles with OBD systems; and vehicles older than 25 years are often exempted from I/M testing.
11 The NTE requirements establish an area or zone under the torque curve of an engine in which emissions must not exceed a specified value for any of the regulated pollutants.

28
INTERNATIONAL COUNCIL ON CLEAN TRANSPORTATION
For the purposes of this study, a summary of the essential elements of a good I/M program is presented in Table 5.4.1. [46]
Table 5.4.1: Features of a good I/M program
ELEMENTS BEST PRACTICE ADVANTAGES
I/M design
Centralized I/M system where inspection is separated from maintenance function
Easier facility oversight by the government
Potentially lower cost per test if large number of vehicles are tested in each facility
Government should regulate, but actual enforcement could be contracted out to private companies
Private companies might have better expertise than the government
Institutional/ administrative set up
Solicit support from senior decision makers with the institutional capacity to manage and regulate the system
Adequate funding and resources would be allocated to ensure the program is not plagued by corruption and poor quality control
Develop an adequate fee structure in which affected vehicle owners pay the full costs of the I/M programs (including costs for auditing and overseeing the program, road-side testing, etc.)
Ensure sufficient funding
Initiate full dialogue with all appropriate ministries or departments (national and local) at the early stage of design
Assure all key stakeholders agree on their respective role and have ownership of the program
Link I/M with registration data so that failure to present proof of inspection leads to denial of registration
Strong inducement to encourage vehicle owners to send vehicles in for inspections
Include a detailed data management system to enable transmittal of all test data
Allows oversight agencies to collect data for enhancing the enforcement program, and minimizes the chances of falsified data if testing devices automatically input data into the database
Technical issues
Tighten in-use emission standards for new vehicles in tandem with adoption of more stringent new vehicle standards
Continuous improvement of I/M program effectiveness
Assure frequency of inspections varies for vehicles with differing mileage accumulation rates and with more or less durable emission control systems
Ensure that high mileage/usage commercial vehicles, like taxi cabs, are adequately inspected and properly maintained
Public participation in I/M
Raise public awareness on health benefits that can result from a successful I/M program
Ensure public acceptance and encourage participation in I/M inspection
Develop performance standards for I/M and penalize poorly performing stations
Guarantee quality of the I/M program is key to assure public support
Quality assurance – Audit
Ensure audits are fully built into the overall program design and accounted for in the fee structure
Establish credibility and effectiveness of the I/M systems.
Set test fees at a reasonable level that will allow private operators to make a sufficient profit to maintain, replace and upgrade equipment as required
Assure good quality testing is performed
Roadside Testing program
Complement I/M with roadside testing or remote sensing
Catch gross emitters that use temporary fixes to pass I/M requirements
Pay attention to maintenance
Ensure service industry have sufficient equipment and knowhow to properly repair vehicles
Realize the emission reductions promise of the I/M program
Give sufficient lead-time to allow the service industry equip itself to repair failing vehicle when tightening I/M requirements
Ensures that failed vehicles are properly repaired and emissions are reduced
Establish communications between the repair industry and the I/M managers
Resolve disputes over the appropriate repairs needed.
The EPA now allows states to use OBD systems in I/M testing. OBD data are useful for identifying problematic models. In fact, for newer (1996 or later) vehicles, they have been shown to be as reliable, if not more so, as I/M tests in detecting gross emitters. States with I/M programs that incorporate OBD technology provide the data to the EPA. The EPA holds bimonthly stakeholder calls with states for an opportunity to share information on problematic vehicles. The agency researches issues, works with manufacturers to resolve problems, and uses the stakeholder call system to give guidance on how states can resolve issues with problematic vehicle models.

29
OVERVIEW OF INDIA’S VEHICLE EMISSIONS CONTROL PROGRAM
After more than a decade of experience with them, the vast majority of vehicles in the United States are equipped with OBD systems. The EPA is now allowing states to reduce or even eliminate tailpipe testing and to shift I/M emphasis to data recovery of OBD systems alone. OBD data can also help mechanics quickly identify problems and fix them, reducing repair costs.
For example, the state of California does not require smog checks (the equivalent of the Pollution Under Control check in India) for up to five years after a vehicle is purchased. [47] This is because emission controls on new vehicles have become very reliable, largely thanks to national in-use testing programs.
5.5 RESULTS AND COSTS OF THE U.S. ENFORCEMENT PROGRAM
In the early years of the EPA’s compliance program, the conformity tests and SEA procedures were successful in establishing a strong enforcement presence. The consequences for failing confirmatory tests or an SEA effectively deterred fraudulent reporting of certification results and forced manufacturers to conduct a large number of tests at their own expense for the sake of production conformity. As new vehicle noncompliance became less of a concern, the EPA was able to shift resources to in-use testing programs that seek to ensure that vehicles (and emission control devices) are designed to be durable enough to function well throughout their entire useful life.
Although the vehicle compliance program is well developed and mature, preproduc-tion problems still occur. EPA reports for model years 2007 and 2008 indicated there were six failures in 2007 and three in 2008. These low numbers reflect manufacturers’ typical preference for having a significant margin of compliance since they cannot afford the risk of confirmation failure late in the process, thereby jeopardizing produc-tion schedules. [40, 41]
The high cost of recalls serves as a significant deterrent, encouraging manufactur-ers to improve the durability of vehicles and emission control devices to guarantee compliance in actual use. In the late 1970s and early 1980s, when the recall program began, the EPA recalled 30–40 percent of cars and light trucks produced each year. By the mid-2000s, the EPA was recalling just 5 to 10 percent of vehicles produced annually. [48]
In 2008, more than 1 million new and in-use LDVs were recalled for immediate correc-tion (about 7.5 percent of the 13.2 million new vehicles sold that year), and 2.1 million were recalled for voluntary service campaigns (owners bringing in vehicles when a problem is evident).12
In-use testing requirements for HDVs started in 2007 for gaseous pollutants, while PM testing is still in the pilot stage. Analysis of gaseous data from the first year of manu-facturer testing with enforceable consequences has not revealed any noncompliance issues. [38]
5.5.1 Costs and resources for the vehicle enforcement programThere are seven full-time-equivalent staff and an additional four grantees on the light-duty vehicle compliance team. The four grantees are part of the Senior Environmental Employment program and are typically retired engineers. The overall costs of the
12 Problems leading to the recalls in 2008 included: engine control module, OBD, positive crankcase ventilation oil trap and ventilation hose, fuel line tubes, underbody heat shield, catalytic converter, powertrain control module, etc. For more details, see EPA (2009). “2008 Annual Summary of Emission-Related Recall and Voluntary Service Campaigns Performed on Light-Duty Vehicles and Light-Duty Trucks.” EPA420-B-09-016. April.

30
INTERNATIONAL COUNCIL ON CLEAN TRANSPORTATION
EPA’s compliance program, including both fixed and labor costs, have been estimated to be on the order of $16 million, which is equivalent to Rs. 80 crore13, for all source sectors (LDV, HDV, nonroad, etc.), with the largest part being for the LDV sector, at about $10.8 million (Rs. 54 crore).14
5.6 OVERVIEW OF CHINA’S VEHICLE COMPLIANCE PROGRAM China’s vehicle emission standard enforcement and compliance program currently consists of three main elements: 1) new vehicle type approvals (similar to U.S. prepro-duction testing by manufacturers and confirmatory testing performed by the EPA), 2) conformity of production (COP) testing (similar to U.S. Selective Enforcement Audits), and 3) inspection and maintenance programs.15 The national environmental authority, the Ministry of Environmental Protection (MEP), focuses its compliance efforts on new vehicle type approval and COP testing, while I/M programs are implemented by provin-cial and municipal environmental protection bureaus (EPBs).
The legal foundations for China’s vehicle emission control regulations and programs, including compliance programs, rest in its Air Pollution Prevention and Control Law. The law requires that emissions from all motor vehicles and vessels must not exceed the regulated limits and prohibits vehicles that fail to meet in-use emission standards from operating on the road. The law also includes provisions for regulatory agencies to stop entities from producing, selling, or importing vehicles that do not conform to emission standards. If nonconforming vehicles are discovered, those vehicles can be confiscated, and fines may be levied up to the value of the confiscated products. All confiscated, nonconforming vehicles and vessels can be destroyed. It is important to note, however, that the law does not clearly specify which government agencies are responsible for enforcing these provisions. In practice, to date no vehicles in China have been confis-cated because of noncompliance, nor have any fines been issued. [49]
Strengthening vehicle emission standards enforcement and compliance programs is a priority for China’s environmental protection authorities at both the national and subna-tional levels in the coming years. China is currently engaged in revising its compliance strategies, with officials expressing particular interest in emulating the federal and state compliance experience in the United States. Vehicle compliance training and education for regulators has been an area of cooperation between Chinese environmental protec-tion agencies and the U.S. EPA over the past few years. This will continue.
What follows is a brief guide to the status of China’s vehicle emission standards enforce-ment and compliance programs as of early 2012.
5.7 CHINA’S ENFORCEMENT APPROACH
5.7.1 New vehicle type approvalAccording to China’s emissions rules for highway vehicles, motorcycles, and nonroad and agricultural vehicles, engine and vehicle manufacturers must submit prototypes to accredited laboratories for type-approval testing prior to production (comparable to certification testing in the United States). The Ministry of Environmental Protection has
13 1 crore = 10 million14 For more details on the costs of EPA’s enforcement program, see http://edocket.access.gpo.gov/2004/
pdf/04-10338.pdf or http://www.epa.gov/otaq/fees.htm15 Under the Chinese program, type approval is conducted by independent labs and is thus comparable to the
combined U.S. programs of preproduction certification by manufacturers and confirmatory testing by the EPA. Conformity of production (COP) testing is nearly identical to U.S. selective enforcement audits. Several elements, though, are missing or are underutilized: (1) In-use surveillance by the EPA and the manufacturer (testing of in-use vehicles to ensure compliance); (2) Recall authority (to address noncompliance in the marketplace); and (3) warranty and defect reporting (which can trigger manufacturer recalls for emission-related defects).

31
OVERVIEW OF INDIA’S VEHICLE EMISSIONS CONTROL PROGRAM
entrusted emissions testing to 24 laboratories nationwide, 19 of which conduct tests on light-duty vehicles, heavy-duty vehicles and engines, agricultural vehicles, and nonroad engines and five of which conduct motorcycle emissions testing. These labs are mainly used for type-approval testing, but some also carry out conformity of production testing. The most recently opened and certified lab, the Vehicle Emission Control Technology Center located in the southeastern coastal city of Xiamen, is China’s most advanced emissions testing lab, and in the coming years it will undertake responsibility for an increasingly large share of compliance-related testing.
Labs are certified by the MEP’s Department of Science, Technology and Standards, which inspects them once a year to assess testing capabilities and to decide if certifica-tion should be renewed. The labs are given one to two days’ advance notice before each inspection, which is conducted by the MEP’s Vehicle Emission Control Center (VECC-MEP) and a team of experts recruited from other accredited labs.
Vehicle type-approval reports are submitted to the VECC-MEP for review. In general, for conventional engine and emission control technologies, only passing reports are submit-ted, and labs are not required to provide any data on vehicles or engines that do not pass. However, for nontraditional or new emission control technologies, the VECC-MEP may require additional, more comprehensive application materials and may also require repeat testing under the supervision of VECC-MEP staff. In several instances over the past few years, engines that received passing type-approval applications did not pass subsequent type-approval testing when the testing was witnessed by VECC-MEP staff.
Type-approval reports that pass the VECC-MEP’s technical review are subsequently for-mally approved by the MEP. According to the MEP’s 2011 China Vehicle Emission Control Annual Report, a total of 20,920 vehicle and engine models that were tested passed type-approval testing in 2010. More than half (12,228 models) were heavy-duty vehicle and engine models, and slightly less than one-fourth (4,709 models) were light-duty vehicle models, while the remainder were motorcycle, moped, or off-road engines. [50]
5.7.2 Conformity of productionEach year, the MEP commissions the VECC-MEP to conduct a number of random conformity of production (COP) tests. For some COP tests, vehicles are selected directly off the assembly line, while for others, vehicles are purchased. COP tests results are summarized in a report submitted to the MEP.
The MEP reviews the COP reports, and if a vehicle is found to be noncompliant, the ministry issues a deadline to the manufacturer to bring the production line into compli-ance. It also suspends any type-approval applications from that manufacturer. If an engine class/test group still cannot meet the standards after remedial actions are taken, the MEP may revoke the type-approval certificate. Fines are not usually issued because it is unclear from the Air Pollution Prevention and Control Law which ministry has the authority to impose them.
In 2008, the VECC-MEP conducted random COP testing for 11 manufacturers, inspecting 13 vehicle models (including LDVs and HDVs). Of the 13 models, two were identified as out of compliance because essential parts/accessories used in mass production were inconsistent with those reported in the certification application. In the 11 manufacturing facilities inspected, the quality of monitoring equipment used in three of the production lines did not meet requirements. In those cases, the manufacturers were informed of their noncompliance, but no punishment was imposed. In 2010, the number of manufac-turers inspected increased to 50. COP testing was performed for 25 light-duty vehicle and motorcycle manufacturers, while special environmental inspections were performed for an additional 25 heavy-duty engine manufacturers whose production processes were
32
INTERNATIONAL COUNCIL ON CLEAN TRANSPORTATION
using a nonconventional technology pathway. Results of the 2010 testing were not made public. Increasing the capacity and improving the management of COP programs is a priority in the MEP’s overall vehicle compliance program.
In addition to COP tests conducted by the MEP, vehicle and engine manufacturers are required to submit COP assurance reports to the VECC-MEP on a quarterly basis. These manufacturer-run COP requirements are specified in the emission standard regula-tions. To demonstrate COP compliance, LDV and HDV manufacturers are required to select randomly and test at least three vehicles from each engine family or test group. Manufacturers of nonroad engines and agricultural vehicles must randomly select and test at least one engine or vehicle. For LDVs and HDVs, an engine family or test group is deemed COP-compliant if emissions of all regulated pollutants are lower than the standard limit values or if the average emissions of all tests for each pollutant are lower than standard limit values. For nonroad and rural vehicles, if emissions of the first sample tested are lower than the limit values for all pollutants, the engine model or test group is deemed COP-compliant. Otherwise, the manufacturer can choose to test more samples, allowing for the engine model or test group to pass the COP test if the average emission levels are lower than the limit values for all the pollutants. In 2010, nearly 500 vehicle and engine manufacturers submitted COP plans and reports to the MEP. [50]
5.7.3 In-use compliance testing and recallSince the partial introduction of the China IV LDV emission standards (equivalent to Euro 4), the MEP has required vehicle manufacturers to submit in-use compliance testing plans and annual reports. However, owing to a lack of resources, the MEP has not yet conducted its own national-level testing program to verify these reports.
However, at the local level, the city of Beijing conducts its own in-use testing program for LDVs. In March 2009, the Beijing Environmental Protection Bureau launched a random-ized in-use testing program for all China III and IV (Euro 3 and 4) LDVs with less than 100,000 km of use. The following year, 60 vehicles were tested. The program identified various problems with many in-use vehicles. For example, some vehicles had only one catalyst instead of the two catalysts specified in their type approval. Detailed results were not made public, and it is unclear what follow-up actions Beijing EPB took against manufacturers making noncompliant vehicles. Beijing has also issued local-level regula-tions requiring manufacturers to conduct in-use testing of any engine or vehicle model that sells more than 500 units per year in the city.
Beyond government- and manufacturer-run test programs, a number of academic and research institutions have conducted remote sensing and portable emissions measure-ment system studies to evaluate emissions from in-use vehicles. Select PEMS results are summarized in Table 5.7.1 below. Of particular concern are the high NOX emissions from trucks and buses—even those certified to more advanced emission standards—as well as the poor performance in terms of durability of high-mileage vehicles such as taxis.

33
OVERVIEW OF INDIA’S VEHICLE EMISSIONS CONTROL PROGRAM
Table 5.7.1: Summary of in-use testing results in China
RESEARCH INSTITUTE
VEHICLES TESTED SUMMARY OF FINDINGS
CRAES1 44 China I – IV taxis in Beijing
• Large variations in emissions performance among vehicles, even among low-mileage vehicles
• NOX emissions more readily exceeded standards than CO or HC
Tsinghua University2
175 HD, MD, and LD trucks, Euro 0 – Euro IV
• NOX emissions from Euro II trucks 3-6% higher than Euro I
• Euro III trucks do not show significant reduction from Euro II as intended by the standards
Tsinghua University, CATARC, BIT, CRAES3
135 HD trucks and buses, Euro I – Euro IV
• No clear decrease in average in-use NOX emission factors from Euro II to Euro IV buses
• No clear decrease in average in-use NOX emission factors from Euro II to Euro III trucks
• Average NOX emission factors significantly higher than standard limit values for Euro II to Euro IV trucks and buses
Tsinghua University4
57 light-duty gasoline vehicles, Euro 0 – Euro 4
• Average CO emission factors exceed limit values by 4.6 and 1.9 times for Euro 1 and Euro 2 vehicles, respectively; average NOX emission factors exceed limit values by 2.6, 2.2, and 1.7 times for Euro 1, 2, and 3 vehicles, respectively
• 23% of investigated vehicles were “superemitters” (including Euro 0, high mileage taxis, and malfunctioning vehicles), emitting 50-70% of total emissions
Sources: 1. Chinese Research Academy of Environmental Sciences (CRAES) and China Automotive Technology
and Research Center (CATARC) (2010). Status Quo of the City Taxi Emissions in China and Its Control Approaches (in Chinese). China Sustainable Energy Foundation Project Report. April.
2. Huo, H., et al. (2012). “On-Board Measurements of Emissions from Diesel Trucks in Five Cities of China.” Atmospheric Environment 54 (July): 159–67.
3. Communication with Ye Wu, Tsinghua University, 2012.4. Huo, H., et al. (2012). “On-Board Measurements of Emissions from Light-Duty Gasoline Vehicles in
Three Mega-Cities of China.” 49 (March): 371–77.
5.7.4 Inspection and maintenance programAccording to the Air Pollution Prevention and Control Law, inspection and maintenance (I/M) programs are to be managed by provincial- and municipality-level environmental protection bureaus. The EPBs entrust vehicle test centers that have been accredited by the Public Security Bureau to conduct I/M testing. Maintenance and repair centers are man-aged by the provincial transportation management authorities. If I/M tests are found to be conducted at unauthorized facilities, or if I/M facilities are found to be practicing fraudulent testing, the regulatory agency can stop those illegal activities, demand remediation, and levy a fine no more than 50,000 renminbi, equivalent to Rs. 350,000, or $7,000. In the case of a serious violation, a manufacturer’s certificate for conducting I/M tests can be revoked.
The MEP sets overall I/M guidance, including the determination of emission limits and procedures for loaded and unloaded I/M tests. Local governments must adopt the MEP I/M test procedures, although local EPBs may set stricter emissions limits according to local needs. An MEP notice released in December 2010 mandates that each I/M testing facility submit an annual work report with a description of the facility and any emission problems identified to the municipal EPB. Municipal EPBs will then prepare and submit an I/M inspection and management report to provincial EPBs for transmission to the MEP. [51]
The Air Pollution Prevention and Control Law bans the operation of vehicles whose emissions exceed the standards. For regulatory simplicity, many local governments

34
INTERNATIONAL COUNCIL ON CLEAN TRANSPORTATION
combine their I/M program with a yellow/green sticker identification. Vehicles can only be registered if they have a yellow/green emission sticker. The MEP announced a na-tionwide labeling program in July 2009, requiring all provincial and municipal EPBs with established emission sticker programs to verify and issue the stickers (including for rural vehicles and motorcycles) according to a unified format and categorization specified by the MEP starting from October 2009. [52]
Currently, 349 local EPBs have established I/M programs, about 50 of which conduct loaded tests (Acceleration Simulation Mode or Inspection/Maintenance Driving Cycle IM240). In total there are more than 1,200 I/M stations throughout the country. The VECC-MEP estimates that, nationwide, about 10–20 percent of vehicles do not pass their first I/M inspection, but there are no data on how many vehicles are being tested every year.
Currently, I/M test centers submit summaries of their I/M test data to their local EPBs, which summarize them into a report for the MEP. The VECC-MEP is currently engaged in a major program to construct a centralized I/M database, to which all 1,200+ I/M facilities will eventually be networked, allowing for much more comprehensive management and quality assurance.
5.8 RESULTS OF CHINA’S ENFORCEMENT PROGRAMResults from the small number of in-use vehicle tests conducted to date in China suggest that there are vehicles on the road whose emissions exceed certified emission standards or in-use limits. There are a number of possible causes of these problems: poor vehicle, engine, or emission control system design (problems that were not identified during type approval), conformity of production noncompliance (e.g., a vehicle produced with missing or low-quality catalysts or fewer sensors than required), off-cycle emissions that were not identified and corrected through the existing enforcement and compliance program, issues with the durability of emission control devices, and more. Identifying the scope and sources of these problems and developing a legal basis and strong regulatory regime to overcome them or prevent them in the first place are important tasks for the MEP moving forward. All of these are critical to consider in building a comprehensive program to guarantee that vehicles produced actually meet the emissions requirement they are supposed to.
5.9 OVERVIEW OF INDIA’S VEHICLE COMPLIANCE PROGRAM Government authority to regulate motor vehicle emissions in India was first established by the Air (Prevention and Control of Pollution) Act, 1981, and the Environment (Protec-tion) Act, 1986. [14, 15] The former vested powers in the individual states to regulate and enforce broad environmental standards, while the latter gave most of the same powers to the central government. The Motor Vehicles Act, 1989, then fixed vehicular emission standards and authorized the central government and state governments to regulate and enforce them. [53]
While the Air Act, 1981, and the Environment Act, 1986, specifically mention the Central Pollution Control Board’s and state pollution control boards’ role in setting environmen-tal standards, it is ultimately the Ministry of Road Transport and Highways (MoRTH) that is responsible for enforcing compliance with India’s vehicular emission standards. This is because the MoRTH is responsible for enforcing the Motor Vehicles Act, 1989, which specifically assigns the central government the responsibility of regulating vehicle emission standards.
Nevertheless, there is still confusion regarding the organizational structure of vehicular emissions compliance. For example, while the MoRTH sets norms for in-use emission

35
OVERVIEW OF INDIA’S VEHICLE EMISSIONS CONTROL PROGRAM
standards, individual states and municipalities are responsible for enforcing them. Another division of responsibility is among the national agencies that conduct type-approval and COP testing. These agencies are under the management of other ministries rather than the MoRTH. For example, two of the primary vehicle testing agencies, the Automotive Research Association of India (ARAI) and the International Centre for Automotive Technology (ICAT), are managed by the Ministry of Heavy Industries and Public Enterprises (MoHIPE).
To do away with this complexity, the 2003 Auto Fuel Policy Committee had recom-mended the creation of a single agency responsible for all vehicle emissions and related fuel quality issues. Being a permanent agency (unlike the Standing Committee on Implementation of Emission Legislation—discussed below in section 5.10.1), it would also likely be proactive in establishing standards and regulations that India may need in due course. But this committee recommendation has yet to be adopted.
Aside from the numerous agencies responsible for compliance and enforcement, puni-tive measures for violations of standards are not well established by law, either. The Air Act, 1981, and Environment Act, 1986, set much stricter penalties for violations of environmental regulations than the Motor Vehicles Act, 1989. In any case, it is difficult to find instances in which these penalties were levied on any entity for vehicle emissions.
5.10 INDIA’S ENFORCEMENT APPROACHIndia’s vehicle enforcement and compliance program consists of three main elements: 1) new vehicle type approval; 2) conformity of production (COP); and 3) inspection and maintenance programs. New vehicle type approval and COP are responsibilities of the MoRTH, in conjunction with some other ministries and government institutions, whereas I/M programs fall under the direction of state and local governments’ road transport offices, although standards are set nationally.
5.10.1 New vehicle type approval Limit values for new vehicle emission standards are first proposed by the Standing Com-mittee on Implementation of Emission Legislation (SCOE), which is constituted by repre-sentatives from the Ministry of Environment and Forests (MoEF), Ministry of Petroleum and Natural Gas (MoPNG), Ministry of Heavy Industries and Public Enterprises (MoHIPE), the Society of Indian Automobile Manufacturers (SIAM), and various emissions testing agencies (such as the ARAI and ICAT). The joint secretary of the MoRTH is the chairman of the SCOE. Proposals are then sent to the Central Motor Vehicle Rule–Technical Stand-ing Committee (CMVR-TSC) for finalization. Rules come into effect with the approval of the proposal by the joint secretary and the minister of the MoRTH. The CMVR-TSC is composed of representatives from the MoHIPE, the Bureau of Indian Standards (BIS), the Automotive Component Manufacturers Association of India (ACMA), SIAM, and various state governments and testing agencies. [54] The complexity of this system is shown in figure 5.10.1. [54]

36
INTERNATIONAL COUNCIL ON CLEAN TRANSPORTATION
Bureaur of Indian Standards(Transport Divisional Council)
Ministry of Road Transport &Highways (Motor Vehicles Act &
Central Motor Vehicles Rules)
Ministry of Environment& Forests
Ministry of Petroleum &Natural Gas
Standing Committee on Implementation of Emission Legislation
Chairman – Joint Secretary, MoRTHMembers – Test agencies, SIAM, TMA,
MoPING, MoHI, MoEF, others
CMVR – Technical Standing CommitteeChairman – Joint Secretary, MoRTH
Members – Test agencies, SIAM, ACMA,TMA, MoHI, BIS, others
Figure 5.10.1: A diagram of the vehicle rulemaking process and stakeholders in India
There are currently six government-owned autonomous testing agencies nationwide charged with type approval and COP testing for emissions from new vehicles. The testing agencies are listed below:
1. Automotive Research Association of India, Pune (ARAI)
2. Vehicle Research and Development Establishment, Ahmednagar (VRDE)
3. Central Farm Machinery Testing and Training Institute, Budhni (CFMTTI)
4. Indian Institute of Petroleum, Dehradun (IIP)
5. Central Institute of Road Transport, Pune (CIRT)
6. International Centre for Automotive Technology, Manesar (ICAT)
A manufacturer must send a prototype of every new vehicle model to one of the test agencies for certification of compliance. If a prototype passes the test, it is certified. If a prototype fails the test, it is rejected, and the manufacturer must provide a rectified version of the prototype before it can proceed with production of vehicles based on it. Test results are recorded by computer and can be referenced if needed. [55]
5.10.2 Conformity of production To ensure conformity of production for all vehicles, a testing agency can select vehicles from a manufacturer’s production lot at random but at a specified periodicity. The testing agency intimates to the manufacturer the month in which the vehicles will be selected. [56] The vehicles are serviced as prescribed by the manufacturer before emissions tests are performed. [55]
COP tests are conducted once or twice a year for four-wheeled vehicles, depending on production quantity. For two- and three-wheelers, COP tests are conducted every three months, every six months, or once a year, depending on output. Sample sizes are between 10 and 100 vehicles in most cases. In cases where production volume is less than 250 vehicles every six months, a minimum of five vehicles must be tested. [56]
The statistical mean of the emissions from the vehicles tested must fall below set norms in order for COP certificates to be issued. In the case of a failure, the testing agency sends copies of the test report to the MoRTH and the vehicle manufacturer. Then, over a period not to exceed four weeks, the SCOE advises the MoRTH on the next steps to take. The manufacturer is also given an opportunity to present its case to the MoRTH. The MoRTH then makes a final decision on whether to withdraw the type-approval certificate from the manufacturer. [55]
In the case where the type-approval certificate is withdrawn, the manufacturer is given a chance to correct the problem, at its own expense, and to submit vehicles for retesting. If they pass the second test, the type-approval certificate is restored. If failure occurs again, the process detailed in the previous paragraph is repeated. This can continue until

37
OVERVIEW OF INDIA’S VEHICLE EMISSIONS CONTROL PROGRAM
up to 32 vehicles have failed COP testing. After that, the MoRTH can take further action against the manufacturer, including ordering a recall of all vehicles failing the COP tests. To date, no vehicle model has failed COP testing 32 times, and no recalls due to violation of emission standards have been conducted. [55]
5.10.3 In-use compliance testing and I/M programWith set deterioration factors for the emissions of many pollutants included in the Bharat III and Bharat IV regulations, manufacturers are expected to design passenger cars and commercial vehicles that still comply with standards after 80,000–100,000 km of use—and two- and three-wheelers that do not exceed emission standards after 30,000 km of use.
Nevertheless, in-use compliance testing and I/M programs remain weak in India. Cur-rently, only commercial vehicles are required to undergo annual fitness tests, starting just two years after their original sale. Private vehicles are not required to pass any fitness tests until 15 years after their initial registration.
A separate Pollution Under Control (PUC) program is required for vehicles in many cities. The PUC program in most cities mandates an emissions test twice a year (four times a year in Delhi) for every vehicle and requires that emissions do not exceed set norms. Table 5.10.1 gives the maximum emissions for gasoline-, compressed natural gas (CNG)–, and liquefied petroleum gas (LPG)–operated vehicles, and Table 5.10.2 gives the maximum emissions for diesel-operated vehicles. For gasoline, CNG, and LPG vehicles, emissions are measured at low idling conditions, while for diesel-operated vehicles, a snap acceleration (a protocol that involves repeatedly snapping the throttle fully open to go from an idling engine to full power) or free acceleration test is used. [17]
Table 5.10.1: PUC norms for in-use gasoline, CNG, and LPG vehicles
VEHICLE TYPE CO (%) HC* (ppm)
2- & 3-Wheelers (2/4-stroke) (vehicles manufactured before April 1, 2000) 4.5 9000
2- & 3-Wheelers (2-stroke) (vehicles manufactured on or after April 1, 2000) 3.5 6000
2- & 3-Wheelers (4-stroke) (vehicles manufactured on or after April 1, 2000) 3.5 4500
Lower than Bharat II–compliant 4-Wheeled Vehicles 3 1500
Bharat II and Bharat III 4-Wheeled Vehicles 0.5 750
Bharat IV–compliant 4-Wheeled Vehicles 0.3 200
* For CNG and LPG vehicles, the measured HC value is converted using the following formula: CNG vehicles: Nonmethane Hydrocarbon (NMHC) = 0.3 x HC LPG vehicles: Reactive Hydrocarbon (RHC) = 0.5 x HC
Table 5.10.2: PUC norms for in-use light-duty diesel vehicles
METHOD OF TEST
MAXIMUM SMOKE DENSITY
Light absorption coefficient (1/m)
Hartridge smoke units (HSU)
Free acceleration test for turbocharged and naturally aspirated engines complying with Bharat III and below
2.45 65
Free acceleration test for turbocharged and naturally aspirated engines complying with Bharat IV
1.62 50
Each road transport office has its own PUC mechanisms. Therefore, the enforcement system for PUC standards is not uniform, and effectiveness varies from region to region. In many jurisdictions, any automotive body shop can easily apply to become an autho-

38
INTERNATIONAL COUNCIL ON CLEAN TRANSPORTATION
rized PUC testing center. The problem is exacerbated by the frequent lack of trained personnel, proper guidelines, and functioning equipment at such centers. Further, there is little coordination between government authorities, testing centers, and equipment manufacturers. Ultimately, there is little oversight over PUC testing centers and little assurance that vehicles are actually in compliance with PUC norms.
The National Capital Region (NCR) has been at the forefront of PUC enforcement reform over the past decade. Vehicles there are required to undergo a PUC check once every three months. The NCR has implemented a computerized PUC testing procedure, which reduces the risk of human error. A standardized certificate is issued for passing the test, and the police have the right to stop any driver and ask for a valid PUC certificate. [57] If any vehicle is found to be operating without a valid PUC certificate, a fine of Rs. 1000 ($20) is applied for the first violation and a fine of Rs. 2000 for subsequent violations. [58]
PUC tests are paid for by vehicle owners. Costs for PUC tests vary by region and city. In Delhi, PUC testing centers charge owners about Rs. 25 for gasoline-powered cars and Rs. 50 for diesel cars. [58]
5.11 RESULTS OF INDIA’S ENFORCEMENT PROGRAMIn India, in-use and PUC programs remain less effective compared with type approval and COP. Unlike in the United States, there is no national-level in-use surveillance program in India ensuring that in-use vehicles are meeting set standards throughout their useful life. As the U.S. experience shows, focusing only on type approval and preproduction COP is often not sufficient to ensure that vehicles on the road are conforming to standards.
India’s PUC program has other problems as well. While much of the difficulty remains with the decentralized infrastructure and lack of well-defined guidelines, the greatest problem may be lax standards. Even in the National Capital Region, where PUC compli-ance is relatively good compared with the rest of the country, there are hardly any cases of vehicles violating PUC norms. This is because PUC norms are extremely easy to meet.
Another problem with the PUC program is the low visibility of proof of compliance. For example, while the police in the NCR can ask any motorist to present a PUC certificate at any time, they have no way to predict which vehicles may be out of compliance since there are no stickers on vehicles to display certification.
In contrast with in-use vehicle emissions compliance, new vehicle enforcement has had some success in India. The MoRTH regularly monitors COP activities, and many type-approval and COP testing centers have been expanded and improved in recent years. [59] Testing centers maintain records of type-approval and COP test results and regularly relay them to the MoRTH as part of the certification process. [55] As a result, vehicle manufacturers now offer warranties on emissions.
The central government is also setting up ten new I/M centers across the country to help the six current authorized testing agencies meet the demand for vehicle testing. The date of completion of these centers is unknown, although construction has already begun. Rs. 2,000 lakh ($4 million) was allocated for the project in the 2010–2011 fiscal year, and Rs. 8,400 lakh ($16.8 million) has been allocated for the 2011–2012 fiscal year.
5.12 COMPARISON OF INDIA’S PROGRAM WITH INTERNATIONAL BEST PRACTICES
Table 5.12.1 compares India’s vehicle emissions compliance program with that of the United States. The specific issues are discussed in more detail in the following sections.

39
OVERVIEW OF INDIA’S VEHICLE EMISSIONS CONTROL PROGRAM
Table 5.12.1: Comparison of vehicular emissions compliance programs in the United States and India
India United States
Testing ProtocolType approval (TA) and conformity of production (COP) through testing centers
• TA, COP and in-use testing by manufacturers
• EPA runs confirmatory tests and in-use surveillance tests and oversees the selective enforcement audits (SEAs)
Compliance Testing Manufacturers advised before selection of vehicles for COP
Vehicles from models identified for testing selected at random
Compliance Testing Vehicles/engines must pass standard test cycle
Vehicles must pass supplementary test cycles (Supplementary Federal Test Procedure/Not To Exceed) in addition to standard test cycles
Durability Requirements
• 100K km (Bharat IV-LDVs) • 180K km/10 years (LDV)
• Deterioration rates or 125K–167K km (HDVs)
• 700K km/10 years/22K hours (HDV)
In-use VehiclesI/M (PUC) inspections conducted by independent operators not linked to vehicle registration
I/M inspections conducted by state/local authorities linked to vehicle registration
In-use Vehicles Certificates issued to PUC-compliant vehicles
Visible sticker issued to I/M-compliant vehicles
In-use Vehicles PUC data not sent to centralized system
I/M data accessible to EPA to identify vehicles for in-use testing program
On-Board Diagnostics (OBD)
OBD-II will go into effect on Bharat IV vehicles only starting in 2013
• LDV OBD since 1996
• HDV OBD since 2005
• Increasing reliance on OBD for in-use monitoring
Noncompliance No mandatory recall policy Mandatory recall for vehicles not in compliance
5.12.1 Policy and organizational issuesIn the United States, the Clean Air Act authorizes the EPA to regulate all engines and vehicles that emit pollutants into the atmosphere. It also gives the EPA the authority to require manufacturers to, at their own expense, recall and fix any vehicle or engine not meeting the standards in actual use, given proper maintenance.
In India, enforcement is unnecessarily complex because of the splintered nature of compliance programs and vague policies. Furthermore, procedures in the case of noncompliance are not well laid out. The MoRTH maintains the right to order recalls of vehicles failing compliance testing, but specific guidelines for initiating recalls do not exist. Nor are there any plans to create such a system in the near future. [60] Lastly, the large number of committees, agencies, and ministries dealing with emissions compliance makes coordination among them difficult.
Even if creating a single authority to regulate all vehicle and fuel matters is deemed not politically feasible, there are other issues that prevent the current system from realizing its full potential. For example, the SCOE functions to some extent as such a unitary authority, but it has no civil society representation, meaning that the public interest is not well reflected. Moreover, the SCOE does not have a website, nor are any

40
INTERNATIONAL COUNCIL ON CLEAN TRANSPORTATION
of its proceedings readily available to the public.
Aside from logistical issues, India also lacks in-use conformity testing that is carried out at the national level. While the COP program is intended to ensure that all new vehicles meet standards, the lack of in-use conformity testing prevents the country from testing a representative sample of vehicles on the road to ensure that they are meeting emission standards within set deterioration rates. [61]
In terms of I/M, India also falls short of international best practices. In many U.S. states, all vehicles are required to undergo annual registration, insurance checks, safety inspections, and emissions control checks. While there are differences from region to region, the annual one-stop system allows for multiple vehicle maintenance problems to be resolved at one time. Data are stored at the state level but can be easily accessed by the EPA for national-level use.
By contrast, private vehicle registration in India is not required until 15 years after initial purchase. Nor are vehicle registration, proof of insurance, and PUC certification coordi-nated through a system that would allow for the verification of all at the same time. Data from PUC tests also are not stored for future access. However, a few cities, notably Delhi, have been making efforts to create a centralized vehicle database.
Another aspect of India’s enforcement program that is not up to par with international best practices is its in-use test procedures. In India, a fairly simple idling test is conduct-ed that only passes or fails a vehicle. In the United States, in contrast, a more accurate full-scale mass emission test is performed in many regions. [61]
5.12.2 Technical capacity and testing capabilityServing as an exemplar, the EPA has developed solid in-house technical capacity and testing capability, resulting in effective enforcement of vehicle emission standards:
» With about 400 staff today, the National Vehicle and Fuel Emission Laboratory in Ann Arbor was founded in 1971 to perform conformity testing and in-use testing of vehicles and engines. The agency also uses the Department of Defense’s Aberdeen Test Center in Maryland to conduct in-use testing of HDVs and nonroad engines.
» EPA’s Compliance and Innovative Strategies Division has seven full-time-equivalent staff, four grantees, and a team of outside contractors for the light-duty vehicle division to enforce vehicle emissions standards. This does not include staff responsible for heavy-duty and nonroad engine and vehicle enforcement.
India has six laboratories around the country that are authorized by the MoRTH to conduct type-approval and COP tests. Of these six, only the ARAI and the ICAT regularly conduct type-approval and COP tests of passenger vehicles. The ICAT has about 35 people working on type approval and COP, while the ARAI is assumed to have a similar-size staff. The ICAT is currently set up to test vehicles up to Euro 4/IV–equivalent standards, while the ARAI can test up to Euro 5/V–equivalent standards. [55] The four other testing agencies focus on specialty vehicles (i.e., military, off-road, etc.).
5.12.3 Financial resourcesFinancial resources allocated to type-approval, COP, and PUC programs in India are dif-ficult to estimate. One big reason for this is the splintered setup, and therefore funding, of testing agencies and their considerable reliance upon testing fees from manufacturers. For example, part of the ICAT’s operational budget comes from the MoHIPE, even though the ICAT conducts type-approval and COP tests for the MoRTH. The percentages of the ICAT’s budget coming from diverse sources are difficult to discern.

41
OVERVIEW OF INDIA’S VEHICLE EMISSIONS CONTROL PROGRAM
5.13 RECOMMENDATIONSCompared with its counterparts abroad in terms of vehicular emissions compliance and enforcement, India needs improvement in several critical program areas, particularly for in-use vehicles. Many major cities, notably Delhi, have ramped up inspections and have implemented changes to enforce PUC rules. Nonetheless, expanded authority for officials responsible for enforcing emissions norms, increased funding, improved train-ing, updated technologies, and explicit policies will be required for vehicle compliance in India to match international best practices.
For type-approval and COP testing, India has taken steps to bolster its compliance and enforcement program over the past decade. Nevertheless, problems persist, and the system can be improved further. Below are some recommendations for India to strengthen its national vehicle enforcement program.
Institute a national in-use compliance program. The establishment of a compliance program that integrates with type approval and COP to apply throughout the useful life of a vehicle may be the most important recommendation to ensure that vehicles are designed to meet standards throughout their useful life. Currently, India lacks national in-use vehicle testing programs, along the lines of U.S. EPA programs, that are linked to new vehicle emission standards and deterioration rates. Together with strong recall regulations, this type of program can be the best route to full-vehicle-life compli-ance. India can take advantage of vehicle testing centers already in development to institute such programs by April 2017.
Create a single agency fully responsible for vehicle emission and fuel quality standards and compliance. This approach was recommended by the Auto Fuel Policy Commit-tee in 2003, but the recommendation was not adopted. The fragmented nature of India’s emissions compliance system creates unnecessary complexities and allows responsibility for compliance to be passed on to others. If the creation of an entirely separate agency is not possible, all vehicle emission and related fuel quality regulatory responsibilities should be assigned to the MoRTH.
Reform SCOE to widen its representation and open it to the public. If it proves politi-cally impossible to have a single agency, either a stand-alone entity or the MoRTH, regulating vehicle emission and fuel quality standards, the SCOE can be reformed to assume many of the responsibilities such an agency would have. Civil society organiza-tions should become an integral part of the SCOE so that vehicle emissions can be tied in with the larger effort to improve air quality in India. Furthermore, the SCOE should make its proceedings easily accessible to the public, so people know what progress is being made.
Mandate annual vehicle registration and integrate it with PUC and other I/M pro-cedures. Like many other countries, India can implement annual registration for all vehicles, encompassing PUC testing and other I/M procedures. This will have the advantage of creating a system in which multiple vehicle regulations are dealt with at once. It will also ensure that PUC testing is done in order for owners to register vehicles. Annual registration will have the added benefit of keeping better track of vehicles in use in India. A sticker clearly stating the date of expiry of registration should be issued so that law enforcement officials can easily see which vehicles are out of compliance.
Implement specific legal procedures for MoRTH to order recalls. Although laws recog-nize the right of the central government and state governments to recall vehicles when they are not in compliance, there is no official procedure set up to carry this out in practice. The result is that the government lacks the precedent and authority to recall

42
INTERNATIONAL COUNCIL ON CLEAN TRANSPORTATION
vehicles that are not in compliance. A proper procedure for recalls should be drawn up in collaboration with the automotive industry, as in the United States. The threat of a recall, and the costs associated with it, are strong incentives for manufacturers to produce vehicles that meet standards throughout their useful life.

43
OVERVIEW OF INDIA’S VEHICLE EMISSIONS CONTROL PROGRAM
6 FUEL INSPECTION AND COMPLIANCE PROGRAMS
As discussed in Chapter 4, fuel modifications can affect combustion-generated emis-sions and, more important, enable the effective use of advanced emission control devices. Top vehicle emission performance can only be achieved if both vehicles and fuels meet respective standards in tandem.
It is important to design and implement an effective fuel compliance program to ensure that fuels sold at retail stations meet all the mandated specifications. A fuel compliance program becomes even more critical with the use of advanced emission control devices, which can be damaged by fuel not conforming to specifications (e.g., high-sulfur fuel).
It has been a challenge for India to establish an effective fuel compliance program, given its expansive territory and incentives for fuel suppliers and retailers to sell cheaper illegal fuel to their price-conscious customers. This chapter reviews the experiences of the United States, Japan, and China in enforcing motor fuel quality. Lessons learned from these countries inform recommendations for the implementation of an effective fuel quality compliance program in India.
6.1 OVERVIEW OF THE EPA’S FUEL COMPLIANCE PROGRAMThe U.S. Environmental Protection Agency manages a comprehensive fuel compliance program that combines fuel registration, extensive inspections, a fuel quality testing and reporting system, and stiff noncompliance penalties. The Clean Air Act (CAA) gives the EPA the authority to prohibit the manufacture or sales of fuel and fuel additives if there is reason to believe they endanger public health or if they impair emission control devices on vehicles. [13] Amendments to the CAA in 1990 added provisions mandating that fuel combustion result in fewer emissions. The amendments also expanded the EPA’s authority to include fuels used in nonroad vehicles.
The EPA’s compliance program places the onus largely on refiners, importers, and other fuel handlers to demonstrate compliance through registration, fuel analysis, and reporting. The EPA authenticates the industry’s compliance by mandating independent lab sampling and testing, by third-party auditing of industry reports, and by conducting targeted and random audits at refineries, import facilities, truck loading terminals, and retail stations. Major elements of the program are discussed in more detail in the follow-ing sections.
6.1.1 U.S. enforcement approachThe U.S. fuel compliance program targets all parties in the distribution system, including refiners, importers, distributors, carriers, oxygenate blenders, retailers, and wholesale purchaser-consumers (fleet operators with their own dispensing pumps).
The program was set up to guarantee that fuel that is either leaving the refinery gate or being imported meets all requirements on both a per gallon and an annual average basis. Tables 6.1.1 and 6.1.2 below show the per gallon and average fuel requirements for gasoline and diesel fuel. Additional measures have been taken to ensure that the quality of fuel is maintained downstream of the refinery (also on a per gallon basis).

44
INTERNATIONAL COUNCIL ON CLEAN TRANSPORTATION
Table 6.1.1: Per gallon and average requirements for gasoline
PROPERTY OR PERFORMANCE REQUIREMENT
REFORMULATED GASOLINE (RFG)1 OTHER GASOLINE
PER GALLON AVERAGE PER GALLON AVERAGE
Lead Non-detectable - Non-detectable -
Sulfur, ppm, max 80 max 30 80 30
Volatility (summer RVP)
Approximately 7.0 psi (48 kPa) - 7.8-9 psi
(54-62 kPa) -
Aromatics 25% - 25% -
Benzene 1.3 vol.% 0.95 vol.% - -
Other heavy metals (e.g., manganese) Non-detectable - - -
RFG and anti-dumping2
Reduce VOCs and air toxics by 25-30% (compared with 1990 gasoline quality)
Reduce VOCs and air toxics by 25-30% (compared with 1990 gasoline quality)
Fuel not dirtier than 1990 gasoline quality
Mobile Source Air Toxics (MSAT 1)
Reduce air toxics by 330,000 tons by 2030
Reduce air toxics by 330,000 tons by 2030
MSAT 2 Benzene: 1.3 vol%
0.62 vol.% on average
No cap but refinery/importer annual average cannot exceed 1.3 vol.% before use of credits
0.62 vol.% average
1 RFG is a cleaner burning gasoline blend required in certain regions that do not meet air quality standards for ozone.
2 Sec. 211 of the Clean Air Act specifies a backstop limit on NOX, requiring that NOX emissions from a baseline vehicle using non-RFG shall not exceed the level from the baseline vehicle using the baseline gasoline in 1990. EPA no longer enforces the NOX standard, since compliance with the low sulfur levels in gasoline (30 ppm average and 80 ppm per-gallon cap) assures compliance with the old NOX standards. Starting in 2011, EPA will begin to phase out the toxics standards as well. These will be replaced by a benzene standard (annual average of 0.62 volume percent).
Table 6.1.2: Per gallon and average requirements for diesel
PROPERTY REQUIREMENT PER GALLON
Sulfur 15 ppm
Cetane index, min 40
Aromatics, max 35%
6.1.2 Fuel and fuel additive registration In the United States, refiners and importers are required to register any motor vehicle fuel and fuel additive with the EPA prior to marketing it. Registration requires submitting the chemical description of the fuel or fuel additive, as well as some technical, market-ing, and health-related information, such as the product’s purpose. The EPA might also require that a product be tested for possible health effects before registration.
The EPA uses registration information to assess likely combustion and evaporative emissions using the Complex Model, [62] which identifies products with emissions that might pose unreasonable risks to public health. The agency can deny registration to, or

45
OVERVIEW OF INDIA’S VEHICLE EMISSIONS CONTROL PROGRAM
repeal registration of, any fuel or fuel additive that may endanger public health or impair emission control devices.
Under the CAA, detergent additives are required to be added to gasoline to reduce accumulation of deposits in engines and the fuel supply system. These additives must be certified by the EPA via the following process:
1. Registration with the EPA that includes the additive’s composition and the minimum recommended additive concentration. The recommended concentration cannot be lowered without first notifying the EPA.
2. Submitting a sample of the detergent additive to the EPA.
3. Submitting a certification letter for the detergent additive package. The letter must be signed by a person legally authorized to represent the certifying party.
After receiving the certification letter, the EPA may review the certification data, analyze the submitted detergent additive sample, or subject the additive package to confirma-tory testing, and it may disqualify a certification where appropriate.
Detergent additive manufacturers also are required to communicate their detergent’s minimum recommended blending concentration to fuel producers. [39]
6.1.3 Fuel testing and compliance reportingThe EPA requires refiners and importers to analyze the properties of every batch16 of fuel produced or imported.17 Refiners and importers have to keep all testing records and retain test samples. Fuel properties are reported to the EPA on a quarterly or annual basis, depending on the design of the particular compliance program.18 [63] In addition, annual reports are filed with the EPA, summarizing test results and associated proper-ties to show compliance with the per gallon and annual average standards. The EPA selectively audits reports and lab records to check for consistency. Additionally, the EPA audits testing labs and test methods.
6.1.4 Industry-paid independent lab testingIn addition to requiring self-testing of every batch of fuel, the EPA calls on refiners and importers to hire independent labs to test gasoline. As of 2005, about 150 labs were working with the EPA and refiners to test fuel quality. [64] Lab test reports are submitted to the EPA for comparison with reports submitted by industry. All reports are required to be signed by senior lab managers, and the EPA can file criminal charges against the signatory if reports are found to be falsified.
6.1.5 Presumptive liability and industry-funded field surveysThe EPA rules place liability on refiners, importers, distributors, carriers, resellers, retail-ers, and wholesale purchaser-consumers to sell or use motor vehicle diesel fuel that meets the sulfur, benzene, volatility, toxics, and lead contamination standards. When a violation is found, not only the party in possession of the noncompliant fuel but all upstream parties in the fuel distribution system as well are presumed liable, unless they establish a credible defense. This has prompted many refiners and importers whose
16 In the diesel fuel program, by definition (40 CFR 80.502[d]), a batch is a volume of fuel whose custody has been transferred to another party. A batch of gasoline is defined as a homogeneous mixture in Sec. 80.2 (gg).
17 Sulfur content, aromatics, and cetane number for diesel; sulfur, aromatics, benzene, lead, summer Reid vapor pressure distillation, and olefin for gasoline, as well as other fuel properties that demonstrate compliance with the reformulated gasoline or conventional gasoline antidumping requirements.
18 For instance, refiners and importers are required to submit a fuel quality report for every batch of fuel produced or imported to show that all per gallon requirements are met. To demonstrate compliance with the reformulated gasoline and antidumping requirements, refiners or importers are required to submit reports every quarter and annually. Annual reports are required for demonstrating compliance with the benzene, volatile organic compounds, and air toxics requirements and the average and per gallon maximum gasoline sulfur limits.

46
INTERNATIONAL COUNCIL ON CLEAN TRANSPORTATION
brands appear at retail outlets to implement a downstream quality assurance program in the interest of compliance. [65]
As another mechanism to ensure compliance, fuel refiners and importers often fund a fuel survey program. Under this program, the industry hires surveyors to take statistically representative samples from retail stations and test them against standards.
6.1.6 EPA field audits and inspection Besides auditing the industry’s own reports and requiring fuel suppliers to arrange for independent lab testing, the EPA conducts random and targeted inspections of fuels at various points in the distribution system. It also audits a small number of labs each year to verify that they maintain an appropriate independence from fuel producers and that they correctly report test results.
6.1.7 Noncompliance penaltyThe CAA sets a maximum civil penalty of $37,500 (equivalent to Rs. 1,687,500) per day per occurrence plus the amount of economic benefit or savings resulting from a viola-tion. [13] Actual penalties are determined by the EPA based on various considerations, including unwarranted economic gains, business size, and the gravity of violation (whether it results in significant increases in emissions). While maximum fines are seldom assessed, the EPA has levied heavy fines for severe violations. For instance, in 1985, it imposed fines of $266,000 (Rs. 1.2 crore19) against Decker Coal for using leaded gasoline in 37 vehicles marked for unleaded fuel only. [66] In 2008, the EPA assessed a penalty of $1.25 million (Rs. 5.6 crore) against Biofriendly Corporation for failing to register an additive. [67] In 2011, the agency fined three fuel handlers and retailers $2.5 million (Rs. 12.5 crore) for producing and selling fuel that did not meet standards and for failing to comply with adequate fuel testing and recordkeeping. [68] In addition, the EPA can file criminal charges against refiners, importers, and independent labs should they be found to have falsified, or assisted in falsifying, test results.20
6.1.8 Averaging, banking, and trading (ABT) systemTo allow for industry to meet standards in the most cost-effective way, the EPA has introduced a number of flexibility provisions. One such measure is the Averaging, Bank-ing, and Trading (ABT) system.
The ABT system allows compliance to be reached over a specified time period. For example, in the EPA’s gasoline sulfur reduction programs, a refinery can bank any extra credits from going beyond the stringency demanded in the fuel standard for later use or for use at a different refinery. This enhances flexibility while ensuring that the annual average standard is still met. It should be noted that per gallon caps cannot be exceeded under the ABT system. Credits can only be applied to meet the average.
6.1.9 Fuel quality labeling Because of compliance flexibility and multitiered fuel quality standards in the United States, labels at retail outlets specify the appropriate use for various fuels. Figure 6.1.1 shows some such labels. [69]
19 1 crore = 10 million20 For instance, in 1998, Saybolt, which performed testing and inspection services for refiners and importers,
was fined a total of $4.9 million (Rs. 221 million) for submitting false statements to the EPA about the results of lab testing performed for refiners and importers.

47
OVERVIEW OF INDIA’S VEHICLE EMISSIONS CONTROL PROGRAM
Figure 6.1.1: Labels posted on fuel pumps at retail outlets stating diesel sulfur content and intended use
6.1.10 Controlling evaporative emissions during refueling Fuel vapors emitted during distribution and storage are a source of volatile organic and toxic compounds, such as benzene. Because of this, emission control devices have been developed to contain and recover vapors during fuel delivery and vehicle refueling.
Equipment that recovers evaporative emissions from distribution systems (e.g., storage tanks, bulk plants, bulk terminals, storage tanks at service stations, and fuel trucks) is designated as Stage I controls. To meet ambient air quality standards, many states require Stage I controls in their State Implementation Plans.21
Additionally, equipment is often installed at retail outlets. Doing this captures vapors released during vehicle refueling process and circulates them back to underground stor-age tanks. Such systems are called Stage II controls. Conversely, vapors can be captured through the use of carbon canisters installed on vehicles. These are called on-board refueling vapor recovery (ORVR) systems.
All passenger cars and light trucks (including SUVs, minivans, and light pickups) have been required to have ORVRs since 2000 and 2006, respectively. In anticipation of ORVR systems replacing Stage II, in 2006 the EPA relieved most of the United States from Stage II compliance regulations. Only the worst ozone nonattainment areas and those in the Ozone Transport Region (a group of northeastern states) were still subject to Stage II control measures. It is envisioned that all Stage II controls will be phased out in the near future since ORVR-equipped vehicles are now in widespread use. Currently, ORVR-equipped vehicles comprise approximately 64 percent of the in-service vehicle fleet nationwide and account for around 74 percent of the vehicle miles traveled. It is estimated that more than 75 percent of gasoline is dispensed into ORVR-equipped vehicles. [70] Therefore, the EPA published a notice of proposed rulemaking on July 15, 2011, formally concluding that ORVR will be sufficiently “widespread” as of June 30, 2013. [70] On that date, the federal mandate for use of Stage II systems in the worst nonattainment areas will be dropped.22
ORVRs are preferred to Stage II controls because i) ORVR systems on vehicles are more cost-effective than installing Stage II controls at retail outlets nationwide, ii) the performance of Stage II systems deteriorates over time as components break down from use, whereas the performance of ORVRs shows little deterioration over a vehicle’s lifetime, and iii) the deterioration of Stage II systems requires careful monitoring and maintenance to preserve effectiveness.
21 State Implementation Plans detail the control measures a state that is failing to attain National Ambient Air Quality Standards is undertaking to reach compliance within a given time period.
22 Individual states may continue to require Stage II controls if they wish.
48
INTERNATIONAL COUNCIL ON CLEAN TRANSPORTATION
6.1.11 Results and costs of the enforcement programThe EPA’s enforcement program has been largely successful. Less than 1 percent of facilities audited each year are found to be in violation of fuel quality requirements. [38] The following are some major features that have contributed to the program’s working as intended.
Noncompliance penalty. Under the fuel compliance program, the EPA has aggressively pursued violators, whether refineries, importers, or testing laboratories. Substantial fines were imposed on big companies when severe violations were found, and criminal charges have been filed against laboratories found to have falsified test results. This has created a strong incentive for fuel producers, importers, and handlers to exercise care to stay within the rules.
Presumptive liability. Presumptive liability provisions mean that all parties involved in the fuel distribution chain must undertake efforts to ensure the quality of fuel they handle. Industry-paid surveys to verify retail fuel quality help maintain compliance throughout the chain and reduce the regulatory burden of the EPA.
Independent testing and auditing. Requirements for independent lab testing of every batch of fuels and independent auditing of in-house and lab test results make it difficult for refineries or importers to cheat by submitting falsified data to the EPA.
Program funding and staffing. The contractor the EPA uses for conducting field sampling and testing costs more than $1 million annually. The EPA has more than 20 full time staff, including lawyers, engineers, and inspectors, working on fuel compliance issues. These expenditures and the associated staff time are in addition to industry spending to ensure fuel quality. As with vehicular emissions compliance, the EPA does not directly use fees from industry for program funding.
6.2 OVERVIEW OF JAPAN’S FUEL COMPLIANCE PROGRAMLike the United States, Japan has a well-conceived and effective fuel compliance program. While its approach has similarities to the U.S. program, there are significant differences as well.
Japan dropped a long-standing ban on petroleum product imports by companies other than domestic oil firms in April 1996, allowing refined petroleum products from overseas to be sold freely in the country. As more companies became involved in the fuel industry, a need for better fuel quality control emerged. That led the country to develop a program to stabilize the supply of petroleum products and to ensure that the quality of those products met set standards, through the passage of the Law on the Quality Control of Gasoline and Other Fuels (known for short as the Fuel Quality Control Law). This put the Ministry of Economy, Trade and Industry (METI) in charge of enforcing fuel quality standards in Japan.
6.2.1 Japan’s fuel quality enforcement approachBased on environmental and safety considerations, the Fuel Quality Control Law estab-lishes mandatory property specifications for ten gasoline and three diesel properties. [71, 72] It also details a set of standard specifications that include all mandatory require-ments plus additional recommended requirements for gasoline and diesel fuels. These are all shown in Table 6.2.1.

49
OVERVIEW OF INDIA’S VEHICLE EMISSIONS CONTROL PROGRAM
Table 6.2.1: The Fuel Quality Control Law’s mandatory and standard specifications
GASOLINE DIESEL
PROPERTY STANDARD PROPERTY STANDARD
Stan
dar
d s
pec
ifica
tio
ns
Man
dat
ory
Sp
ecifi
cati
ons
Lead Non-detectable Cetane Index 45 min.
Man
dat
ory
Stan
dar
d s
pec
ifica
tio
ns
Sulfur content 10 ppm Sulfur 10 ppm
MTBE 7% vol. max. Distillation, T90% 360oC max.
Benzene 1% vol. max. FAME * 0.1 mass% max.
Kerosene 4% vol. max. Triglyceride * 0.01 mass% max.
Methanol Non-detectable Flash point 45oC min.
Washed gum 5 mg/100 ml. max. Pour point Depends on regions and month
Color Orange Cold Filter Plugging Point (CFPP)
Depends on regions and month
Oxygen content 1.3% mass% max. Carbon residue ** 0.1 mass% max.
Ethanol 3% vol% max. Kinematic viscosity @30 oC 1.7 mm2/s min.
Octane Regular: 89 min.Premium: 96 min.
Density 0.783 g/cm3 max.
Distill T10/T50/T90
Copper corrosion @50 oC 1 max.
RVP 44-78kPa (kgf/cm2)
Oxidation stability 240min min.
Source: Petroleum Association of Japan (2009). Petroleum Industry in Japan 2009.
Note: All properties listed above are included in the standard specifications; items in bold are mandatory specifications.
* This specification is applicable to diesel fuels without international blending of FAME (Fatty Acid Methyl Ester). Mandatory standards allow FAME upper blending limit of 0.5% max. In such a case, additional standards include:
Triglyceride: 0.01% mass max.; Methanol: 0.01% mass max.; Acid Value: 0.13 mg KOH (potassium hydroxide)/g max.; Formic Acid+Acetic Acid+Propionic Acid: 0.003% mass max.; Acid Stability: 0.12 mg KOH/g max.
** Conradson carbon residue, from 10% distillation residue.
6.2.2 Quality assurance obligations of fuel importers and refiners The Fuel Quality Control Law requires refineries and importers to test the fuel quality prior to distribution and sale to ensure that petroleum products meet all the mandatory requirements. As a result, the industry regularly tests fuel all along the distribution chain.
6.2.3 Retail outlet registration and testing requirementsAll retail outlets must register with the METI. The Fuel Quality Control Law stipulates that, once every ten days, retail stations test fuels they sell against the requirements listed in Table 6.2.1. Retail outlets may contract any of the four labs accredited by the METI for fuel testing.
A retail outlet can apply for exemption from this frequent testing if it shows that it has a clear distribution channel and a distributor that is jointly responsible for ensuring product quality. In this case, the outlet only needs to test fuel once a year.

50
INTERNATIONAL COUNCIL ON CLEAN TRANSPORTATION
6.2.4 METI enforcement programsIn addition to industry testing, METI conducts its own fuel testing every year. It com-missions the National Petroleum Association (NPA), an independent public corporation, to test fuel samples at least once a year from every one of the more than 45,000 retail outlets in the country. [73]
The NPA owns nine testing labs around the country. Each lab is responsible for fuel testing in a specific region. The NPA purchases one liter of every fuel type sold for test-ing at each existing retail outlet once or twice a year. This is done without prior notice. Noncompliant samples are then sent to quality testing laboratories, which support the NPA’s nine testing labs, for further analysis. If problems persist, results are then sent to METI and the Economic and Industry Bureau (EIB). The METI and EIB, in collaboration with local police, can then enforce corrective actions, such as mandatory equipment improvements or suspension of operation. In 2009, more than 29,000 gasoline and 54,000 diesel samples were tested by the NPA.
6.2.5 Consumer information: Standard Quality (SQ) MarkTo encourage consumers to choose higher-quality fuels, any retail station selling fuels that meet all the standard specifications can inform the public by displaying a Standard Quality (SQ) logo issued by the EIB.
6.2.6 Noncompliance penaltyRefineries, importers, or retailers found guilty of selling noncompliant fuels are subject to a punishment of up to 1,000,000 yen (equivalent to Rs. 5.5 lakh,23 or $13,000) in fines or up to one year of imprisonment, or both. METI also has the authority to suspend any business for up to six months for distributing or selling noncompliant fuels. In that case, METI can publicize the name of the noncompliant business to consumers.
6.2.7 Regulatory actions against mixing heavy oil into dieselTax authorities and some local governments in Japan, such as Tokyo’s, have also taken aggressive action against fuel adulteration, specifically, the illegal mixing of heavy oil into diesel. A study in 2000 by the Tokyo Research Institute for Environmental Protection found that using diesel with 50 percent heavy oil content results in 15 percent higher particulate matter (PM) and 7 percent higher nitrogen oxide (NOX) emissions, as well as higher emissions of toxic compounds (such as benzene and toluene). [74]
To combat this, the Japanese government mandated that the chemical marker coumarin be added to diesel and heavy oil but in different concentrations. Authorities can deter-mine if heavy oil is illegally added to diesel by testing for coumarin concentration.
6.2.8 Results and costs of Japan’s enforcement programMETI pays the NPA 1.57 billion yen (Rs. 707 million, or $15.7 million) every year for fuel quality testing. [75] This does not include expenses for METI’s staff time and other resources. Fuel quality monitoring data from the auto industry suggest that diesel and gasoline sold in Japan have met the 10-ppm sulfur limit since 2007.
6.3 OVERVIEW OF CHINA’S FUEL COMPLIANCE PROGRAM
6.3.1 Fuel quality enforcement approachChina’s systems for guaranteeing fuel quality are not well developed. Unclear legal guidelines regarding compliance have led to confusion concerning which authorities are responsible for fuel quality at different stages of the supply chain. The problem is
23 1 lakh = 100,000

51
OVERVIEW OF INDIA’S VEHICLE EMISSIONS CONTROL PROGRAM
exacerbated by poor communication between national and local authorities. Documen-tation detailing the role and responsibilities of various ministries is either nonexistent or difficult to obtain. This section summarizes what is currently understood by reviewing fuel relevant regulations and China’s Air Pollution Prevention and Control Law and by taking into account discussions between the ICCT and its Chinese partners. This may not reflect the full extent of activities related to fuel compliance in China.
The Air Pollution Prevention and Control Law bans the production, import, and sale of leaded fuels. The law authorizes the Ministry of Environmental Protection (MEP) to enforce the ban. It also encourages the production and use of quality fuels in general and supports measures to reduce toxic substances in fuel to mitigate harmful emissions. [49] However, there is no mention of control or regulatory responsibility for other fuel characteristics that affect vehicle emissions.
The quality of fuel sold at retail stations, according to the environment ministry’s Vehicle Emission Control Center (VECC-MEP), is monitored by provincial and municipal Admin-istration of Quality and Technical Supervision (AQTS) bureaus. But enforcement efforts vary from region to region. As a result, fuel quality compliance can differ considerably across the country.
According to Part 7 of China’s petroleum refining industry standard SH 0164-92, “Rules for Storage, Transport, and Delivery Acceptance of Petroleum Products,” regulations to guarantee petroleum product quality during transport and delivery stipulate the following:
» Before fuels are sold to retail stations, fuel sellers are responsible for ensuring that they comply with standards;
» The party delivering petroleum tests the product against applicable standards and certifies product quality;
» The buyer has the right to take random samples to verify product quality;
» The Research Institute of Petroleum Processing, an arm of the China Petroleum and Chemical Corporation (Sinopec), will act as arbiter when disputes regarding product quality arise between fuel buyers and sellers;
» The quality of fuel sold at retail stations is supervised and managed by the local AQTS bureau;
» City governments can take random samples at retail stations for testing. They then report results on the local AQTS website.
6.3.2 Results and costs of China’s fuel enforcement programOfficial reports or studies assessing fuel quality are currently not publicly available in China. However, several fuel surveys have been conducted by various organizations in different parts of China. Results show that noncompliant fuels on the market are commonplace, which indicates weak enforcement. Summaries of some of these studies are discussed below.
» Fuel surveys conducted by the Beijing AQTS Bureau in 2006 and 2007 showed that more than 95 percent of fuel samples met the standards, with the most frequent violation being high sulfur content. A few gasoline samples were also found to contain methylcyclopentadienyl manganese tricarbonyl, or MMT. The bureau ordered the retail stations in question to stop selling noncompliant fuel immediately, and it requested that AQTS bureaus in other districts in the area take similar actions.
» Random fuel inspections conducted by the Shenzhen Quality and Technical Supervision Bureau in the fall of 2008 showed that 94 percent of gasoline and 97 percent of diesel samples were in compliance. The bureau imposed a deadline for noncompliant enterprises to correct the problems.

52
INTERNATIONAL COUNCIL ON CLEAN TRANSPORTATION
» Fuel quality inspections conducted by Yunnan Provincial Institute of Product Quality Supervision and Inspection found that 81 percent of the 785 samples of refined oil, lubricants, and motor vehicle brake fluid tested complied with standards. Most of the noncompliant samples were not from PetroChina and Sinopec, the two largest oil companies, but rather from small community service stations.
» A nationwide fuel quality survey funded by VECC-MEP and conducted by the Swiss private testing and inspection company SGS in July 2008 showed that 6 percent of diesel samples exceeded the then 2,000-ppm sulfur limit, that 13 percent of gasoline samples contained methanol, that 13 percent of gasoline did not meet the vapor pressure requirements, and that 2 percent of gasoline did not meet the benzene requirements. No follow-up action was taken since the tests were performed for research purposes only.
» In 2008, a fuel quality study conducted by the CRAES across northern China showed that 7.5 percent of diesel samples had sulfur content above the legal limit of 2,000 ppm. Furthermore, 12 percent of gasoline samples had sulfur content above the legal limit of 500 ppm. [76]
» Testing of in-use taxis in Beijing by the CRAES showed elevated levels of manganese deposits in catalytic converters, implying that the gasoline used had high manganese content.
6.3.3 Costs of and resources devoted to running the compliance programComprehensive information about the total outlays and resources needed to run China’s fuel quality compliance programs is not publicly available. At the national level, there are approximately five staffers at the Chinese Research Academy of Environmental Sciences and two in the Vehicle Emission Control Center that have responsibilities related to fuel quality and fuels additives testing, supervision, management, and research. At the local level, data regarding the number of staff in local Quality and Technical Supervision bureaus involved in fuel inspections are not available.
As China begins to implement increasingly stringent fuel quality and vehicle emission standards in the coming years, it is clear that tougher and farther-reaching fuel compli-ance programs will also be necessary, both to prevent damage to vehicles and after-treatment systems and to see to it that intended emissions reductions are achieved.
6.4 OVERVIEW OF INDIA’S FUEL COMPLIANCE PROGRAMIn India, the legal foundation for enforcing automotive fuel standards rests on several laws. The Air Act, 1981, gives state pollution control boards the right to prohibit the production or burning of any fuel that is determined to lead to air pollution. [14] Another legal document, the Environment (Protection) Act, 1986, does not specifically mention fuels but does authorize the central and state governments to regulate activities that can harm the environment, which would seem to cover the burning of fossil fuels. [15]
Another law that provides for government regulation of fuels is the Essential Com-modities Act, 1955. This gives state governments the right to ensure that all essential commodities, including petroleum products, sold to the public are up to government standards. It also calls for fines, imprisonment up to one year, and forfeiture of the right to do business for those who violate the act. [77]
In India, the multiple laws addressing fuel quality compliance creates a situation in which many ministries may be involved in safeguarding fuel quality standards. For example, the Ministry of Environment and Forests (MoEF) is responsible for enforcing environmental regulations, the Ministry of Road Transport and Highways (MoRTH) sets and enforces vehicular regulations, the Ministry of Petroleum and Natural Gas (MoPNG) deals with

53
OVERVIEW OF INDIA’S VEHICLE EMISSIONS CONTROL PROGRAM
fuel-related issues, and the Ministry of Consumer Affairs, Food and Public Distribution supervises provisions of the Essential Commodities Act.
6.4.1 Fuel quality enforcement approachIn 2006, the Petroleum and Natural Gas Regulatory Board Act created the Petroleum and Natural Gas Regulatory Board (PNGRB) under the MoPNG. [78] Currently, the responsibil-ity for ensuring fuel quality standards, from import or production through retail sales, ultimately falls on the PNGRB. It is charged with ensuring that the Petroleum and Natural Gas Rules, which were revised in 2002, are followed. The PNGRB is also authorized to resolve all disputes that may arise among producers, transporters, retailers, and consum-ers over fuel-related issues. [79] However, the MoPNG has not notified the PNGRB of its fuel quality control responsibilities. This means that the PNGRB cannot carry out the tasks assigned to it under the Petroleum and Natural Gas Regulatory Board Act.
To maintain quality control, the Petroleum and Natural Gas Rules list specific guidelines to be followed for the importation or refinement of fuel in India and the transport of fuel within the country. At refineries and depots, the rules call for the testing of fuels at “set intervals,” although exact intervals are not specified. A government-authorized sampling officer is required to extract the samples to be tested against standards, with at least one witness present during the process. The samples must be tested within twenty-four hours, and results are authorized by a government-appointed chief controller (of explosives). If results show that a fuel is noncompliant, the chief controller can order its destruction.
Once fuel is transferred away from refineries and depots, fuel transporters are required to have permits issued by state governments in order to deliver to retailers. [80–82] Transport-ers are also required to have up-to-date lists of the retailers they supply and the quantities of fuels supplied to them. This is a precaution against fuel being diverted to other places.
Fuel quality control at retail outlets is the responsibility of state governments under the Essential Commodities Act. [83] Most retail outlets are franchises of oil companies, but little, if any, information is available about fuel testing at retail outlets by any entity.
6.4.2 Controlling evaporative emissions during refuelingCurrently, there are no Stage I vapor recovery controls at retail fuel outlets in India, while only a select few have Stage II controls. [84] As of May 2012, oil companies have agreed to install Stage I and Stage II controls at all retail outlets in the National Capital Region (NCR), although the timeline for installation of these systems is unknown.
6.4.3 Results and costs of India’s fuel enforcement programIndia has had some success over the past decade in terms of fuel quality. Lead has been removed from all fuels, and sulfur levels have fallen dramatically. Alternative fuels such as compressed natural gas have also been gaining ground in recent years. Testing has improved as well. Under the direction of the Supreme Court of India, an independent fuel testing laboratory has been set up in Noida, just outside of Delhi, to test fuel samples submitted by any government authority.
According to oil companies, fuel is tested regularly at their refineries and depots. It is also regularly tested at retail outlets directly owned by oil companies [80–82] (about 50 percent of retail outlets). [57] Fuel not meeting standards is denied entry into the market.
Nevertheless, persistent problems with the compliance and enforcement program bring into doubt the quality of fuels sold at the pump versus mandated standards. Part of the issue lies with the delegation of responsibility from government to oil companies. While the Petroleum and Natural Gas Rules call for government officials to test fuels at refiner-ies and depots, in reality, oil companies conduct testing with little oversight.

54
INTERNATIONAL COUNCIL ON CLEAN TRANSPORTATION
At the retail level, there is no certain way to assess state governments’ enforcement of fuel quality measures. Data regarding what state governments have done to police fuel standards are not readily available.
Another problem is that, although PNGRB has the authority to enforce fuel quality, it does not do so because it claims (in its annual report) that the MoPNG has not allowed it to take on this responsibility. [83]
As a result of inadequate government oversight of fuel quality compliance, independent fuel testing laboratories, such as the new one established in Noida, are not utilized to their full potential. These labs do not have the authority to obtain samples themselves nor to administer punishments to oil companies, fuel transporters, or retail outlets for violations of standards.
6.4.4 Fuel adulterationIn India, uniquely among nations, adulteration is a major reason that fuel often does not comply with standards. The problem stems from government subsidies for kerosene and diesel, which encourage opportunists to mix these cheaper fuels with each other and into gasoline.
A 2006 study by the Indian Institute of Management, Ahmedabad (IIMA) looked at kerosene subsidies and distribution systems in the state of Gujarat. The study found that, although proper reporting on the part of kerosene transporters and dealers was required, the reality was often otherwise. Recordkeeping was sloppy, usually handwritten and not thoroughly checked by officials. Even when the recordkeeping was checked, little was done to verify that trucks went to their specified destinations because of the high costs of tracking every truck. Exacerbating the situation, corruption among those responsible for enforcing rules was pervasive, especially among lower-level employees. The low incomes of kerosene dealers and transporters as well gave them incentives to be in cahoots with fuel adulterators. [85]
An earlier study by the Centre for Science and Environment (CSE) in 2002 found similar problems. Oil companies were not legally held responsible for the transportation of fuels by contractors (representing about 90 percent of fuel tankers). As a result, they did not take responsibility for the loading and unloading of fuel tankers. Because of this, as well as generally poor enforcement, the CSE study found 51 percent of diesel and 33 percent of gasoline at retail stations to be out of compliance with sulfur standards. [86]
To tackle the issue of fuel adulteration, the government set up an anti-adulteration cell within the MoPNG in 2001. The cell was shut down in 2004, however, because of corrup-tion. [87]
6.4.5 Costs of and resources devoted to running India’s compliance programThe PNGRB is a six-member board at present. Oil companies have their own employees who monitor fuel quality compliance, though data on the exact number of people work-ing in that capacity are difficult to obtain. Similarly, data on government and oil company expenditures on fuel quality compliance are not readily available.

55
OVERVIEW OF INDIA’S VEHICLE EMISSIONS CONTROL PROGRAM
6.5 COMPARISON OF INDIA’S PROGRAM WITH INTERNATIONAL BEST PRACTICES
Table 6.5.1: Comparison of fuel quality compliance programs in the United States, Japan, and India
India United States Japan
Fuel Testing
Oil industry tests fuel; only one independent fuel testing lab
Oil industry tests every batch; EPA audits industry tests and contracts testing to multiple independent labs across the country
Oil industry testing before sale; METI tests all service stations annually at one of nine NPA labs
Presumptive Liability
Oil companies not responsible once fuel leaves their depots
All parties in fuel distribution system responsible
All parties in fuel distribution system responsible
Fuel Registration and Tracking
No centralized or computerized system
Computerized EPA Designate and Track system accounts for all fuel nationwide
All fuel and fuel handlers registered with METI
Penalties None to date Fines and criminal charges against violators
Fines and possible jail time; noncompliant service stations closed
6.5.1 Poor quality control and divided authority In the United States, the Clean Air Act gives clear authority to the EPA to regulate fuels and enforce fuel quality standards as needed to meet the overarching clean air goal. The law also specifies a maximum penalty, which the agency can assess when violations are found. The legal basis empowers the EPA to devise a comprehensive fuel compliance program that assigns presumptive liability to the entire distribution chain, thereby forcing the industry to bear the burden of testing and recordkeeping. It also allows the EPA to levy hefty, punitive fines in cases of noncompliance. The presumptive liability provision and the power to impose substantial fines are key to the program’s success.
Similarly, the Fuel Quality Control Law in Japan grants the METI the authority to regulate fuel quality and assess punitive measures (fines, suspension of operation, or imprison-ment) against violators.
In India, the PNGRB is ultimately responsible for fuel quality compliance and protecting consumers, but in reality it has not been given the full power by the MoPNG to carry out its duties. At the refinery and fuel depot stages, the government allows oil companies to test and certify their petroleum products with little oversight. At the retail outlet stage, compliance is splintered, as state governments are supposed to collaborate with oil companies to ensure that fuel quality standards are being met. But the paucity of data on this matter hints that it is not being carried out effectively.
6.5.2 Problems with liability in IndiaBest practices for managing fuel quality liability can be observed in countries such as the United States and Japan. Both countries’ regulatory authorities can subject all parties along the chain of production, distribution, and sales to presumptive liability. This compels all to monitor fuel quality diligently at every stage from the refineries to the retail stations for fear of punitive action otherwise.
In India, oil companies are absolved of direct responsibility for the quality of their prod-ucts once they leave refineries and depots. Therefore, while companies might do all they can in terms of quality control at their own facilities, fuel that reaches consumers might nonetheless be of a lower quality. With responsibility divided among those engaged in

56
INTERNATIONAL COUNCIL ON CLEAN TRANSPORTATION
the chain of production, distribution, and sales, in addition to weak enforcement, it is easy for one party to blame another for problems.
6.5.3 Limited staff, resources, and funding The experiences of the United States and Japan show that substantial resources from both regulatory agencies (the EPA and the METI) and industry are needed for fuel analy-sis, recordkeeping, and audits to maintain fuel quality along the supply chain. In India, while oil companies may allocate sufficient resources to meet fuel quality standards during production, there is relatively little investment on the part of the government to monitor their practices. Furthermore, there seem to be even fewer resources available to ensure fuel quality compliance at retail outlets, judging by the paucity of data on government enforcement actions.
6.6 RECOMMENDATIONS FOR INDIATo make certain that fuels sold at retail stations in India meet standards and to combat fuel adulteration, the Indian central government needs to invest more in fuel quality testing and enforcement. The following are some specific recommendations to improve fuel standards compliance.
Strengthen the PNGRB and centralize fuel quality compliance. Even if a single authority to regulate both vehicular emissions and fuel quality cannot be created, the PNGRB already has clear authority to enforce fuel quality standards. Nonetheless, arguments over procedural details and fine points remain, and compliance and enforcement suffer because of it. The MoPNG can fully notify the PNGRB of its responsibilites, increase fund-ing for it, and make it the sole authority responsible for fuel quality control at all levels.
Make oil companies accountable for fuel quality at the retail level. Under the current system, the vigilance of oil companies is meaningless if retail outlets still sell fuel not meeting standards. Making oil companies accountable for fuel sold to consumers would put pressure on them to keep watch on fuel quality throughout the supply chain. It would force those companies to stand by retail products offered in their name, wherever sold.
Continue reform of fuel subsidies. Currently, diesel prices are increasing by Rs. 0.50 (1 cent) per liter every month until the full diesel subsidy is removed. This is a huge step forward, and this policy should continue unimpeded, regardless of political consider-ations. Additionally, sales tax differentials between diesel and gasoline should be erased to eliminate the retail price disparity. Aside from reforming subsidies for diesel, subsidies for kerosene and other fuels should also be zeroed out to disincentivize fuel adulteration.
Increase the number of independent fuel quality testing labs. The United States and Japan each have numerous labs spread out across the country that can test fuel quality in their respective regions. Setting up at least one lab in each region in India would allow regulators to test fuels in any part of the country relatively quickly and easily. As it stands, only one national lab, in Noida, is authorized to test fuels from anywhere.
Mandate Stage I, Stage II, and ORVR evaporative controls. Currently, there are almost no evaporation controls at retail outlets in India. Especially as vehicular emission standards are tightened, evaporative emissions will increase in significance. This is particularly problematic in areas that already have poor air quality. India can adopt policies already in place in the United States, in which Stage I and Stage II controls were implemented in areas with the worst air quality. On-board refueling vapor recovery systems were mandated for new vehicles shortly thereafter. With vehicle turnover over time, U.S. Stage II controls were gradually lifted as ORVR-fitted vehicles became prevalent.

57
OVERVIEW OF INDIA’S VEHICLE EMISSIONS CONTROL PROGRAM
7 ALTERNATIVE FUELS AND NEW ENERGY VEHICLE POLICIES
For vehicles, the term “alternative fuels” refers to substitutes for conventional fuels such as diesel and gasoline. With rapidly growing vehicle populations and limited oil supplies, many governments around the world have sought to promote nonpetroleum and often home-grown fuels as suitable alternatives. Beyond energy security, though, authorities must not overlook the environmental impacts of such vehicles and fuels, in terms of both conventional air pollutants and greenhouse gases (GHGs). When taking into consideration fuel life cycle emissions, some alternative fuels may not yield any benefits over conventional fuels.
This chapter provides information on the environmental advantages and drawbacks of a range of alternative fuels and vehicles currently deployed, or planned to be, in India. These include compressed or liquefied natural gas (CNG/LNG), ethanol, liquefied petroleum gas (LPG), and various new technology vehicles such as conventional hybrid electric vehicles (HEV), plug-in hybrid electric vehicles (PHEV), battery electric vehicles (BEV), and hydrogen fuel cell electric vehicles (FCEV).
Alternative-fuel vehicles are designed in different ways, depending on how they use fuel. Vehicles can be engineered to use one alternative fuel; dual-fuel vehicles can use either a conventional or an alternative fuel, stored in separate tanks; and flexible-fuel vehicles (FFVs) can use either a conventional or an alternative fuel, or a mixture of both, stored in the same tank.
Not all alternative-fuel vehicles are produced by original equipment manufacturers (OEMs). Vehicles originally designed to have conventional fuel engines can be modified to accommodate alternative fuels. Generally speaking, OEM alternative-fuel vehicles have better engine and emissions performance, given that engine design and calibration are optimized for alternative fuels.
Each of the following sections summarizes international and Indian experience and poli-cies related to promoting the use of these fuels. Based on the emissions features of each fuel type, as well as lessons learned in India and abroad, each section ends with recom-mendations. These reflect India’s opportunities in the development and implementation of policies that support sustainable alternatives to petroleum-derived fuels.
7.1 NATURAL GAS VEHICLESNatural gas vehicles (NGVs) are fueled with either compressed natural gas or liquefied natural gas. NGVs can produce significantly lower carbon monoxide, nitrogen oxide (NOX), and particulate matter (PM) emissions thanks to their clean-burning properties. At the same time, life cycle GHG emissions need to be considered when developing policies related to NGVs. For example, CNG refueling infrastructure needs to be leakproof since even small amounts of methane escaping into the atmosphere can have significant global warming impacts.
For light-duty vehicles, a U.S. Environmental Protection Agency (EPA) study showed that CNG vehicles had the potential to reduce CO and NOX by up to 97 percent and 60 percent, respectively, compared with gasoline vehicles without three-way catalysts. [88] For heavy-duty vehicles, the same study showed that, relative to a diesel-powered United Parcel Service delivery truck, a CNG-powered truck could reduce PM, hydrocar-bon (HC), and NOX emissions by 50 percent (without any after-treatment) and poten-tially could reduce well-to-wheel CO2 emissions by 25 percent, depending on the source of the natural gas. A variety of other studies involving urban transit buses, sanitation trucks, and freight trucks conducted in a number of U.S. cities have also shown that

58
INTERNATIONAL COUNCIL ON CLEAN TRANSPORTATION
dedicated CNG or LNG heavy-duty vehicles can result in significant emission reductions over diesel buses and trucks.
Table 7.1.1 summarizes the results of some of these studies. [88] Information on emission control technologies fitted on reference group vehicles is provided in the notes below the table. It is important to point out that none of the vehicles had after-treatment systems. With more stringent emission standards, after-treatment systems will likely be necessary even for NGVs.
Table 7.1.1: Summary of findings for U.S. heavy-duty NGV working fleets
VEHICLE TYPECNG MAIL
DELIVERY TRUCKS LNG BUSES* LNG SEMI-TRUCKSLNG DUAL-FUEL
REFUSE TRUCKS**
Fleet United Parcel Service (UPS)
Dallas Area Rapid Transit (DART) Raley’s City of Los Angeles
Bureau of Sanitation
Number of Alternative Fuel Vehicles
7 15 8 10
Number of Diesel Vehicles 3 5 3 3
Drive Cycle City/Suburban Heavy Vehicle Route
Central Business District Five-Mile Route
Air Quality Management District Refuse Truck Cycle
PM Reduction 95% NSS**** 96% NSS****
NOx Reduction 49% 17% 80% 23%
NMHC Reduction 4% 96% 59% Less Than Diesel THC NSS****
CO Reduction 75% 95% –263%*** NSS****
*Diesel buses in the DART study used oxidation catalysts.** Diesel trucks in the Los Angeles Bureau of Sanitation test used catalyzed particulate filters.*** Negative reduction values indicate an increase in pollutants.****NSS: Not statistically significant because emissions were too low for the testing equipment for the LNG buses and for both the LNG and diesel (owing to the use of catalyzed particulate filters) refuse trucks. Emission figures are given in terms of percentage reduced from diesel emissions, based on grams emitted per mile driven.
One important advantage of natural gas is that it is sulfur-free. As a result, NGVs are a popular substitute for diesel heavy-duty vehicles as a way to meet emissions standards in many countries where low-sulfur fuel is not widely available. An Indian study found that CNG buses could readily meet Euro IV–equivalent standards for all pollutants except CO without any after-treatment systems. Emissions from an Indian CNG bus are compared with Euro II, Euro III, and Euro IV emission limits in table 7.1.2. [17]
Table 7.1.2: Emissions of an Ashok Leyland Indian CNG bus compared with various European emission standards
Emissions (g/kWh)
HC NOX CO PM
Euro II 1.10 7.00 4.00 0.15
Euro III 0.66 5.00 2.10 0.10
Euro IV 0.46 3.50 1.50 0.02
Indian CNG Bus 0.04 3.24 3.12 0.01
One advantage of lean-burn CNG engines is that PM and NOX emissions meet Euro III standards without any after-treatment. Fitting a lean-burn CNG vehicle with an oxidation

59
OVERVIEW OF INDIA’S VEHICLE EMISSIONS CONTROL PROGRAM
catalyst specially designed for CNG operation can, however, further improve emissions to meet Euro IV–equivalent standards. This provides the same level of PM emissions controls as an advanced diesel engine with a diesel particulate filter (DPF) and is the primary reason that cities lacking low-sulfur fuel are considering switching heavy-duty fleets to run on CNG to reduce urban air pollution. This strategy can work in the near term, but a future move to Euro V standards and beyond will require after-treatment systems on CNG vehicles as well, in order to meet CO, NOX, and particulate number standards. [89]
According to the U.S. Department of Energy’s Argonne National Lab, life cycle GHG tailpipe emissions from NGVs can be as much as 20 percent less than those of conven-tional gasoline vehicles. [88] CNG uses less petroleum and emits fewer GHGs than LNG because compression requires less energy than liquefaction.
On the downside, though, NGVs are associated with geographical limitations, load limitations, formaldehyde emissions, and issues associated with diesel engine conversion. For regions far from natural gas fields, building long-distance pipelines, often through multiple countries, can be expensive and risky. Additionally, leakage of methane from these pipelines can have a sharply negative climate impact. [90] Methane has a 100-year GHG potential about 25 times greater than CO2.
Because of natural gas’s lower energy content per kilogram compared with gasoline or diesel, NGVs yield less engine power, which may cause difficulties in climbing, accelerat-ing, or driving with heavy loads. Furthermore, CNG is stored in specially designed tanks (at 200-bar pressure), which increase vehicle weight and may displace load or reduce passenger capacity. This can further curtail fuel economy. In general, these limitations have restricted CNG vehicles to niche applications such as city buses and other vehicles with fixed routes and secure refueling sources. Vehicles fueled with LNG, which has much higher energy intensity and therefore does not require as large a fuel tank as CNG vehicles, are better suited to long-haul applications, especially for heavy-duty trucks.
As mentioned, developing countries have a growing interest in converting diesel buses into NGVs to reduce emissions. Where natural gas refueling is difficult, diesel buses are often modified as dual-fuel vehicles that can run on either. In this case, however, dual-fuel engines cannot be optimized for use with natural gas. Thus, the flexibility of dual-fuel vehicles often comes at a cost of lower fuel economy. Newer technologies, such as high-pressure direct injection, may improve engine efficiency, but they are associated with high maintenance costs.
7.1.1 International experienceIn the United States, NGVs are primarily urban buses or refuse truck. The Energy Policy Act of 1992 included CNG and LNG as alternative fuels and provided tax incentives for them, their fueling infrastructures, and NGVs.24 In the case of light-duty vehicles, the implementation of more stringent emission standards for new engines over the past 20 years has stimulated the development of new diesel and gasoline engine and fuel technologies that are competitive with CNG engines from an emissions standpoint. As a consequence, interest in light-duty CNG vehicles waned, although a few manufactur-ers are again considering NGVs, stimulated by falling natural gas prices and abundant supplies. Honda is still producing a CNG-based light-duty model (Civic). Chrysler and General Motors recently announced plans to develop CNG variants of some of their pickup trucks. There are also more product options on the heavy-duty market.
Worldwide, NGVs are most popular in South American countries like Argentina that are rich in natural gas but not petroleum. Rather than providing incentives for natural gas
24 Most of these incentives have now expired.

60
INTERNATIONAL COUNCIL ON CLEAN TRANSPORTATION
vehicles, Argentina chose to levy a high tax on gasoline, so that natural gas sells for one-fourth of its price. [91]
China, too, has been promoting NGVs in a number of its southwestern cities. Natural gas is much cheaper in that region compared with gasoline and diesel (about 40–50 percent of the price of gasoline). Starting in 2000, natural gas became a commonly available energy source for eastern cities like Shanghai and Beijing as well, which laid the groundwork for developing NGVs. By the end of 2008, NGVs were being promoted in 80 Chinese cities, resulting in more than 170,000 of them on the road and more than 500 CNG refueling stations nationwide.
7.1.2 India’s ExperienceDelhi has been at the forefront in introducing CNG heavy-duty vehicles in India. More than a decade ago, the city built the world’s largest CNG bus fleet after skyrocketing growth in private vehicle ownership resulted in poor air quality and severe public health problems. [92] In response to these problems, the Supreme Court of India issued an order that required Delhi’s entire bus fleet to be converted from diesel to CNG by March 2001. Other cities have also followed Delhi’s lead in switching their bus fleets to CNG. These include Visakhapatnam, Indore, Ujjain, Thane, Mumbai, Pune, Pimpri-Chinchwad, Agartala, Agra, Kanpur, and Lucknow. [17]
In addition to buses, many LDVs also use CNG as a fuel, particularly taxis and autorickshaws. In 2010, there were more than 354,000 CNG-powered vehicles in the entire country. Of these, about 150,000 were in Delhi, with the rest operating mostly in Mumbai, Hyderabad, Ahmedabad, Surat, Vadodara, Kanpur, Bareilly, Agra, Lucknow, and Agartala. [17] In the 2010–2011 fiscal year, in excess of 80,000 new CNG vehicles were sold, representing 2.7 percent of total passenger vehicle sales in India. [5]
Despite the initial benefits of CNG vehicles, congestion, poor road conditions, overload-ing, and lack of maintenance have gradually eroded their advantages. Furthermore, as emissions standards become stricter, it will be tougher for NGVs to comply without after-treatment systems. In recent years, it has been recognized that ultra-low-sulfur diesel and DPFs for diesel vehicles could better reduce emissions than using CNG without after-treatment systems. In India, however, ultra-low-sulfur diesel is not scheduled to be introduced in the near future. This means that CNG vehicles, especially buses, will remain central to in many cities’ strategies to control air pollution.

61
OVERVIEW OF INDIA’S VEHICLE EMISSIONS CONTROL PROGRAM
7.1.3 Summary and recommendationsSome of the pros and cons associated with NGVs are summarized in Table 7.1.3.
Table 7.1.3: Summary of advantages and disadvantages of natural gas in vehicles
ADVANTAGES DISADVANTAGES
• Significant reduction of PM and NOX for both light-duty and heavy-duty CNG vehicles compared with conventional-fuel vehicles with Euro III technologies. No black carbon emission
• Regional limitation—only cost-effective for regions with NG supply
• In developing countries without low-sulfur diesel fuel, lean-burn NGVs are a bridge technology to meet more stringent emissions norms (Euro III and Euro IV if the lean-burn NGV is fitted with oxidation catalyst), which is more difficult for conventional diesel vehicles
• Power loss in converted engines: not ideal for hilly regions or long-distance or heavy-loading transportation (LNG is better); reduced passenger capacity for buses
• Advanced CNG technologies together with after-treatment technologies (stoichiometric engines with a three-way catalyst) will achieve the most ambitious emissions norms worldwide (Euro VI)
• Lower fuel economy (more fuel consumption) than conventional vehicles for non-OEM CNG engines without high-pressure direct injection. However, the cost impact can be offset when the NG price is lower than for gasoline and diesel. For OEM engines, fuel economy can be similar to or a little higher than their diesel counterparts
• About 20% life cycle GHG reduction compared with conventional fuel vehicles
• Increased formaldehyde emissions if an oxidation catalyst is not used
• Natural gas can be much cheaper than conventional fuels for areas near a natural gas supply
• Converted dual-fuel vehicles (CNG/diesel) have inferior engine performance and higher emissions
In India’s case, NGVs remain a cost-effective way to control vehicular emissions since low-sulfur fuels will not be available any time soon. India also has more natural gas reserves than petroleum reserves, though it is a net importer of both. [93] India’s neigh-bors to the north and west are rich in natural gas reserves.
While promoting OEM-built NGVs is preferable to converting existing vehicles to run on natural gas, India can develop a comprehensive standards and certification system to optimize the performance of converted vehicles. This is especially true for urban bus fleets. The success of Delhi and a few other cities in converting their bus fleets to oper-ate on CNG can be a model for other cities that have yet to do so.
7.2 LIQUEFIED PETROLEUM GAS VEHICLES Liquefied petroleum gas (LPG), a by-product of natural gas processing, is typically a mixture of flammable gases, primarily consisting of propane or butane with smaller amounts of propene and butene. [17]
In terms of emissions, LPG vehicles are somewhat similar to NGVs. PM emissions are low, and CO emissions are generally lower than those of gasoline engines but higher than for diesel engines. HC emissions are typically higher than for gasoline vehicles, though LPG vehicles emit mostly short-chain hydrocarbons that are less reactive. NOX emissions are generally about the same as gasoline engines. [94] Life cycle CO2 emissions for LPG vehicles can be lower than those of both gasoline and diesel vehicles but depend on the LPG source.
Disadvantages of LPG include problems with cold starting, lower fuel economy, lower power output (relative to conventional fuels), and higher production costs than CNG. The lack of LPG refueling infrastructure in most countries is also a drawback, at least initially. As in the case of CNG, improvements in gasoline and diesel engines in recent years have eroded many of the benefits of LPG engines. [95]

62
INTERNATIONAL COUNCIL ON CLEAN TRANSPORTATION
7.2.1 International experienceIn the United States, LPG vehicles are uncommon. No new commercial or passenger LPG vehicles have been available in the country since 2004.
Starting in the 1990s, China pushed for LPG taxis and buses. In 2004, there were 114,000 LPG vehicles nationwide. However, the momentum died because of poor vehicle quality (LPG vehicles were converted dual-fuel vehicles instead of OEM-dedicated LPG vehicles), higher than expected emissions, subpar fuel economy (relative to gasoline and diesel), and the limited supply of LPG. The Chinese government abandoned the strategy of promoting LPG vehicles a few years ago. Many of the previously LPG-retrofitted buses were replaced by HEV and CNG buses. [96]
In the Special Administrative Region of Hong Kong, LPG has fueled the more than 18,000 taxis since the end of 2005. Diesel taxis are now banned in Hong Kong. [97]
In Europe, the situation varies from country to country. In most countries, LPG penetra-tion is well below 1 percent, but Italy has been at the forefront with sales of dual-fuel vehicles that run on either LPG or CNG. Close to 20 percent of passenger car sales in Italy are CNG- or LPG-operated dual-fuel vehicles. France is a distant second, with CNG or LPG dual-fuel vehicles making up slightly more than 3 percent of all passenger cars sold in 2010. [98]
Overall, LPG use is most popular in a few countries with small automotive markets or for specialized segments. For example, in South Korea, in excess of 1.7 million vehicles use LPG. In Japan, 90 percent of taxis use LPG. Canada had more than 60,000 LPG-powered vehicles as of 2008, with the potential to expand the fleet since LPG is more accessible and cheaper there. [99] In Armenia, 20–30 percent of vehicles run on LPG. [100]
7.2.2 India’s experienceUntil recently, LPG as a fuel for passenger cars had been gaining popularity in India. The advantage of LPG in India is its lower price relative to gasoline. From the 2006–2007 fis-cal year to the 2009–2010 fiscal year, LPG dual-fuel vehicles increased from 1.23 percent to 3.84 percent of all passenger vehicle sales. But in 2010–2011, only 1.5 percent of all passenger vehicle sales were LPG dual-fuel vehicles. Much of the drop was absorbed by sales of CNG vehicles, which more doubled in 2010–2011 over 2009–2010. [5]
7.2.3 Summary and recommendationsLPG as an automotive fuel does provide some incentives over gasoline, but these have drastically diminished thanks to improvements in gasoline engines. As with CNG, LPG engines will have to make use of after-treatment systems in order to meet eventual emission standards. Given the cheaper cost of CNG, it seems likely that CNG will have higher demand than LPG in the future.
7.3 BIOFUEL VEHICLESBiofuels, both ethanol and biodiesel, refer to conventional-fuel additives or alternatives generated from biological sources. Ethanol is often blended with gasoline, or it can be used as an alternative to gasoline in appropriate vehicles. Biodiesel serves the same purpose with diesel.
7.3.1 EthanolEthanol can be blended with gasoline at low (5–10 percent), intermediate (15–20 percent), or high (≤85 percent) ratios. Since it does not significantly displace gasoline use, low-blend ethanol is not considered an alternative fuel in the United States. Ethanol has a higher octane rating than gasoline and offers some anti-knock benefits

63
OVERVIEW OF INDIA’S VEHICLE EMISSIONS CONTROL PROGRAM
as well, so it has replaced methyl tertiary-butyl ether (MTBE) in the United States to oxygenate gasoline.
Whether ethanol use increases or decreases vehicle emissions depends on the level of ethanol blending and many other conditions. Combustion of E10 (gasoline blended with 10 percent ethanol) emits acetaldehyde, which is toxic to humans. Depending on engine operating conditions, NOX emissions from burning E10 can be higher than those from pure gasoline.25 Furthermore, ethanol at low-blend levels raises the Reid vapor pressure of gasoline, thus worsening evaporative emissions. Taking both tailpipe and evaporative emissions into account, E10 only reduces CO emissions. It increases emissions of HC, nonmethane hydrocarbons (NMHC), formaldehyde, and acetaldehyde, as well as elevat-ing the ozone-forming potential in the atmosphere. [101]
Intermediate ethanol blends do not qualify as alternative fuels in the United States, either. Neither are they treated as legal fuels for conventional engines, unless granted a special waiver. The state of Minnesota is leading the effort to use intermediate blends. Minnesota passed a law in 2005 mandating the use of 20 percent ethanol in the state’s gasoline by 2013. Research on the impact of using intermediate blends of ethanol thus far has not been conclusive. A study sponsored by the Minnesota Department of Agriculture suggests that using E20 will not cause significant problems for engine or fuel-dispensing systems when compared with E10. [102] On the other hand, a literature review conducted by the Australia’s environmental department concluded that burning E20 could increase NOX emissions by 30 percent over E10. The same study also cited increases in evaporative emissions, formaldehyde, and other HC emissions and reduced fuel economy. In terms of life cycle GHG emissions, the study pointed out that E20 was unlikely to be very different from E10. [103]
Looking at high-blend fuels, a 2008 study conducted by U.S. National Renewable Energy Laboratory showed that, on average, emissions of most regulated pollutants either decreased or had no significant change with the use of E85 over pure gasoline. But using E85 increased emissions of formaldehyde, acetaldehyde, and methane. [104]
Lower fuel economy is a significant problem associated with ethanol since ethanol has lower energy content than gasoline. FFVs typically get about 25–30 percent fewer miles per gallon when fueled with E85. [105] In some American states, E85 is seasonally adjusted to E70 to allow for a cold start, though it is still called E85.
7.3.2 BiodieselMany of the advantages and disadvantages of biodiesel are the same as those of etha-nol. Most studies show that biodiesel can reduce tailpipe emissions of HC, CO, and PM, though emissions of ultrafine PM can increase. Biodiesels also reduce emissions of toxic chemicals such as aromatic and polyaromatic compounds. Additionally, biodiesels are sulfur-free, which not only positively affects emissions and after-treatment systems but also reduces engine corrosion. [106]
However, the effect of biodiesel on NOX emissions is unclear. Some studies suggest that NOX emissions increase, while others show that they decrease. [106] Biodiesel also low-ers vehicle fuel economy compared with diesel, similar to ethanol in relation to gasoline.
7.3.3 Life cycle GHG emissions of biofuelsLife cycle CO2 emissions from biofuel use vary greatly. Tailpipe CO2 emissions are lower on a CO2 per gallon basis, but those are offset by the poorer fuel economy of
25 A few studies conducted in the United States concluded that E10 increases NOX. But others argue that NOX emissions strongly depend on the fuel/air ratio, implying that engine optimization for E10 could decrease emissions.

64
INTERNATIONAL COUNCIL ON CLEAN TRANSPORTATION
biofuels compared with gasoline and diesel. The result is that tailpipe CO2 emissions per megajoule of energy are essentially the same. Upstream, biofuels can be produced in various ways. Ethanol can be extracted from a by-product in petroleum refining (mainly for industrial use). However, the common practice worldwide is to make ethanol through fermentation and distillation of feedstocks such as corn (in the United States), sugar-cane (in Brazil), or aged grain stock or cassava (in China). Biodiesels, too, are mostly generated from crops. There are technologies to convert nonfood feedstock like algae, cellulosic fibers, or animal or yard waste into ethanol, but currently none of them can be economically scaled up for mass production. The type of feedstock used and processing methods for biofuels have a significant effect on GHG emissions.
There are also GHG emissions attributable to indirect land-use change (ILUC). [107] The growing demand for biofuels can induce the conversion of croplands used for food into lands for biofuel feedstock. The resulting drop in food production and higher food prices can prompt farmers to convert rainforests or grasslands into new farms, which will release CO2 stored in the original plant life and soil and impair the ability of those plots to sequester CO2 in the future. The conversion of virgin lands to cropland causes significant environmental and social harm well beyond increased GHG emissions, such as attenuating biodiversity, degrading soil and water quality, and potentially impoverishing local communities. Higher fuel prices can also increase worldwide food insecurity. While the “food versus fuel” debate has been controversial, it is generally agreed that biofuel mandates will have a negative overall impact on general welfare, even with increased farm revenues taken into account. When developing policies regarding biofuels, policy-makers need to consider all the consequences of biofuels for life cycle GHG emissions, including emissions due to ILUC.
7.3.4 International experienceThe United States and Brazil dominate the world’s ethanol fuel market—together, these countries produce and consume nearly 90 percent of all ethanol fuel. In the United States, more than 90 percent of gasoline is an E10 blend. [108] Some states and cities even mandate the use of E10. The United States also has about 8 million FFVs on the road that can run either on pure gasoline or any gasoline-ethanol blend up to E85. These are most common in the Midwestern states, where most of the nation’s corn is produced. Nevertheless, the number of E85 vehicles on American roads is relatively low, on the order of 8 million out of a total vehicle stock of around 260 million. This may be because of faltering momentum in support of biofuel vehicles in the United States and elsewhere.
Political support for ethanol-fueled vehicles in the United States dates back to the 1970s. The Alternative Motor Fuels Act of 1988 established vehicle manufacturer incentives in the form of Corporate Average Fuel Economy (CAFE) credits, with which manufactur-ers could meet a less stringent fleet-average fuel economy target by producing FFVs. Ethanol was also heavily subsidized, given that producing fuel from corn is expensive, especially when compared with Brazilian sugarcane ethanol. One study found that in 2006 total corn ethanol subsidies amounted to more than $5 billion. [91] In 2004, the American Jobs Creation Act created the Volumetric Ethanol Excise Tax Credit, which gave fuel blenders and marketers a $0.45 tax credit for each gallon of ethanol blended into gasoline. This credit expired at the end of 2011. [109]
Despite the fact that some American vehicles can run on E85, most are actually not doing so. There are three major reasons for this. First, the initial CAFE FFV credit program did not require proof of alternative fuel use until its recent revision in 2007. Second, while sales of FFVs grew, they never became predominant. Perhaps because of this, ethanol refueling infrastructure also lagged behind. In 2010, there were about only 2,000 filling stations selling E85, most of them in the Midwestern states, while the entire United States had more than 121,000 gasoline fueling stations. [110] Last, FFV owners

65
OVERVIEW OF INDIA’S VEHICLE EMISSIONS CONTROL PROGRAM
often do not refuel with E85, even knowing that they can. This might be because of the 28 percent lower energy density of E85. An average driver who could go 300 kilometers (186 miles) with a tank of gasoline would have to refuel after just 216 kilometers if the vehicle ran on E85.
Brazil is often cited as a policy model for promoting ethanol fuel. When the world oil crisis hit in the late 1970s, the Brazilian government took early action to reduce its de-pendence on gasoline. Taking advantage from having an expansive sugarcane industry, Brazil began to promote sugarcane ethanol and dedicated ethanol vehicles. To deal with cold-start difficulty, Brazilian engineers built a small tank in the engine compartment that directly injected gasoline to help the car start in cold weather. Aided by large govern-ment subsidies, more than 90 percent of cars sold in Brazil were pure ethanol vehicles (E100) by 1984.
However, when the oil crisis faded and the price of sugar went up, sugarcane cultivators switched back to producing sugar for food. This caused a severe shortage of ethanol supply in the late 1980s, and ethanol-powered car sales almost evaporated. Learning from this lesson, Brazil adopted flexible-fuel technology from the United States start-ing in the 1990s. Brazil has maintained a durable ethanol policy for longer than three decades now, but it relies heavily on financial subsidies.
When considering biofuel targets, both the U.S. government and the state of California have used life cycle analysis, including ILUC effects, to model the potential changes in GHG emissions from increased biofuels use. In April 2009, California approved the world’s first-ever transportation-focused low carbon fuel standard. The standard requires a 10 percent reduction in fuel carbon intensity, considering both direct and indirect GHG emissions, by 2020. In February 2010, the EPA published its new Renewable Fuel Standard (RFS2). The rule imposes both specified GHG cutbacks, requiring a 20 to 60 percent reduction in combined direct and indirect GHG emissions, depending on the fuel category, and a set of volumetric targets for various renewable fuel supplies. For example, renewable fuels defined by RSF2 must cut GHG emissions by 20 percent compared with conventional fuels at new production plants.26 According to the final rule, the total volumetric target for renewable fuels for 2010 was 12.95 billion gallons. This is supposed to be increased to 36 billion gallons by 2022. [111]
The EPA, California’s Air Resources Board, and the European Commission have identified several feedstocks and pathways that can produce renewable fuels on an ecologically sound basis. The highest GHG emissions reduction potential comes from producing biofuel from switchgrass via a biochemical process. Figure 7.3.1 shows the EPA’s results for GHG emissions, including ILUC effects, for various feedstocks and pathways. [65, 112, 113]
26 However, the Energy Independence and Security Act of 2007 waived the 20 percent GHG reduction requirement for almost all the existing corn ethanol produced in the United States. About 9.6 billion gallons of corn ethanol were produced in the United States in 2009.

66
INTERNATIONAL COUNCIL ON CLEAN TRANSPORTATION
130
110
90
70
50
30
10
-10
-30
Car
bo
n in
tens
ity
(gC
O2e
MJ)
Pal
m
Can
ola
Soy
Sw
itch
gra
ss
Sug
arca
ne
Mai
ze
Mid
wes
t so
ybea
ns
Use
d c
oo
king
oil
Sug
arca
ne
Cal
ifo
rnia
mai
ze
Mid
wes
tern
mai
ze
FT
die
sel f
rom
was
te w
oo
d
Sun
flo
wer
oil
Rap
esee
d o
il
Soy
oil
Pal
m o
il
Eth
ano
l fro
mw
aste
wo
od
Sug
arca
ne
Sug
ar b
eet
Co
rn (
mai
ze)
Whe
at
BIODIESEL
EPA
ETHANOL BIODIESEL ETHANOL BIODIESEL ETHANOL
CARB European Commission
ILUC Indirect agricultural emissions Direct emissions
Fossil fuel comparator 50% saving
Figure 7.3.1: Life cycle GHG estimates of various feedstocks and pathways
The European Union is also considering an indirect land-use impact analysis in the next revision of its Renewable Fuels Directive. Table 7.3.1 briefly compares renewable, or low-carbon, fuel standards in various countries.

67
OVERVIEW OF INDIA’S VEHICLE EMISSIONS CONTROL PROGRAM
Table 7.3.1: World’s transportation-related renewable or low-carbon fuel standards
Features US—RFS2
California—Low-Carbon
Fuel Standard
EU—Fuel Quality
Directive
EU—Renewable Energy
Directive
UK—Renewable Transport Fuel
Obligation
Baseline fuels Diesel and gasoline
Reformulated gasoline and 10% corn ethanol, diesel
Diesel and gasoline
Diesel and gasoline
Diesel and gasoline
Targets
36 billion gallons of biofuels by 2022; GHG emission reduction of 5.6%
6% (extra 4% optional) reduction in GHG emissions by 2020
10% reduction in GHG emissions by 2020 (6% mandatory)
10% of biofuels (energy content)
5% of biofuels (energy content) by 2013/2014, GHG emission reduction of 1.90%
Compliance pathways
Cellulosic ethanol, advanced biofuel, renewable biofuel
Biofuels, LPG, natural gas, electricity, hydrogen
Biofuels, reductions in flaring and venting, carbon sequestration and capture
Biofuels Sustainable biofuels
GHG emissions from ILUC
Proposed but uncertain Included Pending
decision None
Brazilian sugarcane ethanol is considered an advanced biofuel under the RSF2 because of its estimated 61 percent reduction in GHG emissions, including indirect land-use change emissions.27 Thanks in part to a favorable climate for sugarcane cultivation, Brazil’s ethanol production is highly efficient. This could be difficult to replicate else-where in the world.
China is now the world’s third-largest producer of ethanol, with a yield of 542 million gallons in 2009. [114] The main feedstocks for ethanol in China are aged grain stock, cassava, and sweet potato. Biofuel production was first undertaken on a large scale in China in 2001, when the central government saw ethanol as a way to reduce the country’s aged corn stocks. Four grain ethanol plants were set up with an annual production capacity of 350 million gallons. The government provided a subsidy similar to U.S. corn ethanol subsidies to these plants.
Currently, ethanol is blended into gasoline at 10 percent by volume in 10 provinces. While the four grain ethanol plants continue to operate, the Chinese government has recognized the limitations of grain-based ethanol. In 2008, it decided to promote non-grain-based ethanol production. This resulted in ground being broken for a large ethanol plant in Guangxi province that uses imported cassava as a feedstock. That plant is now in operation, and another one is under construction. In addition to this, several small-scale pilot cellulosic ethanol plants have been constructed in China.
Beyond ethanol and biodiesel production, China is unique in its support for methanol as a vehicle fuel. In March 2012, it announced trial runs of methanol-powered vehicles in the northern provinces of Shanxi and Shaanxi and in Shanghai. The drive to use methanol as a vehicle fuel has much to do with its significantly lower cost and higher availability in China with respect to gasoline. [115]
7.3.5 India’s experienceIn 2003, nine states and four union territories made E5 gasoline available for the first time in India. These were Andhra Pradesh, Daman and Diu, Goa, Dadra and Nagar
27 In the RFS2, “advanced biofuels” are defined as any biofuel offering a carbon reduction of 50 percent or more.

68
INTERNATIONAL COUNCIL ON CLEAN TRANSPORTATION
Haveli, Gujarat, Chandigarh, Haryana, Pondicherry, Karnataka, Maharashtra, Punjab, Tamil Nadu, and Uttar Pradesh. In October 2008, E10 was mandated throughout the country. [17]
Most of the ethanol produced in India uses sugarcane molasses as a feedstock. India is almost Brazil’s equal in terms of sugarcane production, which gives the country the advantage of being able to assess for its own needs Brazil’s experiences in adapting its vehicle fleet to run on ethanol.
India is working to expand the country’s ethanol production capability and increase the use of ethanol as a fuel. Reasons for doing so include the availability of sugarcane and other feedstocks in India and the potential boost to poor farmers from the resulting increase in the sugarcane price. In 2008, the government approved a policy that seeks to mandate 20 percent blending of biofuels into gasoline and diesel throughout the country by 2017. [116] Despite the mandate, though, India is experiencing difficulties in increasing ethanol and biofuel production because of insufficient feedstock produc-tion. [117]
Biodiesel is an up-and-coming fuel in India. Although currently there are no require-ments for biodiesel blending in conventional diesel, the biofuel policy of 2008 targets a minimum of 20 percent biodiesel-blended diesel by 2017.
Biodiesel in India is mostly rendered from animal fat and waste oil. [118] Over the past few years, there has been a strong push to increase biodiesel from jatropha, the seeds of which naturally produce inedible vegetable oil. Jatropha has the advantage that it can be grown on relatively infertile “wastelands,” which means that its cultivation could increase economic activity without affecting food production.
But despite high hopes, jatropha cultivation has fallen somewhat short of expectations. Yields are often lower than expected, especially when using marginal rather than prime agricultural land. This makes the crop less appealing to farmers. [119] Jatropha also has a long gestation period (about three to four years before it produces seed), which translates into high capital costs and increased risk for farmers. The failure of the jatropha initiative to deliver has left large numbers of farmers in the developing world in a difficult situation. There have also been problems in the implementation of large-scale jatropha cultivation projects because jatropha has not traditionally been viewed as a plantation crop in India. As a result, many farmers are unsure about the govern-ment’s policies to scale up jatropha production. [120] Moreover, the “wastelands” on which jatropha is cultivated often have other economic uses, implying that jatropha production can have land-use impacts after all. [121] Further, there are other plants and trees in India that might yield biodiesel more efficiently than jatropha, though research on this issue is still needed. [122]
As a result of the lower than expected yields, the Ministry of Rural Development has canceled plans to expand jatropha cultivation onto new lands. This came after a government-sponsored study by The Energy and Resources Institute (TERI) released a negative assessment of the crop in India. [123]

69
OVERVIEW OF INDIA’S VEHICLE EMISSIONS CONTROL PROGRAM
7.3.6 Summary and recommendationsTable 7.3.2 summarizes the advantages and disadvantages of biofuel use in vehicles.
Table 7.3.2: Summary of advantages and disadvantages of biofuel use in vehicles
ADVANTAGES DISADVANTAGES
• Displaces fossil fuel • Corrosive, especially at a high blend, and requires specially designed tanks and fuel lines
• Can be produced from renewable and low-carbon feedstocks by energy-efficient pathways. Such low-carbon ethanol fuel can reduce life cycle GHG emissions
• High-blend ethanol requires separate supply infrastructure
• NOX may increase, but this also depends on engine condition
• Increased emissions of acetaldehyde
• E10 may emit more regulated exhaust gases from evaporation and running loss
• Cold-start difficulty with E100
• Lower fuel economy and shorter range than conventional-fuel vehicles
• Potential negative effects on food production
In the Indian context, biofuels represent the ability to reduce the country’s dependence on foreign oil. Currently, it imports nearly 70 percent of its crude oil, [124] which is a cost burden that hampers economic activity within the country and makes it reliant on others.
But the advantages of biofuels must be weighed against the disadvantages. These include unintended effects on food production and costs and potentially harmful impacts on land use and biodiversity. For example, while India produces large amounts of sugarcane, policymakers must consider the overall effects of diverting some of that crop from food production to ethanol. Policymakers must take into account changes in the country’s agricultural outlook, food prices, and new lands that must be cultivated as a result of increased sugarcane cultivation, or of the cultivation of the crops sugarcane displaces. Studies and models have shown that biofuel policies have far-reaching effects and that reductions in GHG emissions may not be as high as initially expected when all of these effects are considered. [125]
7.4 NEW ENERGY VEHICLESIn this section, four vehicle types are considered: conventional hybrid electric vehicles, plug-in hybrid electric vehicles, battery electric vehicles, and hydrogen fuel cell electric vehicles. This section also surveys international experiences in develop-ing and deploying new energy vehicles. Given the similar characteristics of certain new energy vehicles (for example, BEVs and FCEVs), they may at times be grouped together for discussion.
HEVs and PHEVs combine an internal combustion engine, a battery, and an electric motor. HEV technologies can achieve a 30–70 percent increase in fuel efficiency over conventional vehicles, depending on the technology used, the degree of hybridization, and driving patterns. Unlike the other three new energy vehicle types, HEVs are not entirely electric-drive because vehicle propulsion still relies, at least partly, on the conventional engine. Unlike PHEVs and BEVs, HEVs do not require an electric recharging

70
INTERNATIONAL COUNCIL ON CLEAN TRANSPORTATION
infrastructure. BEVs (and some PHEVs) operate entirely on electric mode, meaning that they require no conventional fuel at all. On the other hand, the batteries in these vehicles must be recharged, which requires the development of recharging infrastructure.
Large-scale deployment of FCEVs and BEVs can greatly improve air quality in urban areas, as there are no tailpipe emissions. The same is true for PHEVs operating only in electric mode. Having zero tailpipe emissions also means that in-use emissions testing programs can be done away with. This is especially true for FCEVs and BEVs, which have zero tailpipe emissions throughout their useful life.
Looking at range, FCEVs can travel farther than BEVs on a “tank” of fuel. They can also beat out HEVs, though this depends on a vehicle’s engine configuration and fuel economy. Therefore, FCEVs are best suited for vehicles that traverse long distances. To date, FCEVs generally have batteries in addition to the fuel cell. Because of this, they take advantage of regenerative braking to increase their range, like BEVs and HEVs.
Despite the zero tailpipe emissions about which many new energy vehicles can boast, ramping up electricity and hydrogen generation for them can increase upstream emis-sions, although this depends on the production process used. Hydrogen can be obtained from fossil fuels or biomass or through the electrolysis of water. The diversity of produc-tion processes means that upstream emissions can vary greatly.
As with hydrogen, electricity generation can come from a variety of sources. Life cycle emissions for electric vehicles depend on a region’s electric grid. For example, a study showed that, for the U.S. grid as currently structured, replacing a conventional vehicle with a BEV could reduce life cycle volatile organic compounds, CO, sulfur oxides (SOX), NOX, and PM emissions by 100 percent, 100 percent, 75 percent, 69 percent, and 31 percent, respectively, in urban areas. [126] But in rural areas, the study pointed out that BEVs may increase power plant emissions of certain pollutants (SOX, NOX, and PM); this is because power plants are usually located away from cities.
Life cycle GHG emissions of BEVs would be 19 percent lower than an equivalent gasoline vehicle in an area with the typical U.S. mix of generating sources for the electric grid. But in a state like California, which uses much more renewable energy and relatively less carbon-intensive gas-fired power plants, the same shift to BEVs could reduce life cycle GHG emissions by 74 percent. [127] Conversely, in regions where most power generation is provided by carbon-intensive fossil-fuel-based power plants, life cycle GHG emissions resulting from switching to BEVs over gasoline vehicles could actually increase. However, this might change with time if renewable energy sources replaced fossil-fuel-based power plants.
The development of FCEVs and BEVs still faces economic and technological challenges. Processes for extracting hydrogen fuel for FCEVs from renewable sources are still under development and will remain expensive in the near future. In addition, on-board hydro-gen storage technologies, especially for light-duty vehicles, continue to be prohibitively costly for the consumer market.
BEVs need to overcome technological obstacles in terms of battery capacity and costs. Although low-capacity batteries may be sufficient to operate cars in cities, with their short driving ranges and low maximum speeds, they still cannot compete with the 300-plus miles per tank offered by conventional vehicles. But battery technology is improving rapidly, and many range restrictions for BEVs may be overcome in the future. [128]
If large-scale deployment of new energy vehicles happens, existing regulations, focused on internal combustion engines, must be modified to account for the new technologies’ distinct features. Changes called for would be the redetermination of fuel (or energy)

71
OVERVIEW OF INDIA’S VEHICLE EMISSIONS CONTROL PROGRAM
efficiency standards, emissions standards that account for well-to-wheel emissions, and safety standards adapted to the electric propulsion system. Electric vehicles will require new standards for recharging systems and battery recycling.
Lack of a recharging infrastructure could be an initial barrier to widespread adoption of BEV and FCEV vehicles. But it should be noted that, while building an adequate infrastructure will require significant investment, maintaining the existing infrastructure for gasoline and diesel is also costly and demands vast resources.
7.4.1 International experience and policiesThe state of California was the first in the United States to promote electric vehicles in the 1990s. This was done as part of the zero-emission vehicle (ZEV) mandate in accordance with low-emission vehicle regulations to improve air quality. Recently, California has broadened the rationale to include energy diversity and GHG concerns. The state is setting a target of 14.4 percent of auto sales being ZEVs by 2025 and 80 percent by 2050.
The United States as a whole, driven mainly by energy security concerns, accommodates electric vehicles in the EPA’s list of certified alternative-fuel vehicles. The country began to provide tax incentives to consumers for purchases of new HEVs, BEVs, and FCEVs under the Energy Policy (EP) Act of 2005. The Energy Independence and Security Act (EISA) of 2007 extended the tax credits to PHEVs. Under the American Recovery and Reinvestment Act of 2009, low-speed neighborhood electric vehicles were also added. Table 7.4.1 details the U.S. tax incentives for electric vehicles. The United States also provides grants to support research and development of electric vehicles, as well as parts and infrastructure.
Table 7.4.1: Summary of U.S. alternative-fuel tax credit programs
VEHICLE TYPE TAX CREDIT PROGRAMS [106] LEGISLATION
HEV
Light-duty vehicle (≤ 8,500 lb GVWR)Amount of credit varies from $650 to $3,400, depending on fuel-efficiency gains and lifetime gasoline saved compared to vehicles of the same weight class. Phased out after 60,000 sales per manufacturer Energy Policy Act
(2005)Mid- to heavy-duty vehicles (>8,500 lb GVWR)Amount of credit is based on incremental cost limitations:• <14,001 GVWR: $7,500• 14,001–26,000 GVWR: $15,000• 26,001+ GVWR: $30,000
FCV
Light-duty vehicle (≤ 8,500 lb GVWR)$8,000 if purchased before 2010; $4,000 after 2010 Energy Policy Act
(2005)Mid- to heavy-duty vehicles (>8,500 lb GVWR)Amount is determined by vehicle weight
PHEV
Light- and medium-duty vehicles (≤14,000 lb GVWR)Qualified vehicles purchased in or after 2010 meeting a certain emission standards receive a $2500 base tax credit. An extra $417 tax credit is given for each 5 kW-hours of power the vehicle’s engine draws entirely from the battery. The credits will be phased out after the first 200,000 sales per manufacturer [107]
Energy Independence and Security Act (2007)
BEV
Battery electric vehicles (EVs) purchased in or after 2010 may be eligible for a federal income tax credit of up to $7,500. The credit amount will vary based on the capacity of the battery used to fuel the vehicle
Energy Independence and Security Act (2007)
LS EV 10% of the cost of qualified low-speed electric vehicles, electric 2- and 3-wheelers, up to $2,500, expires 2011
American Recovery and Reinvestment Act (2009)

72
INTERNATIONAL COUNCIL ON CLEAN TRANSPORTATION
In his 2003 State of Union speech, President George W. Bush expressed strong sup-port to FCEVs. But President Barack Obama has not signaled the same support for hydrogen-powered vehicles. In 2009, President Obama announced a target of putting a million environmentally friendly vehicles on U.S. roads by 2015. The state of California has established a goal of reducing vehicular GHG emissions by 80 percent by 2050. To meet this goal, California is currently analyzing various scenarios involving new energy vehicles in the near and long term to see what strategies would work best. [131]
Increasingly, programs are being created outside the United States to encourage HEVs and electric-drive vehicles. In many cases, the incentives are technology-specific, meaning that as long as a vehicle is a HEV or BEV it will be deemed eligible. In other cases, the incentive is tied to the emissions reduction potential of a vehicle. For example, in France, the subsidy for various electric-drive vehicles is integrated into a CO2-based bonus-malus system that applies to light-duty vehicles of all fuel types. This means that a subsidy of 5,000 euros is available only to vehicles with tailpipe emissions of less than 60 grams of CO2 per kilometer. Table 7.4.2 lists incentives for the purchase of electric vehicles in select European countries and Japan. [132, 133]
Table 7.4.2: Consumer incentives for purchasing electric vehicles in Europe and Japan
Country Consumer Incentives
France
Under a CO2-based bonus-malus system, a subsidy of up to €5,000 is provided to low CO2 emissions (below 60g/km) vehicles including various electric-drive vehicles. The government is also planning to exempt electric vehicles from parking fees.
Germany Electric vehicles are exempt from an annual circulation tax for the first five years after purchase.
United Kingdom
Private electric vehicles are exempt from an annual circulation tax. Company electric vehicles are exempt from the tax for the first 5 years after purchase. From 2011, BEV and PHEV buyers will get 25 percent off the list vehicle price up to a maximum of £5,000.
JapanBEVs, HEVs, and PHEVs are exempt from an acquisition tax and annual tonnage tax if they meet certain fuel economy and emissions standards.
Denmark 200 percent sales tax on new conventional fuel vehicles. But no tax on electric vehicles. This incentivizes the sales of electric vehicles.
China in late 2008 announced its Auto Industry Adjustment and Revitalization Plan, which asserted that new energy vehicles would be the key to China’s long-term industrial strategy. It also aimed to make China’s automakers world leaders in the development of electric vehicles.
Building on that, the Ministry of Science and Technology launched a large-scale pilot program in December 2009 called “10 Cities, 1000 Vehicles.” In July 2010, the program selected 25 additional cities for public new energy vehicle deployment and five for private new energy vehicle deployment. The program plans to introduce at least 1,000 new energy vehicles per year in each city, primarily by providing financial subsidies for their purchase. Subsidy amounts vary according to fuel efficiency improvements, the type of technology used, and cost differences between a new energy vehicle and a comparable conventional vehicle. Table 7.4.3 shows the current amount of subsidies for various types of vehicles.
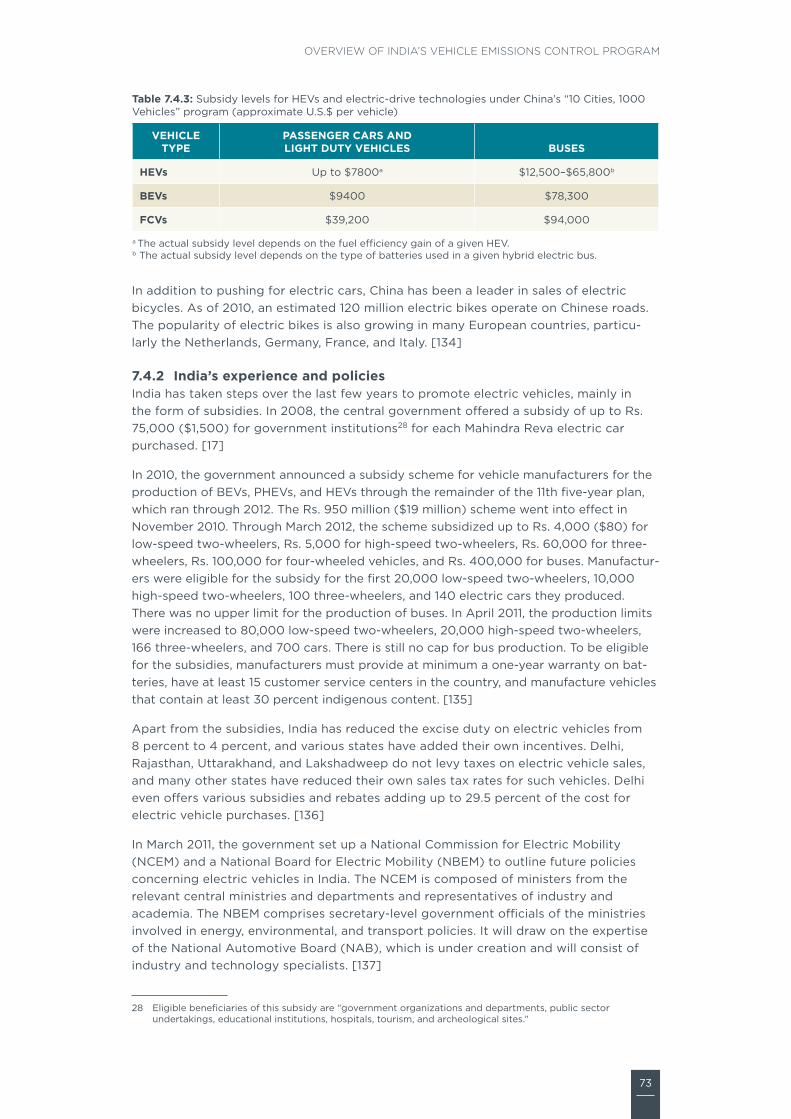
73
OVERVIEW OF INDIA’S VEHICLE EMISSIONS CONTROL PROGRAM
Table 7.4.3: Subsidy levels for HEVs and electric-drive technologies under China’s “10 Cities, 1000 Vehicles” program (approximate U.S.$ per vehicle)
VEHICLE TYPE
PASSENGER CARS AND LIGHT DUTY VEHICLES BUSES
HEVs Up to $7800a $12,500–$65,800b
BEVs $9400 $78,300
FCVs $39,200 $94,000
a The actual subsidy level depends on the fuel efficiency gain of a given HEV.b The actual subsidy level depends on the type of batteries used in a given hybrid electric bus.
In addition to pushing for electric cars, China has been a leader in sales of electric bicycles. As of 2010, an estimated 120 million electric bikes operate on Chinese roads. The popularity of electric bikes is also growing in many European countries, particu-larly the Netherlands, Germany, France, and Italy. [134]
7.4.2 India’s experience and policiesIndia has taken steps over the last few years to promote electric vehicles, mainly in the form of subsidies. In 2008, the central government offered a subsidy of up to Rs. 75,000 ($1,500) for government institutions28 for each Mahindra Reva electric car purchased. [17]
In 2010, the government announced a subsidy scheme for vehicle manufacturers for the production of BEVs, PHEVs, and HEVs through the remainder of the 11th five-year plan, which ran through 2012. The Rs. 950 million ($19 million) scheme went into effect in November 2010. Through March 2012, the scheme subsidized up to Rs. 4,000 ($80) for low-speed two-wheelers, Rs. 5,000 for high-speed two-wheelers, Rs. 60,000 for three-wheelers, Rs. 100,000 for four-wheeled vehicles, and Rs. 400,000 for buses. Manufactur-ers were eligible for the subsidy for the first 20,000 low-speed two-wheelers, 10,000 high-speed two-wheelers, 100 three-wheelers, and 140 electric cars they produced. There was no upper limit for the production of buses. In April 2011, the production limits were increased to 80,000 low-speed two-wheelers, 20,000 high-speed two-wheelers, 166 three-wheelers, and 700 cars. There is still no cap for bus production. To be eligible for the subsidies, manufacturers must provide at minimum a one-year warranty on bat-teries, have at least 15 customer service centers in the country, and manufacture vehicles that contain at least 30 percent indigenous content. [135]
Apart from the subsidies, India has reduced the excise duty on electric vehicles from 8 percent to 4 percent, and various states have added their own incentives. Delhi, Rajasthan, Uttarakhand, and Lakshadweep do not levy taxes on electric vehicle sales, and many other states have reduced their own sales tax rates for such vehicles. Delhi even offers various subsidies and rebates adding up to 29.5 percent of the cost for electric vehicle purchases. [136]
In March 2011, the government set up a National Commission for Electric Mobility (NCEM) and a National Board for Electric Mobility (NBEM) to outline future policies concerning electric vehicles in India. The NCEM is composed of ministers from the relevant central ministries and departments and representatives of industry and academia. The NBEM comprises secretary-level government officials of the ministries involved in energy, environmental, and transport policies. It will draw on the expertise of the National Automotive Board (NAB), which is under creation and will consist of industry and technology specialists. [137]
28 Eligible beneficiaries of this subsidy are “government organizations and departments, public sector undertakings, educational institutions, hospitals, tourism, and archeological sites.”

74
INTERNATIONAL COUNCIL ON CLEAN TRANSPORTATION
In January 2013, India unveiled a National Electric Mobility Mission Plan. This plan anticipates having 7 million electric vehicles on the road by 2020. To achieve this, the central government has pledged to spend Rs. 13,000–14,000 crore29 ($2.6–2.8 billion) over the next eight years. The private sector will spend another Rs. 8,500–9,500 crore ($1.7–1.9 billion) over this period under the plan. [138]
As a result of recent policy initiatives, electric vehicle sales are expected to rise. Many companies have expressed an increasing interest in marketing the cars and trucks in India. However, future trends are difficult to predict, since promotional policies went into effect only recently. For the time being, electric vehicle sales in India (including HEVs) remain low.
Although India lags behind China and some European countries in sales of electric bicycles, this is expected to change in the near future. Electric bike sales were low in India as late as 2008, but they jumped in the final two years of the past decade, and a number of companies are expecting even higher sales over the next few years. [134, 139–141] Projections of electric bike sales top 700,000 units per year.
In its development and promotion of electric vehicles, the country has to consider their overall impact on emissions and public health. Replacing conventional with electric vehicles means that the country will have to generate extra electricity, which, with India’s current grid, will lead to an increase in conventional pollutant emissions and GHGs. Therefore, turning to renewable sources to generate electricity will be necessary to capture fully the benefits of electric vehicles.
The last point is particularly important if electric bike sales increase significantly. Unlike electric cars, electric bikes may not replace motorized transport but rather walking and pedal-powered biking. In that case, electric bike use could lead to higher overall emissions as coal-fired power plants need to generate more electricity.
29 1 crore = 10 million
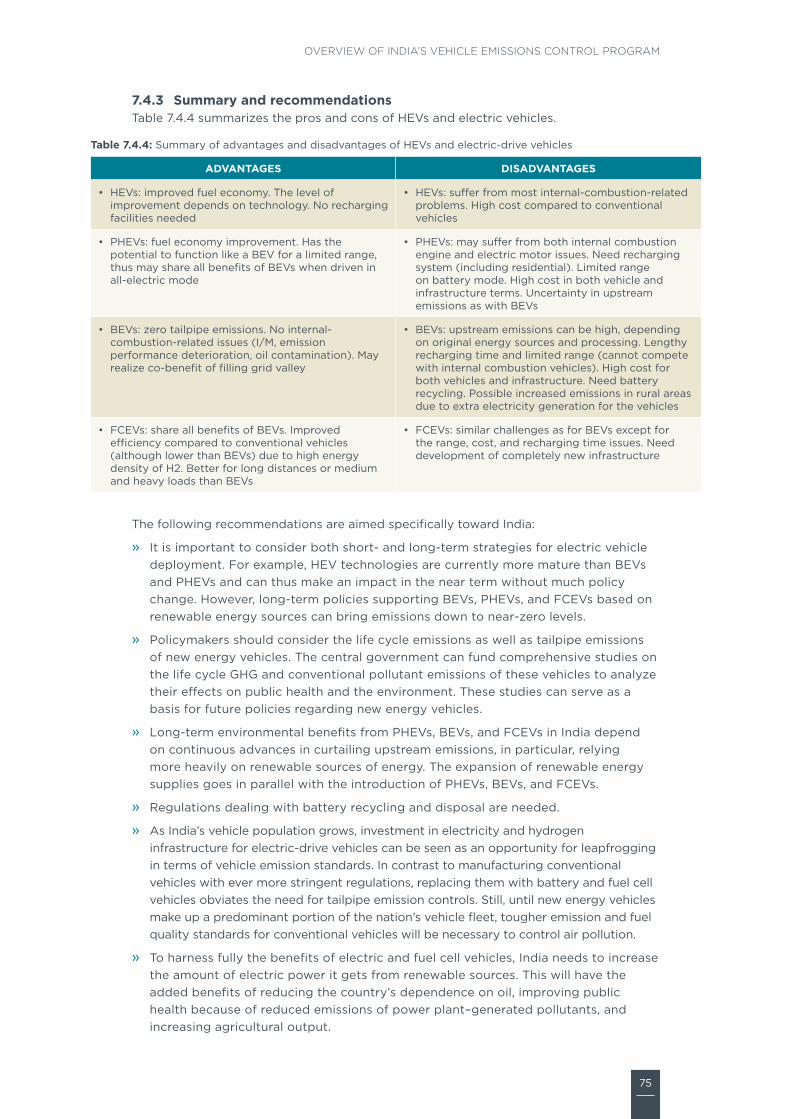
75
OVERVIEW OF INDIA’S VEHICLE EMISSIONS CONTROL PROGRAM
7.4.3 Summary and recommendationsTable 7.4.4 summarizes the pros and cons of HEVs and electric vehicles.
Table 7.4.4: Summary of advantages and disadvantages of HEVs and electric-drive vehicles
ADVANTAGES DISADVANTAGES
• HEVs: improved fuel economy. The level of improvement depends on technology. No recharging facilities needed
• HEVs: suffer from most internal-combustion-related problems. High cost compared to conventional vehicles
• PHEVs: fuel economy improvement. Has the potential to function like a BEV for a limited range, thus may share all benefits of BEVs when driven in all-electric mode
• PHEVs: may suffer from both internal combustion engine and electric motor issues. Need recharging system (including residential). Limited range on battery mode. High cost in both vehicle and infrastructure terms. Uncertainty in upstream emissions as with BEVs
• BEVs: zero tailpipe emissions. No internal-combustion-related issues (I/M, emission performance deterioration, oil contamination). May realize co-benefit of filling grid valley
• BEVs: upstream emissions can be high, depending on original energy sources and processing. Lengthy recharging time and limited range (cannot compete with internal combustion vehicles). High cost for both vehicles and infrastructure. Need battery recycling. Possible increased emissions in rural areas due to extra electricity generation for the vehicles
• FCEVs: share all benefits of BEVs. Improved efficiency compared to conventional vehicles (although lower than BEVs) due to high energy density of H2. Better for long distances or medium and heavy loads than BEVs
• FCEVs: similar challenges as for BEVs except for the range, cost, and recharging time issues. Need development of completely new infrastructure
The following recommendations are aimed specifically toward India:
» It is important to consider both short- and long-term strategies for electric vehicle deployment. For example, HEV technologies are currently more mature than BEVs and PHEVs and can thus make an impact in the near term without much policy change. However, long-term policies supporting BEVs, PHEVs, and FCEVs based on renewable energy sources can bring emissions down to near-zero levels.
» Policymakers should consider the life cycle emissions as well as tailpipe emissions of new energy vehicles. The central government can fund comprehensive studies on the life cycle GHG and conventional pollutant emissions of these vehicles to analyze their effects on public health and the environment. These studies can serve as a basis for future policies regarding new energy vehicles.
» Long-term environmental benefits from PHEVs, BEVs, and FCEVs in India depend on continuous advances in curtailing upstream emissions, in particular, relying more heavily on renewable sources of energy. The expansion of renewable energy supplies goes in parallel with the introduction of PHEVs, BEVs, and FCEVs.
» Regulations dealing with battery recycling and disposal are needed.
» As India’s vehicle population grows, investment in electricity and hydrogen infrastructure for electric-drive vehicles can be seen as an opportunity for leapfrogging in terms of vehicle emission standards. In contrast to manufacturing conventional vehicles with ever more stringent regulations, replacing them with battery and fuel cell vehicles obviates the need for tailpipe emission controls. Still, until new energy vehicles make up a predominant portion of the nation’s vehicle fleet, tougher emission and fuel quality standards for conventional vehicles will be necessary to control air pollution.
» To harness fully the benefits of electric and fuel cell vehicles, India needs to increase the amount of electric power it gets from renewable sources. This will have the added benefits of reducing the country’s dependence on oil, improving public health because of reduced emissions of power plant–generated pollutants, and increasing agricultural output.

76
INTERNATIONAL COUNCIL ON CLEAN TRANSPORTATION
8 FUEL EFFICIENCY AND GREENHOUSE GAS PROGRAMS
Driven by concerns about energy independence and global warming, countries around the world have adopted or proposed vehicle fuel economy or greenhouse gas (GHG) emission standards. Europe, the United States, China, Japan, South Korea, and Canada have all been leaders in this area.
India, too, has recently started a process to set national fuel consumption standards. It is currently the world’s fourth-largest consumer of oil. In 1996, India’s oil imports exceeded its domestic production for the first time in the country’s history. In 2011, India produced about 782,000 barrels of oil per day, while it consumed nearly 3.3 million barrels per day, meaning that about 2.35 million barrels of oil used every day were imported. [142]
A major driver of the increase in India’s oil consumption is the rapidly growing transpor-tation sector. Looking ahead, the gap between domestic oil production and imports will grow even larger if transportation-related fuel use continues to expand at current rates.
8.1 VEHICLE EFFICIENCY STANDARDS VERSUS GHG EMISSION STANDARDS
Throughout the world, countries have generally taken one of two approaches to this class of standards: 1) those for vehicle efficiency and 2) those relating to GHG emissions. Vehicle efficiency policies include fuel economy standards, measured by distance traveled per unit of fuel, or fuel consumption standards, measured by amount of fuel used for a given distance of travel. GHG emission standards may narrowly refer to carbon dioxide emissions directly from combustion or to a suite of GHGs (such as CO2, methane, hydrofluorocar-bons, and nitrous oxide) emitted from an operating vehicle or its accessories.
Although the two types of regulations are related to one another, policymakers must take into consideration the difference between fuel efficiency and GHG emission standards. They are only interchangeable if the whole fleet relies on a single type of fuel. When there are multiple fueling options in the market, a fuel consumption requirement may not translate into same CO2 impact from vehicle tailpipe emissions, given the differing carbon content of various fuels. Furthermore, upstream CO2 emissions from producing different fuels vary.
A GHG emission standard builds in compliance flexibility by taking into account non-engine technology improvements. For example, operating an air conditioning system places an additional load on the vehicle engine, raising fuel consumption and therefore CO2 emissions as well. Extra emissions resulting from such loads can be reduced by designs that increase air conditioning efficiency or that use low-emission refrigerants.
8.2 WEIGHT-BASED VERSUS SIZE-BASED REGULATIONSGHG emission and fuel efficiency standards generally have variations according to vehicle attributes. This allows for further flexibility since different types of vehicles have varying emissions and fuel use rates.
The United States bases its standards on vehicle size. The chosen metric is vehicle “footprint,” defined as the area between the tires (wheelbase multiplied by track width). On the other hand, the European Union, Japan, China, and South Korea have all adopted weight-based standards.
One major flaw of a weight-based system is that there is no regulatory incentive for manufacturers to reduce vehicle mass since doing so is bound to be “rewarded” with a

77
OVERVIEW OF INDIA’S VEHICLE EMISSIONS CONTROL PROGRAM
more stringent standard. To the contrary, weight-based standards give manufacturers an inducement to up-weight their fleet in order to qualify for more lenient standards. They penalize manufacturers that use advanced technologies to minimize vehicle mass for the sake of improved fuel efficiency.
An ideal standard would be structured to encourage all fuel-efficient technologies (including improved powertrain designs, engine downsizing, and lightweight materials), while at the same time allowing vehicle brands to be produced across the entire range of sizes typical for the targeted market segment.
The U.S.-style size-based standard has all these advantages. It rewards the use of fuel-efficient technology and lightweight materials while punishing the up-weighting of vehicles that is directly responsible for higher fuel consumption. It discourages pursuing bigger engines and higher performance at the expense of fuel efficiency. Additionally, size-based standards reduce the chances of manufacturer “cheating,” by installing big bumpers, for example, that increase weight, allowing the vehicle to qualify for more lenient standards in a weight-based system.
8.3 INTERNATIONAL LDV STANDARDSThis section reviews current and proposed fuel economy or GHG emission standards around the world. Though many countries have regulations on the books, the focus here is on the United States, the EU, and China, as those three markets together account for the overwhelming share of the world’s automobile production and sales. Figure 8.3.1 shows trends in light-duty vehicle (LDV) GHG emission standards (or estimated equiva-lents) in various countries.30
US 2025[2]:109Canada 2025: 109
EU 2020: 95
Japan 2020: 105
China 2020[1]: 117S. Korea 2015: 153
India 2021: 113
Mexico 2016: 169
0
20
40
60
80
100
120
140
160
180
200
220
240
260
280
2000 2005 2010 2015 2020 2025
Gra
ms
CO
2 p
er K
ilom
eter
no
rmal
ized
to
NE
DC
Tes
t C
ycle
[1] China’s target reflects gasoline vehicles only. The target may be higher after new energy vehicles are considered. [2] US, Canada, and Mexico light-duty vehicles include light-commercial vehicles. [3] Supporting data can be found at: http://www.theicct.org/info-tools/global-passenger-vehicle-standards
historical performance
enacted targets
proposed targets or targets under study
Figure 8.3.1: Past and proposed LDV GHG emission standards in various countries
30 The latest updates on the status of passenger vehicle fuel efficiency standards can be found at http://www.theicct.org/global-passenger-vehicle-standards-update

78
INTERNATIONAL COUNCIL ON CLEAN TRANSPORTATION
8.3.1 The United StatesFor decades, the primary motivation for U.S. fuel economy regulations was energy security. In recent years, climate change has become a concern as well. On April 1, 2010, the U.S. Envi-ronmental Protection Agency (EPA) and the Department of Transportation (DOT) finalized a new joint regulation covering GHG emissions and fuel economy for model-years 2012–2016 light-duty vehicles (including passenger cars and light trucks). In the regulations, the EPA established the country’s first national GHG emissions standards under the Clean Air Act, and the DOT updated the Corporate Average Fuel Economy (CAFE) standards under the Energy Policy and Conservation Act. In accordance with these standards, the average LDV GHG emission rate will be reduced from 342 grams of CO2–equivalent per mile in 2008 to 250 gCO2e/mile in 2016. Fuel economy will increase from an average of 26 miles per gallon (11.05 kilometers per liter) to 34.1 miles per gallon (14.5 km/L) during this period. Addition-ally, the United States extended CAFE standards for LDVs to 2025. LDVs will be required to meet a fleet-average fuel economy standard of 54.5 miles per gallon (23.17 km/L) by that year. Some leniency in that standard will be allowed through credits for enhancements in air conditioning technology and other areas that reduce GHG emissions.
Following the DOT fuel economy standard framework, CAFE rules set separate numerical standards for vehicle size or “footprint” for passenger cars and light trucks. In contrast to the S-shaped, constrained logistical curve previously used, the new system uses piecewise linear functions between vehicle footprint and the test cycle GHG emission rate. This general shape allows for different vehicles sizes to have different standards in the sloped portion but constrains the largest vehicles at the upper bend and incentivizes vehicles below the lower bend. [143]
8.3.2 EuropeIn 1998, the EU signed a voluntary agreement with vehicle manufacturers to reduce LDV CO2 emissions to 140 g/km by 2008. That voluntary target was not met, and at the end of 2008, the EU-wide fleet-average CO2 emission rate was around 159 g/km. The EU then decided on mandatory standards to curb vehicle CO2 emissions. This was carried out in December 2008, when it implemented regulations to reduce CO2 emissions from new passenger cars.
A fleetwide CO2 target was set at 130 g/km (5.2 liters of fuel per 100 kilometers) for model-year 2015 vehicles. The target is to be met through vehicle efficiency technology improvements alone, with additional cuts being achieved through measures such as changes in tire pressure, gearshift indicators, and air conditioning, as well as an increased use of biofuels. A more far-reaching 2020 target of 95 gCO2/km (3.8 L/100 km) was also announced, although the European Commission has not yet finalized pathways to achieve this target.
The European standard for CO2 emissions is a weight-based corporate average. The regulation is grounded in a linear equation used to calculate a specific emissions target for a vehicle, depending on its weight. A broader target for a manufacturer is then calculated by sales-weighting the specific targets of all vehicle models the manufacturer produces. The slope of the linear curve is determined largely by the trend line of the rela-tionship between current weight and CO2 performance fleetwide for manufacturers in the EU but is manipulated to be flatter than the slope of the actual trend line, to reduce incentives to increase vehicle weight. [144]
In October 2009, the European Commission adopted a new CO2 emissions reduction proposal for light commercial vehicles (LCVs). The standard of 175 g/km for new LCVs will fully be implemented by 2017. A long-term target of 147 g/km has been specified for the year 2020. The proposal also uses a weight-based linear curve to calculate a specific target for each vehicle, similar to the regulatory design for passenger LDVs.

79
OVERVIEW OF INDIA’S VEHICLE EMISSIONS CONTROL PROGRAM
In recent years, a movement has emerged in many EU member states to tax vehicles ac-cording to their CO2 emission rates. The idea has become particularly popular since 2007, when the European Commission announced a new EU-wide 2015 CO2 emission target for cars that included fiscal incentives and consumer information programs as part of an integrated approach to reach the target. Nevertheless, countries have not yet actually moved beyond the proposal phase to implement vehicle taxes based on CO2 emissions.
8.3.3 ChinaChina introduced its first national fuel consumption standards for new passenger vehicles in 2005. Three years later, as the second stage, the regulations were made about 10 per-cent more stringent. In August 2009, China proposed an even stricter Phase III standard.
Unlike the corporate average fuel economy or vehicle GHG emissions standards adopted in other parts of the world, the first two phases of the Chinese policy were per vehicle certificate standards. In that type of system, a new vehicle model must meet the mini-mum fuel consumption requirement for its weight class before it can enter the market. Such a compliance scheme, though useful as a quick way to weed out vehicles with outdated technologies, does not encourage manufacturers to adopt state-of-the-art fuel efficiency technologies over time. In the proposed Phase III regulation, China is consider-ing combining per vehicle certification with corporate average performance. So far, a detailed implementation plan has not been released.
Phase I and Phase II standards improved the fuel efficiency of new passenger cars from 9.1 L/100 km in 2002 to 8.1 L/100 km in 2008. [145] According to the China Automotive Technology and Research Center (CATARC), the proposed Phase III standards will reduce average fuel consumption of the new passenger car fleet to 6.9 L/100 km when fully implemented in 2015. This represents a 13 percent improvement in fleetwide fuel efficiency between 2010 and 2015, or a 1.8 percent annual gain over the period.
The projection for 2015 is made by assuming that the current fleet mix by vehicle weight will not change. This may not be correct, however, since cars in China are generally getting larger and heavier.31 Because of this, China’s weight-based fuel consumption standard does not provide any incentive for manufacturers to adopt technologies that reduce automobile mass. As market demand for heavier and higher-performance vehicles rises, fleet-average fuel consumption may not be able to meet the 6.9 L/100 km target.
In 2005, China announced a two-phase fuel consumption standard for LCVs. As with the passenger car standards, the main purpose is to speed up the phase-out of outdated technologies by accelerating the modernization of the fleet. [143]
8.4 INTERNATIONAL HDV STANDARDSThe heavy-duty vehicle (HDV) share of fuel consumption and energy use varies by country. In the United States, HDVs account for about 20 percent of transport sector energy use and GHG emissions, while in China and India, HDVs are the predominant source, account-ing for close to 60 percent. [146] As a result, regulating HDV fuel economy and GHG emission standards will have differing effects on air quality, fuel consumption, and energy use, depending on the country.
Regulating GHG emissions from HDVs differs from the procedures used for LDVs for a number of reasons. LDVs and HDVs are very different types of vehicles, built for distinct uses. HDVs are primarily commercial or service vehicles, and often multiple manufacturers may be involved in the development of the final product. Also, since the use of HDVs is
31 Data from CATARC reveal that the share of models with curb mass below 1,090 kg was 44 percent in 2002, while that ratio dropped to 27 percent in 2006. Source: CATARC (2008).

80
INTERNATIONAL COUNCIL ON CLEAN TRANSPORTATION
linked with freight activity, stakeholders in the HDV sector extend beyond vehicle manu-facturers and owners to include those that contract services as well.
Still, there is a range of well-known technical improvements to reduce HDV fuel consump-tion. A combination of the following improvements can yield significant reductions in fuel consumption (on the order of 30–50 percent, depending on vehicle type): better aerodynamic design, enhanced tire technology, weight reduction, extended idling reduc-tion, refinements to the engine and drivetrain, predictive controls (such as cruise control), behavioral controls (such as driver training), and vehicle speed limiters on certain trucks.
Setting fuel economy or GHG emission standards for HDVs is a more recent regulatory endeavor than for LDVs. Until the mid-2000s, the approach had focused on voluntary best-practice programs connecting fleets with resources to improve their in-use efficiency (such as SmartWay in the United States, FleetSmart in Canada, and Freight Best Practices in the United Kingdom).
Recently, several countries have begun to develop and implement mandatory fuel economy or GHG emission standards for HDVs. Japan adopted the first mandatory HDV fuel economy standards in 2005, followed by the United States in 2011. Canada has proposed standards that are in line with many features of the U.S. rules, and Mexico is actually developing such standards. China has adopted a voluntary industry fuel consumption standard for certain vehicle types and is developing a mandatory standard. In Europe, government efforts have focused on developing a certification procedure that will assign a CO2 emission value to individual heavy-duty vehicles as a complete system, regardless of which firm manufactured which component. Future policy development in Europe will be outlined in the 2013–2014 time frame.
Table 8.4.1 shows the development of HDV fuel economy or GHG emission standards in assorted countries and regions.
Table 8.4.1: The development of HDV fuel economy or GHG emission standards in various regions
Country/ Region
Regulation Type 2010 2011 2012 2013 2014 2015 2016 2017 2018 2019 2020
Japan Fuel economy Phase 1 regulation implemented starting MY 2015
United States
GHG/Fuel efficiency
Standard proposal Final rule
Regulation implemented starting MY 2014
(mandatory DOT program starts MY 2016)
Phase 2 Phase 2 imple-mentation
China Fuel consumption
Test pro-cedure
finalized
Industry standard proposal
Industry standard
imple-mented
National standard adopted
Regulation implemented starting MY 2015
European Union
CO2 test procedure Technical studies
Impact assessment/
Policy implementationTest procedure finalized
Canada GHG Standard proposal
Final rule Regulation implemented starting MY 2014 Phase 2
Korea Fuel efficiency Technical studies
Impact assess-ment
Test procedure finalized
Policy implementation
(second half of 2015)
Mexico Fuel efficiency Proposal Regulation implemented starting MY 2016 Phase 2 imple-
mentation
California End-user purchase reqts
Requirements for new tractors, trailers
(2011+)
Additional reqs. for existing tractors and trailers (pre MY 2010)
Additional reqts. for existing trailers and reefers (pre MY 2010)

81
OVERVIEW OF INDIA’S VEHICLE EMISSIONS CONTROL PROGRAM
8.4.1 JapanJapan was the first country to implement mandatory fuel economy standards for HDVs. In November 2005, the Japanese government introduced its first fuel economy standards for new heavy-duty diesel vehicles, which were estimated to be responsible for approximately one-quarter of all CO2 emissions from motor vehicles in 2002. Rec-ognizing the need for enough lead time for manufacturers to develop technologies and comply with standards, the government set 2015 as the deadline for compliance with fuel economy targets.
Japan’s standards are corporate average weight–based standards. The targets for each vehicle category were set at the level of the most efficient model in 2002, which was called the “Top Runner” approach. The test procedure combines engine testing with a vehicle simulation model. This regulatory innovation is also the basis of the U.S. GHG standards test procedure.
There are currently four categories of HDVs that come under Japan’s fuel economy standards, covering all vehicles with gross weight above 3.5 metric tons. Fuel economy limits by category and gross vehicle weight rating (GVWR) are shown in Table 8.4.2. [147] These standards are expected to result in a 10–13 percent improvement in HDV fuel economy by 2015 over 2002.
Table 8.4.2: Fuel economy standards for HDVs in Japan
Heavy-Duty Transit Buses
Heavy-Duty Non-Transit Buses Heavy-Duty Trucks Heavy-Duty Tractors
GVW (tons)
FE target (km/L)
GVW (tons)
FE target (km/L)
GVW (tons)
FE target (km/L)
GVW (tons)
FE target (km/L)
6–8 6.97 3.5–6 9.04 3.5–7.5 10.83–8.12* ≤20 3.09
8–10 6.30 6–8 6.52 7.5–8 7.24 >20 2.01
10–12 5.77 8–10 6.37 8–10 6.52
12–14 5.14 10–12 5.70 10–12 6.00
>14 4.23 12–14 5.21 12–14 5.69
14–16 4.06 14–16 4.97
>16 3.57 16–20 4.15
>20 4.04
*Dependent on load
8.4.2 United StatesIn 2011, the United States approved its first GHG emission standards for HDVs. The new requirements dictate up to a 20 percent decrease in fuel consumption for road haulage tractors, a 10 percent reduction for delivery trucks, buses, and vocational vehicles (such as refuse trucks, dump trucks, and cement mixers), and a 17 percent decrease for heavy-duty pickups and vans by 2018. While the U.S. program covers all HDVs (above 8,500 lbs. GVWR), it focuses on vehicle categories that use the most fuel, notably pickups and vans (classes 2B/3) and heavy tractors that typically pull trailers (Class 7 and 8). Table 8.4.3 below shows this in more detail. The table gives the percentage reduction in fuel consumption required by 2018 over 2010 levels for each HDV vehicle type and class. [148]
The U.S. program differs from Japan’s in several regards. While the Japanese approach was largely based on engine improvements, the United States took a more comprehen-sive look at improving HDV fuel economy. While the United States has separate engine-

82
INTERNATIONAL COUNCIL ON CLEAN TRANSPORTATION
only standards built into the overall requirements, it also includes aerodynamics, tires, and weight reduction in its approach to increasing overall HDV fuel economy.
Table 8.4.3: U.S. fuel economy improvements for HDVs for 2018 over 2010 levels
Type/SubclassPercentage Reduction in
Fuel Consumption
Tractor-trailers
Day cabs Class 7 low roof 10.2
Class 7 mid roof 10.3
Clas 7 high roof 13
Class 8 low roof 9.1
Class 8 mid roof 9.5
Class 8 high roof 13.6
Sleeper Class 8 low roof 17.5
Class 8 mid roof 18
Class 8 high roof 23.4
Vocational
Light HDV Class 2b–5 8.6
Medium HDV Class 6–7 8.9
Heavy HDV Class 8 5.9
Pickups and Vans
Gasoline 12
Diesel 17
8.4.3 EuropeEurope is currently developing its strategy to confront CO2 emissions from the road freight sector, but it has not stated plans to implement mandatory limits in the near future. At the same time, EU legislation for Euro VI emission standards (set to go into effect in 2014) includes provisions to develop a test procedure to assess fuel consumption and CO2 emis-sions from vehicles. Work is ongoing to establish such a procedure in the next couple years.
8.4.4 ChinaLike Europe, China is assessing options for HDV fuel consumption standards. The country is currently developing a test procedure based on a modified version of the worldwide transient vehicle cycle for its HDV fuel consumption standards. [149] Limits have not yet been set but are expected to be in the near future.
8.5 INTERNATIONAL TWO- AND THREE-WHEELER EXPERIENCECurrently, there are only two countries in the world with two- and three-wheeler fuel economy standards: China and Taiwan (China). China inaugurated its two- and three-wheeler fuel consumption standards in 2008. The country is expected to implement its second phase of motorcycle fuel consumption standards in the near future. Table 8.5.1 shows Taiwan’s and China’s two- and three-wheeler standards. [150]

83
OVERVIEW OF INDIA’S VEHICLE EMISSIONS CONTROL PROGRAM
Table 8.5.1: Two- and three-wheeler fuel consumption standards in China and Taiwan
Engine Size (cc)
China Two-Wheeler (L/100km)
China Three-Wheeler (L/100km)
Taiwan (China) Two-Wheeler (L/100km)
≤ 50 2.0 2.3 2.3
50-100 2.3 3.3 2.7
100-150 2.5 3.8 2.8
150-250 2.9 4.3 4.0
250-400 3.4 5.1 4.0
450-650 5.2 7.8 5.5
650-1000 6.3 9.0 6.3
1000-1250 7.2 9.0 6.9
≥1250 8.0 9.0 6.9
8.6 COMPLIANCE IN THE UNITED STATESIn terms of compliance with fuel economy standards, the United States has the most comprehensive regulatory program. Therefore, it is analyzed in detail in this section.
The EPA is in charge of CAFE data collection and fuel economy tests, although it does not test all new models. Instead, it requires manufacturers to test and submit the majority of fuel economy data. The agency itself only conducts confirmatory tests on about 10–15 percent of all new models. This approach significantly reduces its test burden, even while maintaining the compliance regime.
The EPA developed standard requirements for test equipment, equipment calibration, fuel specification, driving cycles, and test procedures. Manufacturers must strictly follow these guidelines for their in-house fuel economy testing and submit reports to the agency explaining their methods. Any deviation from the test requirements needs to be fully explained in the report.
With today’s market diversification, each model type may have multiple variations (for example, a two-door versus four-door version of the same model). Testing each varia-tion would create an enormous workload for manufacturers. Thus, automakers are not required to test all models. The EPA groups vehicles into a hierarchy, wherein data are harmonically averaged on a sales-weighted basis at each level as they are aggregated into the next level of the hierarchy. The hierarchy ranges from most detailed to most aggregated as follows: subconfiguration, configuration, base level, and model type. For the preparation of fuel economy labels, which is done prior to any yearly model going on the market, projected sales data are used for the averaging calculations. For labeling purposes, the EPA’s minimum data requirement is that the highest-selling configura-tion32 (and the highest-selling subconfiguration within that configuration) be tested within each base level. The CAFE value is again computed at the end of the model year, and actual sales data are used. Also, for CAFE, the minimum data requirement is that manufacturers must submit data covering 90 percent of actual sales by configuration.
Along with fuel economy data, an automaker must submit a description of a vehicle’s physical attributes, mileage accumulated, exhaust test results, deterioration factors,
32 Vehicle configuration means a unique combination of engine displacement (volume), number of cylinders, fuel system (as distinguished by the number of carburetor barrels or use of fuel injection), catalyst use, engine code, inertia weight class, transmission configuration, and axle ratio.

84
INTERNATIONAL COUNCIL ON CLEAN TRANSPORTATION
vehicle test condition, and a statement for each test vehicle mentioning i) if the test has been conducted in accordance with applicable requirements, ii) if the vehicle is representative of the configuration listed to the best knowledge of the manufacturer, and iii) if the vehicle is in compliance with applicable tailpipe emission standards.
After receiving manufacturer data, the EPA reviews the fuel economy calculations. EPA administrators determine the acceptability of the submitted fuel economy data based on three criteria: i) the vehicle has not accumulated more than 10,000 miles; ii) it has met exhaust emission standards; and iii) it is representative of its model type. To judge the reasonableness and representativeness of fuel economy data, the administrators compare the results of a test vehicle to those of other, similar test vehicles.
As well as reviewing manufacturer data, the EPA selects 10–15 percent of vehicles used to collect fuel economy data for confirmatory testing in its lab. Some confirma-tory testing is conducted at random, and some is targeted. Targeted testing focuses on developments such as new technologies or vehicles with suspected problems. After the first test, the EPA compares the result to that submitted by the manufac-turer. If the two results are consistent, the agency will use its fuel economy value for the particular vehicle configuration. If the data do not match,33 the EPA will repeat the test up to four times until one of the following occurs: if two or more EPA tests show consistent fuel economy values, the agency will use the harmonic average of all of its own matching test results as the official fuel economy of the test vehicle; if none of the EPA test results match the manufacturer’s data, and there is disparity among the test results, the EPA will reject the fuel economy data and the vehicle. If the latter situation consistently occurs during testing of other representative vehicles from the same automaker, the agency may even dispute all fuel economy data from that manufacturer. For rejected vehicles, the manufacturer can retest and justify why the disparity has occurred, or it can just accept the lower of its own or the EPA’s test result as the fuel economy value. Figure 8.4.1 shows a diagram of the U.S. fuel economy compliance program.
33 Matching is defined as within a range of 3 percent. This used to be outlined only in policy guidance letter but has subsequently been incorporated in the regulations.

85
OVERVIEW OF INDIA’S VEHICLE EMISSIONS CONTROL PROGRAM
NO
YESNOT ALL YES
NO
NO
YES
ALL YES
NO
YES
YES
Mfr to test 90% of sales by configuration and submit
fuel economy to EPA
EPA to determineacceptability of data
EPA to request Mfrto resubmit data
Mfr to submitmodel year
production dataand EPA to
confirm mfr’sfleet-averagefuel economy
Conduct onemore test
Reject all datafrom the mfr
REPEAT
Is veh. selected forconfirmatory test?(EPA confirmatorytest 15% of veh.)
Is veh. 1) less than10,000 miles; 2) meet
emissions std;3) representative?
Accept data
Adopt harmonicave. of the
matching results
EPA to conductconfirmatory test
Initial test
Does resultmatch mfr
data?Adopt EPA data
Does resultmatch any oneof the previous
test(s)?
EPAconducted 4
tests?
Reject the dataIf trend of
inconsistencyfound
PROCEDURES
DETERMINATION
DECISION MAKING
Figure 8.6.1: A diagram of the U.S. fuel economy compliance program

86
INTERNATIONAL COUNCIL ON CLEAN TRANSPORTATION
8.7 LABELINGFuel efficiency and CO2 labels on new vehicles usually contain detailed vehicle informa-tion, such as model type, pertinent physical specifications, and emissions.
Vehicle emissions or fuel efficiency labels have been instituted in many parts of the world, including New Zealand, Australia, Japan, South Korea, China, Singapore, the United Kingdom, other EU countries, the United States, Chile, and Brazil. In the United States, a mandatory fuel economy label dates back to the late 1970s. Prior to 2011, only California’s new car label showed emissions ratings for both conventional pollutants and GHGs. Today, the new U.S. label provides information on fuel economy, GHGs, smog ratings, and the annual fuel cost. European new car CO2 emission labels are often tied in with fiscal policies in order to support the EU’s fleetwide CO2 reduc-tion target. In the early 2000s, Japan adopted labels for super-low-emission and super-efficient vehicles that receive substantial tax incentives. It has continued to enhance its policies since then. Singapore also implemented tax incentives for low-emission cars in January 2013.
Of the countries that currently have labeling programs, New Zealand, Japan, Singapore, the EU, the United States, South Korea, and Brazil include some form of comparative information. China, Chile, and Australia do not. The following list highlights distinctive features of certain labeling programs worldwide.
» Only New Zealand includes a star rating system (half a star to six stars).
» Labels in Europe use a lettering scheme from A to G instead of stars, with A being the best and G the worst. Brazil has adopted the European scale as well.
» In New Zealand, the United Kingdom, and for the new U.S. label, the comparison is based on absolute fuel efficiency or CO2 emissions, or both (i.e., the same scale is used for vehicles regardless of fuels, size, or weight).
» In Singapore, the amount of tax incentives or surcharge is scaled by the amount of CO2 emissions per car. The fuel consumption and the CO2 emissions are registered on an absolute scale.
» In Japan, vehicles that exceed fuel economy standards by a certain percentage must display that figure.
» In the United States the label shows the fuel economy of the vehicle in comparison with all other vehicles in the same size class.
In general, a labeling program based on absolute fuel efficiency or emissions will encourage consumers to purchase vehicles with higher fuel economy regardless of size or any other classification system. On the other hand, a class-based system is helpful if the consumer has already decided to purchase a vehicle of a particular class. In such a case, the label will help the consumer in selecting a vehicle that is close to the best-in-class vehicle.

87
OVERVIEW OF INDIA’S VEHICLE EMISSIONS CONTROL PROGRAM
8.7.1 EU labelsIn 2000, the EU Parliament introduced legislation requiring that information on fuel economy and CO2 emissions be provided to consumers for all new passenger cars. Member states have developed different label designs under the parliament’s general guidelines. Finland, the Netherlands, France, and the United Kingdom have adopted a scaled comparative label. These labels have a CO2–based, color-coded band system that is similar to energy efficiency labels on appliances. Familiarity with such labels has led to their easy acceptance. The U.K. label also includes road tax next to the average yearly fuel cost. The U.K. fuel economy and CO2 emissions label is shown in Figure 8.7.1.
Figure 8.7.1: Car CO2 and fuel economy label in the United Kingdom

88
INTERNATIONAL COUNCIL ON CLEAN TRANSPORTATION
8.7.2 U.S. labelsThe U.S. labeling system includes city, highway, and combined fuel economy data. The la-bel also displays the estimated annual fuel cost for the vehicle and the expected savings or increased costs for that particular vehicle compared with the average new vehicle. It rates the vehicle on a scale of one to ten in terms of GHG and smog emissions. That label is shown in Figure 8.7.2. [151]
Figure 8.7.2: Car fuel economy label in the United States
8.7.3 Labels in other countriesBrazil introduced labels for passenger vehicle fuel economy in 2009. Brazilian fuel economy labels are similar to many European labels in that they are scaled and comparative. [152] However, vehicle fuel economy labels are still voluntary in Brazil. For Brazil’s label, the fuel economy rating for both gasoline and ethanol is printed.
As of April 2009, Australia has required a fuel consumption and CO2 emissions label. The current label is not comparative, as in many EU countries, but does clearly display urban, extraurban (rural), and combined test fuel consumption, as well as combined test CO2 emissions. [153]
Chile became the first Latin American country to mandate LDV fuel economy labels in 2011. Much like Australian labels, Chilean labels show vehicle fuel economy for urban, highway, and combined driving cycles. Chile is the only country where the emission standards themselves are printed on the label. [154]
New Zealand, on the other hand, has adopted a “star” rating system in which vehicles get up to six stars depending on their fuel economy. A single system applies to all vehicles, whereby lower fuel consumption earns more stars. [152]
China instituted a voluntary fuel economy labeling program in July 2008, which became mandatory on January 1, 2010. All new LDVs, including imported vehicles, are required to display a label indicating the manufacturer, vehicle type, engine size, and fuel consump-tion according to urban, suburban, and integrated test cycles. China’s label does not show CO2 emissions. [152]

89
OVERVIEW OF INDIA’S VEHICLE EMISSIONS CONTROL PROGRAM
Starting in January 2013, Singapore mandated a new labeling system for all new vehicles. The new label displays CO2 emissions and fuel consumption on an absolute scale. It also shows tax incentives for cars with low CO2 emissions and surcharges for high cars with high CO2 emissions.
8.8 INDIA’S FUEL ECONOMY STANDARDSAs part of its low-carbon growth strategy, India has announced it will reduce its GHG emissions intensity (the ratio of emissions to GDP) by 20–25 percent from 2005 levels by 2020. The transportation sector is currently the second-largest contributor of GHG emissions in the country, after power generation. Its share, though, is growing as the number of vehicles on Indian roads increases. [155] There are many strategies India can adopt with respect to the transportation sector to mitigate GHG emissions. Establish-ing national fuel economy standards for vehicles is one of them.
8.8.1 LDVs and HDVsIndia is currently developing its first-ever fuel economy standards for passenger ve-hicles. These were expected to be finalized in 2012 by the Bureau of Energy Efficiency (BEE) in cooperation with the Ministry of Road Transport and Highways, though they have inexplicably been delayed indefinitely. The new regulations envision a continuous reduction in fuel consumption over a ten-year period. To give manufacturers adequate lead time, new standards are expected to go into effect for the 2015–2016 fiscal year. They will be implemented according to a corporate average fuel consumption model, meaning that there will not be a set standard for every vehicle produced but rather weighted fleet-average standards for each manufacturer. [156] LDV fuel economy regulations are expected to be implemented first, to be followed by rules for HDVs and two- and three-wheelers.
8.8.2 Two- and three-wheelersIndia does not currently have any two- or three-wheeler fuel economy or fuel con-sumption standards, though that may change over the next few years. There is much potential to improve the efficiency of India’s two- and three-wheeler fleet. A report that reviewed multiple studies and technology options found a 25–30 percent fuel economy improvement potential for two- and three-wheelers with two-stroke engines and a 5–10 percent potential for two- and three-wheelers with four-stroke engines. [61]
8.8.3 Labels in IndiaIndia has debuted a fuel economy label for new cars sold in fiscal year 2011–2012. The label is shown and described in Figure 8.8.1. Apart from displaying the combined fuel economy of the vehicles, the label ranks fuel efficiency by a five-star system. The current rankings are based on fleet-average fuel consumption by curb weight for fiscal year 2009–2010. Cars within 10 percent of the regression line for fuel consumption by curb weight receive three stars. Cars with fuel consumption between 10 and 30 percent less than the average receive four stars, and cars with fuel consumption more than 30 percent less receive five stars. Cars with fuel consumption greater than the average receive two stars or one in the same manner. In fiscal year 2014–2015, the ranking system will be recalibrated according to fleet-average fuel consumption in India at that time. [156]

90
INTERNATIONAL COUNCIL ON CLEAN TRANSPORTATION
Figure 8.8.1: India’s proposed vehicle fuel economy label, with descriptions
India also has another fuel economy label that the Society of Indian Automobile Manufac-turers (SIAM) has issued. This label is not mandatory, and it is not available for every car. The SIAM fuel economy label, which can be obtained from a car dealership, segments the vehicles according to the weight of the car. The highlighted box from the scale as depicted below is the range of fuel economy in the appropriate weight class. [157]
8.8.4 Future prospectsThe ICCT-developed India Emissions Model (IEM) estimates future emissions from India’s on-road vehicle fleet. The IEM is described in Appendix A. In terms of CO2 emissions, the IEM modeled various scenarios that show India’s potential to slow the growth in CO2 emis-sions from vehicles, collectively called the Program Scenarios. These were compared with a business as usual (BAU) projection, which assumed that current trends would continue. Table 8.8.1 shows the fuel consumption assumptions under each model scenario.
Table 8.8.1: Future fuel consumption assumptions under the Program Scenarios and BAU scenario
SCENARIOS FUEL CONSUMPTION STANDARDS1
BAU None
Continued Dual Standards Program
1.5% annual improvement from 2015–30 for LDVs; 1% annual improvement from 2020–30 for HDVs; 0.5% annual improvement from 2015–30 for 2- and 3-wheelers
National Leapfrog Program
2.5% annual improvement from 2015–30 for LDVs; 2% annual improvement from 2020–30 for HDVs; 0.75% annual improvement from 2015–30 for 2- and 3-wheelers
World Class Program4% annual improvement from 2015–30 for LDVs; 3% annual improvement from 2020–30 for HDVs; 1% annual improvement from 2015–30 for 2- and 3-wheelers
1 LDVs mean cars, SUVs, and light-duty trucks and buses. HDVs mean medium-duty and heavy-duty trucks and buses
While all Program Scenarios predict an increase in vehicular CO2 emissions in the future, the most effective curtailment of CO2 emissions occurs under the World Class program,

91
OVERVIEW OF INDIA’S VEHICLE EMISSIONS CONTROL PROGRAM
where they start to level out about fifteen years into the future. Figure 8.8.1 shows annual CO2 emissions through the year 2035 under the Program Scenarios and according to BAU.
0
100
200
300
400
500
600
700
800
900
1,000
2010 2015 2020 2025 2030 2035
Ann
ual C
O2
Em
issi
ons
(T
g)
BAU Continued Dual Standards National Leapfrog World Class
Figure 8.8.2: Annual CO2 emissions under the BAU scenario and the Continued Dual Standards, National Leapfrog, and World Class programs through the year 2035
Looking at CO2 emissions by vehicle type, HDVs will continue to be the largest contribu-tors. Two- and three-wheelers, currently the second-largest class of emitters, are pre-dicted to be overtaken by passenger cars in the future, especially if consumers continue to opt for larger SUVs in place of smaller cars. Figure 8.8.2 shows CO2 emissions by vehicle type under the BAU scenario.
0
100
200
300
400
500
600
700
800
900
1,000
2010 2015 2020 2025 2030 2035
CO
2 E
mis
sio
ns (
Tg
)
Passenger Vehicles
Light-Commercial Vehicles
2- & 3-Wheelers
Heavy-Duty Vehicles
Figure 8.8.3: Projected annual CO2 emissions by vehicle type from 2010 to 2035

92
INTERNATIONAL COUNCIL ON CLEAN TRANSPORTATION
8.9 FINDINGS AND RECOMMENDATIONSIndia is taking its first steps toward establishing fuel efficiency standards for new vehicles. While this is a welcome first move, the country is still behind international best practices. Most advanced countries have already put into place long-term fuel efficiency or GHG emission standards for LDVs or are in the process of implementing them. In many cases, these countries are now working on long-term standards for HDVs. India can learn much from the experiences of others to close the gap with best practices.
There is also much that can be done to improve the fuel efficiency of two- and three-wheelers. This is especially important in India, where motorcycles dominate new vehicle sales and are expected to continue to do so. The experiences of China and Taiwan can be beneficial for India since motorcycles compose a significant share of the vehicle stock there as well.
A relatively new and innovative technique to promote higher fuel economy or lower fuel consumption is to tax fuel use or CO2 emissions. India has already revamped its vehicle sales tax structure to tax larger private vehicles at a higher rate. It can strengthen the incentive to purchase fuel-efficient vehicles by further taxing gas-guzzlers. A number of European countries have already adopted annual vehicle taxes or registration fees that take into account vehicle CO2 emissions. [6]

93
OVERVIEW OF INDIA’S VEHICLE EMISSIONS CONTROL PROGRAM
9 EFFECTS OF NEW REGULATIONS ON THE ENVIRONMENT, PUBLIC HEALTH, AND THE ECONOMY IN INDIA
This chapter takes a comprehensive look at the potential effects of the policies and regulations discussed so far. It seeks to understand the ways in which India can improve ambient air quality, help mitigate global warming, safeguard public health, and strengthen its economy through vehicular emissions and fuel quality controls.
The ICCT is not the first organization to look at the connection between air pollution and health in India. The World Health Organization’s 2010 Global Burden of Disease study estimated that ambient fine particulate matter (PM2.5) was responsible for 712,000 pre-mature deaths in South Asia in 2010, making it the sixth-highest cause of mortality in the region. [158] A separate study estimated that between 20,000 and 50,000 premature deaths in India in 2010 were caused by PM2.5 emissions from the transportation sector alone. The report attributed hundreds of thousands of illnesses to transportation-related PM2.5 as well. The toll of mortality and morbidity will increase significantly in the future if no action is taken. [159] In 2012, a World Bank study for India estimated the cost of outdoor air pollution to be Rs. 110,000 crore34 ($22 billion), higher than for any other type of environmental damage. [160]
For the purposes of this report, in order to assess the future effects of new policies and regulations, the ICCT developed two models that estimate the vehicular emissions from various pollutants and the corresponding health and economic benefits of limiting them. Scenarios were chosen for the models that took into account differing degrees of regulatory stringency. These models, the scenarios, and results are discussed in the following sections.
9.1 MODELING VEHICLE EMISSIONS AND CORRESPONDING HEALTH AND ECONOMIC IMPACTS
The ICCT developed an India Emissions Model (IEM) and a parallel India Health Assess-ment Model (IHAM) to analyze in full India’s past, current, and potential future vehicle and fuel regulations. This analysis focused only on on-road vehicles, meaning that the benefits of better controls on emissions from nonroad vehicles were not taken into account. Multiple future scenarios were assessed in the IEM and the IHAM to provide an idea of what range of benefits India could realize under different programs. Results from the IEM and IHAM are presented in the next few sections. Appendix A offers a detailed description of the methodologies and assumptions underpinning the IEM and the IHAM.
The IEM and the IHAM are unique in that they are the only comprehensive models that look exclusively at the current and future impacts of India’s vehicular emissions. They provide in-depth analysis and data to allow policymakers and the public to understand what has already been done and what is yet possible.
9.1.1 India’s vehicular emission control program over the past decadeThe vehicle population in India has grown tremendously since the year 2000. The total number of vehicles on India’s roads increased by more than 240 percent between 2000 and 2010, primarily because of sales of two-wheelers. Figure 9.1.1 shows the change in India’s vehicle stock over the past decade.
34 1 crore = 10 million

94
INTERNATIONAL COUNCIL ON CLEAN TRANSPORTATION
0
10
20
30
40
50
60
70
80
90
100
2000 2001 2002 2003 2004 2005 2006 2007 2008 2009 2010
Veh
icle
Sto
ck (
in m
illio
ns) Passenger Vehicles
Light-Commercial Vehicles
2- & 3-Wheelers
Heavy-Duty Vehicles
Figure 9.1.1: Vehicle stock in India from 2000 to 2010
To counteract such tremendous growth in the number of vehicles on the road, India has taken steps to reduce overall emissions from its vehicle fleet. The nation first imple-mented preliminary emission and fuel quality standards more than twenty years ago. Beginning in 2000, India shifted its regulatory method so as to be largely in line with the European model. This is discussed in more detail in Chapters 3 and 4.
Figures 9.1.2 and 9.1.3 show particulate matter (PM) and nitrogen oxide (NOX) emissions by vehicle type in India from 2000 to 2010, as estimated by the IEM. These pollutants are of special concern because they have been shown to be particularly damaging to human health. [161] As a result of tighter standards, PM emissions fell during this period, and the growth in NOX emissions was mitigated. In both cases heavy-duty vehicles (HDVs) accounted for the vast majority of PM and NOX emissions, despite their being a small share of the total vehicle population.
0
20
40
60
80
100
120
140
160
180
200
2000 2001 2002 2003 2004 2005 2006 2007 2008 2009 2010
PM
10 E
mis
sio
ns (
100
0 m
etri
c to
ns)
Passenger Vehicles
Light-Commercial Vehicles 2- & 3-WheelersHeavy-Duty Vehicles
Figure 9.1.2: Annual PM10 emissions by vehicle type from 2000 to 2010

95
OVERVIEW OF INDIA’S VEHICLE EMISSIONS CONTROL PROGRAM
0
500
1000
1500
2000
2500
2000 2001 2002 2003 2004 2005 2006 2007 2008 2009 2010
NO
x E
mis
sio
ns (
100
0 m
etri
c to
ns)
Passenger Vehicles
Light-Commercial Vehicles
2- & 3-Wheelers
Heavy-Duty Vehicles
Figure 9.1.3: Annual NOX emissions by vehicle type from 2000 to 2010
The successes of India’s vehicular emissions control program include the removal of lead from fuels, significant reductions in fuel sulfur, and tighter emission standards, all of which led to large reductions in pollutant emissions per vehicle. Figure 9.1.4 shows percentage reductions in new vehicles emissions of carbon monoxide (CO), particulate matter, nitrogen oxides (which comprise nitric oxide and nitrogen dioxide), and total hydrocarbons35 (HC) by looking at the effects of all the regulations introduced in India post-2000 compared with what would have been emitted had India not taken any further action beyond what was already in place in 2000.
0%
5%
10%
15%
20%
25%
30%
35%
40%
2000 2001 2002 2003 2004 2005 2006 2007 2008 2009 2010
PM NOx CO HC
Figure 9.1.4: Annual percentage reduction in new vehicle emissions of various pollutants owing to regulatory action taken by India from 2000 to 2010
It can be seen from Figure 9.1.4 that reductions in PM emissions are particularly notable. This is certainly a laudable achievement for India, given how hazardous these substances are to human health. Total hydrocarbon emissions are made up largely of methane (CH4, around 94 percent). While methane has a strong global warming potential, it is less reactive than the other pollutants that comprise HC. This lower reactivity means that methane is less likely to increase concentrations of ambient, ground-level ozone (O3), a harmful pollutant that is formed by the reaction of NOX and HC. In the case of CO,
35 Total hydrocarbons include both tailpipe and evaporative emissions.

96
INTERNATIONAL COUNCIL ON CLEAN TRANSPORTATION
this pollutant is often converted to CO2, which is problematic for global warming but relatively innocuous in terms of human health.
Given that exposure to pollutants (especially PM and NOX) in vehicle exhaust can lead to increased incidences of morbidity and premature mortality, [161] India’s policies over the past decade have resulted in substantial public health benefits. The reduction in morbid-ity and mortality translates into economic benefits as well because of reduced medical costs and the consequent avoidance of losses from diminished economic activity.
The India Health Assessment Model (IHAM) estimated the number of deaths avoided for India’s 337 largest cities that can be attributed to lower ambient concentrations of fine particulate matter (PM2.5) resulting from India’s post-2000 vehicular emissions regula-tions. The model also monetized the benefits of those avoided deaths, using value of a statistical life (VSL) estimates for India. Since the IHAM only looked at mortality from the effects of primary PM2.5 emissions, it is certainly an underestimate of the total health benefits India has realized over the past decade by implementing progressively tighter emission and fuel quality standards. Secondary PM2.5 formation was not considered, nor were other vehicular emissions such as HC, CO, NOX, and the resulting O3 that have been shown to lead to respiratory illnesses and even death. [161, 162] The IHAM also looked only at these 337 cities, which constitute less than 20 percent of India’s total population. [19, 163] Undoubtedly, the remaining 80 percent of India’s population have experienced the benefits of lower vehicular air pollution as well.
The IHAM estimated that, in the year 2010 alone, more than 6,300 premature deaths were avoided in India’s 337 largest cities because of PM2.5 reductions from India’s existing emis-sions control program. That translated into economic benefits of about Rs. 50,000 crore ($9.8 billion) in 2010, which represented 0.7 of India’s GDP that year. Figure 9.1.5 and Figure 9.1.6 show the health and economic benefits, respectively, of reduced ambient PM2.5 concen-trations attributable to India’s vehicular emissions control program over the past decade.
0
1,000
2,000
3,000
4,000
5,000
6,000
7,000
2000 2001 2002 2003 2004 2005 2006 2007 2008 2009 2010
Avo
ided
Dea
ths
Child Respiratory Infections Lung Cancer Cardiopulmonary
Figure 9.1.5: Annual premature deaths in India avoided between 2000 and 2010 due to lower ambient PM2.5 levels attributable to vehicle emissions control programs

97
OVERVIEW OF INDIA’S VEHICLE EMISSIONS CONTROL PROGRAM
0.0%
0.1%
0.2%
0.3%
0.4%
0.5%
0.6%
0.7%
0
5,000
10,000
15,000
20,000
25,000
30,000
35,000
40,000
45,000
50,000
2000 2001 2002 2003 2004 2005 2006 2007 2008 2009 2010
Per
cent
of
GD
P
Cro
re 2
011
INR
Monetary Benefits % of GDP
Figure 9.1.6: Annual economic benefits between 2000 and 2010 owing to lower ambient PM2.5 levels from vehicle emissions controls
9.1.2 A look into the futureDespite the progress that has been made in India in terms of emission reductions and their concomitant health and economic benefits, more must be done. India’s steadily expanding transportation sector makes it necessary to continue the revision and imple-mentation of policy initiatives to mitigate further the negative health, environmental, and economic impacts of vehicular emissions. Despite recent progress, such emissions are expected to increase dramatically over the next two decades, following the rapid increases in vehicle population.
If vehicle growth in India continues at the current pace, the total number of vehicles in the country is forecast to top 525 million by 2035. The majority of this growth is expected to be in sales of two- and three-wheelers, though sales of other passenger vehicles will also be significant. Figure 9.1.7 shows the projected annual number of vehicles on India’s roads through 2035. Figures 9.1.8 and 9.1.9 show projected annual PM and NOX emissions by vehicle type, as estimated by the IEM. Note once more that HDVs will likely account for most PM and NOX emissions, despite their being a minority of vehicles on the road. Reasons for this include the higher figure for vehicle kilometers traveled for HDVs and higher per kilometer emissions from these vehicles.
0
50
100
150
200
250
300
350
400
450
2010 2015 2020 2025 2030 2035
Veh
icle
Sto
ck (
in m
illio
ns)
Passenger Vehicles
Light-Commercial Vehicles
2- & 3-Wheelers
Heavy-Duty Vehicles
Figure 9.1.7: Projected vehicle stock in India, 2010–2035

98
INTERNATIONAL COUNCIL ON CLEAN TRANSPORTATION
0
50
100
150
200
250
300
350
400
2010 2015 2020 2025 2030 2035
PM
10 E
mis
sio
ns (
100
0 m
etri
c to
ns) Passenger Vehicles
Light-Commercial Vehicles
2- & 3-Wheelers
Heavy-Duty Vehicles
Figure 9.1.8: Projected annual PM10 emissions by vehicle type, 2010–2035
0
1000
2000
3000
4000
5000
6000
2010 2015 2020 2025 2030 2035
NO
X E
mis
sio
ns (
100
0 m
etri
c to
ns)
Passenger Vehicles
Light-Commercial Vehicles
2- & 3-Wheelers
Heavy-Duty Vehicles
Figure 9.1.9: Projected annual NOX emissions by vehicle type, 2010–2035
The impact of the increase in vehicle stock, in emissions terms, will be substantial. Even after the adoption of Bharat IV standards in thirteen major metropolitan cities and Bharat III standards in the rest of the country in 2010, total emissions of all pollutants will increase in future years unless tighter emission control regulations are adopted and implemented.
The IEM was used to analyze four scenarios concerning future on-road vehicle and fuel quality regulations in India. Off-road vehicles, while important, were not considered. The business-as-usual (BAU) scenario assumed that India would not move beyond regulations currently in place and that existing trends would continue. The three others (the Continued Dual Standards program, the National Leapfrog program, and the World Class program), referred to as Program Scenarios, were used as frameworks to examine the impacts of various policies and regulations India can implement. These were then compared with the BAU scenario. An overview of the policies analyzed in the scenarios is provided below:
1. Emission Standards: India’s past, present and future emission standards for new vehicles.

99
OVERVIEW OF INDIA’S VEHICLE EMISSIONS CONTROL PROGRAM
2. Fuel Quality Standards: The past, present, and future implementation of lower-sulfur fuel regulations.
3. Enforcement and Compliance: Options regarding the removal of gross emitters from the in-use vehicle fleet.
4. Change in Fuel Type: Weighing the merits of a shift to CNG and LPG to replace diesel in passenger vehicles and buses.
Each scenario comes with its own assumptions regarding the policies and regulations just described. The Continued Dual Standards program represents the weakest actions India can take to control vehicle emissions. While an improvement over business as usual, the agenda it models is limited in scope. The National Leapfrog program is more stringent, and it represents reasonable steps India can take to reduce vehicular emissions in the long term. The World Class program, the most exacting of the three Program Scenarios, would put India on more or less equal footing with international best practices within the shortest time frame. While the World Class program is certainly ambitious, it would lead to the greatest reductions in vehicular emissions, which would result in important benefits for public health and the economy. Detailed assumptions of the BAU and the three Program Scenarios are laid out in Table 9.1.1.
Table 9.1.1: The four scenarios analyzed by the IEM and their assumptions
SCENARIOS EMISSION STANDARDS FUEL STANDARDS
ENFORCEMENT AND
COMPLIANCE1CHANGE IN FUEL
TYPE2
BAUBharat IV in 50+ cities by 2015; Bharat III in rest of India; Bharat III for 2-/3-wheelers nationwide
Low-sulfur fuel (50 ppm) in 50+ cities by 2015; 150-ppm-sulfur gasoline and 350-ppm-sulfur diesel in rest of India
15% of vehicle fleet are gross emitters
60% of new LDV sales are diesel by 2020
Continued Dual Standards Program
Bharat V 4-wheeled vehicles in 50+ cities, Bharat IV 4-wheeled vehicles in rest of India, and Bharat IV 2-/3-wheelers nationwide in 2015; Bharat VI 4-wheeled vehicles in 50+ cities, Bharat V 4-wheeled vehicles in rest of India, Bharat V 2-/3-wheelers in 2020
Ultra low-sulfur fuel (10 ppm) in 50+ cities, low-sulfur fuel (50 ppm) in rest of India by 2015; ultra-low sulfur-fuel nationwide (10ppm) by 2020
By 2020, only 10% of vehicle fleet are gross emitters
5% of LDV sales are CNG and 5% LPG by 2030; 25% of bus and 3-wheeler sales are CNG by 2030
National Leapfrog Program
Leapfrog to Bharat VI by 2017 for all vehicles
Ultra-low-sulfur gasoline and diesel countrywide (10 ppm) by 2017
By 2020, only 5% of vehicle fleet are gross emitters
10% of LDV sales are CNG and 5% LPG by 2030; 50% of bus and 3-wheeler sales are CNG by 2030
World Class Program
Bharat V by 2015, Bharat VI by 2017, and Tier 3 by 2020 for all vehicles
Low-sulfur fuel (50 ppm) nationwide by 2015; ultra-low-sulfur fuel (10 ppm) nationwide by 2017
By 2020, only 3% of vehicle fleet are gross emitters
15% of LDV sales are CNG and 10% LPG by 2030; 75% of bus sales are CNG by 2030; 50% of 3-wheeler sales are CNG by 2030
1 Gross polluters are defined as vehicles for which emission controls are nonfunctional.2 LDV means passenger cars and utility vehicles. Increases in CNG and LPG vehicle market share are assumed to happen at the
expense of diesel market share.

100
INTERNATIONAL COUNCIL ON CLEAN TRANSPORTATION
The projected emissions of PM, NOX, HC, and CO under all the scenarios are shown in Figures 9.1.10 through 9.1.13.
0.00
0.05
0.10
0.15
0.20
0.25
0.30
0.35
0.40
0.45
2010 2015 2020 2025 2030 2035
PM
10 E
mis
sio
ns (
Tg
)
BAU Continued Dual Standards
National Leapfrog World Class
Figure 9.1.10: Projected annual total PM10 emissions for each scenario through 2035
0
1
2
3
4
5
6
2010 2015 2020 2025 2030 2035
NO
X E
mis
sio
ns (
Tg
)
BAU Continued Dual Standards
National Leapfrog World Class
Figure 9.1.11: Projected annual NOX emissions for each scenario through 2035

101
OVERVIEW OF INDIA’S VEHICLE EMISSIONS CONTROL PROGRAM
0.0
2.0
4.0
6.0
8.0
10.0
12.0
14.0
2010 2015 2020 2025 2030 2035
HC
Em
issi
ons
(T
g)
BAU Continued Dual Standards
National Leapfrog World Class
Figure 9.1.12: Projected annual HC emissions for each scenario through 2035
0
5
10
15
20
25
30
35
40
45
2010 2015 2020 2025 2030 2035
CO
Em
issi
ons
(T
g)
BAU Continued Dual Standards
National Leapfrog World Class
Figure 9.1.13: Projected annual CO emissions for each scenario through 2035
These figures show that rigorous and holistic regulatory measures are necessary to keep vehicle emissions below 2010 levels. Otherwise, emissions may fall in the short run but increase in the long term.
The IHAM projects the health and economic impacts of each of the scenarios analyzed in the IEM. Projected primary PM2.5 emissions were calculated based on analyses showing particles smaller than 2.5 microns in diameter to be about 76 percent of total vehicular PM emissions. These were then input to estimate future average annual ambient PM2.5 concentrations associated with those emissions, using an intake fraction (iF) method, and to forecast the resulting premature mortality. Details of the IHAM’s methodology are explained in Appendix A. The number of premature deaths avoided under each Program Scenario is compared with business as usual, as illustrated in Figure 9.1.14.

102
INTERNATIONAL COUNCIL ON CLEAN TRANSPORTATION
0
10,000
20,000
30,000
40,000
50,000
60,000
2010 2015 2020 2025 2030 2035
Ann
ual A
vera
ge
Avo
ided
Dea
ths
Continued Dual Standards National Leapfrog World Class
Figure 9.1.14: Projected annual avoided premature deaths through 2035 attributable to lower ambient PM2.5 concentrations for the Program Scenarios compared with business as usual.
Figure 9.1.14 shows that all three Program Scenarios point to a significant reduction in premature mortality. In the year 2035 alone, according to World Class program projec-tions, more than 55,000 lives can be saved solely from reductions in ambient PM2.5 concentrations stemming from lower vehicular emissions.
The predicted economic benefits associated with this reduced premature mortality, based on economists’ estimates of VSL in India, are shown in Figures 9.1.15 and 9.1.16.
0
20
40
60
80
100
120
0
100,000
200,000
300,000
400,000
500,000
600,000
2010 2015 2020 2025 2030 2035
Bill
ion
2011
US$
Cro
re 2
011
INR
Annual Economic Benefits
Continued Dual Standards National Leapfrog World Class
Figure 9.1.15: Projected annual economic benefits through 2035 associated with lower ambient PM2.5 levels for the Program Scenarios compared with business as usual

103
OVERVIEW OF INDIA’S VEHICLE EMISSIONS CONTROL PROGRAM
0.0%
0.2%
0.4%
0.6%
0.8%
1.0%
2010 2015 2020 2025 2030 2035
Eco
nom
ic B
enefi
ts’ P
erce
nt o
f G
DP
Continued Dual StandardsNational LeapfrogWorld Class
Figure 9.1.16: Projected annual economic benefits as a percentage of predicted GDP through 2035 as a result of lower ambient PM2.5 levels for the Program Scenarios com-pared with business as usual
Projected economic benefits correlate well with the predicted reduction in premature mortality. All three Program Scenarios suggest that India’s economy stands to gain from further regulations that reduce vehicular PM2.5 emissions. This is true for the near future as well as the long term. Additional regulations will be even more critical with time, as India’s vehicle population is predicted to increase more than fivefold from 2010 to 2035.
An important conclusion from the IEM and the IHAM is the need to take action sooner rather than later. All three Program Scenarios assume many of the same new vehicle emission and fuel quality standards to be in place by the end of this decade, though they make varying assumptions about the timing of implementation. Nevertheless, the difference in impacts between scenarios is evident even in the years beyond 2020. This suggests that acting early yields greater benefits in the distant future.
9.2 COST-BENEFIT ANALYSISThere are naturally costs associated with implementing any of the Program Scenarios. The most significant expenditures are for the technology and other investments required for cleaner vehicles and fuels. In this section, these costs are compared with the benefits India stands to gain from lower vehicular PM emissions.
9.2.1 Costs of manufacturing vehicles to meet more stringent standardsA recent ICCT study [164] estimated the average cost, on a per vehicle basis, of moving to progressively tighter tailpipe emission standards in India. The estimated cost to go from Bharat III to Bharat VI was about Rs. 6,150 ($120) per gasoline passenger car or utility vehicle and about Rs. 65,000 ($1,300) per diesel passenger car or utility vehicle. Looking at commercial vehicles, the study estimated a cost of about Rs. 2.87 lakh36 ($5,700) per diesel vehicle and about Rs. 1.65 lakh ($3,300) per CNG vehicle. For two- and three-wheelers, costs were estimated to be about Rs. 3000 ($60) and Rs. 2,400 ($50) per vehicle, respectively. Figure 9.2.1 shows the incremental costs from Bharat III to Bharat VI for four-wheeled vehicles. Two- and three-wheelers are not displayed because their costs are very low and primarily associated with a move from Bharat V to Bharat VI. Additional cost details from the ICCT study are available in Appendix F.
36 1 lakh = 100,000

104
INTERNATIONAL COUNCIL ON CLEAN TRANSPORTATION
0
50,000
100,000
150,000
200,000
250,000
300,000
0
1,000
2,000
3,000
4,000
5,000
6,000
III IV V VI
Co
st (
INR
)
Co
st (
US$
)
Emission Stage
Gasoline Cars
Diesel Cars
Diesel SUVs
Diesel Trucks/Buses
CNG Trucks/Buses
Figure 9.2.1: Per vehicle technology cost of going from Bharat III to Bharat VI for four-wheeled vehicles in India
Any increase in vehicle costs associated with a move to more stringent standards would almost certainly be passed on to consumers, most likely with a profit margin added on top. The U.S. Environmental Protection Agency (EPA) and National Highway Transporta-tion Safety Administration (NHTSA) found that increased vehicle production costs associated with tighter emission standards in the United States were not only shifted to consumers but multiplied by a factor of 1.5. [162]
The incremental costs are significantly higher for diesel vehicles compared with gasoline and CNG vehicles. As a result, moving to more demanding emission standards may also depress the sale of diesel vehicles—which have higher PM and NOX emissions—in favor of gasoline- and CNG-powered vehicles.
9.2.2 Cost to upgrade refineries and produce cleaner fuelsA 2012 joint MathPro/Hart Energy/ICCT study forecast that to advance from India’s current fuel production capability to 50-ppm-sulfur gasoline and diesel would cost an extra 0.15 Rs./L ($0.003/L) and 0.25 Rs./L ($0.005/L), respectively. [9] To upgrade from India’s current fuel production capability to 10–ppm-sulfur gasoline and diesel would cost an extra 0.35 Rs./L ($0.009/L) and 0.32 Rs./L ($0.008/L), respectively. These include capital and fixed costs as well as the increased incremental costs of production. While the costs are not trivial, the savings in health care expenditures and the increased economic activity unleashed by improved air quality will far offset any investment outlays.
9.2.3 Analysis of costs and benefitsComparing the costs and benefits of India’s existing emission control efforts, it has been estimated that clean vehicle technologies cost about Rs. 22,600 crore ($4.53 billion) total from the year 2000 through 2010. In addition to this, investments in refineries have cost around Rs. 32,000 crore ($6.4 billion), according to Indian oil companies. At the same time, benefits from cleaner fuels and vehicles over pre-2000 norms have pumped at least Rs. 600,000 crore ($120 billion) into the economy as a result of reduced mortal-ity. This results in a net benefit of Rs. 545,000 crore ($109 billion) to India.
The majority of costs for cleaner fuels are one-time-only investments to upgrade refiner-ies. Costs to produce cleaner vehicles do not steadily increase on an annual basis and can in fact decrease with time if standards stay the same.

105
OVERVIEW OF INDIA’S VEHICLE EMISSIONS CONTROL PROGRAM
The benefits calculated in this analysis are only from reduced mortality attributable to reduced PM2.5 emissions from vehicles. Benefits from lowered emissions of other pollut-ants, such as NOX, and the resulting lower O3 concentrations are not evaluated, though these have been shown to be deleterious to human health. [161, 165] Nor are the benefits of reduced morbidity assessed. The economic impacts of the co-benefits of lower air pollution, such as increased crop yields, also were not taken into account, though these can be substantial. [10]
Despite these limitations to the analysis of benefits, it is still clear that total benefits and the annual benefit/cost ratio will increase with time. This is because benefits increase exponentially as the advantages of cleaner and more fuel-efficient vehicles and reduced air pollution build on each other.
Furthermore, while the more onerous regulations of the World Class program, initially have higher costs, this analysis shows that projected benefits under that program overshadow the benefits under any other from the near term into the future indefinitely. This supports the conclusion that implementing stringent regulations as soon as is prac-ticable brings the greatest benefits in the long run. This is shown in Figure 9.2.2 below. The dashed lines show the annual costs of each Program Scenario, while the solid lines show annual benefits. In all cases, costs initially exceed benefits, but they are surpassed after just a few years. Benefits continue to grow exponentially, while costs increase only modestly. The disparity is largest under the World Class program.
0
20
40
60
80
100
120
0
100,000
200,000
300,000
400,000
500,000
600,000
2010 2015 2020 2025 2030 2035
2011
Bill
ion
US$
2011
Cro
re IN
R
Continued Dual Standards BenefitsNational Leapfrog BenefitsWorld Class Benefits
Continued Dual Standards CostsNational Leapfrog CostsWorld Class Costs
Figure 9.2.2: Annual costs and benefits under the Program Scenarios through 2035
The trends shown in Figure 9.2.2 are summed up in Tables 9.2.1 and 9.2.2 below. The tables show cumulative costs and benefits for each Program Scenario through 2025 and 2035, as contrasted with a continuation of today’s standards and infrastructure. Again, it is clear that net benefits and the benefits-to-cost ratio are both highest under the World Class program, especially in the long run.

106
INTERNATIONAL COUNCIL ON CLEAN TRANSPORTATION
Table 9.2.1: Cumulative costs and benefits of lower vehicular PM emissions for the year 2025 under the Program Scenarios (in crore rupees)
2025 Vehicle Costs Fuel Costs Benefits Net BenefitsBenefits/Costs
Ratio
Continued Dual Standards 256,710 62,245 483,773 164,818 1.52
National Leapfrog 450,663 55,668 873,755 367,424 1.73
World Class 594,002 58,466 1,025,086 372,618 1.57
Table 9.2.2: Cumulative costs and benefits of lower vehicular PM emissions for the year 2035 under the Program Scenarios (in crore rupees)
2035 Vehicle Costs Fuel Costs Benefits Net BenefitsBenefits/Costs
Ratio
Continued Dual Standards 599,488 150,733 2,281,113 1,530,892 3.04
National Leapfrog 952,057 129,966 4,171,763 3,089,740 3.86
World Class 1,223,177 119,916 4,826,278 3,483,186 3.59
9.3 CONCLUSIONSIndia has taken numerous measures over the past decade to reduce emissions from its vehicle fleet. Continuing this progress with further action to tighten vehicular emission and fuel quality standards, to close the gap with international best practices, and to enhance compliance and enforcement activities to remove gross emitters from India’s roads will profoundly improve air quality, public health, and the quality of life. While there will inevita-bly be costs associated with new standards, technologies, and compliance programs, just the benefits associated with cutting down on premature mortality as a result of reduced PM2.5 emissions will by themselves far outweigh costs in the long term.
Other benefits, while not quantitatively assessed in this study, will also have strong repercussions for India’s economy. These include lower incidence of mortality and morbidity from reductions in all vehicular air pollutants (not only particulate matter), increased agricultural yields, and climate change mitigation.

107
OVERVIEW OF INDIA’S VEHICLE EMISSIONS CONTROL PROGRAM
APPENDIX A: ICCT INDIA EMISSIONS AND HEALTH MODELS METHODOLOGY, DATA SOURCES, AND ASSUMPTIONS
ICCT INDIA HEALTH ASSESSMENT MODEL (IHAM)The ICCT India Health Assessment Model (IHAM) estimates the public health and eco-nomic impacts of particulate matter (PM) emissions from Indian motor vehicles. Three hundred and thirty-seven cities with more than 100,000 inhabitants in the year 2001 were identified from population statistics. For the years 2000 through 2035, the model estimates avoided premature deaths associated with cardiopulmonary disease, lung cancer, and acute respiratory infections (ARI). These impacts are then converted into economic terms to illustrate the cost of vehicular air pollution.
Health Impacts
MORTALITY EVALUATIONThe IHAM estimates annual premature cardiopulmonary disease and lung cancer deaths among adults over the age of thirty due to long-term exposure to PM2.5. The IHAM also estimates ARI mortality among children below the age of six due to exposure to all PM. The IHAM follows a population attributable fraction (PAF) method, which is a widely used approach in epidemiological studies. The IHAM’s use of the PAF method is described below.
The premature mortality (iP) due to long-term exposure to air pollution is a function of the mortality rate attributable to ambient concentrations of the pollutant of concern—in this case, PM2.5—as well as the share of the population affected and the size of the total population. This is given in Equation 1.
iP(Cobs) = Iobs×pp%×P ×PAF(Cobs) Equation 1
The IHAM builds in a mortality lag in its evaluation of avoided premature deaths. This lag was incorporated because benefits of reduced emissions would not likely be felt im-mediately but would be distributed among subsequent years. Therefore, the model took up the EPA’s recommendation for the following distribution of health benefits valuation: 30 percent of the avoided deaths in Year 1 are valued for that year; 50 percent of the avoided deaths are distributed evenly between Years 2 through 5; and the remaining 20 percent are distributed evenly between Years 6 through 20.
In the IHAM, P is the total population of each of the 337 Indian cities evaluated, and pp% is the share of the total population affected (percentage of the population above the age of 30 for cardiopulmonary and lung cancer mortality and below the age of six for ARI mortality). PAF(Cobs) is the population attributable fraction of disease at an observed pollutant concentration (Cobs). Iobs is the observed incidence rate of a given disease. The relationships between Iobs and the underlying incidence rate of disease (INE) in a popula-tion exposed at a counterfactual minimum exposure concentration, the PAF, and the relative risk (RR) of death for a population exposed at a certain concentration are given below in Equations 2–4.
INE = Iobs / RR(Cobs) Equation 2
PAF(Cobs) = RR(Cobs )-1
RR(Cobs)
Equation 3
Substituting Equations 2 and 3 into equation 1 yields Equation 4 below.

108
INTERNATIONAL COUNCIL ON CLEAN TRANSPORTATION
iP(Cobs) = pp%×P×INE×(RR(Cobs)-1) Equation 4
Similar to Equation 4, an equation can be derived to compute the mortality rate attributable to exposure to an arbitrary ambient PM concentration (C*). This is given by Equation 5.
iP(C*) = pp%×P×INE×(RR(C*)-1) Equation 5
Subtracting Equation 4 from Equation 5 yields the change in premature deaths associ-ated with the change in population exposure from an observed concentration to a new concentration. This is ultimately what the IHAM calculates. It is shown in Equation 6.
∆iP = pp%×P×INE×[RR(C*)-RR(Cobs)]=pp%×P×INE×∆RR Equation 6
RR itself is a function of ambient PM concentrations, and RR equations were derived from the literature for adult cardiopulmonary mortality, adult lung cancer mortality, and child ARI mortality. These RR equations are shown in Equations 7 and 8. Equation 7 applies to PM2.5 for the two types of adult mortality, while Equation 8 applies to all PM for child ARI mortality.
RR(Cobs) = [Cobs]β
CNE
Equation 7
RR(Cobs) = exp [β(Cobs – CNE)] Equation 8
β is a disease-specific constant. Cobs represents the observed annual average PM2.5 or PM concentration for each city. CNE, the baseline no exposure concentration, was set to 5 μg/m3 for PM2.5 and 10 μg/m3 for all PM, based on the literature.
Rewriting Equations 7 and 8 for C* instead of Cobs and subtracting RR(Cobs) from RR(C*) leads to the following results, which can then be substituted into Equation 6.
∆RR = C*β – Cobsβ
CNEβ
Equation 9
∆RR = exp[β(Cobs – CNE)] × {exp[β(C* – C_obs ) – 1]} Equation 10
∆iP = pp% × P × ∆IE = pp% × P × Iobs × [ RR(C*, CNE) -1 ]RR(Cobs,CNE) Equation 9
In the IHAM, C* in Equations 9 and 10 is the theoretical annual average ambient PM or PM2.5 concentration under a scenario with different vehicle emissions from the observed case. Transportation-related PM concentrations are calculated using an intake fraction (iF) method. This approach avoids the use of an air quality dispersion model. The intake fraction is the ratio of PM inhaled to PM emitted. Knowing the PM intake fraction for a particular city, PM emissions in that city, the population average breathing rate (Q), and city population (P), ambient PM concentrations are calculated by Equation 10.
C = iF × EQ × P
Equation 10
MORBIDITY EVALUATIONWhile morbidity impacts such as chronic obstructive pulmonary disease in adults, asthma incidence in children, preterm birth, and low birth weight were considered, none were included in the India Health Assessment Model. There were four important reasons for this, explained below.
1. The model’s current version is based on the World Health Organization (WHO)’s Global Burden of Disease study methods, which did not assess the effects of ambi-ent PM2.5 on morbidity.

109
OVERVIEW OF INDIA’S VEHICLE EMISSIONS CONTROL PROGRAM
2. Reliable data for morbidity were not available on a national scale. Appropriate metrics and definitive studies for candidate diseases require analysis that goes beyond the scope of this project.
3. Many morbidity effects such as hospital admissions and treatment costs are more directly related to short-term spikes in ambient air pollution from various causes. These impacts were not included; instead, the model opts to evaluate the effects of consistent changes in ambient PM2.5.
4. The impacts of mortality far outweigh those of morbidity. Nevertheless, morbidity impacts are important and may be included in future work, pending resolution of the issues highlighted above.
INPUT DATAData for pp% were obtained from the United Nations Population Division, which has demographic projections for five-year intervals for all countries through the year 2100. Data were linearly extrapolated for years in between the five-year intervals. The India Health Assessment Model takes pp% values that represent the fraction of the population over the age of 30 when assessing lung cancer and cardiopulmonary mortality. The fraction of the population under the age of six is used to assess childhood mortality.
P is the total population of each of the 337 Indian cities evaluated. The Indian census provides data for the years 2000 and 2011 in each city. Population in other years was interpolated and extrapolated using all-India population projections and Indian percentage-urban population projections from the UN Population Division.
Intake fractions in each Indian city are provided by a separate global intake fraction model developed at the University of California, Berkeley, for all cities in the world with populations above 100,000. The IHAM input iF data for the year 2001, then extrapolated this for all years through 2035 based on data that showed that in India, on average, iF increases by 0.5408 percent for every 1 percent increase in population.
Cobs is the average annual ambient concentration of PM or PM2.5 in each Indian city. This was taken from a combination of modeled, ground-based, and satellite-derived data. This dataset contains average annual PM concentrations for every 10 km2 grid cell on earth based on 2005 data. PM concentrations were halved to obtain ambient PM2.5
concentrations. All 337 Indian cities were matched to this dataset using latitude and longitude data. Transportation-related ambient PM2.5 concentrations under the business-as-usual (BAU) scenario, the scenario most closely representing reality, for 2005 were subtracted from the data to obtain the nontransportation contribution to ambient PM2.5. That value was then kept constant for every other modeled year and added to the BAU transportation-related ambient PM2.5 concentration for that year. In this way, nontransportation contributions to ambient PM2.5 were kept constant, and only changes in ambient PM2.5 due to transportation-related emissions were analyzed.
β is a coefficient that defines the slope of the health impact function and is specific to the health impact being evaluated. These coefficients were derived by the WHO.
Observed adult cardiopulmonary, adult lung cancer, and child ARI mortality rates were taken from the WHO. Cardiopulmonary mortality is the sum of upper and lower respiratory infections; hypertensive, ischemic, cerebrovascular, and inflammatory heart diseases; and chronic obstructive pulmonary disease, asthma, and other respiratory diseases (ICD-9 codes 401–5, 410–14, 418–22, 425–39, 460–519). Lung cancer mortality is the sum of mortality stemming from trachea, bronchus, and lung cancers (ICD-9 code 162). Child mortality is given by the acute respiratory infection mortality rate for children under the age of six (ICD-9 codes 381–82, 460–66, 480–87). For the years 2004 and 2008, mortality data are taken

110
INTERNATIONAL COUNCIL ON CLEAN TRANSPORTATION
from WHO subregional estimates for high-mortality South Asian, East Asian, and Southeast Asian countries. This grouping, known as SEAR-D, includes India, Bangladesh, Bhutan, North Korea, the Maldives, Myanmar, Nepal, and Timor-Leste. For the years 2015 and 2030, WHO Southeast Asia regional mortality predictions are extrapolated for SEAR-D countries, and these data are used. For all other years, baseline mortality was linearly extrapolated from 2004, 2008, 2015, and 2030 data. SEAR-D data were used in lieu of India-specific data because India-specific data did not provide mortalities that were keyed to age.
Emissions (E) data were taken from the ICCT India Emissions Model (IEM). Since the IEM produces national emission estimates, these were allocated to all 337 cities based on their percentage of the country’s total population. This may not accurately reflect the breakdown of the vehicle population in the country, but it serves as a reasonable proxy in the absence of better data.
Q, the population average breathing rate, was taken from the literature and assumed to remain constant for all populations [167].
Economic BenefitsAn estimate of the public health impact of vehicle emissions on the Indian economy was evaluated for each year between 2000 and 2035. This is given by Equation 11.
V = ∆iP × $ Equation 11
V is the total value of the economic impacts of vehicular emissions on public health; ∆iP is the number of avoided premature deaths due to reduced vehicle emissions in any given year (with mortality lag; see the next paragraph); and $ represents the average value of a statistical life (VSL) for India. The critical variable in economic benefits assessment is VSL. The VSL is a numerical value that represents an individual’s willingness to pay for a change in survival risk. In this study, the VSL is the amount the average Indian is willing to pay to avoid premature death from vehicular air pollution. It is typically calculated by dividing individual willingness to pay by the risk change. For example, if an individual is willing to pay $5 to reduce his or her annual mortality by 1 in 10,000, the VSL is $50,000 (or $5 divided by 1/10,000). The VSL is commonly misunderstood as the moral worth or inherent value of an individual. It is rather the rate at which individuals are willing to exchange their own income for a small reduction in mortality risk over a certain time period.
For India, an estimate of the VSL in the year 1990 is taken from the literature. The VSL for all other years is extrapolated based on past and projected Indian gross national income (GNI) at purchasing power parity (PPP) values and a VSL elasticity factor. Annual GNI at PPP data were obtained from the World Bank.
VSL elasticity gives the percentage change in VSL that would be expected from a 1 percent change in income. A VSL elasticity of one suggests that the VSL increases at the same rate as economic development. In other words, increases in one’s willingness to invest in personal safety increase in proportion to one’s personal income. Most studies of the VSL elasticity in high-income countries find that VSL increases at roughly half the rate of income, a VSL elasticity of 0.5. This low value may reflect the presence of institutions and investments in public safety that reduce a personal preference for further expenditures in this area. In studies that look across countries in various stages of economic development, VSL elasticity is higher than one. This may indicate the absence of strong institutions and public investments in personal safety.
In the absence of conclusive studies on VSL elasticity in India, a VSL elasticity factor of unity was chosen for the IHAM, even though this is likely an underestimate of VSL growth relative to income in India.

111
OVERVIEW OF INDIA’S VEHICLE EMISSIONS CONTROL PROGRAM
ICCT INDIA EMISSIONS MODEL (IEM)This section provides an overview of the IEM but does not describe in detail all the aspects of data collection and preparation. Nor does it describe in detail every calcula-tion undertaken by the IEM to generate results. To describe these things in their entirety would require time and space beyond the scope of this report.
Using a modular design, the IEM assesses annual emissions of various pollutants from India’s vehicle fleet. It considers all on-road vehicles. It does not currently evaluate emissions from nonroad vehicles, although it has the capability to do so. The model also assesses the annual cost of implementing cleaner fuels and vehicle technologies as new standards and policies are adopted. The modular design makes it relatively straightforward to expand both emissions and cost assessments to additional vehicle and fuel types.
InputsThe most basic inputs into the IEM are denoted as “Basic Definitions.” These inputs define the level of analysis that is conducted and allow for the entry of up to 20 vehicle types, 10 fuel types, 15 emissions species, and 15 emission control levels (per vehicle type). The current set of inputs defines 15 vehicle types, eight fuel types, nine emission species, and 11 emission control levels.
A second set of inputs is denoted as “VKT Curves.” These inputs define the relationship between vehicle kilometers traveled (VKT) and vehicle age for each vehicle type (in terms of the fraction of annual new vehicle VKT accumulated by vehicles of different ages). By definition, new vehicles have an input value of one, and other values generally decline as vehicles age, under the assumption that older vehicles are driven less than newer ones. Data for each vehicle type are input for each of the 50 vehicle ages and 51 calendar years (2000–2050) evaluated by the model. Currently, the IEM assumes the same relationships for all calendar years analyzed. “VKT Curves” data are based on U.S. National Highway Transportation Safety Administration (NHTSA) data modified for India based on economic and demographic data.
“Survival Curves” denote a set of inputs that define data on the relationship between vehicle survival and vehicle age for each vehicle type and calendar year. These data define the rate at which new vehicles are retired. New vehicles have the highest value, close to unity, because they are least likely to become inactive during their first year on the road. Survival values then drop as vehicles age since more vehicles retire with each successive year of use. “Survival Curves” data exist for vehicles up to 50 years old. Although data input is calendar-year-specific, the current IEM assumes the same relationships for all calendar years analyzed. “Survival Curves” data are based on NHTSA survival curves data modified for India. It is assumed that the population-weighted average age of vehicles in India is 15 years, except for two- and three-wheelers, for which the corresponding average age is 12 years.
“Sales & VKT” data define annual vehicle sales and new vehicle VKT by vehicle type and calendar year. For the years 2003–2010, the Society of Indian Automobile Manufacturers and Segment Y (a research firm) sales data are used for vehicle sales estimates. For all other years, vehicle sales are forecast based on GDP and population projections for India. New vehicle VKT data are based on NHTSA VKT data modified to produce the “all ages” average annual VKT estimated for vehicles in India. This VKT input also allows the user to “turn off” the VKT aging function defined by the “VKT Curves” data (as described above), although the current model is set to keep the VKT aging function “on.”
“Vehicle Stock” data define the base-year (calendar-year 2000) vehicle population in India by vehicle age for each vehicle type. Data are required to be input only for calen-

112
INTERNATIONAL COUNCIL ON CLEAN TRANSPORTATION
dar-year 2000, although “observed” data can be input for all years up to calendar-year 2050. Data for all years for which explicit population data are not entered are calculated by the IEM based on sales and VKT inputs. The model currently defines only calendar-year 2000 data, which are based on Indian vehicle registration data and NHTSA survival curve data adjusted for India.
“Stock Restrictions” data allow the user to evaluate the effects of non-market-based vehicle stock adjustments, such as those that would result from forced vehicle scrappage requirements. Data on the oldest vehicles still allowed, the fraction of vehicles forced into retirement that are replaced, and the year the non-market-based program starts can be input for each vehicle type. In its current baseline configuration, the IEM assumes that no such programs are in place, but users can easily evaluate program impacts by setting the appropriate inputs as defined by the program being evaluated.
“Fueling Shares” data define the fraction of vehicle sales that belong to a certain fuel type for each vehicle type. Data are input for each model year evaluated by the IEM (1951–2050) and are checked for each year to ensure that the fractions sum to unity. Segment Y data are used for vehicle model years 2006–2010. For years before 2006, “Fueling Shares” data are extrapolated, and for years after 2010, data are input based on future scenario assumptions.
“Fuel VKT Factors” define data on the variability of VKT by fuel type for each vehicle type and model year evaluated by the IEM (1951–2050). For example, if model-year 2015 electric vehicles are expected to be driven only half as much as typical model-year 2015 vehicles (for which the annual VKT data are defined by the “Sales & VKT” and “VKT Curves” data discussed above), then “Fuel VKT Factors” for 2015 electric vehicles should be set to 0.5. The IEM currently assumes that vehicles of all fuel types are equally used with respect to each other for all vehicle model years, but this can be changed if necessary.
“Fuel Sulfur” inputs define the amount of sulfur contained in each fuel type by calendar year. For the years 2000–2010, India’s fuel sulfur standards were input, and for the years 2011–2050, fuel sulfur levels were input based on future scenario assumptions. These data are used to adjust emissions estimates for all emission species that have been shown to be sensitive to fuel sulfur content.
“Veh Ctrl Fractions” define data on the fraction of vehicle sales that are subject to a particular control level by vehicle model year (1951–2050) and vehicle type. For exam-ple, model-year 2030 sales might be split into “Euro 3,” “Euro 4,” “Euro 5”, and “Euro 6” sales shares (or any other shares that are appropriate). India’s historical vehicular emission standards were used for input data up to the 2010 vehicle model year. After that, “Veh Ctrl Fractions” data are input based on currently forecast standards and future scenario assumptions.
“Ctrl Costs” define data on per vehicle costs by control level for each fuel type and vehicle type. “Ctrl Costs” data are further differentiated by calendar year to account for cost changes over time.
“High Emitter Profiles” define data on the fraction of vehicles that are high emitters (ve-hicles assumed to have either unregulated emissions or inordinately high emissions) by vehicle age. Separate “High Emitter Profiles” can be input as necessary to differentiate between the high-emitter shares for different vehicle types, control levels, or emission species. Currently, however, the IEM defines only a single profile, which was developed based on the assumption that 50 percent and 85 percent of Indian vehicles would be high emitters after 12 and 20 years, respectively (with a maximum cap of 95 percent for older vehicles). Additional profiles can be added as necessary.
113
OVERVIEW OF INDIA’S VEHICLE EMISSIONS CONTROL PROGRAM
“High Emitter Profile IDs” define the high-emitter profile that is assigned to particular vehicle types, fuel types, and control levels. Currently all are assigned to the one high-emitter profile in the IEM, but this can be altered as appropriate.
“Fuel Sulfur Effects” define a series of parameters that are used to estimate the impact of fuel sulfur on emissions. Sulfur effects are defined individually for each vehicle type, each fueling type, each emission species, and each control level. The data currently encoded in the IEM are derived from the U.S. Environmental Protection Agency’s MO-BILE6 emission factor model.
“Zero Mile Emission Rates (ZMERs)” define the level of emissions at zero mileage for each vehicle type, fueling type, and emission species. Emission rates can be either control-level dependent or model-year dependent. For example, CO2 emissions are generally independent of emission control level and, therefore, defined on a model-year basis. Similarly, all electric vehicle emissions are dependent on power generation facility emissions, and these also vary over time and are more easily characterized on an annual (model-year) basis. Other emission species are dependent on emissions control level regardless of model year. Thus, the model contains two separate input formats so that the user can enter both model–year- and control-level-dependent emission rates. “Zero Mile Emission Rates” are also input into the IEM for ordinary (normal-emitter) vehicles and high-emitter vehicles separately. Currently, for all vehicle types except electric vehicles, ZMERs are organized by emission control level for all emission species except carbon dioxide. For carbon dioxide and all power plant–based emissions associated with electric vehicle deployment, ZMERs are organized by vehicle model year. ZMERs data are developed using a combination of Automotive Research Association of India (ARAI) emissions test data and data extracted from the MOBILE6 emission factor model.
“Deterioration Rates (DRs)” define data relating the change in emission rates over time. DRs are input in the same way as ZMERs, with one set for ordinary vehicles and another for high-emitter vehicles, and are applied to ZMERs on the basis of accumulated mileage to determine an overall emission rate for vehicles of any age. Like ZMERs data, DRs data are developed using a combination of ARAI emissions test data and data extracted from the MOBILE6 emission factor model.
MethodologyThe IEM first calculates the population of vehicles (vehicle stock) by type for all calendar years for which the user has not entered explicit stock data. Vehicle stock for calendar-year 2001 is calculated based on sales of new vehicles and the vehicle stock from calendar-year 2000 adjusted for vehicle retirement using the “Survival Curves” data. This process is repeated for successive years and all vehicle types to generate an estimate of the vehicle-type-specific population for all calendar years. These data are then split into specific fuel types by applying the “Fueling Shares” data. The resulting estimates are fed into the “Modeled Veh Stock” spreadsheet.
Next, two sets of VKT estimates are calculated: per vehicle cumulative VKT estimates and total annual VKT estimates. Both are calculated for each vehicle type, each fuel type, each model year, and each calendar year. Per vehicle cumulative VKT is calculated by multiplying new vehicle VKT estimates from the “Sales & VKT” dataset by the “VKT Curves” data for each successive calendar year (as the vehicle ages, its annual mileage declines), unless the user has “turned off” the “VKT Curves” aging function as described above. These estimates are also adjusted by the “Fuel VKT Factors” data (currently set to unity in the IEM). The per vehicle cumulative VKT data are exported to the “Modeled Cum Per-Veh VKT” spreadsheet in the form of per vehicle cumulative VKT estimates by fuel type, model year, and calendar year for each vehicle type. These data are subse-

114
INTERNATIONAL COUNCIL ON CLEAN TRANSPORTATION
quently used by the IEM to define an overall emission rate on the basis of input ZMERs and DRs applied to the cumulative VKT.
Total annual VKT is estimated for each vehicle type, each fuel type, each model year, and each calendar year by multiplying annual per vehicle VKT (as opposed to the cumulative per vehicle VKT previously calculated) by the previously estimated “Modeled Veh Stock” data. Annual per vehicle VKT is developed in the same fashion as the cumulative per vehicle VKT data, but only the VKT that accrues in the calendar year being evaluated is of interest. The resulting estimates are output to the “Modeled Total VKT” spreadsheet in the same form as the “Modeled Cum Per-Veh VKT” data. These data are subsequently used to develop annual emission estimates by applying annual emission factors (devel-oped from the per vehicle cumulative VKT estimates) to estimated annual VKT.
Emissions estimates are calculated after “Modeled Veh Stock” and “Modeled Total VKT” have been calculated. First, ZMERs and DRs data are read in for ordinary and high-emitter vehicles. Then “High Emitter Profiles” data are registered, followed by “Fuel Sulfur,” “Veh Ctrl Fractions,” and “Fuel Sulfur Effects” data. Once these data are entered, a sulfur adjustment (A) is calculated as follows:
A = aSe + bAb
Equation 1
In Equation 1, S is sulfur content, Ab is the sulfur effect associated with a “base” sulfur content (which reflects the sulfur content with which the input emission factors are as-sociated, set to 500 ppm for gasoline and diesel and zero for other fuels for the emission factor data currently encoded in the IEM), and a, e, and b are coefficients dependent on emission species, fuel type, vehicle type, and control level. S in equation 1 is from “Fuel Sulfur” data, while the rest of the terms are from “Fuel Sulfur Effects” data. Equation 1 was derived using data from the MOBILE6 emission factor model.
The next step in the emissions calculation procedure combines the ZMERs and DRs data to create an aggregate (or basic) emission rate (BER). Basic in this context is intended to signify an emission rate that is unadjusted for fuel sulfur effects or other influences. Since there are two forms of DRs input, one for linear deterioration rates and one for nonlinear deterioration rates, there are also two forms for the BER calculation, as follows:
BER = ZMER + DR × CumVKT Equation 2
BER = ZMER × DRCumVKT Equation 3
Currently, only evaporative hydrocarbon emissions employ the nonlinear deteriora-tion function; all other emission estimates employ the linear structure. Note that the depicted equations are not precise in that, for clarity purposes, they do not indicate all of the unit conversion factors actually employed in the calculation. They do, neverthe-less, properly convey the fundamental calculations being made. ZMER and DR are input ZMERs and DRs data, respectively (whether by control level or model year). CumVKT is per vehicle cumulative VKT. BERs are developed separately for normal and high emitters.
The net emission factor (EmisFac) is then calculated, taking into account both any fuel sulfur adjustments and the share of normal and high emitters. This calculation is as follows:
EmisFac = (BERNorm × A × (1 – HiEmFrac)) + (BERHiEm × HiEmFrac) Equation 4
In Equation 4, BERNorm and BERHiEm represent the BERs for normal and high emitters, respectively, A is the sulfur adjustment calculated in Equation 1, and HiEmFrac is the fraction of vehicles that are high emitters, as calculated from the “High Emitter Profiles” input data. It is important to note that the sulfur adjustment is only applied to normal

115
OVERVIEW OF INDIA’S VEHICLE EMISSIONS CONTROL PROGRAM
emitters. This is because fuel sulfur affects after-treatment systems, which are assumed to be nonexistent or nonfunctional for high emitters. For emission species that are control-level dependent, EmisFac is calculated for each control level individually and the resulting calculations are then weighted by the fraction of vehicles in each control level to derive an overall average emission factor estimate.
Finally, total emissions estimates are calculated by multiplying EmisFac (in grams per kilometer) by annual VKT data (in kilometers) to yield total emissions of a particular pollutant by vehicle type, fuel type, calendar year, and model year.
After emissions estimates are generated, the IEM also calculates control costs associated with the technologies expected to be employed as emission standards for vehicles become more stringent. This is done by weighting control cost input data from “Ctrl Costs” by entered “Veh Ctrl Fractions” data to derive a net per vehicle cost by model/calendar year, vehicle type, and fuel type. The average per vehicle cost is then multiplied by estimated vehicle populations at the same level of resolution to derive an overall annual cost estimate. For all years after 2000, the cost calculation only needs to be performed for new vehicle sales (since there is no added cost for vehicles that were sold in previous years). However, for calendar-year 2000, control costs must be estimated for both new vehicles and for pre-2000 model-year vehicles (since the model has not “previously” estimated such costs, given that calendar-year 2000 is the first calendar year evaluated). This is done by looping through each vehicle age in calendar-year 2000 and essentially “unscrapping” vehicles of each age (using “Survival Curves” data) to estimate the number of such vehicles originally sold. This estimated vehicle population is multiplied by average per vehicle costs calculated in the same fashion as discussed for calendar years after 2000. The costs for vehicles of each age are then aggregated to derive an estimate of the cumulative control costs incurred through calendar-year 2000, and this estimate forms the basis upon which the costs for subsequent calendar years are added. It is important to note that annual cost estimates generated by the IEM do not reflect incremental costs from one year to another but rather the total costs associated with a particular control level. To calculate incremental control costs for a particular year, the cost estimate for the preceding calendar year is subtracted from the cost estimate for that year.
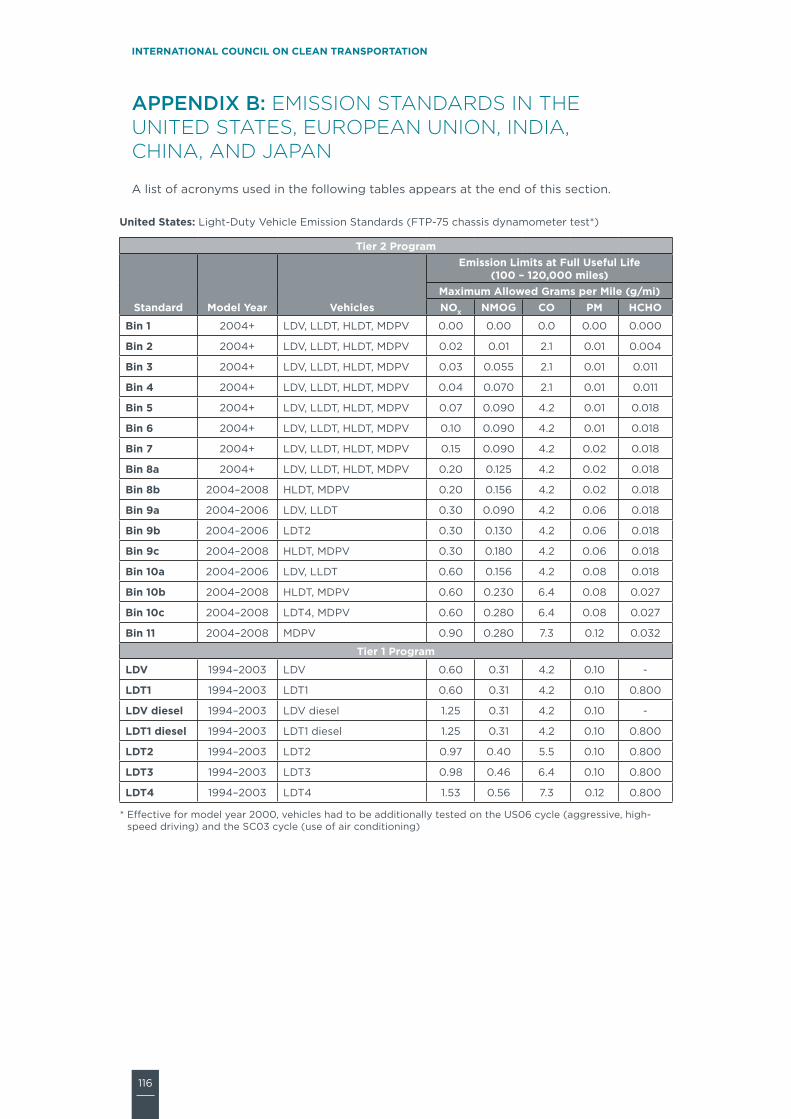
116
INTERNATIONAL COUNCIL ON CLEAN TRANSPORTATION
APPENDIX B: EMISSION STANDARDS IN THE UNITED STATES, EUROPEAN UNION, INDIA, CHINA, AND JAPAN
A list of acronyms used in the following tables appears at the end of this section.
United States: Light-Duty Vehicle Emission Standards (FTP-75 chassis dynamometer test*)
Tier 2 Program
Standard Model Year Vehicles
Emission Limits at Full Useful Life (100 – 120,000 miles)
Maximum Allowed Grams per Mile (g/mi)NOX NMOG CO PM HCHO
Bin 1 2004+ LDV, LLDT, HLDT, MDPV 0.00 0.00 0.0 0.00 0.000
Bin 2 2004+ LDV, LLDT, HLDT, MDPV 0.02 0.01 2.1 0.01 0.004
Bin 3 2004+ LDV, LLDT, HLDT, MDPV 0.03 0.055 2.1 0.01 0.011
Bin 4 2004+ LDV, LLDT, HLDT, MDPV 0.04 0.070 2.1 0.01 0.011
Bin 5 2004+ LDV, LLDT, HLDT, MDPV 0.07 0.090 4.2 0.01 0.018
Bin 6 2004+ LDV, LLDT, HLDT, MDPV 0.10 0.090 4.2 0.01 0.018
Bin 7 2004+ LDV, LLDT, HLDT, MDPV 0.15 0.090 4.2 0.02 0.018
Bin 8a 2004+ LDV, LLDT, HLDT, MDPV 0.20 0.125 4.2 0.02 0.018
Bin 8b 2004–2008 HLDT, MDPV 0.20 0.156 4.2 0.02 0.018
Bin 9a 2004–2006 LDV, LLDT 0.30 0.090 4.2 0.06 0.018
Bin 9b 2004–2006 LDT2 0.30 0.130 4.2 0.06 0.018
Bin 9c 2004–2008 HLDT, MDPV 0.30 0.180 4.2 0.06 0.018
Bin 10a 2004–2006 LDV, LLDT 0.60 0.156 4.2 0.08 0.018
Bin 10b 2004–2008 HLDT, MDPV 0.60 0.230 6.4 0.08 0.027
Bin 10c 2004–2008 LDT4, MDPV 0.60 0.280 6.4 0.08 0.027
Bin 11 2004–2008 MDPV 0.90 0.280 7.3 0.12 0.032
Tier 1 Program
LDV 1994–2003 LDV 0.60 0.31 4.2 0.10 -
LDT1 1994–2003 LDT1 0.60 0.31 4.2 0.10 0.800
LDV diesel 1994–2003 LDV diesel 1.25 0.31 4.2 0.10 -
LDT1 diesel 1994–2003 LDT1 diesel 1.25 0.31 4.2 0.10 0.800
LDT2 1994–2003 LDT2 0.97 0.40 5.5 0.10 0.800
LDT3 1994–2003 LDT3 0.98 0.46 6.4 0.10 0.800
LDT4 1994–2003 LDT4 1.53 0.56 7.3 0.12 0.800
* Effective for model year 2000, vehicles had to be additionally tested on the US06 cycle (aggressive, high-speed driving) and the SC03 cycle (use of air conditioning)
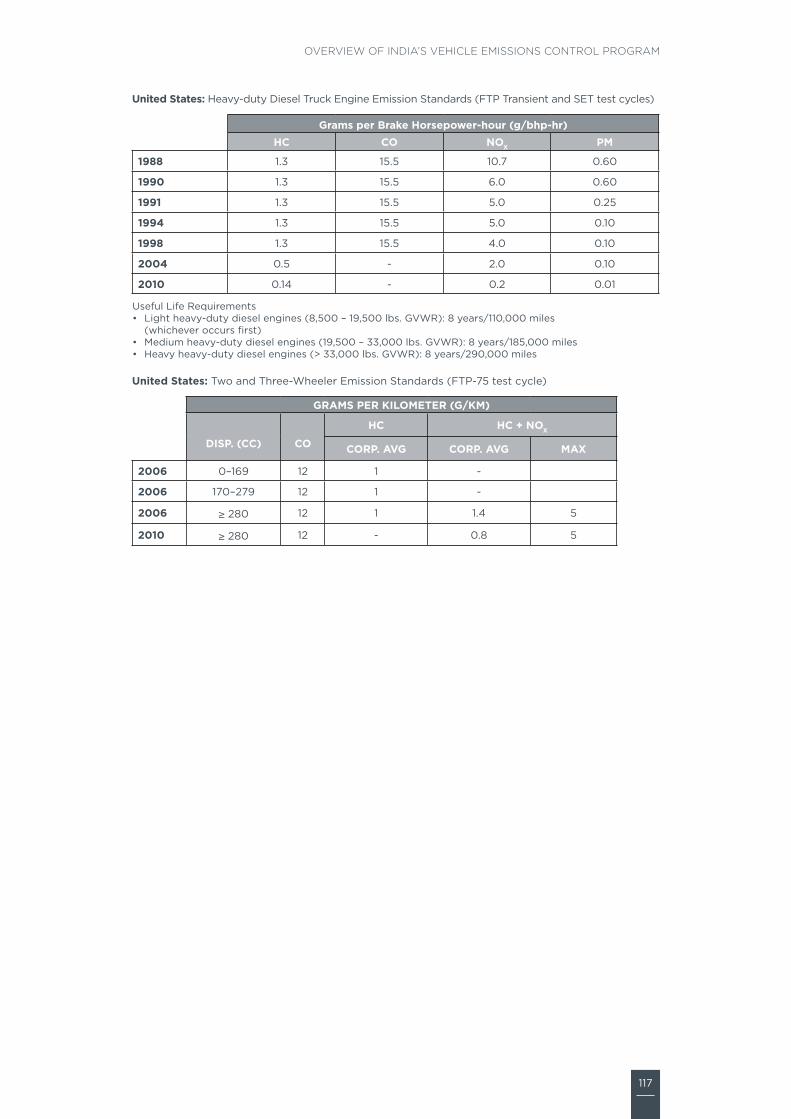
117
OVERVIEW OF INDIA’S VEHICLE EMISSIONS CONTROL PROGRAM
United States: Heavy-duty Diesel Truck Engine Emission Standards (FTP Transient and SET test cycles)
Grams per Brake Horsepower-hour (g/bhp-hr)HC CO NOX PM
1988 1.3 15.5 10.7 0.60
1990 1.3 15.5 6.0 0.60
1991 1.3 15.5 5.0 0.25
1994 1.3 15.5 5.0 0.10
1998 1.3 15.5 4.0 0.10
2004 0.5 - 2.0 0.10
2010 0.14 - 0.2 0.01
Useful Life Requirements• Light heavy-duty diesel engines (8,500 – 19,500 lbs. GVWR): 8 years/110,000 miles
(whichever occurs first)• Medium heavy-duty diesel engines (19,500 – 33,000 lbs. GVWR): 8 years/185,000 miles• Heavy heavy-duty diesel engines (> 33,000 lbs. GVWR): 8 years/290,000 miles
United States: Two and Three-Wheeler Emission Standards (FTP-75 test cycle)
GRAMS PER KILOMETER (G/KM)
DISP. (CC)
CO
HC HC + NOX
CORP. AVG CORP. AVG MAX
2006 0–169 12 1 -
2006 170–279 12 1 -
2006 ≥ 280 12 1 1.4 5
2010 ≥ 280 12 - 0.8 5

118
INTERNATIONAL COUNCIL ON CLEAN TRANSPORTATION
United States: Nonroad Equipment and Rural Vehicles Emission Standards*
GRAMS PER KILOWATT HOUR (G/KWH)
TIER 1 DATE CO HC NMHC+NOX NOX PM
P < 8 kW 2000 8.00 - 10.50 - 1.00
8 ≤ P < 19 2000 6.60 - 9.50 - 0.80
19 ≤ P < 37 1999 5.50 - 9.50 - 0.80
37 ≤ P < 75 1998 - - - 9.20 -
75 ≤ P < 130 1997 - - - 9.20 -
130 ≤ P < 225 1996 11.40 1.30 - 9.20 0.54
225 ≤ P < 450 1996 11.40 1.30 - 9.20 0.54
450 ≤ P < 560 1996 11.40 1.30 - 9.20 0.54
P ≥ 560 2000 11.40 1.30 - 9.20 0.54
TIER 2
P < 8 kW 2005 8.00 - 7.50 - 0.80
8 ≤ P < 19 2005 6.60 - 7.50 - 0.80
19 ≤ P < 37 2004 5.50 - 7.50 - 0.60
37 ≤ P < 75 2004 5.00 - 7.50 - 0.40
75 ≤ P < 130 2003 5.00 - 6.60 - 0.30
130 ≤ P < 225 2003 3.50 - 6.60 - 0.20
225 ≤ P < 450 2001 3.50 - 6.40 - 0.20
450 ≤ P < 560 2002 3.50 - 6.40 - 0.20
P ≥ 560 2006 3.50 - 6.40 - 0.20
TIER 3
37 ≤ P < 75 2008 5.00 - 4.70 - 0.40
75 ≤ P < 130 2007 5.00 - 4.00 - 0.30
130 ≤ P < 225 2006 3.50 - 4.00 - 0.20
225 ≤ P < 450 2006 3.50 - 4.00 - 0.20
450 ≤ P < 560 2006 3.50 - 4.00 - 0.20
TIER 4
P < 8 kW 2008 8.00 - 7.50 - 0.40
8 ≤ P < 19 2008 6.60 - 7.50 - 0.40
19 ≤ P < 37 2008 5.50 - 7.50 - 0.30
2013 5.50 - 4.70 - 0.03
37 ≤ P < 56 2008 5.00 - 4.70 - 0.30
2013 5.00 - 4.70 - 0.03
56 ≤ P < 130 2012–2014a 5.00 0.19 - 0.40 0.02
130 ≤ P ≤ 560 2012–2014b 3.50 0.19 - 0.40 0.02
P > 560 2011 3.50 - 0.40 3.50 0.10
P > 560, Generator sets > 900 2011 3.50 - 0.40 0.67 0.10
P > 560 2015 3.50 - 0.19 3.50 0.04
P > 560, all generator sets 2015 3.50 - 0.19 0.67 0.03
* The following nonroad engine categories are exempt from regulation: • Engines used in railway locomotives; those are subject to separate EPA regulations • Engines used in marine vessels, also covered by separate EPA regulations. Marine engines below 37
kW (50 hp) are subject to Tier 1–2—but not Tier 4—nonroad standards. Certain marine engines that are exempted from marine standards may be subject to nonroad regulations
• Engines used in underground mining equipment. Diesel emissions and air quality in mines are regulated by the Mine Safety and Health Administration (MSHA)
• Hobby engines (below 50 cc per cylinder) a PM/CO: full compliance by 2012. HC/NOX: 50% of engines must comply in 2012–13 and full compliance by
2014 b PM/CO: full compliance by 2011. HC/NOX: 50% of engines must comply in 2011–13 and full compliance by
2014

119
OVERVIEW OF INDIA’S VEHICLE EMISSIONS CONTROL PROGRAM
European Union: Emission Standards for Passenger Cars* (ECE15 + EUDC chassis dynamometer test)
Grams per Kilometer (g/km) #/km
Diesels Date CO HC HC+ NOX NOX PM PN
Euro 1f 1992.07 2.72 (3.16) - 0.97 (1.13) - 0.140 (0.180)
Euro 2, IDI 1996.01 1 - 0.7 - 0.08
Euro 2, DI 1996.01a 1 - 0.9 - 0.1
Euro 3 2000.01 0.64 - 0.56 0.5 0.05
Euro 4 2005.01 0.5 - 0.3 0.25 0.025
Euro 5a 2009.09b 0.5 - 0.23 0.18 0.005e
Euro 5b 2011.09g 0.5 - 0.23 0.18 0.005e 6.0 x 10¹¹
Euro 6 2014.09 0.5 - 0.17 0.08 0.005e 6.0 x 10¹¹
Gasoline
Euro 1f 1992.07 2.72 (3.16) - 0.97 (1.13) - -
Euro 2 1996.01 2.2 - 0.5 - -
Euro 3 2000.01 2.3 0.2 - 0.15 -
Euro 4 2005.01 1 0.1 - 0.08 -
Euro 5 2009.09b 1 0.1c - 0.06 0.005d,e
Euro 6 2014.09 1 0.1c - 0.06 0.005d,e 6.0 x 10¹¹ d,h
* Category M1 vehicles. For Euro 1 through 4, vehicles greater than 2,500 kg were type approved as Category N1 vehicles
a – After Sept 30, 1999, vehicles with DI engines had to meet the IDI limitsb – Jan 2011 for all modelsc – NMHC limit = 0.068 g/kmd – applicable only to vehicles with DI enginese – 0.0045 g/km using the PMP measurement proceduref – Euro 1 values in brackets are conformity of production limitsg – Jan 2013 for all modelsh – 6.0x10¹² per km within three years of implementation of Euro 6
Useful Life Requirements• Euro 3: 80,000 km or 5 years (whichever occurs first); in lieu of an actual deterioration run,
manufacturers may use the following deterioration factors:• Spark ignition (gasoline): 1.2 for CO, HC, and NOX• Compression ignition (diesel): 1.1 for CO, NOX, HC+NOX, and 1.2 for PM
• Euro 4: 100,000 km or 5 years (whichever occurs first)• Euro 5/6: in-service conformity of 100,000 km or 5 years; durability testing of pollution control
devices for type approval is 160,000 km or 5 years (whichever occurs first); in lieu of a durability test, manufacturers may use the following deterioration factors (Euro 6 deterioration factors to be determined):• Spark ignition: 1.5 for CO, 1.3 for HC, 1.6 for NOX, and 1.0 for PM• Compression ignition: 1.5 for CO, 1.1 for NOX and HC+NOX, and 1.0 for PM

120
INTERNATIONAL COUNCIL ON CLEAN TRANSPORTATION
European Union: Emission Standards for Heavy-Duty Diesel Engines Grams per Kilowatt hour (g/kWh) 1/m
Date Test Cycle CO HC NOX PM Smoke
Euro I1992, < 85 kW
ECE R-49
4.5 1.1 8 0.612
1992, > 85 kW 4.5 1.1 8 0.36
Euro II1996.10 4 1.1 7 0.25
1998.10 4 1.1 7 0.15
Euro III
1999.10, EEVs* only
ESC and ELR
1.5 0.25 2 0.02 0.15
2000.10 2.1 0.66 50.1 0.8
0.13a 0.8
Euro IV 2005.10 1.5 0.46 3.5 0.02 0.5
Euro V 2008.10 1.5 0.46 2 0.02 0.5
Euro VI 2013.01 WHSC 1.5 0.13 0.4 0.01
a for spark ignition engines only; Euro III through V: natural gas only; Euro VI: natural gas and liquid petroleum gas
EEV – enhanced environmentally friendly vehicle
Grams per Kilowatt hour (g/kWh)
Date Test Cycle CO NMHC CH4a NOx PMb
Euro III
1999.10, EEVs only
ETC
3 0.4 0.65 2 0.02
2000.10 5.45 0.78 1.6 50.16
0.21c
Euro IV 2005.10 4 0.55 1.1 3.5 0.03
Euro V 2008.10 4 0.55 1.1 2 0.03
Euro VI 2013.01 WHTC 4 0.16d 0.5 0.46 0.01
a for spark ignition engines only; Euro III through V: natural gas only; Euro VI: natural gas and liquid petroleum gasb not applicable for Euro III and IV gasoline enginesc for engines with swept volume per cylinder less than 0.75 dm3 and rated power speed greater than 3,000 min-1
d total hydrocarbon for diesel engines
Useful Life RequirementsEffective October 2005 for new type approvals and October 2006 for all type approvals, manufacturers must adhere to emission limits over the following useful life periods:
Vehicle CategoryPeriod (whichever event occurs first)Euro IV, V Euro VI
N1 and M2 100,000 km/5 years 160,000 km/5 years
N2
200,000 km/6 years 300,000 km/6 yearsN3 < 16 metric tons
M3 Class I, Class A, and Class B < 7.5 metric tons
N3 > 16 metric tons500,000 km/7 years 700,000 km/7 yearsM3 Class III, and Class B > 7.5 metric
tons

121
OVERVIEW OF INDIA’S VEHICLE EMISSIONS CONTROL PROGRAM
European Union: Emission Standards for Two- and Three-Wheelers (ECE Reg 40 test cycle for Mopeds and ECE Reg 47 test cycle for Motorcycles and Tricycles)
2-WHEELERS GRAMS PER KILOMETER (G/KM)Euro 2 DATE CO HC NOX
< 150 cc 2004.04.01 5.50 1.20 0.30
≥ 150 cc 2004.04.01 5.50 1.00 0.30
Euro 3
< 150 cc 2006.01.01 2.00 0.80 0.15
≥ 150 cc 2006.01.01 2.00 0.30 0.15
3-WHEELERS
All Gasoline 2003.01.01 7.00 1.50 0.40
All Diesel 2003.01.01 2.00 1.00 0.65

122
INTERNATIONAL COUNCIL ON CLEAN TRANSPORTATION
European Union: Emission Standards for Nonroad Engines
GRAMS PER KILOWATT HOUR (G/KWH)
Stage I DATE CO HC HC+NOX NOX PM
37 ≤ P < 75 1999.04 6.50 1.30 - 9.20 0.85
75 ≤ P < 130 1999.01 5.00 1.30 - 9.20 0.70
130 ≤ P ≤ 560 1999.01 5.00 1.30 - 9.20 0.54
Stage II
18 ≤ P < 37 2001.01 5.50 1.50 - 8.00 0.80
37 ≤ P < 75 2004.01 5.00 1.30 - 7.00 0.40
75 ≤ P < 130 2003.01 5.00 1.00 - 6.00 0.30
130 ≤ P ≤ 560 2002.01 3.50 1.00 - 6.00 0.20
Stage IIIA
19 ≤ P < 37 2007.01 5.50 - 7.50 - 0.60
37 ≤ P < 75 2008.01 5.00 - 4.70 - 0.40
75 ≤ P < 130 2007.01 5.00 - 4.00 - 0.30
130 ≤ P ≤ 560 2006.01 3.50 - 4.00 - 0.20
Stage IIIB
37 ≤ P < 56 2013.01 5.00 - 4.70 - 0.025
56 ≤ P < 75 2012.01 5.00 0.19 - 3.30 0.025
75 ≤ P < 130 2012.01 5.00 0.19 - 3.30 0.025
130 ≤ P ≤ 560 2011.01 3.50 0.19 - 2.00 0.025
Stage IV
56 ≤ P < 130 2014.10 5.00 0.19 - 0.40 0.025
130 ≤ P ≤ 560 2014.01 3.50 0.19 - 0.40 0.025
INLAND WATER VESSELSStage IIIA
D ≤ 0.9 dm3/cyl, P > 37 kW 2007.01 5.00 - 7.50 - 0.40
0.9 < D ≤ 1.2 2007.01 5.00 - 7.20 - 0.30
1.2 < D ≤ 2.5 2007.01 5.00 - 7.20 - 0.20
2.5 < D ≤ 5 2009.01 5.00 - 7.20 - 0.20
5 < D ≤ 15 2009.01 5.00 - 7.80 - 0.27
15 < D ≤ 20, P ≤ 3,300 2009.01 5.00 - 8.70 - 0.50
15 < D ≤ 20, P > 3,300 2009.01 5.00 - 9.80 - 0.50
20 < D ≤ 25 2009.01 5.00 - 9.80 - 0.50
25 < D ≤ 30 2009.01 5.00 - 11.00 - 0.50
RAIL TRACTION ENGINESStage IIIA
P > 130 kW 2006.01 3.50 - 4.00 - 0.20
130 ≤ P ≤ 560 2007.01 3.50 - 4.00 - 0.20
P > 560 2009.01 3.50 0.50 - 6.00 0.20
P > 2,000, D > 5 L/cyl 2009.01 3.50 0.40 - 7.40 0.20
Stage IIIBP > 130 kW (railcar) 2012.01 3.50 0.19 - 2.00 0.025
P > 130 kW (locomotive) 2012.01 3.50 - 4.0 - 0.025

123
OVERVIEW OF INDIA’S VEHICLE EMISSIONS CONTROL PROGRAM
India: Emission Standards for Passenger Cars (Modified NEDC test cycle)
GRAMS PER KILOMETER (G/KM)
GASOLINE DATE CO HC HC+NOX NOX PM DETERIORATION FACTOR
India Stage I* 2000 2.72 - 0.97 - - -
Bharat Stage IIa 2001a 2.20–5.00 - 0.50–0.70 - - -
Bharat Stage IIIb 2005b 2.30–5.22 0.20–0.29 - 0.15–0.21 - CO: 1.2 HC: 1.2 NOX: 1.2
Bharat Stage IVc 2010c 1.00–2.27 0.10–0.16 - 0.08–0.11 - CO: 1.2 HC: 1.2 NOX: 1.2
DIESEL
India Stage I* 2000 2.72–6.90 - 0.97–1.70 - 0.14–0.25 -
Bharat Stage IIa 2001a 1.00–1.50 - 0.70–1.20 - 0.08–0.17 -
Bharat Stage IIIb 2005b 0.64–0.95 - 0.56–0.86 0.50–0.78 0.05–0.10 CO: 1.1 NOX: 1.0 HC+NOX: 1.0 PM: 1.2
Bharat Stage IVc 2010c 0.50–0.74 - 0.30–0.46 0.25–0.39 0.025–0.06 CO: 1.1 NOX: 1.0 HC+NOX: 1.0 PM: 1.2
* Exact standard dependent on seat number and weight of vehiclea From April 1, 2000, in Delhi; January 1, 2001, in Mumbai; July 1, 2001, in Kolkata and Chennai; April 1, 2003, in Bangalore,
Hyderabad, Ahmedabad, Pune, Surat, Kanpur, and Agra; April 1, 2005, in the rest of the countryb From April 1, 2005, in Delhi, Mumbai, Kolkata, Chennai, Bangalore, Hyderabad, Ahmedabad, Pune, Surat, Kanpur, and
Agra; April 1, 2010, in the rest of the countryc From April 1, 2010, in Delhi, Mumbai, Kolkata, Chennai, Bangalore, Hyderabad, Ahmedabad, Pune, Surat, Kanpur, and Agra
India: Emission Standards for Heavy-Duty Vehicles
By Engine Dynamometer GRAMS PER KILOWATT HOUR (G/KWH) DETERIORATION FACTOR DATE CO HC NOX PM
India Stage I 2000 4.5 1.1 8 0.36 -
Bharat Stage II 2001a 4 1.1 7 0.15 -
Bharat Stage III - ESC Test 2005b 2.1 0.66 5 0.10/0.13X CO: 1.1 HC: 1.05 NOX: 1.05 PM: 1.1
Bharat Stage III - ETC Test 2005b 5.45 0.78 5 0.16 CO: 1.1 HC: 1.05 NOX: 1.05 PM: 1.1y
Bharat Stage IV - ESC Test 2010c 1.5 0.46 3.5 0.02
Bharat Stage IV - ETC Test 2010c 4 0.55 3.5 0.03
x for engines with swept volume <0.75 liter per cylinder and rated power speed >3000 rpma From October 24, 2001, in Delhi; October 31, 2001, in Mumbai, Kolkata and Chennai; April 1, 2003, in Bangalore, Hyderabad,
Ahmedabad, Pune, Surat, Kanpur, and Agra; April 1, 2005, in the rest of the countryb From April 1, 2005, in Delhi, Mumbai, Kolkata, Chennai, Bangalore, Hyderabad, Ahmedabad, Pune, Surat, Kanpur, and Agra;
April 1, 2010, in the rest of the countryc From April 1, 2005, in Delhi, Mumbai, Kolkata, Chennai, Bangalore, Hyderabad, Ahmedabad, Pune, Surat, Kanpur, and Agray for gasoline CO: 1.1 HC: 1.05 NMHC: 1.2 CH4: 1.2 NOX: 1.05
India: Emission Standards for Two and Three-Wheelers
GASOLINE GRAMS PER KILOMETER (G/KM) 2-WHEELERS DATE CO HC+NOX PM DETERIORATION FACTOR
India Stage I 2000 2.00 2.00 -
Bharat Stage II 2005.04.01 1.50 1.50 -
Bharat Stage III 2008.04.01–2010.04.01 1.00 1.00 - CO: 1.2 HC+NOX: 1.2
3-WHEELERS
India Stage I 2000 4.00 2.00 -
Bharat Stage II 2005.04.01 2.25 2.00 -
Bharat Stage III 2008.04.01–2010.04.01 1.25 1.25 - CO: 1.2 HC+NOX: 1.2
DIESEL
Bharat Stage II 2005.04.01 1.00 0.85 0.10
Bharat Stage III 2008.04.01-2010.04.01 0.50 0.50 0.05 CO: 1.1 HC+NOX: 1 PM: 1.2

124
INTERNATIONAL COUNCIL ON CLEAN TRANSPORTATION
India: Emission Standards for Nonroad Equipment and Rural Vehicles
CONSTRUCTION MACHINERY GRAMS PER KILOWATT HOUR (G/KWH)Bharat Stage II DATE CO HC HC+NOX NOX PM
P < 8 kW 2008.10 8 1.3 - 9.2 1
8 ≤ P < 19 2008.10 6.6 1.3 - 9.2 0.85
19 ≤ P < 37 2007.10 6.5 1.3 - 9.2 0.85
37 ≤ P < 75 2007.10 6.5 1.3 - 9.2 0.85
75 ≤ P < 130 2007.10 5 1.3 - 9.2 0.7
130 ≤ P < 560 2007.10 5 1.3 - 9.2 0.54
Bharat Stage III
P < 8 kW 2011.04 8 - 7.5 - 0.8
8 ≤ P < 19 2011.04 6.6 - 7.5 - 0.8
19 ≤ P < 37 2011.04 5.5 - 7.5 - 0.6
37 ≤ P < 75 2011.04 5 - 4.7 - 0.4
75 ≤ P < 130 2011.04 5 - 4 - 0.3
130 ≤ P < 560 2011.04 3.5 - 4 - 0.2
AGRICULTURAL TRACTORS
Bharat Stage I 1999.10 14 3.5 - 18 -
Bharat Stage II 2003.06 9 - 15 - 1
Bharat Stage III 2005.10 5.5 - 9.5 - 0.8
Bharat Stage IIIA
P < 8 kW 2010.04 5.5 - 8.5 - 0.8
8 ≤ P < 19 2010.04 5.5 - 8.5 - 0.8
19 ≤ P < 37 2010.04 5.5 - 7.5 - 0.6
37 ≤ P < 56 2011.04 5 - 4.7 - 0.4
56 ≤ P < 75 2011.04 5 4.7 0.4
75 ≤ P < 130 2011.04 5 - 4 - 0.3
130 ≤ P < 560 2011.04 3.5 - 4 - 0.2
GENERATOR SETS
For P ≤ 800 kW DATE CO HC NOX PM SMOKE
P ≤ 19 kW 2003.07 5 1.3 9.2 0.6 0.7
2004.07 3.5 1.3 9.2 0.6 0.7
2005.07 3.5 1.3 9.2 0.3 0.7
19 < P ≤ 50 2004.07 3.5 1.3 9.2 0.5 0.7
2004.07 3.5 1.3 9.2 0.3 0.7
50 < P ≤ 176 2004.07 3.5 1.3 9.2 0.3 0.7
176 < P ≤ 800 2004.11 3.5 1.3 9.2 0.3 0.7
For P > 800 kW CO (mg/Nm3) NMHC (mg/Nm3) NOX (ppm (V)) PM (mg/Nm3)
Until 2003.06 150 150 1,100 75
2003.07–2005.06 150 100 970 75
2005.07 150 100 710 75

125
OVERVIEW OF INDIA’S VEHICLE EMISSIONS CONTROL PROGRAM
China: Emission Standards for New† Light-Duty Vehicle Type Approval (ECE15 + EUDC chassis dynamometer test*)
Diesels China Beijing Shanghai GuangzhouProductionconformity
In-use surveillance Durability OBD requirement
China I2000.01 (T1)
1999.01 1999.07 Sample of one No 80,000 km No
2001.01 (T2)a
China II2004.07 (T1)
2002.01 2003.03 2005.07 Sample of one No 80,000 km No
2005.07 (T2)
China IIIb 2007.07 2005.12.31 2007.12.31 2006.09 Sample of three Yes 5 years or
80,000 km2008.07 (< 6 seats, GVWR <
2.5t); 2010.07 for other vehicles
China IVc 2010.07 Sample of three Yes 5 years or
80,000 km 2013.01
Gasoline
China I2000.01 (T1)
1999.01 1999.07 Sample of one No 80,000 km No
2001.01 (T2)a
China II2004.07 (T1)
2003.01 2003.03 2005.07 Sample of one No 80,000 km No
2005.07 (T2)
China IIIb 2007.07 2005.12.31 2007.12 (taxis only) 2006.09 Sample of
three Yes 5 years or 80,000 km
2008.07 (< 6 seats, GVWR < 2.5t); 2010.07 for other vehicles
China IV 2010.07 2008.03 2009.11 2010.06 Sample of three Yes 5 years or
80,000 km 2010.07
† Standards for existing models typically implemented one year later than standards for new models.* Speed points are mostly the same as in ECE15 and EUDC cycles, except for some transient speed points a Type 1 M1 LDVs carry no more than 6 seats and weigh no more than 25 metric tons; T2-other non-type 1 LDVsb The China III standard was supposed to be effective in 2007 for all new vehicle type approval, but a transition period of one year was
allowed, so all approved vehicles could still be sold until 2008 (Jan for HDV and July for LDV)c The China IV standards for diesel vehicles was delayed 28 months from the initial planned implementation date
China: Emission Standards for New† Heavy-Duty Vehicle Type Approval*
Diesels China Beijing Shanghai GuangzhouProductionconformity
In-use surveillance Durability
OBD requirement
China I 2000.09 1999.01 1999.07 Sample of one No - No
China II 2003.09 2003.01 2003.03 2005.07 Sample of one No
5 years or 80,000 kme
No5 years or 100,000 kmf
6 years or 250,000 kmg
China IIIb 2007.01 2005.12.31 2007.12.31 2006.09 Sample of three No Same as Euro II No
China IVh 2013.07 2008.07a,c 2009.11c Sample of three Yes Same as Euro II Yes
China Vh Sample of three Yes Same as Euro II Yes
Gasoline
China I 2003.01 2002.07 Sample of one No 5 years or 80,000 km No
China II 2003.09 2003.09 Sample of one No 5 years or 80,000 kmd No
China IIIb 2009.07 2009.07 Sample of three No 5 years or 80,000 kmd 2009.07
China IV 2012.07 Sample of three Yes 5 years or 80,000 km 2012.07
† Standards for existing models typically implemented one year later than standards for new models* China follows the same test cycle schedule as the EU but uses the Japan05 test for durability in Euro III and later modelsa Requires OBD for NOXb The China III standard was supposed to be effective in 2007 for all new vehicle type approval, but a transition period of one year was
allowed, so all approved vehicles could still be sold until 2008 (January for HDV and July for LDV)c In Beijing, China IV covers diesel public buses and diesel trucks used for postal and public sanitary (garbage collection) services; in
Shanghai, it covers those categories regulated under China IV in Beijing plus construction trucksd Took effect on October 1, 2007e Durability requirement for M1 vehicles with gross vehicle weight greater than 3.5 metric tons and M2 vehiclesf Durability requirement for M3 vehicles less than 7.5 metric tons; N2 and N3 vehicles less than 16 metric tonsg Durability requirement for M3 vehicles over 7.5 metric tons and N3 vehicles over 16 metric tonsh The China IV standard for diesel vehicles was delayed 28 months from the initial planned implementation date. At the same time the
China IV standard was delayed, the China V standard was put on indefinite hold

126
INTERNATIONAL COUNCIL ON CLEAN TRANSPORTATION
China: Emission Standards for New Motorcycle Type Approval
Year Began Engine Size (cc)
CO (g/km)
HC (g/km)
NOx (g/km)
HC+ NOx (g/km)
PM (g/km)
Driving Cycle
Cold Start
Durability (km)
Two-Wheeler with Two-Stroke Engine
2003<50 cc (moped) 6 3 ECE R47 No 6,000 1
≥50 cc 8 4 0.1 ECE R40 No 6,000 1
2004 ≥50 cc 5.5 1.2 0.3 ECE R40 No 10,000 1
2005 <50 cc (moped) 1 1.2 ECE R47 No 10,000 1
Two-Wheeler with Four-Stroke Engine
2003<50 cc (moped) 6 3 ECE R47 No 6,000 1
≥50 cc 13 3 0.3 ECE R40 No 6,000 1
2004 ≥50 cc 5.5 1.2 0.3 ECE R40 No 10,000 1
2005 <50 cc (moped) 1 1.2 ECE R47 No 10,000 1
2008
< 50 cc 1 1.2 ECE R47 Yes 10,000
50-150 cc 2 0.8 0.15 ECE R40 Yes18,000 2
30,000 3
≥ 150 cc 2 0.3 0.15 ECE R40 +EUDC Yes
18,000 2
30,000 3
Three-Wheeler with Two-Stroke Engine
2003 < 50 cc (moped) 12 6 ECE R47 No 6,000 1
2003 ≥50cc 12 6 0.15 ECE R40 No 6,000 1
2004 ≥50cc 7 1.5 0.4 ECE R40 No 10,000 1
2005 < 50 cc (moped) 3.5 1.2 ECE R47 No 10,000 1
2008
< 50 cc (moped 3.5 1.2 ECE R47 Yes 10,000
≥ 50cc 4 1 0.25 ECE R40 Yes12,000 4
18,000 2
30,000 3
Three-Wheeler with Four-Stroke Engine
2003 < 50 cc (moped) 12 6 ECE R47 No 6,000 1
2003 ≥50cc 19.5 4.5 0.45 ECE R40 No 6,000 1
2005 < 50 cc (moped) 3.5 1.2 ECE R40 No 10,000 1
2005 ≥50cc 7 1.5 0.4 ECE R40 No 10,000
2008
< 50 cc (moped) 3.5 1.2 ECE R47 Yes
≥50cc 4 1 0.25 ECE R40 Yes12,000 4
18,000 2
30,000 3
Notes: 1 If installed with emission control device; 2 Maximum speed under 130 km/h and displacement above 150cc; 3 Maximum speed equal to or above 130 km/h and displacement above 150cc; 4 Displacement between 50 and 150 cc; Moped: Maximum speed under or equal to 50 km/h and displacement under or equal to 50 cc

127
OVERVIEW OF INDIA’S VEHICLE EMISSIONS CONTROL PROGRAM
Japan: Emission Standards for Gasoline- and LPG-Fueled Vehicles
New
ModelAll models/
imports Test Cycle Unit CO HCa NOX PMNew Short Term (Mean/Maxb)
PC 2000.1 2002.0910–15 mode g/km 0.67/1.27 0.08/0.17 0.08/0.17 -
11 mode g/test 19.0/31.1 2.20/4.42 1.40/2.50 -
Mini CV 2002.1 2003.0910–15 mode g/km 3.30/5.11 0.13/0.25 0.13/0.25 -
11 mode g/test 38.0/58.9 3.50/6.40 2.20/3.63 -
Light CV 2000.1 2002.0910–15 mode g/km 0.67/1.27 0.08/0.17 0.08/0.17 -
11 mode g/test 19.0/31.1 2.20/4.42 1.40/2.50 -
Medium CV 2001.1 2003.0910–15 mode g/km 2.10/3.36 0.08/0.17 0.13/0.25 -
11 mode g/test 24.0/38.5 2.20/4.42 1.60/2.78 -
New Long Term (Mean/Max)
PC
2005.10 2007.09 10–15 mode + 11 mode
g/km
1.15/1.92 0.05/0.08 0.05/0.08 -
2008.10 2010.09 JC08 cold + 10–15 mode 1.15/1.92 0.05/0.08 0.05/0.08 -
- 2013.03d JC08H + JC08C 1.15/1.92 0.05/0.08 0.05/0.08 -
Mini CV 2007.10 2008.09/ 2007.09 4.02/6.67 0.05/0.08 0.05/0.08 -
Light CV
2005.10 2007.09 10–15 mode + 11 mode 1.15/1.92 0.05/0.08 0.05/0.08 -
2008.10 2010.09 JC08 cold + 10–15 mode 1.15/1.92 0.05/0.08 0.05/0.08 -
2013.03d JC08H + JC08C 1.15/1.92 0.05/0.08 0.05/0.08 -
Medium LCV
2005.10 2007.09 10–15 mode + 11 mode 2.55/4.08 0.05/0.08 0.07/0.10 -
2008.10 2010.09 JC08 cold + 10–15 mode 2.55/4.08 0.05/0.08 0.07/0.10 -
2013.03d JC08H + JC08C 1.15/1.92 0.05/0.08 0.05/0.08 -
Post New Long Termc
PC
2009.1 2009.10/ 2010.09
JC08H + JC08C g/km
1.15/1.92 0.05/0.08 0.05/0.08 0.005/0.007
Light LCV 1.15/1.92 0.05/0.08 0.05/0.08 0.005/0.007
Medium LCV 2.55/4.08 0.05/0.08 0.07/0.10 0.007/0.009
a From 2005, HC is measured as NMHC b Mean: to be met as a type-approval limit and as a production average; max: to be met as type-approval limit if sales are less than
2,000 per vehicle model per year and generally as an individual limit in series productionc New PM measurement method; technically modified methods for CO and other gasesd NLT Phase III only for IDI engines, not valid for direct injection lean-burn engines with NOX storage catalyst
Useful Life Requirements• PC, trucks, and buses with GVWR less than 3.5 metric tons: 80,000 km• PC, trucks, and buses with GVWR greater than 3.5 metric tons: 250,000 km
OBD – Diesel, Gasoline, and LPG• J-OBDII: enhanced OBD requirement for PCs and CVs with GVWR less than 3.5 metric tons from October 2008• EU/U.S. OBD standards accepted as equivalent

128
INTERNATIONAL COUNCIL ON CLEAN TRANSPORTATION
Japan: Emission Standards for Diesel Vehicles
New
Model
All models/ imports Test Cycle Unit CO HCa NOX PM
New Short Term (Mean/Maxb)
PC < 1,265 kg
2002.12004.09 10–15 mode g/km
0.63/0.98 0.12/0.24 0.28/0.43 0.052/0.11
PC > 1,265 kg 0.63/0.98 0.12/0.24 0.30/0.45 0.056/0.11
Light CV 0.63/0.98 0.12/0.24 0.28/0.43 0.052/0.11
Medium CV 2003.1 0.63/0.98 0.12/0.24 0.49/0.68 0.06/0.12
New Long Term (Mean/Max)
PC < 1,265 kg2005.10 2007.09 10–15 mode + 11 mode
g/km
0.63/0.84 0.024/0.032 0.14/0.19 0.013/ 0.0172008.10 2010.09 JC08 cold + 10–15 mode
PC > 1,265 kg2005.10 2007.09 10–15 mode + 11 mode
0.63/0.84 0.024/0.032 0.15/0.20 0.014/ 0.0192008.10 2010.09 JC08 cold + 10–15 mode
Light CV2005.10 2007.09 10–15 mode + 11 mode
0.63/0.84 0.024/0.032 0.14/0.19 0.013/ 0.0172008.10 2010.09 JC08 cold + 10–15 mode
Medium CV
2005.10 2007.09 10–15 mode + 11 mode0.63/0.84 0.024/0.032 0.25/0.33 0.015/ 0.020
2008.10 2010.09 JC08 cold + 10–15 mode
Post New Long Termc
PC2009.10 2009.10/
2010.09 JC08H + JC08C g/km
0.63/0.84 0.024/0.032 0.08/0.11e 0.005/0.007
Light LCV 0.63/0.84 0.024/0.032 0.08/0.11 0.005/0.007
Medium LCV 2010.10d 0.63/0.84 0.024/0.032 0.15/0.20 0.007/0.009
a From 2005, HC is measured as NMHC b Mean: to be met as a type-approval limit and as a production average; max: to be met as type-approval limit if sales are less than
2,000 per vehicle model per year and generally as an individual limit in series productionc New PM measurement method; technically modified methods for CO and other gasesd October 2010 for Medium CV with 1,700 kg < GVWR < 3,500 kg; October 2009 for Medium CV with 2,500 kg < GVWR < 3,500 kge For vehicles not exceeding 1,265 kg; for vehicles greater than 1,265 kg, the values are 0.15/0.20

129
OVERVIEW OF INDIA’S VEHICLE EMISSIONS CONTROL PROGRAM
California: LEV III Standards
LDVsCATEGORY* NMOG+NOX (G/MILE)
LEV160 0.160
ULEV125 0.125
ULEV70 0.070
ULEV50 0.050
SULEV30 0.030
SULEV20 0.020
MDVsCATEGORY* WEIGHT (GVW) NMOG+NOX (G/MILE)
LEV395 8,500-10,000 lbs 0.395
ULEV340 8,500-10,000 lbs 0.340
ULEV250 8,500-10,000 lbs 0.250
ULEV200 8,500-10,000 lbs 0.200
SULEV170 8,500-10,000 lbs 0.170
SULEV150 8,500-10,000 lbs 0.150
LEV630 10,001-14,000 lbs 0.630
ULEV570 10,001-14,000 lbs 0.570
ULEV400 10,001-14,000 lbs 0.400
ULEV270 10,001-14,000 lbs 0.270
SULEV230 10,001-14,000 lbs 0.230
SULEV200 10,001-14,000 lbs 0.200
* For the 2017 through 2021 model years, the interim in-use compliance standard for vehicles certifying to the 3 mg/mi particulate standard is 6 mg/mi. For the 2025 through 2028 model years, the interim in-use compliance standard for vehicles certifying to the 1 mg/mi particulate standard is 2 mg/mi
To be phased in over the 2014–2022 model years.

130
INTERNATIONAL COUNCIL ON CLEAN TRANSPORTATION
ACRONYMS10–15 mode cycle used in Japan for emission certification and fuel economy for
light-duty vehicles; derived from the 10-mode cycle by adding another 15-mode segment of a maximum speed of 70 km/h
11-mode a cold-start cycle used in Japan for emission certification and fuel economy for light-duty vehicles
ALVW adjusted loaded vehicle weight = average of the curb (empty) weight and the GVWR
CV commercial vehicle
DI direct injection
ECE R-49 13-mode (speed and load) steady-state diesel engine test cycle
ECE15 urban driving cycle, also known as UDC, devised to represent city driving conditions in the EU
EEV enhanced environmentally friendly vehicle
ELR engine test for smoke opacity measurement
ESC European Stationary Cycle, also known as the OICA/ACEA cycle, 13-mode, steady-state engine test that replaces the R-49
EUDC Extra Urban Driving Cycle; more aggressive, high-speed driving modes
FTP Transient an engine dynamometer test designed to simulate both urban and freeway driving for heavy-duty trucks and buses
FTP-75 test cycle for light-duty vehicles in the United States consisting of three phases: 1) cold start, 2) transient, and 3) hot start
GVWR gross vehicle weight rating = maximum fully loaded vehicle weight
HCHO formaldehyde
HLDT heavy light-duty truck; between 6,001 and 8,500 lbs. GVWR, includes LDT3 and LDT4
IDI indirect injection
JC08 new urban driving cycle for emission and fuel economy measurement that will fully replace the 10–15 mode cycle by 2011
JC08C JC08 test performed ‘cold’
JC08H JC08 test performed ‘hot’
LCV light commercial vehicle; GVWR less than 3,500 kg (2,500 kg before 2005)
LDT1 light-duty truck 1; up to 6,000 lbs. GVWR and up to 3,750 lbs. LVW
LDT2 light-duty truck 2; up to 6,000 lbs. GVWR and between 3,750 and 5,750 lbs. LVW
LDT3 light-duty truck 3; between 6,001 and 8,500 lbs. GVWR and between 3,750 and 5,750 lbs. ALVW
LDT4 light-duty truck 4; between 6,001 and 8,500 lbs. GVWR and over 5,750 lbs. ALVW
LDV light-duty vehicle
Light LCV light light commercial vehicle; GVWR < 1,700 kg
LLDT light light-duty truck; up to 6,000 lbs. GVWR, includes LDT1 and LDT2
LVW loaded vehicle weight = nominal empty vehicle weight + 300 lbs.
M1 Vehicles designed and constructed for the carriage of passengers and containing no more than eight seats in addition to the driver’s seat

131
OVERVIEW OF INDIA’S VEHICLE EMISSIONS CONTROL PROGRAM
M2 Vehicles designed and constructed for the carriage of passengers, containing more than eight seats in addition to the driver’s seat, and having a maximum mass (“technically permissible maximum laden mass”) not exceeding 5 metric tons
M3 Vehicles designed and constructed for the carriage of passengers, containing more than eight seats in addition to the driver’s seat, and having a maximum mass exceeding 5 metric tons
MDPV medium-duty passenger vehicle; light truck (SUV or minivan) between 8,500 and 10,000 lbs. GVWR
Medium LCV medium light commercial vehicle; 1,700 kg < GVWR < 3,500 kg
N1 Vehicles designed and constructed for the carriage of goods and having a maximum mass not exceeding 3.5 metric tons
N2 Vehicles designed and constructed for the carriage of goods and having a maximum mass exceeding 3.5 metric tons but not exceeding 12 metric tons
N3 Vehicles designed and constructed for the carriage of goods and having a maximum mass exceeding 12 metric tons
NMHC nonmethane hydrocarbons
NMOG nonmethane organic gases
OBD on-board diagnostics
PC passenger car
PM particulate matter
PMP Particle Measurement Program
SET Supplemental Emission Test (SET); steady-state engine dynamometer test used for certification in the United States

132
INTERNATIONAL COUNCIL ON CLEAN TRANSPORTATION
APPENDIX C: TECHNOLOGIES REQUIRED TO MEET EURO 4/IV, 5/V, 6/VI
LIGHT-DUTY VEHICLES (LDVs)Table C-1 presents the basic technologies required to comply with Euro 4, Euro 5, and Euro 6 emission levels of conventional pollutants.
Table C-1: Gasoline LDV technology requirements for control of conventional pollutants
GasolineRegulation
Euro 4 Euro 5 Euro 6
Regulated pollutants CO/NOX/HC CO/NOX/HC/(PM) CO/NOx/HC/(PM)
Emissions standard, g/km 1.0/0.08/0.1 1.0/ 0.06/ 0.1/ (0.005) 1.0/ 0.06/ 0.1/(0.005)
Emissions reduction vs. previous standard 57% / 50% / 50% 0 / 25% / 0 / - 0 / 0 / 0 / -
Engine-out emissions • Stoichiometric combustion Same as Euro 4 vehicles plus: Same as Euro 5 vehicles plus:
A/F control
• Electronic Injection,
• Electronic ignition, • Air-fuel management system improvements
• Conventional pollutants control same as Euro 5 technologies
• Multipoint fuel injection (MPFI)
• Variable valve timing (VVT) in large vehicles
• Improved controller and hardware
Improvements focused on fuel economy (FE):
• Improved fueling strategy for proper closed coupled (CC) catalyst operation
Stoichiometric GDIs require: Turbocharging, downsizing, and hybridization
• Use of EGR for NOX control • Improved injectors
• Higher press. Injection
• Linear range O2 sensor for A/F control.
After-treatment system
• Three-way catalyst (under-floor)
• Improvements in the TWC system
Same as Euro 5 vehicles
• A secondary O2 sensor is required for OBD
• GDIs might require specially formulated TWCs
• Closed coupled (CC) catalyst is required in some models
CO = carbon monoxide; HC = hydrocarbon; NOX = nitrogen oxides; PM = particulate matter
The elimination of the warm-up period during the test cycle and increased restriction on HC and CO emissions required the addition of a closed coupled (CC) cold-start catalyst. In addition, the fueling strategy is improved by keeping the closed coupled (CC) catalyst at the right temperature range for cold-start emissions control
Increased use of gas direct injection (GDI)—stoichiometric combustion—forces regula-tions to include PM emissions levels for GDI vehicles
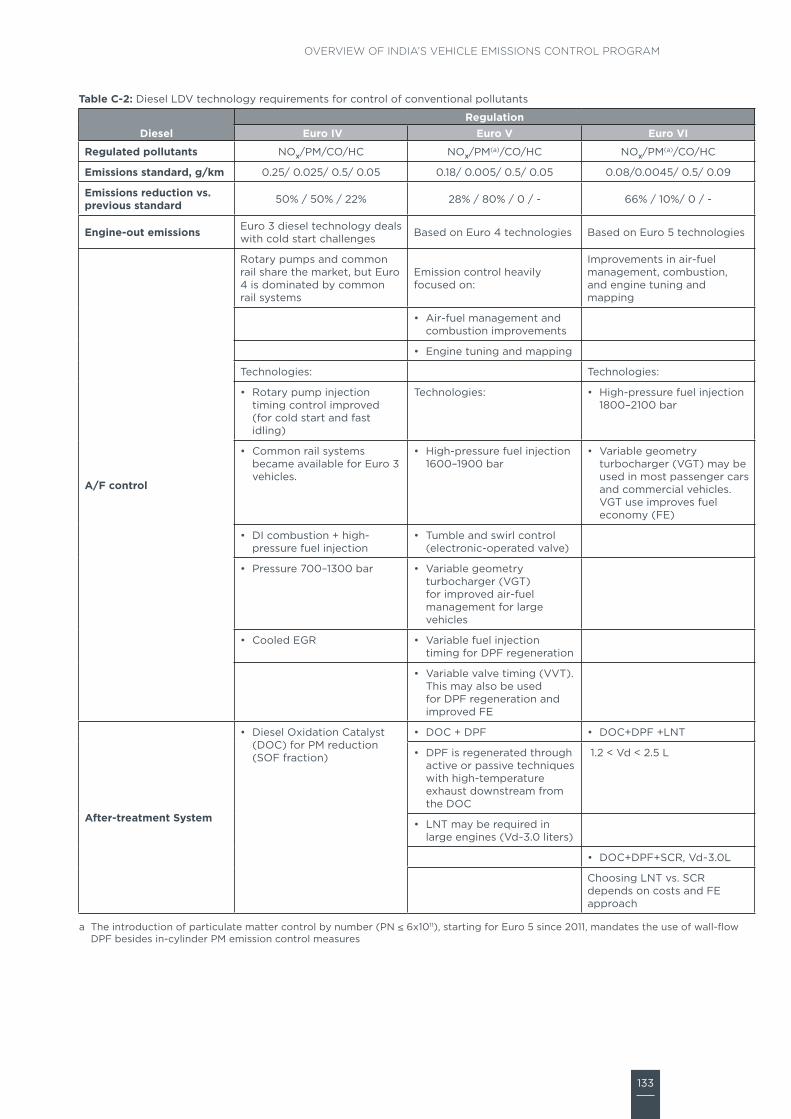
133
OVERVIEW OF INDIA’S VEHICLE EMISSIONS CONTROL PROGRAM
Table C-2: Diesel LDV technology requirements for control of conventional pollutants
DieselRegulation
Euro IV Euro V Euro VI
Regulated pollutants NOX/PM/CO/HC NOX/PM(a)/CO/HC NOX/PM(a)/CO/HC
Emissions standard, g/km 0.25/ 0.025/ 0.5/ 0.05 0.18/ 0.005/ 0.5/ 0.05 0.08/0.0045/ 0.5/ 0.09
Emissions reduction vs. previous standard 50% / 50% / 22% 28% / 80% / 0 / - 66% / 10%/ 0 / -
Engine-out emissions Euro 3 diesel technology deals with cold start challenges Based on Euro 4 technologies Based on Euro 5 technologies
A/F control
Rotary pumps and common rail share the market, but Euro 4 is dominated by common rail systems
Emission control heavily focused on:
Improvements in air-fuel management, combustion, and engine tuning and mapping
• Air-fuel management and combustion improvements
• Engine tuning and mapping
Technologies: Technologies:
• Rotary pump injection timing control improved (for cold start and fast idling)
Technologies: • High-pressure fuel injection 1800–2100 bar
• Common rail systems became available for Euro 3 vehicles.
• High-pressure fuel injection 1600–1900 bar
• Variable geometry turbocharger (VGT) may be used in most passenger cars and commercial vehicles. VGT use improves fuel economy (FE)
• DI combustion + high-pressure fuel injection
• Tumble and swirl control (electronic-operated valve)
• Pressure 700–1300 bar • Variable geometry turbocharger (VGT) for improved air-fuel management for large vehicles
• Cooled EGR • Variable fuel injection timing for DPF regeneration
• Variable valve timing (VVT). This may also be used for DPF regeneration and improved FE
After-treatment System
• Diesel Oxidation Catalyst (DOC) for PM reduction (SOF fraction)
• DOC + DPF • DOC+DPF +LNT
• DPF is regenerated through active or passive techniques with high-temperature exhaust downstream from the DOC
1.2 < Vd < 2.5 L
• LNT may be required in large engines (Vd~3.0 liters)
• DOC+DPF+SCR, Vd~3.0L
Choosing LNT vs. SCR depends on costs and FE approach
a The introduction of particulate matter control by number (PN ≤ 6x10¹¹), starting for Euro 5 since 2011, mandates the use of wall-flow DPF besides in-cylinder PM emission control measures

134
INTERNATIONAL COUNCIL ON CLEAN TRANSPORTATION
HEAVY-DUTY VEHICLES (HDVs)Tables C-3 and C-4 summarize basic emission control technologies and the fuel sulfur levels required for implementing each technology.
Table C-3: LDV technology requirements for control of conventional pollutants
Technology
Control Efficiency, % Reduction Fuel sulfur requirement,
ppm CommentsPM NOX HC CO
Three-way Catalyst - >90 >90 >90 <500
Applies to gasoline and natural gas engines with stoichiometric combustion
Well-established technology
EGR (w/ cooling) (a) 20–80 (a) - <500
NOx reduction depends on load conditions: having higher loads provides higher reductions
(a) PM and HC increase in engines without A/F management systems: electronic fuel timing and metering and variable geometry turbocharger (VGT)
U.S. 2010 engines and Euro V engines with proper A/F management systems may be able to achieve in-cylinder reduction of both NOx and PM
EGR is used at moderate loads in stoichiometric engines, both gasoline and natural gas
Diesel oxidation catalyst (DOC)
20–25 (a)
- >80 >80
<500 viable (a) High-load tests (b) Low-load tests
~50 (b) <350 preferred DOC only reduces SOF out of the total PM (no fine particles reduction)
Formaldehyde and acetaldehyde can be reduced by 50–90%
Partial Flow Filter (PFF) 40–70 - >80 >80 <350
Also known as Partial flow technologies (PFT), this catalyzed filter is a flow-through DPF. It is composed of a DOC upstream, which provides NO2 for soot oxidation downstream in catalytic-coated metallic or fiber mesh
PFFs generate lower exhaust back-pressure, and no maintenance is required
Diesel particle filter (DPF)
>70–95 (a)
- ~60 (c) - <50 required
It refers to catalyzed particle filters and the combination DOC + uncatalyzed wall-flow filter—commercially known as CRT
50–90 (b) Only technology that significantly reduces ultrafine particles. Low-sulfur fuels improve DPF performance
(a) Elemental carbon filtration (soot)
(b) Solid organic fraction (SOF). Conversion by catalytic oxidation
(c) HC reduction due to catalytic oxidation intended for catalyst regeneration
No filtration capabilities for sulfate particulates from fuel sulfur
Formaldehyde and acetaldehyde can be reduced by 50–90%
DPFs may increase nanoparticle number emissions during low load cycles—low-temperature exhaust gases
Lean NOX catalyst -
5–15 (a)
- -
<50 required Technology in development
50–60 (b) (a) Passive regeneration (catalyst based)
(b) Active regeneration. It requires late fuel injection or upstream fuel addition
NOx adsorber or Lean NOX traps
- 70–90 - - <50 required
Fuel economy penalty associated with regeneration periods
Commercialized in GDI engines
Commercial applications in Dodge Ram and Mercedes-Benz E320
Heavy-duty application still in development
Selective catalytic reduction (SCR)
(a) 50–95% - - No requirements
(a) PM emissions may be affected by fuel sulfur level
Reduction levels depend on control system configuration
Allows improved engine efficiency (fuel economy)
Requires urea supply infrastructure and special provisions for proper operation to avoid system tampering

135
OVERVIEW OF INDIA’S VEHICLE EMISSIONS CONTROL PROGRAM
Table C-4: HDV technology requirements for control of conventional pollutants
Diesel Regulation Euro IV Euro V Euro VI
Regulated pollutants NOX / PM / HC / CO NOX / PM / HC / CO NOX / PM / HC / CO
Emissions target, g/kWha 3.5 / 0.02 / 0.46 / 1.5 2.0 / 0.02 / 0.46 / 1.5 0.4 / 0.01 / 0.13 / 1.5
Emission reduction vs. previous standarda 30% / 80% / 30% / 29% 43% / 0% / 0% / 0% 80% / 50% / 72% / 0%
Engine-out emissions and air/fuel (A/F) controls
• High-pressure fuel injection
• Improvements in engine combustion and calibration
• Variable geometry turbocharger (VGT)
• Electric fuel timing and metering, including timing retard for low NOX
• Multiple-injection fuel system (pilot-main-post)
• Combustion research * PCCIc, LTCd
• Electric EGR, with cooling system
Variable geometry turbocharger (VGT)
• Improvements in engine combustion and calibration for PM control
• NOX controlb: EGR cooled
• Turbocharging with intercooling
• NOX controlb: EGR cooled
After-treatment system
• NOX controlb: • NOX controlb: • NOX control: SCR systems (closed loop)
SCR systems (open loop)
SCR systems (closed loop)
• PM control: DOC + DPFs
• PM control: • PM control:
DOC in some vehicles. Most rely on in-cylinder control
DOC in some vehicles. Most rely on in-cylinder control
DOC + Partial Flow Filter (PFF) used in Europe DOC + PFF
a Emissions measured over the ESC engine dynamometer test cyclesb NOX control through EGR or SCR is manufacturer’s choicec PCCI: premixed charge compression ignition. Includes multiple-fuel timing and metering, allowing for a multimodal
combustion engined LTC: Low-temperature combustion. Air-fuel management improvements aim to avoid high temperatures that lead to NOX
formation
Table C-5: Motorcycles technology requirement to meet Euro 1, 2, and 3
Pre-Euro to Euro 1 Euro 1 to Euro 2 Euro 2 to Euro 3
Regulated pollutants NOX/HC/CO NOX/HC/CO NOX/HC/CO
Emission levels 0.3/3/13 0.3/1.2/5.5 0.15/0.8/2
Emission reduction 0%/60%/60% 50%/33%/63%
Base technology Carburetor
A/F control and Engine-out emissions Carburetor or open-loop fuel injection
Closed-loop fuel injection
After-treatment System Oxidation catalyst
Oxidation catalyst with secondary air injection
Oxidation catalyst with secondary air injection or
or Three-way catalyst
Three–way catalyst

136
INTERNATIONAL COUNCIL ON CLEAN TRANSPORTATION
APPENDIX D: IMPACTS OF FUEL SPECIFICATIONS ON EMISSION PERFORMANCE
Table D-1: Impact of gasoline composition on emissions from light-duty vehicles
Gasoline No Catalyst Euro 1 Euro 2 Euro 3 Euro 4 Euro 5/6[1] Comments
Lead ↑ Pb, HC↑ CO, HC, NOX all increase dramatically as catalyst destroyed
Lead is banned in India since 2000
Sulfur ↑ (50 to 450 ppm) SO2 ↑
CO, HC, NOX all increase ~15–20% On-board diagnostic light may come on incorrectlySO2 and SO3 increase
Olefins ↑ Increased 1,3 butadiene, increased HC reactivity, NOX, small increases in HC for Euro 3 and cleaner Potential deposit buildup
Aromatics ↑
Increased benzene in exhaustDeposits on intake valves and combustion chamber tend to increase
potential increases in HC, NOX
HC↑, NOX↓, CO↑ HC, NOX, CO ↑
Benzene ↑ Increased benzene exhaust and evaporative emissions Benzene is carcinogenic
Ethanol ↑ up to 3.5% O2
Lower CO, HC, slight NOX increase (when above 2% oxygen content),
Minimal effect with new vehicles equipped with oxygen sensors, adaptive learning systems
Increased evaporative emissions unless RVP adjusted, potential effects on fuel system components, potential deposit issues, small fuel economy penaltyHigher
aldehydes
MTBE ↑ up to 2.7% O2
Lower CO, HC, higher aldehydes
Minimal effect with new vehicles equipped with oxygen sensors, adaptive learning systems
Concerns over water contamination
Distillation characteristics Probably HC↑ HC↑T50, T90↑
MMT ↑Increased manganese emissions
Possible catalyst plugging
Likely catalyst plugging
O2 sensor and OBD may be damaged, MIL light may come on incorrectly
RVP ↑ Increased evaporative and exhaust HC emissionsMost critical parameter for Asian countries because of high ambient temperatures
Deposit control additives ↑ Potential HC, NOX emissions benefits
Help to reduce deposits on fuel injectors, carburetors, intake valves, combustion chamber
[1] Euro 5 emissions standards were adopted for implementation in 2009; Euro 6 was also adopted for 2014 implementationNotes: CO = carbon monoxide; HC = hydrocarbon; Pb = lead; RVP = Reid vapor pressure; MMT = methylcyclopentadienyl manganese tricarbonyl; MTBE = methyl tertiary butyl ether; NOX = oxides of nitrogen; O2 = oxygen; SO2 = sulfur dioxide; T50 = temperature at which 50 percent of the gasoline distills; T90 = temperature at which 90 percent of the gasoline distills

137
OVERVIEW OF INDIA’S VEHICLE EMISSIONS CONTROL PROGRAM
Table D-2: Impact of gasoline composition on emissions from motorcycles
Gasoline No Catalyst India 2005 Euro 3 India 2008 China Stage 3 Comments
Lead ↑ Pb, HC↑ CO, HC, NOX all increase dramatically as catalyst is destroyed
Sulfur ↑ (50 to 450 ppm) SO2 ↑
CO, HC, NOX all increase
SO2 and SO3 increase
Olefins ↑ Increased 1,3 butadiene, HC reactivity and NOX Potential deposit buildup
Aromatics ↑ Increased benzene exhaust
Benzene ↑ Increased benzene exhaust and evaporative emissions
Ethanol ↑ up to 3.5% O2
Lower CO, HC, slight NOX increase
Minimal effect with oxygen-sensor-equipped vehicles
Increased evaporative emissions unless RVP adjusted, potential effects on fuel system components, potential deposit issues, small fuel economy penalty
MTBE ↑ up to 2.7% O2
Lower CO, HC Minimal effect with oxygen-sensor-equipped vehicles
Concerns over Water contamination; small fuel economy penalty
Distillation characteristics T50, T90 ↑
Probably HC↑ HC↑ Not as quantifiable as in
passenger cars
MMT ↑Increased manganese emissions
Possible catalyst plugging
With low cell density, catalyst plugging risk seems small, but there are concerns regarding deposits on spark plugs and in the combustion chamber
RVP ↑ Increased evaporative HC emissions
Deposit control additives ↑ Potential emissions benefits Helps reduce deposits on
fuel injectors, carburetors
Notes: CO = carbon monoxide; HC = hydrocarbon; Pb = lead; RVP = Reid vapor pressure; MMT = methylcyclopentadienyl manganese tricarbonyl; MTBE = methyl tertiary butyl ether; NOX = oxides of nitrogen; O2 = oxygen; SO2 = sulfur dioxide; T50 = temperature at which 50 percent of the gasoline distills; T90 = temperature at which 90 percent of the gasoline distills
Table D-3: Impact of fuels on light-duty diesel vehicles
Diesel Fuel Characteristic Pre-Euro Euro 1 Euro 2 Euro 3 Euro 4 Euro 5/6[1] Comments
Sulfur↑ SO2, PM↑ If oxidation catalyst is used, SO3, SO2, PM↑
If Filter, 50 ppm maximum, 10–15 ppm better
If NOX adsorber used requires near zero sulfur (<10 ppm)
With low S, use lubricity additives
Cetane↑ Lower CO, HC, benzene, 1,3 butadiene, formaldehyde, and acetaldehyde Higher white smoke with low-cetane fuels
Density↓ PM, HC, CO, formaldehyde, acetaldehyde, and benzene↓, NOX↑
Volatility (T95 from 370° to 325° C) NOX, HC increase, PM, CO decrease
Polyaromatics↓ NOX, PM, formaldehyde, and acetaldehyde↓ but HC, benzene, and CO ↑
Some studies show that total aromatics are important for emissions in a manner similar to polyaromatics
[1] Euro 5 emissions standards were adopted for implementation in 2009; Euro 6 was also adopted for 2014 implementationNotes: CO = carbon monoxide; HC = hydrocarbon; NOX = oxides of nitrogen, PM = particulate matter; ppm = parts per million; SO2 = sulfur dioxide; SO3 or sulfur trioxide is an intermediate compound

138
INTERNATIONAL COUNCIL ON CLEAN TRANSPORTATION
Table D-4: Impact of fuels on heavy-duty diesel vehicles
Diesel Fuel Characteristic Pre-Euro Euro I Euro II Euro III Euro IV Euro V Comments
Sulfur↑ SO2, PM↑If oxidation catalyst is used, SO3, SO2, PM↑
If Filter, 50 ppm maximum, 10–15 ppm better
If NOX adsorber used requires near zero sulfur (<10 ppm)
With low S, use lubricity additives
Cetane↑ Lower CO, HC, benzene, 1,3-butadiene, formaldehyde, and acetaldehyde
Higher white smoke with low-cetane fuels
Density↓ HC, CO ↑, NOX↓
Volatility (T95 from 370° to 325° C)
Slightly lower NOX but increased HCToo large a fraction of fuel that does not volatilize at 370° C increases smoke and PM
Polyaromatics↓ NOX, PM, HC ↓ Some studies show that total aromatics are important

139
OVERVIEW OF INDIA’S VEHICLE EMISSIONS CONTROL PROGRAM
APPENDIX E: COMPARISON OF CHINA, EU, U.S., CALIFORNIA FUEL SPECIFICATIONS
Table E-1. Gasoline parameters
Fuel Property
India Euro III Euro IV Euro V EPA RFG average(2005)1
EPA conventional gasoline
average (2005)2
Worldwide Fuel Charter
Bharat Stage III
Bharat Stage IV 98/70/EC 2003/17/EC 2009/30/EC Category 44
Summer Winter Summer Winter
Research Octane (RON), min. 91 91 95–91 95–91 95–91 NS 91–95–98
Motor Octane (MON), min. 81 81 85–81 85–81 85–81 NS 82.5–85–88
Anti-Knock Index (AKI), min. NS NS NS NS NSRecommended: 87–87–91 with
seasonal and altitudinal variationsASTM D4814
NS
Aromatics, vol%, max. 42 35 42 35 35 20.75 19.55 27.7 24.7 35
Olefin, vol%, max. 21 21 18 18 18 11.9 11.2 12 11.6 10
Benzene, vol%, max. 1 1 1 1 1 0.666 0.666 1.216 1.156 1
Sulfur, ppm, max. 150 50 150 50 10 717 817 1067 977 10
Gum Content, g/m3, max. 40 40 NS NS 5 5 5
Density 15C, kg/m3 720–775 720–775 NS NS 720–775 NS NS NS NS 715–770
RVP, kPa 60 60 60/70max.
60/70max.
60/70max.
47.68
(6.91 psi)max.
82(11.89 psi)max.
57.28
(8.3 psi)
83.6(12.12 psi)
Temp > 15° C:45–60
15 C>=T>5 C:55–70
5 C>=T> -5 C:65–80
-5 C>=T>-15 C:75–90
Temp < -15° C:85–105
Lead, mg/l, max. 5 5 5 5 5 13 NS
Manganese, mg/liter, max. NS NS NS NS
MMT<6 (by 2011)
NA9 NA9 NA NA NDMMT<2
(by 2014)
Oxygen, % m/m 2.7 2.7 2.7 (max.) 2.7 (max.) 2.7(max.) 2.49 2.37 0.95 1.08 2.7
NS = Not specified; NA = Not available; ND = Nondetectable; NAP = Not applicableNotes: 1. National average of the 2005 RFG survey data are shown here. Even though the EPA establishes limits on sulfur, summer RVP, aromatics,
and benzene for reformulated gasoline (RFG), compliance is determined based on the complex model estimates of VOC, toxic substances, and NOx emissions relative to the emissions of the 1990 baseline gasoline
2. Presented here are national averages in 2005 based on conventional gasoline survey data. The EPA sets limits on benzene and sulfur content as well as summer RVP but not for other parameters. Individual producer or importer demonstrates compliance with the conventional gasoline standard by showing that emissions of VOC, CO, NOx, and toxic air pollutants from conventional gasoline produced or imported do not increase over levels from the gasoline it produces or imports in 1990. If a producer or importer is unable to develop adequate 1990 data, it must use a “statutory baseline,” which is the average quality of all 1990 U.S. gasoline
3. Refiners and fuel importers could choose to comply with the maximum (flat) limit or the averaging limit coupled with a cap limit. Refiners and importers could also certify alternative specification by using the predictive model to demonstrate that emissions are equivalent to those of a gasoline meeting the flat limits or the averaging limits plus cap values
4. Applicable to markets requiring Euro 4, Euro 5 Heavy-Duty, U.S. EPA Tier 2 or 2007/2010 Heavy-Duty On-Highway, or equivalent emission standards
5. The reformulated gas provision of the Clean Air Act limits the aromatic content of RFG to 25 percent by volume 6. The Clean Air Act limits benzene content of RFG gasoline to 1 percent by volume; the Mobile Source Air Toxics final rule further tightens
the benzene limit to 0.62 percent for all gasoline (reformulated and conventional) on an annual average basis beginning January 1, 2011. While the 0.62 percent limits could be met through an averaging, banking, and trading program, the actual annual average of gasoline produced or imported by any refiner or importer must not exceed 1.3 percent by volume, beginning July 1, 2012
7. Effective from 2006, the gasoline sulfur limit for all gasoline is 30 ppm for the annual refinery average and a cap of 80 ppm for all production8. The Clean Air Act specifies a limit of 62.1 kPa (9 psi) for any gasoline sold during the high ozone season (Jun 1 to Sept 15). More stringent
volatility (summer RVP) are set for RFG, which vary by the region and month, and range from 48.3-62.1 kPa (70-90 psi). EPA provides a 1.0-psi RVP allowance for gasoline containing ethanol at 9-10% by volume.
9. The Clean Air Act requires that RFG contain no heavy metals, including lead or manganese.

140
INTERNATIONAL COUNCIL ON CLEAN TRANSPORTATION
Table E-2: Diesel parameters
Fuel Property
India
Euro III Euro IV Euro V
EPA CARBWorldwide
Fuel Charter
Bharat Stage
II
Bharat Stage
III
Bharat Stage
IV
Conventional diesel
Reference fuel1
Designated equivalent limit1 Category 42
Polyaromatics, vol%, max. - 11 11 11 11 8 NS 1.4 3.5 2
Sulfur, ppm, max. 500 350 50 350 50 10 15 15 15 10
Cetane number, min. 48 51 51 51 51 51
Cetane index>= 40 or aromatics<= 35%3
48 53 55
Density @ 15°C, kg/m3, min.
820–860
820–845
820–845
820–845 845 845 NS NS NS 8204
Flash point, Abel, °C, min. 35 35 35 55 55 55 NS 54 NS 55
Ash content, % m/m, max. 0.01 0.01 0.01 0.01 0.01 0.01 NS NS NS 0.001
Viscosity @ 40°C, mm2/s 2.0–5.0 2.0–5.0 2.0–4.5 2.0–4.5 2.0–4.5 2.0–4.5 NS 2.0–4.1 NS 2.05
PP = Diesel pour point; NS=Not specified1. The California regulations allow flexibility in meeting the limit on aromatics. Producers or importers could either produce a fuel that meets the
designated equivalent limits or certify a fuel formulation by demonstrating that the exhaust emission reduction of a candidate fuel is equivalent to those with the reference fuel; the “low-emission” fuels typically have a much higher cetane number and lower sulfur but higher aromatics, higher polycyclic aromatics, and higher nitrogen than the reference fuel
2. Applicable to markets requiring Euro 4, Euro 5 Heavy-Duty, U.S. EPA Tier 2 or 2007/2010 Heavy-Duty On-Highway, or equivalent emission standards3. The EPA requires either a minimum cetane index of 40 or a maximum aromatic content of 35 percent. Premium diesel fuel defined by the National
Institute of Standards and Technology (NIST) requires a minimum cetane number of 47.0. It is up to individual states to adopt the NIST premium diesel requirements
4. Can be relaxed to 800 kg/m3 when ambient temperatures are below -30°C. For environmental purposes, a minimum of 815 kg/m3 can be adopted5. Can be relaxed to 1.5 mm2/s when ambient temperatures are below -30°C and to 1.3 mm2/s when ambient temperatures are below -40°C

141
OVERVIEW OF INDIA’S VEHICLE EMISSIONS CONTROL PROGRAM
APPENDIX F: COST OF EMISSION CONTROL TECHNOLOGIES IN INDIA This memo presents a brief description of emission control technology costs for vehicles in India. Vehicle categories analyzed correspond to those used in the India Emissions Model (IEM) developed by the ICCT. The original IEM vehicle categories are grouped in three main vehicle categories for cost assessment purposes: light-duty vehicles (passenger cars and utility and multipurpose vehicles), commercial vehicles (buses, trucks, and combination trucks), and two- and three-wheelers. Within each vehicle category the analysis is separated by fuel type (gasoline, diesel, compressed natural gas, and liquefied petroleum gas). All the values presented are in 2010 U.S. dollars. Factors were applied to account for the reduction in costs attributable to volumes and to learning.
1. COST METHODOLOGYThe first step is identification of technologies that are required for each regulatory level, for each vehicle category and fuel. The second is gathering available informa-tion about emission control technology costs for each vehicle category and fuel type. Identifying vehicle fleet characteristics is important for defining the geometry and volume of the main components, which is fundamental for accurate cost calcula-tions. Because vehicle fleets vary by countries and regions, India-specific vehicle characteristics were ascertained. Engine size is the main parameter used to convert information from international sources to Indian applications. In some cases where is not possible to cite available sources for some technologies, an extrapolation of costs is done based on engine size.
1.1 India Fleet Engine SizeThe engine size for each transportation mode and fuel technology was taken from commercial data that tracks Indian vehicle markets. The data for four-wheeled vehicles were obtained from Segment Y (a research firm) and Society of Indian Au-tomobile Manufacturers sources for model-year 2010 vehicles. Data for motorcycles and three-wheelers were obtained through Internet sources and a consultant. [61] Table 1 shows the sales average for model-year 2009 in India. Although fleet-average engine size changes over the years, this cost assessment was performed assuming model-year 2009 fleet-average engine size for each year.

142
INTERNATIONAL COUNCIL ON CLEAN TRANSPORTATION
Vehicle CategoryDiesel Gasoline CNG LPG
Average Fleet Engine Volume, L
PC and U&MPVPC 1.4 1.1 1.1 1.1
U&MPV 2.2 2.0 2.0 2.0
Commercial Vehicle
LDBus 3.1 3.1 3.1 3.1
LDTruck 3.1 3.1 3.1 3.1
MDBus 3.6 3.6 3.6 3.6
MDTruck 3.6 3.6 3.6 3.6
HDBus 5.8 5.8 5.8 5.8
HDSUT 5.7 5.7 5.7 5.7
HDCT 6.0 6.0 6.0 6.0
Vehicle Category Average Fleet Engine Volume, cc
3-wheelers3WP* 416 173 173 173
3WC* 416 200 200 200
2-Wheelers
2W75 - 70 - -
2W125 - 110 - -
2W250 - 175 - -
2W9999 - 500 - -
*Information from Bajaj Website (Bajaj, 2011) CNG = compressed natural gas; CT = combination tractor; HD = heavy duty; LD = light duty; LPG = liquefied petroleum gas; MD = medium duty; MPV = multipurpose vehicle; PC = passenger car; SUT = single unit truck; UV = utility vehicle; 2W75 = two wheeler with <75 cc engine; 2W125 = two wheeler with 75-125 cc engine; 2W250 = two wheeler with 125-250 cc engine; 2W9999 = two wheeler with >250 cc engine; 3WP = passenger three wheeler; 3WC = commercial three wheeler.
2. TECHNOLOGY REQUIRED FOR EACH INDIAN EMISSION LEVELThe list of technologies is divided by control level. In India, emissions control for mo-tor vehicles started in 1991. Successive amendments to the standard applied in 1996, 1998, 2000, 2005, and 2010. Technologies that will be required from model-year 2011 to model-year 2050 are estimated based on international experiences and analysis of technology trends.
2.1 Passenger Car and Utility and Multipurpose Vehicle Technology This section presents cost details on emission control technologies required for gasoline- and diesel-powered passenger cars and utility and multipurpose vehicles. The set of technologies studied here spans outdated ones, from the time before emission regulations were enacted, through the present, up to those that are envisaged for use in the future. Because the regulatory program in India took the European system as the model, most technologies used in vehicles for compliance under European regulations apply to their Indian counterparts as well. The technologies required for emission control were obtained from a recent study published by the ICCT on light-duty vehicle emission control costs. [166] Table 2 presents the list of technologies for gasoline- and diesel-powered cars and other light-duty vehicles for each regulatory level.

143
OVERVIEW OF INDIA’S VEHICLE EMISSIONS CONTROL PROGRAM
Regulation Gasoline Technology Costs Diesel Technology Costs
No control Carburetor—no control - IDI—no control -
1991 Adjustments in carburetor operation - IDI—improvement in mechanical fueling methods -
1996 Adjustment in carburetor and EGR $25 IDI—improvement in mechanical fueling methods -
2000—Euro 1
Electronic fuel control (TBI)
$161
IDI—improvement in electronic fueling methods
$56 Catalytic converter (TWC) EGR
EGR
Bharat II
Electronic fuel control (TBI and MPFI)
$199
Direct injection
$151 Catalytic converter (TWC) with one oxygen sensor EGR with cooling systems
EGR
Bharat III
Electronic fuel system requires MPFI
$249
Common rail fuel injection at 900–1,300 bar.
$529
Oxygen sensor is upgraded with heating capabilities for cold-start operation EGR with cooling systems
Low thermal capacity manifolds for cold-start emissions. Diesel oxidation catalysts for HC control
Engine calibration
Bharat IV
Similar to BSIII
$306
Increased fuel injection pressure 1,300–1,600 bar
$784 TWC system includes a close-coupled catalyst and a under-floor Turbocharger and intercooler
Cooled EGR
Oxidation catalyst
Bharat V* Improvements in combustion and catalytic converter performance $326
Same technology as BS-IV
$1,047 Improvements in fuel atomization with injection pressure 1,600–1,900 bar
Diesel particulate filter for PM control
Bharat VI* Improvements in combustion and catalytic converter performance. $326
Same technology as Bharat V
$1,385 Improvements in fuel atomization with injection pressure 1,800–2,100 bar
Diesel particulate filter for PM control and lean NOX trap for NOX control
Bharat VII* Improvements in combustion and catalytic converter performance $351 System improvements over Bharat VI
technology $1,435
* Technologies for regulations beyond Bharat Stage IV are inferred from technology evolution in EuropeTBI: Throttle body injection; PFI: port fuel injection; MPFI: multipoint fuel injection; EGR: exhaust gas recirculation; TWC: three-way catalysts; IDI: Indirect diesel injection

144
INTERNATIONAL COUNCIL ON CLEAN TRANSPORTATION
2.2 Commercial Vehicles Technologies required for these vehicles cover diesel and compressed natural gas (CNG) vehicles. As with passenger cars, the regulatory program in India used the European heavy-duty regime as a model. The technologies required for emission control were obtained from a recent study published by the ICCT on heavy-duty vehicle emission controls. [164] Table 2 presents the list of technologies for diesel and CNG heavy-duty buses for each regulatory level.
Regulation Diesel Technology Costs CNG Technology Costs
No control IDI—no control - - -
1991 IDI—improvement in mechanical fueling methods - - -
1996 IDI—improvement in mechanical fueling methods $250 Carburetor; lean-burn combustion $250
2000
IDI—improvement in electronic fueling methods
$300 Carburetor; lean-burn combustion $300 Fuel injection timing retardation for NOX reduction
Bharat II Turbocharging and further engine optimization $400 Carburetor; lean-burn combustion $400
Bharat III
Electronic fuel control. Single electronic unit injection
$1,314 Multipoint fuel injection—lean-burn combustion $1,012 Diesel oxidation catalysts for HC
control
Engine calibration
Bharat IV
Increased fuel injection pressure
$2,337
Multipoint fuel injection—lean burn combustion
$1,935
Turbocharger and intercooler Oxidation catalysts
Cooled EGR for NOX control Closed-loop electronic control requires oxygen sensor
Larger vehicles might require SCR
Oxidation catalyst
Bharat V*
Improvements in fuel atomization with injection pressure 1,900 bar
$3,366
Multipoint fuel injection—stoichiometric burn combustion
$2,899
Cooled EGR EGR cooled for NOX control
VGT Turbocharger and intercooler
Engine calibration techniques for emission and fuel economy Three-way catalyst system
SCR for NOX control Closed loop with oxygen sensor
Bharat VI*
Improvements in fuel atomization with dual-actuator fuel injectors
$4,521 Improvements over Bharat V technology $3,195 VGT
Diesel particulate filter for PM control and SCR for NOX control
Bharat VII* System improvements over Bharat VI technology $4,973 Improvements over Bharat VI
technology $3,488
* Technologies for regulations beyond Bharat stage IV are inferred from technology evolution in EuropeVGT: variable geometry turbochargers; SCR: selective catalytic reduction

145
OVERVIEW OF INDIA’S VEHICLE EMISSIONS CONTROL PROGRAM
2.3 Two- and Three-Wheelers Technologies required for these vehicles cover gasoline, diesel, CNG, and liquefied petroleum gas (LPG) vehicles. Only gasoline and CNG are presented detailed in this section, but cost details can be found in Appendix A. The regulatory program for two- and three-wheelers is exclusive to India, including the test cycle used and the emission standards put into place. The technologies required for emissions control were obtained from a recent study published by the ICCT on two- and three-wheeler emission controls. [61] Table 3 presents the list of technologies for a typical gasoline-powered motorcycle with a 125-cc engine and for three-wheelers for each regulatory level.
Regulation 2W Gasoline Technology Costs 3W Technology Costs
No control 2-stroke - 2-stroke -
19912-stroke.
-
2-stroke.
-Carburetor improvements and engine lubrication improvements
Carburetor improvements and engine lubrication improvements
19962-stroke
-
2-stroke
-Carburetor improvements and engine lubrication improvements
Carburetor improvements and engine lubrication improvements
20002-stroke
$20
2-stroke
$15 Carburetor improvements and engine lubrication improvements
Carburetor improvements and engine lubrication improvements
Bharat II4-stroke
$25
2-stroke
$20 Carburetor improvements Carburetor improvements and engine
lubrication improvements
Bharat III4-stroke
$35 Gasoline 4-stroke or shift to CNG 4-stroke
$35 OEM or $460 retrofitCarburetor improvements and
oxidation catalyst
Bharat IV4-stroke
$35 Gasoline or CNG 4-stroke $35 OEM or $460 retrofitCarburetor and improved
oxidation catalyst
Bharat V*4-stroke
$35
Gasoline or CNG 4-stroke
$37 Fuel injection improvements and oxidation catalyst with oxidation catalyst
Bharat VI*
4-stroke
$76
Gasoline or CNG 4-stroke
$67 Fuel injection improvements and three-way catalyst
with port fuel injection oxidation catalyst
Oxygen sensor and closed-loop air-fuel control
Bharat VII*
4-stroke
$76
Gasoline or CNG 4-stroke
$69 Fuel injection improvements and three-way catalyst
with port fuel injection oxidation catalyst and oxygen sensor
Oxygen sensor and closed-loop air-fuel control
* Technologies for regulations beyond Bharat stage IV are inferred from technology evolution in Europe

146
INTERNATIONAL COUNCIL ON CLEAN TRANSPORTATION
3. COST REDUCTIONS Cost reduction factors are applied to new technologies during the first two years follow-ing their introduction into the market. A 10 percent discount is applied during the first year, and a further 10 percent discount is applied during the second year.
After the third year, the cost is reduced by a predetermined percentage each year. This is an estimate of the progressive cost-cutting effects of optimizing manufacturing processes, more efficient materials use, and design changes. From the third year through the seventh (five years total), a 3 percent annual discount is assumed. For the subse-quent five years (years eight through twelve), a 2 percent per year discount is applied, and then a 1 percent yearly discount for five more years beyond.

147
OVERVIEW OF INDIA’S VEHICLE EMISSIONS CONTROL PROGRAM
APPENDIX G: ACRONYMS AND DEFINITIONSACEA European Automobile Manufacturers Association (European Union)
ABT Averaging, Banking, and Testing (United States)
AFPC Auto Fuel Policy Committee (India)
AQSIQ Administration of Quality Supervision, Inspection and Quarantine (China)
ARAI Automotive Research Association of India (India)
ARB Air Resources Board, California (United States)
BAU Business as usual
BEV Battery electric vehicle
CAA Clean Air Act (United States)
CAFE Corporate Average Fuel Economy (United States)
CH4 Methane
CMVR Central Motor Vehicle Rules (India)
CMVR-TSC Central Motor Vehicle Rules–Technical Standing Committee
CNG Compressed natural gas
CO Carbon monoxide
CO2 Carbon dioxide
COP Conformity of production
CPCB Central Pollution Control Board (India)
CRAES Chinese Research Academy of Environmental Sciences (China)
CSE Centre for Science and Environment (India)
DI Direct injection
DOA Department of Agriculture (United States)
DOC Diesel oxidation catalyst
DOE Department of Energy (United States)
DPF Diesel particulate filter
EGR Exhaust gas recirculation
EIB Economic and Industry Bureau (Japan)
EISA Energy Independence and Security Act (United States)
EPA Environmental Protection Agency (United States)
EPB Environmental Protection Bureau (China)
EU European Union
EV Electric vehicles
FCEV Fuel cell electric vehicle
FFV Flexible-fuel vehicle
FTP Federal Test Procedure (United States)
GDI Gasoline direct injection
HC Hydrocarbon
HDV Heavy-duty vehicle
HEV Hybrid electric vehicle
I/M Inspection and maintenance
ICAT International Centre for Automotive Technology (India)
ICCT International Council on Clean Transportation
IDI Indirect diesel injection

148
INTERNATIONAL COUNCIL ON CLEAN TRANSPORTATION
IEM ICCT India Emissions Model
IHAM ICCT India Health Assessment Model
IIM Indian Institute of Management (India)
IUCP In-Use Confirmatory Test Program (United States)
IUVP In-Use Verification Program (United States)
LCV Light-duty commercial vehicle
LDV Light-duty vehicle
LNT Lean NOX traps
LPG Liquefied petroleum gas
MEP Ministry of Environmental Protection (China)
METI Ministry of Economy, Trade and Industry (Japan)
MOBILE6 EPA’s vehicle emission modeling software (United States)
MoEF Ministry of Environment and Forests (India)
MoHIPE Ministry of Heavy Industries and Public Enterprises (India)
MoRTH Ministry of Road Transport and Highways (India)
MPFI Multipoint fuel injection
MPV Multipurpose vehicle
NAAQS National Ambient Air Quality Standards
NBEM National Board for Electric Mobility (India)
NCEM National Commission for Electric Mobility (India)
NCR National Capital Region (India)
NEDC New European Driving Cycle
NGV Natural gas vehicle
NHTSA National Highway Transportation Safety Administration (United States)
NMHC Nonmethane hydrocarbon
NOX Oxides of nitrogen
NPA National Petroleum Association (Japan)
O3 Ozone
OBD On-board diagnostics
ORVR On-board refueling vapor recovery
Pb Lead (element)
PEMS Portable emissions measurement systems
PFF Partial flow filter
PFI Port fuel injection
PHEV Plug-in hybrid electric vehicle
PM Particulate matter
PM2.5 Particulate matter smaller than 2.5 microns in diameter
PNGRB Petroleum and Natural Gas Regulatory Board (India)
PUC Pollution Under Control (India)
RFS2 (New) Renewable Fuel Sulfur (United States)
RVP Reid vapor pressure
SCOE Standing Committee on Implementation of Emission Legislation (India)
SCR Selective catalytic reduction
SEA Selective Enforcement Audit (United States)

149
OVERVIEW OF INDIA’S VEHICLE EMISSIONS CONTROL PROGRAM
SOF Solid organic fractionSQ – Standard Quality (Japan)
SO2 Sulfur dioxide
TERI The Energy and Resources Institute (India)
TWC Three-way catalyst
UV Utility vehicleVECC – Vehicle Emission Control Center (China)
VERT Verminderung der Emissionen von Realmaschinen im Tunnelbau (European Union)
VKT Vehicle kilometers traveled
VSL Value of a statistical life
WHTC World Harmonized Heavy-duty Test Cycle
WLTP Worldwide Harmonized Light Vehicles Test Procedure
WMTC Worldwide Harmonized Motorcycle Emissions Test Cycle
ZEV Zero-emission vehicle

150
INTERNATIONAL COUNCIL ON CLEAN TRANSPORTATION
REFERENCES1. International Council on Clean Transportation. India Emissions Model (unpublished).
Ed. D. Meszler et al. 2012.
2. International Council on Clean Transportation. India Health Assessment Model (unpublished). Ed. G. Bansal et al. 2012.
3. Central Pollution Control Board, Ministry of Environment and Forests (India). Air Quality Monitoring, Emission Inventory and Source Apportionment Study for Indian Cities. 2011.
4. Central Pollution Control Board, Ministry of Environment and Forests (India). “List of Non Attainment Cities in India.” 2008. Available at http://www.cpcb.nic.in/Non_attainment.php
5. Segment Y. Vehicle data systems sales data. 2011.
6. He, H., and A. Bandivadekar. A Review and Comparative Analysis of Fiscal Policies Associated with New Passenger Vehicle CO2 Emissions. International Council on Clean Transportation. February 2011. Available at http://www.theicct.org/sites/default/files/publications/ICCT_fiscalpolicies_feb2011.pdf
7. Ministry of Environment and Sustainable Resource Development, Alberta. “Carbon Monoxide Levels.” August 2011. Available at http://environment.alberta.ca/01644.html
8. Bluett, J., K. Dey, and G. Fisher. Assessing Vehicle Air Pollution Emissions. Report prepared for the Department of the Environment, Water, Heritage and the Arts (Australia). July 2008. Available at http://www.environment.gov.au/atmosphere/airquality/publications/pubs/vehicle-pollution.pdf
9. Hart Energy and MathPro Inc. Economic Analysis of the Transition to Ultra-Low Sulfur Fuels in Brazil, China, India and Mexico. Report prepared for the International Council on Clean Transportation. October 2012.
10. Shindell, D., et al. “Climate, Health, Agricultural and Economic Impacts of Tighter Vehicle-Emission Standards.” Nature Climate Change 1, no. 1 (April 2011): 59–66.
11. Nemet, G. F., T. Holloway, and P. Meier. “Implications of Incorporating Air-Quality Co-Benefits into Climate Change Policymaking.” Environmental Research Letters 5, no. 1 (January–March 2010): 4007.
12. Bollen, J. C., et al. Co-Benefits of Climate Policy. PBL Report no. 500116005. Nether-lands Environmental Assessment Agency. February 2009. Available at http://www.unep.org/transport/gfei/autotool/understanding_the_problem/Netherlands%20Environment%20Agency.pdf
13. Clean Air Act Amendments of 1970. Public Law 91-604. U.S. Statutes at Large 84 (1970): 1676, codified at U.S. Code 42 §§ 7401–7671.
14. The Air (Prevention and Control of Pollution) Act, 1981. Act no. 14 of 1981. Parliament of India. March 29, 1981.
15. The Environment (Protection) Act, 1986. Act no. 29 of 1986. Parliament of India. May 23, 1986.
16. DieselNet. “Emission Test Cycles: ECE15 + EUDC/NEDC.” June 2013. Available at http://www.dieselnet.com/standards/cycles/ece_eudc.php
17. Central Pollution Control Board, Ministry of Environment and Forests (India). Status of the Vehicular Pollution Control Programme in India. Programme Objective Series no. 136. March 2010. Available at http://www.cpcb.nic.in/upload/NewItems/NewI-tem_157_VPC_REPORT.pdf

151
OVERVIEW OF INDIA’S VEHICLE EMISSIONS CONTROL PROGRAM
18. Fung, F., et al. Overview of China’s Vehicle Emission Control Program: Past Successes and Future Prospects. International Council on Clean Transportation. December 2010. Available at http://www.theicct.org/sites/default/files/publications/Retrosp_final_bilingual.pdf
19. Delphi. Worldwide Emissions Standards: Passenger Cars and Light Duty Vehicles. 2010/2011. Brochure. 2011. Available at http://delphi.com/pdf/emissions/Del-phi_PC.pdf
20. DieselNet. “Emission Standards—India: On-Road Vehicles and Engines.” July 2009. Available at http://www.dieselnet.com/standards/in/
21. DieselNet. “Emission Standards—European Union: Heavy-Duty Diesel Truck and Bus Engines.” September 2012. Available athttp://www.dieselnet.com/standards/eu/hd.php
22. European Commission. Summary of “Workshop on Approach on Emissions Legisla-tion.” Brussels. November 23, 2010.
23. Ligterink, N., et al. “On-road NOx Emissions of Euro-V Trucks.” Report no. MON-RPT-033-DTS-2009-03840. TNO (Netherlands Organisation for Applied Scientific Research). December 2, 2009. Available at http://www.leefmilieu.nl/sites/www3.leefmilieu.nl/files/imported/pdf_s/2009-12-02_TNO%20Rapport_On-road%20NOx%20emissions%20of%20Euro-V%20trucks.pdf
24. Lowell, D., and F. Kamakaté. “Urban Off-Cycle NOx Emissions from Euro IV/V Trucks and Buses: Problems and Solutions for Europe and Developing Countries.” White paper no. 18. International Council on Clean Transportation. March 2012. Available at http://www.theicct.org/sites/default/files/publications/ICCT_WP18_urban_Nox_emissions.pdf
25. Automotive Research Association of India. “Indian Emissions Regulations: Limits, Regulations and Measurement of Exhaust Emissions and Calculation of Fuel Con-sumption.” Booklet. December 2011. Available at https://www.araiindia.com/pdf/Indian_Emission_Regulation_Booklet.pdf
26. Ministry of Road Transport and Highways (India). Central Motor Vehicles (First Amendment) Rules. 2012.
27. DieselNet. “Emissions Standards—India: Nonroad Diesel Engines.” December 2008 Available at http://www.dieselnet.com/standards/in/nonroad.php
28. Weiss, M., et al. Analyzing On-Road Emissions of Light-Duty Vehicles with Portable Emission Measurement Systems (PEMS). European Commission Joint Research Centre/Institute for Energy. 2011. Available at http://ec.europa.eu/clima/policies/transport/vehicles/docs/2011_pems_jrc_62639_en.pdf
29. Cuelenaere, R. Real Driving Emissions: The Impact on Air Quality. Ministry of Infra-structure and Environment, the Netherlands. 2011.
30. Mock, P. “Laboratory versus Real World: Discrepancies in NOx Emissions in the EU.”International Council on Clean Transportation. November 7, 2012. Available at http://www.theicct.org/blogs/staff/laboratory-versus-real-world-discrepancies-nox-emissions-eu
31. U.S. Environmental Protection Agency. “Lead in Air.” April 12, 2012. Available at http://www.epa.gov/oar/lead/
32. International Council on Clean Transportation and The Energy and Resources Insti-tute. “Background Paper on Cleaner Fuels and Improved Vehicular Technologies.” May 31, 2011. Available at http://www.theicct.org/sites/default/files/Background_In-dia2011.pdf

152
INTERNATIONAL COUNCIL ON CLEAN TRANSPORTATION
33. “Report of the Expert Committee on Auto Fuel Policy.” Government of India. 2002. Available at http://petroleum.nic.in/autoeng.pdf
34. Panda, P. Treating Diesel Exhaust: BSV and Beyond. 2010.
35. Doval, P. “Petrol Prices Set to Boost Diesel Car Sales.” The Times of India. January 19, 2011.Available at http://timesofindia.indiatimes.com/business/india-business/Petrol-prices-set-to-boost-diesel-car-sales/articleshow/7315390.cms
36. DieselNet. “Fuel Regulations—United States.” December 2009. Available at http://www.dieselnet.com/standards/us/fuel.php
37. “India Should Deregulate Diesel Prices by 2014/15: Government Panel.” Reuters. September 28, 2012. Available at http://in.reuters.com/article/2012/09/28/india-economy-fuel-idINL4E8KS5F720120928
38. Personal contact with Freed, C., and F. Fung. 2011.
39. Code of Federal Regulations. Title 40, sec. 86. National Archives and Records Administration. 2011.
40. U.S. Environmental Protection Agency. 2008 Progress Report: Vehicle and Engine Compliance Activities. August 2010. Available at http://www.epa.gov/otaq/about/420r10022.pdf
41. U.S. Environmental Protection Agency. 2007 Progress Report: Vehicle and Engine Compliance Activities, October 2008. Available at http://www.epa.gov/otaq/about/420r08011.pdf
42. Harrison, D. “In-Use Vehicle Compliance Management in the United States.” Paper presented at the Vehicle Pollution Control International Workshop. Beijing. December 2006.
43. U.S. Environmental Protection Agency. “Emissions Warranties for 1995 and Newer Cars and Trucks.” March 1996. Available at http://nepis.epa.gov/Exe/ZyNET.exe/P1001Z7B.TXT?ZyActionD=ZyDocument&Client=EPA&Index=1995+Thru+1999&Docs=&Query=&Time=&EndTime=&SearchMethod=1&TocRestrict=n&Toc=&TocEntry=&QField=&QFieldYear=&QFieldMonth=&QFieldDay=&IntQFieldOp=0&ExtQFieldOp=0&XmlQuery=&File=D%3A\zyfiles\Index%20Data\95thru99\Txt\00000022\P1001Z7B.txt&User=ANONYMOUS&Password=anonymous&SortMethod=h|-&MaximumDocuments=1&FuzzyDegree=0&ImageQuality=r75g8/r75g8/x150y150g16/i425&Display=p|f&DefSeekPage=x&SearchBack=ZyActionL&Back=ZyActionS&BackDesc=Results%20page&MaximumPages=1&ZyEntry=1&SeekPage=x&ZyPURL
44. Code of Federal Regulations, Title 40, secs. 69, 80, and 86, p. 5002. 2001.
45. U.S. Environmental Protection Agency. “Regulatory Announcement: Amendments to the Manufacturer-Run, Heavy-Duty Diesel In-Use Engine and Vehicle Testing Program.” February 2008. Available at http://www.epa.gov/otaq/regs/hd-hwy/inuse/420f08011.pdf
46. Walsh, M. “Motor Vehicle Inspection and Maintenance: The Worldwide Experience.” Car Lines (newsletter). 2005. Available at http://www.walshcarlines.com/pdf/SIAT2005%20IM.pdf
47. B AR Engineering. “Vehicles Subject to Smog Check.” December 2009. Available at http://www.bar.ca.gov/80_BARResources/02_SmogCheck/vehicle_model_years_subject_to_smog_check.pdf
48. Freed, C. “In-Use Emission Durability Testing—Recall.” Paper presented at the SAE Conference 2006. China.

153
OVERVIEW OF INDIA’S VEHICLE EMISSIONS CONTROL PROGRAM
49. Law of the People’s Republic of China on the Prevention and Control of Atmo-spheric Pollution (Air Pollution Prevention and Control Law). Order of the President no. 32. April 29, 2000.
50. Ministry of Environmental Protection (China). 2011 Annual Report of China on Prevention and Control of Vehicle Emissions. 2011.
51. Ministry of Environmental Protection (China). “Notice on the Issuance of Motor Vehicle Inspection Agency Environmental Regulations.” 2009.
52. Ministry of Environmental Protection (China). “Notice on the Issuance of Motor Vehicle Inspection Marks of Environmental Protection Regulations.” 2009.
53. Motor Vehicles Act, 1988. Act no. 59 of 1988. Parliament of India. October 14, 1988.
54. Marathe, S. “Rule Making in India for Safety and Emissions.” (PowerPoint slide presentation.) Informal document no. WP29-143-20. United Nations Economic Commission for Europe. November 2007.
55. Personal contact with Bhangale, U. 2011.
56. “Services: Certification—COP.” Automotive Research Association of India. 2013. Available at http://www.araiindia.com/services_certification_COP.asp
57. Personal contact with Roychowdhury, A. Delhi, India. 2011.
58. Government of National Capital Territory of Delhi. “Frequently Asked Questions (FAQ) about P.U.C. Certificate.” 2013. Available at http://www.delhi.gov.in/wps/wcm/connect/doit_transport/Transport/Home/Pollution+Control/P.U.C.+Certificate
59. Karuppaiah N., and G. Sharma. “Monitoring Compliance of Fuel Economy Stan-dards.” PowerPoint presentation at the International Seminar on “Fuel Efficiency Standards and Labeling of Vehicles in India.” Chennai. December 6–7, 2007. Avail-able at http://www.pcra.org/english/transport/karuppaiah1.pdf
60. Doval, P. “Recall Policy Not High Priority: Siam.” The Times of India. April 9, 2011. Available at http://timesofindia.indiatimes.com/business/india-business/Recall-policy-not-high-priority-Siam/articleshow/7921855.cms
61. Iyer, N. A Technical Assessment of Emissions and Fuel Consumption Reduction Potential from Two and Three Wheelers in India. Study prepared for the Inter-national Council on Clean Transportation. August 2012. Available at http://www.theicct.org/sites/default/files/publications/Iyer_two-three-wheelers_India_Au-gust2012.pdf
62. Energy Information Administration, U.S. Department of Energy. “Refiners Switch to Reformulated Gasoline Complex Model.” January 9, 1998. Available at http://www.eia.gov/forecasts/steo/special/pdf/rfg1.pdf
63. U.S. Environmental Protection Agency. “Fuels and Fuel Additives Reporting Forms.” December 11, 2012. Available at http://www.epa.gov/oms/fuels/reporting/
64. Mason, R., and J. Buckingham. EPA 2005 Sulfur in Diesel Fuel Round Robin Test Plan and Data Analysis. Report prepared for the National Vehicle and Fuels Emis-sions Laboratory, U.S. Environmental Protection Agency. December 2005. Available at http://www.docstoc.com/docs/46146973/2005-US-EPA-ULSD-Round----Robin-Test-Program
65. Code of Federal Regulations. Title 40, sec. 80. National Archives and Records Administration. 2011.
66. “Fuel Violation Fines Sought.” Associated Press, appearing in Spokane Chronicle. December 4, 1985.

154
INTERNATIONAL COUNCIL ON CLEAN TRANSPORTATION
67. U.S. Environmental Protection Agency. “Biofriendly Corporation Clean Air Act Settlement.” November 3, 2008. Available at http://www.epa.gov/compliance/enforcement/air/cases/biofriendlycorp.html
68. U.S. Environmental Protection Agency. “Rocky Mountain Pipeline Clean Air Act Settlement.” May 4, 2011. Available at http://www.epa.gov/compliance/resources/cases/civil/caa/rockymountainpipeline.html
69. American Petroleum Institute. “API Suggested Diesel Fuel Pump Labels.” May 10, 2010. Available at http://www.api.org/oil-and-natural-gas-overview/fuels-and-refining/diesel/~/media/2D982BF082684C46BD981DF4C52413C4.ashx
70. Code of Federal Regulations. Title 40, sec. 51. National Archives and Records Administration. 2011.
71. National Petroleum Association (Japan). “Quality Control System of on Vehicle Fuel in Japan.” October 24, 2006. Available at http://www.pecj.or.jp/japanese/overseas/koria/2006_2nd_oiltech/02_Quality_control_system.pdf
72. Hirota, K. “Fuel Quality Monitoring (FQM) in EU, US and Japan.” Japan Automobile Research Institute (JARI). Presented at the Indo-JARI Roundtable 2008. New Delhi. March 17–18, 2008. Available at http://petrofed.winwinhosting.net/upload/17-18Mar09/Hirota_sII%20.pdf#page=26&zoom=auto,549,37
73. National Petroleum Association. Better to Protect the Quality of Petroleum Products. 2011. Available (in Japanese) at http://www.sekiyu.or.jp/qualitycontroll/index.html.
74. Bureau of Environment, Tokyo Metropolitan Government. In Introducing Diesel Vehicle Control. September 2003. Available at http://www.kankyo.metro.tokyo.jp/en/attachement/diesel_vehicle.pdf
75. Bureau of Environment, Tokyo Metropolitan Government. Costs of METI. 2010.
76. Zhang K., et al. “Sulfur Content of Gasoline and Diesel Fuels in Northern China.” Energy Policy 38, no. 6 (2010): 2934–40.
77. Essential Commodities Act, 1955. Act no. 10 of 1955. Parliament of India. April 1, 1955.
78. Petroleum and Natural Gas Regulatory Board Act, 2006. Act no. 19 of 2006. Parlia-ment of India. March 31, 2006.
79. Ministry of Petroleum and Natural Gas (India). Petroleum and Natural Gas (Amend-ment) Rules, 2003. April 1, 2003. Available at http://www.dghindia.org/pdf/PNG_AMENDMENT_RULES_2003.pdf
80. Personal contact with Malhotra, R. 2011.
81. Personal contact with Jain, P. 2011.
82. Personal contact with Sharma, G.K. 2011.
83. Petroleum and Natural Gas Regulatory Board (India). Annual Report 2009–10. 2010. Available at http://www.pngrb.gov.in/newsite/pdf/annualreports/AN-REPORT-%28ENGLISH%29-2009-10.pdf
84. Garg, M., et al. “Measurement and Estimation of Gasoline Fuel Vapour Losses from Retail Outlets.” SAE Technical Paper no. 2011-26-0117. SAE International. January 19, 2011.
85. Morris S., A. Pandey, and S. Barua. A Subsidy on the Kerosene Distribution and Related Subsidy Administration and the Generation and Assessment of Options for Improvement of the System: Final Report Submitted to the Petroelum Federation of India, New Delhi. Indian Institute of Management Ahmedabad. June 1, 2006. Avail-able at http://petrofed.winwinhosting.net/upload/Kerosene.pdf

155
OVERVIEW OF INDIA’S VEHICLE EMISSIONS CONTROL PROGRAM
86. Roychowdhury, A., et al. A Report on the Independent Inspection of Fuel Quality at Fuel Dispensing Stations, Oil Depots and Tank Lorries. Report submitted to the Environmental Pollution (Prevention and Control) Authority (India). Centre for Science and Environment. February 5, 2002. Available at http://old.cseindia.org/campaign/apc/pdf/Fnladul.pdf
87. Kumar, N. “Anti-Adulteration Cell Closed Down.” The Hindu. November 15, 2004. Available online at http://www.hindu.com/2004/11/15/stories/2004111505030500.htm
88. Alternative Fuels Data Center, U.S. Department of Energy. “Natural Gas Vehicle Emissions.” 2013. Available at http://www.afdc.energy.gov/vehicles/natural_gas_emissions.html
89. Posada, F. “CNG Bus Emissions Roadmap: From Euro III to Euro IV.” International Council on Clean Transportation. December 2009. Available at http://www.theicct.org/sites/default/files/publications/CNGbuses_dec09.pdf
90. Alvarez R., et al. “Greater Focus Needed on Methane Leakage from Natural Gas Infrastructure.” Proceedings of the National Academy of Sciences of the United States of America 109, no. 17 (April 9, 2012): 6435–40.
91. Sperling, D., and D. Gordon. Two Billion Cars: Driving toward Sustainability. Oxford University Press. 2009.
92. Delhi Transport Corporation. Citizen Charter. 2011.
93. Energy Information Administration, U.S. Department of Energy. “Analysis Brief: India.” March 18, 2013. Available at http://www.eia.gov/countries/analysisbriefs/India/india.pdf
94. Nett Technologies Inc. “Emissions FAQ (Frequently Asked Questions).” 2013. Avail-able at http://www.nettinc.com/information/emissions-faq
95. Extraordinary Road Trip. Research Lab: Understanding the Issues. “Liquified Petroleum Gas (LPG) (A Non-Renewable Resource).” n.d. Available at http://www.extraordinaryroadtrip.org/research-library/technology/liqufied-petroleum/ad-draw.asp
96. Sheng, C. “China LPG and CNG Gas Vehicle Development Status.” March 21, 2006. Available (in Chinese) at http://www.istis.sh.cn/list/list.aspx?id=2700
97. LPG Taxi’s. 2012. Available at http://www.fuelture.com/magazine/LPG-Taxi-s/
98. International Council on Clean Transportation, Polk, R.L. CNG/LPG Use by EU Country. 2011.
99. Propane Facts. “Backgrounder.” 2008 Available at http://www.propanefacts.ca/about/news/backgrounder/
100. BRC Limited. “LPG around the World.” 2013. Available at http://brcgb.co.uk/about-lpg/lpg-around-the-world
101. Alternative Fuels Data Center, U.S. Department of Energy. “Ethanol Vehicle Emissions.” 2013. Available at http://www.afdc.energy.gov/vehicles/flexible_fuel_emissions.html
102. Minnesota Department of Agriculture. E20 Test Results. Various dates.Available at http://www.mda.state.mn.us/renewable/ethanol/e20testresults.aspx
103. Orbital Engine Company. A Literature Review Based Assessment on the Impacts of a 20% Ethanol Gasoline Fuel Blend on the Australian Vehicle Fleet Report con-ducted for Environment Australia. 2002. Available at http://www.nmma.org/assets/cabinets/Cabinet103/ethanol-report.pdf
104. E85 Emissions. 2011. Available at http://www.afdc.energy.gov/vehicles/flexible_fuel_emissions.html

156
INTERNATIONAL COUNCIL ON CLEAN TRANSPORTATION
105. FuelEconomy.gov, U.S. Department of Energy. “Ethanol.” 2013. Available at http://www.fueleconomy.gov/feg/ethanol.shtml
106. Posada, F., and C. Malins. Biodiesel carbon intensity, sustainability, and effects on vehicles and emissions. International Council on Clean Transportation. 2011.
107. Searchinger, T., et al. “Use of U.S. Croplands for Biofuels Increases Greenhouse Gases through Emissions from Land-Use Change.” Science 319, no. 5867 (February 29, 2008): 1238–40..
108. Alternative Fuels Data Center, U.S. Department of Energy. “Ethanol Blends.” 2013. Available at http://www.afdc.energy.gov/fuels/ethanol_blends.html
109. Alternative Fuels Data Center, U.S. Department of Energy. “Volumetric Ethanol Excise Tax Credit (VEETC).” 2013. Available at http://www.afdc.energy.gov/laws/law/US/399
110. Census Bureau, U.S. Department of Commerce. “Retail Trade: United States.” 2002 Economic Census. Revised, January 6, 2012. Available at http://www.census.gov/econ/census02/data/us/US000_44.HTM
111. U.S. Environmental Protection Agency. “Regulatory Announcement: EPA Finalizes Regulations for the National Renewable Fuel Standard Program for 2010 and Beyond.” February 2010. Available at http://www.epa.gov/otaq/renewablefuels/420f10007.pdf
112. European Commission. Directive 2009/28/EC of the European Parliament and of the Council of 23 April 2009 on the Promotion of the Use of Energy from Renew-able Sources and Amending and Subsequently Repealing Directives 2001/77/EC and 2003/30/EC. April 23, 2009.
113. Air Resources Board, California Environmental Protection Agency. “Low Carbon Fuel Standard Program.” 2013. Available at http://www.arb.ca.gov/fuels/lcfs/lcfs.htm
114. Licht F.O. World Ethanol and Biofuels Report, vol. 8, no. 16. 2010.
115. Tanquintic-Misa, E. “After LNG, China Test Drives Methanol-Fuelled Cars.” International Business Times, March 1, 2012. Available at http://au.ibtimes.com/articles/307063/20120301/lng-china-kyoto-protocol-methanol.htm#.UdsfFaz8-BY
116. Ministry of New and Renewable Energy (India). “National Policy on Biofuels.” n. d. Available at http://mnre.gov.in/file-manager/UserFiles/biofuel_policy.pdf
117. Aradhey, A. “India Biofuels Annual, 2010.” GAIN Report no. IN1058, prepared for the Global Agricultural Information Network, U.S. Department of Agriculture Foreign Agricultural Service.July 1, 2010. Available at http://gain.fas.usda.gov/Recent%20GAIN%20Publications/Biofuels%20Annual_New%20Delhi_India_7-1-2010.pdf
118. Personal contact with Baral, A. International Council on Clean Transportation. 2012.
119. Kant, P., and S. Wu. “The Extraordinary Collapse of Jatropha as a Global Biofuel.” Environmental Science and Technology 45, no. 17 (September 1, 2011): 7114–15.
120. Biswas, P., S. Pohit, and R. Kumar. “Biodiesel from Jatropha: Can India Meet the 20% Blending Target?” Energy Policy 38, no. 3 (March 2010): 1477–84.
121. Findlater, K., and M. Kandlikar. “Land Use and Second-Generation Biofuel Feed-stocks: The Unconsidered Impacts of Jatropha Biodiesel in Rajasthan, India.” Energy Policy 39, no. 6 (June 2011): 3404–13.
122. Agoramoorthy, G., and P. Patel. “India’s Biodiesel Development: Swings and Round-abouts.” Environmental Science and Technology 46, no. 2 (January 17, 2012): 589–90.
123. Jyoti, A. “Jairam Has No Faith in Jatropha Biofuel.” The Pioneer. May 18, 2012. Text available at http://tech.groups.yahoo.com/group/biofuelwatch/message/5274

157
OVERVIEW OF INDIA’S VEHICLE EMISSIONS CONTROL PROGRAM
124. Ethanol India. “Ethanol in India—Information and Useful Links.” 2013. Available at http://www.ethanolindia.net/
125. Personal contact with Malins, C., and Searle, S. International Council on Clean Transportation. 2012.
126. Alternative Fuels Data Center, U.S. Department of Energy. “Emissions from Hybrid and Plug-In Electric Vehicles.” 2013. Available at http://www.afdc.energy.gov/vehicles/electric_emissions.php
127. Alternative Fuels Data Center, U.S. Department of Energy. “Hydrogen Fuel Cell Vehicle Emissions.” 2013. Available at http://www.afdc.energy.gov/vehicles/emis-sions_hydrogen.html
128. Shulock, C., and E. Pike, with A. Lloyd and R. Rose. Vehicle Electrification Policy Study. International Council on Clean Transportation. February 2011.
129. Alternative Fuels Data Center, U.S. Department of Energy. “Federal Laws and Incentives.” 2013. Available at http://www.afdc.energy.gov/laws/fed_summary
130. Internal Revenue Service, U.S. Department of the Treasury. “Qualified Vehicles Acquired after 12-31-2009: Qualified Plug-In Electric Drive Motor Vehicle (IRC 30D).” Revised, April 8, 2013. Available at http://www.irs.gov/Businesses/Qualified-Vehicles-Acquired-after-12-31-2009
131. Freed, C. California CARB Mandates. 2011.
132. European Automobile Manufacturers’ Association (ACEA). “Overview of Tax Incen-tives for Electric Vehicles in the EU.” April 20, 2010. Available at http://www.acea.be/images/uploads/files/20100420_EV_tax_overview.pdf
133. Japan Automobile Manufacturers Association. The Motor Industry of Japan 2009. May 2009.
134. Goodman, J. “An Electric Boost for Bicyclists.” New York Times. January 31, 2010. Available at http://www.nytimes.com/2010/02/01/business/global/01ebike.html?pagewanted=all&_r=0
135. Ministry of New and Renewable Energy (Bio Energy and Technology Development Group) (India). “Implementation of Alternate Fuels for Surface Transportation Programme for the Remaining Period of 11th Plan for the Years 2010–2011 and 2011–2012.” 2010. Text available at http://hareda.gov.in/writereaddata/document/hareda034353402.pdf
136. Salvi, R., and S. Nambiar. “Electric Vehicle India.” FinPro. n.d. Available at http://www.tekes.fi/fi/gateway/PTARGS_0_201_403_994_2095_43/http%3B/tekes-ali2%3B7087/publishedcontent/publish/programmes/eve/documents/finpro_elec-tric_mobility_in_india_2013.pdf
137. Booz and Company. “Alternative Powertrains and Challenges for Next Decade.” PowerPoint presentation made at the SIAM Annual General Meeting 2011. Society of Indian Automobile Manufacturers. New Delhi. September 2011.
138. Sethi, N. “PM unveils plan to promote electric, hybrid vehicles.” LiveMint. 2013.
139. Bike Europe. “India’s Biggest Bike Maker Enters E-Bike Market with Take-Over of Ultra Motor’s Brand Names.” January 3, 2012. Available at http://www.bike-eu.com/Home/General/2012/1/Indias-Biggest-Bike-Maker-Enters-E-Bike-Market-with-Take-Over-of-Ultra-Motors-Brand-Names-BIK005547W/
140. Krishna U, M. “Future of Electric Bikes in India.” Businessgyan. February 5, 2011. Available at http://www.businessgyan.com/b/future_electric_bikes_india
141. Electric Bicycle Guide. “Statistics and Trends.” 2013. Available at http://www.electric-bicycle-guide.com/electric-bicycle-statistics.html

158
INTERNATIONAL COUNCIL ON CLEAN TRANSPORTATION
142. Energy Information Administration, U.S. Department of Energy. “Analysis Brief: India.” March 18, 2013. Available at http://www.eia.gov/countries/analysisbriefs/India/india.pdf
143. TransportPolicy.net. “U.S. Light-duty: Fuel Economy and GHG.” International Council on Clean Transportation and DieselNet. 2013. Available at http://transportpolicy.net/index.php?title=US:_Light-duty:_Fuel_Economy_and_GHG#Overview
144. Mock, P. “Development of a Worldwide Harmonized Light Vehicles Test Procedure (WLTP).” Working paper no. 2011-7. International Council on Clean Transportation. September 2011. Available at http://theicct.org/sites/default/files/publications/WLTP4_2011.pdf
145. He, H., and Tu, J. The New Passenger Car Fleet in China, 2010: Technology Assess-ment and International Comparisons. International Council on Clean Transportation. 2012. Available at http://theicct.org/sites/default/files/publications/ICCT_New_Pas-senger_Car_Fleet_China_2010.pdf
146. Kodjak, D., et al. Evolution of Heavy-Duty Vehicle GHG and Fuel Economy Standards. International Council on Clean Transportation. February 1, 2012.
147. DieselNet. “Emission Standards—Japan: Fuel Economy.” Revised, November 2009. Available at http://www.dieselnet.com/standards/jp/fe.php
148. International Council on Clean Transportation. “U.S. Greenhouse Gas Emissions and Fuel Efficiency Standards for Medium- and Heavy-Duty Engines and Vehicles.” Policy Update no. 14. September 23, 2011. Available at http://www.theicct.org/sites/default/files/publications/ICCTpolicyupdate14_USHDV_final.pdf
149. General Administration of Quality Supervision (China). Final Consumption Test Methods for Medium and Heavy-Duty Commercial Vehicles. 2011.
150. Kamakaté, F., and D. Gordon. Managing Motorcycles: Opportunities to Reduce Pollution and Fuel Use from Two- and Three-Wheeled Vehicles. International Council on Clean Transportation. October 2009. Available at http://www.theicct.org/sites/default/files/publications/managing_motorcycles.pdf
151. Austin, M. “New EPA Fuel-Economy Stickers for Gas Vehicles, Plug-in Hybrids, and EVs Explained.” Car and Driver. May 26, 2011. Available at http://blog.caranddriver.com/new-epa-fuel-economy-sticker-explained/
152. Fuel Efficiency Labeling Worldwide. International Council on Clean Transporta-tion. 2009.
153. Department of Sustainability, Environment, Water, Population and Communities (Australia). “Fuel Consumption Label.” Revised, June 10, 2008.. Available at http://www.environment.gov.au/settlements/transport/fuelguide/label.html
154. United Nations Environment Programme. “Leaner, More Efficient Vehicles—Chile.” Global Fuel Economy Initiative. n.d. Available at http://www.unep.org/transport/gfei/autotool/approaches/information/labeling.asp#chile
155. Planning Commission (India). Low Carbon Strategies for Inclusive Growth: An Interim Report. May 2011. Available at http://planningcommission.nic.in/reports/genrep/Inter_Exp.pdf
156. Bureau of Energy Efficiency, Ministry of Power (India). “Consultation Paper: Standards and Labeling of Fuel Consumption in Cars.” October 21, 2011. Available at http://www.indiaenvironmentportal.org.in/files/file/BEE%20Consultation%20Paper-21Oct2011.pdf
157. Mock, P. “Fuel Economy Labels: Focus on Non-EU Countries.” PowerPoint presenta-tion made at an International Energy Agency workshop, Paris, April 30, 2013. Available at http://www.iea.org/media/workshops/2013/gfeilabelling/02.ICCT.130430ICCTCO2labelingoutsideEU.pdf

159
OVERVIEW OF INDIA’S VEHICLE EMISSIONS CONTROL PROGRAM
158. O’keefe, R. “Outdoor air pollution among top global health risks in 2010. Health Effects Institute. December 13, 2012.
159. Guttikunda, S., Jawahar, P. “Road Transport Emissions in India 2010-2030. Simple Interactive Models for Better Air Quality. November 2012.
160. Mani, M., Markandya, A., Sagar, A., Strukova, E. An Analysis of Physical and Monetary Losses of Environmental Health and Natural Resources in India. World Bank. Octo-ber 2012.
161. HEI Panel on the Health Effects of Traffic-Related Air Pollution. Traffic-Related Air Pollution: A Critical Review of the Literature on Emissions, Exposure, and Health Effects. Special Report no. 17. Health Effects Institute. January 2010. Available at http://pubs.healtheffects.org/getfile.php?u=553
162. Coalition for Clean Air. “Fast Facts: Pollutants and Health Effects.” 2013. Available at http://ccair.org/facts-about-air-pollution/pollutants-a-health
163. Apte, J. “Draft India iF Results.” 2011.
164. Posada, F. “Model Input Description—Cost of Emission Control Technologies for Vehicles in India.” International Council on Clean Transportation. 2011.
165. HEI International Scientific Oversight Committee. Outdoor Air Pollution and Health in the Developing Countries of Asia: A Comprehensive Review. Special Report no. 18. Health Effects Institute. November 2010. Available at http://pubs.healtheffects.org/getfile.php?u=602
166. Posada Sanchez, F., A. Bandivadekar, and J. German. Estimated Cost of Emission Reduction Technologies for Light-Duty Vehicles. International Council on Clean Transportation. March 2012. Available at http://www.theicct.org/sites/default/files/publications/ICCT_LDVcostsreport_2012.pdf
167. Environmental Protection Agency. Exposure Factors Handbook, chapter 6. September 2011.

BEIJING BERLIN BRUSSELS SAN FRANCISCO WASHINGTON
www.theicct.org