Download File - City of Augusta
102
Transcript of Download File - City of Augusta


WEST AUGUSTA I Development Feasibility Study
June 2010 prepared for: Augusta Progress Inc. City of Augusta, Kansas prepared by: Gould Evans Associates Kansas City, MO Transystems Corporation Wichita, KS Richard Caplan and Associates Prairie Village, KS

PAGE INTENTIONALLY LEFT BLANK

WEST AUGUSTA | Development Feasibility Study
table of contents:
1. Introduction I-1 1.1 Introduction I-1 1.2 Study Purpose I-1 1.3 Study Area I-2
2. Technical Research TR-1 2. 1 Planning TR-1 2. 2 Infrastructure TR-14 2. 3 Economics TR-20
3. Corridor Framework CF-1 3.1 Land Use and Development CF-1 3.2 Infrastructure Service CF-8 3.3 Community Impact CF-24
4. Tool Box TB-1
4.1 Introduction TB-1 4.2 Toolbox TB-2 4.3 Land Use and Development TB-3 4.4 Infrastructure TB-6 4.5 Economics TB-6
june - 2010
list of figures: I-1 figure 1-1 regional context I-3 figure 1-2 study area TR-2 figure 2-1 generalized existing land use TR-6 figure 2-2 city of augusta zoning TR-10 figure 2-3 natural resources TR-12 figure 2-4 fire district boundaries TR-13 figure 2-5 water district boundaries TR-13 figure 2-6 school district boundaries TR-15 figure 2-7 existing traffic conditions TR-23 figure 2-8 net population change TR-26 figure 2-9 total property tax mill levy 2008 TR-27 figure 2-10 median housing sale price TR-29 figure 2-11 adult population with college degrees TR-30 figure 2-12 total construction value of new permits CF-2 figure 3-1 alternative #1 rural corridor CF-3 figure 3-2 alternative #2 neighborhood CF-4 figure 3-3 alternative #3 commercial center CF-6 figure 3-4 land use plan CF-9 figure 3-5 santa fe lake existing peak hour / ADT CF-12 figure 3-6 conceptual roadway layout CF-14 figure 3-7 proposed improvements – full build out CF-23 figure 3-8 phase 1 (interim) infrastructure improvements

WEST AUGUSTA | Development Feasibility Study
list of tables: TR-9 table 2-1 housing stock TR-9 table 2-2 housing occupancy and value TR-22 table 2-3 average wage comparison 2007 TR-24 table 2-4 wichita msa population growth by county TR-28 table 2-5 south central kansas employment TR-33 table 2-6 regional labor force and unemployment TR-34 table 2-7 area industry employment/wage/education TR-35 table 2-8 kansas manufacturing growth patterns TR-37 table 2-9 manufacturing establishment trends TR-38 table 2-10 augusta industry profile 2008 TR-41 table 2-11 target industry CF-7 table 3-1 development capacity CF-13 table 3-2 transportation infrastructure costs – full build CF-15 table 3-3 water infrastructure costs – full build CF-16 table 3-4 wastewater infrastructure costs – full build CF-17 table 3-5 transportation infrastructure costs – interim CF-18 table 3-6 water infrastructure costs – interim CF-19 table 3-7 wastewater infrastructure costs – interim CF-19 table 3-8 infrastructure costs – full build CF-20 table 3-9 total improvement costs – interim CF-20 table 3-10 interim phased costs – commercial/residential CF-20 table 3-11 interim phased costs – industrial CF-22 table 3-12 projected development demand CF-26 table 3-13 west augusta phase 1 with infrastructure CF-27 table 3-14 west augusta area retail sales CF-28 table 3-15 total and average annual assessed value CF-30 table 3-16 west augusta projected revenues

june - 2010
list of tables: (cont.) CF-31 table 3-17 proposed sewer capital fee CF-32 table 3-18 projected infrastructure improvement costs CF-34 table 3-19 other municipal revenues and expenses CF-36 table 3-20 summary of financial feasibility TB-12 table 4-1 summary of financing tools

WEST AUGUSTA | Development Feasibility Study I - 1
1. Introduction
1-1 Introduction. US 54/400 is a significant feature that serves the community of Augusta. Access, afforded by the roadway, provides opportunities for the community. With an estimated population of 8,683 people (2007), the City of Augusta is located just minutes away from the largest city in the state – Wichita, KS. US 54/400 provides a direct route from Augusta to the Wichita metropolitan area. This connection serves the businesses located along the corridor and moves a significant amount of traffic between the two cities. The corridor also provides access to a potential growth area for Augusta. As the community continues to grow and develop, US 54/400 could act as the spine that provides access for future growth and development. Due to the pace of the City’s growth and the corridor’s design, function and aesthetics will be important in providing a foundation for an active environment that contributes to the City of Augusta.
figure 1-1 regional context

I – 2 june – 2010
1-2 Purpose of the Study. This study is intended to analyze the development feasibility of the US 54/400 Corridor between Indianola Road and the current western city limits of Augusta, between 90th and 110th Streets. In general, this represents a five square mile area. The feasibility of the area will be determined through a community benefit analysis in which the cost of providing municipal services to the corridor will be examined and the benefit to the community will be understood. The feasibility of service provisions will be based on a development vision that will provide a physical framework for anticipated future development. The plan should help to build a foundation for a partnership between private and public sectors, so that future investments are done in a consistent and cohesive manner. Ultimately, long-term economically and environmentally sustainable actions will be an important aspect to the success of the Highway 54/400 corridor. To better understand the potential of the corridor we must first understand the current conditions. This document is intended to provide a foundation of information that the study recommendations will stem from. The foundation of information is built upon two primary components, these include:
• Technical Research related to an analysis of the existing built environment. These include: A. Planning (land use, zoning, housing and natural, cultural and political resources); B. Infrastructure (transportation and utilities); and C. Economics.
• Plans + Priorities Analysis related to the plans and studies done prior to this study. These include: A. City of Augusta, KS Comprehensive Plan Update; B. Vision Augusta; and C. Sculpture Park Plan

WEST AUGUSTA | Development Feasibility Study I - 3
1-3 Study Area. The corridor study area focuses on Highway 54/400, west of the City of Augusta, including one mile north and one mile south of the roadway. The study boundaries include 90th Street to the north; 110th Street to the south; Indianola Road to the west; and Augusta city limits to the east. However, it is recognized that actions proposed within the corridor can have an effect on the surrounding existing community and the downtown.
figure 1-2 study area

I – 4 june – 2010
PAGE INTENTIONALLY LEFT BLANK

WEST AUGUSTA | Development Feasibility Study TR- 1
2. Technical Research This section focuses on the existing conditions of the US 54/400 corridor. Three topics are discussed in this section focusing on the basic technical elements of the corridor. These include: 2-1 Planning; 2-2 Infrastructure; and 2-3 Economic Analysis. The information presented herein is a combination of City and County data that were acquired. The US 54/400 Corridor, not originally identified as a growth area in the Comprehensive Plan, was designated as such in 2006 and expanded to the limits of this study in 2008. Butler County and the City of Augusta signed an Interlocal Agreement designating the corridor, including one-mile on each side, from the existing city limits to SW Indianola Road as a growth area for the City of Augusta. With the approval of this agreement, planning, zoning and subdivision jurisdiction were given to the City of Augusta. 2-A Planning The planning element of corridor analysis focuses on those physical development aspects of the corridor, and adjacent properties, including land use, zoning and natural and cultural resources. Existing Land Use – focuses on current development patterns along the corridor. The city limits of Augusta do not currently extend west of SW Dike Road. There are two exceptions for land that the City has annexed within the corridor; the Augusta Municipal Airport at SW Indianola and US 54/400 and a small piece of property west of Santa Fe Lake Road on the south side of US 54/400. The City’s land use designations have not been applied to the corridor through an amendment ot the Comprehensive Plan. However, based on this study the Comprehensive Plan will be updated for the corridor. (See Figure 2-1)
US 54/400 Commercial Development

TR- 2 june - 2010
Based on the visual analysis and existing land use information provided by Butler County, a generalized land use map for the 10 square miles of the corridor study area was created. (See Figure 2.1) Identified as the future growth area of the City of Augusta, the land use definitions within the Augusta Comprehensive Plan have been used. The Comprehensive Plan does not include an agriculture land use category, which much of the corridor would be classified as, so this category currently is defined by the Butler County Agricultural Distirct. For more information regarding land within the City of Augusta, reference the Comprehensive Plan Update 2002.
Low-Density Residential – areas devoted for residential development with densities of up to 4 units per acre and served by municipal services within Urban Service Areas. Commercial – areas devoted for retail business uses, including shopping centers and other isolated retail establishments. Industrial – areas devoted for industrial and warehousing business with limited manufacturing uses.
Figure 2-1 Generalized Existing Land Use

WEST AUGUSTA | Development Feasibility Study TR- 3
Agricultural – land devoted to agricultural uses or natural areas only. Over 50 percent of the corridor study area is agricultural. Other land use categories that could apply to the corridor in the future and are defined in the Comprehensive Plan are: Higher Density Residential – areas devoted for the residential development with densities more than 4 units per acre and up to 10 units per acre. Public/Semi-Public – areas devoted primarily for the institutional, governmental or educational uses. Some service-commercial, office-commercial and semi-public institutional uses are permited in this land use category as well. Institutional Overlay District – areas devoted for the office-commercial and limited retail-commercial uses to support medical and related institutional land uses. Urban Service Area – areas devoted for urban uses in the area to be annexed and served with municipal service. Parks & Recreation – areas devoted for park land, facilities and recreational use including linear parks and trails. Long-term Development – areas for the future urban-density development. Assesment must be made of the ability of the existing utility infrastructure to serve the additional growth. Long-term Environmental Mitigation Improvement Area – area that is located in the floodplain at 70th Street and Ohio Street. Stormwater, roadway and culvert improvements will be made.

TR- 4 june - 2010
Similar to the Augusta Comprehensive Plan, Butler County has a comprehensive plan that applies primarily to the unincorporated areas of the county. The corridor was originally developed under the guidance of the Butler County Comprehensive Plan and its land uses include: Agricultural – land devoted to agricultural use only. Over 50 percent of the corridor study area is agricultural. As this corridor develops, it is important that future recommendations take this into consideration that some of the agricultural land uses may need to be preserved. Single-family Residential – land devoted to residential use only. This category includes the older single-family residential neighborhoods between Indianola Road and Santa Fe Lake Road, north of US 54/400; and new single-family residential development scattered on the south side of US 54/40. Commercial – land devoted to retail, mixed-use and office land uses. Commercial uses along the US 54/400 corridor are scattered right along the corridor and occur at major intersections, such as: US 54/400 and Tawakoni Road, Santa Fe Lake Road and Diamond Road. These commercial uses are mainly highway oriented businesses that take advantage of the location and direct access of this high traffic highway. Industrial – land devoted for light and heavy industrial use. One of the largest industrial sites along the corridor is the Augusta Municipal Airport, which is operated and owned by the City of Augusta and is one of two publicly owned aiports in Butler County.

WEST AUGUSTA | Development Feasibility Study TR- 5
Zoning – regulates uses and the development of land to protect the public health, safety and welfare of the community. Zoning is applied to land and defines the appropriate uses and development standards for proposed development.
City of Augusta Zoning. US 54/400 corridor study area is in Butler County but under the City of Augusta’s zoning jurisdiction, based on the interlocal agreement executed in 2008. Consistent with the agreement all land within the growth area has been re-zoned to the City of Augusta’s zoning designations. The zoning map shows the current zoning classifications in this unincorporated area of Butler County within the growth area (See Figure 2-2). Six different zoning categories that apply to the corridor study area are described below:
Figure 2-2: City of Augusta Zoning

TR- 6 june - 2010
C Commercial District – this zoning district includes commercial zoned properties along the corridor. Most of which occur on both sides of US 54/400 at major crossing intersections, including: Indianola Road, Tawakoni Road, Santa Fe Lake Road, and Diamond Road. R-1 Single-Family Dwellings – this zoning district includes single-family residential properties with density less than one unit per acre. The area between 95th Street and US 54/400, and between Tawakoni Road and Santa Fe Lake Road includes most of the properties zoned in this category. The area just east of Indianola Road also contains several of the R-1 zoned properties. R-6A Rural Residential – this zoning district includes rural residential properties with density between one unit per acre and one unit per 4.99 acres. The properties zoned in this category mainly occur on the north-west side of the corridor in the older mixed, rural and single-family, residential neighborhoods. R-6A zone properties are also found scattered on the east side of the corridor study area besides one of the larger rural neighborhoods, located on the north-east corner of 110th Street and Tawakoni Road. R-6B Rural Residential – this zoning district includes rural residential properties with density between one unit per 5 acres and one unit per 9.99 acres. R-6B properties are mainly located south of the US 54/400 corridor, mostly adjacent to other rural and agricultural zoned properties. R-6C Rural Residential – this zoning district includes rural residential properties with density between one unit per 10 acres and one unit per 19.99 acres. R-6C properties are mainly located south of the US 54/400 corridor, mostly adjacent to other rural and agricultural zoned properties. R-6D Rural Residential – this zoning district includes rural residential properties with density between one unit per 20 acres and one unit per 39.99 acres. R-6C properties are scattered throughout the corridor study area.

WEST AUGUSTA | Development Feasibility Study TR- 7
AG-1 – this zoning district has been established to provide agricultural uses for land of 10 acres or more in size. Permitted uses in this district include the growing of crops and prohibit live stock. AG-2 – this zoning district has been established to provide agricultural uses for land of 40 acres or more in size located in the growth area. Permitted uses within this district include agriculture and accessory structures, single-family dwellings and guest houses, oil and gas exploration and livestock but prohibit commercial feedlots.
Population – Augusta has been the beneficiary of population growth driven by the Wichita Metropolitan Area. Augusta, continuing it past growth trends through the 20th century, grew by over three percent between 2000 and 2007, from 8,423 to 8,683. Since 1970, the City of Augusta has grown by 30 percent, adding almost 2,000 people to the population. This trend is projected to continue through 2030 with a projected growth rate of 42 percent, for the City of Augusta over the next two and one-half decades, according to the Kansas Water Office. A population increase of that magnitude will require an increase in the available housing stock, which will likely have an impact on the US 54/400 Corridor for both development and traffic.
Housing – Housing, as in most communities, makes up the greatest portion of the building stock of a community. This is particularly true given the proximity of Augusta to the Wichita Metropolitan Area. The City of Augusta housing stock continues to grow, making the availability of housing more important. Total housing units have increased almost 20 percent (577 units) from 1990 to 2000, bringing new mid-level and high-end housing development to the community. The Comprehensive Plan identifies affordable housing as a priority for the community. Residents have expressed a high interest in desirable higher density apartment units, patio homes, townhouses and assisting living facilities that the City of Augusta is currently lacking. (Comprehensive Plan page 43)

TR- 8 june - 2010
Augusta Andover El Dorado Total housing units 3,585 2,456 5,460 Lacking complete plumbing facilities 0.3 % 0.2 % 0.3 % Lacking complete kitchen facilities 0.4 % 0.7 % 0.7 % Structure Age
9-19 years old 21.4 % 53 % 8.9 % 70 and older 16.6 % 2.3 % 30.2 %
Median number of rooms 5.4 6.4 5.2
Augusta Andover El Dorado MSA number % number % number % number %
Total housing units 3,585 2,456 5,460 23,176 Occupied: 3,277 91.4 2,274 92.3 5,068 92.8 21,527 92.9 owner-occupied 2,324 70.9 1,822 80.1 3,163 62.4 16,722 77.7 renter-occupied 953 29.1 452 19.9 1,905 37.6 4,805 22.3 Vacant: 308 8.6 182 7.4 392 7.2 1,649 7.1 Median house value ($) 78,700 135,500 62,400 83,900
Table 2-2: Housing Occupancy and Value
Table 2-1: Housing Stock

WEST AUGUSTA | Development Feasibility Study TR- 9
Natural Resources – Augusta City Lake and its accompanying parks are approximately 300 acres in size and provide a recreational amenity as well as a functional back-up drinking water system for the community. Currently, growth within the City of Augusta’s is occurring north of the City primarily along North Ohio Street. As new areas are looked to for future growth, west of the current city limits becomes a focus. The natural resources in the area west of Augusta provide a challenge and an opportunity for growth. The Whitewater River, immediately west of Augusta provides a natural and scenic area for the community; however, the floodplain that surrounds the river separates the area from the existing community. In the past, the flooding of the river has had a dramatic impact on Augusta and the study area and it remains a concern. Almost three square miles of the study area (north of the corridor between Diamond Road and Dike Road; and south of the corridor between River Valley Road and Dike Road) is in the floodplain of the Whitewater River, limiting developable land in the City’s future growth area. In addition, the floodplain makes it difficult to extend utilities services to the west. Similarly, the Walnut River to the east and south of Augusta has impacted the community in the past.
Figure 2-3: Natural Resources

TR- 10 june - 2010
Land located in the floodplain can be used for recreational use. The City of Augusta currently provides varied types and sizes of park and recreation land. These include: play lots, neighborhood parks, community parks, linear parks and other special use recreation lands. A minimum standard of the National Recreation and Park Association (NRPA) is used by the City to determine an appropriate location and acreage, based on the City’s population, for the park land. Walking/jogging trails, linear parks, trail heads, bird watching points can be a great use for some land located in the floodplain.
An abandoned railroad right-of-way that runs along US 54/400 connecting the City of Augusta and the Cities of Andover and Wichita has been surfaced with gravel and currently is used as a trail. Owned by Butler County, within the county area, and by the City of Augusta, within the city limits, the trail has not been very heavily used for recreational purposes. It has a great potential as a multi-use trail; however, some public investments may be needed to improve the recreational function and aesthetics of this “green corridor”.
Cultural Resources – The City of Augusta is home to the Augusta Historical Museum which is home to the C.N. James Log Cabin. The cabin, built in 1868, is listed on the National Register of Historic Places and is one of the oldest landmarks in Butler County. Also in downtown Augusta is the Augusta Historic Theater. The theater has recently been restored to its original design. The community is also considered home to Henry’s Sculpture Hill, located outside of the city limits, created by the artist/owner Frank Jensen. In all, the “Hill” features more than 30 sculptures, a number of which are based on classic literature. While there are several resources within Augusta, there are no significant cultural resources within the corridor study area.
An existing trail/abandoned railroad R-O-W

WEST AUGUSTA | Development Feasibility Study TR- 11
Supporting Resources – This section focuses on the different political jurisdictions that have an influence in the US 54/400 corridor west of Augusta. Primarily this includes fire districts, water districts and school districts and their service areas. Fire Districts. The US 54/400 corridor study area is served by two different fire districts. These include: Fire District 1 (FD1) that provides services west of Santa Fe Lake Road; and Fire District 2 (FD2) that extends east of Santa Fe lake Road and includes the City of Augusta. FD1 services are managed by the City of Andover and FD2 by the City of Augusta.
Figure 2.4 - Fire District Boundaries

TR- 12 june - 2010
Water Districts. Two Butler County Rural Water Districts (BRWD) provide service to the area, BRWD 5 and BRWD 8. BRWD 5 generally covers the study area north of US 54/400 between Indianola Road on the west and the half section line between Diamond Road and Santa Fe Lake Road, on the east. Similarly, BRWD 8 covers the study area south of US 54/400 between Indianola Road on the west and the half-section line between River Valley Road and Dike Road, on the east. The remaining areas of the corridor are within the City of Augusta’s water service area. (See Figure 2-5) School Districts. Two different school districts cover the US 54/400 corridor study area. The area is mainly served by Augusta School District 402 that serves about 8,500 residents from Augusta and the surrounding rural areas. A small portion of the US 54/400 corridor study area lies within Andover Unified School District 385. The district covers almost one square mile of the corridor study area, located north of US 54/400 and west of Tawakoni Road. (See Figure 2-6)
Figure 2-6: School District Boundaries
Figure 2-5 - Water District Boundaries

WEST AUGUSTA | Development Feasibility Study TR- 13
2-B Infrastructure Augusta’s existing infrastructure is discussed in two sections: Transportation and Utilities. The Transportation section focuses on the existing street network system, access control and traffic conditions. The Utilities section focuses on the existing water system, waste water system and other utilities. Understanding each system is necessary for a complete corridor assessment as explained in the following sections. Transportation – US Hwy 54/400 is a four-lane divided highway through the study corridor with a general speed limit of 65 mph. The speed limit changes to 50 mph immediately west of the bridge at Whitewater River. Speed limits on US 54 through the City are reduced to 30 mph. Access points are generally restricted to right-in and right-out turns except for intersections at major arterials. Existing major arterials with signalized intersections along US Hwy 54/400 include US Hwy 77, Lulu Street and Santa Fe Lake Road. Other existing minor arterials, with a potential to serve as major arterials in the future, are stop-controlled and include River Valley Road, Diamond Road, Tawakoni Road and Indianola Road. All of these minor arterials are gravel roads with some paving near the intersection of US Hwy 54/400.
Figure 2-7: Existing Traffic Conditions
TR- 14 june - 2010
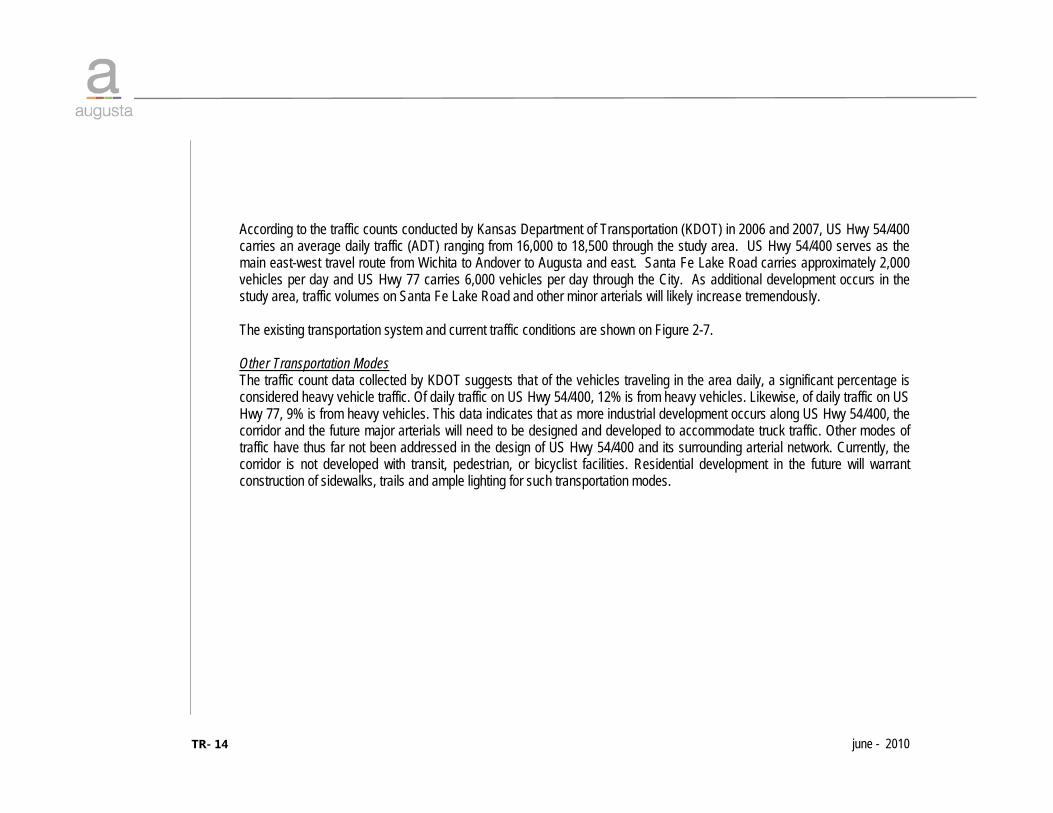
According to the traffic counts conducted by Kansas Department of Transportation (KDOT) in 2006 and 2007, US Hwy 54/400 carries an average daily traffic (ADT) ranging from 16,000 to 18,500 through the study area. US Hwy 54/400 serves as the main east-west travel route from Wichita to Andover to Augusta and east. Santa Fe Lake Road carries approximately 2,000 vehicles per day and US Hwy 77 carries 6,000 vehicles per day through the City. As additional development occurs in the study area, traffic volumes on Santa Fe Lake Road and other minor arterials will likely increase tremendously. The existing transportation system and current traffic conditions are shown on Figure 2-7. Other Transportation Modes The traffic count data collected by KDOT suggests that of the vehicles traveling in the area daily, a significant percentage is considered heavy vehicle traffic. Of daily traffic on US Hwy 54/400, 12% is from heavy vehicles. Likewise, of daily traffic on US Hwy 77, 9% is from heavy vehicles. This data indicates that as more industrial development occurs along US Hwy 54/400, the corridor and the future major arterials will need to be designed and developed to accommodate truck traffic. Other modes of traffic have thus far not been addressed in the design of US Hwy 54/400 and its surrounding arterial network. Currently, the corridor is not developed with transit, pedestrian, or bicyclist facilities. Residential development in the future will warrant construction of sidewalks, trails and ample lighting for such transportation modes.

WEST AUGUSTA | Development Feasibility Study TR- 15
Utilities – Within this section an analysis of all utilities are provided, including the Water System, Wastewater System and Other Utilities. Water System. The Augusta water system is served by surface water received from one reservoir and two lakes. Currently the City of Augusta is in the process of perfecting their water rights. Perfecting water rights is the establishment of actual water rights needed to serve the city. The City will be going through this process with finalization in 2011. The current water plant has a rating of 5.75 million gallons per day (MGD) which was completed in 2001. The City of Augusta average daily flow is 1.6 MGD for winter flows with a summer average near 3.4 MGD. Peak flows in the summer are near 4.2 and also has been determined, due to the overall system configuration, a comfortable maximum which cannot be sustained for long periods of time. The overall hydraulic capacity of the raw water lines hinders the capacity of the existing plant. The 10-mile connection from El Dorado Lake is an old line currently experiencing some failures and a pump malfunction. The raw water lines that add additional flow to the plant from the two other lakes are also in need of upgrade. Flows from this plant serve not only the City of Augusta but also Butler County Rural Water Districts (RWD) #4 and #6, Sedgwick County RWD #3 and the City of Mulvane. Staff does have concerns with the production of the ultimate capacity of 5.75 MGD. The high service pump station will need to be upgraded or rebuilt to increase the capacity but also to provide disinfection to the system. Within the plant, additional filters and settling basins need to be built once raw water needs are increased. Augusta is aggressively working on these issues including strategic planning of new lines south of Kelly Avenue to allow service west of the river. Furthermore, the Mulvane line has also seen issues in the past and it is not uncommon for this line to have breaks. (See Figure 2.8 Water Districts Map, TR-17) Discussions with staff have revealed issues with development west of the river. The first obstacle is of course the river and the flood plain. It is anticipated a polyethylene pipe would be placed under the river and floodplain by boring a large portion of the alignment. Once outside the floodplain, soil types and rock outcroppings are an apparent issue and will play a major role within the development of a system in this area. These two items will be a large factor in construction costs of the system. During the design of the system, pressure and storage will need to be considered. The current plant cannot sustain

TR- 16 june - 2010
pressures to serve this area, therefore, water towers and booster pump stations will need to be considered as development occurs. By letting existing contracts with wholesale districts terminate, the City could in the future serve this area. Butler County RWD #5 and RWD #8 are two other water resources available. Butler County RWD #8 serves south of U.S. 54/400 and is currently purchasing water from the City of Wichita. Wichita has contracted to sell water to this district with a few restrictions. One of the restrictions does not allow the district to serve any industrial user. This hinders the development potential at the airport property. Another restriction will not allow the district to serve any house on less than 10 acres unless they were grandfathered in. Butler County RWD #8 would like to find a way for the City of Augusta to serve their district which would increase development in this corridor. Augusta would then be capable of adding another customer without development costs for new water lines. Their closest water tank is at Tawakoni and 110th and is a 200,000 gallon structure. Butler County RWD #5 currently purchases water from the City of El Dorado and serves the area north of U.S. 54/400. They would like an additional water source in this area to make sure they can provide the amount of water required plus have a backup plan for the area. This district has a 300,000 gallon tank at Meadowlark and 90th. With these two districts interested in serving the area, a water connection could be brought across the floodplain with one connection point. The development fees could be split between all three entities and serve as a building block for the future. Anticipated upgrades for the water treatment plant and booster pump station are near 9 million dollars. With a current sustainability maximum near 3.6 million, the City anticipates the capabilities of the plant at the current time to be capable of serving an additional 300,000 to 400,000 gallons per day.

WEST AUGUSTA | Development Feasibility Study TR- 17
Waste Water System. The Augusta Waste Water Plant currently manages an average of 1.2 to 1.3 million gallons per day (MGD). 2008 was a very wet year and the plant flows during wet months shows the need for a continuation of Augusta’s plan to reduce infiltration. In 2001 the plant was upgraded with the capabilities of treating an average 1.5 MGD and a 4.5 MGD peak flow. However, due to current infiltration capabilities the plant is close to capacity at average daily flow in wet months. During periods of high flow, bypassing can be performed into the old basins, west of the plant, to help manage the flow prior to bypassing flow directly to the river. The current capabilities of the plant would need to be improved, or a second plant would need to be built on the west side of the river to serve the planned westward development. Investigations into the type of plant will need to be continued because of the soil types and physical location of the plant. If the existing plant were to be reused, the infrastructure needed would have the same general problems crossing the Whitewater River as was discussed in the water supply section. The first and foremost issue is to cross the river and floodplain. A polyethylene pipe would be placed under the river and floodplain from a lift station on the west side of the river. Multiple issues arise when adding an additional treatment facility which includes procuring land for the facility, zoning and staff expectations. Further discussions with the City has determined that if a line is constructed across the river then the existing plant will be upgraded instead of construction of a new plant. This will be investigated further. Other Utilities. Other key utilities within this corridor would be natural gas and electric. These are served by Kansas Gas Service and Westar respectively. Extremely rocky conditions will hinder the installation of underground utilities. However, Westar agreed that setting poles can be hard sometimes due to the rock. If a business requires or requests to have power placed underground additional charges above the normal underground rates would apply. This is something to think about when planning subdivisions and commercial centers. Kansas Gas Service is fed by Southern Star at the intersection of 50th and Santa Fe Lake Road. Gas could run down the original railroad right-of-way from the Andover area if the current railroad right-of-way is preserved for utilities.

TR- 18 june - 2010
2-C Economics The economic, demographic and geographic characteristics of a community significantly influence the potential for a community to expand its economy. The US 54/400 corridor west of Augusta in Butler County is characterized by the following strengths and weaknesses:
Corridor Strengths Corridor Weaknesses
• Presence of Municipal Airport • Less College Educated Workforce
• Lowest Wages in the Wichita MSA • Lower Amount of Private Investment
• Area Projected Population Growth • Limited Infrastructure
• Proximity to Interstate 35 • Quality Industrial and Business Park Competition in the Wichita MSA • Supply of Vacant Land for Development
• Competitive Augusta Property Tax Rate
• Affordable Housing Stock
• Favorable Regional Employment Trends

WEST AUGUSTA | Development Feasibility Study TR- 19
These strengths and weaknesses are described in more detail as follows: Economic Strengths
Presence of Augusta Municipal Airport. The availability of general aviation services and activity offers a convenient air transport alternative for existing and prospective Augusta businesses and visitors. Augusta Municipal Airport is one of only two publicly owned airports in Butler County. The airport’s presence provides a competitive edge to the corridor versus developing areas without this amenity.
Lowest Wages in the Wichita MSA. Butler County’s average wage is the lowest in the Wichita MSA. The average wage in Butler County is 22 percent lower than the State of Kansas average and 31 percent lower than the Sedgwick County average wage. The lower wage scale increases the corridor’s ability to attract prospective businesses by operating at a lower cost.
Table 2-3: Average Wage Comparisons 2007 Source: Kansas Department of Labor.
TR- 20 june - 2010
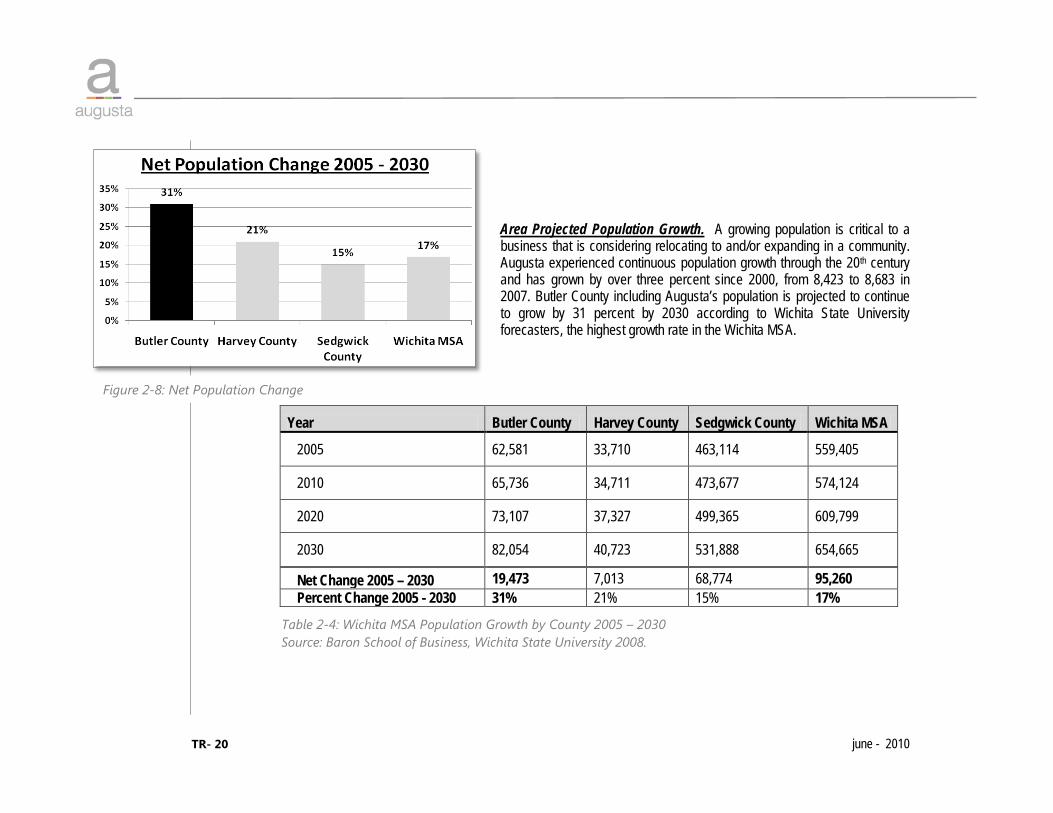
Area Projected Population Growth. A growing population is critical to a business that is considering relocating to and/or expanding in a community. Augusta experienced continuous population growth through the 20th century and has grown by over three percent since 2000, from 8,423 to 8,683 in 2007. Butler County including Augusta’s population is projected to continue to grow by 31 percent by 2030 according to Wichita State University forecasters, the highest growth rate in the Wichita MSA.
Year Butler County Harvey County Sedgwick County Wichita MSA
2005 62,581 33,710 463,114 559,405
2010 65,736 34,711 473,677 574,124
2020 73,107 37,327 499,365 609,799
2030 82,054 40,723 531,888 654,665
Net Change 2005 – 2030 19,473 7,013 68,774 95,260 Percent Change 2005 - 2030 31% 21% 15% 17%
Table 2-4: Wichita MSA Population Growth by County 2005 – 2030 Source: Baron School of Business, Wichita State University 2008.
Figure 2-8: Net Population Change

WEST AUGUSTA | Development Feasibility Study TR- 21
Proximity to Interstate 35. US Highway 54 corridor’s direct four lane access to Interstate 35 approximately 6 to 10 miles west of the current Augusta city limits provides excellent access for ground transportation for employees and trucks and the larger workforce in the region.
Supply of Vacant Land for New Development. The availability and selection of land available for development offers prospective developers and businesses the ability to accommodate specific building design needs on parcels most suitable for their future needs. Older, established commercial buildings and/or industrial parks may not offer a business the ability to grow or may require costly renovation or reconfiguration. When adequate infrastructure becomes available in the corridor, the ability to attract new business will be attractive to expanding and/or relocating companies.
Competitive Augusta Property Tax Rate. The Augusta total mill levy is lower than the average mill levy in two of the three most directly competing, neighboring communities.
Figure 2-9: Total Property Tax Mill Levy 2008 Source: Kansas League of Municipalities.
TR- 22 june - 2010
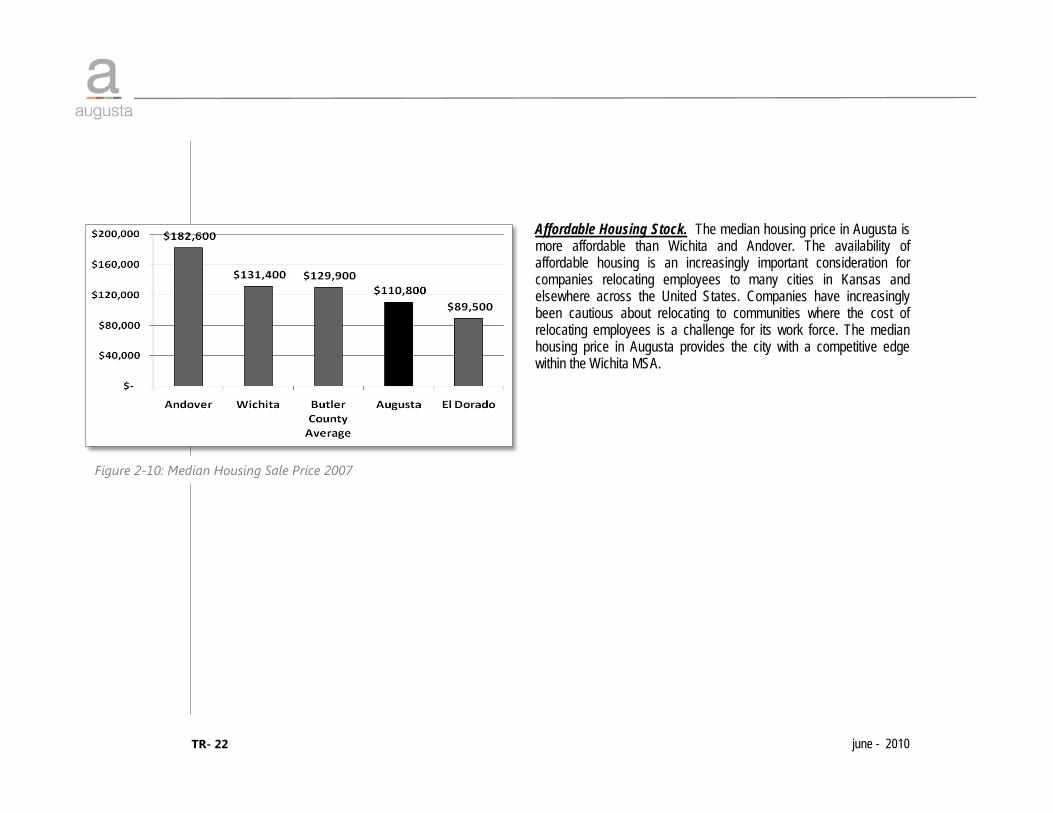
Affordable Housing Stock. The median housing price in Augusta is more affordable than Wichita and Andover. The availability of affordable housing is an increasingly important consideration for companies relocating employees to many cities in Kansas and elsewhere across the United States. Companies have increasingly been cautious about relocating to communities where the cost of relocating employees is a challenge for its work force. The median housing price in Augusta provides the city with a competitive edge within the Wichita MSA.
Figure 2-10: Median Housing Sale Price 2007

WEST AUGUSTA | Development Feasibility Study TR- 23
Favorable Regional Employment Trends. Augusta is a part of a region with a growing employment base. Companies will more often locate or expand where the labor market is expanding and the local business climate is welcoming. Augusta, Butler County and the South Central Kansas regional employment is projected to grow by 16 percent by 2014 over the prior decade according to the Kansas Department of Labor. The industries with the higher growth rates in employment by 2014 are presented in the following table.
NAICS Industry
Code Industry Title
Base Year Employment
(2004)
Projected Employment
(2014)
Absolute Change
Percentage Change
336 Transportation Equipment Manufacturing 34,090 50,260 16,170 47%
621 Ambulatory Health Care Services 12,440 17,510 5,070 41%
561 Administrative and Support Services 16,020 21,020 5,000 31%
611 Educational Services 27,530 32,110 4,580 17%
722 Food Services and Drinking Places 21,930 25,190 3,260 15%
623 Nursing and Residential Care Facilities 7,880 9,800 1,920 24%
624 Social Assistance 5,690 7,260 1,570 28%
541 Professional, Scientific, and Technical Services 8,990 10,330 1,340 15%
813 Religious, Grant making, Civic, Professional, and Similar Organizations
7,800 8,850 1,050 13%
452 General Merchandise Stores 7,450 8,230 780 10%
Sub-Total of Top 10 Industries 149,820 190,560 40,740 27%
All Other Industries 177,950 188,740 10,790 6%
TOTAL 327,770 379,300 51,530 16%
Table 2-5: South Central Kansas Employment Growth by Industry 2004 – 2014
Source: Kansas Department of Labor.

TR- 24 june - 2010
Economic Weaknesses Less College Educated Workforce. A higher level of education of a community often attracts higher paying jobs. Augusta’s work force population has a lower percentage of adult population, 25 years and over, with a 4-year college degree or graduate degree than adults residing in Wichita and Andover. Lower Amount of Private Investment Since 2002. From 2002 through 2007, the City of Augusta received less new private investment than Butler County’s neighboring cities. The total value of Augusta’s construction permits issued for the six year period ending in 2007 was $42.1 million. During the same period Andover attracted $254 million and El Dorado had $98 million in new construction. City Total Private Investment
Augusta $42,100,000
El Dorado $98,300,000
Andover $254,200,000
Figure 2-11: Percent of Adult Population with College Degrees 2000 Source: 2000 U.S. Census.
Figure 2-12: Total Construction Value of New Permits 2002 - 2007 Source: Wichita State University.

WEST AUGUSTA | Development Feasibility Study TR- 25
Limited Corridor Infrastructure. The current absence of sanitary sewers and sufficient water supply along the U.S. 54/400 Corridor west of the Augusta city limits restricts the amount of new commercial, residential and industrial development the corridor can accommodate at this time.
Industrial and Business Park Competition in the Wichita MSA. The corridor’s proximity to a variety of office parks in Wichita and the availability of shovel-ready industrial parks with sufficient water and sewer infrastructure including a 72 acre business park in Andover and 100 acres in El Dorado represents a competitive setting for the US 54/400 Corridor to attract new businesses. The presence of major retailers and office products in Wichita further limits the ability for Augusta to attract many large retail businesses and office users.

TR- 26 june - 2010
Targeted Industries In order to identify target industries for Augusta, an evaluation was performed which measures Augusta industrial trends in the past decade and evaluates its opportunities for growth in the context of its workforce characteristics and average wages. Augusta’s position in Butler and Sedgwick County industrial markets has also been evaluated. The findings of this industry analysis are presented in the following tables:
Table 2-6 - Regional Labor Force and Unemployment June 2009 Table 2-7 - Area Industry, Wage and Education Comparisons Table 2-8 - Kansas Manufacturing Growth Patterns by Industry 1997-2009 Table 2-9 - Augusta and Butler County Manufacturing Establishments Trends 2000-07 Table 2-10 - Augusta Industry Profile 2008 Table 2-11 - Kansas and Augusta Target Industries
Area Civilian Labor Force Employment Unemployed Unemployment
Rate Percent of MSA Labor Force
Wichita MSA (Butler, Harvey, Sedgwick and Sumner Counties) 336,688 307,956 28,732 8.5% 100%
Butler County 34,500 31,922 2,578 7.5% 10.4% Harvey County 19,033 17,773 1,260 6.6% 5.8% Sedgwick County 270,489 246,658 23,831 8.8% 80.1% Sumner County 12,666 11,603 1,063 8.4% 3.8% Augusta (% of Butler County) 7,953 23.1% of Butler County Kansas 1,542,450 1,433,813 108,637 7.0% N / A
Table 2-6: Regional Labor Force and Unemployment June 2009 Source: Kansas Department of Labor

WEST AUGUSTA | Development Feasibility Study TR- 27
Augusta has approximately 7,953 workers residing within the boundaries of ZIP Code 67010. This represents 23.1 percent of Butler County’s labor force. Butler County represents 10.4 percent of the Wichita MSA labor force. Butler County’s June 2009 7.5% unemployment rate was lower than the Wichita MSA and Sedgwick County, although slightly higher than Harvey County’s 6.6% unemployment rate. The next major step in this analysis reviews the industrial trends within the region, Butler County and Augusta. The Wichita MSA area has about 23% of total employment in the manufacturing sector, nearly double the national manufacturing employment percentage rate of about 11%. Approximately 12.5% of Butler County’s employment is in the manufacturing sector according to data published by the U.S. Bureau of Economic Analysis. Augusta has an estimated 363 manufacturing jobs representing approximately 22 percent of Butler County’s manufacturing base.
Butler County Sedgwick County Kansas
Total Employment 2007 12,648 230,819 1,169,099
Manufacturing Employment 1,580 50,176 176,115
Manufacturing - % of all jobs 12.5% 21.7% 15.1%
Manufacturing Establishments 44 574 3,184
Average Wage Per Job $54,231 $59,352 $48,396
Education Levels of Persons 25 years and over
College Degree or more 20.4% 25.4% 25.8%
High School Degree or more 87.3% 85.1% 86.0%
Table 2-7: Area Industry Employment, Wage and Educational Comparisons Source: U.S. Department of Commerce; Bureau of Economic Analysis

TR- 28 june - 2010
It is also important to put Augusta and Butler County in their proper context by assessing industry trends within Kansas. In the past decade, the number of manufacturers in Kansas has grown by one percent. The two industries reporting the most growth include petroleum and fuel products and primary metal products which have grown by over 20%; in comparison, textile and leather goods companies and manufacturers of furniture and fixtures has declined by around 30 percent. Table 2.8 summarizes the numeric and percentage change in Kansas industries in the last decade.

WEST AUGUSTA | Development Feasibility Study TR- 29
Table 2-8: Kansas Manufacturing Growth Patterns by Industry 1997-2009 Source: Kansas Manufacturers Directory 2001, 2009.
Manufacturing Industry Group Industry Code Total Facilities 1997–99 Average
Total Facilities 2009
Net Change in Facilities
Percent Change
Petroleum & Fuel Products 28--; 29-- 42 51 9 21% Primary Metals Products 34-- 83 100 17 20% Metal Fabricating 34-- 353 413 60 17% Lumber & Wood Products 24-- 207 239 32 15% Chemical Products 28-- 171 188 17 10% Industrial Machinery & Equipment 35-- 723 785 62 9% Apparel & Fabric Products 22--; 23-- 210 225 15 7% Paper & Allied Products 26--; 35-- 45 47 2 5% Measuring Devices 38-- 90 95 5 5% Transportation Equipment 37-- 275 283 8 3% Printing & Publishing 27--; 35-- 711 708 (3) 0% Stone, Glass & Concrete 32-- 307 288 (19) -6% Electrical & Electronic Equipment 36-- 146 134 (12) -8% Food Products 20-- 507 424 (83) -16% Rubber & Plastic Products 30-- 202 162 (40) -20% Textile Mill Products 22--; 23-- 17 12 (5) -28% Furniture & Fixtures 25-- 95 68 (27) -28% Leather Goods 31-- 10 6 (4) -38% Total 4,192 4,228 36 1%

TR- 30 june - 2010
The Augusta manufacturing market is characterized as follows: • Augusta is home to approximately one-third of Butler County’s manufacturing companies. • This share of the industrial market has remained relatively stable through the decade despite the county’s
population and employment growth. • The number of manufacturers in Butler County and total employment in manufacturing has declined by 15
percent and 12 percent respectively since 2000. • By comparison, Sedgwick County has maintained the same number of manufacturers through the decade
matching the state’s one percent growth rate during this period. The availability of attractive business/industrial parks with good access to skilled labor, transportation systems with sufficient park infrastructure will impact the ability of a community to attract new manufacturing and expand its industrial and employment bases. More specifically, since 2000, Augusta has lost two manufacturing companies of Butler County’s decline of eight manufacturers. Employment at manufacturing companies in the county has declined by 12 percent overall during the past decade. The number of manufacturers in Andover and El Dorado has also declined since 2000 as reflected in the following table Table 2-9 – “Augusta and Butler County Manufacturing Establishment Trends 2000 – 2007” which illustrates the changes in the three largest cities in Butler County and the Sedgwick County trend since 2000.

WEST AUGUSTA | Development Feasibility Study TR- 31
Year Augusta Augusta % of County
El Dorado Andover Other Butler County
Butler County Total
Butler County Manufacturing Employment
Sedgwick County Total
2000 17 33% 18 8 9 52 1,793 575 2001 20 36% 16 9 10 55 1,548 590 2002 16 30% 17 9 11 53 1,573 584 2003 16 31% 19 8 9 52 1,612 588 2004 14 25% 20 8 16 57 1,581 582 2005 14 29% 19 6 10 49 1,620 577 2006 15 32% 16 6 10 47 1,634 575 2007 N / A N / A N / A N / A N / A 44 1,580 574 % Change -12% N / A -11% -25% 11% -15% -12% 0% Net Change (2) 0 (2) (2) 1 (8) (213) 0
Table 2-9: Augusta and Butler County Manufacturing Establishment Trends 2000 - 2007 Source: U.S. Bureau of Economic Analysis.

TR- 32 june - 2010
Despite this decline, industrial employment in Augusta has grown slightly during the decade although a majority of these companies have fewer employees than they did in 2001. Augusta is dominated by smaller employers which average around 24 employees per company. (See Table 2-10 – “Augusta Industry Profile 2008”.) This profile is relatively comparable to other Kansas communities its size in metropolitan areas.
Industry Group Industry Code
2001 Estimated Employment
2009 Estimated Employment
Net Change
Percent Change
D-J Engineering 3728 40 200 160 400% Hunn Leather 3199 10 10 0 0% Zipper-T's Mowers 3524 15 14 -1 -7% Heartland Plastics 3085 9 5 -4 -44% Sigma Tek, Inc. 3728 105 54 -51 -49% STM, Inc. 3089 23 11 -12 -52% Magic Focus 3231 18 7 -11 -61% All 7 other (8 or less emp.) miscellaneous 50 60 10 20%
Total Estimated Employment 270 303 33 11%
Table 2-10: Augusta Industry Profile 2008 Source: Kansas Manufacturers Directory 2001, 2009.

WEST AUGUSTA | Development Feasibility Study TR- 33
Targeted Industry Sectors The State of Kansas Department of Commerce has targeted six broad industry sectors, or clusters, most suitable for future growth. An industry cluster is defined as a “geographic concentration of interdependent companies, institutions and partnerships that together create competitive advantages due to co-location.” There are multiple business opportunities associated within a cluster. Components of a cluster industry can include: raw material producers, equipment manufacturers, fabricators, end-users, engineering and design services, logistics providers, workforce development organizations, educational institutions, public-private partnerships, research and development centers, technology transfer facilitators, venture capitalists and other financiers and business service providers. The Department of Commerce has identified six target industry clusters for Kansas to focus its recruitment and industrial expansion efforts. These are:
1. Advanced Composites and Plastics - The Greater Wichita Economic Development Coalition has identified "engineered" materials (composites) and polymers (advanced plastics, etc.) as an emerging cluster in South Central Kansas. A related cluster in advanced materials and polymers is also emerging driven by the increased use of these engineered materials in the manufacturing of both general and commercial aircraft. Wichita is already one of the largest centers in composite aircraft component design and fabrication.
The emerging cluster in advanced materials and polymers in South Central Kansas can be seen as supporting aviation manufacturing. These materials are also being used in medical devices, automotive components, wind turbines, building and heavy construction infrastructure materials, machinery structural components, scientific instrumentation and home products.
TR- 34 june - 2010
2. Animal Health - The Kansas City metro area is a leader in the global animal health market. The Manhattan area is an important secondary area focused on this industry.
3. Aviation and Aerospace – Wichita is home to the world’s premier aviation manufacturing cluster and has the highest concentration of aircraft manufacturing employment and skills in the United States.
4. Biosciences - A major bioscience effort is under way and centered around a $500 million investment initiative through the Kansas Economic Growth Act supported, in part, by the Kansas Bioscience Authority.
5. Manufacturing – The manufacturing sector comprises establishments engaged in the mechanical, physical, or
chemical transformation of materials, substances, or components into new products. The assembly of component parts of manufactured products is also considered manufacturing. The subsectors in the manufacturing sector generally reflect distinct production processes related to material inputs, production equipment, and employee skills. In the machinery area, where assembly is a key activity, parts and accessories for manufactured products are classified in the industry of the finished manufactured item when they are made for separate sale. A detailed description of the types of business in this sector follows Table 2-11.

WEST AUGUSTA | Development Feasibility Study TR- 35
Table 2-11: Target Industry Source: Kansas Department of Commerce; Richard Caplan & Associates.
6. Transportation and Logistics – The Kansas City metropolitan area offers a variety of transportation and logistics activities. The I-35 and I-70 corridors also serve as important transcontinental transportation corridors suitable for transportation, warehousing and related logistics support.
Kansas Target Industry Primary Market Area Augusta Position
Advanced Composites and Plastics South Central Kansas
TARGET as a part and partner with the Greater Wichita Economic Development effort
Animal Health Johnson County to Manhattan corridor along I-70 and K-10 Highway
Not Suitable – Cluster centered from Manhattan to Kansas City (Animal Health Corridor) offering existing workers and better suited educational skills
Aviation and Aerospace Wichita Metropolitan Area TARGET building on existing Augusta and Wichita MSA related employers
Biosciences Johnson County to Manhattan corridor along I-70 and K-10 Highway
Not Suitable – Cluster centered in Johnson and Douglas County region with existing workers and more suited educational skills
Manufacturing Statewide TARGET – Workforce skills and wage rates in Butler County combined with size and access to larger regional labor pool
Transportation and Logistics Greater Kansas City region; I-35 and I-70 corridors
Low Suitability – Augusta’s distance from I-35 is less suitable than competing Butler and Sedgwick County business parks

TR- 36 june - 2010
Based on the prevailing labor, geographic and transportation characteristics offered by Augusta which include lower average wages, proximity to a large regional workforce and the type of existing industries in Augusta, Table 2-11 identifies three of these six areas to “target” as most suitable for Augusta. Augusta should devote its resources focusing on these three industry sectors. The types of companies in these sectors include:
• Advanced Composites and Plastics companies are in advanced or “engineered” materials (composites) and polymers (advanced plastics). These companies produce materials being used in medical devices, automotive components, wind turbines, marine applications, construction materials, machinery, scientific instrumentation and consumer products. This includes companies grouped within Standard Industrial Classifications (S.I.C.) codes 3080 through 3089.
• Aviation and Aerospace industry sector includes aircraft components and supplies, controls, engine parts, ground
support equipment, seats and interiors. Aerospace products include military and consumer items, such as infantry armor and bicycle frames. This includes companies grouped within Standard Industrial Classifications (S.I.C.) codes 3721 through 3728.
• Manufacturing most suitable for Augusta are companies that produce transportation equipment (primarily aircraft), industrial-commercial machinery, computer equipment, fabricated metal products, instrumentation and controls, photographic equipment, plastic and composite products (an offshoot of aviation industry research and development), chemicals, petroleum refining equipment and electronic equipment. This includes companies grouped within Standard Industrial Classifications (S.I.C.) codes 3511 through 3999.

WEST AUGUSTA | Development Feasibility Study CF - 1
3. Corridor Framework The Corridor Framework chapter focuses on the future development of the US 54/400 Corridor. Within the context of the existing conditions information including land use, zoning, infrastructure, and economics of the corridor, the logistics for future development have been examined within the corridor. To provide a picture of the future development and the potential impact to the community of Augusta, the future land use and development pattern, infrastructure services, and community impacts have been prepared. Those three topics will shape the discussion regarding the future development of the corridor. 3.1 Land Use and Development The land use and development policies, as defined herein, will establish the future development patterns within the US 54/400 Corridor and ensure planned growth of the community. The patterns established provide the necessary guidance to make decisions regarding future development in the corridor and its potential contribution to the community. Land Use Alternatives The proposed land use plan was prepared using an alternatives based process. Three different land use patterns were prepared based on the existing conditions information and feedback from the stakeholders. From those alternatives, a single, preferred direction was created that is representative and complementary of Augusta and the community’s vision for the future. Below, each alternative is briefly discussed prior to outlining the land use plan for the corridor.

CF – 2 june – 2010
Alternative #1: Rural Corridor The first alternative prepared focused on maintaining the rural character of the corridor by minimizing intense developments within the corridor. The primary components of the first alternative were: Encourage commercial growth in Downtown Augusta and
along 7th Street east of the levee. Redevelop the old Mobil Oil Refinery as a new industrial
park. Encourage continued industrial development at the
airport. Encourage low-density rural residential development
along the US 54/400 corridor in the west expansion area. Convert the abandoned rail right-of-way to a nature trail
for public use. Create a city gateway on US 54/400 at the levee.
Figure 3-1: Alternative #1 Rural Corridor

WEST AUGUSTA | Development Feasibility Study CF - 3
Alternative #2: Neighborhood The second alternative prepared focused on the creation of a new neighborhood and neighborhood center to provide retail goods and services to residents. The primary components of the second alternative were:
Create a neighborhood scale commercial center at Diamond Road and US 54/400.
Create neighborhood (higher density) and suburban residential development.
Expand the airport industrial park. Convert the abandoned rail right-of-way to a multi-
use recreational trail.
Figure 3-2: Alternative #2 Neighborhood

CF – 4 june – 2010
Alternative #3: Commercial Center The focus of the third alternative prepared was the establishment of a new commercial center to serve a new population in West Augusta. The primary components of this alternative were:
Create a commercial center at Santa Fe Lake Road and US 54/400.
Create a new industrial park adjacent to and south of the commercial center.
Create a city gateway along US 54/400 as part of the new commercial center.
Create a River Recreation District within the floodplain of the Whitewater River.
Create a pedestrian River Crossing using the abandoned rail right-of-way to connect West Augusta development to downtown.
Figure 3-3: Alternative #3 Commercial Center

WEST AUGUSTA | Development Feasibility Study CF - 5
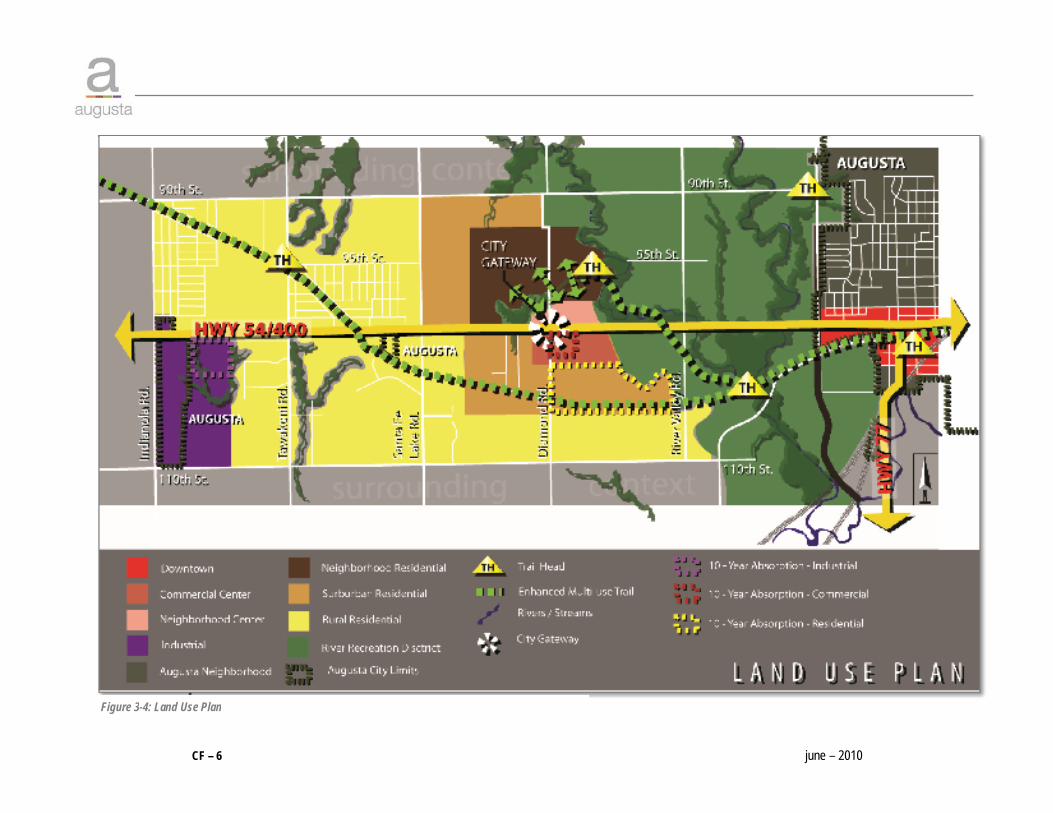
Land Use Plan To provide guidance for growth in the West Augusta expansion area, a land use map was prepared. The proposed land use for the corridor has been defined based on a review of the alternatives previously discussed. The land use map represents the patterns of different use across the corridor in an effort to maximize previous investments, accommodate projected growth for population and commercial development, and create a logical and efficient growth pattern in the short and long-term. The land use map was created for the purposes of this study and will provide the foundation for the infrastructure cost estimates (Section 3.2) as well as defining the fiscal impacts (Section 3.3). The land use map contains the following elements:
Expand the Airport Industrial Park to accommodate new industrial growth and promote industrial growth through its proximity to larger industrial markets and its accessibility to the interstate highway system.
Establish new neighborhoods within the corridor to provide a density of population to support commercial services. A mixture of neighborhood (higher density), suburban, and rural residential neighborhoods are appropriate.
Create the Neighborhood Center north of US 54/400 around Diamond Road to serve the new neighborhood population in West Augusta.
Create a commercial center to accommodate larger commercial and service development south of US 54/400 and Diamond Road.
Estimation of industrial, commercial, and residential land absorbed over the first ten years of implementation.
CF – 6 june – 2010
Figure 3-4: Land Use Plan

WEST AUGUSTA | Development Feasibility Study CF - 7
Development Capacity To better understand the cost and benefits of development, the development capacity was defined within the parameters of the defined land use plan. Development capacity was estimated for residential; commercial, including both retail and office; and industrial development. While estimating the development potential for the entire corridor, it was evident that the complete development of the US 54/400 Corridor Study Area, approximately 10 square miles, was a very long-term proposition. Thus, the development future of the corridor for the purposes of this study was shortened to the first 10 years of development and the capacity for that timeframe was estimated, as shown in Table 3.1 Development Capacity. The economic feasibility of development, as discussed in Section 3.3, also focuses on the first 10 years of development within the corridor.
Table 3-1: Development Capacity The land use plan and the development patterns established provide the baseline to conduct the economic feasibility portion of this study. The economic feasibility section will focus on two items of consequence to the City of Augusta; the cost of public infrastructure to serve the development and the revenues generated for the City from that development. A
Use Phase 1a (Years 1-5)
Phase 1b (Years 6-10)
Buildout (20+ Years)
Industrial 67,500 67,500 4,300,000 sq. ft. Commercial (Retail and Office) 192,500* 57,500 3,500,000 sq. ft. Residential 240 units 260 units 8,331 units

CF – 8 june – 2010
comparison of the development costs and benefits to the City of Augusta will provide an understanding of the feasibility of development in the West Augusta study area. An understanding of these two components will allow the community to make informed decisions about future growth in the area. The costs associated with development are primarily concentrated on the public infrastructure necessary to support development. 3.2 Infrastructure The existing infrastructure in the study area is generally adequate for the existing conditions, but as development occurs, all infrastructure elements will require improvements. The existing land use is mainly agricultural with interspersed commercial and residential clusters, and the infrastructure serving it is what you would expect considering the existing conditions. In reviewing the existing infrastructure, the biggest issue associated with the development potential and extending municipal utilities west of the river appears to be the Whitewater River and floodplain. In the area adjacent to the west city limits of Augusta, the river floodplain is a mile wide in some locations. Once outside the floodplain, the existing subsurface geology has rock outcroppings and terrain that could be described as rolling hills. These conditions can increase development costs due to rock excavation or deeper cuts for utility lines within the corridor.
WEST AUGUSTA | Development Feasibility Study CF - 9
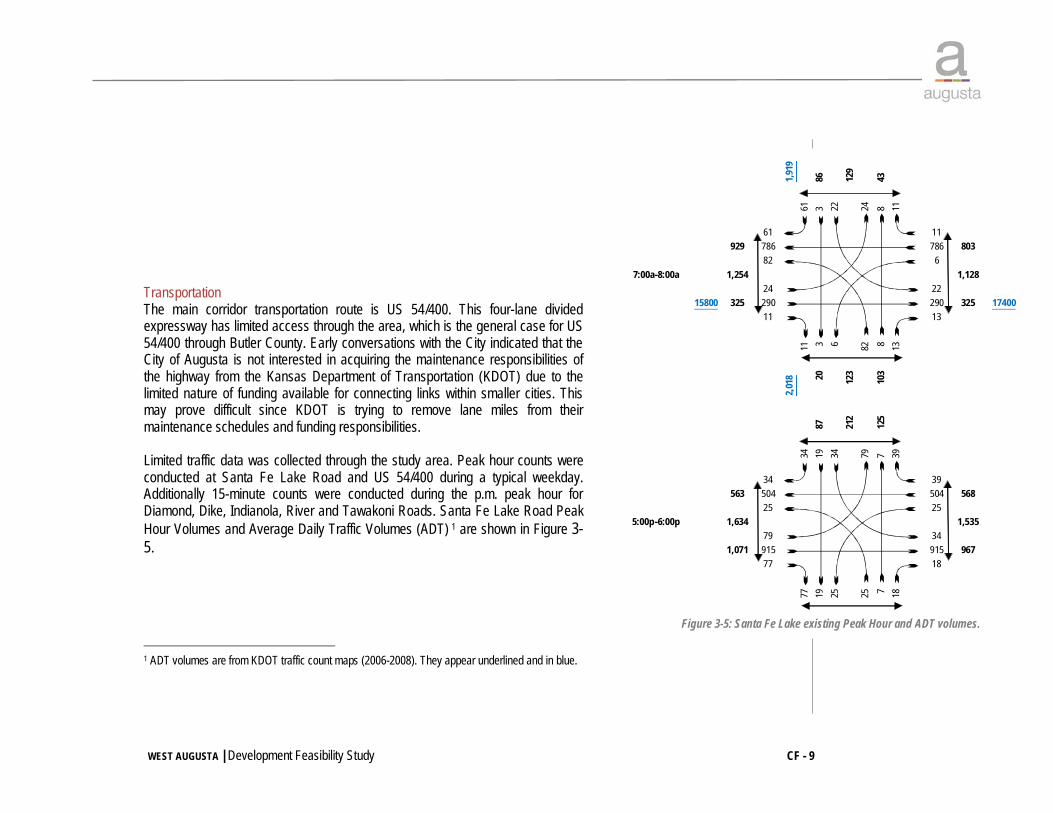
Transportation The main corridor transportation route is US 54/400. This four-lane divided expressway has limited access through the area, which is the general case for US 54/400 through Butler County. Early conversations with the City indicated that the City of Augusta is not interested in acquiring the maintenance responsibilities of the highway from the Kansas Department of Transportation (KDOT) due to the limited nature of funding available for connecting links within smaller cities. This may prove difficult since KDOT is trying to remove lane miles from their maintenance schedules and funding responsibilities. Limited traffic data was collected through the study area. Peak hour counts were conducted at Santa Fe Lake Road and US 54/400 during a typical weekday. Additionally 15-minute counts were conducted during the p.m. peak hour for Diamond, Dike, Indianola, River and Tawakoni Roads. Santa Fe Lake Road Peak Hour Volumes and Average Daily Traffic Volumes (ADT) 1 are shown in Figure 3-5.
1 ADT volumes are from KDOT traffic count maps (2006-2008). They appear underlined and in blue.
1,91
9
86 129
43
61 3 22 24 8 11
61 11929 786 786 803
82 67:00a-8:00a 1,254 1,128
24 2215800 325 290 290 325 17400
11 13
11 3 6 82 8 13
2,01
8 20 123
103
87 212
125
34 19 34 79 7 39
34 39563 504 504 568
25 255:00p-6:00p 1,634 1,535
79 341,071 915 915 967
77 18
77 19 25 25 7 18
Figure 3-5: Santa Fe Lake existing Peak Hour and ADT volumes.

CF – 10 june – 2010
Utilities WATER SYSTEM The Augusta water system is served by surface water received from one reservoir and two lakes. The City is in the process of determining its water rights needed to serve the City in the future. The water plant increased its capacity in 2001, but has not been able to use the plant to its fullest due to limitations in the raw water lines serving the plant. These lines are in need of repair in order to maximize the plants capabilities. Treated water from this plant serve the City of Augusta, Butler County Rural Water Districts #4 and #6, Sedgwick County Rural Water District (RWD) #3, and the City of Mulvane. In order to provide water to new development west of the Whitewater River a new line would have to be placed under the river and flood plain, and through very rocky terrain. This endeavor will be an expensive project. Some of the area west of the river is currently served by RWD's #5 and #8. The area south of US 54/400 is served by RWD #8 and the properties north of US 54/400 are served by RWD #5. Both districts are limited in serving properties either by their contracts for water or their infrastructure, thus additional water supply from Augusta would be beneficial to maximize development potential west of the river. By upgrading the water plant and extending infrastructure west of the river, the three agencies (City of Augusta, RWD #5, RWD #8) could partner in serving new development west of the river and along US 54/400 to the Airport Industrial Park. WASTEWATER SYSTEM The current Augusta Wastewater Plant operates at its maximum due to high infiltration rates. A combination of eliminating high infiltration rates and plant upgrades would need to be performed in order to serve properties west of the river from the existing plant. Another option is to construct a second plant west of the river to serve new development extending to the Airport Industrial Park. The high cost of infrastructure is primarily a function of crossing the river, floodplain, rocky terrain, and the length of the pipelines needed to serve all of the properties. On an interim basis, the City of Andover could serve the Airport

WEST AUGUSTA | Development Feasibility Study CF - 11
Industrial Park with their current sanitary sewer system by extending their system to the east to identified development sites. However, in order to serve the full build out, Augusta would ultimately need to extend infrastructure from an upgraded treatment plant to the development sites west of the River. OTHER UTILITIES Natural gas and electricity in the proposed area is served by the Kansas Gas Service Company and Westar respectively. Westar's facilities are currently overhead power lines common to this area. Putting the electric facilities underground is an additional expense over the normal above ground installations. Extending the private utilities into the project area is also very expensive due to the rocky terrain. Infrastructure Improvements and Costs - Full Build-Out The first scenario that was considered was the full build-out of the entire five-mile study area, and is considered to be the best way to extend utilities to the entire study area. It should be noted that the estimates and sizes of the proposed infrastructure, although based on engineering theory, are preliminary in nature and should be treated as such. These estimates and plans are for a preliminary planning analysis; further refinement and engineering will need to be completed as more details become available. In addition, due to the high variability in the costs of right–of-way and easements, (e.g. sometimes developers donate right-of-way as part of the platting process) these costs were excluded from the estimates.
Figure 3-6: Conceptual roadway layout - typical one-mile section.
Typical Side Road
US 54/400

CF – 12 june – 2010
Transportation In this region, the developer is typically responsible for the cost of developing the internal circulation roadways of their development, which is the assumption that was made to determine an appropriate roadway network as well as costs. It was also assumed that KDOT would continue to maintain US 54/400. In order for KDOT to keep the maintenance responsibilities of US 54/400, it is likely that KDOT will restrict access points to, at a minimum, every mile. As plats are submitted, careful consideration should be given to internal circulation and collector roadways. Cross access easements and roadways should be planned early in the platting process. To ensure adequate property access is maintained to all properties, a conceptual roadway layout, as shown in Figure 3-6, should be developed for the entire one-mile section. Considering the above assumptions, the City would only be responsible for developing the arterial roadways. Based on current volumes and the proposed growth area; a three-lane roadway may be appropriate. Depending on the application, a three-lane roadway can, in an urban setting,
Phase 1 (A10, A12, A14, A16, A18, A2, Industrial Portion A4)
Transportation CostsTransportation Costs 16,500,000.00$ Engineering Costs 1,650,000.00$ Construction Administration 2,475,000.00$ Right of Way/Easement -$ T ransportation Sub-Total 20,625,000.00$
Phase 2 ( A11, A13)
Transportation CostsTransportation Costs 9,900,000.00$ Engineering Costs 990,000.00$ Construction Administration 1,485,000.00$ Right of Way/Easement -$ T ransportation Sub-Total 12,375,000.00$
Phase 3 (A1, A3, A4-A9,A15, A17-A18)
Transportation CostsTransportation Costs 33,000,000.00$ Engineering Costs 3,300,000.00$ Construction Administration 4,950,000.00$ Right of Way/Easement -$ T ransportation Sub-Total 41,250,000.00$
Total 74,250,000.00$ Table 3-2: Transportation Infrastructure Costs – full build

WEST AUGUSTA | Development Feasibility Study CF - 13
support an average daily traffic volume (ADT) of approximately 18,000 to 21,000 vehicles per day. Typical cost data was collected from recent urban projects in the area. The data indicated that an appropriate estimate of an urban roadway would be approximately $1.1 million dollars per lane mile. Using the above assumptions, Table 3-2 shows the proposed cost of Transportation Improvements. Utilities The study area was subdivided into zones A1 through A18. Using the proposed land uses, a water and sewer demand was calculated for each zone. Figure 3-7 illustrates the proposed layout of infrastructure improvements for the full build out. Also shown in Figure 3-7 is a logical phased construction approach that was developed by the planning team for implementation. It was assumed the developers would pay for service and smaller lines necessary to facilitate connection to the end users, but the City would pay for the trunk lines, water towers, pump stations, and plant upgrades. The
Figure 3-7: Proposed improvements - full build out.

CF – 14 june – 2010
development costs for each infrastructure area was broken out for each phase. The railroad corridor appears to be a logical choice for a utility corridor since it intersects the majority of the development area. It also appears to cross the floodplain at the narrowest point. WATER SYSTEM It was assumed that the water system would connect by the existing Mulvane Waterline Connection near the intersection of US-77 and the BNSF railroad tracks on the south edge of Augusta. This is a logical point due to the proximity to the water plant, and the existing high volume pump station located in the area. It was also assumed that the City would have acquired the necessary water rights, and would be capable of accessing enough raw water to meet the development demands. Although specific fire demands were not analyzed because of the preliminary nature of the study, the additional demand was considered when determining the preliminary size of the trunk lines.
Table 3-3: Water Infrastructure costs – full build - by phase.
Phase 1 (A10, A12, A14, A16, A18, A2, Industrial Portion A4)
Water CostsItem Qty. Unit Unit Cost T otal
2,500,000 Storage Tanks (70' in the air or pumps capable of 70' of Head) 1 Each 10,000,000.00$ 10,000,000.00$ 900,000 Storage T anks (70' in the air or pumps capable of 70' of Head) 1 Each 3,600,000.00$ 3,600,000.00$ 8000 GPM Booster Pump Station 1 Each 2,000,000.00$ 2,000,000.00$ 4000 GPM Booster Pump Stations 1 Each 1,000,000.00$ 1,000,000.00$ 33" Water Main 31685 L.F. 110.00$ 3,485,350.00$ 33" Water Main Bore Under River 1000 L.F. 330.00$ 330,000.00$ Water Plant Upgrade (Avg. +7.6 MGD, Max. +15.3 MGD) 1 Each 22,800,000.00$ 22,800,000.00$ Engineering Costs 4,321,535.00$ Construction Administration 6,482,302.50$ Right of Way/Easement -$ Water Subtotal 54,019,187.50$
Phase 2 ( A11, A13)
Water CostsItem Qty. Unit Unit Cost T otal
2,500,000 Storage Tanks (70' in the air or pumps capable of 70' of Head) 1 Each 10,000,000.00$ 10,000,000.00$ 4000 GPM Booster Pump Stations 1 Each 1,000,000.00$ 1,000,000.00$ 18" Water Main 11239 L.F. 55.00$ 618,145.00$ Water Plant Upgrade (Avg. +1.0 MGD, Max. +1.7 MGD) 1 Each 3,300,000.00$ 3,300,000.00$ Engineering Costs 1,491,814.50$ Construction Administration 2,237,721.75$ Right of Way/Easement -$ Water Subtotal 18,647,681.25$
Phase 3 (A1, A3, A4-A9,A15, A17-A18)
Water CostsItem Qty. Unit Unit Cost T otal
900,000 Storage T anks (70' in the air or pumps capable of 70' of Head) 1 Each 3,600,000.00$ 3,600,000.00$ 4000 GPM Booster Plant Upgrade 1 Each 1,000,000.00$ 1,000,000.00$ 4000 GPM Booster Pump Stations 2 Each 1,000,000.00$ 2,000,000.00$ 18" Water Main 19066 L.F. 55.00$ 1,048,630.00$ Water Plant Upgrade (Avg. +2.0 MGD, Max. +4.0 MGD) 1 Each 6,000,000.00$ 6,000,000.00$ Engineering Costs 1,364,863.00$ Construction Administration 2,047,294.50$ Right of Way/Easement -$ Water Subtotal 17,060,787.50$
Total 89,727,656.25$

WEST AUGUSTA | Development Feasibility Study CF - 15
Typical cost data was collected from recent water utility projects in the area and quantities were calculated for the major items of work. Table 3-3 shows the phased construction costs and total cost for construction. WASTEWATER SYSTEM The City wanted our team to compare the probable costs to build either a second sewer plant on the west side of the Whitewater River or a lift station on the east side of the river. Due to the size and cost of building the lift station, and considering the necessary additional line to the wastewater plant in the full study area build-out, the second wastewater plant appears to be the better option. Typical cost data was collected from recent water utility projects in the area and quantities were calculated for the major items of work. Table 3-4 shows the phased construction costs, and total cost for construction.
Phase 1 (A10, A12, A14, A16, A18, A2, Industrial Portion A4)
Wastewater Costs54" Effluent Pipe 2563 L.F. 270.00$ 692,010.00$ 60" Sanitary Sewer 10100 L.F. 300.00$ 3,030,000.00$ 66" Sanitary Sewer 10440 L.F. 330.00$ 3,445,200.00$ 72" Sanitary Sewer 12395 L.F. 360.00$ 4,462,200.00$ 1 Package Sanitary Sewer Plant (Avg. 6.0MGD; Max 12.1 MGD) 1 Each 10,558,235.00$ 10,558,235.00$ Engineering Costs 2,218,764.50$ Construction Administration 3,328,146.75$ Right of Way/Easement -$ Wastewater Subtotal 27,734,556.25$
Phase 2 ( A11, A13)
Wastewater Costs42" Sanitary Sewer 3200 L.F. 200.00$ 640,000.00$ 54" Sanitary Sewer 9282 L.F. 270.00$ 2,506,140.00$ Sanitary Sewer Plant Upgrade (Avg. 1.5 MGD; Max 3.2 MGD) 1 Each 1,618,236.00$ 1,618,236.00$ Engineering Costs 476,437.60$ Construction Administration 714,656.40$ Right of Way/Easement -$ Wastewater Subtotal 5,955,470.00$
Phase 3 (A1, A3, A4-A9,A15, A17-A18)
Wastewater Costs48" Sanitary Sewer 13019 L.F. 220.00$ 2,864,180.00$ 1 Sanitary Sewer Plant Upgrade (Avg. 1.6 MGD; Max 3.2 MGD) 1 Each 2,823,529.00$ 2,823,529.00$ Engineering Costs 568,770.90$ Construction Administration 853,156.35$ Right of Way/Easement -$ Wastewater Subtotal 7,109,636.25$
Total 40,799,662.50$
Table 3.4: Wastewater Infrastructure costs – full build - by phase.

CF – 16 june – 2010
Infrastructure Improvements and Costs – Interim Development After reviewing the full build-out scenario, the City requested that an interim solution be examined which would only look at the area capable of being developed in the next 10 years or less. Figure 3-7 indicates the proposed interim build-out areas. The City also requested that, in the interim, the industrial park wastewater pipeline be served by the City of Andover. This would shorten the length of trunk line necessary as well as the amount of wastewater that would need to be treated by the Augusta plant. In turn, the smaller size of pipe needed to cross under the river makes a river crossing less expensive. Additionally, they wanted to look at serving water through the existing Rural Water District (RWD) # 8 lines, and providing the RWD bulk water. The land use plan was revised to show only the proposed 10-year build-out line. It should be noted again that the estimates and sizes of the proposed infrastructure, although based on engineering theory, are preliminary and should be treated as such. These estimates and plans are for a preliminary planning analysis; further refinement and engineering will need to be completed as more details become available. In addition, due to the high variability in the costs of right-of-way and easements (e.g. sometimes developers donate right-of-way as part of the platting process) these costs were once again excluded from the estimates.
Transportation Using the same basic methodology as in the full build-out scenario, only looking at the roadways that need to be developed as part of the interim developments, it would appear that adequate access to interim development properties would be maintained by continuing to use a three-lane facility. The City would only need to improve approximately ¾ of a mile of roadway on Indianola, Tawakoni, Diamond, and River Valley roads keeping costs lower. The estimates also include limited
Transportation Sub- Total 9,900,000.00$ Engineering Fees 990,000.00$ Construction Administration 1,485,000.00$ Right of Way -$
Total 12,375,000.00$ Table 3-5: Transportation Infrastructure Costs - Interim

WEST AUGUSTA | Development Feasibility Study CF - 17
improvements to US 54/400 (left/right turn lanes, signalization). The Transportation costs associated with the interim scenario are shown in Table 3-5. Utilities Using the same methodologies in the full build-out scenario, probable costs were developed for the interim development. Figure 3-8 shows the proposed interim improvements. WATER SYSTEM It was assumed that the water system would once again connect near the existing Mulvane Waterline Connection near the intersection of US-77 and the BNSF railroad tracks on the south edge of Augusta. The previous assumptions were also used. Table 3-6 shows the interim water infrastructure construction costs. A detailed waterline map was obtained from Rural Water District (RWD) # 8, and was used to calculate necessary improvements and supplemental district demand.
Item Qty. Unit Unit Cost Total
1000 GPM Booster Pump Stations 1 Each 1,000,000.00$ 1,000,000.00$ 300 GPM Booster Pump Station 1 Each 300,000.00$ 300,000.00$ 15" Water Main 29300 L.F. 50.00$ 1,465,000.00$ 15" Water Main Bore Under River 1000 L.F. 850.00$ 850,000.00$ Water Plant Upgrade (0.60 MGD) 1 Each 1,800,000.00$ 1,800,000.00$
5,415,000.00$
Engineering Costs 541,500.00$ Construction Administration 812,250.00$ Right of Way/Easement -$
6,768,750.00$ Total Table 3-6: Water Infrastructure Costs - Interim

CF – 18 june – 2010
WASTE WATER SYSTEM The City of Andover wastewater treatment plant is located approximately one mile west of the southwest edge of the study area on 110th Street. The City of Andover staff indicated that the existing wastewater treatment plant would be able to handle the additional demand without expansion. Other than using Andover’s plant, the general procedure and assumptions used were similar to the full build-out scenario. Table 3-7 shows the interim wastewater infrastructure costs.
Item Qty Unit Unit Cost Total18" Sanitary Sewer 11800 L.F. 140.00$ 1,652,000.00$ 15" Sanitary Sewer 5200 L.F. 120.00$ 624,000.00$ 12" Force Main 8015 L.F. 100.00$ 801,500.00$ 12" Force Main Bore under River 1000 L.F. 850.00$ 850,000.00$ Grinder Pump Station and Wetwell 2 Each 300,000.00$ 600,000.00$ Sanitary Sewer Upgrade (0.2 MGD) 1 400,000.00$ 400,000.00$
4,927,500.00$ 492,750.00$ 739,125.00$
-$ Total 6,159,375.00$
Sub-TotalEngineering
Right of WayConstruction Administration
Table 3-7: Wastewater Infrastructure Costs - Interim

WEST AUGUSTA | Development Feasibility Study CF - 19
Infrastructure Summary The infrastructure needed to develop the study area was determined based on demands calculated from the proposed land use plan. Infrastructure costs were developed for both the full build-out of the corridor as well as the interim improvements requested by the City. A summary of the full build-out costs are shown in Table 3-8. A summary of the interim costs are shown in Table 3-9. The interim industrial park area is located approximately two miles west of the interim commercial and residential areas. The entire interim improvements need not necessarily be constructed at once. For instance, if the commercial and residential properties were to develop first and there were no industrial prospects, the city could phase in part of the improvements in order to develop the commercial and residential properties without extending services to the industrial park. Additionally, the City need not extend sewer service from Augusta to the commercial and residential properties, if only the industrial development is progressing. Table 3-10 and 3-11 respectively show the interim costs broken out in response to the scenarios presented above.
Table 3-9: Total Improvement Costs - Interim
Table 3-8: Infrastructure Costs – Full Build

CF – 20 june – 2010
Commercial/Residential Infrastructure CostsTransportation 10,725,000.00$ Water 6,183,750.00$ Wastewater 4,000,000.00$
Total 20,908,750.00$
Industrial Infrastructure CostsTransportation 1,650,000.00$ Water 585,000.00$ Wastewater 2,159,375.00$
Total 4,394,375.00$ Table 3-10: Interim phased cost - commercial / residential development first.
Commercial/Residential Infrastructure CostsTransportation 10,725,000.00$ Water -$ Wastewater 4,000,000.00$
Total 14,725,000.00$
Industrial Infrastructure CostsTransportation 1,650,000.00$ Water 6,768,750.00$ Wastewater 2,159,375.00$
Total 10,578,125.00$ Table 3-11: Interim phased cost - industrial development first.

WEST AUGUSTA | Development Feasibility Study CF - 21
As the corridor develops according to the land use plan previously described, infrastructure service to support that development will be necessary – both utility and transportation infrastructure. The infrastructure plans and costs identified herein have been prepared to efficiently and effectively serve the development patterns proposed with water, wastewater and streets. To adequately and efficiently supply future development of the area with infrastructure, the West Augusta area has been divided into three phases of development. The phases have been prepared based on current development activities or identified priorities and general timeframes have been applied to look at the cost and revenues associated with development over time. The infrastructure design and costs have been prepared for phase one based on the estimated absorption of industrial, commercial, and residential development of the first ten years. The Improvement Phasing Map details the utility infrastructure necessary to support phase one development levels. The transportation infrastructure is focused on US 54/400 and arterial road improvements to serve new development. Arterial road improvements would include widening Indianola, Tawakoni, Diamond, and River Valley Roads to a three-lane section for ¾ of a mile off of US 54/400. These new improvements would be supported by turn lanes from US 54/400 where necessary.

CF – 22 june – 2010
Phase 1 Infrastructure Costs The infrastructure improvement for Phase 1, including 1a and 1b, are estimated to cost approximately $25 Million. This cost would provide water, wastewater, and transportation improvements to 500 new residential units in the corridor as well as 220,000 square feet of retail uses, 30,000 square feet of office uses, and 130,000 square feet of industrial uses. To better understand the development of the corridor during phase 1, development has been segmented in to 5-year increments – Phase 1a, years 1 through 5 and Phase 1b, years 6 through 10.
Land Use Phase 1a Phase 1b
Residential 240 Units 260 Units
Retail (sq ft) 180,000 40,000
Office(sq ft) 12,500 17,500
Industrial(sq ft) 67,500 67,500
Table 3-12: Projected Development Demand.

WEST AUGUSTA | Development Feasibility Study CF - 23
Figure 3-8: Phase 1 (Interim) Infrastructure Improvements.

CF – 24 june – 2010
3.3 Community Impact The impact of westward expansion to the City of Augusta is best measured in the financial feasibility, cost versus benefit of future development. Based on the development potential of the US 54/400 Corridor, identified in the land use plan and the infrastructure cost to support future development, the financial feasibility has been estimated. The feasibility analysis is based on the return on investment to the City through taxes, both property and sales and additional benefits that accompany growth in a community. In summary, the net cost of the infrastructure and added services associated with developing the targeted area of West Augusta are not sufficient if only a 10-year time frame is considered. However, the projected deficit can be offset by municipal revenues over 20 years when municipal revenues are supplemented with new revenue mechanisms discussed later in this feasibility analysis. The upfront cost of transportation, water, and wastewater improvements places financial burden on the City in the first 10 years; however, the capital improvements will last for more than 20 years. Therefore, development of the area becomes financially feasible under the following financial terms:
a. Participation of 33 percent in the cost of water improvements from the two Rural Water District(s); b. Establishing a new 0.5 percent Transportation Development District sales tax imposed on new retail development in
the annexed area; and c. Municipal revenues over 20 years generated by the new development built in the first 10 years.

WEST AUGUSTA | Development Feasibility Study CF - 25
West Augusta Phase 1 The proposed master plan for the West Augusta US 54/400 Corridor Area has the potential to accommodate as many as 2,800 additional residential units, an additional 4.4 million square feet of industrial development, and 2.4 million square feet of new commercial development. However, for purpose of this analysis, only the first 10 years of new development in the area is included in the Phase 1 projection.
Based on historic trends, prevailing local and regional market conditions, the availability of new water and sewer infrastructure, improved street access and good planning, it is projected that during the first phase of the area’s growth over the next 10 years, the area will absorb 500 housing units and at least 385,000 square feet of new commercial development (260,000 square feet of retail, 30,000 square feet of new office, and 135,000 square feet of new industrial development.) (See Table 3-13 – “West Augusta Area Phase 1 with Infrastructure”)

CF – 26 june – 2010
Major Land Use Phase 1a Phase 1b TOTAL
Years 1 – 10 Projected Total Years 1 - 5
Years 1 - 5 Annual Average
Projected Total Years 6 - 10
Years 6 – 10 Annual Average
Residential Units 240 48 260 52 500 units
Retail (sq. feet) 180,000 (a) 36,000 40,000 8,000 220,000 sq. feet
Office (sq. feet) 12,500 2,500 17,500 3,500 30,000 sq. feet
Industrial (sq. feet) 67,500 13,500 67,500 13,500 135,000 sq. feet
Total Square Feet 260,000 52,000 125,000 25,000 385,000 sq. feet
(a) Assumes a new big box discount store is constructed in the West Augusta area.
Table 3-13: West Augusta Area Phase 1 with Infrastructure Source: RICHARD CAPLAN & ASSOCIATES. These demand projections assume that Augusta, Butler County and the Wichita metropolitan area will grow in the coming decade and that Augusta will attract its fair share of Butler County’s new office and industrial development.

WEST AUGUSTA | Development Feasibility Study CF - 27
Projected Revenues The largest amounts of new municipal revenues generated by the new development will be to the City in property taxes and local sales taxes. Retail sales tax collections will occur from both new residents and new retail development in the area. Retail sales are projected to generate $4.4 million over the first 10 years and approximately $13.9 million over the first 20 years.
New Retail Development
New Area Residents Totals
Phases 1a and 1b: Years 1 - 10 $648,000 $3,805,152 $4,453,152
Years 11 - 20 $2,300,000 $7,255,290 $9,455,290
TOTALS $2,848,000 $11,060,442 $13,908,442
Table 3-14: West Augusta Area Retail Sales

CF – 28 june – 2010
Property tax receipts to the city are projected to generate an additional $3.8 million over the first 10 years from new residential, retail, office, and industrial development and a combined total over $12 million over 20 years. These projected property taxes reflect an increase in assessed value from new development in West Augusta totaling approximately $15.9 million over 10 years. This reflects a conservative annual increase of $1.6 million which represents 82 percent of the $1.9 million in average annual growth in assessed value that the city experienced since 2001. (See Table 3-15 – “City of Augusta / West Augusta Area Total and Average Annual Assessed Value”)
Year / Phases Total Assessed Value Annual Increase 2001 $37,046,640 $2,859,844 2002 $39,906,484 $2,859,844 2003 $40,430,208 $523,724 2004 $41,266,853 $836,645 2005 $44,430,082 $3,163,229 2006 $45,725,111 $1,295,029 2007 $49,426,498 $3,701,387 2008 $51,442,254 $2,015,756 2009 Est. $52,590,530 $1,148,276 2001 – 2009 Annual Average $1,942,986
West Augusta Annexed Area Annual Average Increase Phases Ia and Ib $15,968,750 $1,596,875 City Total Year 10 $68,559,280 N / A
Table 3-15: City of Augusta / West Augusta Area Total and Average Annual Assessed Valuation 2001 – 2009 Source: Butler County Assessor’s Office; RICHARD CAPLAN & ASSOCIATES.

WEST AUGUSTA | Development Feasibility Study CF - 29
Existing residences, vacant properties and commercial businesses in the annexed area will add approximately $86,280 in property taxes to the City for each 10 year period. The following Table 3-16 (“West Augusta Projected Revenues”) presents the total property taxes by land use as well as the other revenues generated by the new development and existing property in the area. These projections do not include potential additional non-city property taxes captured through the use of a tax increment financing (TIF) district. Other key revenue assumptions are as follows:
a) City property tax revenues are projected at a 39.716 mill levy from year 1 through 20; b) City sales tax rate remains at 1 percent; c) The average new single-family home built in West Augusta is valued at $135,000; d) The average new retail buildings in West Augusta are valued at $110 per square foot and generate an overall
average of $120 in retail sales per square foot; e) The average new office building in West Augusta is valued at $130 per square foot; f) The average new industrial building in West Augusta is valued at $45 per square foot; g) The newly annexed area’s assessed value is approximately $1,000,000; h) The average value of the undeveloped residential and agricultural land is valued at $1,250 per acre; i) Commercial land annexed in West Augusta is valued at $10,000 per acre; j) All projections are in 2009 dollars.
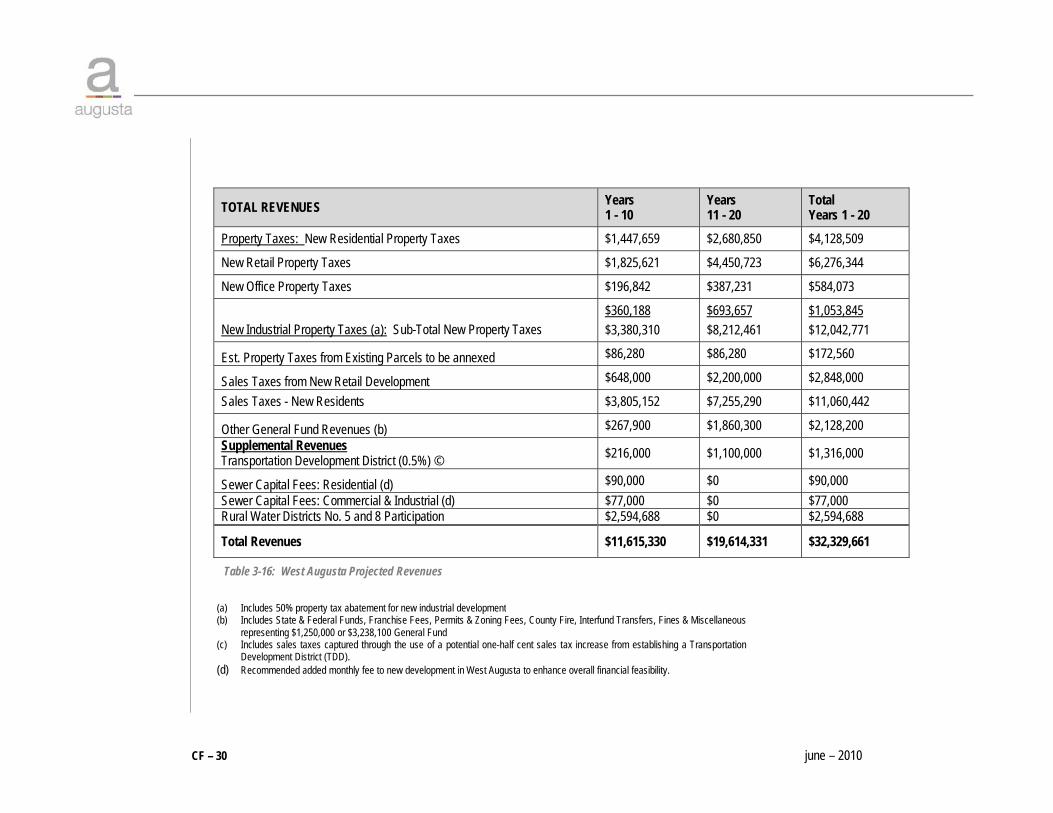
CF – 30 june – 2010
TOTAL REVENUES Years 1 - 10
Years 11 - 20
Total Years 1 - 20
Property Taxes: New Residential Property Taxes $1,447,659 $2,680,850 $4,128,509
New Retail Property Taxes $1,825,621 $4,450,723 $6,276,344
New Office Property Taxes $196,842 $387,231 $584,073
New Industrial Property Taxes (a): Sub-Total New Property Taxes $360,188 $3,380,310
$693,657 $8,212,461
$1,053,845 $12,042,771
Est. Property Taxes from Existing Parcels to be annexed $86,280 $86,280 $172,560
Sales Taxes from New Retail Development $648,000 $2,200,000 $2,848,000
Sales Taxes - New Residents $3,805,152 $7,255,290 $11,060,442
Other General Fund Revenues (b) $267,900 $1,860,300 $2,128,200 Supplemental Revenues Transportation Development District (0.5%) © $216,000 $1,100,000 $1,316,000
Sewer Capital Fees: Residential (d) $90,000 $0 $90,000 Sewer Capital Fees: Commercial & Industrial (d) $77,000 $0 $77,000 Rural Water Districts No. 5 and 8 Participation $2,594,688 $0 $2,594,688
Total Revenues $11,615,330 $19,614,331 $32,329,661
Table 3-16: West Augusta Projected Revenues
(a) Includes 50% property tax abatement for new industrial development (b) Includes State & Federal Funds, Franchise Fees, Permits & Zoning Fees, County Fire, Interfund Transfers, Fines & Miscellaneous
representing $1,250,000 or $3,238,100 General Fund (c) Includes sales taxes captured through the use of a potential one-half cent sales tax increase from establishing a Transportation
Development District (TDD). (d) Recommended added monthly fee to new development in West Augusta to enhance overall financial feasibility.

WEST AUGUSTA | Development Feasibility Study CF - 31
In order to more fairly offset the cost of the proposed waste water improvements in West Augusta and to make the overall development of the area more financially feasible, it is recommended that a $15 per month per residential unit and a one-time $2 per square foot for businesses for sewer capital fee be enacted. These fees would generate approximately $167,000 over 10 years. (See Table 3-17 – “Proposed Sewer Capital Fee Projected Revenues”)
Table 3-17: Proposed Sewer Capital Fee Projected Revenues
Sewer Capital Fee Total Amount Years 1 – 10 Total
Residential Units $15.00 per month per unit 500 units $90,000 Commercial and Industrial Businesses
$00.20 per square foot (one-time) 385,000 square feet $77,000
Total N / A N / A $167,000

CF – 32 june – 2010
Projected Area Costs of Infrastructure and Municipal Services The total estimated cost of new water, wastewater, and transportation improvements to serve Phases 1a and 1b of the West Augusta expansion area is $25.3 million. In order to offset a portion of the water improvements it is also recommended that:
The two existing rural water districts will participate in 33 percent of the capital costs most directly required by them to provide expanded water services within their jurisdictions. Such costs include storage tanks, main water lines, and booster pump stations.
The combined financial participation by RWD # 5 and 8 will offset approximately $2.6 million of the cost of water improvements. (See Table 3-18 – “West Augusta Projected Infrastructure Improvements Costs”)
Infrastructure Improvement Total Estimated Cost
Water Improvements $6,768,750
Wastewater Improvements $6,159,375
Street Improvements $12,375,000
Total Construction Costs $25,303,125
Plus 15% Est. Allowance for Financing Costs $3,795,469
Total Costs $29,098,594
(Less Rural Water Districts No. 5 and 8 participation) ($2,594,688)
Net City Estimated Cost $26,503,906
Table 3-18: West Augusta Projected Infrastructure Improvement Costs

WEST AUGUSTA | Development Feasibility Study CF - 33
The cost of financing by revenue or general obligation bonds will add to the construction cost of these improvements. Therefore, an additional 15 percent has been estimated to finance a portion of the improvements beyond those existing capital revenues already set aside among various municipal funds for capital projects. Approximately $3.8 million has been added to the cost of the infrastructure for this purpose. Other financing assumptions include:
a. Improvements will be financed through general obligation and revenue bonds in two phases repaid over 30 years. b. The average interest rate for the bonds is 5.50 percent. c. The 15% cost of financing includes interest, bond reserve fund, issuance costs, legal and accounting fees, etc.

CF – 34 june – 2010
Other West Augusta Revenues and Expenses In addition to new infrastructure, the City will incur the cost of added services, especially for public safety and public works to the area. It is projected that increased revenues will be generated by a larger population from franchise fees, building permits, etc. and will offset the added municipal costs since the City is required to operate with a balanced annual budget. (See Table 3-19 – “Other West Augusta Area Municipal Revenues and Expenses”) These projections assume that the City tax base will remain stable, that there will be no increase in the City mill levy and no citywide sales tax increase to support industrial development except where noted for new retail as a part of a proposed West Augusta Transportation Development District. In summary, the projected city costs and revenues to serve the projected 1,265 new residents occupying the 500 new residential units in the West Augusta annexed area will offset each other due to requirement to balance the City’s annual budget.
Phases, Years Average Added Population per Year
Total Added Population by Year
Revenues Per Capita (a)
Expenses Per Capita (b)
Total Revenues
Total Expenses
Phase 1, 1-10 126 persons 1,265
$147.06 $147.06
$267,900 $267,900
Phase 2, 11 – 20 none 1,265 $1,860,300 $1,860,300
Total 1,265 persons 1,265 $2,128,200 $2,128,200
Table 3-19: Other West Augusta Area Municipal Revenues and Expenses Source: City of Augusta 2009 Budget. (a) Revenues includes State & Federal Funds, Franchise Fees, Permits & Zoning Fees, County Fire, Inter-fund Transfers, Fines & Miscellaneous representing $1,250,000 of the $3,238,100 2009 General Fund. (b) Costs are based on 2009 Safety budget of $1,574,300 and Public Works budget of $204,700

WEST AUGUSTA | Development Feasibility Study CF - 35
Summary of Financial Feasibility In summary, based on the projected municipal revenues and expenses described above, the projected West Augusta area will result in a net benefit to the City of $1.1 million over 20 years. (See Table 3-20 – “Summary of West Augusta Area Financial Feasibility”) This favorable balance incorporates supplemental revenues from the following:
a) Transportation Development District (TDD) to capture increased sales from the area to offset transportation improvement costs; and
b) New and/or increased sewer capital fees to new users.
These projections do not include a possible tax increment financing district (TIF) that could capture an increased share of the increased property taxes and be used to offset some of the eligible infrastructure improvement costs. These costs may also be offset by state funds or grants (CDBG, KDOT, etc.), Butler County participation, and/or federal grants (EDA).

CF – 36 june – 2010
Table 3-20: Summary of West Augusta Area Financial Feasibility Source: RICHARD CAPLAN & ASSOCIATES.
TOTAL AREA REVENUES Years 1 – 10
Years 11 - 20
Total Years 1 - 20
Total New Property Taxes $3,380,310 $8,212,461 $12,042,771
Est. Property Taxes from Existing Parcels to be annexed $86,280 $86,280 $172,560
City Sales Taxes - New Area Development and New Area Residents $2,848,000 $11,060,442 $13,908,442
Other General Fund Revenues $267,900 $1,860,300 $2,128,200 Supplemental Revenues Transportation Development District (0.5% sales tax) $216,000 $1,100,000 $1,316,000
West Augusta Sewer Capital Fees $167,000 $0 $167,000 Rural Water Districts No. 5 and 8 Participation (33% of water improvement costs) $2,594,688 $0 $2,594,688
Total Area Revenues $11,615,330 $19,614,331 $32,329,661
TOTAL EXPENSES Infrastructure Construction Cost (+15%) ($29,098,594) $0 ($29,098,594)
Added City Services to Area ($267,900) ($1,860,300) ($2,128,200)
Net Total ($17,751,164) $18,854,031 $1,102,867
WEST AUGUSTA | Development Feasibility Study TB - 1
4. Corridor Tool Box
4.1 Introduction. To guide development of the US 54/400 Corridor through implementation of the plan, a Corridor Tool Box has been prepared. The tool box is centered on the plan elements which include the policies, regulations, strategies, programs and actions necessary to address development within the corridor. This tool box pairs implementation tools with plan elements to achieve the most efficient and effective implementation possible. The tool box has been constructed based on the resources and tools identified during the process and the best regulatory and fiscal use of resources. • Planning –The policy and regulatory tools and resources that allow development to occur as well as the design of
development within West Augusta. • Infrastructure – Tools and strategies for constructing improvements, both transportation and utility, and their
appropriate use. • Economic Development – Public funding approaches that will influence the overall feasibility of potential development
and supporting improvements.
The use of these strategies must recognize and balance the financial feasibility to the City as well as to the future developers ensuring that the annexed area’s development achieves a “win-win” for the public and private sectors.

TB – 2 june – 2010
4.2 Tool Box The previous chapters of this study have provided an understanding of the development feasibility of the US 54/400 Corridor to accommodate the growth of Augusta to the west. The feasibility of developing the 10 square mile area has been determined based on the community benefit of that development taking into consideration the cost of providing municipal services. The provision of services has been based on anticipated development over the next 10 years and a physical development framework for the corridor. The future development of the US 54/400 Corridor will be a partnership between the private and public sectors to ensure that future investments are completed in a planned and comprehensive manner and promote the long-term success of the corridor and benefits to the community. The tool box is intended to be used to assist in the decision making process through its guidance on land use and development patterns and procedures, provision and timing of infrastructure improvements and its examination of financial impact to the City of Augusta through development of the corridor. The tool box has been organized by general activities, land use and development, infrastructure and economics, and the actions that are necessary to accommodate development within the corridor.

WEST AUGUSTA | Development Feasibility Study TB - 3
4.3 Land Use and Development The development of West Augusta will require many actions on behalf of the City, the development community and property owners. These actions must be orchestrated to ensure that development of the corridor has a positive impact on the community both socially and fiscally. The quality and pattern of development within the corridor will provide a first impression for people as they approach Augusta from the west. As such, those actions that control development should be examined for their positive contribution to the development of the corridor. In addition to annexation, zoning and subdivision regulation, it is proposed that development and design standards be prepared to supplement these regulations to guide development. The toolbox below shows those tools and their recommended application for development within the corridor.
ACTION POLICY / ACTION / STRATEGY RESPONSIBILITY COMMENTS LAND USE AND DEVELOPMENT
Annexation • Consider annexation of urban levels of development at the time of development proposal / rezoning.
• Require development at urban intensities to consent to annexation.
• City / County • Look at logical pieces to annex that may be larger than proposed development.
Zoning Changes • Consider zoning changes with proposed development plan.
• Require an annexation agreement with zoning changes.
• City • Approve zoning changes that are in conformance with the land use plan defined herein.

TB – 4 june – 2010
Right-of-way • Secure additional right-of-way through dedication as development occurs for new and upgraded arterial and connector streets.
• City / County / State (KDOT)
• Investigate different deferral arrangements for the construction of streets in which continuous rights-of–way are not available.
Development Standards
• Ensure an efficient pattern and use of infrastructure in West Augusta and along the US 54/400 Corridor.
• Prepare development standards that guide the pattern of development within the corridor.
• City
Design Guidelines • Ensure a higher standard of development within the US 54/400 Corridor.
• Proactively prepare corridor design guidelines to create an aesthetically pleasing west entry to Augusta.
• City
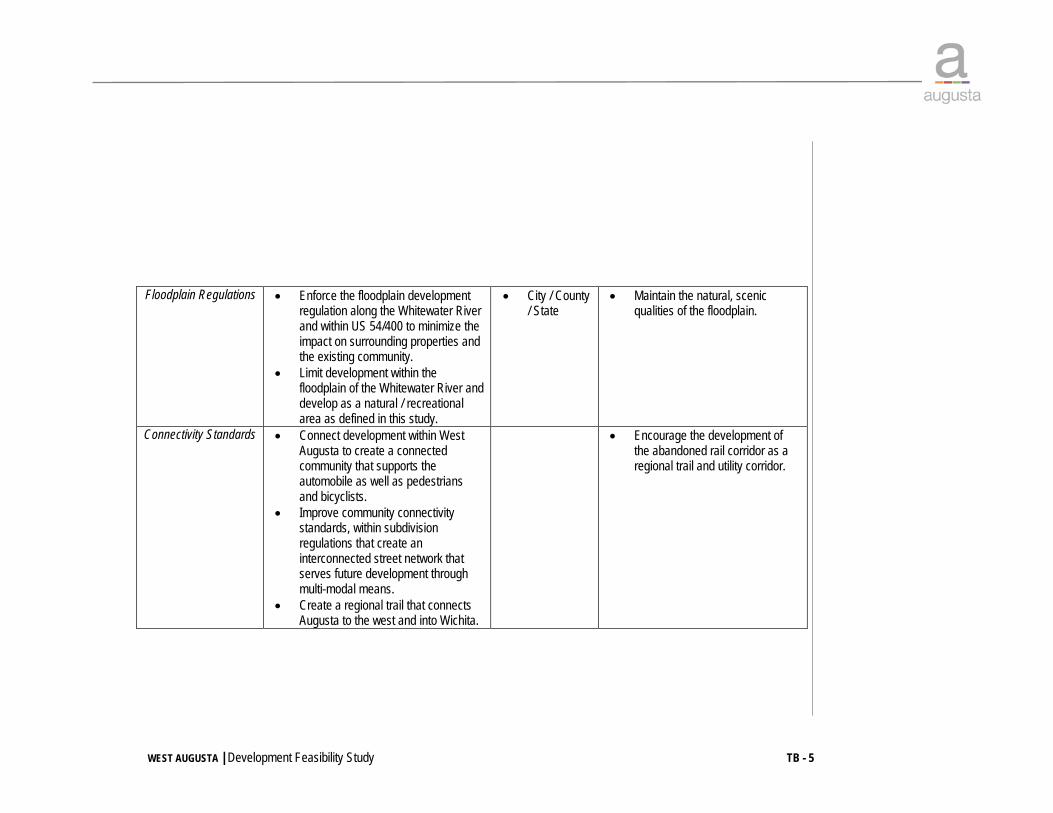
WEST AUGUSTA | Development Feasibility Study TB - 5
Floodplain Regulations • Enforce the floodplain development regulation along the Whitewater River and within US 54/400 to minimize the impact on surrounding properties and the existing community.
• Limit development within the floodplain of the Whitewater River and develop as a natural / recreational area as defined in this study.
• City / County / State
• Maintain the natural, scenic qualities of the floodplain.
Connectivity Standards • Connect development within West Augusta to create a connected community that supports the automobile as well as pedestrians and bicyclists.
• Improve community connectivity standards, within subdivision regulations that create an interconnected street network that serves future development through multi-modal means.
• Create a regional trail that connects Augusta to the west and into Wichita.
• Encourage the development of the abandoned rail corridor as a regional trail and utility corridor.
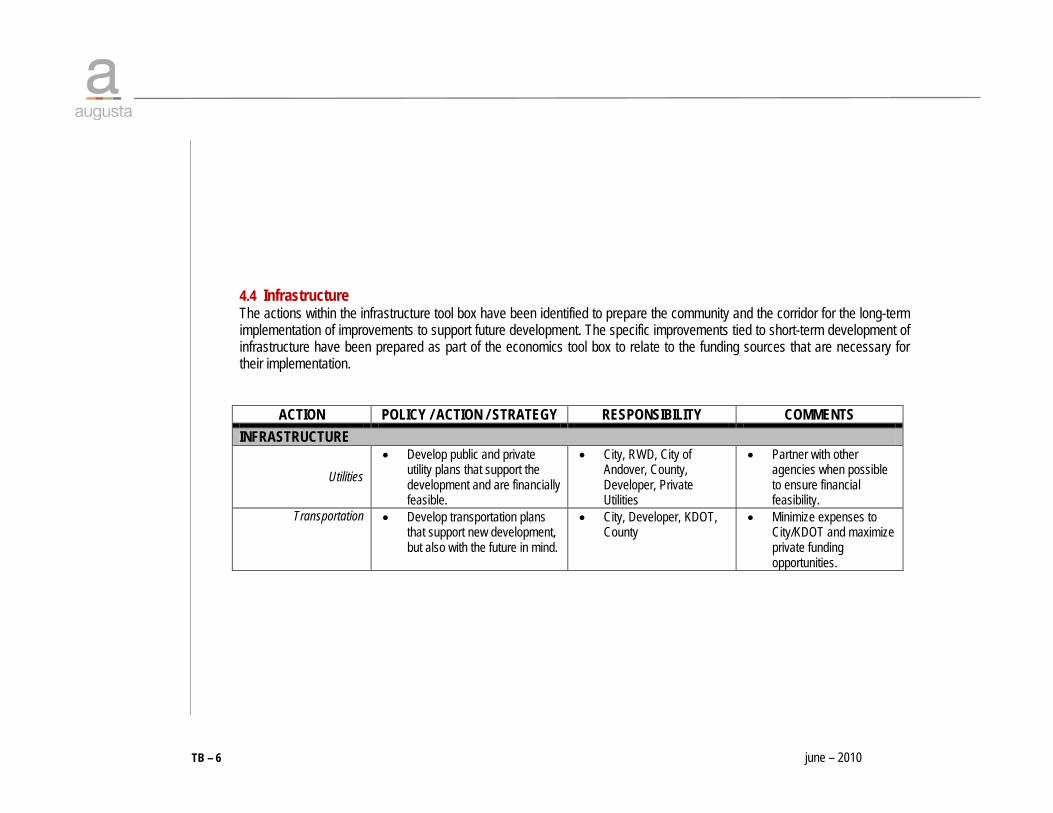
TB – 6 june – 2010
4.4 Infrastructure The actions within the infrastructure tool box have been identified to prepare the community and the corridor for the long-term implementation of improvements to support future development. The specific improvements tied to short-term development of infrastructure have been prepared as part of the economics tool box to relate to the funding sources that are necessary for their implementation.
ACTION POLICY / ACTION / STRATEGY RESPONSIBILITY COMMENTS INFRASTRUCTURE
Utilities • Develop public and private
utility plans that support the development and are financially feasible.
• City, RWD, City of Andover, County, Developer, Private Utilities
• Partner with other agencies when possible to ensure financial feasibility.
Transportation • Develop transportation plans that support new development, but also with the future in mind.
• City, Developer, KDOT, County
• Minimize expenses to City/KDOT and maximize private funding opportunities.

WEST AUGUSTA | Development Feasibility Study TB - 7
4.5 Economics To support new commercial and industrial development in West Augusta, it is important that the City collaborate with the private property owners and/or developers to maximize potential sources of funds. There is a wide array of financing options available to cities to help finance infrastructure improvements. Some of these financing options can be used as economic incentives to stimulate development. Partnerships with Butler County and the two rural water districts serving the area are also important to pursue. The financing tools summarized in this tool box address new commercial and industrial development and include both traditional mechanisms used by Kansas cities and counties to raise revenues as well as one time state and federal grants. Few tools are available for new residential development beyond establishing special benefit districts to offset the up-front cost of infrastructure improvements. It is recommended to utilize at least two of these tools, the Transportation Development District and Water and Sewer Capital Fee, for West Augusta. Traditional Funding Traditional funding mechanisms include real and personal property taxation, sales taxation and special assessments. Kansas cities are authorized to issue long-term debt to finance the infrastructure improvements with that debt to be repaid from a variety of traditional fees (such as water and sewer service charges, tap fees, etc.) and other revenue sources. An important advantage of issuing bonds is that it allows the infrastructure improvements to be constructed up front to get a project started. These improvements can then be paid, in part, from new private development and/or tenants who generate new tax revenues. Special assessments are the most commonly used bond financing method that enables upfront infrastructure

TB – 8 june – 2010
improvements to be built, especially for residential development. It is a financial and public policy decision by the City of Augusta to determine the share of repayment to be assumed by the City and the share of costs, if any, to be passed on to the new private user(s) and/or the Rural Water Districts in the area. Alternative Financing Mechanisms Other financing methods are available to support new commercial development infrastructure. These financial mechanisms all require that the City or other public districts assume the responsibility for the infrastructure development. While all are available in some form to different jurisdictions, there is more flexibility to implement several of the financing alternatives as major parcels in the area are annexed into the City of Augusta.
ACTION POLICY / ACTION / STRATEGY RESPONSIBILITY COMMENTS ECONOMICS Residential, Commercial
and Industrial • Refine Cost/Benefit Analysis to
satisfy elected bodies and public of the merits of annexation.
• City • Utilize the Preliminary Feasibility Study as the basis for the study and update as final boundaries and more detailed site plan(s) are available.
Business Park • Offer Tax Abatement to New Industry.
• City • Recognize competitive setting and be prepared to match tax incentives offered in other Butler County and Sedgwick County cities.
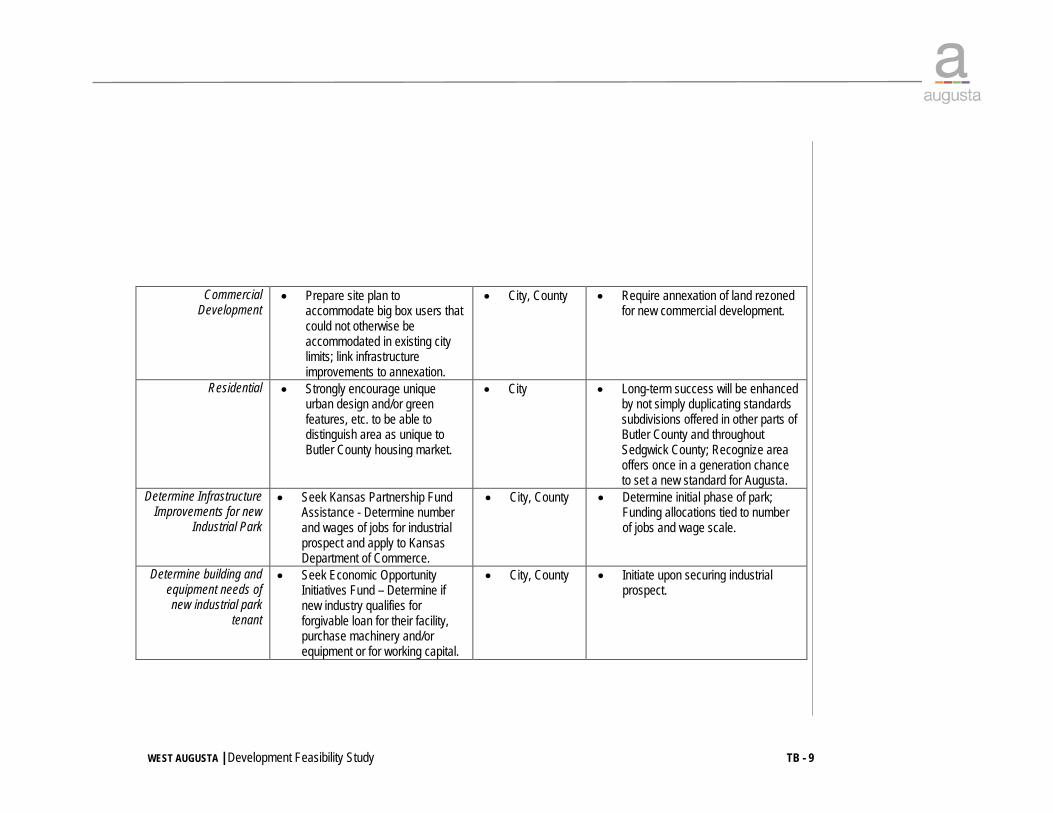
WEST AUGUSTA | Development Feasibility Study TB - 9
Commercial Development
• Prepare site plan to accommodate big box users that could not otherwise be accommodated in existing city limits; link infrastructure improvements to annexation.
• City, County • Require annexation of land rezoned for new commercial development.
Residential • Strongly encourage unique urban design and/or green features, etc. to be able to distinguish area as unique to Butler County housing market.
• City • Long-term success will be enhanced by not simply duplicating standards subdivisions offered in other parts of Butler County and throughout Sedgwick County; Recognize area offers once in a generation chance to set a new standard for Augusta.
Determine Infrastructure Improvements for new
Industrial Park
• Seek Kansas Partnership Fund Assistance - Determine number and wages of jobs for industrial prospect and apply to Kansas Department of Commerce.
• City, County • Determine initial phase of park; Funding allocations tied to number of jobs and wage scale.
Determine building and equipment needs of new industrial park
tenant
• Seek Economic Opportunity Initiatives Fund – Determine if new industry qualifies for forgivable loan for their facility, purchase machinery and/or equipment or for working capital.
• City, County • Initiate upon securing industrial prospect.

TB – 10 june – 2010
Determine eligibility of annexed area based on existing area residents
• Prepare Community Development Block Grant application to support new commercial development.
• City, County • Review most logical area in West Augusta that had obsolete platting, older buildings and/or inadequate infrastructure.
Determine and prepare preliminary plans for US
54/400 improvements
• Seek Kansas Department of Transportation funding for US 54/400 widening and improvements.
• City, State • Work with KDOT staff to position project for future funding and prepare case based on economic development benefits and addressing safety concerns.
Prepare cost estimates for water and sewer
improvements
• Determine most cost-effective method to serve annexed area for application to do KAN STEP program.
• City, Water Districts
• Negotiate partnership agreements with participation from Rural Water District Boards.
Determine preliminary plans and costs for US 54/400 improvements
• Determine existing and projected sales tax revenues from new commercial uses in annexed area for inclusion in a proposed Transportation Development District .
• City • Conduct traffic study as may be required to refine plans and satisfy KDOT requirements.

WEST AUGUSTA | Development Feasibility Study TB - 11
Set new capital fee tied to type and amount of road, water and sewer
impacts and improvements
• Review general fund, water and sewer budgets and conduct hearings to establish a new fee tied to new road improvements, and amount of surcharge to monthly water and sanitation fees.
• City, Water Districts
• Need to clarify to determine amount of cost sharing, if any, among existing water and sewer users tied to system replacement and/or maintenance.
Prepare a Blight Study of annexed area to
determine eligibility for designating a
redevelopment area
• Determine boundaries for a potential Tax Increment Financing (TIF) District and prepare incorporate elements of this plan into a redevelopment plan.
• City, County, School District
• Need to exclude future industrial area in anticipation of offering partial tax abatements.
Determine preliminary plans and costs for US 54/400 improvements
• Consult with existing property owners and annexed area developers to determine their potential degree of participation in a special assessment through a Community Improvement Districts (CID).
• City • Conduct traffic study as may be required to refine plans and satisfy KDOT requirements.
Determine cost estimates for annexed
area infrastructure improvements
• Consult with city’s bond counsel to ascertain availability and timing for issuing new bonds through the new Build America Bond program.
• City • Issuance of bonds tied to generating new jobs and having plans ready for bit.

TB – 12 june – 2010
The following Table 4.1: “Summary of Financing Tools” highlights the funding program or mechanism and the type of infrastructure improvements required to be constructed. A description of each of these funding mechanisms is presented following the table.
Funding Source Funding Program / Tool Infrastructure Improvements
Transportation Water Sewer A. State of Kansas Administered
1. Kansas Partnership Fund √ √ √ 2. Economic Opportunity Initiatives Fund √ √ √ 3. Community Development Block Grant √ √ √ 4. Kansas Department of Transportation √
5. KAN STEP √ √ B. City Government Mechanisms
6. Transportation Development District √
7. Transportation Utility / Water, Sewer Capital Fee √ √ √
8. Tax Increment Financing (TIF) √ √ √
9. Community Improvement Districts (CID) √ √ √ 10. Build America Bonds √ √ √
Figure 4-1: Summary of Financing Tools Source: Richard Caplan & Associates; Kansas Department of Commerce.

WEST AUGUSTA | Development Feasibility Study TB - 13
4.3.a State of Kansas Tools Many of the state financing opportunities for new industry are routinely tied to the number of jobs and often the wage scale of the new business positions. For purposes of soliciting funding assistance, it should be assumed that there will be approximately one new job for every 1,000 square feet of new industrial building constructed. That being the case for new industry, the following funding alternatives are available from the State of Kansas Department of Commerce. Kansas Partnership Fund The Kansas Partnership Fund is administered by the Department of Commerce providing low-interest state funds to cities and counties for infrastructure improvements that support manufacturing and distribution. Eligible projects include construction, rehabilitation or expansion of public facilities, including streets, water supply and treatment facilities, water distribution lines, wastewater collection lines and related improvements. The improvements must directly lead to the creation of new jobs in Kansas basic enterprises. Kansas basic industries include manufacturing and interstate transportation. They may also include wholesale trade, financial services and business services if primarily undertaken for out-of-state markets. The Kansas Partnership Fund is a revolving loan fund with interest rates adjusted annually. (Contact at the Kansas Department of Commerce.) Kansas Economic Opportunity Initiatives Fund The Kansas Department of Commerce also provides a zero percent interest forgivable loan to qualified companies. This loan can offset costs associated with the establishment of a new facility or the expansion of companies through the creation of new jobs. These funds may also be used by a business to acquire land or buildings, construct or renovate facilities,

TB – 14 june – 2010
purchase machinery and equipment or for working capital. Companies can apply for up to $35,000 per job created with a maximum limit of $750,000. Community Development Block Grant (CDBG) Community Development Block Grant (CDBG) grants or loans are available from either the City of Augusta (if the park site is annexed) or from Butler County (if not annexed) which must apply to the Kansas Department of Commerce for projects located in unincorporated Butler County. CDBG funds are used for infrastructure and site improvements that include streets, roads, water lines, sewer lines and rail spurs. Eligible costs may also include construction, build-out and purchases and relocation of machinery and equipment. CDBG funds can also provide gap financing for private businesses that create or retain permanent jobs. At least 51 percent of the jobs created or retained by the company must meet HUD’s low and moderate income guidelines for Butler County. Grants range from $100,000 to $750,000 at $35,000 per job. Infrastructure funding may require that half the funding be paid back. Financing for working capital, equipment and real property carries a fixed rate below prime set on the award date. The term of the loan depends on the type of assets being financed: working capital up to five years, equipment up to 10 years and real property up to 15 years. The loan is forgiven in 20 percent annual increments over a five year period based on the job and payroll targets. Approval by the state is based on the number of new jobs created, the level of wages paid to the new employees and the economic impact of the project.
WEST AUGUSTA | Development Feasibility Study TB - 15
Kansas Department of Transportation The new industrial park will be accessed by a highway under the jurisdiction of the Kansas Department of Transportation (KDOT). Anticipated road improvements to serve the new business park may be internal to the park. Therefore, there is no ability to access KDOT funds at this time. However, other funding for transportation improvements are available now and should be in the future, such as Transportation Enhancement (TE), Economic Development, Hazard Elimination (HES), Congestion Mitigation and Air Quality (CMAQ) and City Connecting Link (KLINK) funding to fund different transportation improvements including trails and other non-automobile modes. Kansas Small Towns Environment Program Grants (KAN STEP) KAN STEP is an ongoing, non-competitive, self-help program for communities to address water, sewer, and public building needs through greater initiative and with fewer dollars offered through the Department of Commerce. Communities must demonstrate readiness, capacity, and documented cost savings.

TB – 16 june – 2010
4.3.b City of Augusta Tools Three of the potential sources of funding, Transportation Development Districts, Community Improvement Districts and Tax Increment Financing Districts are driven by new property and/or sales tax increments generated from new development. The average manufacturing company’s sales taxes paid are small and may not be that meaningful in terms of the ability to finance infrastructure improvements. The financing mechanisms available to the city include the following: Transportation Development District A Transportation Development District (TDD) is a special district that facilitates the construction, maintenance and financing of transportation projects including streets, roads, highway access roads, interchanges and bridges as well as rail and transit facilities. Most related improvements such as streetscape, utility relocations and other necessary associated infrastructure can also be funded using this technique. Transportation development districts may impose a sales tax of up to 1 percent, in addition to the authority to levy special assessments. The transportation development district may issue bonds backed by the revenues received from properties in the district from the imposed sales tax or special assessment. Transportation Utility / Water, Sewer Capital Fee A transportation utility fee is a fee collected on businesses tied to the use and consumption of the transportation system. While this approach has only recently been applied to transportation services, utility charges for water and wastewater have been used for years. Water and/or sewer utility fees, also called capital fees, are collected from all new development as it “hooks-in” to the existing water and wastewater systems. Charges for transportation are based on usage estimates of trips by land use as a share of the project improvements. The transportation utility fee is typically included on an existing county or utility collected tax or rate bill. The uses to which revenues from a utility are limited only by the restrictions placed on their use in the home rule authority.
WEST AUGUSTA | Development Feasibility Study TB - 17
Tax Increment Financing (TIF) Tax increment financing (TIF) is used to capture the future increases in property tax, all or a portion of the revenues received from local sales taxes collected from doing business within the district and/or increased franchise fees and using the revenues to pay for infrastructure necessary to implement a redevelopment project plan. TIF funding can provide funds either as collected (pay-as-you-go) or through special obligation tax increment bonds. The use of TIF is limited to “eligible” areas that fall within one of the following categories and the boundaries are designated by the local government as a redevelopment district:
• Blighted; • Blighted and in a 100-year flood-plain; • Major commercial entertainment and tourism area; • Enterprise zone; or • Environmentally contaminated area.
Given the prevailing site characteristics of the area, the property may not qualify to be included in a redevelopment area. Community Improvement Districts or Benefit Improvement Districts There are differences between Community Improvement Districts (CIDs) and Benefit Improvement Districts (BIDs) in their creation, actions and governance; however, generally they are districts that can finance buildings and structures,

TB – 18 june – 2010
transportation improvements, infrastructure and also various service functions such as security, maintenance, advertising, marketing and training. The CID project improvements are financed by one of the following methods:
• Special assessments levied on property within the CID; • A special sales tax on the sale of tangible personal property at retail or the rendering or furnishings services
with the CID; • Any other funds appropriated by the city of county; or • A combination of any of these three sources.
Each type of improvement district should be reviewed for their applicability to a proposed development and supporting improvements. Build America Bonds Build America Bonds (BABs) were included in the American Recovery and Reinvestment Act signed into law on February 17, 2009. BABs are local government bonds that can be issued as tax-exempt bonds. Interest on BABs is taxable to the bondholder, but tax credits are provided in lieu of the tax-exemption. They provide the bondholder with a non-refundable federal income tax credit of 35 percent of the interest paid on the bond in each tax year. Because the credit is paid to the issuer, and BABs are taxable obligations, the purchasers of these bonds need not be taxpayers.