
Download (1213Kb) - Open Research Online - The Open University
47
Open Research Online The Open University’s repository of research publications and other research outputs Radiative transfer modelling of dust devils Journal Item How to cite: Mason, Jonathon; Patel, Manish R. and Lewis, Stephen R. (2013). Radiative transfer modelling of dust devils. Icarus, 223(1) pp. 1–10. For guidance on citations see FAQs . c 2012 Elsevier Inc. Version: Accepted Manuscript Link(s) to article on publisher’s website: http://dx.doi.org/doi:10.1016/j.icarus.2012.11.018 Copyright and Moral Rights for the articles on this site are retained by the individual authors and/or other copyright owners. For more information on Open Research Online’s data policy on reuse of materials please consult the policies page. oro.open.ac.uk
Transcript of Download (1213Kb) - Open Research Online - The Open University
Open Research OnlineThe Open University’s repository of research publicationsand other research outputs
Radiative transfer modelling of dust devilsJournal ItemHow to cite:
Mason, Jonathon; Patel, Manish R. and Lewis, Stephen R. (2013). Radiative transfer modelling of dust devils. Icarus,223(1) pp. 1–10.
For guidance on citations see FAQs.
c© 2012 Elsevier Inc.
Version: Accepted Manuscript
Link(s) to article on publisher’s website:http://dx.doi.org/doi:10.1016/j.icarus.2012.11.018
Copyright and Moral Rights for the articles on this site are retained by the individual authors and/or other copyrightowners. For more information on Open Research Online’s data policy on reuse of materials please consult the policiespage.
oro.open.ac.uk
Accepted Manuscript
Radiative Transfer Modelling of Dust Devils
Jonathon P. Mason, Manish R. Patel, Stephen R. Lewis
PII: S0019-1035(12)00472-1
DOI: http://dx.doi.org/10.1016/j.icarus.2012.11.018
Reference: YICAR 10459
To appear in: Icarus
Please cite this article as: Mason, J.P., Patel, M.R., Lewis, S.R., Radiative Transfer Modelling of Dust Devils,
Icarus (2012), doi: http://dx.doi.org/10.1016/j.icarus.2012.11.018
This is a PDF file of an unedited manuscript that has been accepted for publication. As a service to our customers
we are providing this early version of the manuscript. The manuscript will undergo copyediting, typesetting, and
review of the resulting proof before it is published in its final form. Please note that during the production process
errors may be discovered which could affect the content, and all legal disclaimers that apply to the journal pertain.
1
Radiative Transfer Modelling of Dust Devils
Jonathon P. Mason, a Manish R. Patel,
a and Stephen R. Lewis,
a
a The Open University, Walton Hall, Milton Keynes, MK7 6AA
Pages: 34
Tables: 1
Figures: 12
2
Proposed Running Head:
Radiative Transfer Modelling of Dust Devils
Editorial correspondence to:
Mr Jonathon P Mason
The Open University
Walton Hall
Milton Keynes
MK7 6AA
Phone: +44 1908 655543
E-mail address: [email protected]
3
Abstract:
Dust devils are particle laden convective vortices that form at the base of convective plumes. They are
typically observed in dry desert climates on Earth and have been observed to form frequently on
Mars. Meteorological measurements have also indicated that martian surface spacecraft have
experienced numerous dust devil transits. To date, the characterisation of dust devils through the
interpretation of spectral measurements of sunlight taken during a transit has yet to be investigated.
Such measurements would provide valuable information of the physical size, dust load and internal
structure of dust devils. A Monte Carlo Radiative Transfer (MCRT) model was developed to simulate
the attenuation of sunlight through a dust devil and to investigate the observed spectral variation
during such an event. The predicted spectral signature resulting from a dust devil transit is highly
dependent on the method of observation. The scattered light flux increases during the transit with the
magnitude dependent on the dust concentration, making it sensitive to the internal dust distribution.
This dependence is not observed for the total light flux which experiences a decrease and is strongly
dependent on the total extinction through the vortex and insensitive to how the dust is distributed. The
implication of this work is that separate in situ measurement of both the total and scattered flux is
crucial for characterising dust devils and such measurements provide a powerful tool that could be
exploited by future Mars missions.
Key Words: Dust devil, Monte Carlo, Dust, Light scattering, Mars, Earth atmosphere
4
1 Introduction
Aeolian mineral dust can have a large impact on the radiation budget of planetary atmospheres such
as those surrounding the Earth and Mars. This dust can absorb solar and infrared radiation resulting in
localised warming of the atmosphere (positive radiative forcing) and scatter incoming
electromagnetic radiation back to space, resulting in cooling of the atmosphere (negative radiative
forcing). The balance between absorption and scattering determines whether the aeolian dust acts to
cool or warm the surrounding atmosphere (Alpert et al., 1998) and highlights the importance of
accurate retrieval of the dust particle single scattering properties, specifically the single scattering
albedo (0), defined as the ratio of the scattered solar radiation to the total solar radiation removed by
both scattering and absorption. One method used to retrieve the single scattering properties is to fit the
observed attenuated spectrum to radiative transfer model outputs. However, accurate modelling of the
light transmission through a dusty environment can be extremely difficult, especially at high dust
concentrations, where the single scattering approximation is inadequate to accurately describe the
diffuse component. The Monte Carlo Radiative Transfer (MCRT) method has been used successfully
in many different fields to accurately describe multiple scattering scenarios in significantly different
environments. Witt (1977) applied MCRT to interstellar grains by looking at reflectance nebulae and
has shown that MCRT can be applied to the multiple scattering problem. MCRT was employed by
Vincendon and Langevin (2010) to simulate the impact of aerosols on the remote sensing of the
surface of Mars and Titan. More relevant to this study, Metzger et al. (1999b) used a MCRT to
simulate the scattered diffuse component of martian dust devils observed by the Imager for Mars
Pathfinder (IMP).
The purpose of this paper is to describe a MCRT model that is used to simulate the transmission
of sunlight through dust devil vortices. The simulated spectral variation during a dust devil transit
over a spectrometer is investigated to determine whether the dust load, size and internal structure of
the vortex can be estimated from a dust devil transit signature (defined as the measured light curve as
a function of distance). The transmission of sunlight through the vortex depends on how the dust is
5
distributed internally and the internal structure of the vortex (in terms of the core diameter). Therefore
the internal structure and dust distribution of dust devils is explored explicitly, comparing the
assumption of a uniform dust concentration to one with a relatively dust free central vortex
surrounded by walls of a higher dust concentration. Finally, the effect on the transit signature due to
variations in the entrained dust particle single scattering properties is investigated to determine the
possibility of retrieval of the dust particle optical properties. Dust devils have yet to be characterised
by interpreting in situ spectral measurements and this will be an invaluable technique for martian
surface landers, which experience hundreds of dust devil transits during their life but may be unable to
provide images of all encounters to determine their physical parameters.
This paper discusses previous retrievals of aeolian dust optical properties on Earth and
investigations into the characteristics of terrestrial and martian dust devils. The developed MCRT
model is described, followed by an analysis into the photon propagation through the model volume
for different dust concentrations and optical scattering properties. Finally, the predicted transit
signatures of dust devils with different internal structures and dust distributions are provided and the
effects of changes to the dust single scattering properties discussed.
1.1 Airborne desert dust on Earth
The optical properties of airborne terrestrial dust remains a debated issue (Dubovik et al., 2000;
Kaufman et al., 2001a). Expressed in terms of its imaginary refractive index, ni, (a measure of the
amount electromagnetic radiation absorbed by the material) the recognised value by the World
Meteorological Organisation (WMO) is 0.008 at 500 nm (WMO,1983) and corresponds to a single
scattering albedo (0) of 0.63. Another study by Levin et al. (1980) predicted a smaller ni of 0.003
(0 0.87). For desert dust, ω0 has been simulated to have values between 0.63 and 0.87 at 500 nm
(Shettle and Fenn, 1976; WMO, 1983; Hess et al., 1998). To exacerbate the issue, Fouquart et al.
(1987), using aircraft radiation measurements, determined an 0 value for the broadband solar
spectrum to be 0.95 for Saharan dust, indicating significantly less absorption. Furthermore, recent
6
retrievals of 0 for desert dust (Dubovik et al., 2000; Kaufman et al., 2001b) agree with the results of
Fouquart, et al. (1987) with 0 > 0.9 for the majority of the solar spectrum, indicating that the dust
acts to cool the atmosphere. It should be recognised that the uncertainty in the retrieved single
scattering properties is likely due to natural variability resulting from heterogeneity in the dust
material at different global locations. This also applies at local spatial scales where the composition of
the source material can vary significantly. The large uncertainty in the single scattering properties of
suspended desert dust can lead to contrasting predictions of their radiative forcing, with a small
change in 0 from 0.95 to 0.85 leading to positive radiative forcing instead of negative forcing
(Hansen et al., 1997). This highlights the importance of accurate determination of 0 at visible
wavelengths. Dust devils are efficient at lofting small particles into the atmosphere (Greeley et al.,
2006) and therefore knowledge of the dust optical properties and the amount of material lofted into
the atmosphere enables the radiative effect of dust devils on the local atmosphere to be determined.
1.2 Dust devils
Dust devils are low pressure, warm core vortices which usually occur during the summer season in
arid locations around the world (Ives, 1947). A dust devil is a special type of vertical convective
current characterised by dust entrained around the upward convective flow. Many in-depth field
studies of terrestrial dust devils have been carried out to date (Sinclair, 1966; Ryan and Carroll, 1970;
Sinclair, 1974; Metzger, 1999a; Greeley et al., 2003; Balme and Greeley, 2006).
Laboratory experiments have also been conducted to investigate different components of dust
devil vortices. Greeley et al. (2003) constructed a vortex generator (The Arizona State University
Vortex Generator, ASUVG) to simulate terrestrial and martian dust devils. Their experiments showed
that the pressure drop (ΔP) at the vortex core provides an additional lift component, making dust
devils more efficient at removing dust from surfaces than boundary layer winds. Using the ASUVG,
Neakrase et al. (2006) and Neakrase and Greeley (2010a) conducted dust and sediment flux
experiments at Earth and Mars atmospheric pressures and found that the sediment flux is related to the
7
vortex intensity, which itself is dependent on the ΔP at the core. Their experiments showed that
vortices of different sizes could yield the same ΔP at the core and concluded that the vortex size is
less important for sediment lifting than the ΔP at the core. The vertical flux of dust (particles < 2 µm
in diameter) was found to increase exponentially with increasing tangential velocity but decrease
exponentially with increasing core radii demonstrating that smaller vortices experience higher vertical
dust fluxes. A similar relationship to the core pressure drop was also reported with an exponential
increase in vertical dust flux for larger ΔP. Furthermore, the effects of surface roughness on dust devil
dynamics was explored by Neakrase and Greeley (2010b) for terrestrial and martian dust devils. They
found a correlated increase in the vortex size with increasing surface roughness, while the tangential
velocity was observed to decrease. The expansion of the vortex reduces the energy available and will
eventually impede additional lifting of surface material. However, Neakrase and Greeley (2010b)
showed that small increases in surface roughness can reduce the threshold required to lift fine
particles (< 100 µm), enhancing the sediment flux of weaker dust devils beyond that which would be
expected. For larger increases in surface roughness the ΔP and tangential velocities are reduced,
decreasing the vertical flux of surface material. While the theoretical modelling presented in this
paper focuses on the applications to field studies, measuring the light flux through laboratory
generated dust devils would allow investigations into the effect of dust particle size on the spectral
attenuation and how the size of the particles being suspended influences the spatial distribution of dust
in the dust devil interior. Since the dust particle size and the physical dimensions of laboratory
generated dust devils can be constrained, these measurements would be more directly comparable to
model predictions than those taken in the field.
Dust devils are not a unique phenomenon to the Earth, with observations from Viking 1 and 2,
Mars Pathfinder (MPF), Mars Global Surveyor, Odyssey and Mars Exploration Rovers (MER),
among others, showing that they form frequently on the martian surface (Ryan and Lucich, 1983;
Thomas and Gierasch, 1985; Metzger et al., 1999b; Ferri et al., 2003; Fisher et al., 2005; Cantor et
al., 2006; Greeley et al., 2010). While dust devils on the two planets are similar, they play very
8
different roles on their respective planets. On Earth they are secondary to boundary layer winds in the
dust cycle and only play a minor role except possibly in arid regions. In contrast, on Mars they
maintain the constant aeolian dust background, especially in northern summer, and play a major role
in the rapid transport of fine particulates into the martian planetary boundary layer, affecting the
atmospheric heating rate. Dust devils also influence the surface albedo through the formation of tracks
as they transverse the surface (Balme et al., 2003; Whelley and Greeley, 2006). From column opacity
measurements taken by IMP, Metzger et al. (1999b) estimated the particle loading for a dust devil to
be 70 mg m-3
and, assuming a vertical wind velocity of 7 ms-1
, they determined the vertical flux of
material into the atmosphere to be 0.49 g m 2
s-1
. Using the thermodynamic theory for dust devils of
Rennó et al. (1998) and MPF meteorological data, Ferri et al. (2003) estimated the vertical velocity
of martian dust devils to be 20 ms-1
and determined the rate at which dust is injected into the
atmosphere by dust devils to be two orders of magnitude higher than the dust settling rate. The Mars
Exploration Rover (MER) Spirit observed three full seasons of dust devil activity within Gusev crater
during mars years (MY) 27, 28 and 29 (Greeley et al., 2010). Over all seasons the vertical wind
speeds of the dust devils were observed to be between 0.04–17.0 ms-1
with the vertical dust flux
ranging between 0.004–0.46 g m2 s
-1. Martian dust devils are not confined to lower latitudes,
meteorological data measured at the Phoenix landing site (68° N) showed that during its operational
life time the lander experienced 502 identifiable encounters with a convective vortex or dust devil
(Ellehoj et al., 2010).
2 Radiative transfer in dusty environments
2.1 Model description
The scattering of sunlight by dust grains entrained in a dust devil vortex was modelled using the
Monte Carlo method (Cashwell and Everett, 1959; Witt, 1977; Whitney, 2011). The model geometry
and coordinate system are illustrated in Fig. 1. The Cartesian coordinate system (X, Y, Z) has its origin
at the vortex centre and the vertical Z-axis is directed along the axis of symmetry of the vortex flow,

9
normal to the X-Y plane. The position of the individual photons is given by their (X, Y, Z) coordinates
while their direction vector, Pv, is described by the directional cosines (ux, uy, uz), which are calculated
from the angles θ and υ. Assuming that the Sun is a point source, the incident photons are plane-
parallel, travelling in the +X and –Z directions depending the solar zenith angle (θz). The line of sight
of the modelled spectrometer is normal to the X-Y plane in the +Z direction.
[Fig. 1]
The optical depth (τ) through the dust devil is defined by:
ext NL (1)
where σext is the extinction cross-section of the particles, N is the dust concentration
(number of particles / m-3
) and L is the path length (m) through the dust devil. The extinction cross-
section is the probability of a photon-particle interaction and is analogous to the projected area of the
species as seen by the photons. The product ext N is defined as the extinction coefficient (kext) which
is a measure of the extinction per unit length (m-1
) and is used in the model to describe heterogeneities
in the dust distribution.
2.2 Dust scattering and absorption
For each photon-dust particle interaction there is a chance that the photon will either scatter or be
absorbed by the dust grain. The probability of an absorption event occurring is governed by ω0 and is
equal to (1- ω0). For each interaction a random real number between 0 and 1 is generated and
absorption occurs if the random number is greater than 0, otherwise the photon scatters. Two
methods can be used to describe the absorption by dust particles (Whitney, 2011). The first removes
the photon from the system if an absorption event occurs, the second incrementally reduces the
photon weight by a factor of (1- ω0). Both methods were applied in the model, though the second
method processed scattering events and tracked photons with small weights, significantly increasing
the simulation run-time. Owing to computational constraints, long run times were undesirable as this
10
limited the overall number of photons that could be injected into the model volume, increasing the √N
error. The difference in the number of photons detected between the two methods was two orders of
magnitude lower than the number of photons detected, therefore the removal method was applied.
If scattering occurs, the angle through which a photon scatters is determined by the phase
function of the dust grains. The model has the capability of using both the single and three parameter
analytical Henyey-Greenstein phase function (Cashwell and Everett, 1959; Witt, 1977) and phase
functions produced by semi-empirical codes used to model spherical particles (Mie theory) and non-
spherical particles (T-matrix and Discrete Diploe Approximation, DDA). The expressions provided by
Witt (1977) are used to relate the new cosine direction to a uniform random number between 0 and 1.
The assumption of randomly orientated dust particles allows one to assume independence between the
scattering phase function and the scattering azimuth angle, and thus the scattering azimuth angle is
determined by producing a uniform random number between 0 and 2π. The two scattering angles are
determined in the particles’ reference frame and are transformed to the global frame coordinate
system using the equations of transformation defined in Cashwell and Everett (1959).
After each photon–particle interaction, photons remaining in the simulated dust devil are
carried forward in the model, with the photon behaviour after subsequent scattering events being
simulated by repeating the procedure described above. From here the term scattering cycle refers to
one pass through the model, i.e. one scattering event. Photons that are outside of the vortex and are
travelling parallel or away from the simulated desert floor (Z = 0) are removed from the simulation. If
the photons are outside the dust devil and travelling toward the desert floor, the interaction point of
the line joining the photon along its trajectory and the desert floor is computed before being removed.
2.3 Spatial variation in dust distribution
The equations described in Witt (1977) and Whitney (2011) require the assumption of a uniform dust
distribution within the dust devil. However, for intense vortices this is a poor approximation and the
majority of the dust is entrained in the ‘wall’ of the vortex which surrounds a central core of
11
significantly lower dust concentration (Sinclair, 1973). The non-uniformity in dust concentration (N)
was modelled as a concentric ring of high kext around a central cylinder of lower kext, with the
cylinders being approximated using the integer grid approximation, creating a uniform grid over the
model X-Y plane. To find the distance travelled by a photon within the dust devil, knowledge of the
cumulative optical depth (τc) in front of the photon direction of travel is required. Lookup tables of τc
relative to the centre of the vortex are generated for an observer looking along the Y-direction (the X-
axis could also have been used since the dust devils are assumed symmetrical in the X-Y plane). The
generated τc lookup table is required to generate a second lookup table relating τc to a distance
travelled down each grid path.
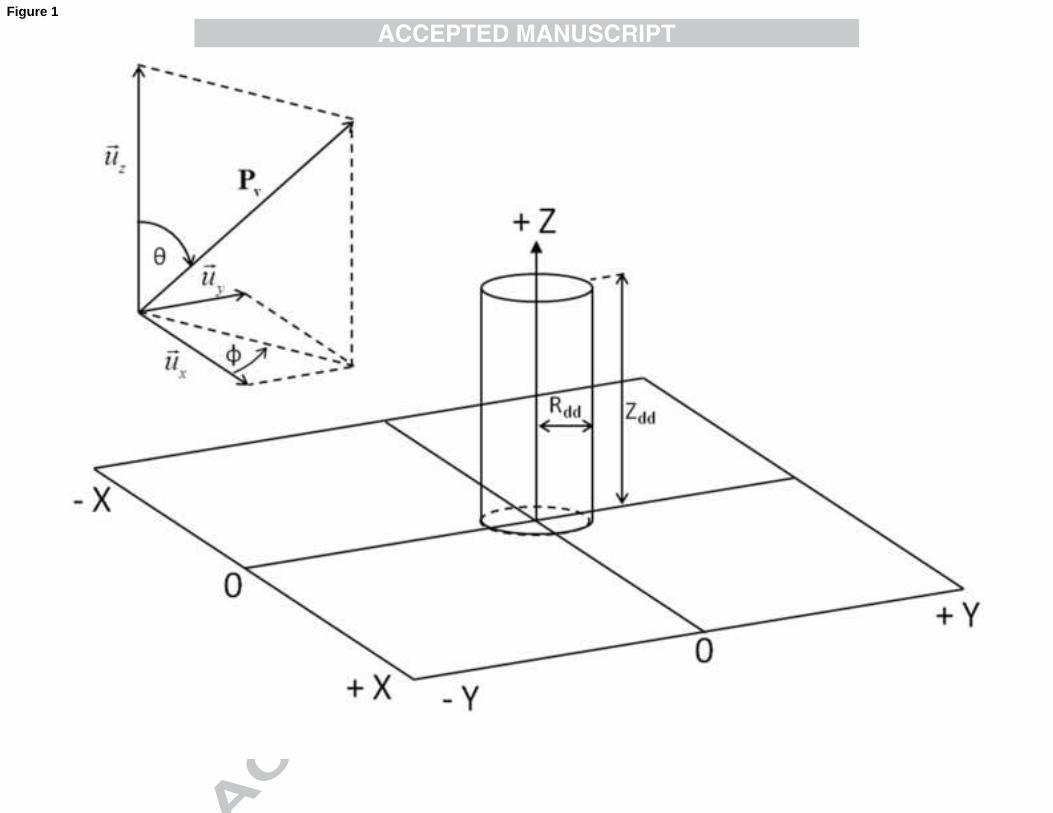
Relating the distance travelled by the photon in any given direction to an optical depth requires
transformation of the photon (X,Y) coordinate and vectors (ux, uy, uz) on to the Cartesian coordinates
of the τc grid, (X, Y) and (ux, uy, uz), such that the photon direction vector is parallel to the Y-axis
(i.e. ux. The transformation is illustrated in Fig. 2 with a photon travelling along vector 1 (dashed
line) being equivalent to a photon travelling along vector 2 (solid line). The transformation allows all
the photons within the simulation to be placed on a uniform grid for interpolation. The transformation
is performed over the individual photon locations and cosines instead of the τc grid as this allows
simultaneous calculations over many photons, reducing the computation time. The optical depth
associated with the (X, Y) position in the τc grid is found by interpolating over the τc table. The
randomly produced optical depth is then added or subtracted from this value depending on the
direction of travel (i.e. the sign of uy), with the resulting optical depth and Y position interpolated
onto the distance lookup table to find the new position of the photon.
[Fig. 2]
The absolute difference between the photon’s new distance and current distance is calculated to
find the distance travelled in the X-Y plane and new photon position is calculated by modifying the
transformation equations defined by Cashwell and Everett (1959) for the X-Y plane. As sinθ → 0 (i.e.
12
as the photon direction vector becomes close to vertical) the transformation equations break down and
it is assumed that the X and Y positions of the photons are unchanged for small sinθ values since ΔX
and ΔY tend to zero. The new Z position is determined from 0 z c extZ Z u k where kext is
determined by interpolation of the photon position on the kext lookup table.
2.4 Error analysis of coordinate system transformation
The large numerical arrays used in the model require single numerical precision for the cosine, sine
and interpolation due to memory limitations. This resulted in errors in the photon optical free path and
final position on the detection plane. To characterise the magnitude of these errors on the final output
of the model, the errors at key stages in the model were analysed. Considering the case of no errors,
the photon vectors align parallel to the Y-axis of the τc grid after transformation, giving ux a value of
zero. Hence the original X position and the new photon position (Xnin the τc grid will be equal. The
introduction of errors results in a departure from the perfect case and X≠ Xn. Fifty batches of 107
photons (a practical limitation) were injected into the system and the ΔX computed. Of the photons
injected 99% experience a ΔX < 1×10⁻⁵
m with the remaining 1% having an error of 1×10⁻⁴
m. The
impact of the rotation errors on the new (X, Y, Z) coordinates of the photons is small with > 85% of all
photon interactions having a ΔX between 1×10⁻⁴
m and 1×10⁻⁵
m, and a ΔY between 1×10⁻⁵
m and
1×10⁻⁶
m. Approximately 99% of the photons showed a ΔZ less than 1×10⁻⁴
m. A small fraction of the
photon interactions have larger positional differences with approximately 0.6 % and 0.006 % of the
interactions exhibiting a ΔZ of 0.001 m and 0.01 m respectively, while one in every two million
photons show a ΔZ of approximately 0.1 m. The larger errors are associated with the error due to the
calculation of the new directional cosines at small angles and the new Z position calculated with a
division by sinθ. The above analysis illustrates the errors introduced by coordinate transformation are
negligible. The √N error for the simulations performed was determined to be 1.0%.
13
3 Dust devil simulations
In this section idealised dust devils of different τ are modelled to assess what effect the quantity of
dust has on the photon propagation. For these simulations the composition of the suspended dust is
assumed to be constant, i.e. σext is constant. A second set of simulations investigates the effect of
different single scattering properties on the photon propagation with N held constant.
3.1 Model parameters
The model requires specification of: solar elevation angle, dust devil height, dust devil radius, location
of the point of measurement (PoM), optical properties of the dust entrained in the vortex, the detection
plane height (set to the height of the PoM above the surface) and the interpolation lookup tables. Two
scenarios are presented; the first assumes the full sky light flux (FS) is measured by the detector (i.e.
half-angle Field of View, FoV = 90°) and the second applies a narrow view (NV) such that the solar
disc does not enter the detector FoV, meaning that only scattered light is detected. For all simulations
in this section, the solar elevation angle was held constant at 76.5°, which corresponds to the
maximum solar elevation angle before the solar disc enters the FoV in the NV case, assumed to be
12.7°. The dust particle scattering phase function was described by the Henyey-Greenstein
approximation.
3.2 Photon Propagation
The initial positions of the photons for the FS model are found by generating random numbers so that
the photons are positioned in the X-Y plane at the height of the dust devil. The NV case resulted in
significantly fewer photons being detected since only scattered photons are detected. To increase the
photon density, only photons that intersect the vortex are considered. Increasing the number of
photons injected into the system was not a practical solution due to the available computing resources.
The initial positions of the photons are randomised on the illuminated edge, described as the
Sun-facing edge, by randomly selecting –Rdd ≤ Y ≤ Rdd and 0 ≤ Z ≤ Zdd, The X position is then
14
determined using Pythagoras’ theorem. The photons are propagated forward in the model until all
photons are either detected or propagate outside the model volume.
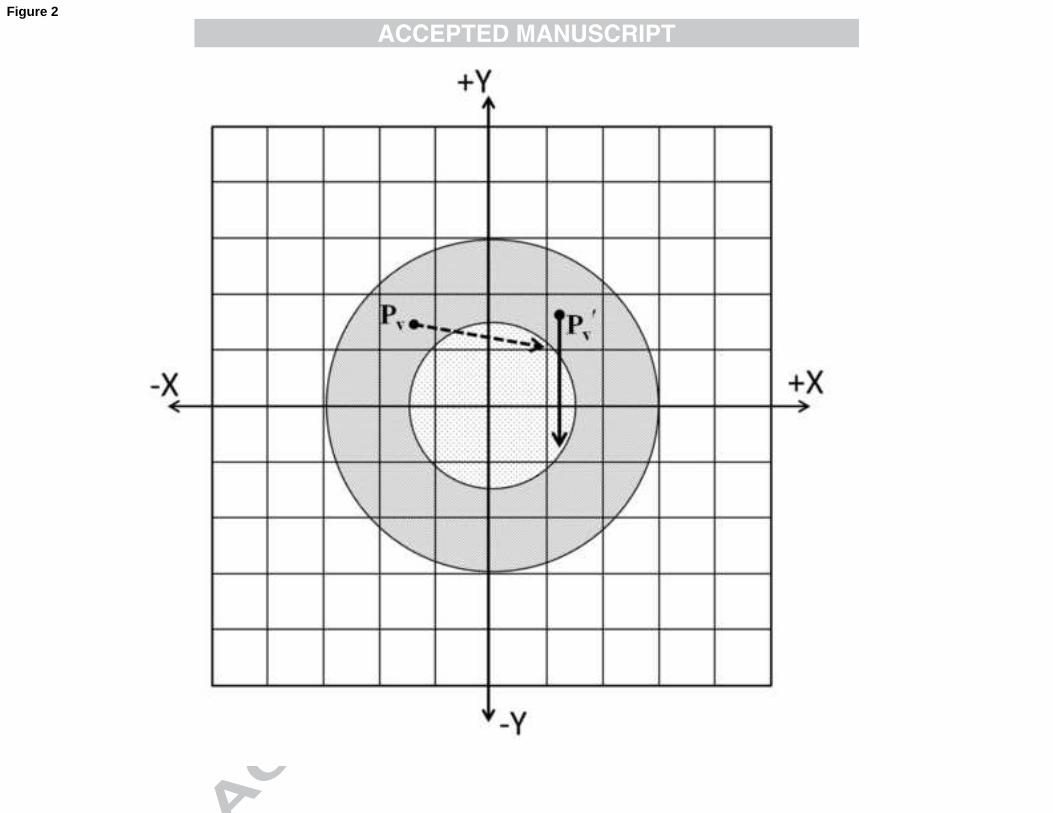
Fig. 3 shows the propagation of the photons in the X-Y plane after one and four consecutive
scattering events for a dust devil with a high N in the wall (kext = 0.5 m-1
) and a dust devil with low N
in the wall (kext = 0.05 m-1
). Both scenarios assumed a dust free core, and the dust devil is assumed to
have core and outer radii of 3.0 and 6.0 m respectively. The black dots mark the positions where the
active photons interact with a dust particle only (photons which travelled outside the model volume or
were detected on the previous cycle are not shown in consecutive figures). The simulations show
what effect varying the dust concentration has on the propagation of the photons through the vortex.
After the first cycle the high opacity case shows that the majority of the photons will interact with a
dust particle close to the inside edge of the illuminated wall or on the inside edge of the non-
illuminated wall. In contrast, after one scattering event the dust devil with low N in the wall displays a
much more uniform distribution with a significantly higher portion of the photons passing directly
through without interacting. As more cycles are performed the photons migrate towards the non-
illuminated side. However, this process is ‘slower’ at high N as a result of the higher probability of
photon–dust particle interaction, with the majority of the photon-dust particle interactions still
occurring in the illuminated wall and near the core on the non-illuminated wall after four scattering
events. At lower N the propagation is more clearly seen and after the same number of scattering
events the number of photons present inside the vortex is significantly reduced, with their positions
being nearly uniform, albeit with a slight bias towards the non-illuminated edge.
The simulations perform in a physically realistic way. The optical free path of the photons is
inversely proportional to kext and from Eq.(1), with the dust composition constant, is inversely
proportional to N. Thus as N increases the photons will travel a shorter distance before interacting
with dust particles. This explains the slower migration of the photons from the illuminated wall to the
non-illuminated wall in the high optical depth case compared to the low optical depth scenario.
15
[Fig. 3]
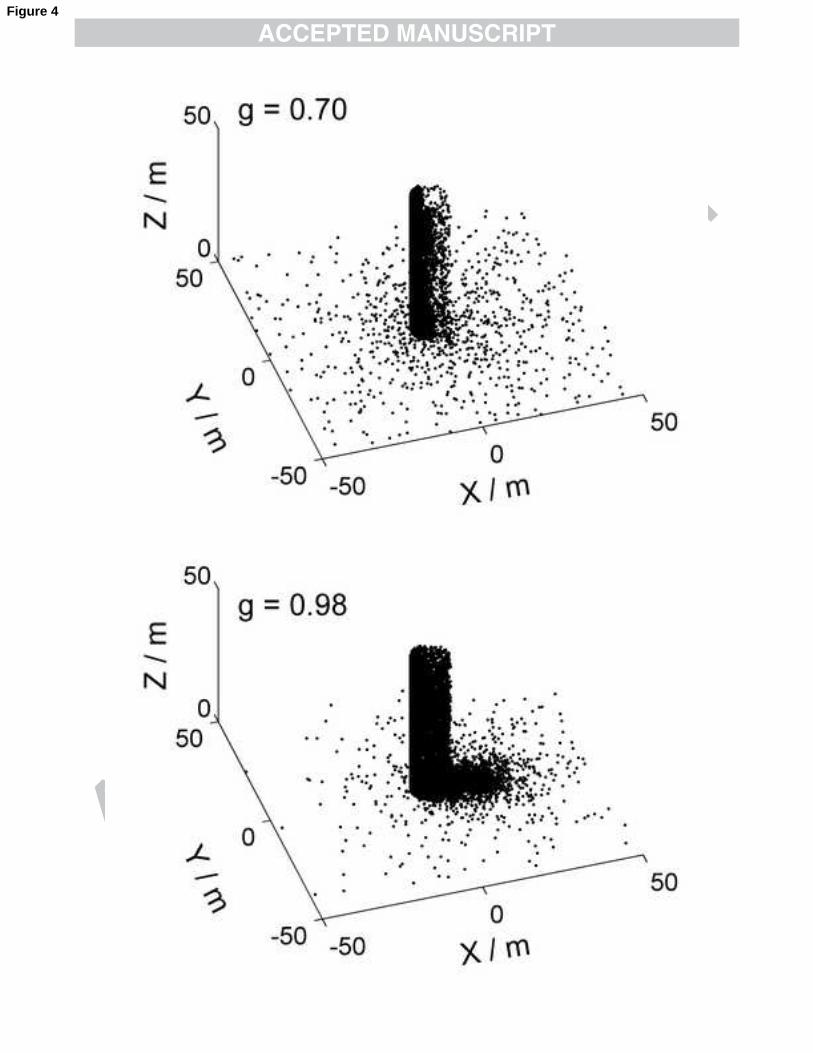
To illustrate the effect of changes in the scattering nature of the dust particles on the photon
propagation, the asymmetry parameter, g, (defined as the average cosine of the scattering angle
weighted by the phase function) was assigned values of 0.70, 0.80, 0.90 and 0.98. The NV model was
used for a dust devil with τ = 0.6. The position of the photons after six scattering events is shown in
Fig. 4 for g = 0.70 and 0.98. As Fig. 4 illustrates, for lower values of g, the location where the photons
cross the detector plane is more uniformly spread around the vortex. At high g values, the positions
where the photons cross the detector plane are highly concentrated in the +X plane and cover an area
only slightly larger than the dust devil radius. This result is expected, since as g →0 the photon
scattering will tend towards isotropic resulting, in a more uniform distribution of photons around the
vortex. As g →1 the photons will scatter more favourably in the forward direction and the positions
where the photons cross the detector plane will be concentrated on the opposite side (+X) from where
they enter (-X).
[Fig. 4]
4 Simulated dust devil transits
The FS case will detect photons which pass directly through the dust without interaction (direct
component) and also any photon scattered onto the PoM (scattered component). The simulations
assume a sky free of dust and clouds resulting in the direct component forming the majority of the
total surface irradiance and therefore as a dust devil transits1 across the detector the number of
photons detected decreases by a factor of extexp[ ]k L , where L is the path length through the dust. The
scattered component increases during the transit, though the increase is small in comparison to the
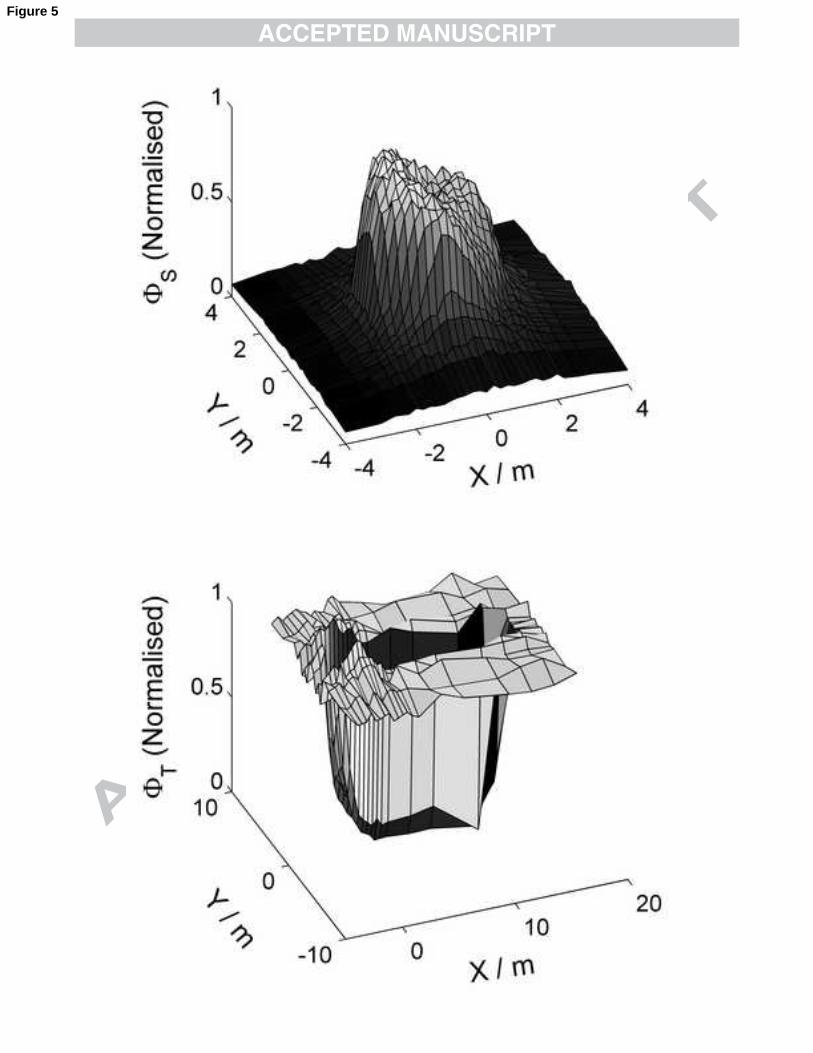
decrease in the direct component. In contrast, when a dust devil transits in the NV case an increase in
1 A ‘transit’ is defined as the passage of a dust devil such that the PoM passes through the low pressure core of
the vortex.
16
detected photons should be observed. This is because the FoV in the NV case precludes detection of
the direct component and therefore only the scattered component is detected, which increases as N
(hence extk ) increases resulting in a net increase in signal over the ambient signal. Fig. 5 shows the
normalised total (T) and scattered (S) photon flux over the model surface for both FoV cases for a
dust devil with a radius of 2 m and τ = 0.6.
[Fig. 5]
In the following sections a transit of a dust devil moving in the –X direction is simulated for τ
of 0.15, 0.3, 0.6, 0.9, 1.2, 1.6 and 2.0. For a uniform dust devil with an outer radius of 2 m this results
in kext of 0.0375, 0.075, 0.15, 0.225, 0.3, 0.4 and 0.5 m-1
respectively. Note that since the dust devil
size and composition is fixed the quantity being varied is the dust concentration N. For a non–uniform
dust devil three scenarios were considered: the first assumes 1/4 of the total dust is in the core with the
remainder in the wall. The second and third assume 1/3 and 2/5 of the dust is present in the core
leaving 2/3 and 3/5 of the dust in the wall respectively. Table 1 provides extk for each scenario for a
non–uniform dust devil with a core radius of 1 m and the same outer radius as the uniform dust devil.
[Table 1]
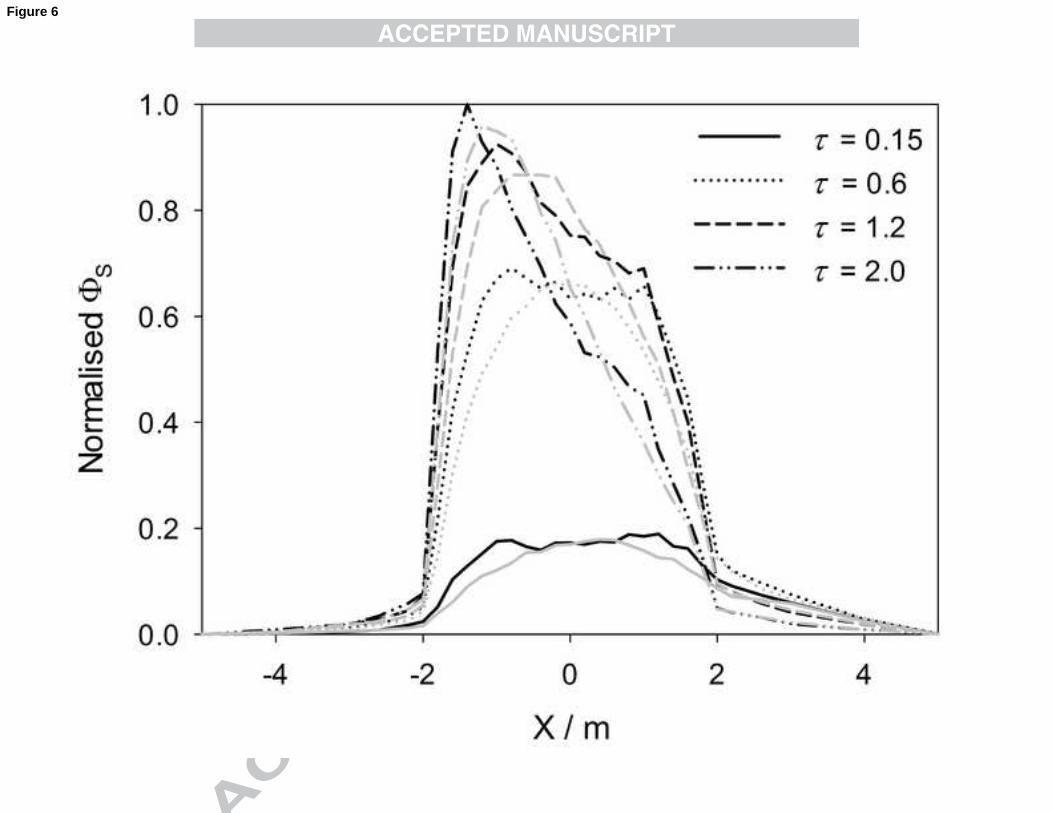
4.1 Effect of dust loading
The transit of a dust devil with the parameters of Scenario 1 is used to investigate the effect of
increasing dust loads, Fig. 6. From examination of the simulated dust devil transits we would expect a
dust devil of high dust loading, for the NV case, to be characterised by a significant increase in the
scattered photon flux (S) as the illuminated edge passes over. This would be followed by a sharp
decrease in S through the core and non–illuminated wall. For high N, S is approximately 150% and
300% larger in the illuminated wall compared to the dust devil core and non-illuminated wall
respectively. Lower dust concentrations result in fewer photon–particle interactions lowering the
probability of scattering into the PoM, causing S in the illuminated wall to decrease. The longer
17
optical free path for low N allows more photons to penetrate into the core and opposite wall and
correspondingly S in the core and non-illuminated wall increases. For vortices with τ of 0.15 and
0.3, the optical free path far exceeds the diameter of the dust devil and as a result S quickly
decreases, with ~70% less flux detected in the core for a dust devil with τ = 0.15 compared to vortices
with τ = 0.6. At these low dust concentrations the internal distribution of the dust becomes important
and the uniform case shows a peak in S at the dust devil centre while the more heterogeneous dust
devils (Scenario 1) show small maxima in flux near the core–wall boundary of the illuminated and
non-illuminated wall and less scattered light detected at the dust devil core.
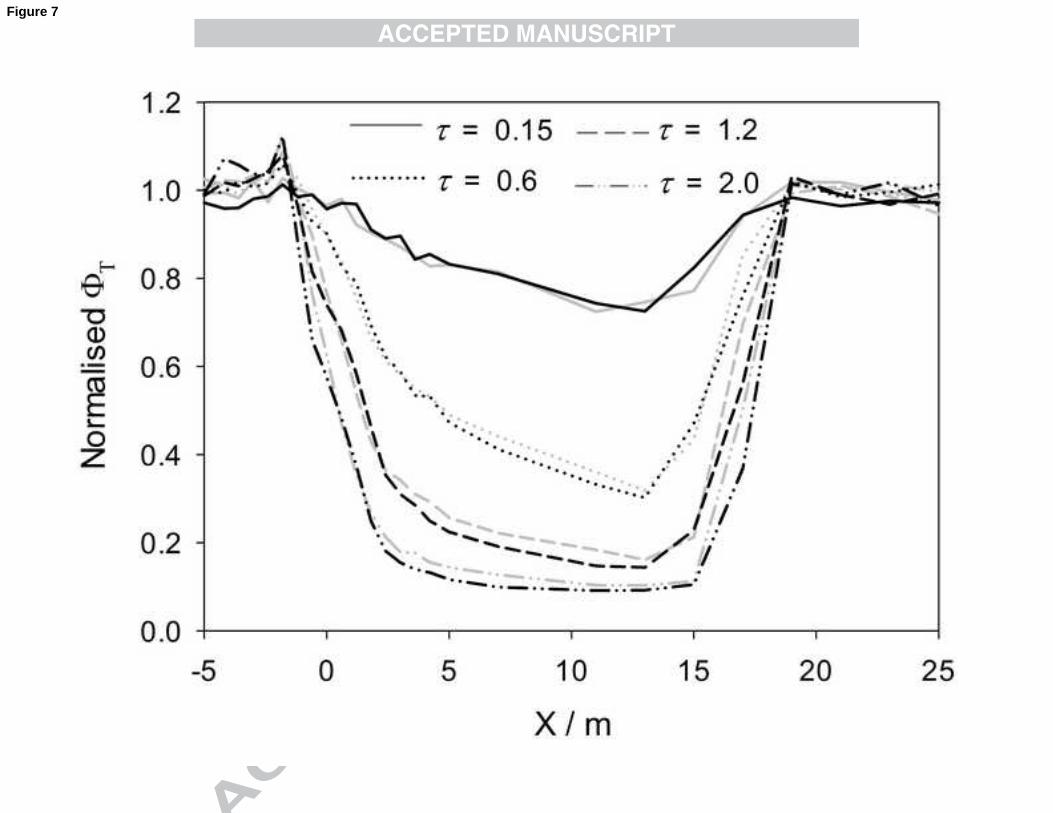
[Fig. 6]
The total photon flux (T) transit signatures can generally be characterised by a reduction in
T as the vortex passes over the PoM. Closer examination of the transits reveals that above a kext of
0.24 m-1
in the dust devil wall there is an increase in T as the dust devil approaches the PoM. A peak
flux is observed just inside the illuminated wall, X = -1.8 m, with the high opacity dust devils showing
a 10% increase in T. The higher T is a result of the increase in S being larger than the decrease in
the direct light flux at X = 1.8 m leading to a net increase inT. Further into the vortex T decreases
depending on τ, with low τ showing a more gradual decline between X = -1.8 m and X = 1.0 m
compared to high dust optical depths (τ = 2.0). As the PoM passes through the core a slight change in
the gradient is observed at high dust concentrations in the heterogeneous dust devils, which is not
observed in the uniform case. Upon exiting the dust devil the gradient reduces significantly and T
reduces gradually to a minimum at X ≈14.0 m before increasing back to the ambient flux. This result
is significant as it shows that for dust devil transits with this geometry (vortices moving directly
towards or away from the Sun) the position of lowest measured flux does not correlate with the
portion of the transit signature associated with the dust devil interior but to the location on the surface
where the optical depth along the photon incident path is at a maximum. This occurs at the point
where the line joining the PoM to the Sun has the longest path length through the dust devil.
18
[Fig. 7]
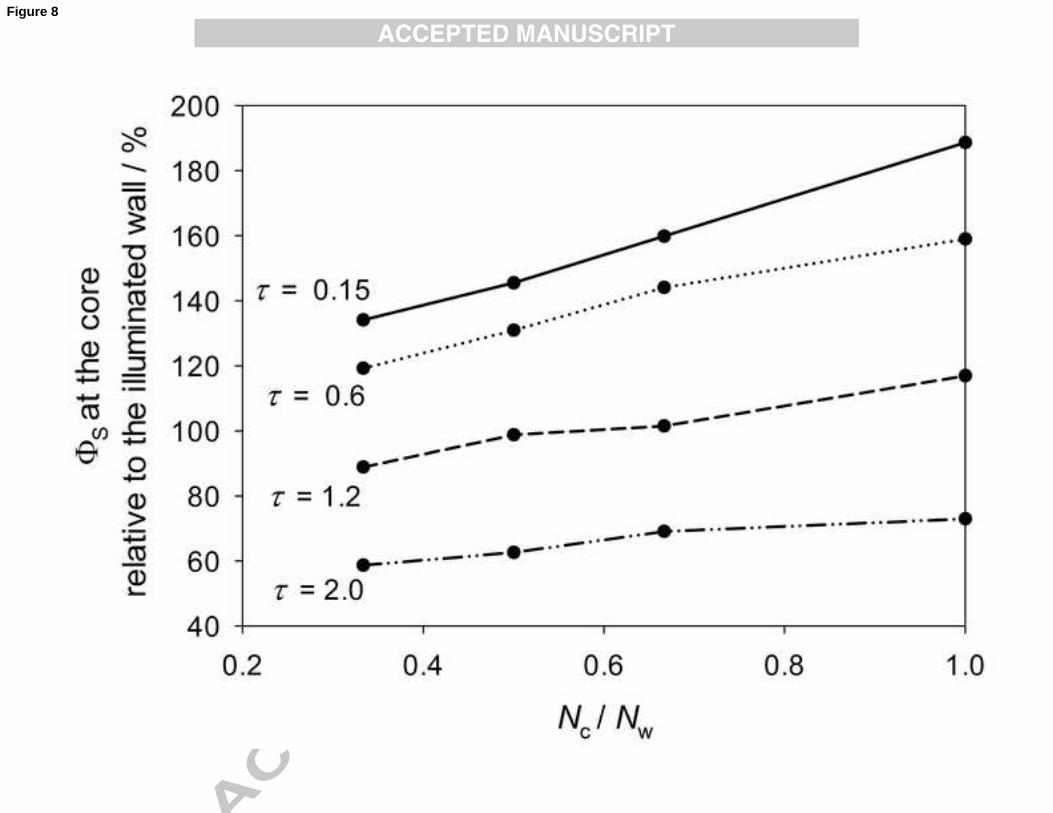
4.2 Effect of dust distribution
To determine the effect of the different internal dust distributions on the transit signature the observed
S in the core and non–illuminated wall relative to the illuminated wall was plotted as a function of
dust devil uniformity, which is defined as the ratio of the core dust concentration to the dust
concentration present in the walls, (Nc / Nw). Fig. 8 shows that for low dust concentrations, S in the
dust devil core is strongly dependent on the internal dust distribution. A dust devil with τ = 0.15 and a
core dust concentration 1/3 of the wall experiences an increased S of ~35 % in the core relative to
the illuminated wall. As the dust devil becomes more uniform the relative scattered flux in the core
increases, with almost twice the scattered photon flux observed relative to the illuminated wall for the
uniform case. At τ = 1.2 the dust concentration in the dust devil walls for Scenario 1 and 2 results in
the optical free path of the photons being less than the width of the walls resulting in Scenario 1 and 2
experiencing a decrease in S of ~10% and 2% respectively relative to the illuminated wall. Dust
distributions with a higher degree of homogeneity (Scenario 3 and the uniform case) predict 2% and
16% increase in S entering the PoM at the core than in the illuminated wall. This indicates that the
different internal dust distributions will result in very different transit signature, with Scenario 1 and 2
showing an increase in S in the illuminated wall over the core while the more uniform dust devils
predict a lower S in the illuminated wall relative to the core. As the dust concentration increases
heterogeneities in the internal dust distribution become less important. At τ = 2.0, Scenario 1 and the
uniform case predict ~40% and ~30% less scattered flux in the core respectively. The scattered photon
flux in the non–illuminated wall relative to the illuminated wall showed little dependence on the
internal dust distribution with the relative scattered flux constant or all internal dust distributions
considered.
The FS simulations showed that T in the core and non-illuminated wall relative to T in the
illuminated wall to be approximately constant for all τ cases. This indicates the internal dust
19
distribution will have an almost negligible effect on the spectral signature of a dust devil transit when
measuring T. The driving parameter governing the transit signature shape is the total amount of dust
along the line joining the source to the detector. From the Beer-Lambert law the direct flux is a
function of τ for a fixed θz. Therefore the manner in which the dust is distributed with the dust devil
will have no impact on the direct component if τ is fixed and the slight variations in the FS transit
signatures are due only to the scattered component. This correlates with the assumption that the direct
component forms the majority of the total surface flux during ‘clear sky’ conditions.
[Fig.8]
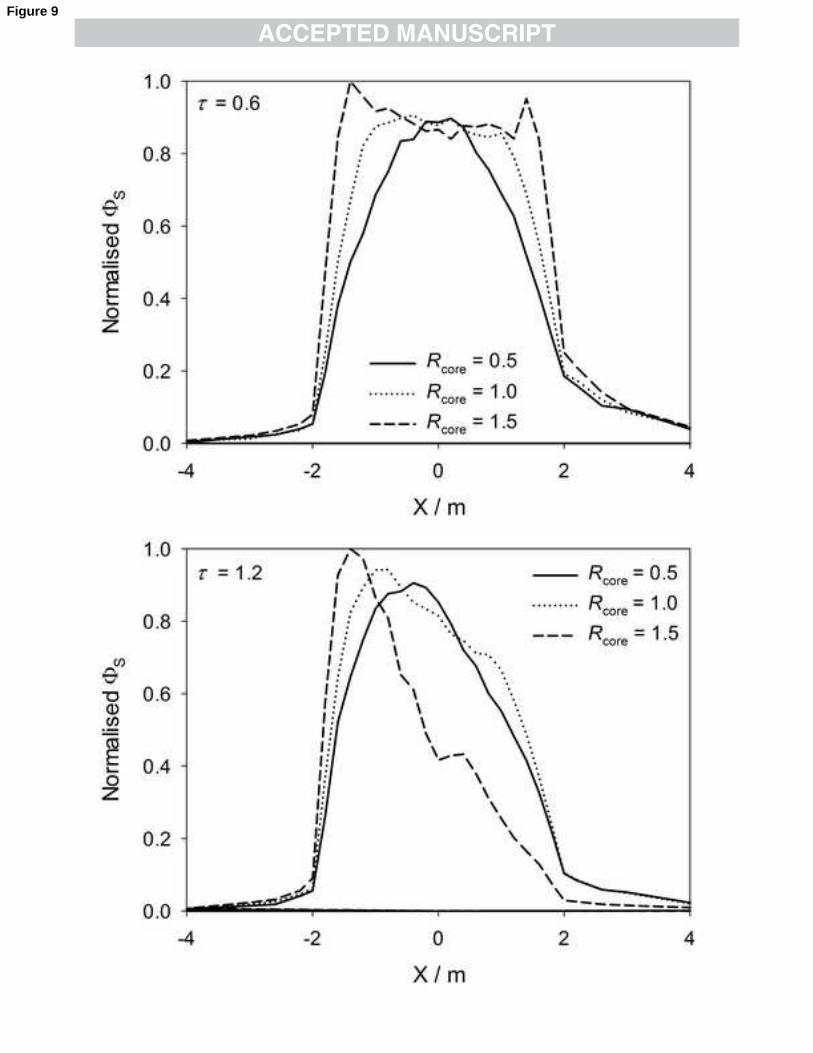
4.3 Effect of core size
To investigate different internal structures the dust devil core radius (Rcore) was varied to be 1/4, 1/2
and 3/4 of Rdd to determine the effect of different core and wall thickness on S. This corresponds to
core radii of 0.5, 1.0 and 1.5 m respectively for a dust devil with an outer radius of 2 m. The dust
distribution defined in Scenario 2 was applied to dust devils with τ of 0.6 and 1.2.
The NV transits, Fig. 9, reveal that S is highly dependent on the vortex core size. Since the
quantity of dust in the two regions is held constant as the core volume is increased, N in the wall is
enhanced while the core sees a reduction in N. Reducing the core diameter has the opposite effect,
increasing the wall and decreasing the core volume, hence lowering and enhancing the dust
concentration in two regions respectively. Looking at the transit of a dust devil with a core radius of
1.5 m and dust loading, τ = 1.2, the signature shows a significant departure compared to the
Rcore = 1.0 m case and more closely resembles a high optical depth dust devil with a core and outer
radius of 1.0 m and 2.0 m, Fig. 6. This is because the dust concentrations in the wall of the two dust
devils lead to a similar kext of 0.8 m-1
and 0.67 m-1
. At τ = 0.6 the increased dust concentration in the
wall results in a broadening of the uniform flux within the dust devil interior and the appearance of
two peaks in S at the outer edge of the illuminated and non–illuminated walls. For both dust optical
20
depths the transit signature of a dust devil with a small central core will be characterised by a peak in
intensity at the dust devil centre similar to the transit by a uniform dust devil.
[Fig. 9]
The simulated transits show that S is strongly dependent on N in the vortex wall which is a
function of τ, dust devil size, core diameter and also the internal dust distribution. Therefore, if both τ
and the dust devil size are known, the transit signature will be able to give insight not only into the
internal structure and dust distribution, but more importantly the dust concentration. For example, a
large S in the illuminated wall relative to the core is characteristic of a dust devil with a high N in the
vortex wall. This can be a result of a dust devil with a moderate dust loading but large internal core
resulting in a low wall volume or by a vortex with a high dust loading and a smaller core but with the
majority of the dust contained within the wall. If S is approximately uniform during the dust devil
transit, this is an indication of low N throughout the vortex.
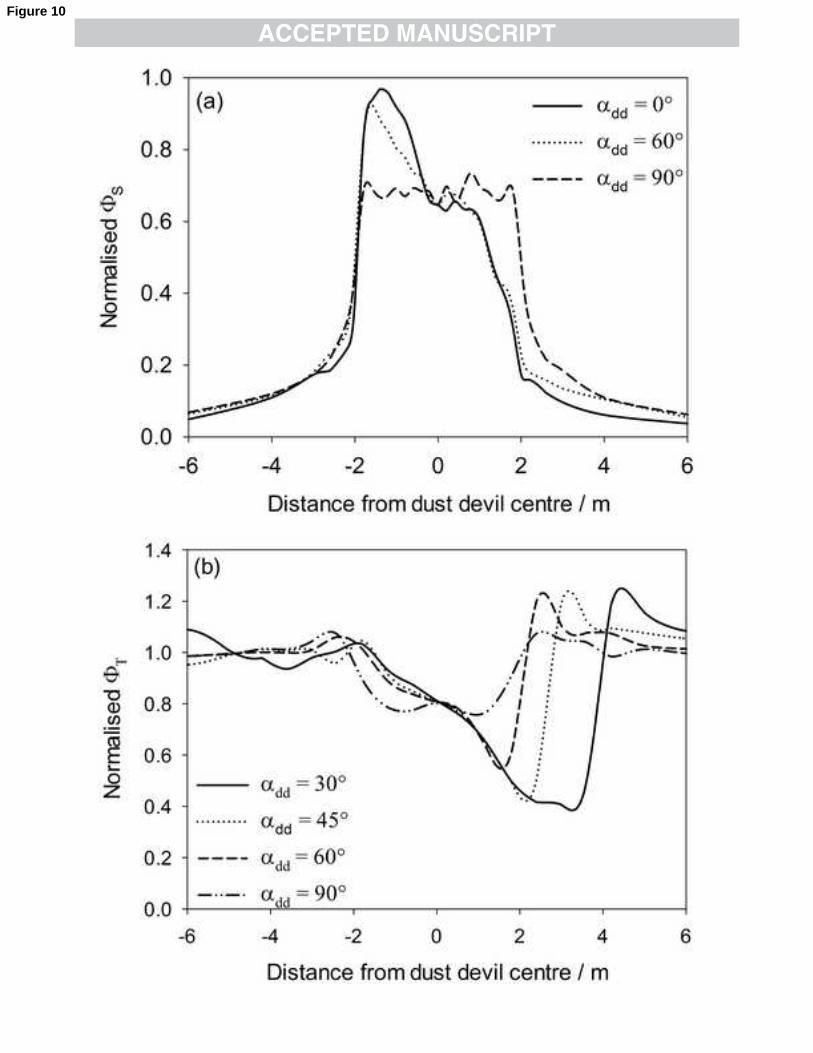
4.4 Effect of transit trajectory
The scattered and total photon flux over the NV and FS model surfaces, Fig. 5, can be used to
determine the transit signature for any dust devil trajectory over the PoM by interpolating over this
model surface. The trajectory of the dust devil is defined here as the angle (dd at which the PoM
enters the vortex relative to the illuminated edge. A number of simulated dust devil transits were
performed using different trajectories to investigate the effect on the S and T transit signatures and
the results are shown in Fig. 10. All simulations in this section apply to a dust devil with Rcore = 1 m
and outer radius of 2 m with kext of 0.1 m-1
and 0.4 m-1
in the core and wall respectively. As illustrated
for the NV case, the direction of travel over the PoM relative to the illuminated side can result in a
significantly different transit signature, especially for high N in the dust devil wall. The transit
signatures show S will be greatest if the PoM passes through the illuminated wall; therefore if the
dust devil is moving away from the Sun (dd180) and the PoM enters from the non-illuminated
21
side, the peak S will be observed in the trailing wall (i.e. after the decrease in pressure at the core).
Alternatively if the dust devil is heading towards the Sun (dd0) the leading edge wall will
experience a higher S. As dd→90, S in the illuminated wall will decrease while S in the
non-illuminated wall increases, leading to a constant S through the vortex interior at dd90.
The FS model shows total flux transit signature is significantly modified by the trajectory of
the dust devil over the PoM. At increased angles from the illuminated wall, the path length through
the dust devil shadow decreases resulting in a reduction of the transit signature width. This leads to
the location where T is smallest to migrate towards the dust devil interior. A perpendicular transit of
a non–uniform dust devil is characterised by the point of lowest flux coinciding with the core–ward
edge of the leading and trailing walls and an increase in flux at the dust devil core. It should be noted
that the high symmetry of the perpendicular transit is an artefact of the X-Y plane symmetry assumed
in the model and such symmetry is unlikely to be measured in reality. The transit signature for dust
devils with trajectories such that the PoM enters the non-illuminated side of the dust devil will be the
reverse of the transits shown in Fig. 10.
[Fig. 10]
22
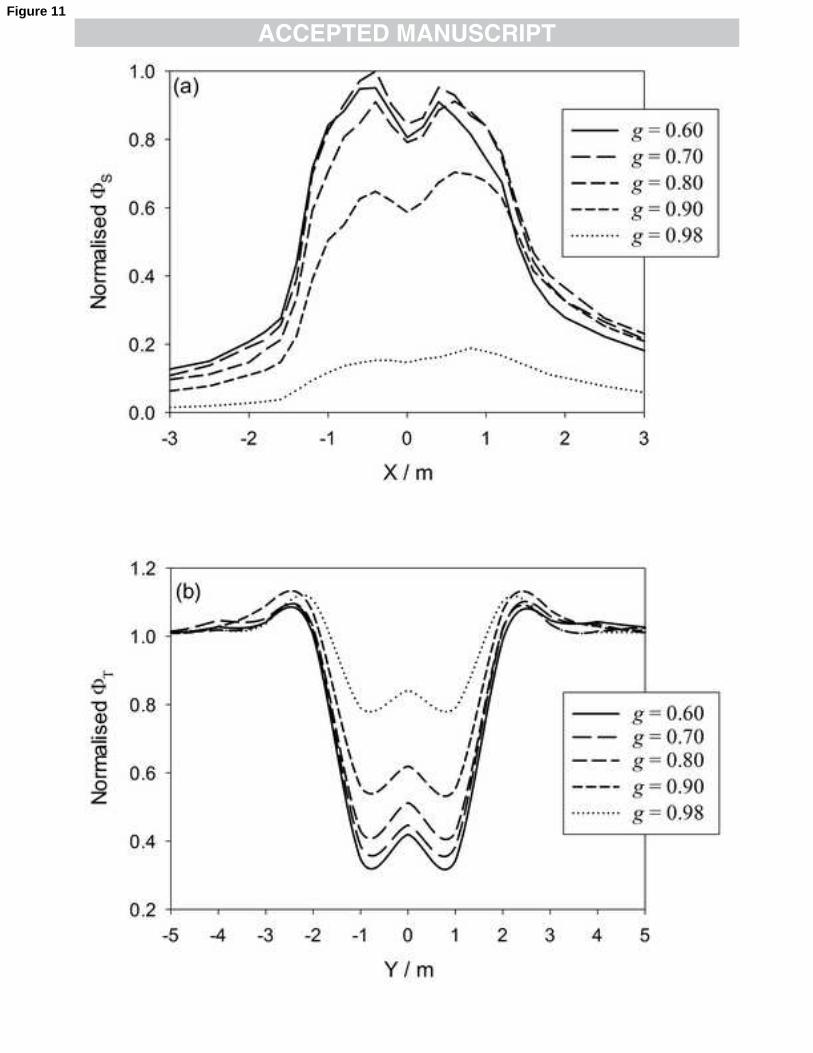
4.5 Effect of single scattering properties
The optical properties of the dust particles entrained in the dust devil were varied to assess the
sensitivity of the model to changes in the single scattering properties. Fig. 11 shows a dust devil
transit for both the NV and FS cases for changes in the asymmetry parameter (with 0 = 0.95 and the
scattering phase function of the dust particle described by a Henyey-Greenstein phase function). A
transit parallel and perpendicular to the X-axis is assumed for the NV and FS cases respectively. The
FS case shows that T increases as g →1, whereas, a decrease in S is observed for the NV case. The
different dependence on g can be explained by the scattering phase function; at high values of g the
photons are scattered predominately at forward angles, therefore even though the photon has been
scattered it will still be in the direct path to the PoM, and hence will be detected. As g decreases the
probability of scattering away from the forward direction and out of the direct path increases, this
results in fewer photons being detected, hence less light. The reverse is true for the NV case where the
photons must be scattered out of the direct path in order to be detected which has a lower probability
of occurring at high g values. For the NV case, Fig. 11a also reveals that as g increases the measured
scattered component in the non-illuminated side relative to the core increases. This is a result of more
photons penetrating through to the non-illuminated side due to the higher probability of scattering at
small angles. Similarly the opposite is true for the illuminated wall, where a decrease in S is
observed for increased values of g.
[Fig. 11]
Unexpectedly, for the NV case, the maximum S does not correspond to the minimum value
of g but occurs at g = 0.73. This can be explained by examining the effect increasing g has on the
scattering phase function. For a θz of 13.5° a photon needs to be scattered by an angle between
approximately 5° and 30° in order to be detected given a field of view of 12.7°. The probability of
scattering between these values decreases as g →1, as the favourable scattering angle approaches 0°.
23
The maximum scattered flux occurs with g = 0.73, as it provides the photons the highest probability
of scattering between 5° and 30°.
This indicates a bias effect associated with θz on the observed scattered flux for a given g
value. At larger or smaller θz, the angle through which the photons must be scattered in order to be
detected will increase and decrease respectively. The implication is that as the Sun moves towards
zenith the g value associated with the peak scattered component will increase as θz decreases, since
the angle through which the photons must be scattered in order to be detected approaches 0.
Conversely, as the Sun sinks towards the horizon the g value will decrease accordingly. The bias
effect is not observed in the FS case as a result of the direct component forming the majority of the
light flux and reveals that the bias is limited to the scattered component. This bias is important when
interpreting data from potential observations and care is needed when attempting retrieval of the dust
optical properties.
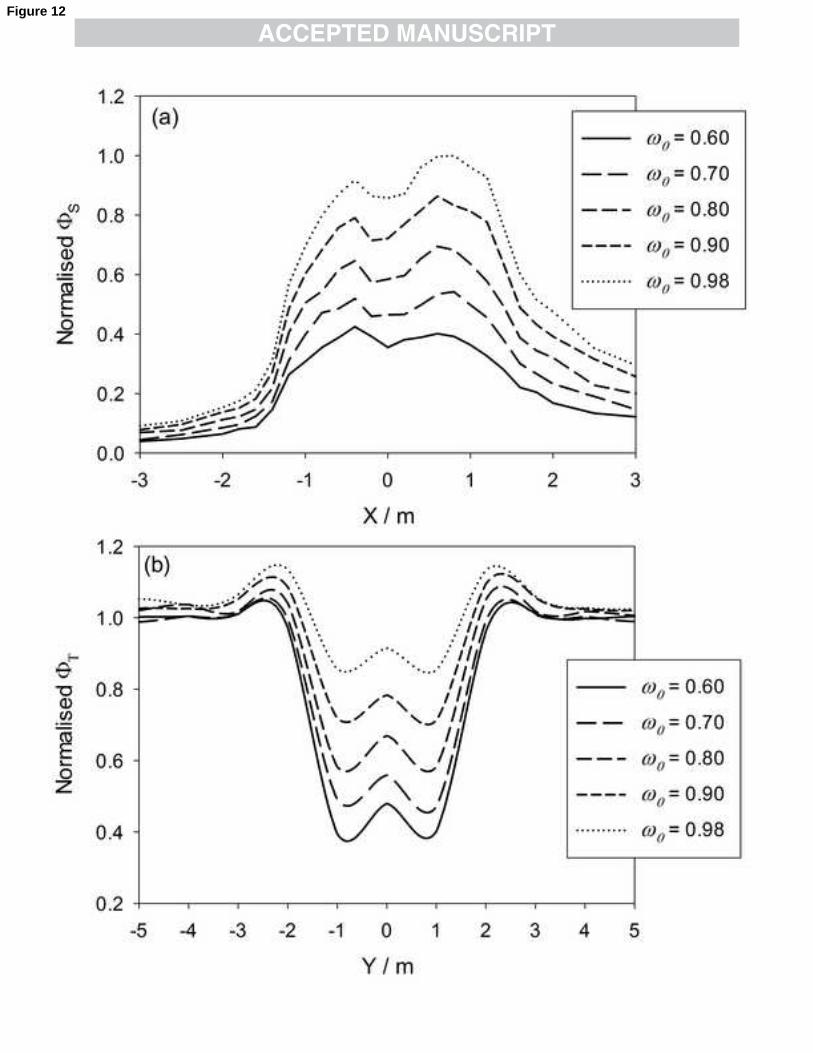
The same transit was simulated for changes in 0, with g held constant at a value of 0.8,
Fig. 12. Both the NV and FS simulations predict that smaller values of ω0 will result in lower total
and scattered fluxes and correlates with a high attenuating dust component absorbing a larger portion
of the incident light. At higher values of ω0 the dust grains are less absorbing and more light is
scattered, increasing the probability of detection, and correlates with a higher S and T.
[Fig. 12]
24
5 Conclusion
The spectral variation of sunlight during a dust devil transit was investigated to determine whether the
dust load, size and internal structure of the vortex could be estimated from a dust devil transit
signature. This work has shown that the spectral signature of a transiting dust devil is highly
dependent on the method of observation, with the narrow field of view (NV, assuming the Sun is not
in the FoV) and full sky flux (FS) simulations showing contrasting spectral signatures.
In the FS case, T decreases during the transit since the loss of light from the direct
component, as a result of absorption and scattering by the dust particles, is much larger than the gain
from increased diffuse scattering. Predictions of T transit signature revealed a negligible dependence
on the dust concentration and core size. This is due to the dominance of the direct component in the
total irradiance at the surface under ‘clear sky’ conditions and therefore, T is dependent upon the
total extinction along the line of sight to the Sun.
In the NV case, the incident solar flux interacts with the dust column of the dust devil vortex
resulting in light, which would otherwise be undetected, being scattered into the point of measurement
(PoM). This causes the measured flux to increase during a dust devil transit. The NV simulations have
shown that S inside a dust devil vortex is strongly dependent on the dust distribution within the dust
devil interior. The S dependence on the dust concentration manifests itself in the transit signature as
a reduction in S in the region of lower dust concentration and an increase in S through regions of
higher dust concentration. Investigations of terrestrial dust devils have revealed central cores that are
relatively free of dust particles (Sinclair, 1974). The NV simulations have shown that this dust free
core becomes clearly defined in the S transit signature as a reduction in S, enclosed by regions of
increased S as the PoM passes through the vortex. Therefore, by measuring the S signature of a
transiting dust devil, the vortex core dimensions can be quantified, providing a more accurate
determination of the dust column volume. Furthermore, measurement of both T and S allows
determination of the direct flux, from which the dust optical depth can be calculated. Therefore if the
25
dust particle size distribution and optical properties are known, estimation of the mass concentration
and the total mass of dust particulates injected into the atmosphere can be determined. This will result
in varying levels of direct solar heating of the atmosphere, dependent on the optical properties of the
dust.
The implication of this work is that separate measurement of both the total and scattered flux of
light is crucial for characterising the distribution of dust within a dust devil by its spectral transit
signature. The total light flux observed provides information about the dust devil size and total
amount of dust, while the scattered light flux gives details of the internal structure of the vortex.
Variation in the dust particle single scattering properties were shown to significantly modify the
amount of total and scattered flux detected during the transit. These variations imply that the spectral
signature of a dust devil transit will differ depending on the wavelength of observation and the
properties of the suspended dust. Therefore by comparing the amount of scattered and total flux
received during the transit at different wavelengths it is possible to determine single scattering
properties of the dust. Following the simulations presented here, the model could be validated by
measuring terrestrial dust devil transits with visible spectrometers covering a spectral range of 300–
800 nm.
Our methods could also be applied to laboratory generated dust devil vortices. Measuring the
light flux at different locations within laboratory generated dust devils and comparing these results
with those predicted by the model would allow determination of the internal structure of such
laboratory generated vortices, hence showing whether they are representative of real dust devils.
These measurements would also help configure the field work setup for future dust devil observations
and assist in the analysis of the measured transit signatures by allowing comparisons of different
vortex trajectories over the detector.
Finally we conclude that in situ measurements of the spectral signatures of transiting dust devils
provide a powerful tool to characterise dust devils, including those on Mars, allowing for
26
determination of their size, dust concentration, internal structure and dust distribution. The nature of
such measurements makes them an ideal technique to use on Mars, only requiring two upward
viewing spectrometers of low complexity and mass. Measuring the wavelength dependent transit
signatures of dust devils would allow estimation of the total amount of dust lofted into the atmosphere
and its radiative properties, which is vital in determining the radiative effect of dust devils on the
martian atmosphere.
27
Acknowledgements
The authors acknowledge STFC for funding this work as part of on-going research (MRP and SRL)
and as part of a PhD project (JPM). The authors also express their gratitude to the two anonymous
referees for their constructive comments and careful reviews.
References
Alpert, P., et al., 1998. Quantification of dust-forced heating of the lower troposphere. Nature. 395,
367-370.
Balme, M., Greeley, R., 2006. Dust devils on Earth and Mars. Reviews of Geophysics. 44.
Balme, M. R., Whelley, P. L., Greeley, R., 2003. Mars: dust devil track survey in Argyre Planitia and
Hellas Basin. J. Geophys. Res. 108.
Cantor, B. A., Kanak, K. M., Edgett, K. S., 2006. Mars Orbiter Camera observations of Martian dust
devils and their tracks (September 1997 to January 2006) and evaluation of theoretical vortex
models. J. Geophys. Res. 111, E12002.
Cashwell, E. D., Everett, C. J., 1959. A practical manual on the Monte Carlo method for random walk
problems. Pergamon Press.
Deepak, A., Gerber, H. E., 1983. Report of WMO (CAS)/Radiation Commission of IAMAP Meeting
of Experts on Aerosols and Their Climatic Effects,(Williamsburg, Virginia, USA, 28-30
March, 1983). Geneva: World Meteorological Organization.
Dubovik, O., et al., 2000. Accuracy assessments of aerosol optical properties retrieved from
AERONET sun and sky-radiance measurements. J. Geophys. Res. 105, 9791-9806.
Ellehoj, M. D., et al., 2010. Convective vortices and dust devils at the Phoenix Mars mission landing
site. J. Geophys. Res. 115, E00E16.
Ferri, F., Smith, P. H., Lemmon, M., Rennó, N. O., 2003. Dust devils as observed by Mars Pathfinder.
J. Geophys. Res. 108, 1–7.
28
Fisher, J. A., et al., 2005. A survey of Martian dust devil activity using Mars Global Surveyor Mars
Orbiter Camera images. J. Geophys. Res. 110.
Fouquart, Y., et al., 1987. Observations of Saharan aerosols: Results of ECLATS field experiment.
Part II: Broadband radiative characteristics of the aerosols and vertical radiative flux
divergence. Journal of Applied Meteorology. 26, 38-52.
Greeley, R., et al., 2003. Martian dust devils: Laboratory simulations of particle threshold. J.
Geophys. Res. 108.
Greeley, R., et al., 2010. Gusev Crater, Mars: Observations of three dust devil seasons. J. Geophys.
Res. 115, E00F02.
Greeley, R., et al., 2006. Active dust devils in Gusev crater, Mars: observations from the Mars
exploration rover spirit. J. Geophys. Res. 111, E12S09.
Hansen, J., Sato, M., Ruedy, R., 1997. Radiative forcing and climate response. J. Geophys. Res. 102,
6831-6864.
Hess, M., Koepke, P., Schult, I., 1998. Optical properties of aerosols and clouds: The software
package OPAC. Bull. Amer. Meteor. Soc. 79, 831-844.
Ives, R. L., 1947. Behavior of dust devils. Bull. Amer. Meteor. Soc. 28, 168-174.
Kaufman, Y. J., Tanré, D., Dubovik, O., Karnieli, A., Remer, L. A., 2001a. Absorption of sunlight by
dust as inferred from satellite and ground-based remote sensing. Geophys Res Lett. 28, 1479-
1482.
Kaufman, Y. J., Tanré, D., Dubovik, O., Karnieli, A., Remer, L. A., 2001b. Absorption of sunlight by
dust as inferred from satellite and ground-based remote sensing. Geophysical Research
Letters. 28, 1479-1482.
Levin, Z., Joseph, J. H., Mekler, Y., 1980. Properties of Sharav (Khamsin) dust-Comparison of optical
and direct sampling data. Journal of Atmospheric Sciences. 37, 882-891.
Metzger, S. M., Dust devils as Aeolian Transport Mechanisms in Southern Nevada and the Mars
Pathfinder Landing Site, Ph.D. dissertation, pp 236. University of Nevada, 1999a.
29
Metzger, S. M., Carr, J. R., Johnson, J. R., Parker, T. J., Lemmon, M. T., 1999b. Dust devil vortices
seen by the Mars Pathfinder camera. Geophys Res Lett. 26, 2781-2784.
Neakrase, L. D. V., Greeley, R., 2010a. Dust devil sediment flux on Earth and Mars: Laboratory
simulations. Icarus. 206, 306-318.
Neakrase, L. D. V., Greeley, R., 2010b. Dust devils in the laboratory: Effect of surface roughness on
vortex dynamics. J. Geophys. Res. 115, E05003.
Neakrase, L. D. V., Greeley, R., Iversen, J. D., Balme, M. R., Eddlemon, E. E., 2006. Dust flux within
dust devils: Preliminary laboratory simulations. Geophysical research letters. 33, L19S09.
Rennó, N. O., Burkett, M. L., Larkin, M. P., 1998. A simple thermodynamical theory for dust devils.
Journal of the atmospheric sciences. 55, 3244-3252.
Ryan, J. A., Carroll, J. J., 1970. Dust devil wind velocities: Mature state. J. Geophys. Res. 75, 531-
541.
Ryan, J. A., Lucich, R. D., 1983. Possible dust devils, vortices on Mars. Journal of geophysical
research. 88, 11005-11,011.
Shettle, E. P., Fenn, R. W., Models of the atmospheric aerosols and their optical properties. Vol. 1,
1976.
Sinclair, P. C., A Quantitative analysis of the dust devil, Ph.D. dissertation, pp 292. University of
Arizona, 1966.
Sinclair, P. C., 1973. The lower structure of dust devils. Journal of Atmospheric Sciences. 30, 1599-
1619.
Sinclair, P. C., Vertical transport of desert particulates by dust devils and clear thermals. California
Univ., Livermore (USA). Lawrence Livermore Lab., 1974.
Thomas, P., Gierasch, P. J., 1985. Dust devils on Mars. Science. 230, 175.
Vincendon, M., Langevin, Y., 2010. A spherical Monte-Carlo model of aerosols: Validation and first
applications to Mars and Titan. Icarus. 207, 923-931.
30
Whelley, P. L., Greeley, R., 2006. Latitudinal dependency in dust devil activity on Mars. Journal of
geophysical research. 111, E10003.
Whitney, B. A., 2011. Monte Carlo radiative transfer. Arxiv preprint arXiv:1104.4990.
Witt, A. N., 1977. Multiple scattering in reflection nebulae. I. A Monte Carlo approach. Astrophys. J.,
Suppl. Ser.;(United States). 35.
Fig. 1. Global coordinate system of the model volume, (X0, Y0) is defined as the centre of the dust
devil. Also shown is the decomposition of the photon vector Pv in to its direction cosines.
Fig. 2. Rotation of a photon vector onto the optical depth grid.
Fig. 3 The photon positions after one scattering event in a dust devil of (a) high and (b) low dust
concentration, and after four scattering events, (c) high and (d) low dust concentration.
Fig. 4. Photon positions after six scattering events for: (a) g = 0.7and (b) g = 0.98.
Fig. 5. The photon flux during a transit of a 2 m diameter dust devil with τ = 0.6 for: (a) NV case and
(b) FS case.
Fig. 6. NV dust devil transits from Scenario 1 (black lines) and uniform Scenario (grey lines) for
different cumulative optical depths.
Fig. 7. As fig.6, but showing the FS simulated transits.
Fig. 8. The observed scattered photon flux in the core relative to the illuminated wall as a function of
Nc / Nw.
Fig. 9. The transit signature of dust devils with core radii of 0.5, 1.0 and 1.5 m. The internal dust
distribution from scenario 2 is used and the dust devils have dust optical depths of 0.6 and 1.2.
Fig. 10. The variation in the dust devil transit signature for different trajectories over the PoM: (a) NV
model (b) FS model.

31
Fig. 11. Transit of a dust devil moving along the X-axis for different asymmetry parameter values
with ω0 held constant at 0.95 (a) NV model, (b) FS model.
Fig. 12. Transit of a dust devil moving along the X-axis for different 0 values with g held constant at
0.8: (a) NV model and (b) FS model.
Table 1: kext in the core and walls for non-uniform dust devils under the different scenarios considered
for each τ.
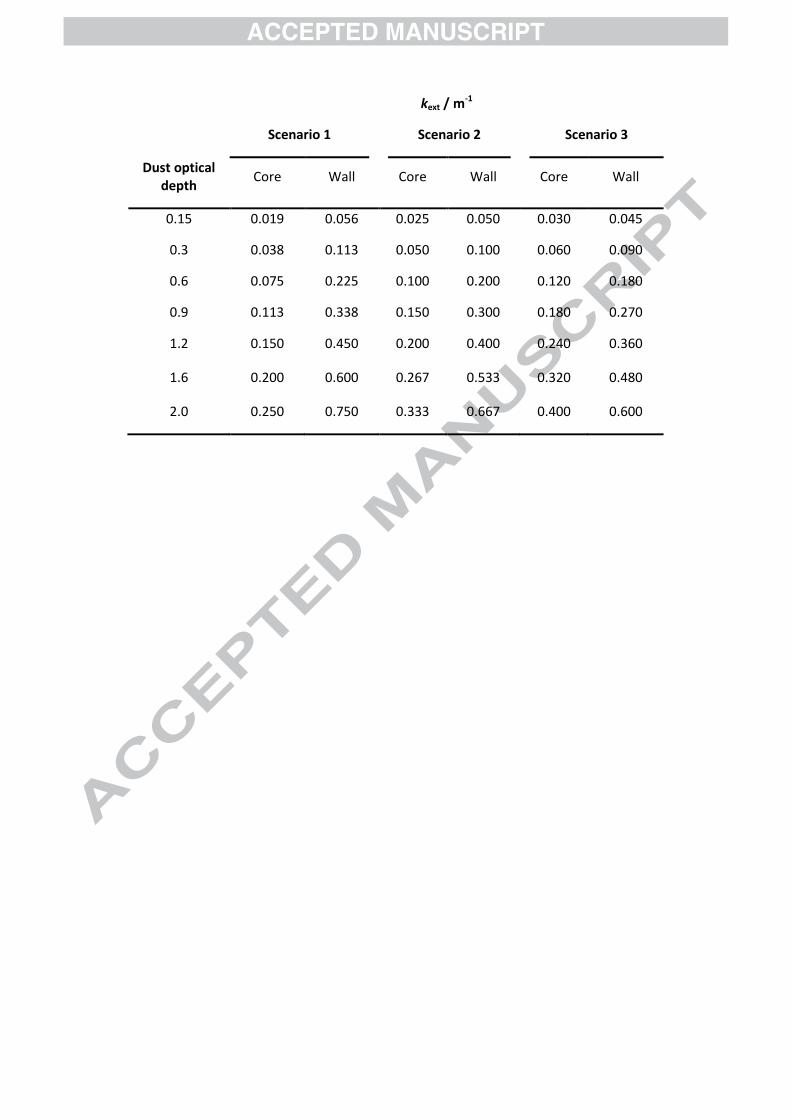
kext / m-1
Scenario 1 Scenario 2 Scenario 3
Dust optical depth
Core Wall Core Wall Core Wall
0.15 0.019 0.056 0.025 0.050 0.030 0.045
0.3 0.038 0.113 0.050 0.100 0.060 0.090
0.6 0.075 0.225 0.100 0.200 0.120 0.180
0.9 0.113 0.338 0.150 0.300 0.180 0.270
1.2 0.150 0.450 0.200 0.400 0.240 0.360
1.6 0.200 0.600 0.267 0.533 0.320 0.480
2.0 0.250 0.750 0.333 0.667 0.400 0.600
We study light transmission through dust devils with a Monte Carlo scattering model The scattered flux is highly dependent on the internal dust distribution The direct flux is dependent on the total amount of dust present A solar zenith angle bias acts on the asymmetry parameter in the scattered flux Measurement of total and scattered flux is crucial for characterising dust devils