Downhole well log and core montages from the Mount Elbert Gas Hydrate Stratigraphic Test Well
17
Downhole well log and core montages from the Mount Elbert Gas Hydrate Stratigraphic Test Well, Alaska North Slope T.S. Collett a, * , R.E. Lewis b , W.J. Winters c , M.W. Lee a , K.K. Rose d , R.M. Boswell d a U.S. Geological Survey, Denver Federal Center, MS-939, Box 25046, Denver, CO 80225, USA b Schlumberger, 713 Market Drive, Oklahoma City, OK 73114, USA c U.S. Geological Survey, 384 Woods Hole Road, Woods Hole, MA 02543, USA d U.S. Department of Energy e National Energy Technology Laboratory, Morgantown, WV 26507, USA article info Article history: Received 9 December 2009 Received in revised form 12 March 2010 Accepted 22 March 2010 Available online 27 March 2010 Keywords: Gas hydrate Alaska Resources Logs Core North Slope Drilling abstract The BPXA-DOE-USGS Mount Elbert Gas Hydrate Stratigraphic Test Well was an integral part of an ongoing project to determine the future energy resource potential of gas hydrates on the Alaska North Slope. As part of this effort, the Mount Elbert well included an advanced downhole geophysical logging program. Because gas hydrate is unstable at ground surface pressure and temperature conditions, a major emphasis was placed on the downhole-logging program to determine the occurrence of gas hydrates and the in-situ physical properties of the sediments. In support of this effort, well-log and core data montages have been compiled which include downhole log and core-data obtained from the gas- hydrate-bearing sedimentary section in the Mount Elbert well. Also shown are numerous reservoir parameters, including gas-hydrate saturation and sediment porosity log traces calculated from available downhole well log and core data. Published by Elsevier Ltd. 1. Introduction Under the Methane Hydrate Research and Development Act of 2000 (renewed in 2005), the U.S. Department of Energy (DOE) has funded laboratory and field research on both Arctic and marine gas hydrates. Among the Arctic studies, BP Exploration (Alaska), Inc. (BPXA) and the DOE have undertaken a project to characterize, quantify, and determine the commercial viability of gas hydrates resources in the Prudhoe Bay, Kuparuk River, and Milne Point field areas on the Alaska North Slope (ANS). In 2005, the analysis of industry acquired 3-D seismic data and existing downhole well log data (enabled by collaborations with the U.S. Geological Survey (USGS) and the Bureau of Land Management (BLM); Lee et al., 2011) identified more than a dozen discrete mapable gas hydrate pros- pects within the Milne Point area. Because the most favorable of those targets was a previously undrilled, fault-bounded gas hydrate accumulation, BPXA and the DOE decided to drill a vertical strati- graphic test well at that location (named the “Mount Elbert” prospect) to acquire critical reservoir data needed to develop a longer-term production testing program (Hunter et al., 2011). The Alaska, Milne Point area, BPXA-DOE-USGS Mount Elbert Gas Hydrate Stratigraphic Test Well (Mount Elbert Well) was completed in February 2007 and yielded one of the most comprehensive datasets yet compiled on naturally-occurring gas hydrates. Data collected from the Mount Elbert well, included extensive core-derived sedimentologic (Rose et al., 2011), petrophysical (Winters et al., 2011), and geochemical (Lorenson et al., 2011; Torres et al., 2011) data, downhole open-hole log data (Lee and Collett, 2011), and gas hydrate reservoir engineering data (Anderson et al., 2011). A major component of the Mount Elbert research program was to assess the response of various downhole wireline logging tools to the presence of gas hydrate. Recent advancements in well log evaluation techniques allow for the quantitative assessment of gas hydrate accumulations using conventional downhole well log data (Lee et al.,1996; Collett and Lee, 2005; Kleinberg et al., 2005; Guerin and Goldberg, 2005; Lee and Collett, 2005; Sun and Goldberg, 2005; Lee and Collett, 2011). The primary goal of this paper is to present a detailed compi- lation of the downhole well log data from the drilled and cored stratigraphic section in the Mount Elbert well. This paper also contains descriptions and graphical portrayals of numerous well- log-calculated and core-derived reservoir properties. The focus of * Corresponding author. Tel.: þ1 303 236 5731. E-mail address: [email protected] (T.S. Collett). Contents lists available at ScienceDirect Marine and Petroleum Geology journal homepage: www.elsevier.com/locate/marpetgeo 0264-8172/$ e see front matter Published by Elsevier Ltd. doi:10.1016/j.marpetgeo.2010.03.016 Marine and Petroleum Geology 28 (2011) 561e577
Transcript of Downhole well log and core montages from the Mount Elbert Gas Hydrate Stratigraphic Test Well
lable at ScienceDirect
Marine and Petroleum Geology 28 (2011) 561e577
Contents lists avai
Marine and Petroleum Geology
journal homepage: www.elsevier .com/locate/marpetgeo
Downhole well log and core montages from the Mount Elbert Gas HydrateStratigraphic Test Well, Alaska North Slope
T.S. Collett a,*, R.E. Lewis b, W.J. Winters c, M.W. Lee a, K.K. Rose d, R.M. Boswell d
aU.S. Geological Survey, Denver Federal Center, MS-939, Box 25046, Denver, CO 80225, USAb Schlumberger, 713 Market Drive, Oklahoma City, OK 73114, USAcU.S. Geological Survey, 384 Woods Hole Road, Woods Hole, MA 02543, USAdU.S. Department of Energy e National Energy Technology Laboratory, Morgantown, WV 26507, USA
a r t i c l e i n f o
Article history:Received 9 December 2009Received in revised form12 March 2010Accepted 22 March 2010Available online 27 March 2010
Keywords:Gas hydrateAlaskaResourcesLogsCoreNorth SlopeDrilling
* Corresponding author. Tel.: þ1 303 236 5731.E-mail address: [email protected] (T.S. Collett).
0264-8172/$ e see front matter Published by Elseviedoi:10.1016/j.marpetgeo.2010.03.016
a b s t r a c t
The BPXA-DOE-USGS Mount Elbert Gas Hydrate Stratigraphic Test Well was an integral part of anongoing project to determine the future energy resource potential of gas hydrates on the Alaska NorthSlope. As part of this effort, the Mount Elbert well included an advanced downhole geophysical loggingprogram. Because gas hydrate is unstable at ground surface pressure and temperature conditions,a major emphasis was placed on the downhole-logging program to determine the occurrence of gashydrates and the in-situ physical properties of the sediments. In support of this effort, well-log and coredata montages have been compiled which include downhole log and core-data obtained from the gas-hydrate-bearing sedimentary section in the Mount Elbert well. Also shown are numerous reservoirparameters, including gas-hydrate saturation and sediment porosity log traces calculated from availabledownhole well log and core data.
Published by Elsevier Ltd.
1. Introduction
Under the Methane Hydrate Research and Development Act of2000 (renewed in 2005), the U.S. Department of Energy (DOE) hasfunded laboratory and field research on both Arctic and marine gashydrates. Among the Arctic studies, BP Exploration (Alaska), Inc.(BPXA) and the DOE have undertaken a project to characterize,quantify, and determine the commercial viability of gas hydratesresources in the Prudhoe Bay, Kuparuk River, and Milne Point fieldareas on the Alaska North Slope (ANS). In 2005, the analysis ofindustry acquired 3-D seismic data and existing downhole well logdata (enabled by collaborations with the U.S. Geological Survey(USGS) and the Bureau of LandManagement (BLM); Lee et al., 2011)identified more than a dozen discrete mapable gas hydrate pros-pects within the Milne Point area. Because the most favorable ofthose targets was a previously undrilled, fault-bounded gas hydrateaccumulation, BPXA and the DOE decided to drill a vertical strati-graphic test well at that location (named the “Mount Elbert”prospect) to acquire critical reservoir data needed to develop
r Ltd.
a longer-term production testing program (Hunter et al., 2011). TheAlaska, Milne Point area, BPXA-DOE-USGS Mount Elbert GasHydrate Stratigraphic TestWell (Mount ElbertWell) was completedin February 2007 and yielded one of the most comprehensivedatasets yet compiled on naturally-occurring gas hydrates.
Data collected from the Mount Elbert well, included extensivecore-derived sedimentologic (Rose et al., 2011), petrophysical(Winters et al., 2011), and geochemical (Lorenson et al., 2011;Torres et al., 2011) data, downhole open-hole log data (Lee andCollett, 2011), and gas hydrate reservoir engineering data(Anderson et al., 2011). A major component of the Mount Elbertresearch program was to assess the response of various downholewireline logging tools to the presence of gas hydrate. Recentadvancements in well log evaluation techniques allow for thequantitative assessment of gas hydrate accumulations usingconventional downholewell logdata (Leeet al.,1996;Collett andLee,2005; Kleinberg et al., 2005; Guerin and Goldberg, 2005; Lee andCollett, 2005; Sun and Goldberg, 2005; Lee and Collett, 2011).
The primary goal of this paper is to present a detailed compi-lation of the downhole well log data from the drilled and coredstratigraphic section in the Mount Elbert well. This paper alsocontains descriptions and graphical portrayals of numerous well-log-calculated and core-derived reservoir properties. The focus of

T.S. Collett et al. / Marine and Petroleum Geology 28 (2011) 561e577562
this paper is on two large-scale well log montage displays (Figs. 1and 2) which can be accessed through the online web version ofthis report at doi:10.1016/j.marpetgeo.2010.03.016. Fig. 1 containsa display of the “general”well-log and core-derived data along withwell-log calculated reservoir properties in the Mount Elbert well.Fig. 2 mainly displays “acoustic” well log and core data.
This paper begins with a review of the Mount Elbert operationaland well logging program, which is followed by a description of thewell log data processing performed before the well log data wasused to calculate reservoir properties. The next section of this papercontains a brief description of the well-log inferred gas hydrateoccurrences in the Mount Elbert well. The main body of the paperconsists of a track-by-track description of the well log data dis-played in Figs. 1 and 2. For clarification, the term “track” refers tothe data display columns in the enclosed well log montages. Thetrack-by-track descriptions contain discussions pertaining to thesource of the portrayed well log and core data, and when appli-cable, descriptions of the gas hydrate reservoir properties calcu-lated from the available well log measurements. It is important tohighlight that all depths noted throughout this paper are measuredfrom the rotary kelly bushing (RKB) on the drilling rig, which waslocated 55.18 ft (16.8 m) above sea level and 33.78 ft (10.3 m) abovethe ground surface. In this project all of the downhole log and coredata was measured in customary imperial units and for this reporthave been converted to SI metric units (for all depth measurementsit was assumed 1 m¼ 3.281ft).
2. Well site operations
The Mount Elbert gas hydrate stratigraphic test well wasdesigned as a 22-day programwith the planned acquisition of cores,well logs, and downhole reservoir pressure test data. To enableacquisition of high-quality core and downhole log data in a verticalwell, the well was spud on February 3, 2007 from a temporary icepad constructed east of the existing Milne Point Unit E productiongravel pad. The surface hole was drilled with water-based mud andwith logging-while-drilling (LWD) tools from surface through thepermafrost sectionwith a12¼-inch (31.1 cm)bit. OnFebruary 8, 9 5/8-inch (24.4 cm) surface casing was set and successfully cementedjust below the base of permafrost at a depth of 1952 ft (595 m). The‘main hole’ was then drilled using a fit-for-purpose mineral oil-based drilling fluid. Although this choice added both cost andadditional operational complexities, the drilling fluid could be keptchilled at or below 0 �C to mitigate the potential for gas hydratedissociation and hole destabilization and thereby preserve core, log,and reservoir pressure test data quality.
The well was then continuously cored from near the base of thecasing to a depth of 2494 ft (760 m) using the Reed Hycalog Corionwireline-retrievable coring system. In 23 total deployments, thissystem successfully recovered 430 ft (131 m) of high-quality 3-inch(7.6 cm) diameter core from 504 ft (154 m) of section (85% recoveryefficiency). The coring team processed these cores on site, andcollected subsamples for analyses of pore water geochemistry,microbiology, gas chemistry, petrophysical properties, and physicalproperties. Core samples were also stored in liquid nitrogen ortemporarily in pressure vessels for future study of the preserved gashydrates. Coring operations are discussed in detail in Hunter et al.(2011) and Rose et al. (2011).
After coring, the hole was deepened to 3000 ft (914 m), reamedto a diameter of 8 3/4 -inches (22.2 cm), and surveyed witha research-level wireline-logging program including neutron-density sediment porosities, nuclear magnetic resonance, dipoleacoustic and electrical resistivity logging, resistivity scanning,borehole electrical imaging, and advanced geochemistry logging
(Table 1; Fig. 3). The downhole wireline logging tools as describedin Table 1 were provided under a contract with Schlumberger.There were several failed attempts to collect log data with a SonicScanner* and Combinable Magnetic Resonance Tool* (CMR); thesetool failures were attributed primarily to the effect of the unusuallycold borehole conditions. Caliper data indicate that the hole wasalmost entirely within several centimeters of gauge, and virtuallyfully in gauge within the gas-hydrate-bearing intervals. Thisoutcome is due largely to the use of oil-based drilling fluid andsuccessful chilling of the drilling fluids with a surface heatexchanger (Hunter et al., 2011).
Following logging, reservoir pressure testing was conductedwith the Schlumberger Modular Formation Dynamic Tester* (MDT)at four open-hole stations in two hydrate-bearing sandstonereservoirs (for details on the testing program, see Anderson et al.,2011). Each test consisted of flow and shut-in periods of varyinglengths, with one lasting for more than 13 hours. Gas was producedfrom the gas hydrates in each of the tests.
3. Well log data processing
Schlumberger Well Logging Services was responsible for con-ducting all of the post-field well log data processing associatedwiththis project, and generated the well log and core data montages asdisplayed in Figs. 1 and 2.
The quality of thewell logs in the gas-hydrate-bearing portion ofthe Mount Elbert well is excellent. The post-field processing of thelog data from the Mount Elbert well consisted of (1) depthadjusting all logs to match gamma ray measurements collected inthe logging pass with the Platform Express* (PEX) (Run-2), (2)corrections specific to certain tools for the composition of thedrilling mud, (3) processing of the Dipole Shear Sonic Imager* (DSI)and the Combinable Magnetic Resonance Tool* (CMR) logs, (4)special processing of the Rt Scanner* log data, and (5) processingand interpretation of the Oil-Base Microimager* (OBMI) log.Specific tool corrections were performed on the gamma-ray,density, photoelectric, spectral gamma, and neutron porosity datato account for the composition of the drilling fluids. The DipoleShear Sonic Imager (DSI) post-field processing consisted of inter-actively extracting compressional- and shear-wave slownessesdirectly from the field recorded DSI wave-forms. The interactively-picked DSI slowness values were then used to calibrate the full DSIsignal array. Well log data quality control consisted of evaluatinganomalous and unrealistic values, which resulted in the geologicrecognition of several coal zones in the Mount Elbert well.
4. Well log-inferred gas hydrate
Gas hydrates were expected and found in two stratigraphiczones (Figs. 1 and 2), dan upper zone (unit D) containing 44 ft(w13.4 m) of gas-hydrate-bearing reservoir-quality sandstone, anda lower zone (unit C) containing 54 ft (w16.5 m) of gas-hydrate-bearing reservoir. Over 504 ft (154 m) of high quality cores wererecovered from the Mount Elbert well between 1990 and 2494 ft(606.5e760.1 m) (Rose et al., 2011). These cores have been thesubject of intensive petrophysical examination, the results of whichhave been used in thewell log montages associated with this reportto validate and calibrate the acquired downhole log data. The coredand logged gas hydrate occurrences (unit C 2132e2186 ft[649.8e666.3 m] and unit D 2016e2060 ft [614.4e627.9 m]) exhibitdeep electrical resistivity measurements ranging from about 50 to100 ohm-m and compressional-wave acoustic velocities (Vp)ranging from about 3.4 to 4.0 km/s. In addition, the measuredshear-wave acoustic velocities (Vs) of the gas-hydrate-bearing


T.S. Collett et al. / Marine and Petroleum Geology 28 (2011) 561e577564
horizons in theMount Elbert well ranged from about 1.1 to 1.8 km/s.Both units displayed gas hydrate saturations that varied withreservoir quality, with typical values between about 50% and 78% ofthe pore volume. Analysis of core samples indicates that the gas-hydrate-bearing stratigrahic units consist primarily of very finegrained, well sorted, and quartz-rich sandstones (Rose et al., 2011).Core-derived estimates of intrinsic (in the absence of gas hydrate)permeabilities are very high, in the multiple Darcy range (Winterset al., 2011). Porosities are also high, averaging 38% in unit D andreaching 40% within unit C. The NMR log indicates the presence ofmobile water, even in the most highly gas-hydrate saturatedintervals. In unit D, mobile water may be 8 to 10% of total porevolume. In the case of unit C it appears the mobile water phase mayexceed 15% of measured pore volume. The successful depressur-ization of the reservoir by fluid withdrawal during the MDT programconfirms this observation. Analysis ofMDT reservoir pressure tests ina variety of advanced reservoir simulators (reviewed by Andersonet al., 2011) has enabled an estimate of 0.12 to 0.17 mD for the in-situ effective permeability of the reservoir in the presence of the gashydrate phase, which compares favorably to the NMR log derivedreservoir permeabilities depicted in Fig. 1.
5. Mount Elbert gas hydrate reservoir properties e generalwell log and core montage
Thewell log and core data described in this section are displayedin Fig. 1 (available online at JMPG). The following descriptions areby tracks, labeled T1 through T31 in Fig. 1.
5.1. Track 1
LithostratigraphyTwo informal stratigraphic units (unit C 2132e2186 ft
[649.8e666.3 m] and unit D 2016e2060 ft [614.4e627.9 m]) areinterpreted to contain significant amounts of gas hydrate at the siteof the Mount Elbert stratigraphic test well (Lee and Collett, 2011;Rose et al., 2011). The cored and logged portion of the MountElbert well has been assigned to the Sagavanirktok Formation(Molenaar et al., 1987; Bird, 1998; Rose et al., 2011) and are age-equivalent with the more distal early Eocene marine shales andminor sands of the Mikkelsen Tongue of the Canning Formationfurther to the east. Using the terminology as proposed by Collett(1993), the Mount Elbert well cored and logged part of units Aand E, along with all of units B, C, and D as shown in Fig. 1.
5.2. Track 2
Completion conditionsAs shown in Track 2, the Mount Elbert well was first drilled and
cased (with a 9 5/8-inch [24.4 cm] diameter casing) to a depth of 1,952 ft (595 m). The 8 3/4-inch (22.2 cm) diameter ‘main hole’ wascored, reamed, and drilled to a total depth of 914 m (3000 ft). The“main hole” was not cased. Drill pipe conveyed formation pressuretesting (MDT test as reviewed by Anderson et al., 2011) wereconducted at four depths in the Mount Elbert well as depictedin Track 2: MDT Test C1 e 2161 ft (658.6 m), MDT Test C2 e 2151 ft(655.6 m), MDT Test D1 e 2047 ft (623.9 m), MDT Test D2 e 2025 ft(617.2 m).
5.3. Track 3
Measured depth (1900e3000 ft; 579.1e914.4m)The subsurface depths used in this display are measured from
the rotary kelly bushing (RKB) on the drilling rig, whichwas located55.18 ft (16.8 m) above sea level. The original well log data was
recorded in feet and later converted to meters as depicted in Track31 (Fig. 1).
Density standoff (DSOZ) (0e0.5 inches; 0e1.27 cm)The density standoff is the distance from the density sensor on
the Platform Express (PEX) to the borehole wall. Portions of theborehole inwhich the density sensor did not contact the wall of theborehole are highlighted.
Wireline tension (2000e4000 pound force e lbf)Wireline tension is the measurement of the downhole tension
applied to the logging tool string.
Cable speed (CS) (0e3000 ft/h; 0e914 m/h)CS in Track 3 is the measured cable speed from the Elemental
Capture Spectroscopy Sonde (ECS) tool run (Run-5).
5.4. Track 4
Computed gamma ray (0e150 API)The computed gamma ray log (CGR) is equal to the total stan-
dard gamma ray log count minus the gamma count associated withthe occurrence of uranium in the formation. The differencebetween the spectroscopy gamma ray and computed gamma ray ishighlighted (Uranium contribution).
Standard gamma ray (0e150 API)The standard gamma ray log (SGR) is the total natural gamma
ray count measured by the Hostile Natural Gamma Ray Sonde(HNGS) (Run-5).
Borehole drift (0e10 degrees)The directional drift of the borehole (obtained from the OBMI
log, Run-4), both the direction of drift and angle of incline relativeto vertical, is shown as a series of ‘tadpole’ plots. Each tadpoleconsists of a dot, positioned horizontally to show the angle ofincline (0e10�) and the direction of the long tail denotes theborehole drift direction (0e360�). The direction of the short taildenotes the direction of Pad-1 within the hole (0e360�).
Bit size (4e14 inches; 10.2e35.6 cm)The sub-permafrost gas-hydrate-bearing interval in the Mount
Elbert well was drilled and reamed with an 8 3/4 inch (22.2 cm)diameter drill bit.
Caliper (4e14 inches; 10.2e35.6 cm)The caliper log is a measure of hole diameter as determined
from caliper on Platform Express (PEX) (Run-1).
WashoutPortions of the wellbore that are enlarged relative to the size of
the drill bit are highlighted as washout zones between the plots ofthe drill bit size and borehole caliper. As shown, the caliper logmeasured a near-gauge hole throughout the gas-hydrate-bearinginterval.
MudcakePortions of the wellbore that are constricted relative to the size
of the drill bit are highlighted with increase mudcake between theplots of the drill bit size and the borehole caliper logs.
Rugosity (0e1 events per ft; 0e1 events per 0.30 m)The rugosity log displays the second derivative of the caliper log
with respect to depth from the Platform Express. The units areevents per depth.

T.S. Collett et al. / Marine and Petroleum Geology 28 (2011) 561e577 565
5.5. Track 5
Array induction resistivity AT10, AT20, AT30, AT60, AT90(0.2e2000 ohm-m)
The resistivity log traces AT10, AT20, AT30, AT60, and AT90depict five different measurements of formation electrical resis-tivities as measured by the Rt Scanner (ZAIT) tool on the PlatformExpress (Run-1), with AT90 being the deepest readingmeasurement and AT10 measuring only the shallow formationresistivity. The Rt Scanner (ZAIT) tool has six triaxial arrays, eachcontaining three co-located coils measuring resistivities atvarious depths into the formation. The high electrical resistivitiesrecorded in the interval from 2016 ft (614.4 m) to 2186 ft(666.3 m) are attributed to the occurrence of in-situ gas hydrate.The apparent overlapping nature of the deep and shallow resis-tivity logs indicates that the gas-hydrate-bearing formationsexperienced relatively little drilling disturbance and minimalinvasion of mud filtrate.
Apparent formation water resistivity (Rwa) (0.2e2000 ohm-m)The continuous well log plot of pore water resistivity in Track
5 has been derived from the Rt Scanner AT90 deep readingelectrical resistivity log. The pore water resistivity log is actuallyan “apparent” pore water resistivity (Rwa) log and it is consideredaccurate in only water saturated (no hydrocarbons) and clean(shale-free) reservoir-type rocks. Therefore, the apparent porewater resistivities within the log inferred gas-hydrate-bearingunits (unit C 2132e2186 ft [649.8e666.3 m] and unit D2016e2060 ft [614.4e627.9 m]) are not considered accuratewhere the conditions above are not met. The apparent formationwater resistivity (Rwa) was calculated with the followingequations:
Rwa ¼ f2Rt (1)
where Rt¼ deep resistivity; fdphi�ecs ¼ density porosity usinga ECS-derived matrix density with
fdphi�ecs ¼ rm�ecs � rbrm�ecs � rf
(2)
where rm�ecs ¼matrix density calculated from geochemical log(see Track 10, Fig. 1), rf ¼ fluid density assumed to be 1.0 g/cm3
(fresh water), rb ¼ bulk density measured with density log.
Core water resistivity (Rw) (0.2e2000 ohm-m)Pore water salinities as determined from the analysis of 44 pore
water samples collected from the cored interval (1990e2494 ft;606.5e760.1 m) in the Mount Elbert well (Torres et al., 2011) havebeen converted to “core measured” water resistivities (shown inTrack 5 as individual data points) through the Arps formula(Serra, 1984).
5.6. Track 6
Vertical resistivity (0.2e2000 ohm-m)Horizontal resistivity (0.2e2000 ohm-m)
The Rt Scanner (ZAIT) triaxial induction tool (Run-1) can beused to calculate vertical and horizontal formation resistivities(Rv and Rh, respectively) as depicted in Track 6. The sections ofthe borehole in which the Rt Scanner measured vertical resis-tivities (Rv) are greater than the horizontal resistivities (Rh) havebeen shaded between the two log curves. For the most part, themeasured vertical resistivities (Rv) are greater than the hori-zontal resistivities (Rh) in the gas-hydrate-bearing sedimentarysections.
5.7. Track 7
Electromagnetic attenuation (0e1000 dB/m)Electromagnetic propagation time (5e20 ns/m)
The Electromagnetic Propagation Tool* (EPT-G) run with thePlatform Express (Run-1) operates at a frequency of 1.1 GHz andmeasures both the attenuation (EATT) andpropagation time (TPL) ofan EPT-tool-emitted sinusoidal electromagnetic waves traveling inthe formation. In intervals containing gas hydrate, electromagneticwaves propagate like acoustic waves, with faster wave speeds orreduced propagation times (TPL) relative to water-bearing sedi-ments (Sun and Goldberg, 2005). The EATTof a formation, however,is mostly controlled by the porosity or total water content of theformation. Since gas hydrate is mostly composed of water (Collett,1998), gas hydrate has relatively little affect on the EPT-measuredEATT. Thus, the well plot of EATT (brown curve) and TPL (blue) inTrack 7 can be used to interpret the presence of gas hydrate. In anEATT-TPL ‘cross plot’, the log traces are shiftedhorizontally to overlieone another in water-saturated sand sections. Thus, stratigraphicintervals exhibiting low TPLs and apparent ‘crossovers’ with themeasured EATT (shaded with a stippled green color and labeled“Sand with hydrate”) are inferred to contain gas hydrate. The EPT-inferred gas hydrate occurrences compare favorably with thoseinterpreted from other more conventional well log measurements(i.e., electrical resistivity and acoustic transit time) in units C and D.TheEATT-TPL ‘cross plot’ also indicates thepresenceof gashydrate innumerous other intervals throughout the borehole. But there is nosupporting well log evidence for the occurrence of gas hydratesoutside of the resistivity and acoustic transit-time inferred hydrate-bearing sections in units C and D (unit C 2132e2186 ft[649.8e666.3 m] and unit D 2016e2060 ft [614.4e627.9 m]). Thisapparent discrepancy might be caused by the invasion of oil-baseddrilling fluids into the formation during drilling which results ina reduced EPT measured propagation time (TPL).
5.8. Track 8
Field neutron porosity (NPHI) (0e80%)Neutron-derived sediment porosities (thermal neutron poros-
ities assuming sandstone matrix) measured by the PlatformExpress (PEX) (Run-1) are shown in Track 8 of Fig. 1. This log hasbeen corrected for hole size and standoff only.
Corrected neutron porosity (NPHI-corrected) (0e80%)Neutron-derived sediment porosities (thermal neutron poros-
ities assuming sandstone matrix) corrected for hole size, standoff,pressure, temperature, mud salinity, and formation salinity areshown in Track 8 of Fig. 1.
Acoustic porosity (SPHI) (0e80%)Sonic-derived sediment porosities calculated using the Wyllie
time-average equation:
f ¼ tlog � tmtf � tm
(3)
where tlog¼ compressional slowness measured with DSI (Run-4);tm¼matrix slowness of 56 ms/ft (sandstone matrix); tf¼ fluidslowness of 189 ms/ft (fresh water).
Density porosity (DPHI) (0e80%)Sediment porosities have been calculated from the bulk density
log as measured by the Platform Express (PEX) (Run-1) using thestandard density-porosity relation (equation (5)):

T.S. Collett et al. / Marine and Petroleum Geology 28 (2011) 561e577566
f ¼ rm � rbrm � rw
(4)
where rb ¼ bulk density (g/cm3), rm ¼matrix density (g/cm3),rw ¼water density (g/cm3).
In equation (4), the density of the formation water (rw) wasassumed to be constant and equal to 1.00 g/cm3 and the matrix (orgrain) densities (rm) were calculated from geochemical log (seeTrack 10, Fig. 1). The density-log-derived porosities in the gas-hydrate-bearing units of the Mount Elbert well, average about 37%.
Total CMR porosity (0e80%)The Combinable Magnetic Resonance Tool (CMR) deployed
(Run-6) in the Mount Elbert well measured the amount of free,not molecularly bound, hydrogen nuclei in the formationdhydrogen in pore water (free and capillary bound), clay-boundwater, and hydrocarbons in the pore space. The total CMRporosity log plotted in Track 8 of Fig. 1 includes the contributionfrom all of the fluid volumes present in the formation. The CMR isinsensitive to the hydrogen in the gas hydrate because it ismolecularly bound. Total CMR porosities should be similar toboth the neutron- and density-log-derived porosities in water-bearing sandstone reservoirs.
Gas hydrateAs discussed in Collett et al. (2005) and shown in the description
of Track 14 of Fig. 1, total CMR porosity measurements and densitylog derived porosities can be used to estimate the concentration ofgas hydrate in a rock interval (i.e., from the amount that thedensity-derived porosity exceeds the CMR porosity). The well logplot ‘crossover’ of the total CMR and density derived porosities inTrack 8 of Fig. 1, highlighted with red hachures, depicts the gashydrate bulk volume (BV) in the Mount Elbert well as derived fromthe NMR-density logs.
5.9. Track 9
Formation density (RHOB) (1.5e3.0 g/cm3)The bulk formation density measured by the Platform Express
(PEX) (Run-1) in the Mount Elbert well is shown in Track 9 of Fig. 1(‘standard’ vertical resolution of w8 inches, 20 cm).
Enhanced resolution formation density (RHOI) (1.5e3.0 g/cm3)In addition to the formation density measurement with stan-
dard vertical resolution, the Platform Express (PEX) (Run-1) log runin the Mount Elbert well also yielded an “enhanced” resolutionformation density log that was recorded with a vertical resolutionof about w2 inches (w5 cm) (Track 9 of Fig. 1).
Density correction (DRHO) (�0.75 to þ0.25 g/cm3)The compensated litho-density tool, on the Platform Express
(PEX) (Run-1) is corrected for adverse borehole and various mud-cake conditions. The calculated density corrections are reported asa log trace and are depicted in Track 9 of Fig. 1.
Photoelectric factor (Pe) e standard resolution (ratio, 0e10)Photoelectric factor (Pe) e high resolution (ratio, 0e10)
The photoelectric factor log (Pe) in Track 9 of Fig. 1 has beenobtained from the compensated litho-density tool on the PlatformExpress (PEX) (Run-1). In gamma-gamma density logging, gammarays emitted from a source are scatted by the formation and loseenergy until absorbed through the photoelectric effect. The well-log-measured photoelectric effect or factor is a function of theaverage atomic number of the formation and can yield informationabout the formation lithology. The two photoelectric factor logs in
Track 9 of Fig. 1 have been shown both at ‘standard’ (w8 inches,w20 cm) and ‘enhanced’ (w2 inches, w5 cm) vertical resolution.
Core bulk density (1.5e3.0 g/cm3)Sediment bulk densities determined from nitrogen porosimetry
analysis (under in-situ confining pressure conditions) of 20 rocksamples collected from the cored interval of the Mount Elbert well(Winters et al., 2011) are shown as discrete values in Track 9 ofFig. 1.
Core gravimetric wet bulk density (MAD) (1.5e3.0 g/cm3)Sediment wet bulk densities determined from the analysis of
the water content and the mass of the solids in 47 rock samplescollected from the cored interval in the Mount Elbert well (Winterset al., 2011) are shown as discrete values in Track 9 of Fig. 1.
5.10. Track 10
Volumetric photoelectric factor (VPE) (0e30 barns/cm3)The volumetric photoelectric factor (cross section) of the forma-
tion (matrix and fluids), is the product of the photoelectric factor andformation density measured with the litho-density tool on the Plat-form Express log run (PEX) (Run-1). Note: 1 barn (b)¼ 10�28 m2.
Apparent volumetric photoelectric factor (VPE-apparent) (0e30barns/cm3)
The apparent volumetric photoelectric factor (cross section),depicted in track 10 of Fig. 1, represents a calculated volumetricphotoelectric factor of just the matrix. The well log-measuredapparent volumetric photoelectric factor provides informationabout the composition of the formation matrix.
ECS matrix density (ECS-RHOM) (1.5e3.0 g/cm3)The ECS-derived matrix density of the formation is calculated
using an empirical relationship developed by Herron and Herron(2000) that uses the elemental concentrations from theElemental Capture Spectroscopy Tool (ECS) (Run-5) as inputs. Thefollowing equation was used to produce this log:
rm�ecs ¼ 2:635þ0:0439Siþ0:2277Caþ1:992Feþ1:144S (5)
The elemental concentrations (Si, Ca, Fe, and S) are in weightfractions.
ELAN matrix density (ELAN-RHOM) (1.5e3.0 g/cm3)TheELANpetrophysical software calculates (described inTrack13,
Fig. 1) a formation matrix density every 6 in (w15 cm) over theintervalevaluated.Eachmineral isassignedamatrixdensity (Table2),and this value is multiplied by the mineral weight percent to derivethe formationmatrix density. The calculatedmatrix density does notinclude clay-bound water.
Core grain density (CORE-RHOM) (1.5e3.0 g/cm3)Core grain densities were determined from grain volume
measured by helium injection and dry sample mass of 20 rocksamples collected from the cored interval in the mount Elbert well(Winters et al., 2011), are shown as discrete values in Track 10 ofFig. 1.
Core gravimetric grain density (MAD-RHOM)(1.5e3.0 g/cm3)
Core-derived grain densities determined from helium injectionand the dry mass of solids in 47 rock samples collected from thecored interval in the Mount Elbert well (Winters et al., 2011) areshown as discrete values in Track 10 of Fig. 1.

T.S. Collett et al. / Marine and Petroleum Geology 28 (2011) 561e577 567
5.11. Track 11
Potassium concentration (0e10 wt %)Thorium concentration (0e20 ppm)Uranium concentration (0e10 ppm)
The Hostile Natural Gamma Ray Sonde* (HNGS) deployed in theMount Elbert well (Runs 5 and 6) uses weighted-least-squares pro-cessing algorithms to deconvolve the total gammaspectrum into thethree components of naturallyoccurringgamma-emitting radiation:uranium family, thorium family, and potassium-40. The spectralyield for each element is adjusted to provide aweight percent value.TheHNGSalso records a standardgammaray (SGR) andagammarayminus the uranium log (CGR) (Track 4; Fig.1). The spectral yields andcomputed gamma ray from the HNGS is mainly used to identifymineral types. Note that the concentration of potassium is given inweight-percent, while ppm standards for parts per million.
ECS-derived potassium concentration (0e10 weight percent)As discussed above, the Hostile Natural Gamma Ray Sonde
(HNGS) deployed in the Mount Elbert well (Runs 5 and 6) can beused to calculate the potassium content of sediments. TheElemental Capture Spectroscopy Sonde (ECS) (Run-5) also yieldssediment potassium concentrations as shown in Track 11 ofFig. 1. In general, the HNGS- and ECS-derived potassiumconcentrations compare favorably throughout most of theMount Elbert well.
5.12. Track 12
SpectroLith weight percents (0 to 100 weight percent)The Elemental Capture Spectroscopy Sonde (ECS) measures
relative elemental yields within the logged formation. Spec-troLith (as described by Herron and Herron, 1996) comprisesa series of equations that are used to transform the elementalvalues to mineral and rock weight percents: clay, quartz-feld-spar-mica (QFM), carbonate, pyrite, siderite, and coal (Track 12).The chlorite concentration is derived from the ELAN petrophys-ical model (Track 13) and it is plotted for comparison to XRD coreresults. These values are plotted in weight percent assuming noporosity. The weight percent iron is plotted from 0 to 25%. Thecolored red band indicates �1 standard deviation of themeasurement.
XRD core results (0 to 100 weight percent)The XRD core results (Rose et al., 2011) are plotted as cumulative
values to match the SpectroLith log format. These include chlorite,total clay (chloriteþ kaoliniteþ illiteþ illite/smectite), quartz-feldspar-mica (QFM: quartzþ K-sparþ plagioclase), carbonate(calciteþ dolomite), and pyrite. Carbonate was not detected withXRD so its value overplots the QFM.
5.13. Track 13
Free and capillary bound water (0e100%), carbonate (0e100%), gashydrate (0e100%), pyrite (0e100%), quartz (0e100%), coal (0e100%),clay-bound water (0e100%), illiteesmectite (0e100%), chlorite(0e100%)
To further evaluate the lithology and porosity of the gas-hydrate-bearing sedimentary section in the Mount Elbert well,various well log measurements have been used to constructdetailed mineralogic models of the cored and logged sedimentarysection at Mount Elbert site. The petrophysical model for theMountElbert well was developed with Schlumberger’s Elemental LogAnalysis* (ELAN) program (Mayer and Sibbit, 1980, Quirein et al.,1986). ELAN is a petrophysical interpretation program designed
for depth-by-depth quantitative formation evaluation from wire-line logs. ELAN estimates the volumetric fractions of user-definedrock matrix and pore constituents at each depth based on theknown log measurement responses to each individual constituent(Table 2). ELAN requires the pre-selection of the volume compo-nents present within the formation (i.e., fluids, minerals, androcks). For each component, the relevant response parameters foreach measurement are also required. For example, if it is assumedthat quartz is a volume component within the formation and thebulk density tool is used, then the bulk density parameter for thismineral is well known to be 2.65 g/cm3.
Table 2 lists the well log measurements used to construct themineralogical models for the sediments at Mount Elbert. Whenconsidering the well log data from the Mount Elbert well, theresponse equations consisted of the expected bulk density, neutronporosity, and iron concentration. The SpectroLith-derived (Track12) volumes for clay, quartz-feldspar-mica (quartz), carbonate,pyrite and coal were also used as direct inputs to the ELAN modelfor the Mount Elbert well.
The mineral assemblage that best achieved reasonable resultsfor the log data from the Mount Elbert well, compared to coreanalyses results discussed in Rose et al. (2011), consisted ofcarbonate, pyrite, quartz, coal, illite-smectite, and chlorite. Thevolume of clay-bound water was calculated as product of thevolume of clay minerals (illite and chlorite) derived from the ELANmodel output, that is each unit volume of illite and chloriterepresents the volume of water for a pure clay end point (e.g., 1volume illite contains 0.125 volume of clay-bound water and 1volume of chlorite contains 0.10 volume of clay-bound water).
The gas hydrate content in Track 13 (Fig. 1) was solved outside ofthe ELAN-Plus model by direct calculation from the NMR-densityporosity technique (Fig. 1, Track 14). The NMR-density-porosity-derived gas hydrate saturations were converted to weight fraction(WHYD) by the following equation:
WHYD ¼�fdphi�ecs � fTCMR
�rb
rhydrate (6)
where rhydrate ¼ gas hydrate grain density (0.91 g/cm3); rb ¼ bulkdensity from log (g/cm3); fdphi�ecs ¼ density porosity calculatedusing ECS-derivedmatrix density (%);fTMR ¼ total CMRporosity (%).
Note that in ELAN, the input values for weight percent of eachcomponent range from 0 or 1, with 1 equal to unity or 100%. Theinput log data for the volume of quartz, carbonate, pyrite, clay, andcoal (along with and their respective weight percents) werecalculated from the Elemental Capture Spectroscopy Sonde* (ECS)using the SpectroLith* methodology (Herron and Herron, 1996).These values are shown in Track 12 (Fig. 1). The SpectroLith weighpercent values (0 or 1) are used to constrain the calculated mineralor rock volumes into the appropriate predicted rock or fluid bin. Forexample, clay weight percent is assigned to both chlorite and illitebut not to any of the other volumes.
5.14. Track 14
Gas hydrate saturation (CMR-DEN) (0e100%)As discussed in the description of Track 8 (Fig. 1) and reviewed
in Lee and Collett (2011), total CMR-porosity measurements anddensity-log-derived porosities can be used to estimate theconcentration of gas hydrate in a rock interval. The well log plotcrossover of the total CMR and density-derived porosities in Track 8of Fig.1, highlightedwith red hachures, depicts the gas hydrate bulkvolume (BV), which has been plotted in Track 14 (Fig. 1) as a CMR-density porosity-derived gas hydrate saturation log (i.e., thepercent of pore-space occupied by gas hydrate).
T.S. Collett et al. / Marine and Petroleum Geology 28 (2011) 561e577568
Gas hydrate saturation (compressional-wave) (0e100%)Gas hydrate saturation (Shear-wave) (0e100%)
As described by Lee and Collett (2011), compressional- andshear-wave slowness data from the Dipole Shear Sonic Imager (DSI)(Run-4) can be used to calculate gas hydrate concentrations,included in Track 14 (Fig. 1).
Gas hydrate saturation (Resistivity) (0e100%)As described by Lee and Collett (2011), electrical-resistivity
well-log data measured by the Platform Express (PEX) (Run-1) canalso be used to calculate gas hydrate concentrations, included inTrack 14 (Fig. 1).
Gas hydrate saturation (ELAN) (0e100%)As described in the discussion of Track 13 (Fig. 1), ELAN-Plus
(Elemental Log Analysis) petrophysical modeling was also used toestimate gas hydrate saturations in the Mount Elbert well. Thisestimate is derived by the CMR-density hydrate saturation method,but in this calculation it is allowed to vary in response to other logmeasurements in the ELAN model.
Core-derived gas hydrate saturation (Core Sh linear) (linear Cl�
relationship) (0e100%)Core-derived gas hydrate saturation (Core Sh diffusion) (diffusion Cl�
relationship) (0e100%)Pore-water freshening in recovered conventional cores (i.e.,
not pressure cores) have been used to estimate gas hydratesaturations in numerous marine and permafrost-associated gashydrate studies (Tréhu et al., 2004; Tomaru et al., 2005). Torreset al. (2011) have also used core-derived pore-water chlorinityfreshening trends to estimate gas hydrate saturations in thecored section of the Mount Elbert well. Depicted in Track 14(Fig. 1) as discrete data points are two sets of 63 chlorinity (Cl�)derived gas hydrate saturation estimates, with one set assuminga linear background relationship and the second assuminga water chemistry profile that has been modified by permafrostformation as described by Torres et al. (2011). Gas hydratesaturations estimated from the core-derived chlorinity trendsagree with most of the downhole log-derived estimates when thegas hydrate occupies more than 20% of the pore space; however,the correlation in the stratigraphic section just below the unit Cand D well-log-inferred gas hydrate occurrences is less robust.Reasons for this discrepancy are still unclear, but may reflectproblems associated with the accurate selection of baselinereservoir conditions or pore-fluid chemistries in a complexsedimentary section.
5.15. Track 15
Gas hydrate saturation (EPT) (0e100%)Electromagnetic propagation well log (Run-1, EPT-G) data was
used to measure in-situ dielectric properties of natural gashydrate in the Mount Elbert well (Fig. 1, Track 7). Sun et al. (2011)were able to calculate gas hydrate saturations from the deriveddielectric constants and density logs. The gas hydrate saturationlog derived from the NMR-density porosity method (Track 14,Fig. 1) has also been included in Track 15 (Fig. 1) for comparisonpurposes. The electromagnetic log yields similar gas hydratesaturations to the NMR-density log-derived values within theportions of units C and D sands that were inferred to contain gashydrate from other well log measurements (i.e., electrical resis-tivity and acoustic transit time). The electromagnetic-log-derivedgas hydrate saturations, however, remain highly variable andoften high throughout most of the logged section depicted inTrack 15 of Fig. 1 (EPT-derived gas hydrate saturation log is
truncated below a depth of 2220 ft [677 m]). The reason for theapparent discrepancy between the electromagnetic-log-derivedgas hydrate saturations and all of the other downhole-log-derivedgas hydrate saturations as depicted in Tracks 14 and 15 of Fig. 1 isnot known. As discussed in Track 7, however, this apparentdiscrepancy might be caused by the invasion of oil-based drillingfluids into the formation during drilling which results in a reducedEPT measured propagation time TPL. It is reasonable to assumethat the highly variable electromagnetic-log-derived gas hydratesaturations, outside of the well documented unit C and D gashydrate occurrences, are likely erroneous.
Gas hydrate saturation (CMR-DEN) (0e100%)The CMR-density-derived gas hydrate saturation log plot from
Track 14 (Fig. 1) has been included in Track 15 (Fig. 1) for compar-ison purposes.
5.16. Track 16
Formation temperature (25 to 75 �F, �4 to 24 �C)Plotted in Track 16 of Fig. 1 is a borehole equilibrated formation
temperature profile, as measured in the Milne Point Unit D-2 well(http://esp.cr.usgs.gov/data/bht/alaska/), which is locatedw2miles(w3.2 km) north of the Mount Elbert well.
Hydrostatic pressure (0e2000 psi, 0e13,790 kPa)Limited pore pressure data from onshore wells on the Alaska
North Slope suggest near hydrostatic pore pressure conditionsimmediately below the base of permafrost (Collett, 1993). There-fore, an assumed hydrostatic pore pressure gradient of 0.433 psi/ft(9.795 kPa/m) is plotted in Track 16 of Fig. 1.
Gas hydrate stability zoneAlso shown in Track 16 of Fig. 1 is the depth limit (2853 ft;
869.6 m) of the gas hydrate stability zone.
5.17. Track 17
Total gas (0e5000 Units)Methane (0e250,000 ppm)
Track 17 of Fig. 1 contains a ‘total gas’ log and the gas chro-matographic log of methane from the mud log report for theMountElbert well (Hunter et al., 2011). The total gas log is plotted in mudlogging ‘Units’, while the gas chromatographic data is reported inparts per million (ppm). The mud gas log of both total gas andmethane appear to be shifted downward from the resistivity andacoustic log inferred gas hydrate occurrences in units C and D. Thereason for this apparent depth shift is unknown; however, it cannotbe easily attributed to a drilling fluid return lag-time calculationerror because the magnitude of the shift is too great.
5.18. Track 18
Total CMR porosity (0e60%)CMR porosity >3 ms (0e60%)CMR free fluid (0e60%)
As discussed above in the description of Track 14 (Fig. 1), theNMR-recorded transverse-magnetization-relaxation time (T2) ofa formation depends on the relaxation characteristics of thehydrogen-bearing substances in the rock formation. For example,T2 for hydrogen nuclei in solids is very short, whereas T2 forhydrogen nuclei in fluids can vary from tens to hundreds of milli-seconds, depending on fluid viscosities and interactions withnearby surfaces. In standard NMR borehole logging, the T2 relaxa-tion signal is divided into a series of time windows, with each


Fig. 3. Schematic diagram of Schlumberger logging tool strings used in the sub-permafrost section of the BPXA-DOE-USGS Mount Elbert Gas Hydrate Stratigraphic Test Well: (a)Run-1: Platform Express (PEX/HILTB), RT-Scanner (ZAIT), Electromagnetic Propagation Tool (EPT-G), Gamma Ray Log (GR), Litho Density, Compensated Neutron Porosity (CNT),General Inclinometry Tool (GPIT), High-Resolution Mechanical Sonde (HRMS); (b) Run-4: Dipole Shear Sonic Imager (DSI/DSST-P), Oil-Base Microimager Tool (OBMI), GeneralInclinometry Tool (GPIT), Gamma Ray Log (GR); (c) Runs-5 and -6: Combinable Magnetic Resonance Tool (CMR), Hostile Natural Gamma Ray Sonde (HNGS), Elemental CaptureSpectroscopy Sonde (ECS). Most of the acronyms used on the tool schematics have been further defined in Table 1, additional information about each tool can be found on thefollowing web site http://www.slb.com/modules/mnemonics/index.aspx.
T.S. Collett et al. / Marine and Petroleum Geology 28 (2011) 561e577570
representing a portion of the T2 signal that can be attributed to thevarious ‘types’ of water within a porous rock unit (i.e., clay-boundwater, capillary-bound water, and free water). Generally, clay-bound water is believed to be characterized by T2 relaxation timesranging from 0.3 to 3 msec (shown as the water volume betweenthe plot of total CMR porosity and CMR porosity >3 ms, shaded inolive-green in Track 18 of Fig. 1). The T2 relaxation time for capil-lary-bound water in Track 18 (Fig. 1) falls between the plot of theCMR porosity >3 ms and the CMR free fluid porosity, which isshaded yellow. The volume of mobile free-water in the formation isdepicted by the plot of the CMR free fluid porosity log and has blueshading. The T2 cutoff between free water and capillary-boundwater was estimated to be 33 ms, a typical value for a sandstonereservoir.
5.19. Track 19
T2 amplitude distribution (relative scale, 0e29)T2 cutoff (0.3e3000 ms)T2 logarithmic mean (0.3e3000 ms)
As discussed in the descriptions of Tracks 14 and 18 (Fig. 1), oneof the primary functions of NMR downhole logging tools are tomeasure the signal associated with the transverse relaxation time,T2. The plot of the T2 amplitude distribution in Track 15, highlightedin green, depicts the CMR-recorded (Run-6) T2 signal amplitudes asa function of relaxation time. It is calculated every 6-in in the logprocessing but displayed every 3-ft in this track. The plot of the T2logarithmic means in Track 15 (orange curve) represent the loga-rithmic mean value of the recorded T2 relaxation time for each
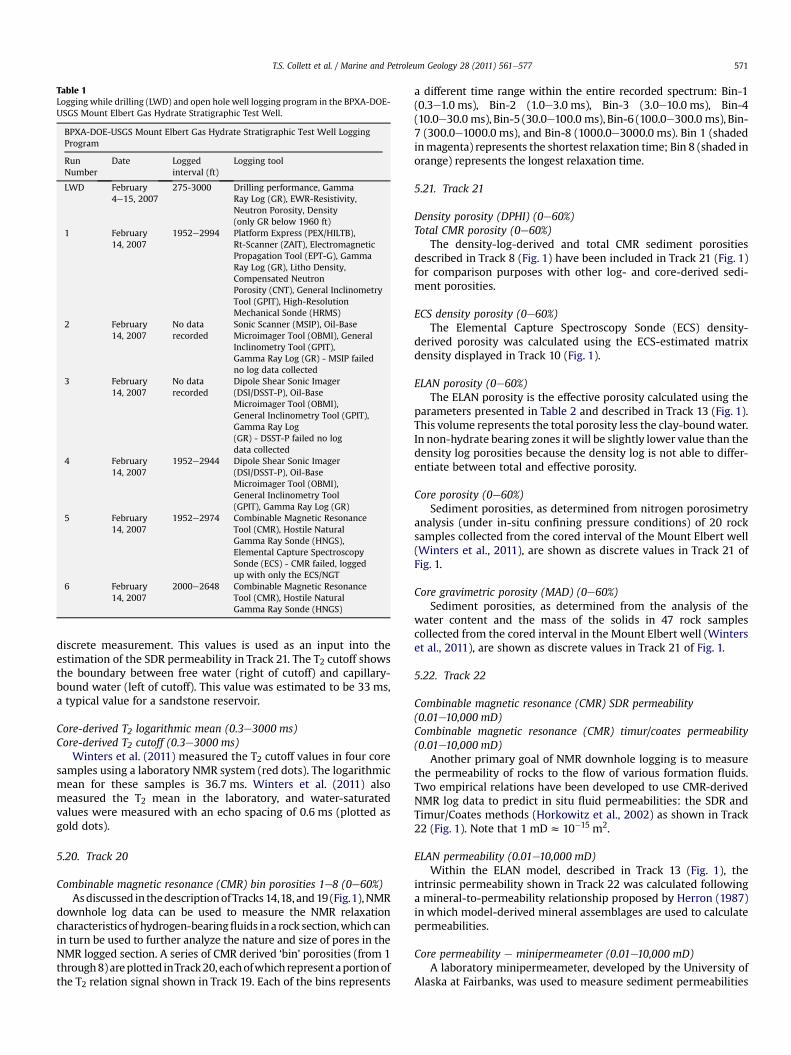
Table 1Logging while drilling (LWD) and open hole well logging program in the BPXA-DOE-USGS Mount Elbert Gas Hydrate Stratigraphic Test Well.
BPXA-DOE-USGS Mount Elbert Gas Hydrate Stratigraphic Test Well LoggingProgram
RunNumber
Date Loggedinterval (ft)
Logging tool
LWD February4e15, 2007
275-3000 Drilling performance, GammaRay Log (GR), EWR-Resistivity,Neutron Porosity, Density(only GR below 1960 ft)
1 February14, 2007
1952e2994 Platform Express (PEX/HILTB),Rt-Scanner (ZAIT), ElectromagneticPropagation Tool (EPT-G), GammaRay Log (GR), Litho Density,Compensated NeutronPorosity (CNT), General InclinometryTool (GPIT), High-ResolutionMechanical Sonde (HRMS)
2 February14, 2007
No datarecorded
Sonic Scanner (MSIP), Oil-BaseMicroimager Tool (OBMI), GeneralInclinometry Tool (GPIT),Gamma Ray Log (GR) - MSIP failedno log data collected
3 February14, 2007
No datarecorded
Dipole Shear Sonic Imager(DSI/DSST-P), Oil-BaseMicroimager Tool (OBMI),General Inclinometry Tool (GPIT),Gamma Ray Log(GR) - DSST-P failed no logdata collected
4 February14, 2007
1952e2944 Dipole Shear Sonic Imager(DSI/DSST-P), Oil-BaseMicroimager Tool (OBMI),General Inclinometry Tool(GPIT), Gamma Ray Log (GR)
5 February14, 2007
1952e2974 Combinable Magnetic ResonanceTool (CMR), Hostile NaturalGamma Ray Sonde (HNGS),Elemental Capture SpectroscopySonde (ECS) - CMR failed, loggedup with only the ECS/NGT
6 February14, 2007
2000e2648 Combinable Magnetic ResonanceTool (CMR), Hostile NaturalGamma Ray Sonde (HNGS)
T.S. Collett et al. / Marine and Petroleum Geology 28 (2011) 561e577 571
discrete measurement. This values is used as an input into theestimation of the SDR permeability in Track 21. The T2 cutoff showsthe boundary between free water (right of cutoff) and capillary-bound water (left of cutoff). This value was estimated to be 33 ms,a typical value for a sandstone reservoir.
Core-derived T2 logarithmic mean (0.3e3000 ms)Core-derived T2 cutoff (0.3e3000 ms)
Winters et al. (2011) measured the T2 cutoff values in four coresamples using a laboratory NMR system (red dots). The logarithmicmean for these samples is 36.7 ms. Winters et al. (2011) alsomeasured the T2 mean in the laboratory, and water-saturatedvalues were measured with an echo spacing of 0.6 ms (plotted asgold dots).
5.20. Track 20
Combinable magnetic resonance (CMR) bin porosities 1e8 (0e60%)Asdiscussed in thedescriptionofTracks14,18, and19 (Fig.1),NMR
downhole log data can be used to measure the NMR relaxationcharacteristics of hydrogen-bearingfluids in a rock section,which canin turn be used to further analyze the nature and size of pores in theNMR logged section. A series of CMR derived ‘bin’ porosities (from 1through8)areplotted inTrack20, eachofwhich representaportionofthe T2 relation signal shown in Track 19. Each of the bins represents
a different time range within the entire recorded spectrum: Bin-1(0.3e1.0 ms), Bin-2 (1.0e3.0 ms), Bin-3 (3.0e10.0 ms), Bin-4(10.0e30.0 ms), Bin-5 (30.0e100.0 ms), Bin-6 (100.0e300.0 ms), Bin-7 (300.0e1000.0 ms), and Bin-8 (1000.0e3000.0 ms). Bin 1 (shadedinmagenta) represents the shortest relaxation time; Bin 8 (shaded inorange) represents the longest relaxation time.
5.21. Track 21
Density porosity (DPHI) (0e60%)Total CMR porosity (0e60%)
The density-log-derived and total CMR sediment porositiesdescribed in Track 8 (Fig. 1) have been included in Track 21 (Fig. 1)for comparison purposes with other log- and core-derived sedi-ment porosities.
ECS density porosity (0e60%)The Elemental Capture Spectroscopy Sonde (ECS) density-
derived porosity was calculated using the ECS-estimated matrixdensity displayed in Track 10 (Fig. 1).
ELAN porosity (0e60%)The ELAN porosity is the effective porosity calculated using the
parameters presented in Table 2 and described in Track 13 (Fig. 1).This volume represents the total porosity less the clay-boundwater.In non-hydrate bearing zones it will be slightly lower value than thedensity log porosities because the density log is not able to differ-entiate between total and effective porosity.
Core porosity (0e60%)Sediment porosities, as determined from nitrogen porosimetry
analysis (under in-situ confining pressure conditions) of 20 rocksamples collected from the cored interval of the Mount Elbert well(Winters et al., 2011), are shown as discrete values in Track 21 ofFig. 1.
Core gravimetric porosity (MAD) (0e60%)Sediment porosities, as determined from the analysis of the
water content and the mass of the solids in 47 rock samplescollected from the cored interval in the Mount Elbert well (Winterset al., 2011), are shown as discrete values in Track 21 of Fig. 1.
5.22. Track 22
Combinable magnetic resonance (CMR) SDR permeability(0.01e10,000 mD)Combinable magnetic resonance (CMR) timur/coates permeability(0.01e10,000 mD)
Another primary goal of NMR downhole logging is to measurethe permeability of rocks to the flow of various formation fluids.Two empirical relations have been developed to use CMR-derivedNMR log data to predict in situ fluid permeabilities: the SDR andTimur/Coates methods (Horkowitz et al., 2002) as shown in Track22 (Fig. 1). Note that 1 mDz 10�15 m2.
ELAN permeability (0.01e10,000 mD)Within the ELAN model, described in Track 13 (Fig. 1), the
intrinsic permeability shown in Track 22 was calculated followinga mineral-to-permeability relationship proposed by Herron (1987)in which model-derived mineral assemblages are used to calculatepermeabilities.
Core permeability e minipermeameter (0.01e10,000 mD)A laboratory minipermeameter, developed by the University of
Alaska at Fairbanks, was used to measure sediment permeabilities

T.S. Collett et al. / Marine and Petroleum Geology 28 (2011) 561e577572
on 658 frozen core samples from the Mount Elbert well (no gashydrate was preserved in the cores); these data are shown asdiscrete values in Track 22 of Fig. 1. This contact measurement tooluses air to measure the permeability of the sample without anyconfining pressure.
Core nitrogen permeability at confining pressure (0.01e10,000 mD)Laboratory measured sediment permeabilities to nitrogen gas
under confining pressure conditions were determined for 20 coresamples that did not contain gas hydrate when analyzed in thelaboratory (Winters et al., 2011); these data are shown as discretevalues in Track 22 of Fig. 1.
Core Klinkenberg permeability at confining pressure(0.01e10,000 mD)
Klinkenberg permeabilities are calculated from laboratorypermeability tests under confining pressure conditions usingnitrogen. A total of 20 Klinkenberg permeabilities were calculated(Winters et al., 2011); these data are shown as discrete values inTrack 22 of Fig. 1.
5.23. Track 23
Core sediment logTrack 23 contains a graphical depiction of the major core-
derived sediment types as described in Rose et al. (2011). For thecomplete lithostratigraphic montage and more information on thecolor coding and symbols used in the core sediment log see the‘explanation’ associated with the sediment log in Rose et al. (2011).
5.24. Track 24
Core samples: clay size (0e100%), silt size (0e100%), and sand size(0e100%)
Sediment grain size (i.e., clay, silt, and sand size), as determinedby laser light diffraction analysis of 134 sediment samples collectedfrom the cored interval in the Mount Elbert well (Winters et al.,2011), is shown both as discrete values (i.e., core points) and aslog traces in Track 24 of Fig. 1. An additional 273 sediment grain sizemeasurements, also using laser light diffraction analysis, wereconducted as part of the detailed lithostratigraphic description ofthe core by Rose et al. (2011); these analysis are shown as onlydiscrete values (i.e., core points).
5.25. Track 25
Oil-base microimager tool (OBMI) dynamic imageThe Oil-BaseMicroimager Tool (OBMI) (Run-4) produces oriented
electrical images of the borehole wall in nonconductive (oil-base)mud. This can be used for detailed sedimentological and structuralinterpretations (Amer and Alexander, 2005). It is also possible to usethe OBMI to obtain high-resolution electrical images of gas hydratesin the wellbore, thus yielding information about the nature andtexture of gas hydrate occurrence in a rock interval. The OBMI toolhas four pads that contain five pairs of electrodes on each pad face,with a vertical image resolution of 0.5 inch (w1.3 cm) and imagecoverage of w32% in a 8.0 inch (w20.3 cm) borehole. The OBMI hasa shallow depth of investigation of w4.0 inches (w10.2 cm), whichmay theoretically allow the OBMI to directly measure in-situ gashydrates. AC current is focused into the formation from each pair ofelectrodes. The voltage drop across the pair is used to quantifyformation microresistivity. The computed values for each electrodepair, which reflect microresistivity variations of the formation, areconverted into high resolution brown-scale (or color) images ofvariable intensity. Black and yellow (or darkest and lightest color)
indicate the low and high microresistivity respectively. The OBMItool string contains a General Purpose Inclinometry Tool* (GPIT) thatorients the resistivity measurements through the use of an acceler-ometer and magnetometer responding to the declination and incli-nation of the Earth’s magnetic field. The raw data are processed inreal-time during logging to transform individual microresistivitytraces into oriented images. Detailed processing and interpretationof the OBMI resistivity images in combination with other log andcore data was carried out in post-field studies by SchlumbergerWellLogging Services.
To further assess the nature of in-situ gas hydrate occurrences,the OBMI images from the interval of well log-inferred gas hydratesin the Mount Elbert well were reprocessed and examined. TheOBMI image in Track 25 (Fig. 1) was generated with GeoFrame*software, a Schlumberger well log data processing package. OBMIlog processing followed standard procedures that included, amongother, a series of logging tool speed corrections. The OBMI image inTrack 25 (Fig. 1) was generated in ‘dynamic’mode, where the imageis normalized such that all 42 shades of yellow to black are depictedwithin an approximately 2 ft (w0.6 m) sliding depth window.Dynamic normalization permits the depiction of fine sedimentarystructures within zones that have limited differences in electricalconductivity. The OBMI image is characterized by light colored(high resistivity) to dark colored (low resistivity) bands, which inmany cases can be traced across the entire display. These contin-uous bands likely represent distinct stratigraphic units withthicknesses ranging between 4e20 inches (w10.2e50.8 cm). TheOBMI imaged light colored stratigraphic beds within the hydrate-bearing portions of units C (2132e2186 ft; 649.8e666.3 m) and D(2016e2060 ft; 614.4e627.9 m;) are likely intervals of relativelyhigh gas hydrate saturations.
5.26. Track 26
Oil-base microimager tool (OBMI) bed boundary true dipThe Oil-Base Microimager Tool (OBMI) (Run-4) data were eval-
uated to identify and characterize sedimentary bed boundaries. Bedorientation was computed over the entire logged interval throughan automated process that correlates features in microresistivitycurves generated by the OBMI electrode pairs. Structural orienta-tions for these computed dips (Track 26) are depicted as black‘arrows’ or ‘tadpoles’, in which each arrow consists of a dot, posi-tioned horizontally to show the angle of dip (0e90�) and thedirection of the arrow denotes the dip direction (azimuth). Filleddip symbols have a greater level of quality than those with no fill. Amanual analysis was also performed on a workstation to check thecomputed dips and also to fill in depth gaps. The manually selecteddips are denoted by green tadpoles. Also depicted in Track 26(Fig. 1) are ‘rose diagrams’ or ‘fan plots’ for the computed dips, witheach circular (green) plot graphically representing the sedimentarybed boundary structural orientations over a 50 ft (w15.2 m) portionof the borehole whose boundaries are shown by green diamonds inthe center of the plot.
5.27. Track 27
Rt scanner bed boundary true dipAs discussed in Track 5 (Fig. 1), the Rt Scanner tool on the
Platform Express (Run-1) has six triaxial arrays, each containingthree co-located coils making oriented resistivity measurements atvarious depths into the formation. The Rt Scanner-derived three-dimensional resistivity model of the near-borehole formation wasanalyzed on aworkstation to identify and characterize sedimentarybed boundaries. Structural orientations at three specific depths (39inches or w99.1 cm, 54 inches or w137.2 cm, and 72 inches or

T.S. Collett et al. / Marine and Petroleum Geology 28 (2011) 561e577 573
w182.9 cm) into the borehole wall are depicted in Track 27 (Fig. 1)as ‘arrows’ or ‘tadpoles’, in which each arrow consists of a dot,positioned horizontally to show the angle of dip (0e90�) and thedirection of the arrow denotes the dip direction (azimuth) at thereferenced depth in the formation as indicated by the color of theentire tadpole. The color of the tadpole dot reflects the number ofbed boundary measurements used to generate each tadpole. Alsodepicted in Track 27 (Fig. 1) are ‘rose diagrams’ or ‘fan plots’, witheach circular (green) plot graphically representing the sedimentarybed boundary structural orientations at 72 inches (w182.9 cm) intothe formation over the same 50 ft (w15.2 m) portion of the bore-hole as was computed for Track 26.
5.28. Track 28
Oil-base microimager tool (OBMI) static imageAs previously discussed in the description of Track 25 (Fig. 1),
the Oil-Base Microimager Tool (OBMI) (Run-4) produces images ofthe microresistivity character of the borehole wall that can be usedfor detailed sedimentological and structural interpretations. It isalso possible to use the OBMI log to produce high-resolution elec-trical images of gas hydrates.
To further assess the nature of in situ gas hydrate occurrences inthe Mount Elbert well, the OBMI image was reprocessed and stat-ically normalized such that the entire log was treated as one unitand themicroresistivities were placed into 42 separate color shadesranging from yellow to black. Therefore, any zones within the logwith the same shade of color will have similar resistivities, unlikethe dynamic normalization presentation. In comparison to the‘dynamic’ processed OBMI log display in Track 25 (Fig. 1), the ‘static’processed OBMI display in Track 28 (Fig. 1) is a less detailed imageof the formation; but the gas-hydrate-bearing sections in units Cand D can be readily identified.
5.29. Track 29
Cored sectionThe Mount Elbert well was continuously cored within the depth
interval from 1990 ft (606.5 m) to 2494 ft (760.1 m) using the ReedHycalog Corion wireline-retrievable coring system. A total of 23cores (430 ft or 131 m of core) were recovered as depicted in Track29 (Fig. 1). The core sections shown in white depict the portion ofthe core not recovered.
5.30. Track 30
Standard gamma ray (0e150 API)The standard gamma ray log is the total natural gamma ray
count measured by the Hostile Natural Gamma Ray Sonde (HNGS)(Run-5).
Core gamma ray (0e150 API)After the completion of field operations, the Mount Elbert cores
were shipped to Anchorage, Alaska for storage and further analysis.A core-gamma ray scan device was used to obtain a ‘core gammaray log’, which was compared to the downhole acquired gamma raylog to help calibrate the log-to-core depths (Rose et al., 2011). Basedon the review and analysis of the core based data (e.g., lithostrati-graphic composite log, core gamma ray log) versus the boreholewireline log data, a uniform �3 ft (�0.9 m) depth shift was appliedto the Mount Elbert core data relative to the wireline log data. Thecore gamma ray data in this track has been depth shifted. All coredata points depicted on the two well log and core montages (Figs. 1and 2) have been depth shifted to match the downhole wireline logdepths.
5.31. Track 31
Measured depth (1900e3000 ft; 579.1e914.4m)The subsurface depths used in this display are measured from
the rotary kelly bushing (RKB) on the drilling rig, which was located55.18 ft (16.8 m) above sea level. The original well log data wasrecorded in feet and later converted to meters as depicted in Track31 (Fig. 1).
6. Mount Elbert gas hydrate reservoir properties e acousticwell log and core montage
Thewell log and core data described in this section are displayedin Fig. 2 (available online at JMPG). All of the acoustic log data,unless otherwise noted, were depth shifted to match the log data inFig. 1. The following descriptions are by tracks, labeled T1 throughT24 in Fig. 2.
6.1. Tracks 1-2
Tracks 1 and 2 in Fig. 2 are the same as Tracks 1 and 2 in Fig. 1;they have been included in Fig. 2 to allow cross referencingbetween the two montages.
6.2. Track 3
Track 3 in Fig. 2 is nearly the same as Track 3 in Fig. 1; however,in Fig. 2 the standard resolution density standoff log has beenremoved and the measured cable speed log (CS) from the DipoleShear Sonic Imager (DSI) tool run (Run-4) has been substituted. Thesubsurface depths used in this display aremeasured from the rotarykelly bushing (RKB) on the drilling rig, which was located 55.18 ft(16.8 m) above sea level. The original well log data was recorded infeet and later converted to meters as depicted in Track 24 (Fig. 2).
6.3. Track 4
Track 4 in Fig. 2 is nearly the same as Track 4 in Fig. 1. In Fig. 2,however, the standard caliper log has been replaced with twoorthogonal calipers (Caliper-1 and Caliper-2) as measured with thefour-arm Oil-BaseMicroimager Tool (OBMI) (Run-4). Track 4 (Fig. 2)also includes a plot of the ‘Pad-1’ azimuth orientation from theGeneral Purpose Inclinometry Tool (GPIT) on the OBMI log run(Run-4).
6.4. Tracks 5e6
Tracks 5 and 6 in Fig. 2 are the same as Tracks 5 and 6 in Fig. 1.
6.5. Track 7
Track 7 in Fig. 2 contains a collection of well logs and core datavalues that also appear in Tracks 18 and 21 of Fig. 1. In Track 7 ofFig. 2, red hachures have been added to the ‘crossover’ between theplot of the total CMR and ELAN total porosity, which depicts the gashydrate bulk volume (BV). The ELAN total porosity is the same asthe ELAN porosity in Track 21 of Fig. 1 except it also includes theclay-bound water.
6.6. Track 8
The CMR-DEN gas hydrate saturation curve is the same as thatdepicted in both Tracks 14 and 15 of Fig. 1.

Table 2Response equations (expected well log values) for the each of the mineral phases (listed along the top of the table) considered in the ELAN-Plus mineral modeling effort (Fig. 1,Track 9). The weight percent of each component are listed ranging from 0 to 1, with 1 equal to unity or 100%.
ELAN input log data Water Coal Hydrate Chlorite Illite Pyrite Carbonate Quartz
Density (g/cm3) 1.006 1.24 0.91 2.81 2.61 4.99 2.61 2.65Neutron porosity (%) 1 0.7 1.06 0.58 0.45 0.008 0 -0.021Iron e Fe (weight %) 0 0 0 0.21 0.05 0.466 0.001 0Quartz (weight %)a 0 0 0 0 0 0 0 1Carbonate (weight %)a 0 0 0 0 0 0 1 0Pyrite (weight %)a 0 0 0 0 0 1 0 0Clay (weight %)a 0 0 0 1 1 0 0 0Coal (weight %)a 0 1 0 0 0 0 0 0Hydrate (weight %)b 0 0 1 0 0 0 0 0
a SepctroLith derived log values (assigned values).b Calculated outside of ELAN (assigned values).
T.S. Collett et al. / Marine and Petroleum Geology 28 (2011) 561e577574
6.7. Track 9
Track 9 in Fig. 2 is the same as Track 13 in Fig. 1.
6.8. Track 10
Track 10 in Fig. 2 is the same as Track 28 in Fig. 1.
6.9. Track 11
Track 11 in Fig. 2 is the same as Track 26 in Fig. 1.
6.10. Track 12
Compressional-wave velocity (5000e12,000 ft/s; approximately1.5e3.7 km/s)
The compressional-wave velocity log depicted in Track 12(Fig. 2) has been derived from the compressional-wave coherenceplot in Track 14 (Fig. 2), which was obtained by the Dipole ShearSonic Imager (DSI) (Run-4). The high compressional-wave veloci-ties recorded in unit C (2132e2186 ft; 649.8e666.3 m) and unit D(614.4e627.9 m; 2016e2060 ft) have been attributed to theoccurrence of in situ gas hydrate.
Fast shear-wave velocity (1000e8000 ft/s; approximately0.3e2.4 km/s)
The shear-wave velocity log (in the fast shear-wave direction)depicted in Track 12 (Fig. 2) has been derived from the shear-wavecoherence plot in Track 15 (Fig. 2), which was obtained by theDipole Shear Sonic Imager (DSI) (Run-4). The high shear-wavevelocities recorded in unit C (2132e2186 ft; 649.8e666.3 m) andunit D (2016e2060 ft; 614.4e627.9 m) have been attributed to theoccurrence of in situ gas hydrate. The methods used to derive thefast and slow shear-wave velocities are further reviewed below inthe descriptions of Tracks 17, 18, and 19 (Fig. 2).
Stoneley-wave velocity (500e4000 ft/s; approximately 0.2e1.2 km/s)The Stoneley-wave velocity log depicted in Track 12 (Fig. 2) has
been derived from the Stoneley-wave coherence plot in Track 16(Fig. 2), which was obtained by the Dipole Shear Sonic Imager (DSI)log run (Run-4).
6.11. Track 13
Compressional-wave slowness (40e180 micro-sec/ft; approximately131e591 micro-sec/m)
The compressional-wave slowness log depicted in Track 13(Fig. 2) has been derived from the compressional-wave coherence
plot in Track 14 (Fig. 2), which was obtained by the Dipole ShearSonic Imager (DSI) (Run-4).
Shear-wave slowness of fast shear waves (150e850 micro-sec/ft;approximately 492e2789 micro-sec/m)
The shear-wave slowness (in the fast shear-wave direction)log depicted in Track 13 (Fig. 2) has been derived from the shear-wave coherence plot in Track 15 (Fig. 2), which was obtained bythe Dipole Shear Sonic Imager (DSI) (Run-4). The methods used toderive the fast and slow shear-wave transit-times are furtherreviewed below in the descriptions of Tracks 17, 18, and 19(Fig. 2).
Stoneley-wave slowness (250e600 micro-sec/ft; approximately820e1969 micro-sec/m)
The Stoneley-wave slowness log depicted in Track 13 (Fig. 2) hasbeen derived from the Stoneley-wave coherence plot in Track 16(Fig. 2), which was obtained by the Dipole Shear Sonic Imager (DSI)(Run-4).
6.12. Track 14
Coherence plot of compressional-wave slowness (40e280 micro-sec/ft; approximately 131e918 micro-sec/m)Compressional-wave slowness (40e280 micro-sec/ft; approximately131e918 micro-sec/m)
Track 14 displays the compressional-wave slowness asmeasured by the Dipole Shear Sonic Imager (DSI) (Run-4). Thecompressional-wave slowness has been extrapolated from thestatistical overlay of the compressional-wave coherence plotfrom the DSI monopole array. This data has not been depthshifted.
6.13. Track 15
Coherence plot of fast shear-wave slowness (112e772 micro-sec/ft;approximately 367e2533 micro-sec/m)Fast shear-wave slowness (112e772 micro-sec/ft; approximately367e2533 micro-sec/m)
Track 15 displays the fast shear-wave slowness (in the fastshear-wave direction) measured by the Dipole Shear SonicImager (DSI) (Run-4). In Track 15 the fast shear-wave receiverslowness has been extrapolated from the statistical overlay of thefast shear-wave slowness time coherence plot from the DSImonopole array. The methods used to derive the fast and slowshear-wave slowness are further reviewed below in thedescriptions of Tracks 17, 18, and 19 (Fig. 2). This data has notbeen depth-shifted.

T.S. Collett et al. / Marine and Petroleum Geology 28 (2011) 561e577 575
6.14. Track 16
Coherence plot of Stoneley-wave slowness (200e900 micro-sec/ft;approximately 656e2953 micro-sec/m)Stoneley-wave slowness (200e900 micro-sec/ft; approximately656e2953 micro-sec/m)
Track 16 displays the Stoneley-wave slowness measuredby the Dipole Shear Sonic Imager (DSI) (Run 4). In Track 16(Fig. 2) the Stoneley-wave slowness has been extrapolatedfrom the statistical overlay of the Stoneley-wave coherence plotfrom the DSI monopole array. This data has not been depth-shifted.
6.15. Tracks 17 and 18
Minimum cross-acoustic energy (ratio, 0e100)Maximum cross acoustic energy (ratio, 0e100)Fast-shear azimuth (�90 to 90 deg)Fast-shear azimuth e minimum (�90 to 90 deg)Fastshear azimuth e maximum (�90 to 90 deg)
The Dipole Shear Sonic Imager log (DSI) (Run-4) allowed forthe complete analysis of the shear wave acoustic anisotropy ofthe hydrate-bearing sedimentary section at Mount Elbert. Cross-dipole acoustic-logging tools can measure shear-waves in bothfast and slow formations, as well as characterize the shearanisotropy of the formation using traditional time-domain pro-cessing techniques. Acoustic anisotropy can be characterized aseither intrinsic (i.e., bedding, shales, aligned fractures) or stress-induced. Recently it has been shown that frequency domainprocessing of cross-dipole data (i.e., slowness-frequency analysisor dispersion analysis) enhances the interpretation of the data bydistinguishing intrinsic from stress-induced anisotropy (Plonaand Kane, 2005). Dispersion analysis augments traditionaltime-based semblance processing to yield a more completecharacterization of the formation. Schlumberger Well LoggingServices used standard frequency-domain processing techniquesto evaluate the isotropic/anisotropic acoustic nature of theformations at the Mount Elbert well site with the recorded DipoleShear Sonic Imager log data (DSI) (Run-4). This study has shownthat the gas-hydrate-bearing sandstone units in the Mount Elbertwell have low compressional-wave and shear-wave slownesses(fast sound speeds) and behave in a homogeneous and isotropicmanner. In contrast, the water-bearing sandstone section exhibitsmuch higher compressional-wave and shear-wave slownesses(slow sound speeds), stress-induced anisotropy, and mechanicaldamage around the wellbore, as indicated by additional radialacoustic slowness gradients.
In Track 17 (Fig. 2), the relative acoustic energy level as seenby the receivers on the DSI tool are plotted for the minimumand maximum shear-wave slowness directions. Note that withingas-hydrate-bearing sandstone intervals (unit C 2132e2186 ft;649.8e666.3 m and unit D 2016e2060 ft; 614.4e627.9 m), theacoustic energies as seen by the DSI are relatively similar inboth the minimum and maximum shear-wave slowness direc-tions, with a slightly greater difference in the unit C hydrate-bearing section. In the water-bearing sandstone intervals, suchas unit B (2480e2660 ft; 775.9e810.7 m), the DSI measuredacoustic energies differ significantly between the minimum andmaximum shear-wave slowness directions (highlighted ingreen).
In Track 18 (Fig. 2), the azimuth of the fast shear-wave slow-ness directions have been plotted along with the expecteduncertainty in the fast shear-wave slowness direction (shaded ingray).
6.16. Track 19
Shear-wave slowness in fast direction (40e540 micro-sec/ft;approximately 131e1772 micro-sec/m)Shear wave slowness in slow direction (40e540 micro-sec/ft;approximately 131e1772 micro-sec/m)Slowness-based anisotropy (relative scale, 0e100%)Time-based anisotropy (relative scale, 0e100%)
The Dipole Shear Sonic Imager log (DSI) (Run-4) was used toanalyze the shear wave acoustic anisotropy of the gas-hydrate-bearing sediments at the Mount Elbert site as shown in thedescription of Tracks 17 and 18 (Fig. 2). Track 19 (Fig. 2) includesplots of the DSI-derived shear-wave slownesses in both the fast andslow directions. Track 19 also includes a plot of the relative slow-ness anisotropy (shaded in green), which derived with thefollowing equation:
Slowness Anisotropy ¼�DTslow � DTfast
��DTslow þ DTfast
�.2100 (7)
where DT is shear slowness. Time-based anisotropy is calculated by
Time Anisotreopy ¼ TTdiffTTfast
100 (8)
where TTdiff is the arrival time difference between fast and slowshear waves; TTfast is the fast shear arrival time.
6.17. Tracks 20 and 21
Stoneley waveform (0e20,440 microsec)Borehole diameter (OBMI caliper 1) (4e14 inches; approximately10.2e35.6 cm)Stoneley reflection coefficient-up (ratio, 0.0e0.5)Stoneley reflection coefficient-down (ratio, 0.0e0.5)
Track 21 (Fig. 2) shows the complete Stoneley waveform acquiredby the Dipole Shear Sonic Imager (DSI) (Run-4) in the Mount Elbertwell. In Tracks 20 and 21 (Fig. 2), the low-frequency reflected Stone-ley-wave mode has been used to locate Stoneley-wave reflections ofpermeable fractures intersecting the borehole. Attenuation of directStoneley-waves in a borehole is due to fractures cross-cutting theborehole and fluid flow into the permeable fracture, a mechanismwhich also gives rise to reflected Stoneley-waves. The Stoneley-wavedata processing in Tracks 20 and 21 (Fig. 2) involved computation ofthe Stoneley-wave reflectivity response using the measured directand reflected Stoneley-wave arrivals. A least-squares fit to the arrivaltime of the reflected-wave arrivals was used to estimate the welldepth of the permeable fractures. The sonic waveform in Track 21(Fig. 2) is dominated by numerous large amplitude reflections,possibly indicating the presence of significant fractures, flagged onthe plot of the up (red) and down (green) Stoneley reflection coeffi-cient logs inTrack 20 (Fig. 2); however, irregularities in the shape andsize of the borehole can adversely affect the Stoneley-wave arrivals.Theboreholediameter log (caliper) has beenadded toTrack21 (Fig. 2)to highlight zones in which borehole conditions may affect theStoneley-wave analysis. The Stoneley waveform (Track 21) has notbeen depth-shifted.
6.18. Track 22
Poisson’s ratio (ratio, 0e0.5)Track 22 (Fig. 2) contains a well log of the Poisson’s ratio (s)
computed from the Dipole Shear Sonic Imager (DSI) (Run-4). The

T.S. Collett et al. / Marine and Petroleum Geology 28 (2011) 561e577576
Poisson’s ratio (s) log in Track 22 was calculated from the DSI-derived compressional- and fast shear-wave velocities (Vp and Vs)and the following relation, developed by Gassmann (1951):
s ¼12
hVPVS
i2�1hVPVS
i2�1(9)
Young’s modulus (0e2.5 MPa)Track 22 (Fig. 2) also contains a log display of Young’s modulus
(E) calculated from the compressional- and shear-wave velocities(Vp and Vs) and the density log using the following relationsdeveloped by Gassmann (1951):
E ¼ 9KG3K þ G
(10)
where K is the bulk modulus, given by the following relation:
VP ¼�ðK þ 4G=3Þ
rb
�12
(11)
where G (the well-log-calculated shear modulus) is derived fromthe Dipole Shear Sonic Imager (DSI) (Run-4) and rb (the bulk-density of the formation) was measured by the Platform Express(PEX) (Run-1).
Shear modulus (0e2.5 MPa)Track 22 (Fig. 2) also contains awell log of the shear modulus (G)
calculated from the shear-wave velocities (Vs), the density log, andthe following relation developed by Gassmann (1951):
VS ¼�Grb
�12
(12)
where the bulk-density (rb) of the formation is obtained from thedensities recorded by the Platform Express (Run-1).
6.19. Track 23
Vp/Vs (ratio, 1.0e3.5)The presence of free-gas in contact with gas hydrate occur-
rences is an important consideration when designing possibleproduction scenarios and assessing drilling hazards. Measuredcompressional-wave/shear-wave velocity ratios less than w1.9are often indicative of free-gas-bearing sediments. As shown inTrack 23 (Fig. 2), however, the log measured compressional-wave/shear-wave velocity ratios measured by the Dipole ShearSonic Imager (DSI) (Run-4), are uniformly higher than the 1.9threshold.
6.20. Track 24
Measured depth (1900e3000 ft; 579.1e914.4 m)The subsurface depths used in this display are measured from
the rotary kelly bushing (RKB) on the drilling rig, whichwas located55.18 ft (16.8 m) above sea level. The original well log data wasrecorded in feet and later converted to meters as depicted in Track24 (Fig. 2).
7. Summary
Analysis of downhole logs has confirmed the occurrence oftwo relatively thick gas-hydrate-bearing stratigraphic sectionsunits (unit C 2132e2186 ft [649.8e666.3 m] and unit D
2016e2060 ft [614.4e627.9 m]) within the BPXA-DOE-USGSMount Elbert Gas Hydrate Stratigraphic Test Well. The downholewell log and core data has yielded a wealth of geologic andengineering data from the Mount Elbert gas hydrate prospect.High resolution borehole surveys have revealed that the gashydrates of the Mount Elbert well appear to be pore fillingconstituents within relatively high quality sandstone reservoirrocks. Porosities of the gas-hydrate-bearing reservoir rocks,derived by various well log and core analyses, range from w35 %to w40 %. Gas hydrate saturations within the gas-hydrate-bearingunits of the Mount Elbert well, calculated by various well logmethods reviewed in this study, are very high with average valuesranging from w50 to w78%.
References
Amer, A., Alexander, S., 2005. Interpreting the depositional facies of the Upper GarifFluvial System using oil-based mud images: a case study in Central Oman.Society of Petroleum Engineers Paper 95584, 13. p.
Anderson, B., Hancock, S., Wilson, S., Collett, T., Boswell, R., Hunter, R., 2011.Formation pressure testing at the Mount Elbert Gas Hydrate Stratigraphic TestWell, Alaska North Slope: Operational summary, history matching, and inter-pretations. Journal of Marine and Petroleum Geology 28 (2), 478e492.
Bird, K.J., 1998. Geographic and geologic setting, Chapter GG. In: The Oil and GasResource Potential of the Arctic National Wildlife Refuge 1002 Area, Alaska, byANWR Assessment Team: U.S. Geological Survey Open-File Report 98-34,Version 1.0, p. GG1-GG51, CD-ROM. http://pubs.usgs.gov/of/1998/ofr-98-0034/GG.pdf.
Collett, T.S., 1993. Natural gas hydrates of the Prudhoe Bay and Kuparuk River area,North Slope, Alaska. American Association of Petroleum Geologists Bulletin 77(5), 793e812.
Collett, T.S., 1998. Well log characterization of sediment porosities in gas-hydrate-bearing reservoirs. In: Proceedings of the 1998 Annual Technical Conferenceand Exhibition of the Society of Petroleum Engineers, September 27e30,1998, New Orleans, Louisiana, USA. Society of Petroleum Engineers, Houston,Texas, p. 12.
Collett, T.S., Lee, M., 2005. Electrical resistivity well-log analysis of gas hydratesaturations in the JAPEX/JNOC/GSC et al. Mallik 5L-38 well. In: Dallimore, S.R.,Collett, T.S. (Eds.), Scientific Results from the Mallik 2002 Gas HydrateProduction Research Well Program, Mackenzie Delta, Northwest Territories,Canada. Geological Survey of Canada Bulletin 585, 8. two CD-ROM set.
Collett, T.S., Lewis, R.E., Dallimore, S.R., 2005. JAPEX/JNOC/GSC et al. Mallik 5L-38 gashydrate production research well downhole well-log and core montages. In:Dallimore, S.R., Collett, T.S. (Eds.), Scientific Results from the Mallik 2002 GasHydrate Production Research Well Program, Mackenzie Delta, Northwest Terri-tories, Canada. Geological Survey of Canada Bulletin 585, 23. two CD-ROM set.
Gassmann, F., 1951, Elasticity of porous media: uber die elastizitat poroser medien,Vierteljahrsschrift der Naturforschenden Gesselschaft in Zurich, Heft 1.
Guerin, G., Goldberg, D., 2005. Sonic attenuation in the JAPEX/JNOC/GSC et al.Mallik 5L-38 gas hydrate research well. In: Dallimore, S.R., Collett, T.S. (Eds.),Scientific Results from the Mallik 2002 Gas Hydrate Production Research WellProgram, Mackenzie Delta, Northwest Territories, Canada. Geological Survey ofCanada Bulletin 585, 9. two CD-ROM set.
Herron, M.W., 1987. Estimating the intrinsic permeability of clastic sediments fromgeochemical data. In: Proceedings of the Society of Professional Well LogAnalyst Annual Logging Symposium, June 29eJuly 2, 1987, Paper HH, 23p.
Herron, S.L., Herron, M.W., 1996. Quantitative lithology: An application for open andcased hole spectroscopy. In: Proceedings of the Society of Professional Well LogAnalyst Annual Logging Symposium, June 16e19, 1996, Paper E, 14p.
Herron, S.L., Herron, M.W., 2000. Application of nuclear spectroscopy logs to thederivation of formation matrix density. In: Proceedings of the Society ofProfessional Well Log Analyst Annual Logging Symposium, June 4e7, 2000,Paper JJ, 12p.
Horkowitz, J., Crary, S., Ganesan, K., Heidler, R., Luong, B., Morley, J., Petricola, M.,Prusiecki, C., Speier, P., Poitzsch, M., Scheibal, J.R., Hashem, M., 2002. Applica-tions of a new magnetic resonance logging-while-drilling tool in a Gulf ofMexico deepwater development well. In: Proceedings of the Society ofProfessional Well Log Analyst Annual Logging Symposium, June 2e5, 2002,Paper EEE, 14p.
Hunter, R., Collett, T., Boswell, R., Anderson, B., Digert, S., Pospisil, G., Baker, R.,Weeks, M., 2011. Mount Elbert Gas Hydrate Stratigraphic Test Well, AlaskaNorth Slope: Overview of scientific and technical program. Journal of Marineand Petroleum Geology 28 (2), 295e310.
Kleinberg, R.L., Flaum, C., Collett, T.S., 2005. Magnetic Resonance Log of JAPEX/JNOC/GSC et al. Mallik 5L-38 gas hydrate production research well: gas hydratesaturation, growth habit, and relative permeability. In: Dallimore, S.R.,Collett, T.S. (Eds.), Scientific Results from the Mallik 2002 Gas HydrateProduction Research Well Program, Mackenzie Delta, Northwest Territories,Canada. Geological Survey of Canada Bulletin 585, 10. two CD-ROM set.
T.S. Collett et al. / Marine and Petroleum Geology 28 (2011) 561e577 577
Lee, M., Agena, W., Collett, T., Inks, T., 2011. Pre- and post-drill comparison of theMount Elbert gas hydrate prospect. Alaska North Slope. Journal of Marine andPetroleum Geology 28 (2), 578e588.
Lee, M.W., Collett, T.S., 2005. Assessments of gas hydrate concentrations estimatedfrom sonic logs in the Mallik 5L-38 gas hydrate research production well,Northwest Territories, Canada. In: Dallimore, S.R., Collett, T.S. (Eds.), ScientificResults from the Mallik 2002 Gas Hydrate Production Research Well Program,Mackenzie Delta, Northwest Territories, Canada. Geological Survey of CanadaBulletin 585, 10. two CD-ROM set.
Lee, M.W., Collett, T.S., 2011. In-situ gas hydrate hydrate saturation estimated fromvarious well logs at the Mount Elbert Gas Hydrate Stratigraphic Test Well,Alaska North Slope. Journal of Marine and Petroleum Geology 28 (2), 439e449.
Lee, M.W., Hutchinson, D.R., Collett, T.S., Dillon, W.P., 1996. Seismic velocities forhydrate-bearing sediments using weighted equation. Journal of GeophysicalResearch 101 (B9), 20347e20358.
Lorenson, T.D., Collett, T.S., Hunter, R.B., 2011. Gas geochemistry of the Mount ElbertGas Hydrate Stratigraphic Test Well, Alaska North Slope: Implications for gashydrate exploration in the Arctic. Journal of Marine and Petroleum Geology 28(2), 343e360.
Mayer, C., Sibbit, A., 1980. Global, A new approach to computer-processed loginterpretation, Society of Professional Engineers 55th Annual Conference,September 21-24, 1980, SPE 9341, 14p.
Molenaar, C.M., Bird, K.J., Kirk, A.R., 1987. Cretaceous and Tertiary stratigraphy ofnortheastern Alaska. In: Tailleur, I., Weimer, P. (Eds.), Alaskan North SlopeGeology, v. 1: Bakersfield, California, Pacific Section, Society of Economic Pale-ontologists and Mineralogists and Alaska Geological Society, pp. 513e528.
Plona, T.J., Kane, M.R., 2005. Anisotropic stress analysis from downhole acoustic logsin the JAPEX/JNOC/GSC et al., Mallik 5L-38 gas hydrate production research well.In: Dallimore, S.R., Collett, T.S. (Eds.), Scientific Results from the Mallik 2002 GasHydrate Production Research Well Program, Mackenzie Delta, Northwest Terri-tories, Canada. Geological Survey of Canada Bulletin 585, 8. two CD-ROM set.
Quirein, J., Kimminau, S., LaVigne, J., Singer, J., Wendel, F., 1986. A coherentframework for developing and applying multiple formation evaluation models.
Transactions of the Society of Professional Well Log Analysts 27th AnnualLogging Symposium, Paper DD.
Rose, K., Boswell, R., Collett, T., 2011. Mount Elbert Gas Hydrate Stratigraphic TestWell, Alaska North Slope: Coring operations, core sedimentology, and lithos-tratigraphy. Journal of Marine and Petroleum Geology 28 (2), 311e331.
Serra, O., 1984. Fundamentals of Well-Log Interpretation. In: Developments in Petro-leumScience, vol.1. Elsevier Publishing, Amsterdam, TheNetherlands, pp.196e197.
Sun, Y.-F., Goldberg, D., 2005. Analysis of electromagnetic propagation tool responsein gas-hydrate-bearing formations. In: Dallimore, S.R., Collett, T.S. (Eds.),Scientific Results from the Mallik 2002 Gas Hydrate Production Research WellProgram, Mackenzie Delta, Northwest Territories, Canada. Geological Survey ofCanada Bulletin 585, 8. two CD-ROM set.
Sun, Y., Goldberg, D., Collett, T., Hunter, R., 2011. High-resolution well-log deriveddielectric properties of gas-hydrate-bearing sediments, Mount Elbert GasHydrate Stratigraphic Test Well, Alaska North Slope. Journal of Marine andPetroleum Geology 28 (2), 450e459.
Tomaru, H., Matsumoto, R., Chen, Y.F., Lu, H., Clark, I.D., 2005. Evolution of a gashydrate system as recorded by oxygen and hydrogen isotopes of the interstitialwaters of the JAPEX/JNOC/GSC et al. Mallik 5L-38 gas hydrate productionresearch well. In: Dallimore, S.R., Collett, T.S. (Eds.), Scientific Results from theMallik 2002 Gas Hydrate Production Research Well Program, Mackenzie Delta,Northwest Territories, Canada. Geological Survey of Canada Bulletin 585, 12.two CD-ROM set.
Torres, M., Collett, T., Rose, K., Sample, J., Agena, W., Rosenbaum, E., 2011. Pore FluidGeochemistry from the Mount Elbert Gas Hydrate Stratigraphic Test Well,Alaska North Slope. Journal of Marine and Petroleum Geology 28 (2), 332e342.
Tréhu, A.M., Long, P.E., Torres, M.E., et al., 2004. Three-dimensional distribution ofgas hydrate beneath southern Hydrate Ridge: constraints from ODP Leg 204.Earth and Planetary Science Letters 222, 845e862.
Winters, W., Walker, M., Hunter, R., Collett, T., Boswell, R., Torres, M., Patil, S.,Dandekar, A., 2011. Physical properties of sediment from the Mount Elbert GasHydrate Stratigraphic Test Well, Alaska North Slope. Journal of Marine andPetroleum Geology 28 (2), 361e380.


![Montages - cvillecameraclub.orgcvillecameraclub.org/sites/default/files/Montages... · Montages: Interpreting Reality by Matthew G. Schmidt. Montage [mɒnˈtɑːʒ (French) mɔ̃taʒ]](https://static.fdocuments.us/doc/165x107/5f3b21e0bdc6647f560a123b/montages-montages-interpreting-reality-by-matthew-g-schmidt-montage-mnt.jpg)