Dow theory and Classical technical analysis
24
Nooresh Merani www.nooreshtech.co.in www.analyseindia.com DOW THEORY The origins of all technical analysis material and studies derive a lot of basics from the 255 editorials written by Charles Dow in Wall Street Journal in the late 1880-1900 period. The Dow Theory not only looks into price analysis but delves deeper into market psychology as well. Along with the contributions of William Hamilton the Dow Theory has become the base material for all types of analysis related to price and volume data. Although the earlier analysis only focused on Dow Jones Rail and Industrial Averages it applies equally well to stocks,sectors,commodities and indices. Mr Charles Dow did not write a book on the subject but books by S A Nelson, William Hamilton and Robert Rhea refined the studies of Dow and Hamilton. The Dow Jones Index now a barometer of US economy is a stock market index which was first formulated by Dow and his business associate Edward Jones. The Assumptions of Dow Theory Every theory lies on some assumptions and fixed conditions to start with. In the same way there are few things you need to assume while accepting the usage of Dow Theory. Primary Trend cannot be manipulated When there is a huge amount of money involved there are bound to be scams, speculation, rumors, vested interests which try to manipulate market prices and markets as a whole. Dow Theory assumes that manipulation may occur in the short term but it will not affect the primary trend of the markets. Rumors may affect stock prices for a day or two or at times for week/months also but over the long run they go back to the primary trend. There will be secondary movements due to oversold/overbought conditions which may lead to temporary moves but will settle down with time. For example in India markets many small cap penny stocks or IPO listings may get manipulated but over time it ends up in the dumps. Also a cartel may possibly manipulate a single security or even a group of securities but it can be easily assumed that it may not be possible to manipulate the index as a whole for long term. The market as a whole is too big to be manipulated.
-
Upload
nooresh-merani -
Category
Economy & Finance
-
view
1.170 -
download
11
Transcript of Dow theory and Classical technical analysis

Nooresh Merani www.nooreshtech.co.in www.analyseindia.com
DOW THEORY
The origins of all technical analysis material and studies derive a lot of basics from the 255 editorials
written by Charles Dow in Wall Street Journal in the late 1880-1900 period. The Dow Theory not only
looks into price analysis but delves deeper into market psychology as well. Along with the contributions
of William Hamilton the Dow Theory has become the base material for all types of analysis related to
price and volume data.
Although the earlier analysis only focused on Dow Jones Rail and Industrial Averages it applies equally
well to stocks,sectors,commodities and indices. Mr Charles Dow did not write a book on the subject but
books by S A Nelson, William Hamilton and Robert Rhea refined the studies of Dow and Hamilton. The
Dow Jones Index now a barometer of US economy is a stock market index which was first formulated by
Dow and his business associate Edward Jones.
The Assumptions of Dow Theory
Every theory lies on some assumptions and fixed conditions to start with. In the same way there are few
things you need to assume while accepting the usage of Dow Theory.
Primary Trend cannot be manipulated
When there is a huge amount of money involved there are bound to be scams, speculation, rumors,
vested interests which try to manipulate market prices and markets as a whole. Dow Theory assumes
that manipulation may occur in the short term but it will not affect the primary trend of the markets.
Rumors may affect stock prices for a day or two or at times for week/months also but over the long run
they go back to the primary trend. There will be secondary movements due to oversold/overbought
conditions which may lead to temporary moves but will settle down with time. For example in India
markets many small cap penny stocks or IPO listings may get manipulated but over time it ends up in the
dumps.
Also a cartel may possibly manipulate a single security or even a group of securities but it can be easily
assumed that it may not be possible to manipulate the index as a whole for long term. The market as a
whole is too big to be manipulated.

Nooresh Merani www.nooreshtech.co.in www.analyseindia.com
Averages Discount Everything
The market reflects all available information. Everything there is to know is already reflected in the
markets through the price. Prices represent the sum total of all the hopes, fears and expectations of all
participants. Interest rate movements, earnings expectations, revenue projections, presidential
elections, product initiatives and all else are already priced into the market. The unexpected will occur,
but usually this will affect the short-term trend. The primary trend will remain unaffected.
Look at the example below of the euphoric move in DLF which was a major mover in end of 2007-2008
but once the trend changed it continued it ended up at 10% of peak levels.
No Theory is perfect
It is also said none of the scientific theories can be totally perfect as even one instance of non
confirmation makes it false. Even Dow theory or as a matter of fact any analysis related to securities and
indices can never be considered as perfect or rather it’s a set of guidelines and principles to assist
investors/traders to understand,analyse markets and increase the probability of being profitable. Given
the fact market prices is a phenomenon of collective behavior it is necessary to remove the emotion
part of investing/trading. Dow Theory and all forms of Technical Analysis try to remove the influence of
emotions in our decisions. But how much ever you try if a person has a huge long position he may
always look for bullish signals then to look at a reversal. This will always remain a nagging factor for
every trader/investor and analysts.
The 6 basic tenets of Dow Theory
We will first look into the basic tenets for the Dow Theory and later in the chapter look how to use these
ideas for analysis.
1. The Averages Discount Everything:

Nooresh Merani www.nooreshtech.co.in www.analyseindia.com
Under the first basic premise, all news and information is quickly incorporated into a stock price as soon
as that information becomes available. Also even natural calamities get discounted in the price very
quickly.
2. The market has Three Trends:
Dow defined an uptrend as a situation in which each successive rally closes higher than the previous
rally high, and each successive rally low also closes higher than the previous rally low. In other words, an
uptrend has a pattern of rising peaks and troughs. The opposite situation, with successively lower peaks
and troughs, defines a downtrend. Dow's definition has withstood the test of time and still forms the
cornerstone of trend analysis. Below picture would sum it up.
The theory defines three movements: The Primary Trend is the major movement of the market. This
trend can last for several years. The Secondary Trend or “intermediate trend” serves as a correction to
the primary movement, moving in the opposite direction of the primary movement. The Minor Trend is
a corrective move within the secondary trend and is typically defined as lasting less than three weeks.
3. Major Trends Have Three Phases:
This tenet further describes the primary trend by identifying three phases of that trend. The
Accumulation Phase marks the beginning of an upward trend. This phase comes at the end of a
downward trend as investors re-enter the market to buy stocks at attractive prices. The Public
Participation Phase follows as informed investors enter the market and help to drive up stock prices. The
Excess Phase completes the cycle as savvy investors to scale back their positions believing that the
market is becoming over-priced.
A simpler summary would be

Nooresh Merani www.nooreshtech.co.in www.analyseindia.com
Accumulation Phase - > Smart Investors recognize worst is over.
Public Participation Phase -> Business Improves and price advances with technical trend followers
participating.
Distribution Phase - > Newspaper Headlines, Economy shining, Public euphoria, Smart Investors selling.
4. The Averages Must Confirm Each Other:
The Dow Theory states that a major reversal in trends is not signaled unless the major averages
(Industrial and Railway) are in agreement. Without agreement in these averages, it is difficult to confirm
a trend in business conditions. (With time we need to look into this as sectors charging up the economy
have changed. Apple with 100 billion dollars cash comes in neither of the averages)
5. Volume Must Confirm the Trend:
Although volume did not form a major part of Dow Theory it clearly mentions that Volume should
expand in the direction of Major trend. So in strong uptrend’s volumes should increase with price rise
and diminish in price falls/corrections. Dow used closing prices for the analysis but with current
availability of data one can do a lot of volume analysis on smaller time frames.
In the chart below one can see how price rises were accompanied with volumes maintaining the major
trend.
Nooresh Merani www.nooreshtech.co.in www.analyseindia.com
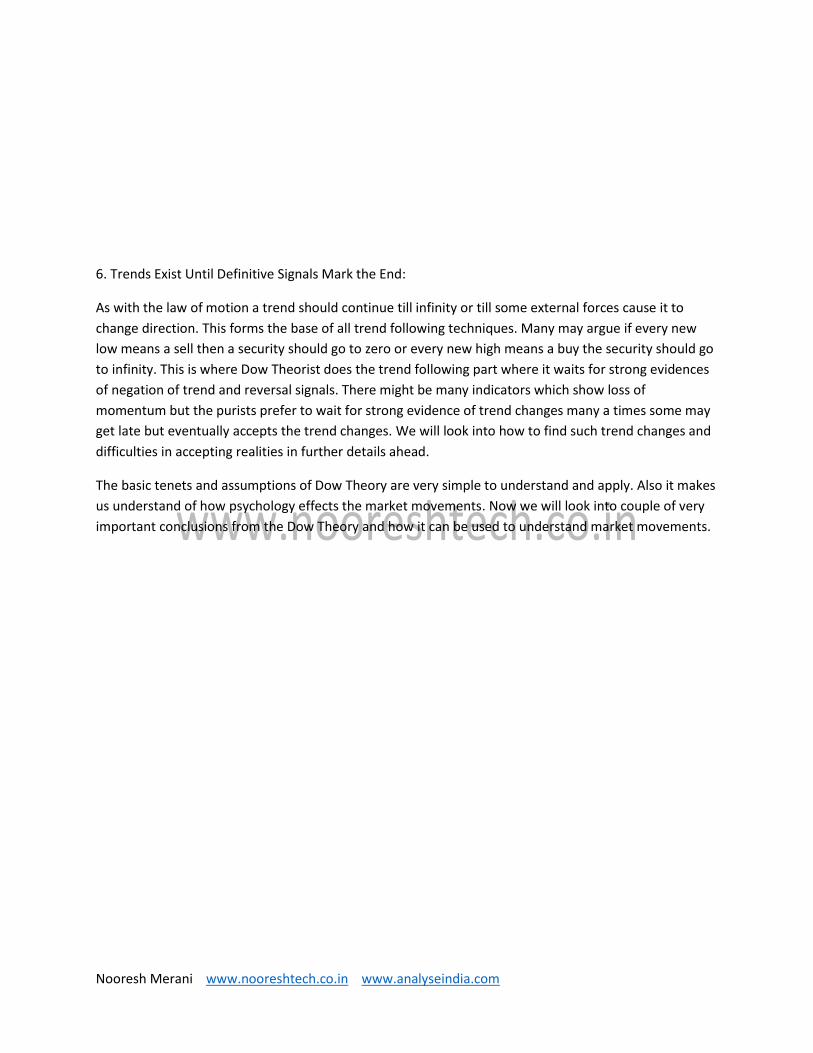
6. Trends Exist Until Definitive Signals Mark the End:
As with the law of motion a trend should continue till infinity or till some external forces cause it to
change direction. This forms the base of all trend following techniques. Many may argue if every new
low means a sell then a security should go to zero or every new high means a buy the security should go
to infinity. This is where Dow Theorist does the trend following part where it waits for strong evidences
of negation of trend and reversal signals. There might be many indicators which show loss of
momentum but the purists prefer to wait for strong evidence of trend changes many a times some may
get late but eventually accepts the trend changes. We will look into how to find such trend changes and
difficulties in accepting realities in further details ahead.
The basic tenets and assumptions of Dow Theory are very simple to understand and apply. Also it makes
us understand of how psychology effects the market movements. Now we will look into couple of very
important conclusions from the Dow Theory and how it can be used to understand market movements.

Nooresh Merani www.nooreshtech.co.in www.analyseindia.com
The 1-2-3 Pattern and Three Trends.
The first tenet is very simple that averages discount everything and has been discussed in detailed in the
first chapter.
The next thing we need to understand is Primary/Secondary and Minor Trends.
Primary Trend – Go into years and years.
Secondary Trend – Months to few years.
Minor Trend – less than 3 weeks.
Look at the chart below how it shows the three trends.
The primary trend remains down till it makes newer highs. There will be secondary corrections taking it
closer to previous highs. In the secondary trend we might see pullbacks forming minor trends lasting for
less than 3 weeks.
This clears out how different types of trends can be used to decide the market positioning for a trader.
But we need to know what confirms the continuation of trends. This as mentioned in the second tenet is

Nooresh Merani www.nooreshtech.co.in www.analyseindia.com
higher highs and higher bottoms for an uptrend and similarly lower tops and lower bottoms for a
downtrend.
So this is how a uptrend and downtrend would look like.
There is no problem in identifying a uptrend and a downtrend it’s when to consider a trend change.
Some theorist would prefer to take a trend change at point 1 and others would wait for a failure top to
come first and then the new lows (Point 2).
Going with the simpler approach will prefer to wait for confirmation at point 2 unless we see classical
distribution signals before point 1. We will look into the distribution pattern in the next section on
phases of markets.
So in case of a failure top like the one shown below we may shift the trend change point to Point 1. Also
notice the period of watching a trend change is shown with orange lines going with the normal traffic
signal style where Green = Go Ahead, Orange = Pause , Red = Stop.

Nooresh Merani www.nooreshtech.co.in www.analyseindia.com
This makes us get into a Dow Theory trend following setup which I look into as a major trend signal or
filter to decide the primary trend of a stock or index. I prefer to call it a 1-2-3 pattern or a top/bottom
confirmation signal.
Step 1: As per Dow Theory find a sequence of Lower Tops or Lower Bottoms. Symbolize them as 1 and
2.
Step 2 : Symbolize the intermediate bottom or top with an arrow.
Step 3: Enter Long/Short on breakout above/below the arrow with a stoploss of Point 2.
Step 4: Close trade on an opposite signal and reverse the position. One can modify the exit plan.

Nooresh Merani www.nooreshtech.co.in www.analyseindia.com
Such a pattern is well applied on closing charts or on a little longer term time frame of few months to 2-
3 years. Also one can have different points for intermediate levels for consideration.
In the above chart we are looking at Nifty closing chart which gave excellent buy signal in April 2009 and
a sell signal in January 2011. A similar buy signal will be generated only if markets were to cross 5550 on
a closing basis. Another intermediate consideration level could be 5400. We may look for the sequence
of two tops/bottoms to be at a good interval of at least 3-4 weeks more and filter the smaller moves
which could be a minor trend.
The above system is just a reference for how one can find trend changes and not as a signal to trade as
the point 2 which is our stoploss at times can be very deep and there is no clear exit plan so it becomes
difficult to assign a risk-reward analysis. But using this system as a filter can help in understanding the
primary trends.
Three Stages of Primary Bull Market and Bear Markets
As mentioned in the third tenet about how Accumulation, Public Participation and Distribution are the
three major phases and the same continues in cycles over long periods. Theoretical it seems very simple
at times but when one has to identify such phases it becomes a bit difficult but generally this is a cycle
that continues.
This is how a Bull-Bear Cycle would be denoted as.
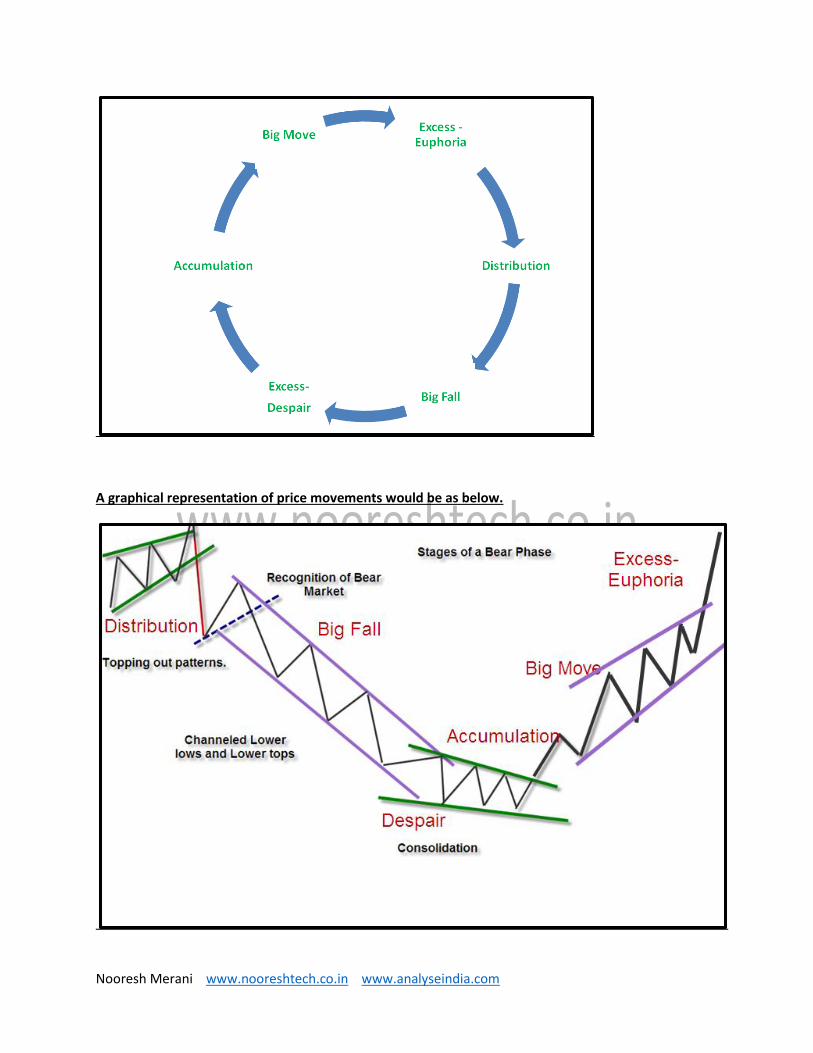
Nooresh Merani www.nooreshtech.co.in www.analyseindia.com
A graphical representation of price movements would be as below.

Nooresh Merani www.nooreshtech.co.in www.analyseindia.com
This cycle of emotions and price movements continues to happen forever and follows the basic
assumptions of Technical Analysis – History Repeast itself.
The above descriptions may be clear to understand graphically but everything is best understood with
known examples.
So let’s try to put the above phases with Indian markets.
The best period for India Markets was undoubtedly 2003-2008.The worst period was 2000-2003 post
the IT debacle. After that 2008 was one of the worst ever period for India and the world as well. Again
the things reversed by 2009 and India had a good time for 2009-2010.
So in terms of the phases for the Bull Market of 2003-2007
Accumulation - 2002-2003
Big Move - 2003-2007
Euphoria – end of 2007
Distribution - 2007-2008 ( Novemeber 2007 to January 2008 )
The chart is as shown below.
Things to Notice
1) Accumulation phase – In the accumulation phase of 2002-2003 India was in a terrible state post
the IT debacle with many stocks falling of 90-95% from peak values. The economy was going
nowhere.
2) Big Move – The big move in 2003-2004 created a move from 3000 to 6000 Sensex. Things
started improving.

Nooresh Merani www.nooreshtech.co.in www.analyseindia.com
3) Continuation of the Trend – We saw a major correction in 2004 because of the Government
change and elections. ( This can be termed as a secondary correction to the primary move as
well as discounting the change of government) . We kept on seeing many corrections on the way
to 16000 Sensex.
4) Excess Phase – The public participation increased tremendously in end of 2007 with smallcaps,
midcaps and everything running. The excessive move led to the fastest upswing from 16k-17k to
21k.
5) Distribution – The index did not do big moves in the end of 2007 till 2008 and the big drops of
2008 (two lower circuits) cleaned up the froth of excessive euphoria and led to the start of a
bear market. We did see a corrective move back to 19k because of a huge fall.
Lot of the above phases will look so simple in hindsight. That’s why one needs to keep evaluating the
market scenario on simple Dow Theory to help us get a better understanding of the probable future.
Now let us look into the next cycle of fall in 2008 and a subsequent bull market of 2009-2010 to get a
view of both Bull and Bear Markets in one chart.
In the above chart we have 1 complete cycle of – Bear Market of 2008 and Bull Market of 2009-2010
and 1 incomplete cycle of Bear Market of 2011.
Lets look into the the 1st complete cycle
Bear Market of 2008
1) Big fall – The big fall in start of 2008 gave the indication of the change in trend and start of a
Bear Market. Now here is where a Dow Theorist will be late. He may not sell in the distribution

Nooresh Merani www.nooreshtech.co.in www.analyseindia.com
phase of 2008 but the secondary pull back in 2008 ( post the lower circuits and a pullback from
15k to 18.5k ). Somebody more late may recognize the Bear Market at 16-15k in next drop.
2) Continuation of Trend – All through 2008 we kept seeing secondary recovery retracing back a
portion of the fall but none could create a higher top and kept making lower lows.
3) Excess – The fall in September – October 2008 on back of the Lehmann event was the excessive
pessimism around the world and in India leading to the fastest drop. ( It looks eerily inverse to
the rise in end of 2007)
4) Accumulation – The pessimism continued till March 2009 but a new low could not be formed.
This is generally the first indication of momentum being lost. Smart Investors are supposed to
accumulate in this period. A Dow theorist may only get in at 9k levels post a new intermediate
high. This is well above the lows of 8k in March 2009. A Dow theorist will generally miss the first
20% part of the move ( 8k to 21k ). Never expect to catch the bottoms.
Bull Market of 2009
1) Big Move – The big move in 2009 from 9k to 11k gave a clear indication of the start of a Bull
Market. This continued with a double circuit in 2009 on back of new government. How similar is
this to the 2008 fall.
2) Continuation of Trend – In 2010 the markets continued to make newer highs and bottoms albeit
in a slow and steady way.
3) Excessive Move – The sharp move in end of 2010 created the euphoria again going into the
Diwali of 2010. The inability to cross new highs in 2011 gave the first indication of distribution
and loss of momentum.
4) Big Fall – The sharp fall to 17k in 2011 was the first indication of a Bear Market beginning. Yet
again a Dow theorist would recognize a bear market somewhere after this point and be a little
late.
Now comes the real part of recognition of what is in store for 2012-2013.
So before looking into what is in store for us we need to look into the facts.
1) Going into end of 2011 Sensex made newer lows in the range of 15800 to 15100 but in a very
slow pace. This indicates the Bearish Momentum has slowed considerably.
2) We saw a big recovery from 15100 to 18500 from December 2011 to February 2011.
3) Sensex has again corrected to 15700 levels but has failed to make new lows. This is generally
considered as the first signal. ( Remember March 2009 when Sensex made 8047 against 7700)
4) So what next?
As per Dow Theory the trend remains down till there is significant evidence of a change in it. The law of
motion suggests Sensex should keep making new lows but a failure to do so at 15700 make us doubtful
of the downtrend. The intermediate tops for Sensex are at 17500 and 18500 roughly.

Nooresh Merani www.nooreshtech.co.in www.analyseindia.com
A trend change will be noticed if the index sees a significantly fast move beyond 17500/18500 or we may
wait for another higher low was an indication of loss in momentum and subsequent high for
confirmation.
For now the trend is down but showing indications of accumulation. A Dow Theorist is not supposed to
be a smart investor and will wait for a significant big move as a Bull Market indication. But yes to be very
clear the DOW THEORIST is now clearly watching for evidences.
Avoidable Jargons
There are no avoidable jargons in Dow Theory as the concept is pretty logical and simple to understand.
The simplicity and effectiveness of this theory has worked for the last 100 years but with modern tools
available for tracking prices and advances in understanding market behavior has led many people to
avoid putting more emphasis on Dow Theory. A Dow Theory based entry points always tend to miss the
1/4th or 20-25% of the rally leads many people to look for better setups but Dow never looked at using
this theory as a trading signal but as a barometer of the economy. Also neither does a Dow Theorist
want to enter at the bottom or top but in middle of the trend and get out before the next starts. As seen
in our examples a buy signal for Sensex would have come at 9500-9700 against a bottom of 8047 it
clearly shows the lag in entry but the subsequent big run ups take care of a late entry.
As we go further into other chapters like Technical Patterns and more detailed combination of technical
analysis one will start realizing the importance of emphasizing and understanding the basics of Dow
Theory.
Nooresh Merani www.nooreshtech.co.in www.analyseindia.com
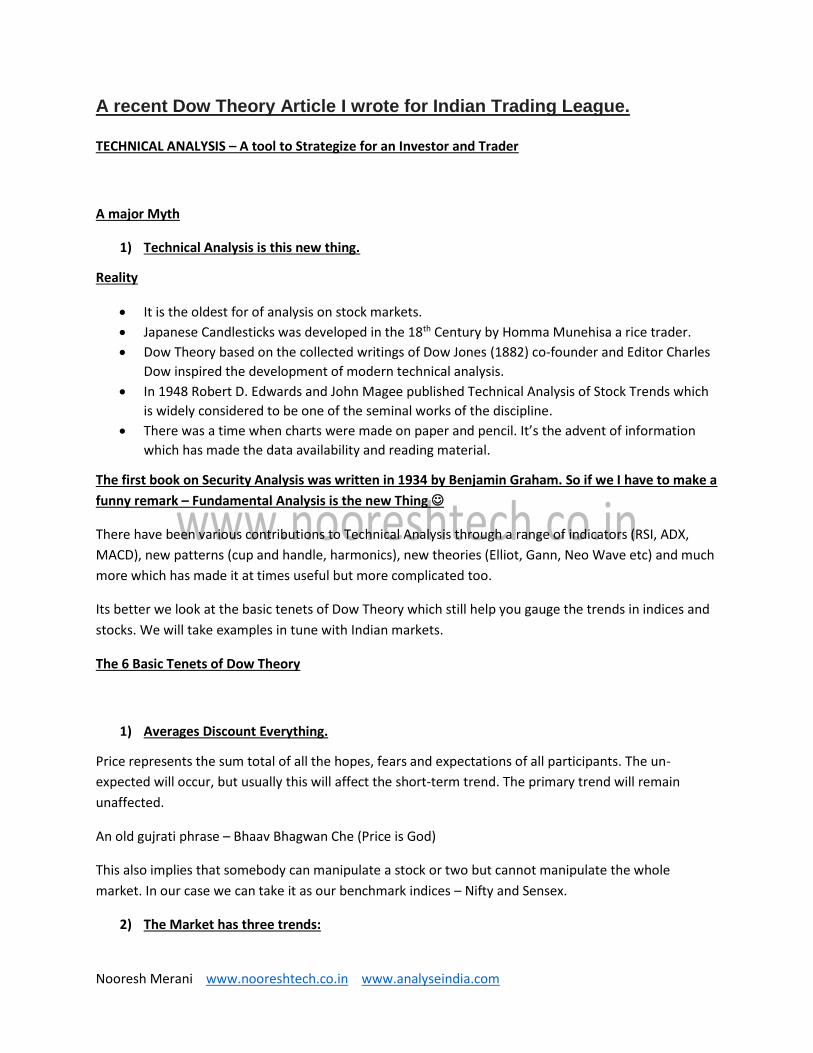
A recent Dow Theory Article I wrote for Indian Trading League. TECHNICAL ANALYSIS – A tool to Strategize for an Investor and Trader
A major Myth
1) Technical Analysis is this new thing.
Reality
It is the oldest for of analysis on stock markets.
Japanese Candlesticks was developed in the 18th Century by Homma Munehisa a rice trader.
Dow Theory based on the collected writings of Dow Jones (1882) co-founder and Editor Charles
Dow inspired the development of modern technical analysis.
In 1948 Robert D. Edwards and John Magee published Technical Analysis of Stock Trends which
is widely considered to be one of the seminal works of the discipline.
There was a time when charts were made on paper and pencil. It’s the advent of information
which has made the data availability and reading material.
The first book on Security Analysis was written in 1934 by Benjamin Graham. So if we I have to make a
funny remark – Fundamental Analysis is the new Thing
There have been various contributions to Technical Analysis through a range of indicators (RSI, ADX,
MACD), new patterns (cup and handle, harmonics), new theories (Elliot, Gann, Neo Wave etc) and much
more which has made it at times useful but more complicated too.
Its better we look at the basic tenets of Dow Theory which still help you gauge the trends in indices and
stocks. We will take examples in tune with Indian markets.
The 6 Basic Tenets of Dow Theory
1) Averages Discount Everything.
Price represents the sum total of all the hopes, fears and expectations of all participants. The un-
expected will occur, but usually this will affect the short-term trend. The primary trend will remain
unaffected.
An old gujrati phrase – Bhaav Bhagwan Che (Price is God)
This also implies that somebody can manipulate a stock or two but cannot manipulate the whole
market. In our case we can take it as our benchmark indices – Nifty and Sensex.
2) The Market has three trends:

Nooresh Merani www.nooreshtech.co.in www.analyseindia.com
According to Dow Theory, the market has only three trends
Primary trend: In Dow theory, primary trend is also considered as major trend in the market. It has a
long term impact and may remain in effect for more than 1 year.
Secondary trend: Dow call a correction in the primary trend as secondary trend. It usually last for few
weeks to months. In a bullish market secondary trend will be a downward movement and in a bearish
market it will be a rally.
Minor trend: The “short swing” or minor movement varies with opinions from hours to a month or
more.
An image says a Thousand Words.
The above tenet of sticking to the primary trend and adding more on fresh highs or on reactions to the
previous bottoms would have yielded a number of trades. A big signal of primary trend started from
280-300 till 680 in 18 months.
3) The Market trends have three phases
Accumulation phase: Prices get range bound and smart money keeps accumulating. The market
opinion is still negative or confused.
Absorption phase: Huge participation in the market. Higher Tops and Higher Bottoms like above.
This phase continues until rampant speculation occurs.
Distribution phase: After a huge hype in the prices because of the skewed supply of the stock the
prices begins to retrace as the astute investors begin to distribute their holdings to the market. As a
result of it the prices start falling along with the volume.
Below we take an example of Nifty post the top made in Y2K Boom in early part of 2000.

Nooresh Merani www.nooreshtech.co.in www.analyseindia.com
There was a consistent downtrend followed with a Panic Bottom made.
Accumulation Phase – The end of 2001 to 2003 market made 2-3 bottoms in the same zone.
Fluctuating between 900-1100 roughly.
Absorption Phase – 2003 start to start of 2004 it rallied from a low of 900 to 2000. A Dow Theory
buy signal came above the highs of 1100. Higher Tops and Higher Bottoms continued.
Distribution Phase – A huge upsurge seen in start of 2004 with a lot of speculative activity. The
higher tops and higher bottom fails and distribution starts. This signal came much before BJP being
ousted in the Elections and Nifty saw its first lower circuit on 17th May 2004.
4) Averages must confirm each other.
During those times Dow had the Industrial Average and Rail Average. The logic behind the theory is
simple: Industrial companies manufactured the goods and the rails shipped them and so both should
logically make new intermediate highs/lows in sync.
When one of these averages climbs to an intermediate high/low, then the other is expected to follow
suit within a reasonable amount of time. If not, then the averages show “divergence” and the market is
liable to reverse course.
We have Nifty ( Sensex ) and Bank Nifty ( Bankex ) or other indices like Midcap/Smallcap to confirm.

Nooresh Merani www.nooreshtech.co.in www.analyseindia.com
Nifty and Bank Nifty showed a classical divergence in the March 2009 lows and we reversed trends in
May 2009.
5) Volume must confirm the trend:
Dow recognized the volume as a secondary but important factor in confirming price signals. In other
words volume should increase in the direction of the major trend. In a major uptrend volume should
increase with the rally in price and should diminish during correction. Also in a major downtrend volume
should expand with the fall in prices and should contract during upward ripples.
In the turnaround from March 2009 a breakout above 3000 Nifty saw a good surge in volumes much
before the Indian Elections in May 2009 which got Congress re-elected.
6) A trend is assumed to be in effect until it gives a definite signal of reversal:
Nooresh Merani www.nooreshtech.co.in www.analyseindia.com
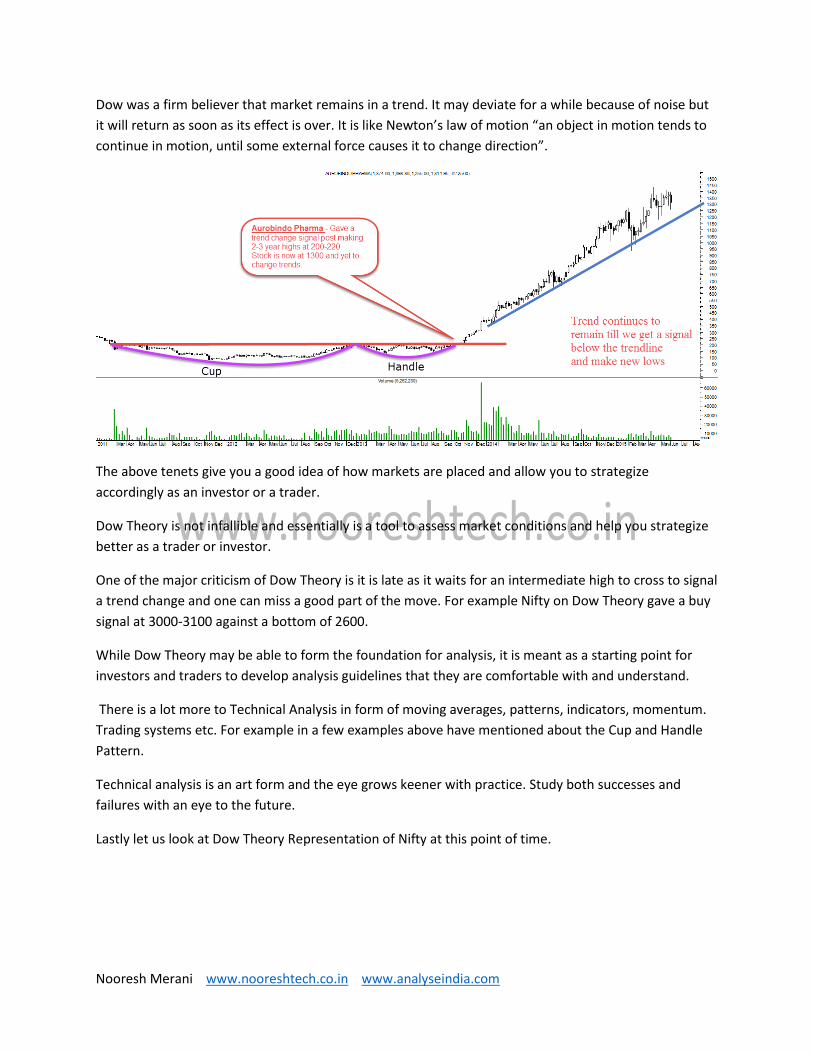
Dow was a firm believer that market remains in a trend. It may deviate for a while because of noise but
it will return as soon as its effect is over. It is like Newton’s law of motion “an object in motion tends to
continue in motion, until some external force causes it to change direction”.
The above tenets give you a good idea of how markets are placed and allow you to strategize
accordingly as an investor or a trader.
Dow Theory is not infallible and essentially is a tool to assess market conditions and help you strategize
better as a trader or investor.
One of the major criticism of Dow Theory is it is late as it waits for an intermediate high to cross to signal
a trend change and one can miss a good part of the move. For example Nifty on Dow Theory gave a buy
signal at 3000-3100 against a bottom of 2600.
While Dow Theory may be able to form the foundation for analysis, it is meant as a starting point for
investors and traders to develop analysis guidelines that they are comfortable with and understand.
There is a lot more to Technical Analysis in form of moving averages, patterns, indicators, momentum.
Trading systems etc. For example in a few examples above have mentioned about the Cup and Handle
Pattern.
Technical analysis is an art form and the eye grows keener with practice. Study both successes and
failures with an eye to the future.
Lastly let us look at Dow Theory Representation of Nifty at this point of time.

Nooresh Merani www.nooreshtech.co.in www.analyseindia.com

Nooresh Merani www.nooreshtech.co.in www.analyseindia.com
Author Nooresh Merani
09819225396
www.nooreshtech.co.in
https://twitter.com/nooreshtech
https://www.facebook.com/nooreshtech

Nooresh Merani www.nooreshtech.co.in www.analyseindia.com
DISCLAIMER
As investment & trading consultants, Promoters, owners, families, relatives, friends and clients of
www.nooreshtech.co.in maybe having positions in stocks / securities mentioned on the web site
All recommendations in this website are based on subject of Technical Analysis and do not reflect the
fundamental validity of the stocks / securities. Authors / owners of Technical View by Nooresh will
not be held responsible for any losses, financial or otherwise, incurred. To clarify, a ‘user’ is defined as
anybody that visitshttp://www.nooreshtech.co.in, regardless of whether or not the have registered as
a member of the website. ‘Site’ and the ‘community’ and‘www.nooreshtech.co.in’ are used
interchangeably and refer to the URL http://www.nooreshtech.co.in and all sub-domains. The
administrators and owners ofhttp://www.nooreshtech.co.in do not guarantee the reliability or
completeness of any information provided on our site or in any hyperlink appearing on our site. Any
advice or information presented on the site has not been verified
by http://www.nooreshtech.co.in and does not represent the opinions of the same. Users of the site
should not rely on the accuracy of any content on the site or assume any information they read on the
site to be factual.http://www.nooreshtech.co.in, its administrators or owners will not be liable for any
loss or damage caused by a user’s reliance on any information obtained from our site, or from a
hyperlink found on our site. Members remain responsible for their own investments and should
always conduct their own independent research before making independent investment decisions. If
you choose to trade on the information, including but not limited to opinions or stock picks found
on http://www.nooreshtech.co.in or any hyperlinks found on the site, then you have made a
conscious, willing, free and personal decision to do so, and http://www.nooreshtech.co.in does not
take any responsibility for this action.
By using http://www.nooreshtech.co.in you agree to be bound by the Terms and Conditions outlined
below. If you don’t wish to be bound by the Terms and Conditions then do not complete this
registration, and do not usehttp://www.nooreshtech.co.in or any of its associated services.
We (the administrators and owners of http://www.nooreshtech.co.in) reserve the right to change
these terms at any time, but will post a notice in advance on this website of any material changes.
Following an update being posted, your continued use of http://www.nooreshtech.co.inimplies
acceptance of the modified terms and conditions.
All of the Content onhttp://www.nooreshtech.co.in remains the property
ofhttp://www.nooreshtech.co.in. By “Content” we mean any information or materials found
onhttp://www.nooreshtech.co.in. The harvesting of data from our site via automated means of any
type, without the prior permission of http://www.nooreshtech.co.in is forbidden, as is attempting to
access our site by any means other than through the interfaces we provide for accessing the site.
You may make one copy of Content for your personal, non-commercial use as long as it is clearly
labeled with “Intellectual Property of http://www.nooreshtech.co.in. All rights reserved”. Any other
copying, distribution, storing, or transmission of any kind, or any commercial use of our Content, is

Nooresh Merani www.nooreshtech.co.in www.analyseindia.com
prohibited without http://www.nooreshtech.co.in prior written permission. You may not republish,
post, transmit or distribute Content to online bulletins or message boards, blogs, chat rooms,
intranets or anywhere else without our consent.
Notwithstanding the above, when you post Content, you do not surrender your copyright. You agree
that http://www.nooreshtech.co.in a has an unlimited and perpetual license to republish the Content.
However, you retain the right to use your words, images and other copyrightable content however you
wish.
We will always endeavor to ensure any content you publish is presented in context, and we’ll credit
you (under your user name) as the author. We won’t republish your content in advertising without
notifying you in advance and will not publish content in advertising if you instruct us not to.
As a member of http://www.nooreshtech.co.in , you agree to behave honestly at all times and act for
the benefit of the users of the site.
You, as a user of http://www.nooreshtech.co.in must not:
Post content that is not your own, or that is harmful, irrelevant, nonsensical, obscene, abusive,
solicitous, fraudulent, or defamatory.
Misrepresent your true identity, motives and opinions
Take any action that places an unreasonable strain or disrupts the functioning of the site and its
services
Copy the site’s content without prior permission from http://www.nooreshtech.co.in
Violate another member’s privacy
Violate any laws or regulations while using our site
If you don’t abide by the Code of Conduct, we will cancel your membership of the site.
We collect information about who our members are and how they use our site in order to provide our
members with the best experience possible. Sometimes we may use the information to notify you of
products, services, specific content, or areas of our site that we think may interest you. You can
choose whether or not to receive these notifications by altering your privacy settings at any time by
contacting us at [email protected]
Privacy whilst using the site
When you post content onto our site, that information, along with your screen name, is visible to the
public. Please remember that any information you disclose can be collected and used by others. Other
members can respond to your posts at any time but will not know your external email address or
other contact details (unless you have disclosed it).http://www.nooreshtech.co.in cannot guarantee
the security of any information you transmit to us, and you do so at your own risk. You are
responsible for maintaining the secrecy of any password and/or account information. We will never
ask you for your password in an unsolicited phone call or email. If you are using a computer to which
others have access, such as one in a computer lab, Internet cafe, or public library, always remember to
log out and close your browser window when leaving our site. If you follow links from our site to

Nooresh Merani www.nooreshtech.co.in www.analyseindia.com
others, you should be aware that you are doing business with those other sites, which have their own
privacy and data collection practices. http://www.nooreshtech.co.in has no responsibility or liability
for these sites.
Use of this site is subject to express Terms & Conditions, Code of Conduct, Privacy Policy,
and Disclaimer. By continuing past this page, you agree to abide by these terms. Any information
provided onhttp://www.nooreshtech.co.in should not be construed as research, trading picks or
recommendations, or investment advice and is provided with no warrants as to its accuracy.
Company names, products, services and branding cited herein may be trademarks or registered
trademarks of their respective owners. The use of trademarks or service marks of another is not a
representation that the other is affiliated with, sponsors, is sponsored by, endorses, or is endorsed
by http://www.nooreshtech.co.in