Double Pipe Creek TMDL 100109 final - mde.maryland.gov...Double Pipe Creek TMDL Fecal Bacteria...
110
FINAL Double Pipe Creek TMDL Fecal Bacteria Document version: October 1, 2009 Total Maximum Daily Loads of Fecal Bacteria for the Double Pipe Creek Basin in Carroll and Frederick Counties, Maryland FINAL DEPARTMENT OF THE ENVIRONMENT 1800 Washington Boulevard, Suite 540 Baltimore MD 21230-1718 Submitted to: Water Protection Division U.S. Environmental Protection Agency, Region III 1650 Arch Street Philadelphia, PA 19103-2029 October 2009 EPA Submittal Date: September 21, 2007 EPA Approval Date: December 3, 2009
Transcript of Double Pipe Creek TMDL 100109 final - mde.maryland.gov...Double Pipe Creek TMDL Fecal Bacteria...
FINAL
Double Pipe Creek TMDL Fecal Bacteria Document version: October 1, 2009
Total Maximum Daily Loads of Fecal Bacteria for the Double Pipe Creek Basin
in Carroll and Frederick Counties, Maryland
FINAL
DEPARTMENT OF THE ENVIRONMENT
1800 Washington Boulevard, Suite 540 Baltimore MD 21230-1718
Submitted to:
Water Protection Division U.S. Environmental Protection Agency, Region III
1650 Arch Street Philadelphia, PA 19103-2029
October 2009
EPA Submittal Date: September 21, 2007 EPA Approval Date: December 3, 2009

FINAL
Double Pipe Creek TMDL Fecal Bacteria Document version: October 1, 2009
This page deliberately left blank.
FINAL
Double Pipe Creek TMDL Fecal Bacteria Document version: October 1, 2009
Table of Contents
List of Figures................................................................................................................................. i
List of Tables ................................................................................................................................. ii
List of Abbreviations ................................................................................................................... iv
EXECUTIVE SUMMARY .......................................................................................................... v
1.0 INTRODUCTION............................................................................................................. 1
2.0 SETTING AND WATER QUALITY DESCRIPTION................................................. 3
2.1 General Setting...................................................................................................... 3
2.2 Water Quality Characterization.......................................................................... 9
2.3 Water Quality Impairment ................................................................................ 12
2.4 Source Assessment .............................................................................................. 17 3.0 TARGETED WATER QUALITY GOAL.................................................................... 27
4.0 TOTAL MAXIMUM DAILY LOADS AND SOURCE ALLOCATION.................. 27
4.1 Overview .............................................................................................................. 27
4.2 Analysis Framework........................................................................................... 28
4.3 Estimating Baseline Loads ................................................................................. 29
4.4 Critical Condition and Seasonality ................................................................... 33
4.5 Margin of Safety.................................................................................................. 36
4.6 Scenario Descriptions ......................................................................................... 37
4.7 TMDL Loading Caps.......................................................................................... 41
4.8 TMDL Allocations .............................................................................................. 44
4.9 Summary.............................................................................................................. 47 5.0 ASSURANCE OF IMPLEMENTATION .................................................................... 49
REFERENCES............................................................................................................................ 50
FINAL
Double Pipe Creek TMDL Fecal Bacteria Document version: October 1, 2009
Appendix A – Bacteria Data ..................................................................................................... A1
Appendix B – Flow Duration Curve Analysis to Define Strata ..............................................B1
Appendix C – BST Report ........................................................................................................ C1
Appendix D – Estimating Maximum Daily Loads.................................................................. D1
Appendix E – Relationship of Fecal Bacteria TMDLs for the Double Pipe Creek, Upper
Monocacy River, and Lower Monocacy River Watersheds....................................................E1

FINAL
Double Pipe Creek TMDL Fecal Bacteria Document version: October 1, 2009
i
List of Figures
Figure 2.1.1: Location Map of the Double Pipe Creek Basin........................................................ 4 Figure 2.1.2: Land Use of the Double Pipe Creek Watershed....................................................... 6 Figure 2.1.3: Population Density in Double Pipe Creek Basin...................................................... 8 Figure 2.2.1: Monitoring Stations and Subwatersheds in the Double Pipe Creek Basin............. 11 Figure 2.3.1: Conceptual Diagram of Flow Duration Zones ....................................................... 14 Figure 2.4.1: Sanitary Sewer Service and Septics Areas in Double Pipe Creek Watershed ....... 19 Figure 2.4.2: Sanitary Sewer Overflows Areas in Double Pipe Creek Watershed...................... 21 Figure 2.4.3: Permitted Point Sources Discharging Fecal Bacteria in Double Pipe Creek
Watershed ............................................................................................................................. 23 Figure 4.2.1: Diagram of Non-tidal Bacteria TMDL Analysis Framework ................................ 29 Figure A-1: E. coli Concentration vs. Time for Double Pipe Creek Monitoring Station BEB0009
.............................................................................................................................................. A6 Figure A-2: E. coli Concentration vs. Time for Double Pipe Creek Monitoring Station BPC0006
.............................................................................................................................................. A6 Figure A-3: E. coli Concentration vs. Time for Double Pipe Creek Monitoring Station BPC0120
.............................................................................................................................................. A7 Figure A-4: E. coli Concentration vs. Time for Double Pipe Creek Monitoring Station LPC0032
.............................................................................................................................................. A7 Figure A-5: E. coli Concentration vs. Time for Double Pipe Creek Monitoring Station LPC0091
.............................................................................................................................................. A8 Figure A-6: E. coli Concentration vs. Time for Double Pipe Creek Monitoring Station MEB0000
.............................................................................................................................................. A8 Figure A-7: E. coli Concentration vs. Time for Double Pipe Creek Monitoring Station SAM0001
.............................................................................................................................................. A9 Figure B-1: Double Pipe Creek Flow Duration Curves...............................................................B2 Figure B-2: E. coli Concentration vs. Flow Duration for Double Pipe Creek Monitoring Station
BEB0009...............................................................................................................................B4 Figure B-3: E. coli Concentration vs. Flow Duration for Double Pipe Creek Monitoring Station
BPC0006 ...............................................................................................................................B5 Figure B-4: E. coli Concentration vs. Flow Duration for Double Pipe Creek Monitoring Station
BPC0120 ...............................................................................................................................B5 Figure B-5: E. coli Concentration vs. Flow Duration for Double Pipe Creek Monitoring Station
LPC0032 ...............................................................................................................................B6 Figure B-6: E. coli Concentration vs. Flow Duration for Double Pipe Creek Monitoring Station
LPC0091 ...............................................................................................................................B6 Figure B-7: E. coli Concentration vs. Flow Duration for Double Pipe Creek Monitoring Station
MEB0000..............................................................................................................................B7 Figure B-8: E. coli Concentration vs. Flow Duration for Double Pipe Creek Monitoring Station
SAM0001..............................................................................................................................B7 Figure C-1: Double Pipe Creek Classification Model: Percent Correct versus Percent Unknown
using a combined DOP-LMO-UMO library........................................................................ C9 Figure C-2: Map of Double Pipe Creek Watershed...................................................................C10 Figure C-3. Double Pipe Creek Watershed relative contributions by probable sources of
Enterococcus contamination. ..............................................................................................C17
FINAL
Double Pipe Creek TMDL Fecal Bacteria Document version: October 1, 2009
ii
Figure E-1: Location of the Double Pipe Creek, Upper Monocacy River, and Lower Monocacy River Watersheds ..................................................................................................................E2
Figure E-2: Flow Schematic of the Double Pipe Creek, Upper Monocacy River, and Lower Monocacy River Watersheds ................................................................................................E3
List of Tables Table 2.1.1: Land Use Percentage Distribution for Double Pipe Creek Basin.............................. 5 Table 2.1.2: Number of Dwellings Per Acre ................................................................................. 7 Table 2.1.3: Total Population Per Subwatershed in Double Pipe Creek Watershed ..................... 7 Table 2.2.1: Historical Monitoring Data in the Double Pipe Creek Watershed .......................... 10 Table 2.2.2: Locations of DNR (CORE) Monitoring Station in the Double Pipe Creek
Watershed ............................................................................................................................. 10 Table 2.2.3: Locations of MDE Monitoring Stations in the Double Pipe Creek Watershed....... 10 Table 2.2.4: Locations of USGS Gauging Stations in Double Pipe Creek Watershed................ 10 Table 2.3.1: Bacteria Criteria Values from COMAR 26.08.02.03-3 Water Quality Criteria
Specific to Designated Uses: Table 1 ................................................................................... 12 Table 2.3.2: Weighting Factors for Average Hydrology Year Used for Estimation of Geometric
Means in the Double Pipe Creek Watershed ........................................................................ 14 Table 2.3.3: Double Pipe Creek Annual Steady-State Geometric Means by Stratum per
Subwatersheds....................................................................................................................... 16 Table 2.3.4: Double Pipe Creek Seasonal (May 1st-September 30th) Period Steady-State
Geometric Means by Stratum per Subwatersheds ................................................................ 17 Table 2.4.1: Septic Systems and Households Per Subwatershed in Double Pipe Creek Watershed
............................................................................................................................................... 18 Table 2.4.2: NPDES Permit Holders with Permits Regulating Fecal Bacteria Discharge in the
Double Pipe Creek Watershed .............................................................................................. 22 Table 2.4.3: Distribution of Fecal Bacteria Source Loads in the Double Pipe Creek Basin for the
Annual Period ....................................................................................................................... 25 Table 2.4.4: Distribution of Fecal Bacteria Source Loads in the Double Pipe Creek Basin for the
Seasonal Period (May 1st – September 30th) ......................................................................... 26 Table 4.3.1: Baseline Loads Calculations.................................................................................... 33 Table 4.4.1: Hydrological Conditions Used to Account for Critical Condition and Seasonality 34 Table 4.4.2: Required Reductions of Fecal Bacteria to Meet Water Quality Standards ............. 35 Table 4.6.1: Bacteria Source Distributions and Corresponding Baseline Loads Used in the
TMDL Analysis .................................................................................................................... 37 Table 4.6.2: Maximum Practicable Reduction Targets ............................................................... 38 Table 4.6.3: Practicable Reduction Scenario Results .................................................................. 39 Table 4.6.4: TMDL Scenario Results: Percent Reductions Based on Optimization Model
Allowing Up to 98% Reduction............................................................................................ 40 Table 4.7.1: Double Pipe Creek Subwatersheds Annual Average TMDL Summary.................. 42 Table 4.7.2: TMDL Loads by Source Category - Annual Average Conditions .......................... 42 Table 4.7.3: Double Pipe Creek Watershed Maximum Daily Loads Summary.......................... 44 Table 4.8.1: Potential Source Contributions for TMDL Allocations........................................... 45 Table 4.8.2: Annual Average Stormwater Allocations................................................................ 46

FINAL
Double Pipe Creek TMDL Fecal Bacteria Document version: October 1, 2009
iii
Table 4.9.1: Double Pipe Creek Watershed TMDL .................................................................... 47 Table 4.9.2: Double Pipe Creek Watershed Maximum Daily Loads .......................................... 48 Table A-1: Measured Bacteria Concentration with Daily Flow Frequency ............................... A1 Table B-1: USGS Gauges in the Double Pipe Creek Watershed.................................................B1 Table B-2: Definition of Flow Regimes ......................................................................................B2 Table B-3: Weighting Factors for Estimation of Geometric Mean .............................................B4 Table C-1. Antibiotics and concentrations used for ARA. ..........................................................C5 Table C-2: Double Pipe Creek. Category, total number, and number of unique patterns in the
Double Pipe Creek known-source library and in the combined DOP-LMO-UMO known-source library. .......................................................................................................................C7
Table C-3: Double Pipe Creek. Number of isolates not classified, percent unknown, and percent correct for eight (8) threshold probabilities for DOP known-source isolates using the combined DOP-LMO-UMO known-source library..............................................................C8
Table C-4: Double Pipe Creek. Actual species categories versus predicted categories, at 50% probability cutoff, with rates of correct classification (RCC) for each category................C11
Table C-5: Probable host source distribution of water isolates by species category, based on DOP-LMO-UMO combination library model with a 50% threshold probability. .............C11
Table C-6: Double Pipe Creek. Enterococcus isolates obtained from water collected during the spring, summer, fall, and winter seasons, by monitoring station........................................C12
Table C-7: Double Pipe Creek. BST Analysis: Number of Isolates per Station per Date..........C12 Table C-8: Double Pipe Creek. BST Analysis: Percentage of Sources per Station per Date...C14 Table D-1: Percentiles of Maximum Observed Bacteria Concentrations in the Double Pipe Creek
Subwatersheds...................................................................................................................... D4 Table D-2: Long-term Annual Average (LTA) TMDL Bacteria Concentrations ....................... D5 Table D-3: Maximum Daily Load (MDL) Concentrations.......................................................... D6 Table D-4: Maximum Daily Loads (MDL) ................................................................................. D8 Table D-5: Double Pipe Creek Watershed Maximum Daily Loads ........................................... D9 Table E-1: Fecal Bacteria Baseline Loads ....................................................................................E4 Table E-2: Double Pipe Creek TMDL..........................................................................................E4 Table E-3: Upper Monocacy River TMDL Summary..................................................................E4 Table E-4: Lower Monocacy River TMDL Summary .................................................................E4
FINAL
Double Pipe Creek TMDL Fecal Bacteria Document version: October 1, 2009
iv
List of Abbreviations
ARCC Average rates of correct classification ARA Antibiotic Resistance Analysis BMP Best Management Practice BST Bacteria Source Tracking CAFO Confined Animal Feeding Operations cfs Cubic Feet per Second CFR Code of Federal Regulations CFU Colony Forming Units COMAR Code of Maryland Regulations CSO Combined Sewer Overflow CSS Combined Sewer System CWA Clean Water Act CWP Center for Watershed Protection DNR Department of Natural Resources EPA United States Environmental Protection Agency GIS Geographic Information System LA Load Allocation MACS Maryland Agricultural Cost Share Program MDE Maryland Department of the Environment MDP Maryland Department of Planning ml Milliliter(s) MOS Margin of Safety MPN Most Probable Number MPR Maximum Practicable Reduction MS4 Municipal Separate Storm Sewer System MST Microbial Source Tracking NPDES National Pollutant Discharge Elimination System NRCS National Resources Conservation Service RCC Rates of Correct Classification RESAC Mid-Atlantic Regional Earth Science Applications Center SSO Sanitary Sewer Overflows STATSGO State Soil Geographic Database TMDL Total Maximum Daily Load USGS United States Geological Survey WQIA Water Quality Improvement Act WLA Wasteload Allocation WQLS Water Quality Limited Segment WWTP Wastewater Treatment Plant
FINAL
Double Pipe Creek TMDL Fecal Bacteria Document version: October 1, 2009
v
EXECUTIVE SUMMARY
This document, upon approval by the U.S. Environmental Protection Agency (EPA), establishes a Total Maximum Daily Load (TMDL) for fecal bacteria in the Double Pipe Creek watershed (basin number 02-14-03-04). Section 303(d) of the federal Clean Water Act (CWA) and the EPA’s implementing regulations direct each state to identify and list waters, known as water quality limited segments (WQLSs), in which current required controls of a specified substance are inadequate to achieve water quality standards. For each WQLS, states are required to either establish a Total Maximum Daily Load (TMDL) of the specified substance that the waterbody can receive without violating water quality standards or demonstrate that water quality standards are being met. The Maryland Department of the Environment (MDE) has identified Double Pipe Creek and its tributaries Little Pipe Creek, Big Pipe Creek, Sam’s Creek, Meadow Branch, and Bear Branch in the State of Maryland’s 303(d) List as impaired by the following (years listed in parentheses): nutrients (1996), sediments (1996) and impacts to biological communities (2002). Double Pipe Creek was also listed for fecal bacteria in 2002 as category 3(a) (waters that have insufficient data and information to determine waterbody attainment status). In 2003 and 2004, MDE monitored Double Pipe Creek for fecal bacteria and the monitoring data analysis confirmed a fecal bacteria impairment in the watershed. Double Pipe Creek and its tributaries Big Pipe Creek, Little Pipe Creek, Meadow Branch and Sam’s Creek have been designated as Use IV-P waterbodies (Recreational Trout Waters and Public Water Supply). Bear Branch is designated as a Use III-P waterbody (Nontidal Cold Water and Public Water Supply). See Code of Maryland Regulations (COMAR) 26.08.02.08P. This document proposes to establish a TMDL for fecal bacteria in Double Pipe Creek that will allow for attainment of the beneficial use designation of primary contact recreation. The listings for nutrients, suspended sediments, and impacts to biological communities will be addressed separately at a future date. A data solicitation for fecal bacteria was conducted by MDE in 2003, and all readily available data from the past five years were considered. For this TMDL analysis, the Double Pipe Creek watershed has been divided into seven subwatersheds, which include the tributaries Little Pipe Creek and Big Pipe Creek (with two subwatersheds each), as well as Sam’s Creek, Meadow Branch and Bear Branch. The pollutant loads set forth in this document are for these seven subwatersheds. To establish baseline and allowable pollutant loads for this TMDL, a flow duration curve approach was employed, using flow strata estimated from United States Geological Survey (USGS) daily flow monitoring data and bacteria monitoring data. The sources of fecal bacteria are estimated at seven representative stations in the Double Pipe Creek watershed where samples were collected for one year. Multiple antibiotic resistance analysis (ARA) source tracking was used to determine the relative proportion of domestic (pets and human associated animals), human (human waste), livestock (agriculture-related animals), and wildlife (mammals and waterfowl) source categories. The allowable load is determined by estimating a baseline load from current monitoring data. The baseline load is estimated using a long-term geometric mean and weighting factors from the flow duration curve. The TMDL for fecal bacteria entering Double Pipe Creek is established after considering three different hydrological conditions: high flow and low flow annual

FINAL
Double Pipe Creek TMDL Fecal Bacteria Document version: October 1, 2009
vi
conditions; and an average seasonal condition (the period between May 1st and September 30th when water contact recreation is more prevalent). This allowable load is reported in units of Most Probable Number (MPN)/day and represents a long-term load estimated over a variety of hydrological conditions. Two scenarios were developed, with the first assessing if attainment of current water quality standards could be achieved by applying maximum practicable reductions (MPRs), and the second applying higher reductions than MPRs. Scenario solutions were based on an optimization method where the objective was to minimize the overall risk to human health, assuming that the risk varies over the four bacteria source categories. In all seven subwatersheds, it was estimated that water quality standards could not be attained with MPRs. Thus, for these subwatersheds, the second scenario with higher maximum reductions was applied. The fecal bacteria long-term annual average TMDL for the Double Pipe Creek watershed is 282,168 billion MPN E. coli/year, with a maximum daily load of 8,082 MPN/day. These total loads represent the sum of individual TMDLs for the seven Double Pipe Creek subwatersheds. The long-term annual average TMDL represents a reduction of approximately 97.6 % from the baseline load of 11,614,269 billion MPN/year. The TMDL is distributed between a load allocation (LA) for nonpoint sources and waste load allocations (WLAs) for point sources, including National Pollutant Discharge Elimination System (NPDES) wastewater treatment plants (WWTPs) and NPDES regulated stormwater discharges, including municipal separate storm sewer systems (MS4s). The long-term annual average allocations are as follows: the LA is 181,528 billion MPN E. coli/year. The WWTP WLA is 9,391 billion MPN E. coli/year. The Stormwater WLA is 91,249 billion MPN E. coli/year. The margin of safety (MOS) has been incorporated using a conservative assumption by estimating the loading capacity of the stream based on a water quality endpoint concentration more stringent than the applicable MD water quality standard criterion. The E. coli water quality criterion concentration was reduced by 5%, from 126 MPN/100ml to 119.7 MPN/100ml. The maximum daily loads, estimated using predicted long-term annual average TMDL concentrations (after source controls), are allocated as follows: the LA is 6,148 billion MPN E. coli/day. The WWTP WLA is 80 billion MPN E. coli/day. The Stormwater WLA is 1,854 billion MPN E. coli/day. Since Double Pipe Creek is a major tributary of the Upper Monocacy River, which also receives an upstream load from Pennsylvania and in turn flows into the Lower Monocacy River, an appendix is included that explains the hydrologic relationship of the three watersheds, along with a comprehensive TMDL summary for the entire Monocacy River basin (Appendix E). Once EPA has approved a TMDL, and it is known what measures must be taken to reduce pollution levels, implementation of best management practices (BMPs) is expected to take place. MDE intends for the required reductions to be implemented in an iterative process that first addresses those sources with the largest impacts to water quality and creating the greatest risks to

FINAL
Double Pipe Creek TMDL Fecal Bacteria Document version: October 1, 2009
vii
human health, with consideration given to ease and cost of implementation. In addition, follow-up monitoring plans will be established to track progress and to assess the implementation efforts. As previously stated, water quality standards cannot be attained in any of the seven Double Pipe Creek subwatersheds, using the MPR scenario. MPRs may not be sufficient in subwatersheds where wildlife is a significant component or where very high reductions of fecal bacteria loads are required to meet water quality standards. In these cases, it is expected that the MPR scenario will be the first stage of TMDL implementation. Progress will be made through the iterative implementation process described above, and the situation will be reevaluated in the future.

FINAL
Double Pipe Creek TMDL Fecal Bacteria Document version: October 1, 2009
1
1.0 INTRODUCTION
This document, upon approval by the U.S. Environmental Protection Agency (EPA), establishes a Total Maximum Daily Load (TMDL) for fecal bacteria in Double Pipe Creek (basin number 02-14-03-04). Section 303(d)(1)(C) of the federal Clean Water Act (CWA) and the U.S. Environmental Protection Agency’s (EPA) implementing regulations direct each state to develop a TMDL for each impaired water quality limited segment (WQLS) on the Section 303(d) List, taking into account seasonal variations and a protective margin of safety (MOS) to account for uncertainty. A TMDL reflects the total pollutant loading of the impairing substance a waterbody can receive and still meet water quality standards. TMDLs are established to achieve and maintain water quality standards. A water quality standard is the combination of a designated use for a particular body of water and the water quality criteria designed to protect that use. Designated uses include activities such as swimming, drinking water supply, and shellfish propagation and harvest. Water quality criteria consist of narrative statements and numeric values designed to protect the designated uses. Criteria may differ among waters with different designated uses. Double Pipe Creek and its tributaries, Little Pipe Creek, Big Pipe Creek, Sam’s Creek, Meadow Branch and Bear Branch, have been identified in the State of Maryland’s 303(d) List as impaired by the following (years listed in parentheses): nutrients (1996), sediments (1996) and impacts to biological communities (2002). It was also listed for fecal bacteria in 2002 as category 3(a) (waters that have insufficient data and information to determine waterbody attainment status). In 2003 and 2004, MDE monitored Double Pipe Creek for fecal bacteria and the monitoring data analysis confirmed a fecal bacteria impairment in the watershed. Therefore, this report documents a TMDL of fecal bacteria for the watershed. Double Pipe Creek and its tributaries Big Pipe Creek, Little Pipe Creek, Meadow Branch and Sam’s Creek have been designated as Use IV-P waterbodies (Recreational Trout Waters and Public Water Supply). Bear Branch is designated as a Use III-P waterbody (Nontidal Cold Water and Public Water Supply). See Code of Maryland Regulations (COMAR) 26.08.02.08P. This document proposes to establish a TMDL for fecal bacteria in Double Pipe Creek that will allow for attainment of the beneficial use designation of primary contact recreation. The listings for nutrients, suspended sediments, and impacts to biological communities will be addressed separately at a future date. A data solicitation for fecal bacteria was conducted by MDE in 2003, and all readily available data from the past five years were considered. Fecal bacteria are microscopic single-celled organisms (primarily fecal coliform and fecal streptococci) found in the wastes of warm-blooded animals. Their presence in water is used to assess the sanitary quality of water for body-contact recreation, for consumption of molluscan bivalves (shellfish), and for drinking water. Excessive amounts of fecal bacteria in surface water used for recreation are known to indicate an increased risk of pathogen-induced illness to humans. Infections due to pathogen-contaminated recreation waters include gastrointestinal, respiratory, eye, ear, nose, throat, and skin diseases (US EPA 1986).

FINAL
Double Pipe Creek TMDL Fecal Bacteria Document version: October 1, 2009
2
In 1986, EPA published “Ambient Water Quality Criteria for Bacteria,” in which three indicator organisms were assessed to determine their correlation with swimming-associated illnesses. Fecal coliform, E. coli and enterococci were the indicators used in the analysis. Fecal coliform bacteria are a subgroup of total coliform bacteria and E. coli bacteria are a subgroup of fecal coliform bacteria. Most E. coli are harmless and are found in great quantities in the intestines of people and warm-blooded animals. However, certain pathogenic strains may cause illness. Enterococci are a subgroup of bacteria in the fecal streptococcus group. Fecal coliform, E. coli and enterococci can all be classified as fecal bacteria. The results of the EPA study demonstrated that fecal coliform showed less correlation to swimming-associated gastroenteritis than did either E. coli or enterococci. Based on EPA’s guidance (US EPA 1986), adopted by Maryland in 2004, the State has revised the bacteria water quality criteria and it is now based on water column limits for either E. coli or enterococci. Because multiple monitoring datasets are available within this watershed for various pathogen indicators, the general term fecal bacteria will be used to refer to the impairing substance throughout this document. The TMDL will be based on the pathogen indicator organisms specified in Maryland’s current bacteria water quality criteria, either E. coli or enterococci. The indicator organism used in the Double Pipe Creek TMDL analysis was E. coli.

FINAL
Double Pipe Creek TMDL Fecal Bacteria Document version: October 1, 2009
3
2.0 SETTING AND WATER QUALITY DESCRIPTION
2.1 General Setting
Location
The Double Pipe Creek watershed is located in Carroll and Frederick Counties in Maryland (MD) (Figure 2.1.1). The total drainage area of Double Pipe Creek is approximately 192.6 square miles (123,232 acres), and lies north, west, and southwest of the Westminster metropolitian area. Double Pipe Creek and its tributaries flow through several small towns that include Manchester, Union Bridge, Taneytown, New Windsor, and Westminster. The headwaters of Double Pipe Creek originate in Westminster and Manchester, flowing west toward the city of Rocky Ridge, entering the Monocacy River and eventually emptying into the Middle Potomac River near the town of Dickerson. There are two major drainage areas comprising the Double Pipe Creek watershed: Big Pipe Creek and Little Pipe Creek. These branches are free-flowing (non-tidal) streams, and flow into Double Pipe Creek at Detour and Keymar, MD before discharging into the Monocacy River at Rocky Ridge.

FINAL
Double Pipe Creek TMDL Fecal Bacteria Document version: October 1, 2009
4
Figure 2.1.1: Location Map of the Double Pipe Creek Basin
FINAL
Double Pipe Creek TMDL Fecal Bacteria Document version: October 1, 2009
5
Land Use
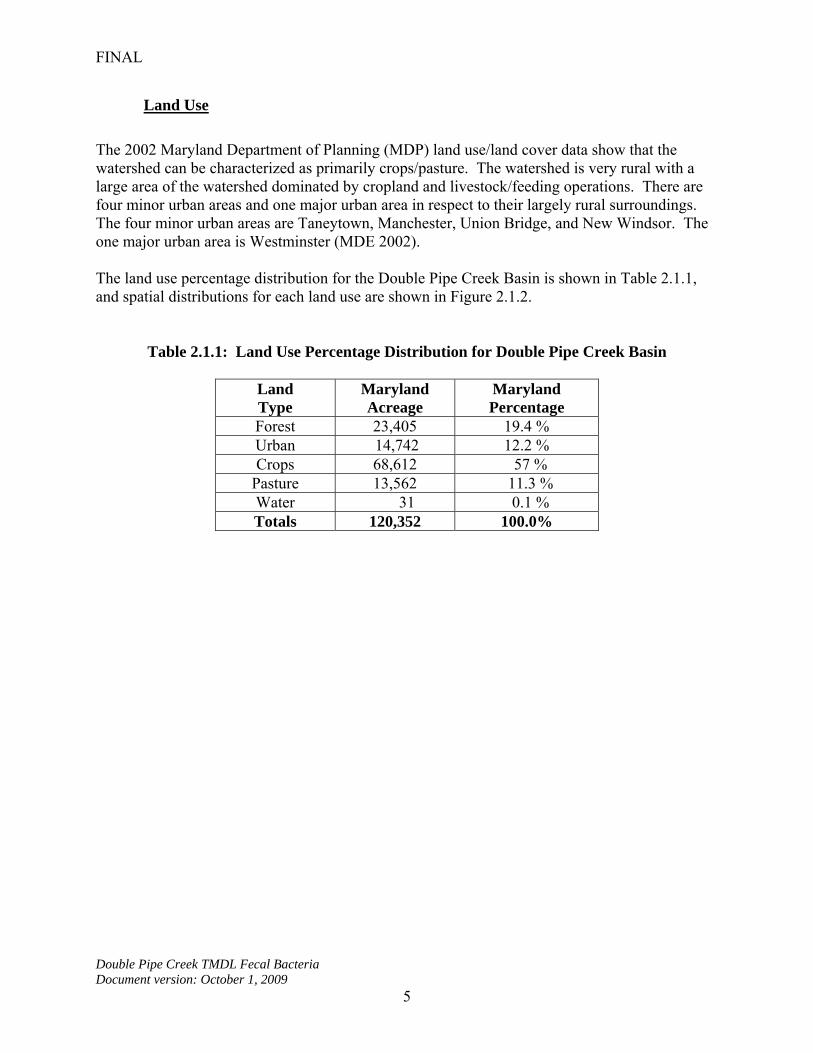
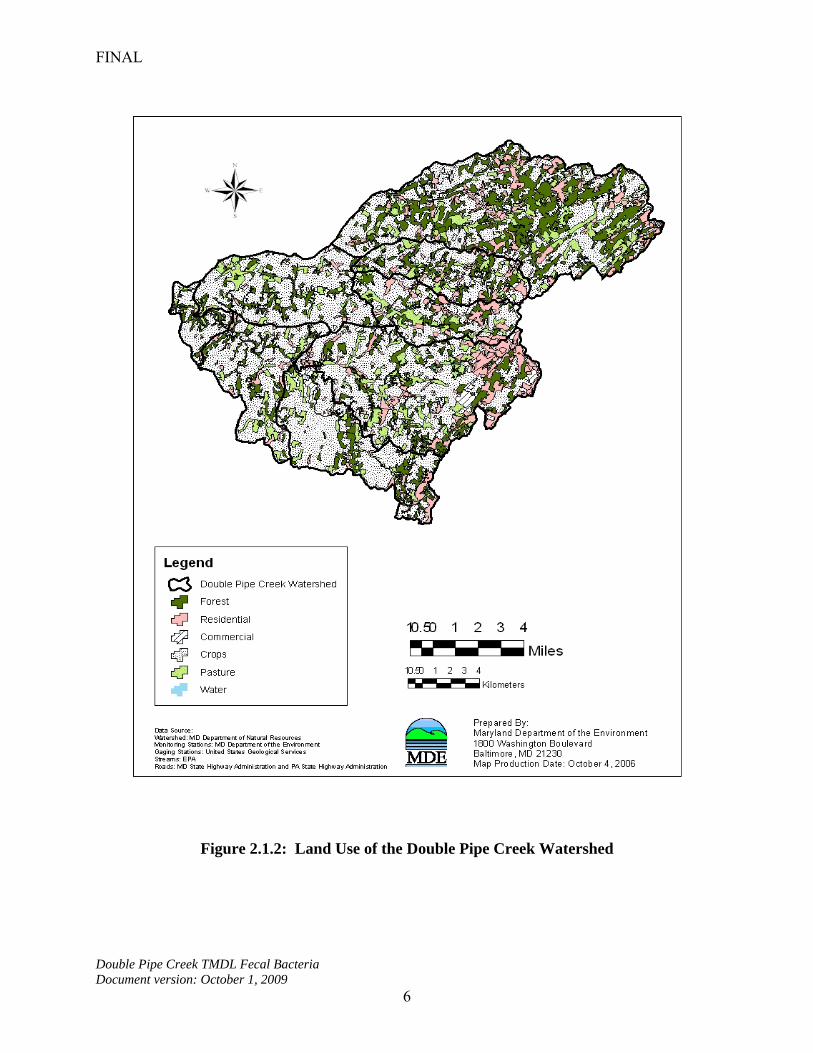
The 2002 Maryland Department of Planning (MDP) land use/land cover data show that the watershed can be characterized as primarily crops/pasture. The watershed is very rural with a large area of the watershed dominated by cropland and livestock/feeding operations. There are four minor urban areas and one major urban area in respect to their largely rural surroundings. The four minor urban areas are Taneytown, Manchester, Union Bridge, and New Windsor. The one major urban area is Westminster (MDE 2002). The land use percentage distribution for the Double Pipe Creek Basin is shown in Table 2.1.1, and spatial distributions for each land use are shown in Figure 2.1.2.
Table 2.1.1: Land Use Percentage Distribution for Double Pipe Creek Basin
Land Type
Maryland Acreage
Maryland Percentage
Forest 23,405 19.4 % Urban 14,742 12.2 % Crops 68,612 57 %
Pasture 13,562 11.3 % Water 31 0.1 % Totals 120,352 100.0%
FINAL
Double Pipe Creek TMDL Fecal Bacteria Document version: October 1, 2009
6
Figure 2.1.2: Land Use of the Double Pipe Creek Watershed
FINAL
Double Pipe Creek TMDL Fecal Bacteria Document version: October 1, 2009
7
Population
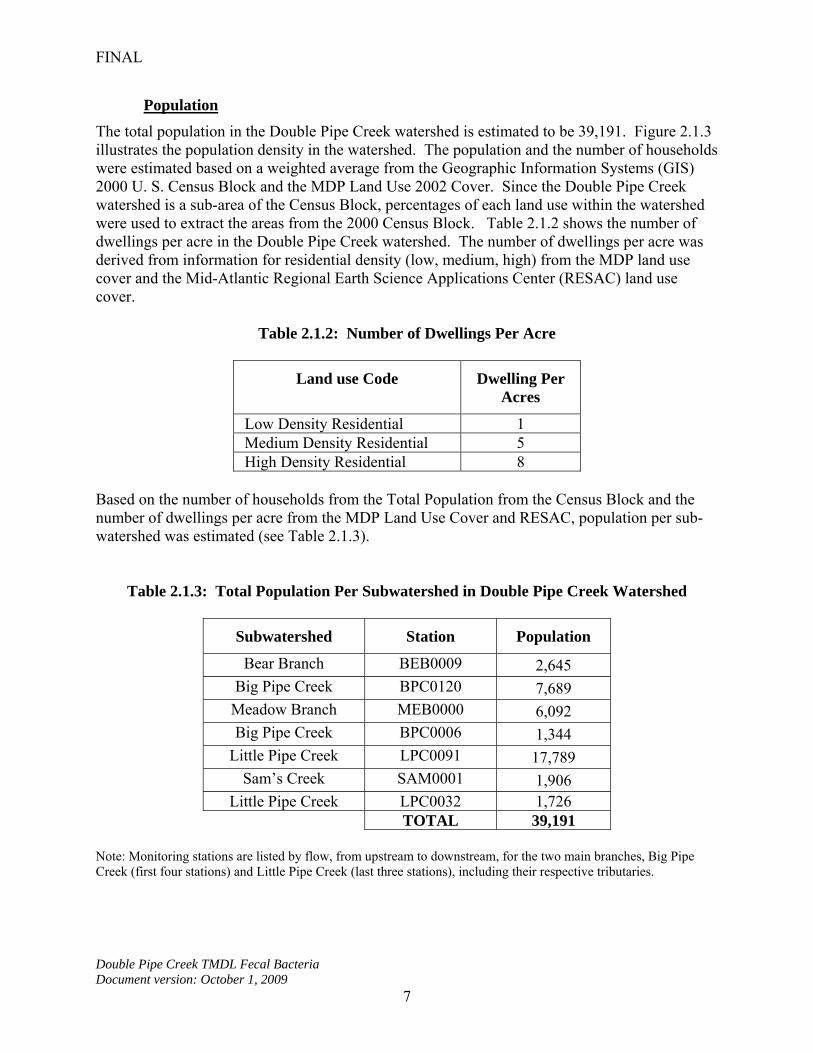
The total population in the Double Pipe Creek watershed is estimated to be 39,191. Figure 2.1.3 illustrates the population density in the watershed. The population and the number of households were estimated based on a weighted average from the Geographic Information Systems (GIS) 2000 U. S. Census Block and the MDP Land Use 2002 Cover. Since the Double Pipe Creek watershed is a sub-area of the Census Block, percentages of each land use within the watershed were used to extract the areas from the 2000 Census Block. Table 2.1.2 shows the number of dwellings per acre in the Double Pipe Creek watershed. The number of dwellings per acre was derived from information for residential density (low, medium, high) from the MDP land use cover and the Mid-Atlantic Regional Earth Science Applications Center (RESAC) land use cover.
Table 2.1.2: Number of Dwellings Per Acre
Land use Code Dwelling Per Acres
Low Density Residential 1 Medium Density Residential 5 High Density Residential 8
Based on the number of households from the Total Population from the Census Block and the number of dwellings per acre from the MDP Land Use Cover and RESAC, population per sub-watershed was estimated (see Table 2.1.3).
Table 2.1.3: Total Population Per Subwatershed in Double Pipe Creek Watershed
Subwatershed Station Population
Bear Branch BEB0009 2,645 Big Pipe Creek BPC0120 7,689
Meadow Branch MEB0000 6,092 Big Pipe Creek BPC0006 1,344
Little Pipe Creek LPC0091 17,789 Sam’s Creek SAM0001 1,906
Little Pipe Creek LPC0032 1,726 TOTAL 39,191
Note: Monitoring stations are listed by flow, from upstream to downstream, for the two main branches, Big Pipe Creek (first four stations) and Little Pipe Creek (last three stations), including their respective tributaries.

FINAL
Double Pipe Creek TMDL Fecal Bacteria Document version: October 1, 2009
8
Figure 2.1.3: Population Density in Double Pipe Creek Basin
FINAL
Double Pipe Creek TMDL Fecal Bacteria Document version: October 1, 2009
9
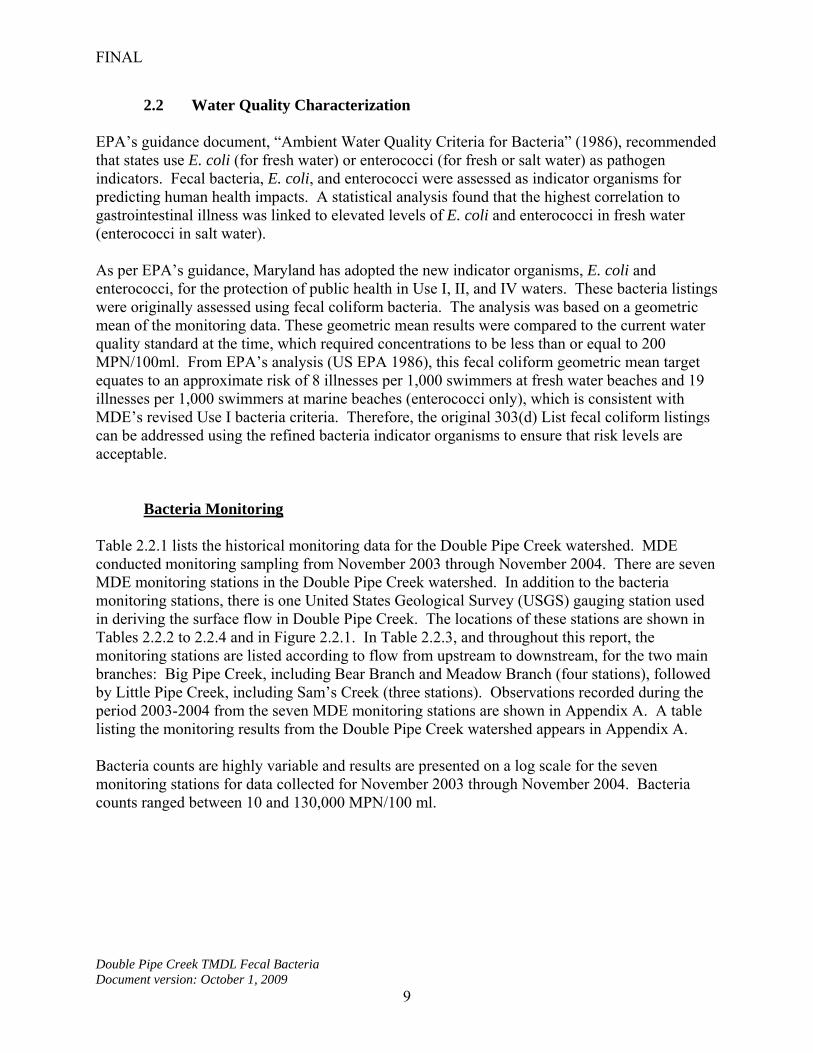
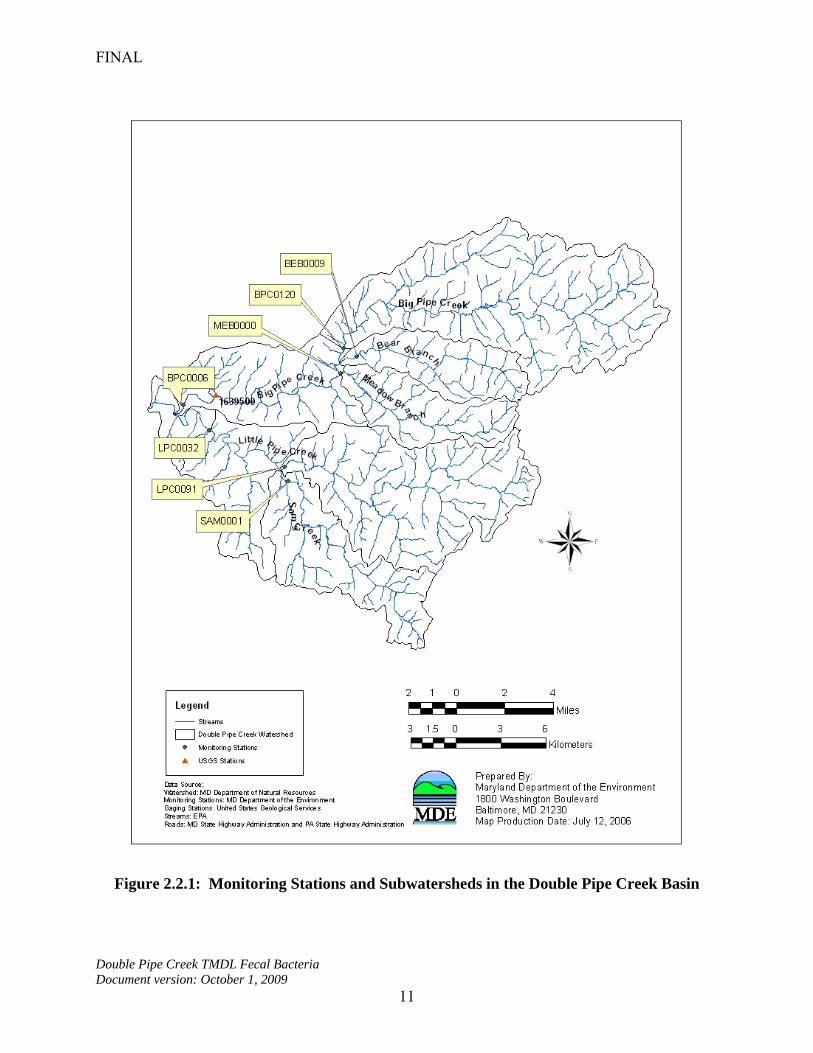
2.2 Water Quality Characterization EPA’s guidance document, “Ambient Water Quality Criteria for Bacteria” (1986), recommended that states use E. coli (for fresh water) or enterococci (for fresh or salt water) as pathogen indicators. Fecal bacteria, E. coli, and enterococci were assessed as indicator organisms for predicting human health impacts. A statistical analysis found that the highest correlation to gastrointestinal illness was linked to elevated levels of E. coli and enterococci in fresh water (enterococci in salt water). As per EPA’s guidance, Maryland has adopted the new indicator organisms, E. coli and enterococci, for the protection of public health in Use I, II, and IV waters. These bacteria listings were originally assessed using fecal coliform bacteria. The analysis was based on a geometric mean of the monitoring data. These geometric mean results were compared to the current water quality standard at the time, which required concentrations to be less than or equal to 200 MPN/100ml. From EPA’s analysis (US EPA 1986), this fecal coliform geometric mean target equates to an approximate risk of 8 illnesses per 1,000 swimmers at fresh water beaches and 19 illnesses per 1,000 swimmers at marine beaches (enterococci only), which is consistent with MDE’s revised Use I bacteria criteria. Therefore, the original 303(d) List fecal coliform listings can be addressed using the refined bacteria indicator organisms to ensure that risk levels are acceptable. Bacteria Monitoring Table 2.2.1 lists the historical monitoring data for the Double Pipe Creek watershed. MDE conducted monitoring sampling from November 2003 through November 2004. There are seven MDE monitoring stations in the Double Pipe Creek watershed. In addition to the bacteria monitoring stations, there is one United States Geological Survey (USGS) gauging station used in deriving the surface flow in Double Pipe Creek. The locations of these stations are shown in Tables 2.2.2 to 2.2.4 and in Figure 2.2.1. In Table 2.2.3, and throughout this report, the monitoring stations are listed according to flow from upstream to downstream, for the two main branches: Big Pipe Creek, including Bear Branch and Meadow Branch (four stations), followed by Little Pipe Creek, including Sam’s Creek (three stations). Observations recorded during the period 2003-2004 from the seven MDE monitoring stations are shown in Appendix A. A table listing the monitoring results from the Double Pipe Creek watershed appears in Appendix A. Bacteria counts are highly variable and results are presented on a log scale for the seven monitoring stations for data collected for November 2003 through November 2004. Bacteria counts ranged between 10 and 130,000 MPN/100 ml.

FINAL
Double Pipe Creek TMDL Fecal Bacteria Document version: October 1, 2009
10
Table 2.2.1: Historical Monitoring Data in the Double Pipe Creek Watershed Sponsor Location Date Design Summary
MDE MD 11/03 to 10/04 E. coli 7 stations 2 samples per month
MDE MD 11/03 to 10/04 BST(ARA) (enterococci)
7 stations 1 sample per month
Table 2.2.2: Locations of DNR (CORE) Monitoring Station in the Double Pipe Creek Watershed
Tributary Monitoring
Station LATITUDE
Dec-Deg LONGITUDE
Dec-Deg Big Pipe Creek BPC0035 39o 36.733 77o 14.216’
Table 2.2.3: Locations of MDE Monitoring Stations in the Double Pipe Creek Watershed
Table 2.2.4: Locations of USGS Gauging Stations in Double Pipe Creek Watershed
Monitoring Station
Observation Period Used in
TMDL Analysis
Total Observations
LATITUDE Dec-deg
LONGITUDE Dec-deg
01639500 1989 – 2004 5,477 39o 36.742’ 77o 14.247’
Tributary Monitoring
Station Observation
Period Total
Observations LATITUDE
Dec-Deg LONGITUDE
Dec-Deg Bear Branch BEB0009 2003 - 2004 22 39o 38.130’ 77 07.692
Big Pipe Creek BPC0120 2003 - 2004 22 39o 38.423’ 77 08.304
Meadow Branch MEB0000 2003 - 2004 22 39o 37.522’ 77 08.454
Big Pipe Creek BPC0006 2003 - 2004 22 39o 36.360’ 77 15.789 Little Pipe Creek LPC0091 2003 - 2004 22 39o 34.130’ 77 11.041
Sam’s Creek SAM0001 2003 - 2004 22 39o 33.611’ 77 10.884 Little Pipe Creek LPC0032 2003 - 2004 22 39o 35.464’ 77 14.560
FINAL
Double Pipe Creek TMDL Fecal Bacteria Document version: October 1, 2009
11
Figure 2.2.1: Monitoring Stations and Subwatersheds in the Double Pipe Creek Basin
FINAL
Double Pipe Creek TMDL Fecal Bacteria Document version: October 1, 2009
12
2.3 Water Quality Impairment
Designated Uses and Water Quality Standard The Maryland water quality standards Surface Water Use Designation for the Double Pipe Creek mainstem and its tributaries Big Pipe Creek, Little Pipe Creek, Meadow Branch and Sam’s Creek, is Use IV-P (Water Contact Recreation, Protection of Aquatic Life, Recreational Trout Waters and Public Water Supply); its tributary Bear Branch is designated as Use III-P (Water Contact Recreation, Protection of Aquatic Life, Non-tidal Cold Water and Public Water Supply) (COMAR 26.08.02.08P). The Double Pipe Creek watershed was listed for fecal bacteria in 2002 as category 3(a) (waters that have insufficient data and information to determine waterbody attainment status). Data collected by MDE in 2003-2004 showed high levels of fecal bacteria in seven monitoring stations throughout the watershed, confirming the fecal bacteria impairment and resulting in the development of this fecal bacteria TMDL.
Water Quality Criteria The State water quality standard for bacteria (E. coli) used in this study is as follows (COMAR 26.08.02.03-3): Table 2.3.1: Bacteria Criteria Values from COMAR 26.08.02.03-3 Water Quality Criteria
Specific to Designated Uses: Table 1
Indicator Steady-state Geometric Mean
Indicator Density
Freshwater
E. coli 126 MPN/100 ml
Interpretation of Bacteria Data for General Recreational Use The relevant portion (for freshwater) of the listing methodology pursuant to the 2006 Integrated 303(d) List for all Use Waters - Water Contact Recreation and Protection of Aquatic Life is as follows: Recreational Waters A steady-state geometric mean will be calculated with available data where there are at least five representative sampling events. The data shall be from samples collected during steady-state conditions and during the beach season (Memorial Day through Labor Day) to be representative of the critical condition. If the resulting steady-state geometric mean is greater than 126 E. coli MPN/100 ml in freshwater, the waterbody will be listed as impaired. If fewer than five representative sampling events for an area being assessed are available, data from the previous two years will be evaluated in the same way. The single sample maximum criterion applies only

FINAL
Double Pipe Creek TMDL Fecal Bacteria Document version: October 1, 2009
13
to beaches and is to be used for closure and advisory decisions based on short term exceedances of the geometric mean portion of the standard. Water Quality Assessment Bacteria water quality impairment in Double Pipe Creek was assessed by comparing both the annual and the seasonal (May 1st –September 30th) steady-state geometric means of E. coli concentrations with the water quality criterion. Graphs illustrating these results can be found in Appendix B. The steady-state condition is defined as unbiased sampling targeting average flow conditions and/or equally sampling or providing for unbiased sampling of high and low flows. The 1986 EPA criteria document assumed steady-state flow in determining the risk at various bacterial concentrations, and therefore the chosen criterion value also reflects steady-state conditions (EPA 1986). The steady-state geometric mean condition can be estimated either by monitoring design or more practically by statistical analysis as follows: 1. A stratified monitoring design is used where the number of samples collected is proportional to the duration of high flows, mid flows and low flows within the watershed. This sample design allows a geometric mean to be calculated directly from the monitoring data without bias. 2. Routine monitoring typically results in samples from varying hydrologic conditions (i.e., high flows, mid flows and low flows) where the numbers of samples are not proportional to the duration of those conditions. Averaging these results without consideration of the sampling conditions results in a biased estimate of the steady-state geometric mean. The potential bias of the steady-state geometric means can be reduced by weighting the samples results collected during high flow, mid flow and low flow regimes by the proportion of time each flow regime is expected to occur. This ensures that the high flow and low flow conditions are proportionally balanced. 3. If (1) the monitoring design was not stratified based on flow regime or (2) flow information is not available to weight the samples accordingly, then a geometric mean of sequential monitoring data can be used as an estimate of the steady-state geometric mean condition for the specified period. A routine monitoring design was used to collect bacteria data in the Double Pipe Creek watershed. To estimate the steady-state geometric mean, the monitoring data were first reviewed by plotting the sample results versus their corresponding daily flow duration percentile. Graphs illustrating these results can be found in Appendix B. To calculate the steady-state geometric mean with routine monitoring data, a conceptual model was developed by dividing the daily flow frequency for the stream segment into strata that are representative of hydrologic conditions. A conceptual continuum of flows is illustrated in Figure 2.3.1.

FINAL
Double Pipe Creek TMDL Fecal Bacteria Document version: October 1, 2009
14
Figure 2.3.1: Conceptual Diagram of Flow Duration Zones During high flows, a significant portion of the total stream flow is from surface flow contributions. Low flow conditions represent periods with minimal rainfall and surface runoff. There is typically a transitional mid flow period between the high and low flow durations, representative of varying contributions of surface flow inputs that result from differing rainfall volumes and antecedent soil moisture conditions. The division of the entire flow regime into strata enables the estimation of a less biased geometric mean from routine monitoring data that more closely approaches steady-state. Based on a flow analysis of several watersheds throughout Maryland, it was determined that flows within the 25th to 30th daily flow duration percentiles were representative of average daily flows. It is assumed for this analysis that flows higher than the 25th percentile flow represent high flows, and flows lower than the 25th percentile represent mid/low flows. A detailed method of how the flow strata were defined is presented in Appendix B. Factors for estimating a steady-state geometric mean are based on the frequency of each flow stratum. The weighting factor accounts for the proportion of time that each flow stratum represents. The weighting factors for an average hydrological year used in the Double Pipe Creek TMDL analysis are presented in Table 2.3.2.
Table 2.3.2: Weighting Factors for Average Hydrology Year Used for Estimation of Geometric Means in the Double Pipe Creek Watershed
Flow Duration Zone Duration Interval Weighting Factor
High Flows 0 – 25% 0.25
Mid/Low Flows 25 – 100% 0.75
1
10
100
1000
10000
0 10 20 30 40 50 60 70 80 90 100Daily Flow Duration Percentile
Flo
wFlood
Mid/Low Flow s
High Flow s
Drought
FINAL
Double Pipe Creek TMDL Fecal Bacteria Document version: October 1, 2009
15
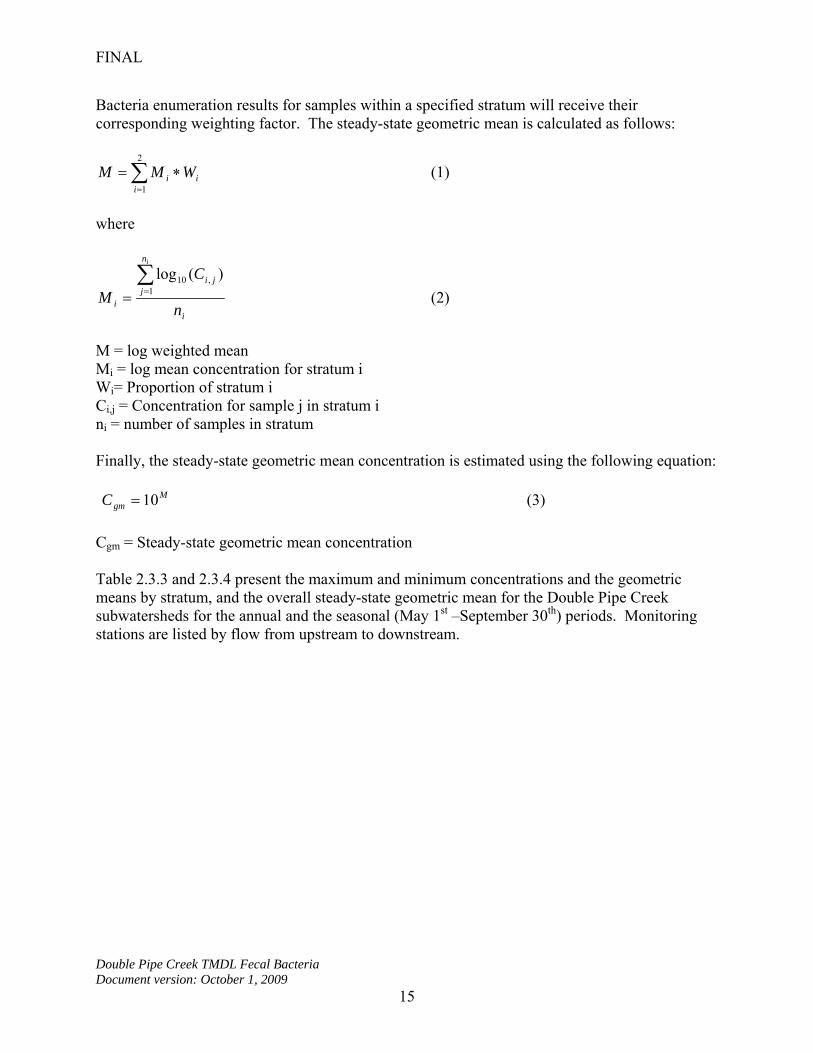
Bacteria enumeration results for samples within a specified stratum will receive their corresponding weighting factor. The steady-state geometric mean is calculated as follows:
2
1iii WMM (1)
where
i
n
jji
i n
C
M
i
1
,10 )(log
(2)
M = log weighted mean Mi = log mean concentration for stratum i Wi= Proportion of stratum i Ci,j = Concentration for sample j in stratum i ni = number of samples in stratum Finally, the steady-state geometric mean concentration is estimated using the following equation: M
gmC 10 (3)
Cgm = Steady-state geometric mean concentration Table 2.3.3 and 2.3.4 present the maximum and minimum concentrations and the geometric means by stratum, and the overall steady-state geometric mean for the Double Pipe Creek subwatersheds for the annual and the seasonal (May 1st –September 30th) periods. Monitoring stations are listed by flow from upstream to downstream.

FINAL
Double Pipe Creek TMDL Fecal Bacteria Document version: October 1, 2009
16
Table 2.3.3: Double Pipe Creek Annual Steady-State Geometric Means by Stratum per Subwatersheds
Tributary Station
Flow Stratum
# of Samples
E. coli Minimum
Concentration (MPN/100ml)
E. coli Maximum
Concentration (MPN/100ml)
Annual Steady-State Geometric
Mean (MPN/100ml)
Annual Weighted Geometric
Mean (MPN/100ml)
High 11 60 14,200 593 Bear Branch
BEB0009 Low 11 100 4,880 789 734
High 11 30 29,100 446 Big Pipe Creek
BPC0120 Low 11 110 9,210 406 416
High 11 20 8,800 570 Meadow Branch
MEB0000 Low 11 100 17,330 895 800
High 11 130 24,190 748 Big Pipe Creek
BPC0006 Low 11 10 540 189 267
High 11 210 24,190 2,041 Little Pipe Creek
LPC0091 Low 11 250 2,480 954 1,153
High 11 50 68,700 1,018 Sam’s Creek
SAM0001 Low 11 50 7,700 1,086 1,069
High 11 220 130,000 2,346.5 Little Pipe Creek
LPC0032 Low 11 180 2,910 1,057 1,290

FINAL
Double Pipe Creek TMDL Fecal Bacteria Document version: October 1, 2009
17
Table 2.3.4: Double Pipe Creek Seasonal (May 1st-September 30th) Period Steady-State Geometric Means by Stratum per Subwatersheds
Tributary Station
Flow Stratum
# of Samples
E. coli Minimum
Concentration (MPN/100ml)
E. coli Maximum
Concentration (MPN/100ml)
Seasonal Steady-State Geometric
Mean (MPN/100ml)
Seasonal Weighted Geometric
Mean (MPN/100ml)
High 2 13,000 14,200 13,587 Bear Branch
BEB0009 Low 8 660 4,880 1,259 2,282
High 2 24,190 29,100 26,532 Big Pipe Creek
BPC0120 Low 8 240 9210 582 1,512
High 2 7,700 8,800 8,232 Meadow Branch
MEB0000 Low 8 730 17,330 1,773 2,602
High 2 17,800 24,190 20,750 Big Pipe Creek
BPC0006 Low 8 180 540 305 876
High 2 15,530 24,190 19,382 Little Pipe Creek
LPC0091 Low 8 860 2,480 1,277 2,520
High 2 24,190 68,700 40,766 Sam’s Creek
SAM0001 Low 8 990 7,700 2,287 4,699
High 2 24,190 130,000 56,078 Little Pipe Creek
LPC0032 Low 8 930 2,910 1,763 4,186
2.4 Source Assessment
Nonpoint Source Assessment
Nonpoint sources of fecal bacteria do not have one discharge point but occur over the entire length of a stream or waterbody. During rain events, surface runoff transports water and fecal bacteria over the land surface and discharges to the stream system. This transport is dictated by rainfall, soil type, land use, and topography of the watershed. Many types of nonpoint sources introduce fecal bacteria to the land surface, including the manure spreading process, direct deposition from livestock during the grazing season, and excretions from pets and wildlife. The deposition of non-human fecal bacteria directly to the stream occurs when livestock or wildlife have direct access to the waterbody. Nonpoint source contributions from human activities generally arise from failing septic systems and their associated drain fields or leaking infrastructure (i.e., sewer systems). The entire Double Pipe Creek watershed is covered by two National Pollutant Discharge Elimination System (NPDES) Municipal Separate Storm Sewer System (MS4) individual permits, which are technically point sources subject to waste load allocation (WLA); therefore, nonpoint source contributions from domestic animal and human sources will be categorized as point sources and assigned to the Stormwater WLA. The

FINAL
Double Pipe Creek TMDL Fecal Bacteria Document version: October 1, 2009
18
presence of agricultural land use is significant in the watershed, and sources associated with it (i.e., livestock) contribute to the load allocation (LA) in this analysis. Wildlife contributions will be distributed between WLAs and LAs due to the presence of wildlife in both developed and undeveloped areas of the watershed. Sewer Systems The Double Pipe Creek watershed is serviced by both sewer systems and septic systems. Sewer systems are present in the towns of Westminster, New Winsdor and Union Bridge. Wastewater collected by these systems is treated at the Westminster Wastewater Treatment Plant (WWTP), the New Windsor WWTP, and the Union Bridge WWTP, all of which discharge into Little Pipe Creek.
Septic Systems
On-site disposal (septic) systems are located throughout the Double Pipe Creek watershed. Table 2.4.1 presents the total households and the number of septic systems per subwatershed. Figure 2.4.1 depicts the areas that are serviced by sewers and septic systems.
Table 2.4.1: Septic Systems and Households Per Subwatershed in Double Pipe Creek Watershed
Tributary Station Households per Subwatershed
Septic Systems (units)
Bear Branch BEB0009 1,218 761 Big Pipe Creek BPC0120 4,843 2,456
Meadow Branch MEB0000 3,125 898 Big Pipe Creek BPC0006 551 501
Little Pipe Creek LPC0091 10,595 1,636 Sam’s Creek SAM0001 1,085 741
Little Pipe Creek LPC0032 756 590 TOTAL 22,173 7,583

FINAL
Double Pipe Creek TMDL Fecal Bacteria Document version: October 1, 2009
19
Figure 2.4.1: Sanitary Sewer Service and Septics Areas in Double Pipe Creek Watershed

FINAL
Double Pipe Creek TMDL Fecal Bacteria Document version: October 1, 2009
20
Point Source Assessment There are two broad types of National Pollutant Discharge Elimination System (NPDES) permits considered in this analysis, individual and general. Both types of permits include industrial and municipal categories. Individual permits can include industrial and municipal WWTPs and Phase I municipal separate storm sewer systems (MS4s). MDE general permits have been established for surface water discharges that include the following: Phase II and other MS4 permits, surface coal mines, mineral mines, quarries, borrow pits, ready-mix concrete, asphalt plants, seafood processors, hydrostatic testing of tanks and pipelines, marinas, concentrated animal feeding operations, and stormwater associated with industrial activities.
NPDES Regulated Stormwater
Bacteria sources associated with MS4s and other NPDES regulated stormwater entities are considered point sources. Stormwater runoff is an important source of water pollution, including bacterial pollution. A MS4 is a conveyance or system of conveyances (roads with drainage systems, municipal streets, catch basins, curbs, gutters, ditches, man-made channels, storm drains) designed or used for collecting or conveying stormwater and delivering it to a waterbody. MS4s programs are designed to reduce the amount of pollution that enters a waterbody from storm sewer systems to the maximum extent practicable. The Double Pipe Creek watershed is located in Carroll and Frederick Counties, which are both individual Phase I National Pollutant Discharge Elimination System (NPDES) MS4 permit jurisdictions. Stormwater in the watershed is primarily conveyed through storm sewers covered by NPDES MS4 permits. Bacteria loads associated with these MS4s are therefore included in the Stormwater WLA of this TMDL, which also encompasses any other NPDES regulated Phase I and Phase II stormwater entities in the watershed, including State and federal permittees.
Sanitary Sewer Overflows Sanitary Sewer Overflows (SSOs) occur when the capacity of a separate sanitary sewer is exceeded. There are several factors that may contribute to SSOs from a sewerage system, including pipe capacity, operations and maintenance effectiveness, sewer design, age of system, pipe materials, geology and building codes. SSOs are prohibited by the facilities’ permits, and must be reported to MDE’s Water Management Administration in accordance with COMAR 26.08.10 to be addressed under the State’s enforcement program. There were a total of five SSOs reported to MDE between September 2003 and November 2004 in the Carroll County portion of the Double Pipe Creek watershed. Approximately 73,000 gallons of SSOs were discharged through various waterways (surface water, groundwater, sanitary sewers, etc.) in the Carroll County portion of the watershed. No SSOs were reported in the Frederick County portion of the watershed. Figure 2.4.2 depicts the locations where SSOs occurred in the watershed between September 2003 and November 2004.

FINAL
Double Pipe Creek TMDL Fecal Bacteria Document version: October 1, 2009
21
Figure 2.4.2: Sanitary Sewer Overflows Areas in Double Pipe Creek Watershed

FINAL
Double Pipe Creek TMDL Fecal Bacteria Document version: October 1, 2009
22
Municipal and Industrial Wastewater Treatment Plants (WWTPs)
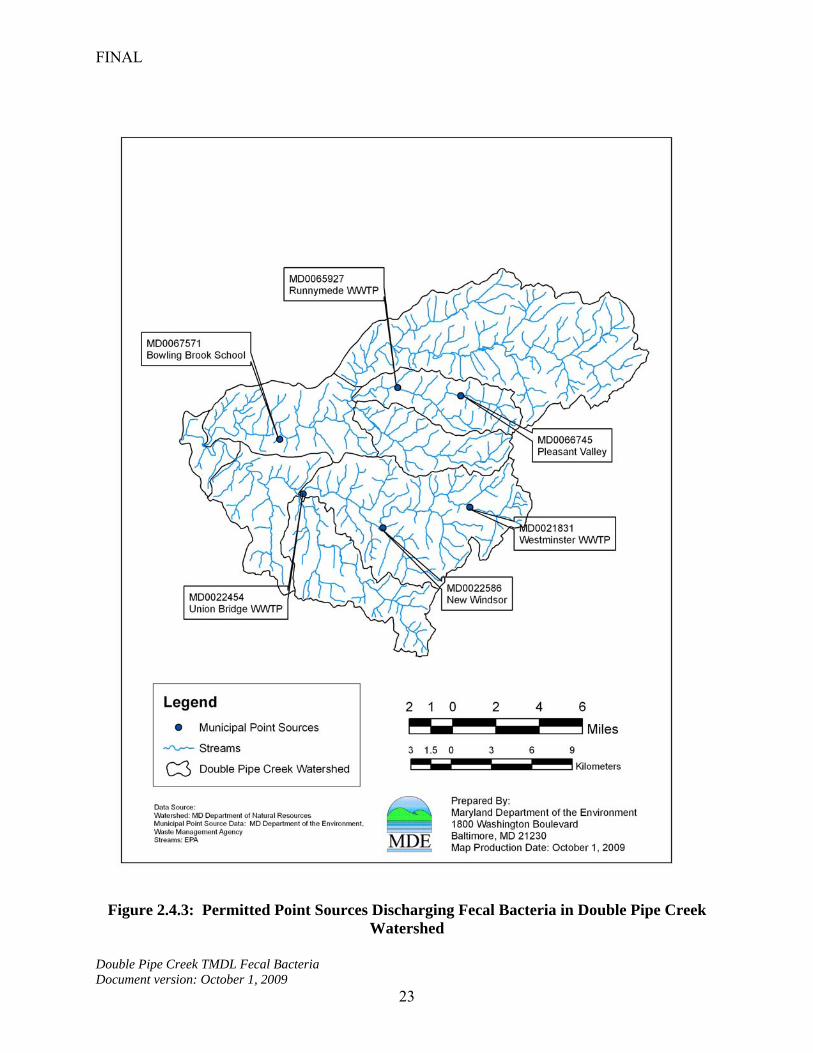
Wastewater treatment plants are designed to treat wastewater before it can be discharged to a stream or river. The goals of wastewater treatment are to protect the public health, protect aquatic life, and to prevent harmful substances from entering the environment. Based on MDE’s point source permitting information, there are six NPDES permitted point source facilities with permits regulating the discharge of fecal bacteria directly into the Double Pipe Creek watershed (Table 2.4.2 and Figure 2.4.3). These six WWTPs combined use an activated sludge process to treat approximately 4,800,000 gallons per day (4.8 MGD). Table 2.4.2 lists the active WWTPs in the Carroll County portion of the watershed. There are no WWTPs in the Frederick County portion of the watershed. Table 2.4.2: NPDES Permit Holders with Permits Regulating Fecal Bacteria Discharge in
the Double Pipe Creek Watershed
Permittee NPDES
Permit No. County
Average Annual
Flow (MGD)
Fecal Coliform Concentrations Annual AVG (MPN/100ml)
Fecal Coliform Load Per Day
(Billion MPN/day)
Westminster WWTP
MD0021831 Carroll 4.55 37.75 6.51
New Windsor WWTP
MD0022586 Carroll 0.09 4.62 0.02
Union Bridge WWTP
MD0022454 Carroll 0.14 3.49 0.02
Bowling Brook School
MD0067571 Carroll 0.005 1.81 0.0003
Runnymede WWTP
MD0065927 Carroll 0.001 3.00 0.0001
Pleasant Valley WWTP
MD0066745 Carroll 0.006 2.25 0.0005
FINAL
Double Pipe Creek TMDL Fecal Bacteria Document version: October 1, 2009
23
Figure 2.4.3: Permitted Point Sources Discharging Fecal Bacteria in Double Pipe Creek Watershed

FINAL
Double Pipe Creek TMDL Fecal Bacteria Document version: October 1, 2009
24
Bacteria Source Tracking Bacteria source tracking (BST) was used to identify the relative contributions from various sources of bacteria to in-stream water samples. BST monitoring was conducted at six stations throughout the Double Pipe Creek watershed, where 12 samples (one per month) were collected for a one-year duration. Sources are defined as domestic (pets and human associated animals), human (human waste), livestock (agricultural animals), and wildlife (mammals and waterfowl). To identify sources, samples are collected within the watershed from known fecal sources, and the patterns of antibiotic resistance of these known sources are compared to isolates of unknown bacteria from ambient water samples. Details of the BST methodology and data can be found in Appendix C.
An accurate representation of the expected average source at each station is estimated by using a stratified weighted mean of the identified sample results. The weighting factors are based on the log10 of the bacteria concentration and the percent of time that represents the high stream flow or low stream flow (See Appendix B). The procedure for calculating the stratified weighted mean of the sources per monitoring station is as follows:
1. Calculate the percentage of isolates per source per each sample date (S). 2. Calculate the weighted percentage (MS) of each source per flow strata (high/low). The
weighting is based on the log10 bacteria concentration for the water sample. 3. The final weighted mean source percentage, for each source category, is based on the
proportion of time in each flow duration zone (i.e., high flow=0.3, low flow=0.7).
The weighted mean for each source category is calculated using the following equations:
2
1,
iikik WMSMS (4)
where
i
i
n
jji
kji
n
jji
ki
C
SC
MS
1,10
,,1
,10
,
)(log
)(log
(5)
where MSi,k = Weighted mean proportion of isolates for source k in stratum i MSk = weighted mean proportion of isolates of source k Wi= Proportion covered by stratum i i = stratum j = sample k = Source category (1 = human, 2 = domestic, 3 = livestock, 4 = wildlife, 5 = unknown) Ci,j = Concentration for sample j in stratum i Si,j,k = Proportion of isolates for sample j, of source k in stratum i ni = number of samples in stratum i

FINAL
Double Pipe Creek TMDL Fecal Bacteria Document version: October 1, 2009
25
The complete distributions of the annual and seasonal periods source loads are listed in Tables 2.4.3 and 2.4.4. Details of the BST data and tables with the BST analysis results can be found in Appendix C.
Table 2.4.3: Distribution of Fecal Bacteria Source Loads in the Double Pipe Creek Basin for the Annual Period
STATION Flow Stratum %
Domestic Animals
% Human
% Livestock
% Wildlife
% Unknown
High Flow 24.4 17.2 21.5 9.3 27.6
Low Flow 25.2 10.4 24.3 8.7 31.4 BEB0009
Weighted 25.0 12.1 23.6 8.8 30.4
High Flow 20.8 28.2 15.6 9.2 26.1
Low Flow 34.2 22.2 14.4 6.4 22.8 BPC0120
Weighted 30.8 23.7 14.7 7.1 23.6
High Flow 19.9 16.5 22.1 15.4 25.9
Low Flow 27.0 11.4 23.1 9.9 28.5 MEB0000
Weighted 25.2 12.7 22.9 11.3 27.9
High Flow 30.9 23.3 13.7 13.3 18.7
Low Flow 19.2 9.2 17.5 12.1 41.8 BPC0006
Weighted 22.1 12.7 16.6 12.4 36.0
High Flow 32.9 12.4 28.6 10.0 16.3
Low Flow 23.6 14.5 21.9 8.5 31.5 LPC0091
Weighted 25.9 14.0 23.5 8.8 27.7
High Flow 48.7 14.4 14.1 13.7 9.0
Low Flow 23.3 9.4 20.8 11.3 35.2 SAM0001
Weighted 29.6 10.6 19.1 11.9 28.7
High Flow 29.6 17.7 14.2 17.7 20.8
Low Flow 18.5 16.5 36.2 5.4 23.4 LPC0032
Weighted 21.2 16.8 30.7 8.4 22.8

FINAL
Double Pipe Creek TMDL Fecal Bacteria Document version: October 1, 2009
26
Table 2.4.4: Distribution of Fecal Bacteria Source Loads in the Double Pipe Creek Basin for the Seasonal Period (May 1st – September 30th)
STATION Flow Stratum %
Domestic Animals
% Human
% Livestock
% Wildlife
% Unknown
High Flow 37.5 25.0 4.2 0 33.3
Low Flow 28.9 8.2 24.2 6.6 32.0 BEB0009
Weighted 31.0 12.4 19.2 4.9 32.4
High Flow 16.7 41.7 4.2 0 37.5
Low Flow 37.5 19.7 14.7 3.0 25.0 BPC0006
Weighted 32.3 25.2 12.1 2.3 28.1
High Flow 8.3 25.0 33.3 4.2 29.2
Low Flow 30.2 11.5 20.4 11.2 26.6 MEB0000
Weighted 24.7 14.9 23.7 9.4 27.3
High Flow 50.0 20.8 0 4.2 25.0
Low Flow 26.1 7.7 15.1 7.7 43.3 BPC0006
Weighted 32.1 11.0 11.3 6.8 38.7
High Flow 50.0 12.5 12.5 0 25.0
Low Flow 28.0 13.9 24.7 8.1 25.2 LPC0091
Weighted 33.5 13.5 21.7 6.1 25.1
High Flow 62.5 20.8 8.3 0 8.3
Low Flow 24.2 5.1 21.0 5.1 44.4 SAM0001
Weighted 33.8 9.0 17.9 3.8 35.4
High Flow 29.2 33.3 4.2 4.2 29.2
Low Flow 15.6 18.8 31.6 7.5 26.4 LPC0032
Weighted 19.0 22.4 24.7 6.6 27.1

FINAL
Double Pipe Creek TMDL Fecal Bacteria Document version: October 1, 2009
27
3.0 TARGETED WATER QUALITY GOAL
The overall objective of the fecal bacteria TMDL set forth in this document is to establish the loading caps needed to assure attainment of water quality standards in the Double Pipe Creek watershed area. These standards are described fully in Section 2.3, “Water Quality Impairment.”
4.0 TOTAL MAXIMUM DAILY LOADS AND SOURCE ALLOCATION
4.1 Overview
This section provides an overview of the non-tidal fecal bacteria TMDL development, with a discussion of the many complexities involved in estimating bacteria concentrations, loads and sources. The second section presents the analysis for estimating a representative geometric mean fecal bacteria concentration and baseline loads. The third section describes the analysis framework and how the hydrological, water quality and BST data are linked together in the TMDL process. This analysis methodology is based on available monitoring data and is specific to a free-flowing stream system. The fourth section addresses the critical condition and seasonality. The fifth section presents the margin of safety. The sixth section discusses annual average TMDL loading caps and how maximum daily loads are estimated. The seventh section presents TMDL scenario descriptions. The eighth section presents the load allocations. Finally, in section nine, the TMDL equation is summarized. To be most effective, the TMDL provides a basis for allocating loads among the known pollutant sources in the watershed so that appropriate control measures can be implemented and water quality standards achieved. By definition, the TMDL is the sum of the individual waste load allocations (WLAs) for point sources, load allocations (LAs) for non point sources and natural background sources. A margin of safety (MOS) is also included and accounts for the uncertainty in the analytical procedures used for water quality modeling, and the limits in scientific and technical understanding of water quality in natural systems. Although this formulation suggests that the TMDL be expressed as a load, the Code of Federal Regulations (40 CFR 130.2(i)) states that the TMDL can be expressed in terms of “mass per time, toxicity or other appropriate measure.” For many reasons, bacteria are difficult to simulate in water quality models. They reproduce and die off in a non-linear fashion as a function of many environmental factors, including temperature, pH, turbidity (UV light penetration) and settling. They occur in concentrations that vary widely (i.e., over orders of magnitude) and an accurate estimation of source inputs is difficult to develop. Finally, limited data are available to characterize the effectiveness of any program or practice at reducing bacteria loads (Schueler 1999). Bacteria concentrations, determined through laboratory analysis of in-stream water samples for bacteria indicators (e.g., enterococci), are expressed in either colony forming units (CFU) or most probable number (MPN) of colonies. The first method (US EPA 1985) is a direct estimate of the bacteria colonies (Method 1600), and the second is a statistical estimate of the number of

FINAL
Double Pipe Creek TMDL Fecal Bacteria Document version: October 1, 2009
28
colonies (ONPG MUG Standard Method 9223B, AOAC 991.15). Sample results indicate the extreme variability in the total bacteria counts (see Appendix A). The distribution of the sample results tends to be lognormal, with a strong positive skew of the data. Estimating loads of constituents that vary by orders of magnitude can introduce much uncertainty and result in large confidence intervals around the final results. Estimating bacteria sources can also be problematic, due to the many assumptions required and to limited available data. Lack of specific numeric and spatial location data for several source categories, from failing septic systems to domestic animals, livestock, and wildlife populations, can create many potential uncertainties in traditional water quality modeling. For this reason, MDE applies an analytical method combined with the bacteria source tracking described above for the calculation of this TMDL.
4.2 Analysis Framework
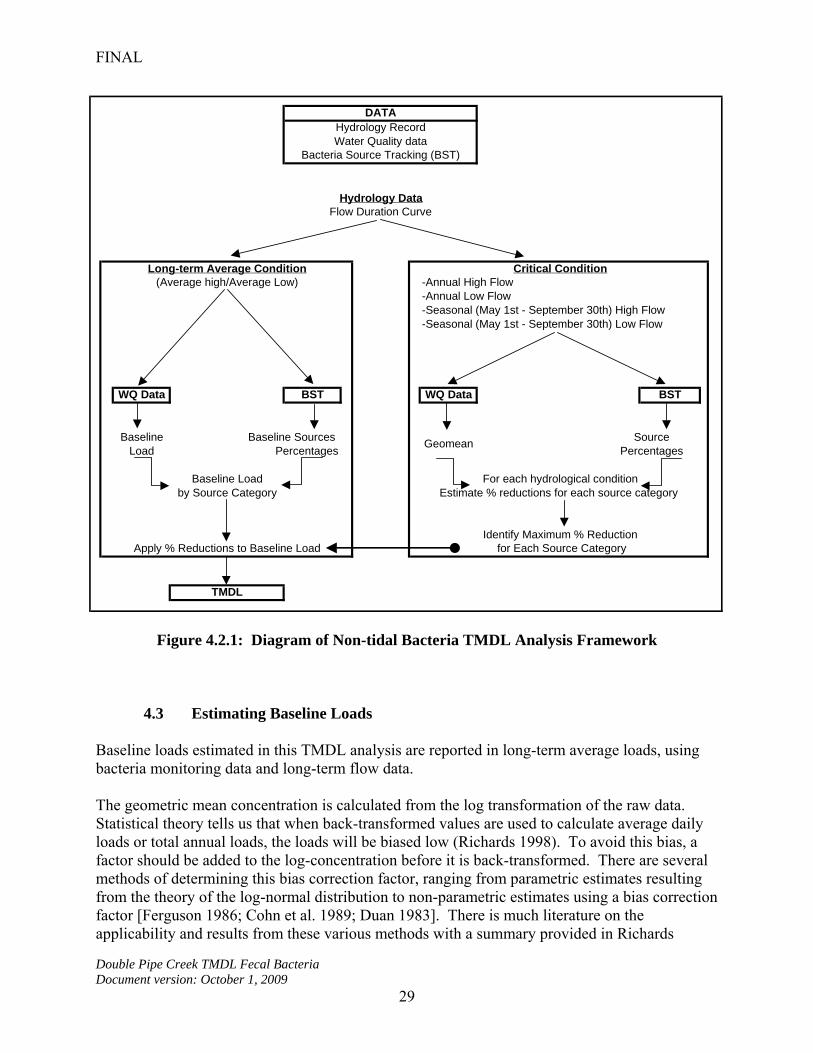
This TMDL analysis uses flow duration curves to identify flow intervals that are used as indicator of hydrological conditions (i.e., annual average and critical conditions). This analytical method, combined with water quality monitoring data and BST, provides reasonable results (Cleland 2003), a better description of water quality than traditional water quality modeling, and also meets TMDL requirements. In brief, baseline loads are estimated first for each subwatershed by using bacteria monitoring data and long-term flow data. These baseline loads are divided into four bacteria source categories using the results of BST analysis. Next, the percent reduction required to meet the water quality criterion is estimated from the observed bacteria concentrations after determining the critical condition and accounting for seasonality. Critical condition and seasonality are determined by assessing annual and seasonal hydrological conditions for high flow and low flow periods. Finally, TMDLs for each subwatershed are estimated by applying these percent reductions. Figure 4.2.1 illustrates how the hydrological (flow duration curve), water quality and BST data are linked together for the TMDL development.
FINAL
Double Pipe Creek TMDL Fecal Bacteria Document version: October 1, 2009
29
Figure 4.2.1: Diagram of Non-tidal Bacteria TMDL Analysis Framework
4.3 Estimating Baseline Loads Baseline loads estimated in this TMDL analysis are reported in long-term average loads, using bacteria monitoring data and long-term flow data. The geometric mean concentration is calculated from the log transformation of the raw data. Statistical theory tells us that when back-transformed values are used to calculate average daily loads or total annual loads, the loads will be biased low (Richards 1998). To avoid this bias, a factor should be added to the log-concentration before it is back-transformed. There are several methods of determining this bias correction factor, ranging from parametric estimates resulting from the theory of the log-normal distribution to non-parametric estimates using a bias correction factor [Ferguson 1986; Cohn et al. 1989; Duan 1983]. There is much literature on the applicability and results from these various methods with a summary provided in Richards
Hydrology Data
-Annual High Flow-Annual Low Flow-Seasonal (May 1st - September 30th) High Flow-Seasonal (May 1st - September 30th) Low Flow
WQ Data BST WQ Data BST
Baseline Baseline Sources Load Percentages
Baseline Loadby Source Category Estimate % reductions for each source category
GeomeanSource
Percentages
For each hydrological condition
Apply % Reductions to Baseline Load
TMDL
Identify Maximum % Reduction for Each Source Category
Long-term Average Condition(Average high/Average Low)
Critical Condition
Flow Duration Curve
DATAHydrology RecordWater Quality data
Bacteria Source Tracking (BST)

FINAL
Double Pipe Creek TMDL Fecal Bacteria Document version: October 1, 2009
30
(1998). Each has advantages and conditions of applicability. A non-parametric estimate of the bias correction factor (Duan 1983) was used in this TMDL analysis. To estimate baseline loads for each subwatershed of the Double Pipe Creek, bias correction factors, daily average flows and geometric mean concentrations for each stratum are first estimated. The bias correction factor for each stratum is estimated as follows: F1i = Ai/Ci (6) where F1i = Bias correction factor for stratum i Ai = Long term annual arithmetic mean for stratum i Ci = Long term annual geometric mean for stratum i Daily average flows are estimated for each flow stratum using the watershed area ratio approach, since nearby long-term monitoring data are available. The loads for each stratum are estimated as follows:
21 *** FFCQL iii (7)
where Li = Daily average load (Billion MPN/day) at monitoring station for stratum i Qi = Daily average flow (cfs) for stratum i Ci = Geometric mean for stratum i F1 = Bias correction factor F2 = Unit conversion factor (0.0245) Finally, for each subwatershed, the baseline load is estimated as follows:
2
1iii WLL (8)
L = Daily average load at station (MPN/day) Wi= Proportion of stratum i In the Double Pipe Creek watershed, a weighting factor of 0.25 for high flow and 0.75 for low/mid flows were used to estimate the annual baseline load expressed as Billion MPN E. coli/day.

FINAL
Double Pipe Creek TMDL Fecal Bacteria Document version: October 1, 2009
31
Estimating Subwatersheds Loads Subwatersheds with more than one monitoring station were subdivided into unique watershed segments, thus allowing individual load and reduction targets to be determined for each. Of the five main tributaries in the Double Pipe Creek watershed, two have both upstream and downstream monitoring stations (Big Pipe Creek and Little Pipe Creek). The downstream segments of each are monitored at stations BPC0006 and LPC0032, respectively (see Figure 2.2.1), and identified as subwatersheds by adding the extension “sub” to their station names (BPC0006sub and LPC0032sub). Thus, there are a total of seven subwatersheds defined in this analysis. The total baseline loads from the upstream watersheds, estimated from the monitoring data, were multiplied by a transport factor derived from first order decay. The decay factor for E. coli used in the analysis was obtained from the study “Pathogen Decay in Urban Waters” by Easton et al. (2001), and was estimated by linear regression of counts of microorganisms versus time (die-off plots). The estimated transported loads were then subtracted from the downstream cumulative load to estimate the adjacent subwatershed load. The general equation for the flow mass balance is:
dssubus QQQ (9)
where Qus = Upstream flow (cfs) Qsub = Subwatershed flow (cfs) Qds = Downstream flow (cfs) and the general equations for bacteria loading mass balance:
dsdssubsubususkt CQCQCQe )( (10)
where Cus = Upstream bacteria concentration (MPN/100ml) k = Bacteria (E. coli) decay coefficient (1/day) = 0.762 day-1 t = travel time from upstream watershed to outlet (days) Csub = Subwatershed bacteria concentration (MPN/100ml) Cds = Downstream bacteria concentration (MPN/100ml) The concentrations in the subwatersheds were estimated by considering the ratio of high flow concentration to low flow concentrations in the upstream watersheds. If the total load and average flow were used to estimate the geometric mean concentration, this estimated concentration would be biased by a correlation with flow and concentration. For example, in two strata, the steady-state geometric mean is estimated as follows:
FINAL
Double Pipe Creek TMDL Fecal Bacteria Document version: October 1, 2009
32
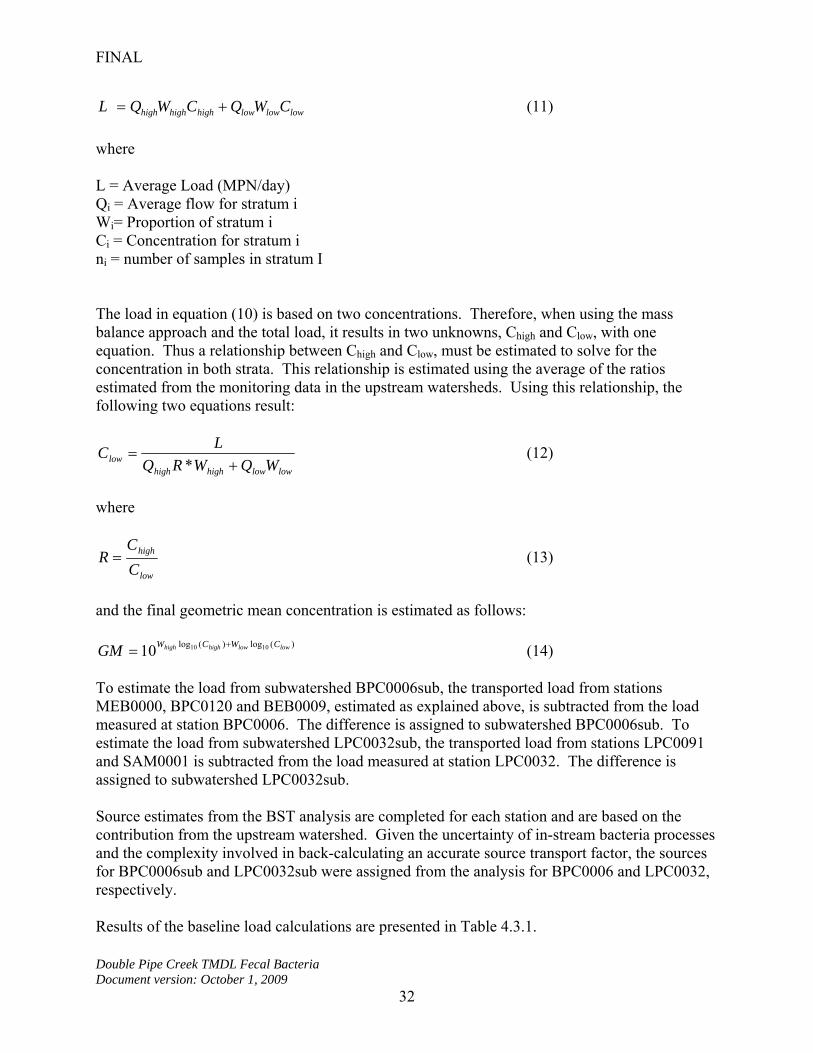
lowlowlowhighhighhigh CWQCWQL (11)
where L = Average Load (MPN/day) Qi = Average flow for stratum i Wi= Proportion of stratum i Ci = Concentration for stratum i ni = number of samples in stratum I The load in equation (10) is based on two concentrations. Therefore, when using the mass balance approach and the total load, it results in two unknowns, Chigh and Clow, with one equation. Thus a relationship between Chigh and Clow, must be estimated to solve for the concentration in both strata. This relationship is estimated using the average of the ratios estimated from the monitoring data in the upstream watersheds. Using this relationship, the following two equations result:
lowlowhighhighlow WQWRQ
LC
* (12)
where
low
high
C
CR (13)
and the final geometric mean concentration is estimated as follows:
)(log)(log 101010 lowlowhighhigh CWCWGM (14) To estimate the load from subwatershed BPC0006sub, the transported load from stations MEB0000, BPC0120 and BEB0009, estimated as explained above, is subtracted from the load measured at station BPC0006. The difference is assigned to subwatershed BPC0006sub. To estimate the load from subwatershed LPC0032sub, the transported load from stations LPC0091 and SAM0001 is subtracted from the load measured at station LPC0032. The difference is assigned to subwatershed LPC0032sub. Source estimates from the BST analysis are completed for each station and are based on the contribution from the upstream watershed. Given the uncertainty of in-stream bacteria processes and the complexity involved in back-calculating an accurate source transport factor, the sources for BPC0006sub and LPC0032sub were assigned from the analysis for BPC0006 and LPC0032, respectively. Results of the baseline load calculations are presented in Table 4.3.1.

FINAL
Double Pipe Creek TMDL Fecal Bacteria Document version: October 1, 2009
33
Table 4.3.1: Baseline Loads Calculations
Sub-watershed
Area (sq.
miles)
Q (cfs)
E. coli Concentration(MPN/100ml)
Q (cfs)
E. coli Concentration(MPN/100ml)
Baseline Load
(Billion
MPN/year)
Weighted Geometric
Mean Conc. MPN/100ml
BEB0009 14.7 48.1 592.9 8.9 788.6 369,052 734
BPC0120 58.0 190.2 445.7 35.1 406.3 1,143,443 416
MEB0000 15.2 49.8 570.5 9.2 895.3 376,282 800
BPC0006sub 22.4 73.5 1,184.7 13.5 1,281.6 1,262,413 1,257
LPC0091 41.7 136.6 2041.3 25.2 953.7 1,772,638 1,154
SAM0001 22.5 73.6 1017.6 13.6 1086.5 1,679,690 1,069
LPC0032sub 18.0 59.1 5,439.3 10.9 2,541.1 5,010,752 3,074
4.4 Critical Condition and Seasonality Federal regulations (40 CFR 130.7(c)(1)) require TMDLs to take into account critical conditions for stream flow, loading, and water quality parameters. The intent of this requirement is to ensure that the water quality of the waterbody is protected during times when it is most vulnerable. For this TMDL the critical condition is determined by assessing annual and seasonal hydrological conditions for wet and dry periods. Seasonality is captured by assessing the time period when water contact recreation is expected (May 1st - September 30th). The average hydrological condition over a 15-year period is approximately 25% high flow and 75% low flow as defined in Appendix B. Using the definition of a high flow condition as occurring when the daily flow duration interval is less than 25% and a low flow condition as occurring when the daily flow duration interval is greater than 25%, critical hydrological condition can be estimated by the percent of high or low flows during a specific period. As stated above, Maryland’s proposed fecal bacteria TMDL for Double Pipe Creek has been determined by assessing various hydrological conditions to account for seasonal and annual averaging periods. The five conditions listed in Table 4.4.1were used to account for the critical condition.
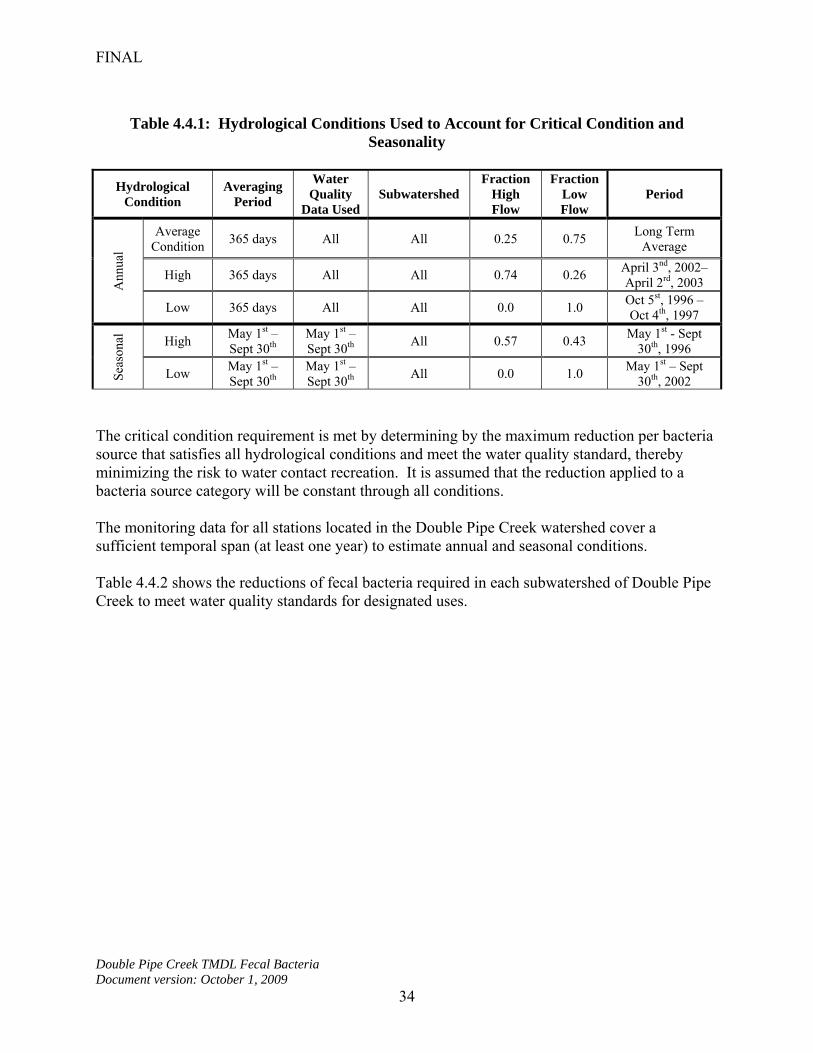
FINAL
Double Pipe Creek TMDL Fecal Bacteria Document version: October 1, 2009
34
Table 4.4.1: Hydrological Conditions Used to Account for Critical Condition and
Seasonality
Hydrological Condition
Averaging Period
Water Quality
Data Used Subwatershed
Fraction High Flow
Fraction Low Flow
Period
Average Condition
365 days All All 0.25 0.75 Long Term
Average
High 365 days All All 0.74 0.26 April 3nd, 2002– April 2rd, 2003 A
nnua
l
Low 365 days All All 0.0 1.0 Oct 5st, 1996 – Oct 4th, 1997
High May 1st – Sept 30th
May 1st – Sept 30th
All 0.57 0.43 May 1st - Sept
30th, 1996
Sea
sona
l
Low May 1st – Sept 30th
May 1st – Sept 30th
All 0.0 1.0 May 1st – Sept
30th, 2002 The critical condition requirement is met by determining by the maximum reduction per bacteria source that satisfies all hydrological conditions and meet the water quality standard, thereby minimizing the risk to water contact recreation. It is assumed that the reduction applied to a bacteria source category will be constant through all conditions. The monitoring data for all stations located in the Double Pipe Creek watershed cover a sufficient temporal span (at least one year) to estimate annual and seasonal conditions. Table 4.4.2 shows the reductions of fecal bacteria required in each subwatershed of Double Pipe Creek to meet water quality standards for designated uses.

FINAL
Double Pipe Creek TMDL Fecal Bacteria Document version: October 1, 2009
35
Table 4.4.2: Required Reductions of Fecal Bacteria to Meet Water Quality Standards
Subwatershed Hydrological Condition Domestic Animals
%
Human %
Livestock %
Wildlife %
Average 94.6% 98.0% 93.5% 6.9% High Flow 93.3% 98.0% 89.6% 0.0% Annual
Low Flow 98.0% 98.0% 95.8% 0.0% High Flow 98.0% 98.0% 98.0% 87.3%
Seasonal Low Flow 98.0% 98.0% 98.0% 21.4%
BEB0009
Maximum Source Reduction
98.0% 98.0% 98.0% 87.3%
Average 70.9% 91.8% 73.0% 0.0% High Flow 70.2% 98.0% 72.0% 0.0% Annual
Low Flow 65.0% 98.0% 72.6% 0.0% High Flow 98.0% 98.0% 98.0% 78.9%
Seasonal Low Flow 77.3% 98.0% 76.2% 0.0%
BPC0120
Maximum Source Reduction
98.0% 98.0% 98.0% 78.9%
Average 98.0% 98.0% 98.0% 14.9% High Flow 98.0% 98.0% 98.0% 10.5% Annual
Low Flow 98.0% 98.0% 98.0% 15.9% High Flow 98.0% 98.0% 98.0% 89.8%
Seasonal Low Flow 98.0% 98.0% 98.0% 66.8%
MEB0000
Maximum Source Reduction
98.0% 98.0% 98.0% 89.8%
Average 99.0% 99.0% 99.0% 55.8% High Flow 99.0% 99.0% 99.0% 48.2% Annual
Low Flow 99.0% 99.0% 99.0% 59.1% High Flow 99.0% 99.0% 99.0% 95.2%
Seasonal Low Flow 99.0% 99.0% 99.0% 40.6%
BPC0006sub
Maximum Source Reduction
99.0% 99.0% 99.0% 95.2%

FINAL
Double Pipe Creek TMDL Fecal Bacteria Document version: October 1, 2009
36
Subwatershed Hydrological Condition Domestic Animals
%
Human %
Livestock %
Wildlife %
Average 99.0% 98.5% 99.0% 23.2% High Flow 99.0% 98.5% 99.0% 48.6% Annual
Low Flow 99.0% 98.5% 99.0% 6.3% High Flow 99.0% 98.5% 99.0% 79.7%
Seasonal Low Flow 99.0% 98.5% 99.0% 22.7%
LPC0091
Maximum Source Reduction
99.0% 98.5% 99.0% 79.7%
Average 98.0% 98.0% 98.0% 43.3% High Flow 99.0% 99.0% 99.0% 23.7% Annual
Low Flow 99.0% 99.0% 99.0% 41.4% High Flow 99.0% 99.0% 99.0% 98.7%
Seasonal Low Flow 99.0% 99.0% 99.0% 53.2%
SAM0001
Maximum Source Reduction
99.0% 99.0% 99.0% 98.7%
Average 99.0% 99.0% 99.0% 22.8% High Flow 99.0% 99.0% 99.0% 70.3% Annual
Low Flow 85.0% 99.0% 99.0% 0.0% High Flow 99.0% 99.0% 99.0% 97.6%
Seasonal Low Flow 99.0% 99.0% 99.0% 11.7%
LPC0032sub
Maximum Source Reduction
99.0% 99.0% 99.0% 97.6%
4.5 Margin of Safety
A margin of safety (MOS) is required as part of this TMDL in recognition of the many uncertainties in the understanding and simulation of bacteriological water quality in natural systems and in statistical estimates of indicators. As mentioned in Section 4.1, it is difficult to estimate stream loadings for fecal bacteria due to the variation in loadings across sample locations and time. Load estimation methods should be both precise and accurate to obtain the true estimate of the mean load. Refined precision in the load estimation is due to using a stratified approach along the flow duration intervals, thus reducing the variation in the estimates. Moreover, Richards (1998) reports that averaging methods are generally biased, and the bias increases as the size of the averaging window increases. Finally, accuracy in the load estimation is based on minimal bias in the final result when compared to the true value. Based on EPA guidance, the MOS can be achieved through two approaches (EPA, April 1991). One approach is to reserve a portion of the loading capacity as a separate term in the TMDL (i.e., TMDL = LA + WLA + MOS). The second approach is to incorporate the MOS as conservative assumptions used in the TMDL analysis. For this TMDL, the second approach was used by estimating the loading capacity of the stream based on a reduced (more stringent) water quality criterion concentration. The E. coli water quality criterion concentration was reduced by 5%, from 126 E. coli MPN/100ml to 119.7 E. coli MPN/100ml.
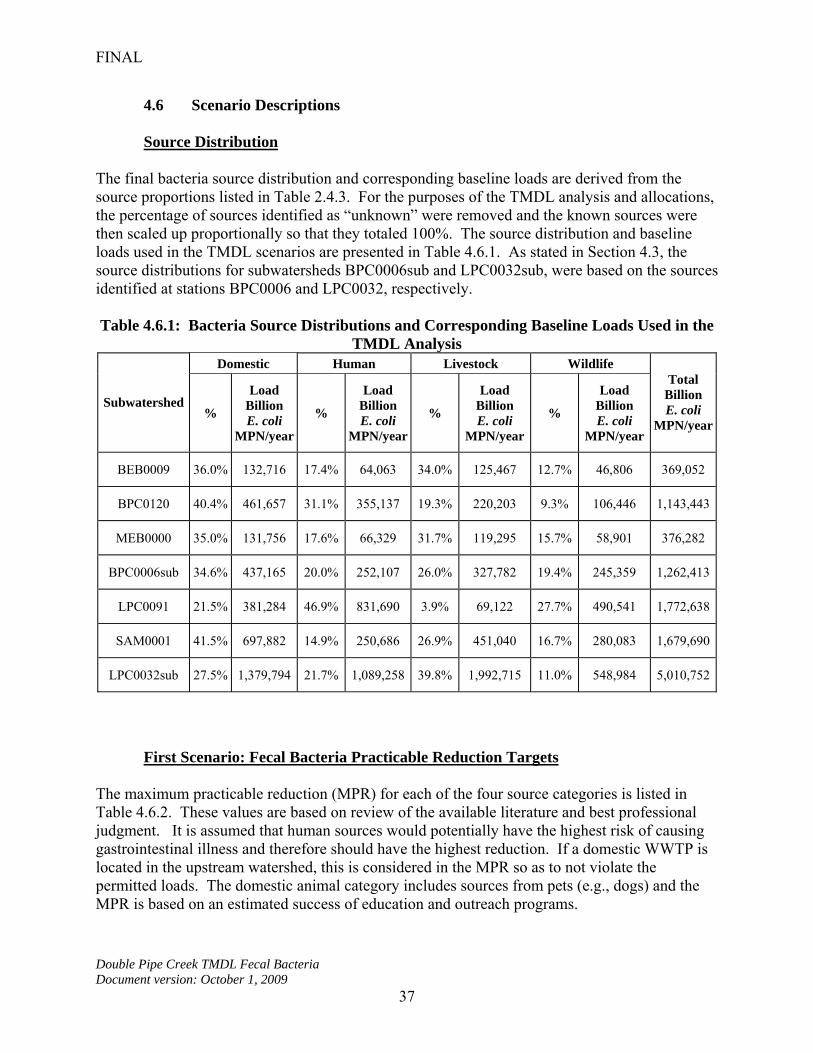
FINAL
Double Pipe Creek TMDL Fecal Bacteria Document version: October 1, 2009
37
4.6 Scenario Descriptions
Source Distribution The final bacteria source distribution and corresponding baseline loads are derived from the source proportions listed in Table 2.4.3. For the purposes of the TMDL analysis and allocations, the percentage of sources identified as “unknown” were removed and the known sources were then scaled up proportionally so that they totaled 100%. The source distribution and baseline loads used in the TMDL scenarios are presented in Table 4.6.1. As stated in Section 4.3, the source distributions for subwatersheds BPC0006sub and LPC0032sub, were based on the sources identified at stations BPC0006 and LPC0032, respectively. Table 4.6.1: Bacteria Source Distributions and Corresponding Baseline Loads Used in the
TMDL Analysis Domestic Human Livestock Wildlife
Subwatershed %
Load Billion E. coli
MPN/year
%
Load Billion E. coli
MPN/year
%
Load Billion E. coli
MPN/year
%
Load Billion E. coli
MPN/year
Total Billion E. coli
MPN/year
BEB0009 36.0% 132,716 17.4% 64,063 34.0% 125,467 12.7% 46,806 369,052
BPC0120 40.4% 461,657 31.1% 355,137 19.3% 220,203 9.3% 106,446 1,143,443
MEB0000 35.0% 131,756 17.6% 66,329 31.7% 119,295 15.7% 58,901 376,282
BPC0006sub 34.6% 437,165 20.0% 252,107 26.0% 327,782 19.4% 245,359 1,262,413
LPC0091 21.5% 381,284 46.9% 831,690 3.9% 69,122 27.7% 490,541 1,772,638
SAM0001 41.5% 697,882 14.9% 250,686 26.9% 451,040 16.7% 280,083 1,679,690
LPC0032sub 27.5% 1,379,794 21.7% 1,089,258 39.8% 1,992,715 11.0% 548,984 5,010,752
First Scenario: Fecal Bacteria Practicable Reduction Targets
The maximum practicable reduction (MPR) for each of the four source categories is listed in Table 4.6.2. These values are based on review of the available literature and best professional judgment. It is assumed that human sources would potentially have the highest risk of causing gastrointestinal illness and therefore should have the highest reduction. If a domestic WWTP is located in the upstream watershed, this is considered in the MPR so as to not violate the permitted loads. The domestic animal category includes sources from pets (e.g., dogs) and the MPR is based on an estimated success of education and outreach programs.

FINAL
Double Pipe Creek TMDL Fecal Bacteria Document version: October 1, 2009
38
Table 4.6.2: Maximum Practicable Reduction Targets Human Domestic Livestock Wildlife Max Practicable
Reduction per Source
95% 75% 75% 0%
Rationale
(a) Direct source inputs. (b) Human pathogens more prevalent in humans than animals. (c) Enteric viral diseases spread from human to human.1
Target goal reflects uncertainty in effectiveness of urban BMPs2 and is also based on best professional judgment
Target goal based on sediment reductions from BMPs3 and best professional judgment
No programmatic approaches for wildlife reduction to meet water quality standards. Waters contaminated by wild animal wastes offer a public health risk that is orders of magnitude less than that associated with human waste.4
1Health Effects Criteria for Fresh Recreational Waters. EPA-600/1-84-004. U.S. Environmental Protection Agency, Washington, DC. EPA. 1984. 2Preliminary Data Summary of Urban Storm Water Best Management Practices. EPA-821-R-99-012. U.S. Environmental Protection Agency, Washington, DC. EPA. 1999. 3Agricultural BMP Descriptions as Defined for The Chesapeake Bay Program Watershed Model. Nutrient Subcommittee Agricultural Nutrient Reduction Workshop. EPA. 2004. 4Environmental Indicators and Shellfish Safety. 1994. Edited by Cameron, R., Mackeney and Merle D. Pierson, Chapman & Hall. As previously stated, these maximum practicable reduction targets are based on the available literature and best professional judgment. There is much uncertainty with estimated reductions from best management practices (BMP). The BMP efficiency for bacteria reduction ranged from –6% to +99% based on a total of 10 observations (US EPA 1999). The MPR to agricultural lands was based on sediment reductions identified by EPA (US EPA 2004). The practicable reduction scenario was developed based on an optimization analysis whereby a subjective estimate of risk was minimized and constraints were set on maximum reduction and allowable background conditions. Risk was defined on a scale of one to five, where it was assumed that human sources had the highest risk (5), domestic animals and livestock next (3), and wildlife the lowest (1) (See Table 4.6.2). The model was defined as follows:
Risk Score = Min
4
1i
Pj*Wj (15)
Where
TR
PbRP ji
j
1
*)1( (16)
and
C
CCTR cr
(17)
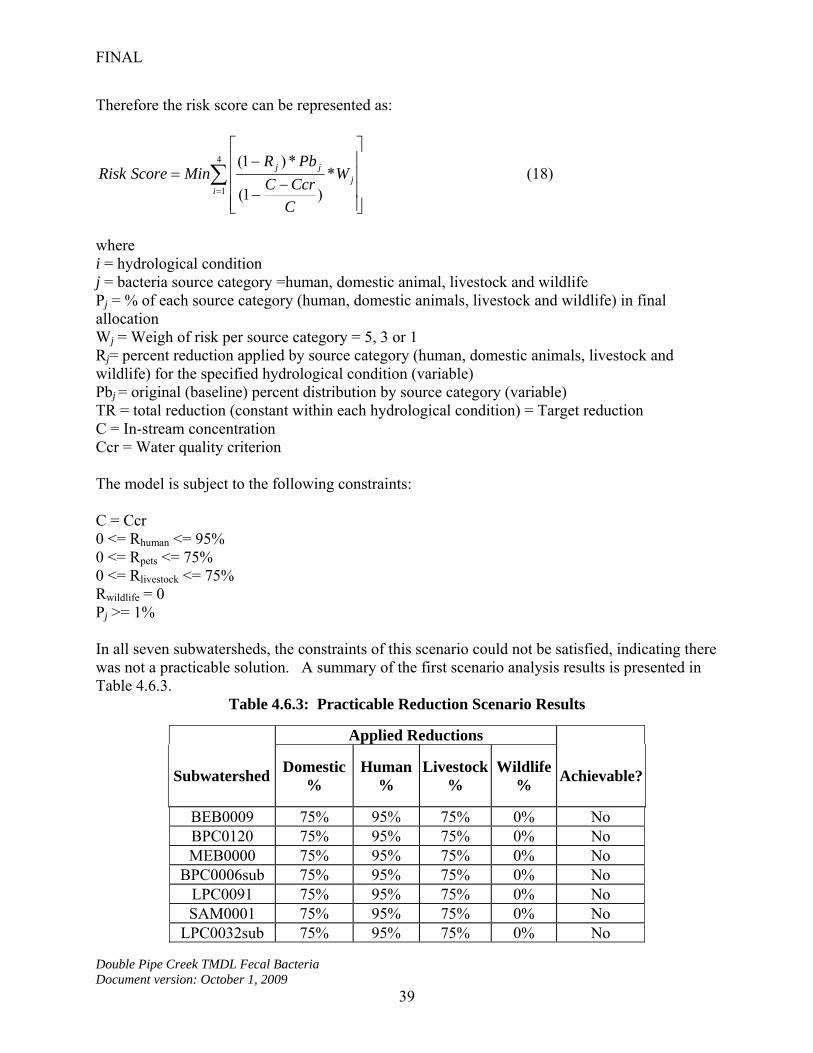
FINAL
Double Pipe Creek TMDL Fecal Bacteria Document version: October 1, 2009
39
Therefore the risk score can be represented as:
4
1
*)1(
*)1(
ij
jj W
C
CcrC
PbRMinScore Risk (18)
where i = hydrological condition j = bacteria source category =human, domestic animal, livestock and wildlife Pj = % of each source category (human, domestic animals, livestock and wildlife) in final allocation Wj = Weigh of risk per source category = 5, 3 or 1 Rj= percent reduction applied by source category (human, domestic animals, livestock and wildlife) for the specified hydrological condition (variable) Pbj = original (baseline) percent distribution by source category (variable) TR = total reduction (constant within each hydrological condition) = Target reduction C = In-stream concentration Ccr = Water quality criterion The model is subject to the following constraints: C = Ccr 0 <= Rhuman <= 95% 0 <= Rpets <= 75% 0 <= Rlivestock <= 75% Rwildlife = 0 Pj >= 1% In all seven subwatersheds, the constraints of this scenario could not be satisfied, indicating there was not a practicable solution. A summary of the first scenario analysis results is presented in Table 4.6.3.
Table 4.6.3: Practicable Reduction Scenario Results
Applied Reductions
Subwatershed Domestic
% Human
% Livestock
% Wildlife
% Achievable?
BEB0009 75% 95% 75% 0% No BPC0120 75% 95% 75% 0% No MEB0000 75% 95% 75% 0% No
BPC0006sub 75% 95% 75% 0% No LPC0091 75% 95% 75% 0% No SAM0001 75% 95% 75% 0% No
LPC0032sub 75% 95% 75% 0% No

FINAL
Double Pipe Creek TMDL Fecal Bacteria Document version: October 1, 2009
40
Second Scenario: Fecal Bacteria Reductions Higher than Maximum Practicable Reductions
The TMDL must specify load allocations that will meet the water quality standards. In the practicable reduction targets scenario, none of the subwatersheds of Double Pipe Creek could meet water quality standards based on MPRs. To further develop the TMDL, a second scenario was analyzed in which the constraints on the MPRs were relaxed in the subwatersheds where water quality attainment was not achievable with MPRs. In these subwatersheds, the maximum allowable reduction was increased to 98% for all sources, including wildlife. A similar optimization procedure was used to minimize risk. Again, the objective is to minimize the sum of the risk for all conditions while meeting the scenario reduction constraints. The model was defined in the same manner as shown in the practicable reduction scenario but subject to the following constraints: C = Ccr 0 <= Ri <= 98% Pj>= 1% The summary of the analysis is presented in Table 4.6.4.
Table 4.6.4: TMDL Scenario Results: Percent Reductions Based on Optimization Model Allowing Up to 98% Reduction
Station Domestic
% Human
% Livestock
% Wildlife
%
Target Reduction
% BEB0009 98% 98% 98% 87.3% 96.6% BPC0120 98% 98% 98% 78.9% 96.2% MEB0000 98% 98% 98% 89.8% 96.7%
BPC0006sub 99% 99% 99% 95.3% 98.3% LPC0091 99% 99% 99% 77.8% 93.4% SAM0001 99% 99% 99% 98.7% 98.9%
LPC0032sub 99% 99% 99% 97.6% 98.8%

FINAL
Double Pipe Creek TMDL Fecal Bacteria Document version: October 1, 2009
41
4.7 TMDL Loading Caps
The TMDL loading cap is an estimate of the assimilative capacity of the monitored watershed. Estimation of the TMDL requires knowledge of how bacteria concentrations vary with flow rate or the flow duration interval. This relationship between concentration and flow is established using the strata defined by the flow duration curve. The TMDL loading caps are provided in billion MPN/day. These loading caps are for the seven subwatersheds located upstream of their respective monitoring stations: BEB0009, BPC0120, MEB0000, and BPC0006sub; and LPC0091, SAM000, and LPC0032sub.
Annual Average TMDL As explained in the sections above, the annual average TMDL loading caps are estimated by first determining the baseline or current condition loads for each subwatershed and the associated geometric mean from the available monitoring data. This annual average baseline load is estimated using the geometric mean concentration and average daily flow for each flow stratum. The loads from these two strata are then weighted to represent average conditions (see Table 4.3.1), based on the proportion of each stratum, to estimate the total long-term loading rate. Next, the percent reduction required to meet the water quality criterion is estimated from the observed bacteria concentrations accounting for the critical conditions (See Section 4.4). A reduction in concentration is proportional to a reduction in load; thus the TMDL is equal to the current baseline load multiplied by one minus the required reduction. This reduction, estimated as explained in Section 4.4, represents the maximum reduction per source that satisfies all hydrological conditions in each subwatershed, and is required to meet water quality standards.
)1(* RLTMDL b (19)
where Lb = Current or baseline load estimated from monitoring data R = Reduction required from baseline to meet water quality criterion. The annual average bacteria TMDLs for the subwatersheds are shown in Tables 4.7.1 and 4.7.2.
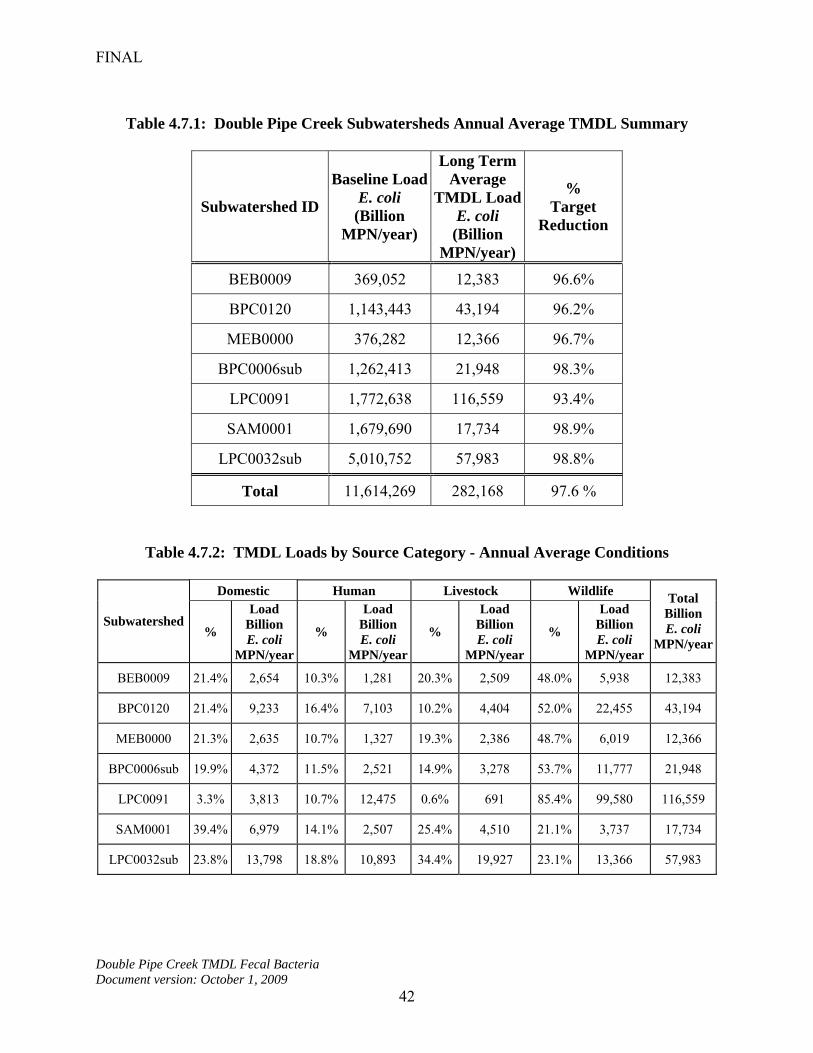
FINAL
Double Pipe Creek TMDL Fecal Bacteria Document version: October 1, 2009
42
Table 4.7.1: Double Pipe Creek Subwatersheds Annual Average TMDL Summary
Subwatershed ID
Baseline Load E. coli (Billion
MPN/year)
Long Term Average
TMDL Load E. coli (Billion
MPN/year)
% Target
Reduction
BEB0009 369,052 12,383 96.6%
BPC0120 1,143,443 43,194 96.2%
MEB0000 376,282 12,366 96.7%
BPC0006sub 1,262,413 21,948 98.3%
LPC0091 1,772,638 116,559 93.4%
SAM0001 1,679,690 17,734 98.9%
LPC0032sub 5,010,752 57,983 98.8%
Total 11,614,269 282,168 97.6 %
Table 4.7.2: TMDL Loads by Source Category - Annual Average Conditions
Domestic Human Livestock Wildlife
Subwatershed %
Load Billion E. coli
MPN/year
%
Load Billion E. coli
MPN/year
%
Load Billion E. coli
MPN/year
%
Load Billion E. coli
MPN/year
Total Billion E. coli
MPN/year
BEB0009 21.4% 2,654 10.3% 1,281 20.3% 2,509 48.0% 5,938 12,383
BPC0120 21.4% 9,233 16.4% 7,103 10.2% 4,404 52.0% 22,455 43,194
MEB0000 21.3% 2,635 10.7% 1,327 19.3% 2,386 48.7% 6,019 12,366
BPC0006sub 19.9% 4,372 11.5% 2,521 14.9% 3,278 53.7% 11,777 21,948
LPC0091 3.3% 3,813 10.7% 12,475 0.6% 691 85.4% 99,580 116,559
SAM0001 39.4% 6,979 14.1% 2,507 25.4% 4,510 21.1% 3,737 17,734
LPC0032sub 23.8% 13,798 18.8% 10,893 34.4% 19,927 23.1% 13,366 57,983
FINAL
Double Pipe Creek TMDL Fecal Bacteria Document version: October 1, 2009
43
Maximum Daily Loads
Selection of an appropriate method for translating a TMDL based on a longer time period into one using a daily time period requires decisions regarding 1) the level of resolution, and 2) the level of protection. The level of resolution pertains to the amount of detail used in specifying the maximum daily load. The level of protection represents how often the maximum daily load is expected to be exceeded. Draft EPA/TetraTech guidance on daily loads (Limno-Tech 2007) provides three categories of options for both level of resolution and level of protection, and discusses these categories in detail.
For the Double Pipe Creek daily TMDL, a “representative daily load” option was selected as the level of resolution, and a value “that will be exceeded with a pre-defined probability” was selected as the level of protection. In these options, the maximum daily loads are two single daily loads that correspond to the two flow strata, with an upper bound percentile that accounts for the variability of daily loads. The upper bound percentile and the maximum daily loads were estimated following EPA’s “Technical Support Document for Water Quality-Based Toxics Control” (1991 TSD) (EPA 1991); and “Approaches For Developing a Daily Load Expression for TMDLs Computed for Longer Term Averages” (EPA 2006).
There are three steps to the overall process of estimating these maximum daily loads. First, all the data available from each monitoring station are examined together by stratum. The percentile rank of the highest observed concentration (for each stratum at each station) is computed. The highest computed percentile rank is the upper boundary to be used in estimating the maximum daily loads. Secondly, the long-term annual average TMDL (see Table 4.7.1) concentrations are estimated for both high-flow and low-flow strata. This is conducted for each station using a statistical methodology (the “Statistical Theory of Rollback,” or “STR,” described more fully in Appendix D). Third, based on the estimated long-term average (LTA) TMDL concentrations, the maximum daily load (MDL) for each flow stratum at each station is estimated using the upper boundary percentile computed in the first step above. Finally, maximum daily loads are computed from these MDL concentrations and their corresponding flows. Results of the fecal bacteria MDL analysis for the Double Pipe Creek subwatersheds are shown in Table 4.7.3.
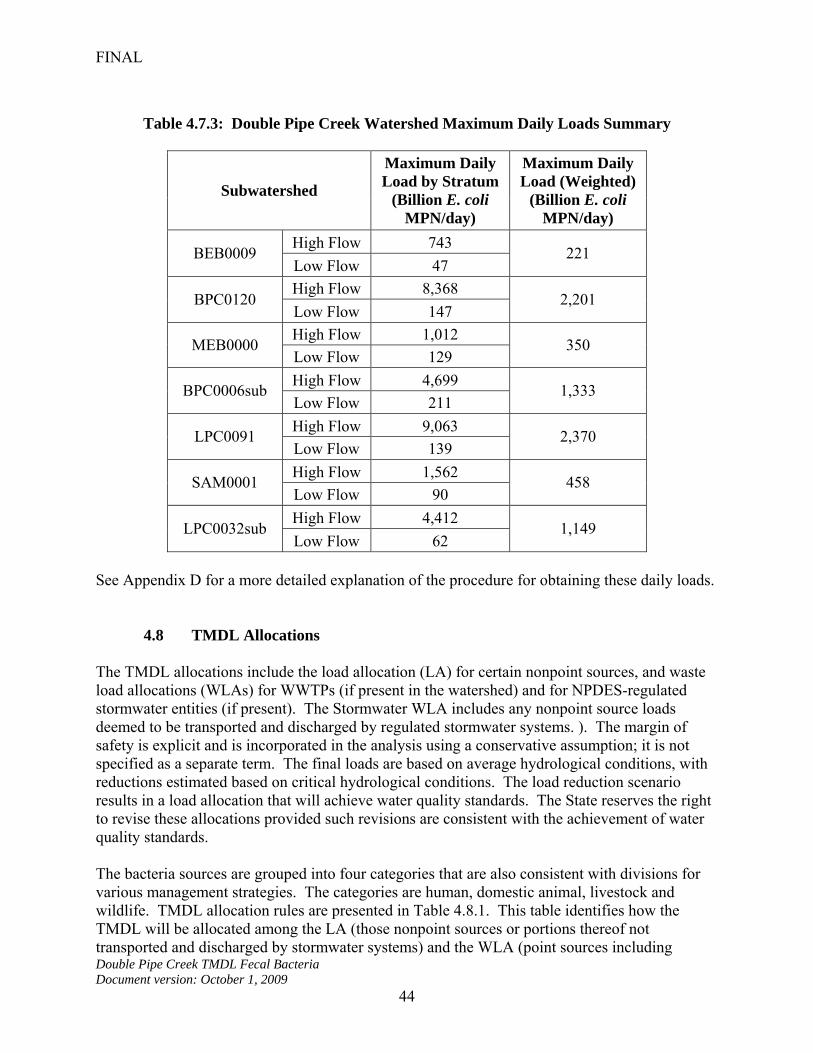
FINAL
Double Pipe Creek TMDL Fecal Bacteria Document version: October 1, 2009
44
Table 4.7.3: Double Pipe Creek Watershed Maximum Daily Loads Summary
Subwatershed
Maximum Daily Load by Stratum
(Billion E. coli MPN/day)
Maximum Daily Load (Weighted)
(Billion E. coli MPN/day)
High Flow 743 BEB0009
Low Flow 47 221
High Flow 8,368 BPC0120
Low Flow 147 2,201
High Flow 1,012 MEB0000
Low Flow 129 350
High Flow 4,699 BPC0006sub
Low Flow 211 1,333
High Flow 9,063 LPC0091
Low Flow 139 2,370
High Flow 1,562 SAM0001
Low Flow 90 458
High Flow 4,412 LPC0032sub
Low Flow 62 1,149
See Appendix D for a more detailed explanation of the procedure for obtaining these daily loads.
4.8 TMDL Allocations The TMDL allocations include the load allocation (LA) for certain nonpoint sources, and waste load allocations (WLAs) for WWTPs (if present in the watershed) and for NPDES-regulated stormwater entities (if present). The Stormwater WLA includes any nonpoint source loads deemed to be transported and discharged by regulated stormwater systems. ). The margin of safety is explicit and is incorporated in the analysis using a conservative assumption; it is not specified as a separate term. The final loads are based on average hydrological conditions, with reductions estimated based on critical hydrological conditions. The load reduction scenario results in a load allocation that will achieve water quality standards. The State reserves the right to revise these allocations provided such revisions are consistent with the achievement of water quality standards. The bacteria sources are grouped into four categories that are also consistent with divisions for various management strategies. The categories are human, domestic animal, livestock and wildlife. TMDL allocation rules are presented in Table 4.8.1. This table identifies how the TMDL will be allocated among the LA (those nonpoint sources or portions thereof not transported and discharged by stormwater systems) and the WLA (point sources including

FINAL
Double Pipe Creek TMDL Fecal Bacteria Document version: October 1, 2009
45
WWTPs, and NPDES regulated stormwater entities). Only the final LA or WLA is reported in this TMDL. Note that the assignment of a small allowable human load to the Stormwater WLA is in consideration of the possible presence of such loads in the watershed beyond the reach of the sanitary sewer systems. The term “allowable load” means the load that the waterbody can assimilate and still meet water quality standards.
Table 4.8.1: Potential Source Contributions for TMDL Allocations
WLA Allocation Category
LA WWTPs Stormwater
Human X X
Domestic X
Livestock X
Wildlife X X
Load Allocation (LA) All four bacteria source categories could potentially contribute to nonpoint source loads. For human sources, if the watershed has no MS4s or other NPDES-regulated stormwater entities, the nonpoint source contribution is estimated by subtracting any WWTP and CSO loads from the TMDL human load, and is then assigned to the LA. However, in watersheds covered by NPDES-regulated stormwater permits, any such nonpoint sources of human bacteria (i.e., beyond the reach of the sanitary sewer systems) are assigned to the stormwater WLA. There are six NPDES WWTPs with permits regulating the discharge of bacteria in the Double Pipe Creek watershed. There are no subwatersheds with assigned NPDES CSO WLA. Livestock loads are all assigned to the LA. Domestic animals (pets) loads are assigned to the LA in watersheds with no MS4s or other NPDES-regulated stormwater systems. Since the entire Double Pipe Creek watershed is covered by NPDES MS4 permits, bacteria loads from domestic animal sources are assigned to the Stormwater WLA in all seven subwatersheds of Double Pipe Creek. However, wildlife sources will be distributed between the LA and the Stormwater WLA, based on a ratio of the amount of pervious non-urban and pervious urban land. Waste Load Allocation (WLA)
NPDES Regulated Stormwater Both individual and general NPDES Phase I and Phase II stormwater permits are point sources subject to WLA assignment in the TMDL. Quantification of rainfall-driven nonpoint source loads, such as those transported by stormwater through MS4s, is uncertain. EPA recognized this in its guidance document entitled "Establishing Total Maximum Daily Load (TMDL) Wasteload Allocations (WLAs) for Storm Water Sources and NPDES Permit Requirements Based on Those

FINAL
Double Pipe Creek TMDL Fecal Bacteria Document version: October 1, 2009
46
WLAs" (November 2002), which states that available data and information usually are not detailed enough to determine WLAs for NPDES-regulated stormwater discharges on an outfall-specific basis. Therefore, in watersheds with existing NPDES-regulated stormwater permits, domestic animal bacteria loads are grouped together into a single Stormwater WLA, along with certain other nonpoint source loads. In watersheds with no existing NPDES-regulated stormwater permits, these loads will be included in the LA. The jurisdictions within the Double Pipe Creek watershed, Carroll County and Frederick County, are covered by individual Phase I MS4 program regulations. Based on EPA’s guidance, the Stormwater WLA is presented as one combined load for the entire land area of each county in each subwatershed. In the future, when more detailed data and information become available, it is anticipated that MDE will revise the WLA into appropriate WLAs and LAs, and may also revise the LA accordingly. Note that the overall reductions in the TMDL will not change. In addition to the counties’ MS4s, the Stormwater WLA category encompasses any other NPDES regulated Phase I and Phase II stormwater entities in the watershed, including State and federal permittees. The Stormwater WLA distribution between Carroll County and Frederick County is presented in Table 4.8.2.
Table 4.8.2: Annual Average Stormwater Allocations
Stormwater WLA Loads (Billion MPN/year)
Station Carroll County
% Frederick County
% Total
BEB0009 4,449 100% 0.0 0% 4,449
BPC0120 18,286 100% 0.0 0% 18,286
MEB0000 4,784 100% 0.0 0% 4,784
BPC0006sub 7,129 100% 0.0 0% 7,129
LPC0091 21,563 100% 0.0 0% 21,563
SAM0001 4,408 45% 5,332 55% 9,741
LPC0032sub 6,745 27% 18,552 73% 25,297
Total 67,365 23,884 91,249

FINAL
Double Pipe Creek TMDL Fecal Bacteria Document version: October 1, 2009
47
Municipal and Industrial WWTPs
As explained in the source assessment section above, there are six municipal WWTPs with permits regulating the discharge of bacteria into Double Pipe Creek. There are no industrial WWTPs with a permit regulating the discharge of bacteria directly into the Creek. These six municipal WWTPs discharge bacteria into three subwatersheds: Little Pipe Creek (LPC0091), Bear Branch (BEB0009) and Big Pipe Creek (BPC0006). Bacteria loads assigned to these WWTPs are allocated as the WWTP WLA.
4.9 Summary The long-term annual average TMDLs and the maximum daily loads for the Double Pipe Creek subwatersheds are presented in Tables 4.9.1 and 4.9.2.
Table 4.9.1: Double Pipe Creek Watershed TMDL
TMDL LA Stormwater
WLA WWTP WLA
Subwatersheds Billions MPN E. coli/year
Bear Branch (BEB0009)
12,383 7,866 4,449 68
Big Pipe Creek (BPC0120)
43,194 24,909 18,286 N/A
Meadow Branch (MEB0000)
12,366 7,582 4,784 N/A
Big Pipe Creek (BPC0006sub)
21,948 14,775 7,129 44
Little Pipe Creek (LPC0091)
116,559 85,718 21,563 9,279
Sam’s Creek (SAM0001)
17,734 7,993 9,741 N/A
Little Pipe Creek (LPC0032sub)
57,983 32,686 25,297 N/A
TOTAL* 282,168 181,528 91,249 9,391
*This total load represents the sum of the individual TMDLs of the subwatersheds presented above and not the TMDL for the Double Pipe Creek watershed as a whole.

FINAL
Double Pipe Creek TMDL Fecal Bacteria Document version: October 1, 2009
48
Table 4.9.2: Double Pipe Creek Watershed Maximum Daily Loads
TMDL LA Stormwater
WLA WWTP WLA
Subwatersheds Billions MPN E. coli/day
Bear Branch (BEB0009)
221 163 58 0.6
Big Pipe Creek (BPC0120)
2,201 1,631 570 0
Meadow Branch (MEB0000)
350 252 98 0
Big Pipe Creek (BPC0006sub)
1,333 1,050 283 0.4
Little Pipe Creek (LPC0091)
2,370 1,918 373 79
Sam’s Creek (SAM0001)
458 271 187 0
Little Pipe Creek (LPC0032sub)
1,149 864 285 0
TOTAL* 8,082 6,148 1,854 80
*This total load represents the sum of the individual TMDLs of the subwatersheds presented above and not the TMDL for the Double Pipe Creek watershed as a whole. See Appendix E for an explanation of the hydrologic relationship between the Double Pipe Creek, Upper Monocacy River, and Lower Monocacy River watersheds and how this relationship affects the fecal bacteria TMDLs for those watersheds. In certain watersheds, the goal of meeting water quality standards may require very high reductions that are not achievable with current technologies and management practices. In this situation, where there is no feasible TMDL scenario, MPRs are increased to provide estimates of the reductions required to meet water quality standards. In the Double Pipe Creek subwatersheds, water quality standards cannot be achieved with the maximum practicable reduction rates specified in Table 4.6.3. The TMDLs shown in Tables 4.9.1 and 4.9.2 represent reductions from current bacteria loadings that are beyond practical reductions. In cases where such high reductions are required to meet standards, it is expected that the first stage of implementation will be to carry out the MPR scenario.

FINAL
Double Pipe Creek TMDL Fecal Bacteria Document version: October 1, 2009
49
5.0 ASSURANCE OF IMPLEMENTATION
Section 303(d) of the Clean Water Act and current EPA regulations require reasonable assurance that the TMDL load and wasteload allocations can and will be implemented. In the Double Pipe Creek watershed, the TMDL analysis indicates that, for all seven subwatersheds, the reduction of fecal bacteria loads from all sources including wildlife are beyond the MPR targets. These MPR targets were defined based on a literature review of BMPs effectiveness and assuming a zero reduction for wildlife sources. Double Pipe Creek and its tributaries Big Pipe Creek, Little Pipe Creek, Bear Branch, Meadow Creek and Sam’s Creek may not be able to attain water quality standards. The fecal bacteria load reductions required to meet water quality criteria in all seven subwatersheds of the Double Pipe Creek are not feasible by implementing effluent limitations and cost-effective, reasonable BMPs to nonpoint sources. Therefore, MDE proposes a staged approach to implementation beginning with the MPR scenario, with regularly scheduled follow-up monitoring to assess the effectiveness of the implementation plan. Additional reductions will be achieved through the implementation of BMPs; however, the literature reports considerable uncertainty concerning the effectiveness of BMPs in treating bacteria. As an example, pet waste education programs have varying results based on stakeholder involvement. Additionally, the extent of wildlife reduction associated with various BMPs methods (e.g., structural, non-structural, etc.) is uncertain. Therefore, MDE intends for the required reductions to be implemented in an iterative process that first addresses those sources with the largest impact on water quality and human health risk, with consideration given to ease of implementation and cost. The iterative implementation of BMPs in the watershed has several benefits: tracking of water quality improvements following BMP implementation through follow-up stream monitoring; providing a mechanism for developing public support through periodic updates on BMP implementation; and helping to ensure that the most cost-effective practices are implemented first. Potential funding sources for implementation include the Maryland’s Agricultural Cost Share Program (MACS), which provides grants to farmers to help protect natural resources, and the Environmental Quality and Incentives Program, which focuses on implementing conservation practices and BMPs on land involved with livestock and production. Though not directly linked, it is assumed that the nutrient management plans from the Water Quality Improvement Act of 1998 (WQIA) will have some reduction of bacteria from manure application practices. Implementation and Wildlife Sources It is expected that in some waters for which TMDLs will be developed, the bacteria source analysis indicates that after controls are in place for all anthropogenic sources, the waterbody will not meet water quality standards. Neither Maryland nor EPA is proposing the wildlife controls to allow for the attainment of water quality standards, although managing the overpopulation of wildlife remains an option for state and local stakeholders. After developing and implementing, to the maximum extent possible, a reduction goal based on the anthropogenic sources identified in the TMDL, Maryland anticipates that implementation to reduce the controllable nonpoint sources may also reduce some wildlife inputs to the waters.
FINAL
Double Pipe Creek TMDL Fecal Bacteria Document version: October 1, 2009
50
REFERENCES
Cameron, R., Mackeney and Merle D. Pierson, eds. 1994. Environmental Indicators and Shellfish Safety. Chapman & Hall. Cleland, Bruce. 2003. TMDL Development from the “Bottom Up” – Part III: Duration Curves and Wet-weather Assessments. America’s Clean Water Foundation. Washington D.C. Code of Federal Regulations, 40 CFR 130.2(h), 40 CFR 130.7(c)(1). Website http://www.access.gpo.gov/nara/cfr/waisidx_04/40cfr130_04.html, last visited 06/24/05. Code of Maryland Regulations, 26.08.02.03-3A(1), 26.08.02.08P. Website http://www.dsd.state.md.us/comar, last visited 06/24/06. Code of Maryland Regulations, 26.08.10. Website http://www.dsd.state.md.us/comar, last visited 07/29/06. Cohn, T.A., L.L. DeLong, E.J. Gilroy, and R.M. Hirsch, and D.K. Wells. 1989. Estimating Constituent Loads. Water Resources Research 25: 937-942. Duan, N. 1983. Smearing Estimate: A Nonparametric Retransformation method. Journal of the American Statistical Association 78:605-610. Easton, J. H., M. M. Lalor, J. J. Gauthier and R. E. Pitt. 2001. Pathogen Decay in Urban Streams. In: AWRA Annual Spring Specialty Conference Proceedings: Water Quality Monitoring and Modeling, American Water Resources Association, San Antonio, TX, pp. 169-174. Ferguson, R.I. 1986. River Loads Underestimated by Rating Curves. Water Resources Research 22: 74-76. MDE (Maryland Department of the Environment). 2002. 2002 List of Impaired Surface Waters [303(d) List] and Integrated Assessment of Water Quality in Maryland. MDE. 2006. 2006 List of Impaired Surface Waters [303(d) List] and Integrated Assessment of Water Quality in Maryland. ————. 2004. 2004 FINAL List of Impaired Surface Waters [303(d) List] and Integrated Assessment of Water Quality in Maryland. ————. 2002. 2002 Bacteriological TMDL Survey of Double Pipe Creek. MDP (Maryland Department of Planning). 2000. 2000 Land Use, Land Cover Map Series. ————. Estimates of Septic Systems. 2003. Baltimore: Maryland Department of Planning, Comprehensive Planning Unit.
FINAL
Double Pipe Creek TMDL Fecal Bacteria Document version: October 1, 2009
51
Richards, R.P. 1998. Estimation of pollutant loads in rivers and streams: A guidance document for NPS programs. Project report prepared under Grant X998397-01-0, U.S. Environmental Protection Agency, Region VIII, Denver. 108 p. Schueler, T. 1999. “Microbes and Urban Watersheds.” Watershed Protection Techniques. 3(1): 551-596. U.S. Department of Commerce. 2000. United States Census Bureau’s GIS Coverage. Washington DC: US Bureau of the Census. U.S. Department of Agriculture. 1995. State Soil Geographic (STATSGO) DataBase. ————. 1997. Census of Agriculture: Maryland State and County Data. Washington, DC: National Agricultural Statistic Service. US EPA (U.S. Environmental Protection Agency). 1986. Ambient Water Quality Criteria for
Bacteria--1986. EPA-440/5-84-002. ————. 1991. Guidance for water quality-based decisions: The TMDL Process, EPA 440/4-91-001. ————. 2002. National Recommended Water Quality Criteria: 2002. EPA-822-R-02-047. November 2002. ————. Health Effects Criteria for Fresh Recreational Waters. EPA-600/1-84-004. U.S. Environmental Protection Agency, Washington, DC. EPA. 1984. ————. 1999. Preliminary Data Summary of Urban Storm Water Best Management Practices. EPA-821-R-99-012. U.S. Environmental Protection Agency, Washington, DC. ————. 2004. Agricultural BMP Descriptions as Defined for The Chesapeake Bay Program Watershed Model. Nutrient Subcommittee Agricultural Nutrient Reduction Workshop. ————. 2003. Implementation Guidance for Ambient Water Quality Criteria for Bacteria: Draft, U.S. Environmental Protection Agency. Office of Water, Washington, D.C. EPA-823-B-02-003. ————. 1985. Test Methods for Eschericichia coli and Enterococci in Water by the Membrane Filter Procedure. EPA600/4-85-076. Washington, DC. NTIS PB86-158052. ————. Office of Water. 2000. Bacteria Indicator Tool User's Guide. EPA-823-B-01-003. ————. 2001. Protocol for developing Pathogen TMDLs, EPA 841-R-00-002, Office of Water (4503F). United States Environmental Protection Agency, Washington, DC. 134pp. U.S. Environmental Protection Agency. Stormwater Manager Resource Center. Website: http://www.stormwatercenter.net/.

FINAL
Double Pipe Creek TMDL Fecal Bacteria Document version: October 1, 2009
52
————. Chesapeake Bay Program. 1996. Chesapeake Bay Program: Watershed Model Application to Calculate Bay Nutrient Loadings: Final Findings and Recommendations, and Appendices, Annapolis, MD 1996. USGS (U.S. Geological Survey). 1996. HYSEP: A Computer Program for Streamflow Hydrograph Separation and Analysis. USGS Water-Resource Investigations Report 96-4040. University of Maryland, Mid-Atlantic Regional Earth Science Applications Center, version 1.05, 2000.
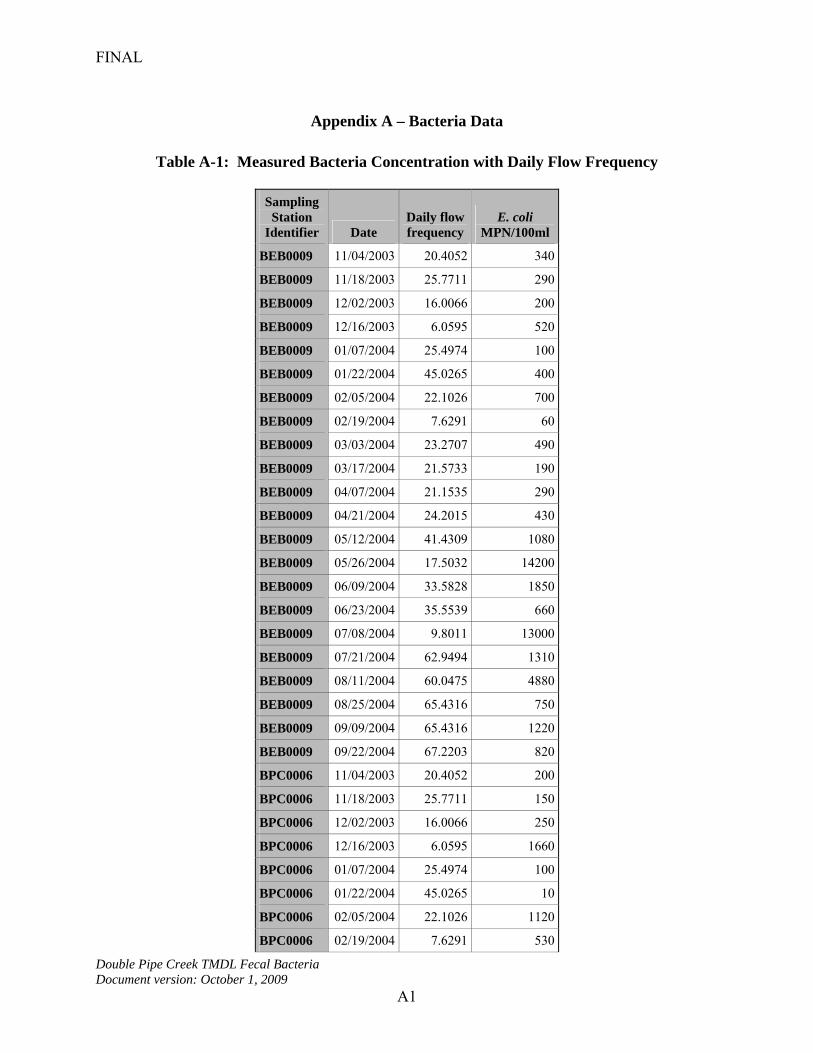
FINAL
Double Pipe Creek TMDL Fecal Bacteria Document version: October 1, 2009
A1
Appendix A – Bacteria Data
Table A-1: Measured Bacteria Concentration with Daily Flow Frequency
Sampling Station
Identifier Date Daily flow frequency
E. coli MPN/100ml
BEB0009 11/04/2003 20.4052 340
BEB0009 11/18/2003 25.7711 290
BEB0009 12/02/2003 16.0066 200
BEB0009 12/16/2003 6.0595 520
BEB0009 01/07/2004 25.4974 100
BEB0009 01/22/2004 45.0265 400
BEB0009 02/05/2004 22.1026 700
BEB0009 02/19/2004 7.6291 60
BEB0009 03/03/2004 23.2707 490
BEB0009 03/17/2004 21.5733 190
BEB0009 04/07/2004 21.1535 290
BEB0009 04/21/2004 24.2015 430
BEB0009 05/12/2004 41.4309 1080
BEB0009 05/26/2004 17.5032 14200
BEB0009 06/09/2004 33.5828 1850
BEB0009 06/23/2004 35.5539 660
BEB0009 07/08/2004 9.8011 13000
BEB0009 07/21/2004 62.9494 1310
BEB0009 08/11/2004 60.0475 4880
BEB0009 08/25/2004 65.4316 750
BEB0009 09/09/2004 65.4316 1220
BEB0009 09/22/2004 67.2203 820
BPC0006 11/04/2003 20.4052 200
BPC0006 11/18/2003 25.7711 150
BPC0006 12/02/2003 16.0066 250
BPC0006 12/16/2003 6.0595 1660
BPC0006 01/07/2004 25.4974 100
BPC0006 01/22/2004 45.0265 10
BPC0006 02/05/2004 22.1026 1120
BPC0006 02/19/2004 7.6291 530
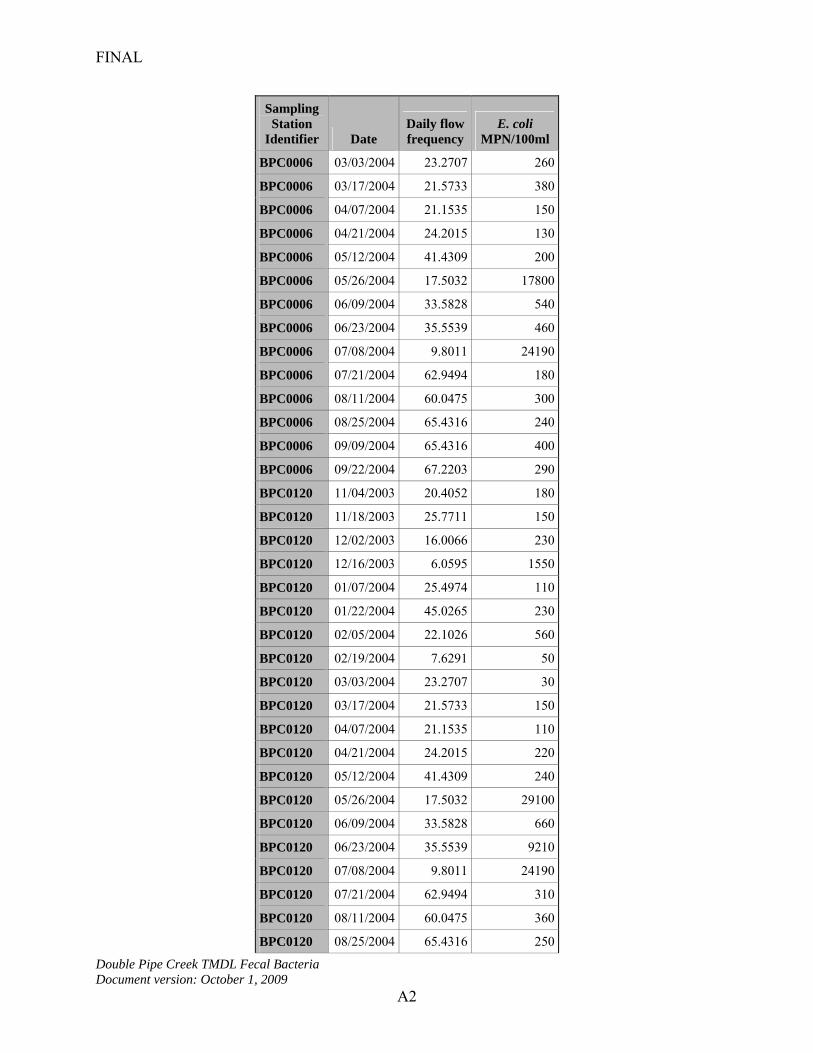
FINAL
Double Pipe Creek TMDL Fecal Bacteria Document version: October 1, 2009
A2
Sampling Station
Identifier Date Daily flow frequency
E. coli MPN/100ml
BPC0006 03/03/2004 23.2707 260
BPC0006 03/17/2004 21.5733 380
BPC0006 04/07/2004 21.1535 150
BPC0006 04/21/2004 24.2015 130
BPC0006 05/12/2004 41.4309 200
BPC0006 05/26/2004 17.5032 17800
BPC0006 06/09/2004 33.5828 540
BPC0006 06/23/2004 35.5539 460
BPC0006 07/08/2004 9.8011 24190
BPC0006 07/21/2004 62.9494 180
BPC0006 08/11/2004 60.0475 300
BPC0006 08/25/2004 65.4316 240
BPC0006 09/09/2004 65.4316 400
BPC0006 09/22/2004 67.2203 290
BPC0120 11/04/2003 20.4052 180
BPC0120 11/18/2003 25.7711 150
BPC0120 12/02/2003 16.0066 230
BPC0120 12/16/2003 6.0595 1550
BPC0120 01/07/2004 25.4974 110
BPC0120 01/22/2004 45.0265 230
BPC0120 02/05/2004 22.1026 560
BPC0120 02/19/2004 7.6291 50
BPC0120 03/03/2004 23.2707 30
BPC0120 03/17/2004 21.5733 150
BPC0120 04/07/2004 21.1535 110
BPC0120 04/21/2004 24.2015 220
BPC0120 05/12/2004 41.4309 240
BPC0120 05/26/2004 17.5032 29100
BPC0120 06/09/2004 33.5828 660
BPC0120 06/23/2004 35.5539 9210
BPC0120 07/08/2004 9.8011 24190
BPC0120 07/21/2004 62.9494 310
BPC0120 08/11/2004 60.0475 360
BPC0120 08/25/2004 65.4316 250

FINAL
Double Pipe Creek TMDL Fecal Bacteria Document version: October 1, 2009
A3
Sampling Station
Identifier Date Daily flow frequency
E. coli MPN/100ml
BPC0120 09/09/2004 65.4316 620
BPC0120 09/22/2004 67.2203 520
LPC0032 11/04/2003 20.4052 720
LPC0032 11/18/2003 25.7711 610
LPC0032 12/02/2003 16.0066 2480
LPC0032 12/16/2003 6.0595 5790
LPC0032 01/07/2004 25.4974 180
LPC0032 01/22/2004 45.0265 180
LPC0032 02/05/2004 22.1026 3610
LPC0032 02/19/2004 7.6291 660
LPC0032 03/03/2004 23.2707 220
LPC0032 03/17/2004 21.5733 2140
LPC0032 04/07/2004 21.1535 440
LPC0032 04/21/2004 24.2015 740
LPC0032 05/12/2004 41.4309 2220
LPC0032 05/26/2004 17.5032 130000
LPC0032 06/09/2004 33.5828 2100
LPC0032 06/23/2004 35.5539 2760
LPC0032 07/08/2004 9.8011 24190
LPC0032 07/21/2004 62.9494 1480
LPC0032 08/11/2004 60.0475 930
LPC0032 08/25/2004 65.4316 1230
LPC0032 09/09/2004 65.4316 1470
LPC0032 09/22/2004 67.2203 2910
LPC0091 11/04/2003 20.4052 860
LPC0091 11/18/2003 25.7711 590
LPC0091 12/02/2003 16.0066 420
LPC0091 12/16/2003 6.0595 2610
LPC0091 01/07/2004 25.4974 570
LPC0091 01/22/2004 45.0265 250
LPC0091 02/05/2004 22.1026 3870
LPC0091 02/19/2004 7.6291 5790
LPC0091 03/03/2004 23.2707 210
LPC0091 03/17/2004 21.5733 1020

FINAL
Double Pipe Creek TMDL Fecal Bacteria Document version: October 1, 2009
A4
Sampling Station
Identifier Date Daily flow frequency
E. coli MPN/100ml
LPC0091 04/07/2004 21.1535 1840
LPC0091 04/21/2004 24.2015 820
LPC0091 05/12/2004 41.4309 2480
LPC0091 05/26/2004 17.5032 15530
LPC0091 06/09/2004 33.5828 1730
LPC0091 06/23/2004 35.5539 1440
LPC0091 07/08/2004 9.8011 24190
LPC0091 07/21/2004 62.9494 930
LPC0091 08/11/2004 60.0475 860
LPC0091 08/25/2004 65.4316 910
LPC0091 09/09/2004 65.4316 1330
LPC0091 09/22/2004 67.2203 1180
MEB0000 11/04/2003 20.4052 420
MEB0000 11/18/2003 25.7711 190
MEB0000 12/02/2003 16.0066 390
MEB0000 12/16/2003 6.0595 1540
MEB0000 01/07/2004 25.4974 160
MEB0000 01/22/2004 45.0265 100
MEB0000 02/05/2004 22.1026 1670
MEB0000 02/19/2004 7.6291 70
MEB0000 03/03/2004 23.2707 20
MEB0000 03/17/2004 21.5733 370
MEB0000 04/07/2004 21.1535 160
MEB0000 04/21/2004 24.2015 880
MEB0000 05/12/2004 41.4309 1010
MEB0000 05/26/2004 17.5032 8800
MEB0000 06/09/2004 33.5828 1790
MEB0000 06/23/2004 35.5539 1850
MEB0000 07/08/2004 9.8011 7700
MEB0000 07/21/2004 62.9494 1380
MEB0000 08/11/2004 60.0475 2140
MEB0000 08/25/2004 65.4316 780
MEB0000 09/09/2004 65.4316 17330
MEB0000 09/22/2004 67.2203 730

FINAL
Double Pipe Creek TMDL Fecal Bacteria Document version: October 1, 2009
A5
Sampling Station
Identifier Date Daily flow frequency
E. coli MPN/100ml
SAM0001 11/04/2003 20.4052 600
SAM0001 11/18/2003 25.7711 740
SAM0001 12/02/2003 16.0066 680
SAM0001 12/16/2003 6.0595 730
SAM0001 01/07/2004 25.4974 90
SAM0001 01/22/2004 45.0265 50
SAM0001 02/05/2004 22.1026 2360
SAM0001 02/19/2004 7.6291 110
SAM0001 03/03/2004 23.2707 50
SAM0001 03/17/2004 21.5733 290
SAM0001 04/07/2004 21.1535 500
SAM0001 04/21/2004 24.2015 1300
SAM0001 05/12/2004 41.4309 1870
SAM0001 05/26/2004 17.5032 68700
SAM0001 06/09/2004 33.5828 1380
SAM0001 06/23/2004 35.5539 1580
SAM0001 07/08/2004 9.8011 24190
SAM0001 07/21/2004 62.9494 7700
SAM0001 08/11/2004 60.0475 2360
SAM0001 08/25/2004 65.4316 2480
SAM0001 09/09/2004 65.4316 4110
SAM0001 09/22/2004 67.2203 990
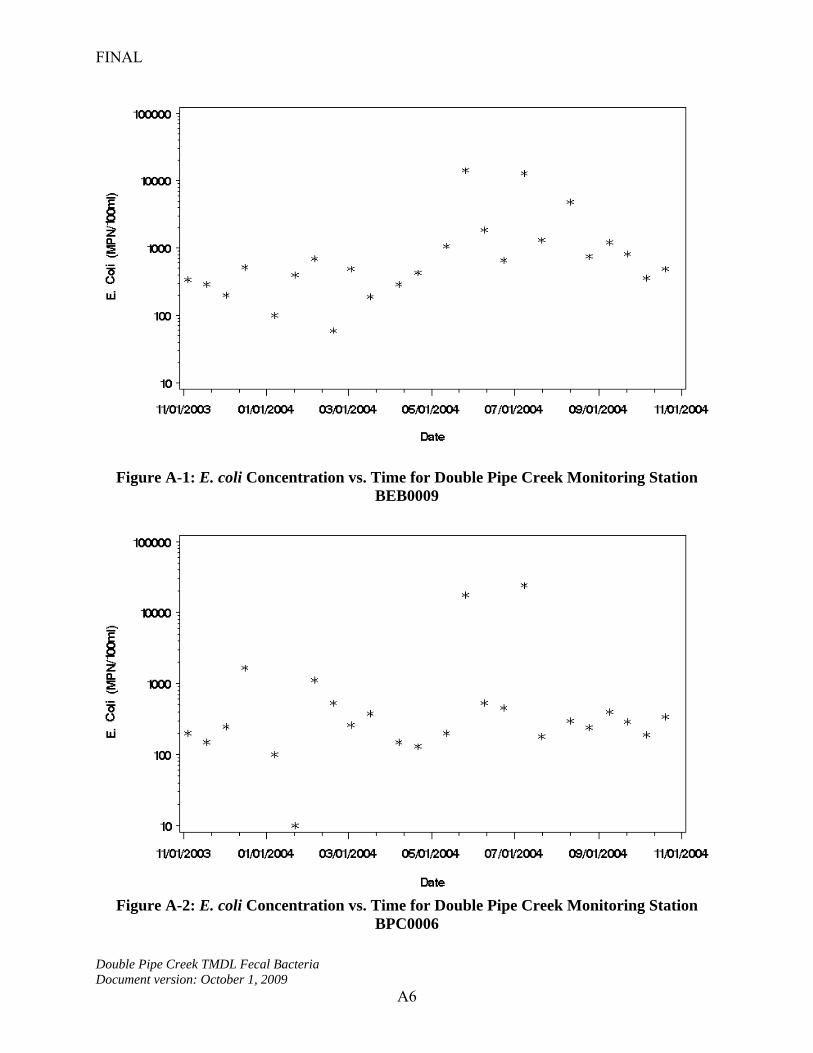
FINAL
Double Pipe Creek TMDL Fecal Bacteria Document version: October 1, 2009
A6
Figure A-1: E. coli Concentration vs. Time for Double Pipe Creek Monitoring Station BEB0009
Figure A-2: E. coli Concentration vs. Time for Double Pipe Creek Monitoring Station
BPC0006

FINAL
Double Pipe Creek TMDL Fecal Bacteria Document version: October 1, 2009
A7
Figure A-3: E. coli Concentration vs. Time for Double Pipe Creek Monitoring Station
BPC0120
Figure A-4: E. coli Concentration vs. Time for Double Pipe Creek Monitoring Station
LPC0032

FINAL
Double Pipe Creek TMDL Fecal Bacteria Document version: October 1, 2009
A8
Figure A-5: E. coli Concentration vs. Time for Double Pipe Creek Monitoring Station
LPC0091
Figure A-6: E. coli Concentration vs. Time for Double Pipe Creek Monitoring Station
MEB0000

FINAL
Double Pipe Creek TMDL Fecal Bacteria Document version: October 1, 2009
A9
Figure A-7: E. coli Concentration vs. Time for Double Pipe Creek Monitoring Station SAM0001

FINAL
Double Pipe Creek TMDL Fecal Bacteria Document version: October 1, 2009
B1
Appendix B – Flow Duration Curve Analysis to Define Strata
The Double Pipe Creek watershed was assessed to determine hydrologically significant strata. The purpose of these strata is to apply weights to monitoring data and thus (1) reduce bias associated with the monitoring design and (2) approximate a critical condition for TMDL development. The strata group hydrologically similar water quality samples and provide a better estimate of the mean concentration at the monitoring station. The flow duration curve for a watershed is a plot of all possible daily flows, ranked from highest to lowest, versus their probability of exceedance. In general, the higher flows will tend to be dominated by excess runoff from rain events and the lower flows will result from drought type conditions. The mid-range flows are a combination of high base flow with limited runoff and lower base flow with excess runoff. The range of these mid-level flows will vary with soil antecedent conditions. The purpose of the following analysis is to identify hydrologically significant groups, based on the previously described flow regimes, within the flow duration curve. Flow Analysis The Double Pipe Creek watershed has one active USGS flow gauge (01639500). The gauge and dates of information used are as follows: Table B-1: USGS Gauges in the Double Pipe Creek Watershed
USGS Gage # Dates used Description
01639500 October 1, 1989 to September 30, 2004
Big Pipe Creek near Bruceville, MD
A flow duration curve for this gauge is presented in Figure B-1.
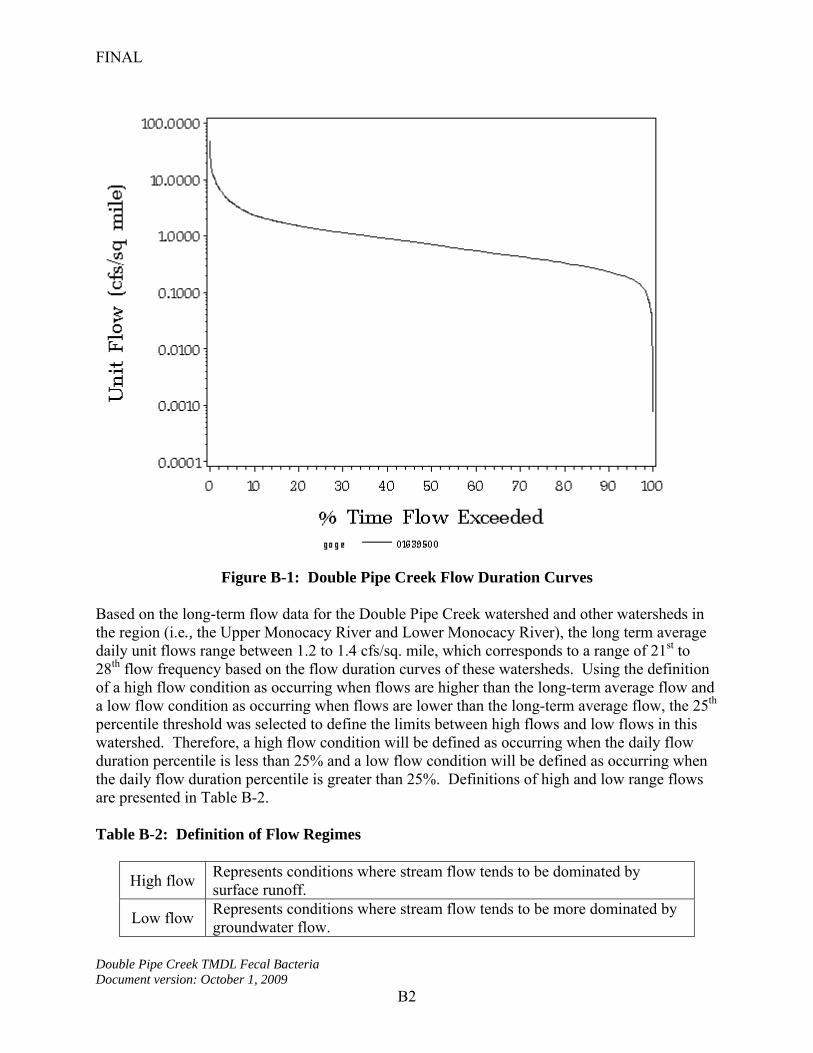
FINAL
Double Pipe Creek TMDL Fecal Bacteria Document version: October 1, 2009
B2
Figure B-1: Double Pipe Creek Flow Duration Curves
Based on the long-term flow data for the Double Pipe Creek watershed and other watersheds in the region (i.e., the Upper Monocacy River and Lower Monocacy River), the long term average daily unit flows range between 1.2 to 1.4 cfs/sq. mile, which corresponds to a range of 21st to 28th flow frequency based on the flow duration curves of these watersheds. Using the definition of a high flow condition as occurring when flows are higher than the long-term average flow and a low flow condition as occurring when flows are lower than the long-term average flow, the 25th percentile threshold was selected to define the limits between high flows and low flows in this watershed. Therefore, a high flow condition will be defined as occurring when the daily flow duration percentile is less than 25% and a low flow condition will be defined as occurring when the daily flow duration percentile is greater than 25%. Definitions of high and low range flows are presented in Table B-2. Table B-2: Definition of Flow Regimes
High flow Represents conditions where stream flow tends to be dominated by surface runoff.
Low flow Represents conditions where stream flow tends to be more dominated by groundwater flow.

FINAL
Double Pipe Creek TMDL Fecal Bacteria Document version: October 1, 2009
B3
Flow-Data Analysis
The final analysis to define the daily flow duration intervals (flow regions, strata) includes the bacteria monitoring data. Bacteria (E. coli) monitoring data are “placed” within the regions (strata) based on the daily flow duration percentile of the date of sampling. Figures B-2 to B-8 show the Double Pipe Creek E. coli monitoring data with corresponding flow frequency for the average annual and the seasonal conditions. Maryland’s water quality standards for bacteria state that, when available, the geometric mean indicator should be based on at least five samples taken representatively over 30 days. Therefore, in situations in which fewer than five samples “fall” within a particular flow regime interval, the interval and the adjacent interval will be joined. In Double Pipe Creek, there are sufficient samples in both the high flow strata to estimate the geometric means. For the low flow strata only three samples exist, therefore the mid and low flow strata will be combined to calculate the geometric mean. Weighting factors for estimating a weighted geometric mean are based on the frequency of each flow stratum during the averaging period. The weighting factors for the averaging periods and hydrological conditions are presented in Table B-3. Averaging periods are defined in this report as:
(1) Average Annual Hydrological Condition (2) Annual High Flow Condition (3) Annual Low Flow Condition (4) Seasonal (May 1st – September 30th) High Flow Condition (5) Seasonal (May 1st – September 30th) Low Flow Condition
Weighted geometric means for the average annual and the seasonal conditions are plotted with the monitoring data on Figures B-2 to B-8.

FINAL
Double Pipe Creek TMDL Fecal Bacteria Document version: October 1, 2009
B4
Table B-3: Weighting Factors for Estimation of Geometric Mean
Hydrological Condition
Subwatershed Weighting
Factor High Flow
Weighting Factor Low
Flow Average
Condition All 0.25 0.75
High All 0.74 0.26
Ann
ual
Low All 0.0 1.0
High All 0.57 0.43
Sea
son
Low All 0.0 1.0
Figure B-2: E. coli Concentration vs. Flow Duration for Double Pipe Creek Monitoring
Station BEB0009

FINAL
Double Pipe Creek TMDL Fecal Bacteria Document version: October 1, 2009
B5
Figure B-3: E. coli Concentration vs. Flow Duration for Double Pipe Creek Monitoring
Station BPC0006
Figure B-4: E. coli Concentration vs. Flow Duration for Double Pipe Creek Monitoring
Station BPC0120

FINAL
Double Pipe Creek TMDL Fecal Bacteria Document version: October 1, 2009
B6
Figure B-5: E. coli Concentration vs. Flow Duration for Double Pipe Creek Monitoring
Station LPC0032
Figure B-6: E. coli Concentration vs. Flow Duration for Double Pipe Creek Monitoring
Station LPC0091

FINAL
Double Pipe Creek TMDL Fecal Bacteria Document version: October 1, 2009
B7
Figure B-7: E. coli Concentration vs. Flow Duration for Double Pipe Creek Monitoring
Station MEB0000
Figure B-8: E. coli Concentration vs. Flow Duration for Double Pipe Creek Monitoring
Station SAM0001
FINAL
Double Pipe Creek TMDL Fecal Bacteria Document version: October 1, 2009
C1
Appendix C – BST Report
Identifying Sources of Fecal Pollution in Double Pipe Creek Watershed, Maryland
June 2004 – October 2006
Mark F. Frana, Ph.D. and Elichia A. Venso, Ph.D. Department of Biological Sciences and Environmental Health Science
Salisbury University, Salisbury, MD
October 31, 2006
FINAL
Double Pipe Creek TMDL Fecal Bacteria Document version: October 1, 2009
C2
Table of Contents
Introduction . . . . . . . . . . . . . . . . . . . . . . . . . . . . . . . . . . . . . . C2 Laboratory Methods . . . . . . . . . . . . . . . . . . . . . . . . . . . . . . . . . C3 Known-Source Library . . . . . . . . . . . . . . . . . . . . . . . . . . . . . C4 Statistical Analysis . . . . . . . . . . . . . . . . . . . . . . . . . . . . . . . . . C4 ARA Results . . . . . . . . . . . . . . . . . . . . . . . . . . . . . . . . . . . . . .. C7 Summary………………………………………………………. C17
References . . . . . . . . . . . . . . . . . . . . . . . . . . . . . . . . . . . . . . . C18 Acknowledgements . . . . . . . . . . . . . . . . . . . . . . . . . . . . . . . . . C18

FINAL
Double Pipe Creek TMDL Fecal Bacteria Document version: October 1, 2009
C3
INTRODUCTION Microbial Source Tracking. Microbial Source Tracking (MST) is a relatively recent scientific and technological innovation designed to distinguish the origins of enteric microorganisms found in environmental waters. Several different methods and a variety of different indicator organisms (both bacteria and viruses) have successfully been used for MST, as described in recent reviews (Scott et al., 2002; Simpson et al., 2002). When the indicator organism is bacteria, the term Bacterial Source Tracking (BST) is often used. Some common bacterial indicators for BST analysis include: E. coli, Enterococcus spp., Bacteroides-Prevotella, and Bifidobacterium spp. Techniques for MST can be grouped into one of the following three categories: molecular (genotypic) methods, biochemical (phenotypic) methods, or chemical methods. Ribotyping, Pulsed-Field Gel Electrophoresis (PFGE), and Randomly-Amplified Polymorphic DNA (RAPD) are examples of molecular techniques. Biochemical methods include Antibiotic Resistance Analysis (ARA), F-specific coliphage typing, and Carbon Source Utilization (CSU) analysis. Chemical techniques detect chemical compounds associated with human activities, but do not provide any information regarding nonhuman sources. Examples of this type of technology include detection of optical brighteners from laundry detergents or caffeine (Simpson et al., 2002). Many of the molecular and biochemical methods of MST are “library-based,” requiring the collection of a database of fingerprints or patterns obtained from indicator organisms isolated from known sources. Statistical analysis determines fingerprints/patterns of known sources species or categories of species (i.e., human, livestock, pets, wildlife). Indicator isolates collected from water samples are analyzed using the same MST method to obtain their fingerprints or patterns, which are then statistically compared to those in the library. Based upon this comparison, the final results are expressed in terms of the “statistical probability” that the water isolates came from a given source (Simpson et al. 2002). In this BST project, we studied the following Maryland nontidal watersheds: Antietam Creek, Concoheague Creek, Double Pipe Creek, Lower Monocacy River, and Upper Monocacy River. Also included in the study was the Potomac River Watershed shellfish harvesting area. The methodology used was the ARA with Enterococcus spp. as the indicator organism. Previous BST publications have demonstrated the predictive value of using this particular technique and indicator organism (Hagedorn, 1999; Wiggins, 1999). A pilot study using PFGE, a genotypic BST method, was used on a subset of known-source isolates collected from the Potomac River Watershed.
Antibiotic Resistance Analysis. A variety of different host species can potentially contribute to the fecal contamination found in natural waters. Many years ago, scientists speculated on the possibility of using resistance to antibiotics as a way of determining the sources of this fecal contamination (Bell et al., 1983; Krumperman, 1983). In ARA, the premise is that bacteria

FINAL
Double Pipe Creek TMDL Fecal Bacteria Document version: October 1, 2009
C4
isolated from different hosts can be discriminated based upon differences in the selective pressure of microbial populations found in the gastrointestinal tract of those hosts (humans, livestock, pets, wildlife) (Wiggins, 1996). Microorganisms isolated from the fecal material of wildlife would be expected to have a much lower level of resistance to antibiotics than isolates collected from the fecal material of humans, livestock and pets. In addition, depending upon the specific antibiotics used in the analysis, isolates from humans, livestock and pets could be differentiated from each other. In ARA, isolates from known sources are tested for resistance or sensitivity against a panel of antibiotics and antibiotic concentrations. This information is then used to construct a library of antibiotic resistance patterns from known-source bacterial isolates. Microbial isolates collected from water samples are then tested and their resistance results are recorded. Based upon a comparison of resistance patterns of water and library isolates, a statistical analysis can predict the likely host source of the water isolates. (Hagedorn 1999; Wiggins 1999). LABORATORY METHODS Isolation of Enterococcus from Known-Source Samples. Fecal samples, identified to source, were delivered to the Salisbury University (SU) BST lab by Maryland Department of the Environment (MDE) personnel. Fecal material suspended in phosphate buffered saline was plated onto selective m-Enterococcus agar. After incubation at 37o C, up to eight (8) Enterococcus isolates were randomly selected from each fecal sample for ARA testing. Isolation of Enterococcus from Water Samples. Water samples were collected by MDE staff and shipped overnight to MapTech Inc, Blacksburg, Va. Bacterial isolates were collected by membrane filtration. Up to 24 randomly selected Enterococcus isolates were collected from each water sample and all isolates were then shipped to the SU BST lab. Antibiotic Resistance Analysis. Each bacterial isolate from both water and scat were grown in Enterococcosel® broth (Becton Dickinson, Sparks, MD) prior to ARA testing. Enterococci are capable of hydrolyzing esculin, turning this broth black. Only esculin-positive isolates were tested for antibiotic resistance. Bacterial isolates were plated onto tryptic soy agar plates, each containing a different concentration of a given antibiotic. Plates were incubated overnight at 37o C and isolates then scored for growth (resistance) or no growth (sensitivity). Data consisting of a “1” for resistance or “0” for sensitivity for each isolate at each concentration of each antibiotic was then entered into a spread-sheet for statistical analysis. The following table includes the antibiotics and concentrations used for isolates in analyses for all the study watersheds.

FINAL
Double Pipe Creek TMDL Fecal Bacteria Document version: October 1, 2009
C5
Table C-1. Antibiotics and concentrations used for ARA.
____________________________________________________________
Antibiotic Concentration (µg/ml)
Amoxicillin 0.625 Cephalothin 10, 15, 30, 50 Chloramphenicol 10 Chlortetracycline 60, 80, 100 Erythromycin 10 Gentamycin 5, 10, 15 Neomycin 40, 60, 80 Oxytetracycline 20, 40, 60, 80, 100 Salinomycin 10 Streptomycin 40, 60, 80, 100 Tetracycline 10, 30, 50, 100 Vancomycin 2.5
_____________________________________________________ KNOWN-SOURCE LIBRARY Construction and Use. Fecal samples (scat) from known sources in each watershed were collected during the study period by MDE personnel and delivered to the BST Laboratory at SU. Enterococcus isolates were obtained from known sources (e.g., human, dog, cow, horse, deer, fox, rabbit, and goose). For each watershed, a library of patterns of Enterococcus isolate responses to the panel of antibiotics was analyzed using the statistical software CART® (Salford Systems, San Diego, CA). Enterococcus isolate response patterns were also obtained from bacteria in water samples collected at the monitoring stations in each basin. Using statistical techniques, these patterns were then compared to those in the appropriate library to identify the probable source of each water isolate. A combined library of known sources was used for Antietam Creek and Concocheaque Creek Watersheds using patterns from scat obtained from both watersheds, and the water isolate patterns of each were compared to the combined library. A combined known-source library was also used for Double Pipe Creek, Lower Monocacy River, and Upper Monocacy River, with water isolate patterns of each compared to this combined library.

FINAL
Double Pipe Creek TMDL Fecal Bacteria Document version: October 1, 2009
C6
STATISTICAL ANALYSIS
We applied a tree classification method, 1CART®, to build a model that classifies isolates into
source categories based on ARA data. CART® builds a classification tree by recursively splitting the library of isolates into two nodes. Each split is determined by the antibiotic variables (antibiotic resistance measured for a collection of antibiotics at varying concentrations). The first step in the tree-building process splits the library into two nodes by considering every binary split associated with every variable. The split is chosen that maximizes a specified index of homogeneity for isolate sources within each of the nodes. In subsequent steps, the same process is applied to each resulting node until a stopping criterion is satisfied. Nodes where an additional split would lead to only an insignificant increase in the homogeneity index relative to the stopping criterion are referred to as terminal nodes.2 The collection of terminal nodes defines the classification model. Each terminal node is associated with one source, the source isolate with an unknown source), based that is most populous among the library isolates in the node. Each water sample isolate (i.e., an on its antibiotic resistance pattern, is identified with one specific terminal node and is assigned the source of the majority of library isolates in that terminal node.3
1 The Elements of Statistical Learning: Data Mining, Inference, and Prediction. Hastie T, Tibshirani R, and Friedman J. Springer 2001. 2 An ideal split, i.e., a split that achieves the theoretical maximum for homogeneity, would produce two nodes each containing library isolates from only one source. 3 The CART® tree-classification method we employed includes various features to ensure the development of an optimal classification model. For brevity in exposition, we have chosen not to present details of those features, but suggest the following sources: Breiman L, et al. Classification and Regression Trees. Pacific Grove: Wadsworth, 1984; and Steinberg D and Colla P. CART—Classification and Regression Trees. San Diego, CA: Salford Systems, 1997.
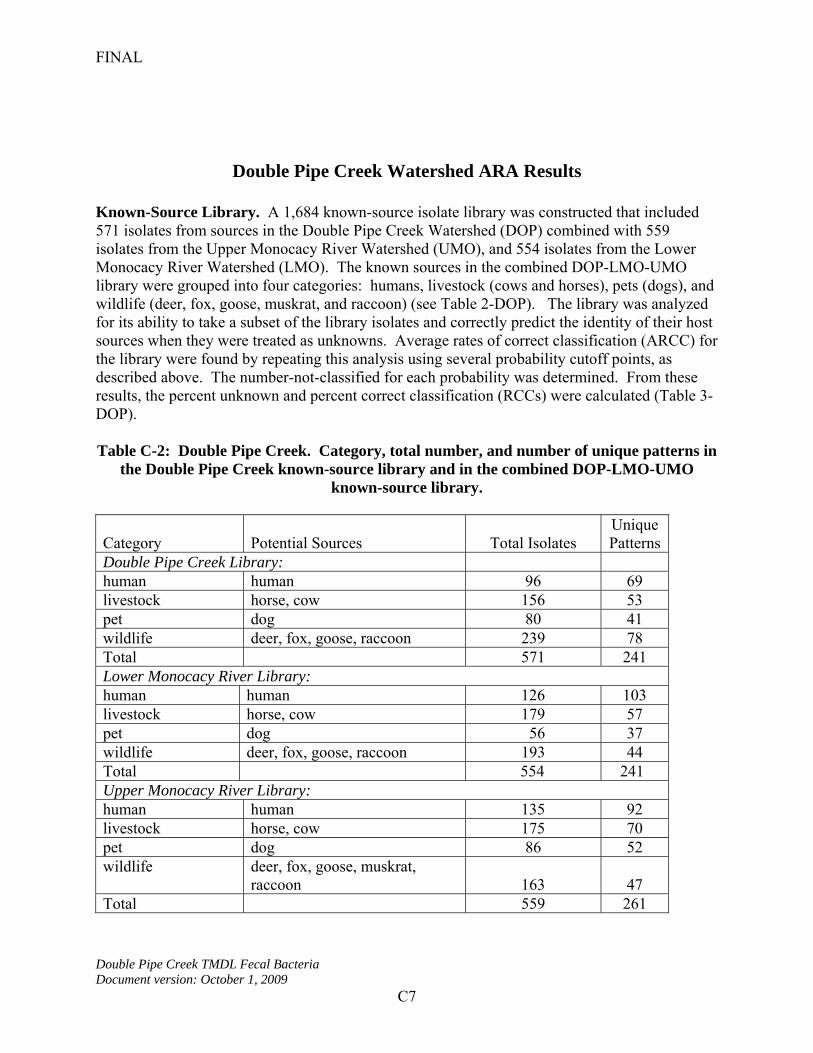
FINAL
Double Pipe Creek TMDL Fecal Bacteria Document version: October 1, 2009
C7
Double Pipe Creek Watershed ARA Results Known-Source Library. A 1,684 known-source isolate library was constructed that included 571 isolates from sources in the Double Pipe Creek Watershed (DOP) combined with 559 isolates from the Upper Monocacy River Watershed (UMO), and 554 isolates from the Lower Monocacy River Watershed (LMO). The known sources in the combined DOP-LMO-UMO library were grouped into four categories: humans, livestock (cows and horses), pets (dogs), and wildlife (deer, fox, goose, muskrat, and raccoon) (see Table 2-DOP). The library was analyzed for its ability to take a subset of the library isolates and correctly predict the identity of their host sources when they were treated as unknowns. Average rates of correct classification (ARCC) for the library were found by repeating this analysis using several probability cutoff points, as described above. The number-not-classified for each probability was determined. From these results, the percent unknown and percent correct classification (RCCs) were calculated (Table 3-DOP). Table C-2: Double Pipe Creek. Category, total number, and number of unique patterns in
the Double Pipe Creek known-source library and in the combined DOP-LMO-UMO known-source library.
Category Potential Sources Total Isolates Unique Patterns
Double Pipe Creek Library: human human 96 69 livestock horse, cow 156 53 pet dog 80 41 wildlife deer, fox, goose, raccoon 239 78 Total 571 241 Lower Monocacy River Library: human human 126 103 livestock horse, cow 179 57 pet dog 56 37 wildlife deer, fox, goose, raccoon 193 44 Total 554 241 Upper Monocacy River Library: human human 135 92 livestock horse, cow 175 70 pet dog 86 52 wildlife
deer, fox, goose, muskrat, raccoon 163 47
Total 559 261

FINAL
Double Pipe Creek TMDL Fecal Bacteria Document version: October 1, 2009
C8
Combined DOP-LMO-UMO Library: human human 357 264 livestock cow, horse 510 180 pet dog 222 130 wildlife deer, fox, goose, 595 169 muskrat, raccoon Total 1684 743
Table C-3: Double Pipe Creek. Number of isolates not classified, percent unknown, and percent correct for eight (8) threshold probabilities for DOP known-source
isolates using the combined DOP-LMO-UMO known-source library. Threshold 0 0.25 0.375 0.5 0.6 0.7 0.8 0.9 % correct 59.9% 59.9% 61.5% 61.6% 69.4% 89.9% 96.9% 98.1% % unknown 0.0% 0.0% 4.4% 26.1% 46.8% 70.4% 77.8% 81.8% # not classified 0 0 25 149 267 402 444 467

FINAL
Double Pipe Creek TMDL Fecal Bacteria Document version: October 1, 2009
C9
DOP-LMO-UMO library used to predict DOP scat, threshold analysis
0.0%
10.0%
20.0%
30.0%
40.0%
50.0%
60.0%
70.0%
80.0%
90.0%
100.0%
0 0.25 0.375 0.5 0.6 0.7 0.8 0.9
threshold probability
perc
ent c
orre
ct
% correct
% unknown
Figure C-1: Double Pipe Creek Classification Model: Percent Correct versus Percent Unknown using a combined DOP-LMO-UMO library.
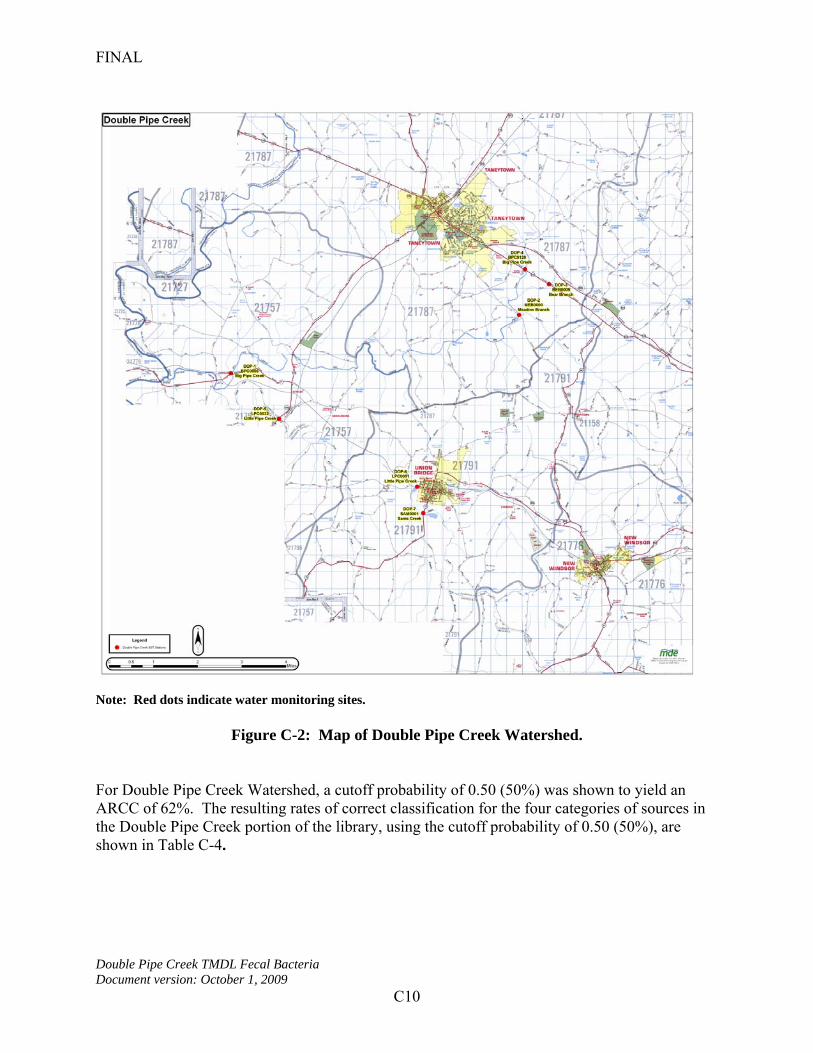
FINAL
Double Pipe Creek TMDL Fecal Bacteria Document version: October 1, 2009
C10
Note: Red dots indicate water monitoring sites.
Figure C-2: Map of Double Pipe Creek Watershed. For Double Pipe Creek Watershed, a cutoff probability of 0.50 (50%) was shown to yield an ARCC of 62%. The resulting rates of correct classification for the four categories of sources in the Double Pipe Creek portion of the library, using the cutoff probability of 0.50 (50%), are shown in Table C-4.
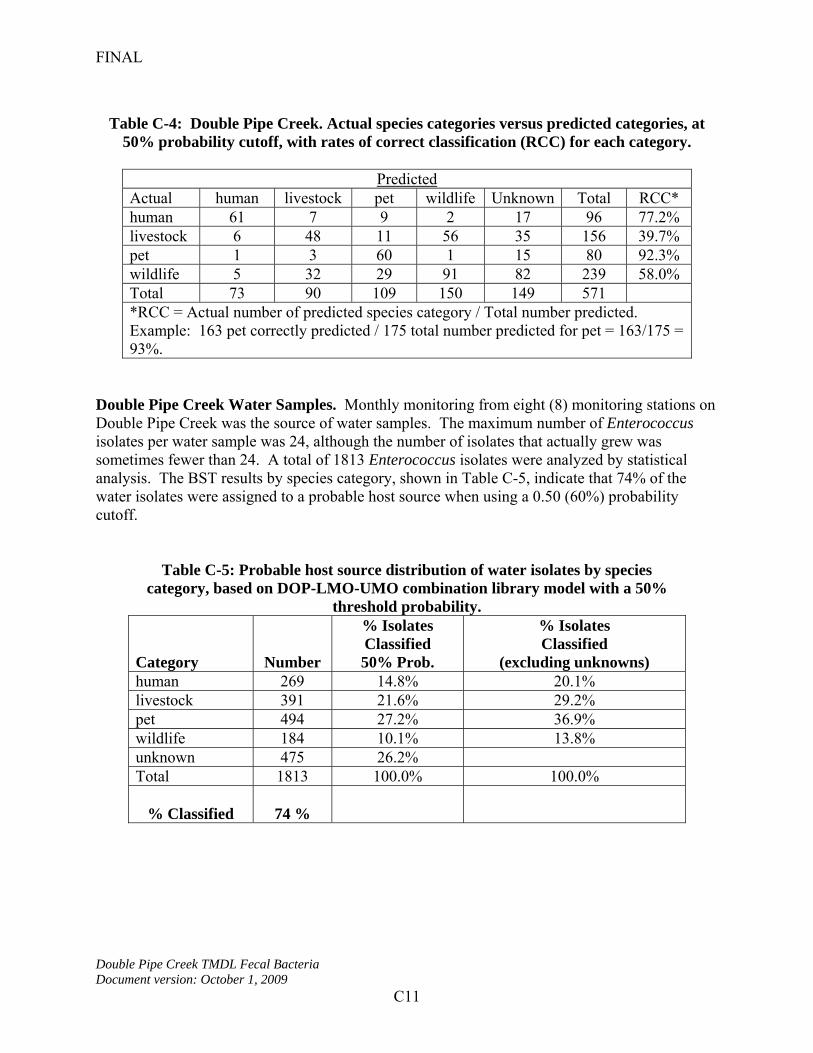
FINAL
Double Pipe Creek TMDL Fecal Bacteria Document version: October 1, 2009
C11
Table C-4: Double Pipe Creek. Actual species categories versus predicted categories, at
50% probability cutoff, with rates of correct classification (RCC) for each category.
Predicted Actual human livestock pet wildlife Unknown Total RCC* human 61 7 9 2 17 96 77.2% livestock 6 48 11 56 35 156 39.7% pet 1 3 60 1 15 80 92.3% wildlife 5 32 29 91 82 239 58.0% Total 73 90 109 150 149 571 *RCC = Actual number of predicted species category / Total number predicted. Example: 163 pet correctly predicted / 175 total number predicted for pet = 163/175 = 93%.
Double Pipe Creek Water Samples. Monthly monitoring from eight (8) monitoring stations on Double Pipe Creek was the source of water samples. The maximum number of Enterococcus isolates per water sample was 24, although the number of isolates that actually grew was sometimes fewer than 24. A total of 1813 Enterococcus isolates were analyzed by statistical analysis. The BST results by species category, shown in Table C-5, indicate that 74% of the water isolates were assigned to a probable host source when using a 0.50 (60%) probability cutoff.
Table C-5: Probable host source distribution of water isolates by species
category, based on DOP-LMO-UMO combination library model with a 50% threshold probability.
Category Number
% Isolates Classified 50% Prob.
% Isolates Classified
(excluding unknowns) human 269 14.8% 20.1% livestock 391 21.6% 29.2% pet 494 27.2% 36.9% wildlife 184 10.1% 13.8% unknown 475 26.2% Total 1813 100.0% 100.0%
% Classified 74 %

FINAL
Double Pipe Creek TMDL Fecal Bacteria Document version: October 1, 2009
C12
The seasonal distribution of water isolates from samples collected at each sampling station is shown below in Table C-6.
Table C-6: Double Pipe Creek. Enterococcus isolates obtained from water collected during the spring, summer, fall, and winter seasons, by monitoring
station. Season
Station Spring Summer Fall Winter Total
BEB0009 72 72 68 67 279 BPC0006 68 72 65 51 256 BPC0120 72 72 69 61 274 LPC0032 72 72 72 43 259 LPC0091 68 72 62 55 257 MEB0000 65 72 57 40 234 SAM0001 72 72 61 49 254
Total 489 504 454 366 1813 Tables C-7 and C-8 (below) show the number and percent of the probable sources for each monitoring station by month.
Table C-7: Double Pipe Creek. BST Analysis: Number of Isolates per Station per Date. Predicted Source
Station Date Human Livestock Pet Wildlife Unknown Total BEB0009 11/18/03 3 6 3 3 6 21 BEB0009 12/02/03 3 5 9 4 2 23 BEB0009 01/07/04 4 4 3 3 6 20 BEB0009 02/05/04 4 5 6 5 3 23 BEB0009 03/03/04 4 8 2 1 9 24 BEB0009 04/07/04 2 9 1 2 10 24 BEB0009 05/12/04 4 14 2 1 3 24 BEB0009 06/09/04 3 8 7 0 6 24 BEB0009 07/08/04 6 1 9 0 8 24 BEB0009 08/11/04 1 2 5 4 12 24 BEB0009 09/09/04 0 0 14 1 9 24 BEB0009 10/06/04 1 5 3 4 11 24 BPC0006 11/18/03 2 3 1 6 9 21 BPC0006 12/02/03 6 3 4 5 2 20 BPC0006 01/07/04 1 2 0 1 2 6 BPC0006 02/05/04 6 4 8 4 1 23 BPC0006 03/03/04 6 5 5 3 3 22 BPC0006 04/07/04 3 6 2 3 10 24 BPC0006 05/12/04 2 1 9 0 8 20 BPC0006 06/09/04 3 6 4 5 6 24

FINAL
Double Pipe Creek TMDL Fecal Bacteria Document version: October 1, 2009
C13
BPC0006 07/08/04 5 0 12 1 6 24 BPC0006 08/11/04 1 5 8 1 9 24
Predicted Source Station Date Human Livestock Pet Wildlife Unknown Total
BPC0006 09/09/04 1 2 3 1 17 24 BPC0006 10/06/04 2 9 0 2 11 24 BPC0120 11/18/03 4 1 9 3 4 21 BPC0120 12/02/03 5 7 5 3 4 24 BPC0120 01/07/04 5 3 1 2 2 13 BPC0120 02/05/04 10 5 3 2 4 24 BPC0120 03/03/04 2 4 13 0 5 24 BPC0120 04/07/04 1 4 4 8 7 24 BPC0120 05/12/04 7 4 6 0 7 24 BPC0120 06/09/04 2 3 10 0 9 24 BPC0120 07/08/04 10 1 4 0 9 24 BPC0120 08/11/04 1 1 14 3 5 24 BPC0120 09/09/04 9 6 6 0 3 24 BPC0120 10/06/04 4 2 17 1 0 24 LPC0032 11/18/03 2 13 6 0 3 24 LPC0032 12/02/03 1 7 4 5 7 24 LPC0032 01/07/04 2 6 4 0 3 15 LPC0032 02/05/04 4 3 15 1 0 23 LPC0032 03/03/04 0 1 0 3 1 5 LPC0032 04/07/04 6 2 6 4 6 24 LPC0032 05/12/04 3 11 2 3 5 24 LPC0032 06/09/04 7 6 5 2 4 24 LPC0032 07/08/04 8 1 7 1 7 24 LPC0032 08/11/04 4 4 3 0 13 24 LPC0032 09/09/04 4 9 5 2 4 24 LPC0032 10/06/04 1 5 7 0 11 24 LPC0091 11/18/03 1 2 2 2 7 14 LPC0091 12/02/03 2 10 3 2 7 24 LPC0091 01/07/04 6 4 3 1 10 24 LPC0091 02/05/04 5 4 14 0 0 23 LPC0091 03/03/04 1 3 1 2 1 8 LPC0091 04/07/04 1 9 2 5 3 20 LPC0091 05/12/04 5 2 6 1 10 24 LPC0091 06/09/04 5 8 7 2 2 24 LPC0091 07/08/04 3 3 12 0 6 24 LPC0091 08/11/04 1 6 7 4 6 24 LPC0091 09/09/04 2 8 7 1 6 24 LPC0091 10/06/04 3 10 7 2 2 24 MEB0000 11/18/03 1 5 3 2 6 17

FINAL
Double Pipe Creek TMDL Fecal Bacteria Document version: October 1, 2009
C14
MEB0000 12/02/03 2 3 3 4 6 18 MEB0000 01/07/04 1 2 1 0 2 6 MEB0000 02/05/04 4 5 14 1 0 24 MEB0000 03/03/04 1 1 0 2 6 10
Predicted Source Station Date Human Livestock Pet Wildlife Unknown Total
MEB0000 04/07/04 2 3 0 7 5 17 MEB0000 05/12/04 1 4 8 7 4 24 MEB0000 06/09/04 3 6 9 0 6 24 MEB0000 07/08/04 6 8 2 1 7 24 MEB0000 08/11/04 0 2 9 1 12 24 MEB0000 09/09/04 6 7 4 3 4 24 MEB0000 10/06/04 2 6 6 1 7 22 SAM0001 11/18/03 3 5 2 5 2 17 SAM0001 12/02/03 1 2 5 8 4 20 SAM0001 01/07/04 4 1 5 4 1 15 SAM0001 02/05/04 1 4 13 5 1 24 SAM0001 03/03/04 3 4 2 0 1 10 SAM0001 04/07/04 4 2 15 2 1 24 SAM0001 05/12/04 2 8 8 1 5 24 SAM0001 06/09/04 2 11 4 1 6 24 SAM0001 07/08/04 5 2 15 0 2 24 SAM0001 08/11/04 0 1 2 3 18 24 SAM0001 09/09/04 1 1 9 0 13 24 SAM0001 10/06/04 4 7 8 1 4 24
Total 269 391 494 184 475 1813 Table C-8: Double Pipe Creek. BST Analysis: Percentage of Sources per Station per Date.
Predicted Source Station Date Human Livestock Pet Wildlife Unknown Total
BEB0009 11/18/03 14% 29% 14% 14% 29% 100% BEB0009 12/02/03 13% 22% 39% 17% 9% 100% BEB0009 01/07/04 20% 20% 15% 15% 30% 100% BEB0009 02/05/04 17% 22% 26% 22% 13% 100% BEB0009 03/03/04 17% 33% 8% 4% 38% 100% BEB0009 04/07/04 8% 38% 4% 8% 42% 100% BEB0009 05/12/04 17% 58% 8% 4% 13% 100% BEB0009 06/09/04 13% 33% 29% 0% 25% 100% BEB0009 07/08/04 25% 4% 38% 0% 33% 100% BEB0009 08/11/04 4% 8% 21% 17% 50% 100% BEB0009 09/09/04 0% 0% 58% 4% 38% 100% BEB0009 10/06/04 4% 21% 13% 17% 46% 100% BPC0006 11/18/03 10% 14% 5% 29% 43% 100% BPC0006 12/02/03 30% 15% 20% 25% 10% 100%
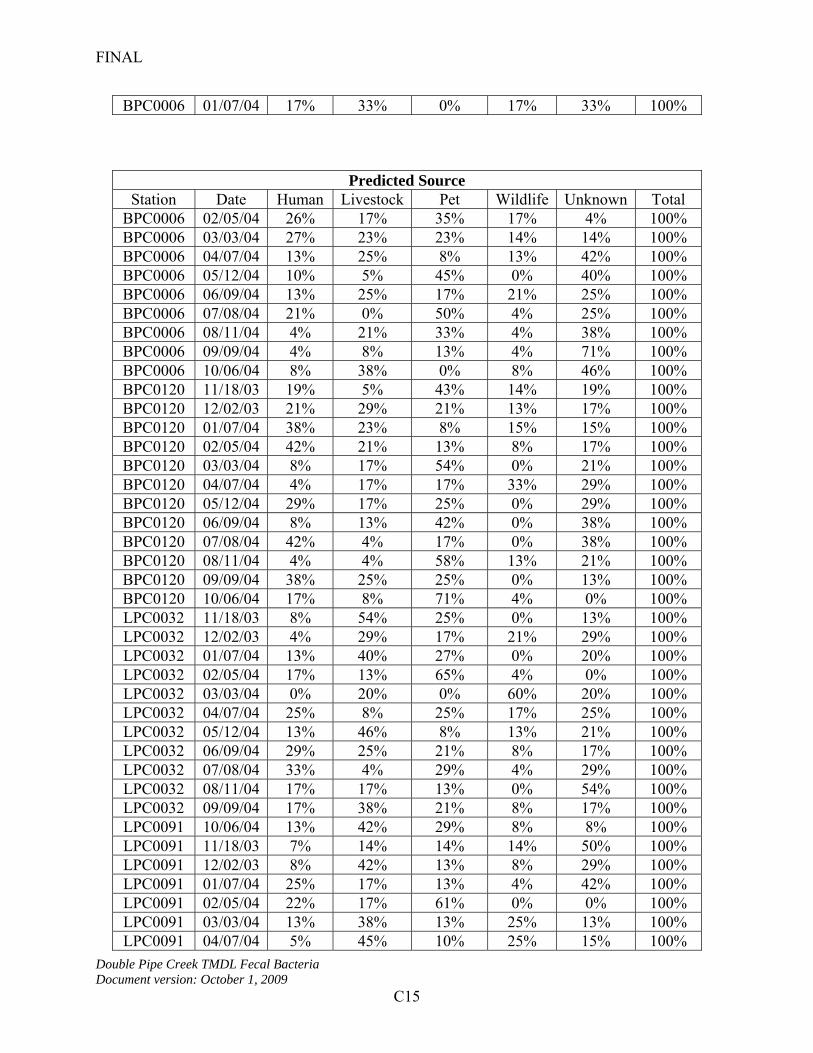
FINAL
Double Pipe Creek TMDL Fecal Bacteria Document version: October 1, 2009
C15
BPC0006 01/07/04 17% 33% 0% 17% 33% 100%
Predicted Source Station Date Human Livestock Pet Wildlife Unknown Total
BPC0006 02/05/04 26% 17% 35% 17% 4% 100% BPC0006 03/03/04 27% 23% 23% 14% 14% 100% BPC0006 04/07/04 13% 25% 8% 13% 42% 100% BPC0006 05/12/04 10% 5% 45% 0% 40% 100% BPC0006 06/09/04 13% 25% 17% 21% 25% 100% BPC0006 07/08/04 21% 0% 50% 4% 25% 100% BPC0006 08/11/04 4% 21% 33% 4% 38% 100% BPC0006 09/09/04 4% 8% 13% 4% 71% 100% BPC0006 10/06/04 8% 38% 0% 8% 46% 100% BPC0120 11/18/03 19% 5% 43% 14% 19% 100% BPC0120 12/02/03 21% 29% 21% 13% 17% 100% BPC0120 01/07/04 38% 23% 8% 15% 15% 100% BPC0120 02/05/04 42% 21% 13% 8% 17% 100% BPC0120 03/03/04 8% 17% 54% 0% 21% 100% BPC0120 04/07/04 4% 17% 17% 33% 29% 100% BPC0120 05/12/04 29% 17% 25% 0% 29% 100% BPC0120 06/09/04 8% 13% 42% 0% 38% 100% BPC0120 07/08/04 42% 4% 17% 0% 38% 100% BPC0120 08/11/04 4% 4% 58% 13% 21% 100% BPC0120 09/09/04 38% 25% 25% 0% 13% 100% BPC0120 10/06/04 17% 8% 71% 4% 0% 100% LPC0032 11/18/03 8% 54% 25% 0% 13% 100% LPC0032 12/02/03 4% 29% 17% 21% 29% 100% LPC0032 01/07/04 13% 40% 27% 0% 20% 100% LPC0032 02/05/04 17% 13% 65% 4% 0% 100% LPC0032 03/03/04 0% 20% 0% 60% 20% 100% LPC0032 04/07/04 25% 8% 25% 17% 25% 100% LPC0032 05/12/04 13% 46% 8% 13% 21% 100% LPC0032 06/09/04 29% 25% 21% 8% 17% 100% LPC0032 07/08/04 33% 4% 29% 4% 29% 100% LPC0032 08/11/04 17% 17% 13% 0% 54% 100% LPC0032 09/09/04 17% 38% 21% 8% 17% 100% LPC0091 10/06/04 13% 42% 29% 8% 8% 100% LPC0091 11/18/03 7% 14% 14% 14% 50% 100% LPC0091 12/02/03 8% 42% 13% 8% 29% 100% LPC0091 01/07/04 25% 17% 13% 4% 42% 100% LPC0091 02/05/04 22% 17% 61% 0% 0% 100% LPC0091 03/03/04 13% 38% 13% 25% 13% 100% LPC0091 04/07/04 5% 45% 10% 25% 15% 100%
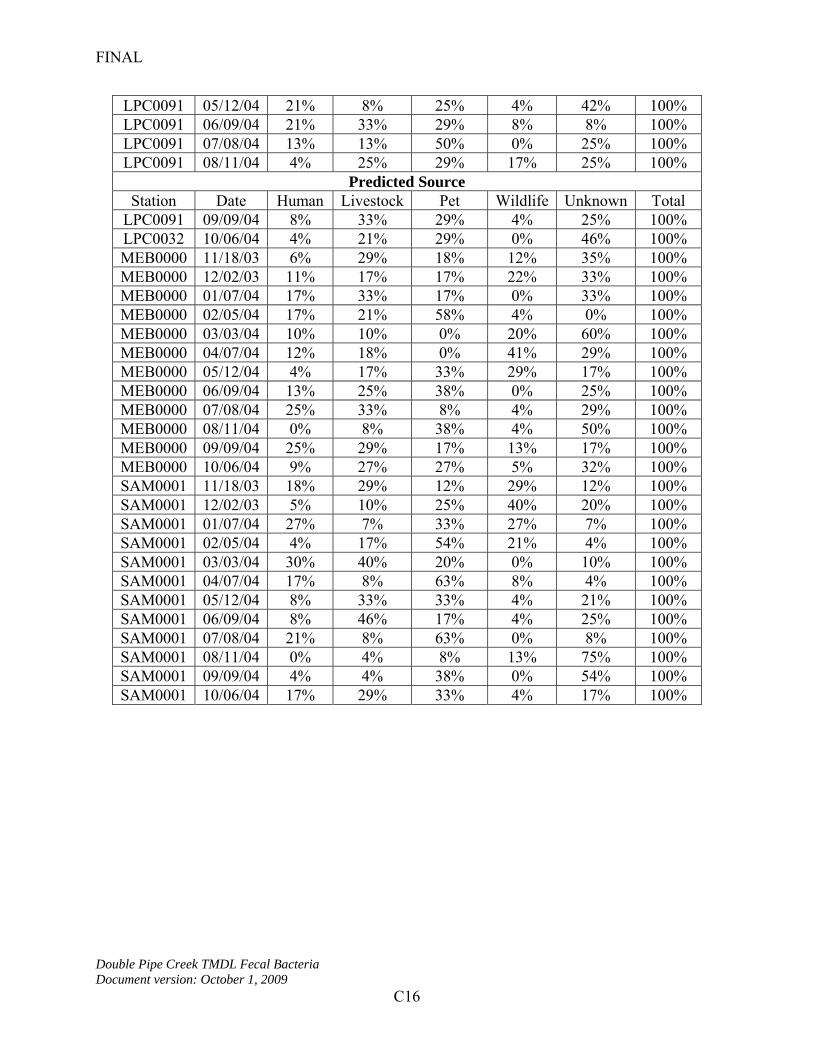
FINAL
Double Pipe Creek TMDL Fecal Bacteria Document version: October 1, 2009
C16
LPC0091 05/12/04 21% 8% 25% 4% 42% 100% LPC0091 06/09/04 21% 33% 29% 8% 8% 100% LPC0091 07/08/04 13% 13% 50% 0% 25% 100% LPC0091 08/11/04 4% 25% 29% 17% 25% 100%
Predicted Source Station Date Human Livestock Pet Wildlife Unknown Total
LPC0091 09/09/04 8% 33% 29% 4% 25% 100% LPC0032 10/06/04 4% 21% 29% 0% 46% 100% MEB0000 11/18/03 6% 29% 18% 12% 35% 100% MEB0000 12/02/03 11% 17% 17% 22% 33% 100% MEB0000 01/07/04 17% 33% 17% 0% 33% 100% MEB0000 02/05/04 17% 21% 58% 4% 0% 100% MEB0000 03/03/04 10% 10% 0% 20% 60% 100% MEB0000 04/07/04 12% 18% 0% 41% 29% 100% MEB0000 05/12/04 4% 17% 33% 29% 17% 100% MEB0000 06/09/04 13% 25% 38% 0% 25% 100% MEB0000 07/08/04 25% 33% 8% 4% 29% 100% MEB0000 08/11/04 0% 8% 38% 4% 50% 100% MEB0000 09/09/04 25% 29% 17% 13% 17% 100% MEB0000 10/06/04 9% 27% 27% 5% 32% 100% SAM0001 11/18/03 18% 29% 12% 29% 12% 100% SAM0001 12/02/03 5% 10% 25% 40% 20% 100% SAM0001 01/07/04 27% 7% 33% 27% 7% 100% SAM0001 02/05/04 4% 17% 54% 21% 4% 100% SAM0001 03/03/04 30% 40% 20% 0% 10% 100% SAM0001 04/07/04 17% 8% 63% 8% 4% 100% SAM0001 05/12/04 8% 33% 33% 4% 21% 100% SAM0001 06/09/04 8% 46% 17% 4% 25% 100% SAM0001 07/08/04 21% 8% 63% 0% 8% 100% SAM0001 08/11/04 0% 4% 8% 13% 75% 100% SAM0001 09/09/04 4% 4% 38% 0% 54% 100% SAM0001 10/06/04 17% 29% 33% 4% 17% 100%

FINAL
Double Pipe Creek TMDL Fecal Bacteria Document version: October 1, 2009
C17
___________________________________________________________________
Double Pipe Creek Watershed Probable Bacterial Pollution Sources
human20%
pet37%
wildlife14%
livestock29%
Figure C-3. Double Pipe Creek Watershed relative contributions by probable sources of Enterococcus contamination.
Double Pipe Creek Summary The use of ARA allowed the identification of probable bacterial sources in the Double Pipe Creek Watershed for source categories in the library. When water isolates were compared to the library and potential sources predicted, 74% of the isolates were classified by statistical analysis. The highest RCC for the library was 92% (for pet), while human and wildlife had RCCs of 77% and 58%, respectively. Again, as was found in the Antietam Creek watershed, the livestock category had a lower RCC of 40%. The largest category of potential sources in the watershed as a whole was pet (37% of classified water isolates), followed by livestock (29%), human (20%), and wildlife (14%) (Figure C-3).
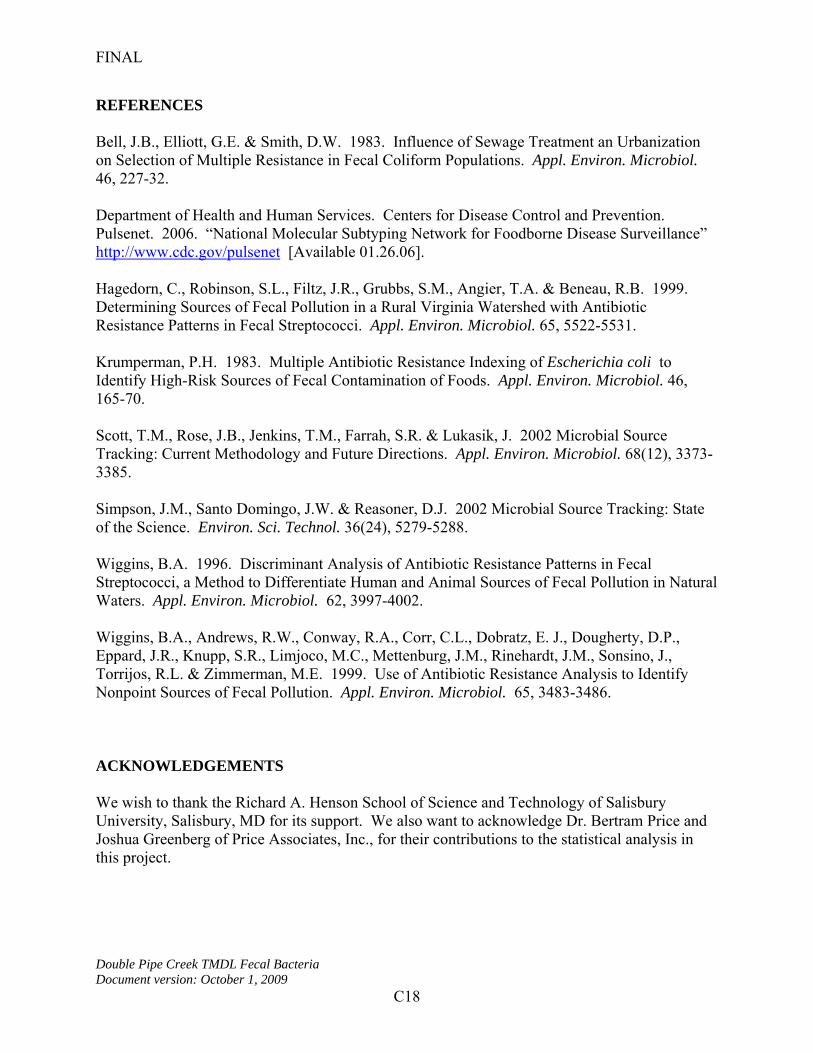
FINAL
Double Pipe Creek TMDL Fecal Bacteria Document version: October 1, 2009
C18
REFERENCES Bell, J.B., Elliott, G.E. & Smith, D.W. 1983. Influence of Sewage Treatment an Urbanization on Selection of Multiple Resistance in Fecal Coliform Populations. Appl. Environ. Microbiol. 46, 227-32. Department of Health and Human Services. Centers for Disease Control and Prevention. Pulsenet. 2006. “National Molecular Subtyping Network for Foodborne Disease Surveillance” http://www.cdc.gov/pulsenet [Available 01.26.06]. Hagedorn, C., Robinson, S.L., Filtz, J.R., Grubbs, S.M., Angier, T.A. & Beneau, R.B. 1999. Determining Sources of Fecal Pollution in a Rural Virginia Watershed with Antibiotic Resistance Patterns in Fecal Streptococci. Appl. Environ. Microbiol. 65, 5522-5531. Krumperman, P.H. 1983. Multiple Antibiotic Resistance Indexing of Escherichia coli to Identify High-Risk Sources of Fecal Contamination of Foods. Appl. Environ. Microbiol. 46, 165-70. Scott, T.M., Rose, J.B., Jenkins, T.M., Farrah, S.R. & Lukasik, J. 2002 Microbial Source Tracking: Current Methodology and Future Directions. Appl. Environ. Microbiol. 68(12), 3373-3385. Simpson, J.M., Santo Domingo, J.W. & Reasoner, D.J. 2002 Microbial Source Tracking: State of the Science. Environ. Sci. Technol. 36(24), 5279-5288. Wiggins, B.A. 1996. Discriminant Analysis of Antibiotic Resistance Patterns in Fecal Streptococci, a Method to Differentiate Human and Animal Sources of Fecal Pollution in Natural Waters. Appl. Environ. Microbiol. 62, 3997-4002. Wiggins, B.A., Andrews, R.W., Conway, R.A., Corr, C.L., Dobratz, E. J., Dougherty, D.P., Eppard, J.R., Knupp, S.R., Limjoco, M.C., Mettenburg, J.M., Rinehardt, J.M., Sonsino, J., Torrijos, R.L. & Zimmerman, M.E. 1999. Use of Antibiotic Resistance Analysis to Identify Nonpoint Sources of Fecal Pollution. Appl. Environ. Microbiol. 65, 3483-3486.
ACKNOWLEDGEMENTS We wish to thank the Richard A. Henson School of Science and Technology of Salisbury University, Salisbury, MD for its support. We also want to acknowledge Dr. Bertram Price and Joshua Greenberg of Price Associates, Inc., for their contributions to the statistical analysis in this project.

FINAL
Double Pipe Creek TMDL Fecal Bacteria Document version: October 1, 2009
D1
Appendix D – Estimating Maximum Daily Loads
This appendix documents the technical approach used to define maximum daily loads of fecal bacteria consistent with the annual average TMDL which, when met, are protective of water quality standards in Double Pipe Creek. The approach builds upon the TMDL analysis that was conducted to ensure that compliance with the annual average target will result in compliance with the applicable water quality standards. The annual average loading target was converted into allowable daily values by using the loadings developed from the TMDL analysis. The approach is consistent with available EPA guidance on generating daily loads for TMDLs.
The available guidance for developing daily loads does not specify a single allowable approach; it contains a range of options. Selection of a specific method for translating a time-series of allowable loads into expression of a TMDL requires decisions regarding both the level of resolution (e.g., single daily load for all conditions vs. loads that vary with environmental conditions) and level of probability associated with the TMDL.
Level of Resolution
The level of resolution pertains to the amount of detail used in specifying the maximum daily load. The draft EPA guidance on daily loads provides three categories of options for level of resolution.
1. Representative daily load: In this option, a single daily load (or multiple representative daily loads) is specified that covers all time periods and environmental conditions.
2. Flow-variable daily load: This option allows the maximum daily load to vary based upon the observed flow condition.
3. Temporally-variable daily load: This option allows the maximum daily load to vary based upon seasons or times of varying source or water body behavior.
Probability Level
Essentially all TMDLs have some probability of being exceeded, with the specific probability being either explicitly specified or implicitly assumed. This level of probability reflects, directly or indirectly, two separate phenomena:
1. Water quality criteria consist of components describing acceptable magnitude, duration, and frequency. The frequency component addresses how often conditions can allowably surpass the combined magnitude and duration components.
2. Pollutant loads, especially from wet weather sources, typically exhibit a large degree of variability over time. It is rarely practical to specify a “never to be exceeded value” for a daily load, as essentially any loading value has some finite probability of being exceeded.
The draft daily load guidance states that the probability component of the maximum daily load should be “based on a representative statistical measure” that is dependent upon the specific TMDL and best professional judgment of the developers. This statistical measure represents how
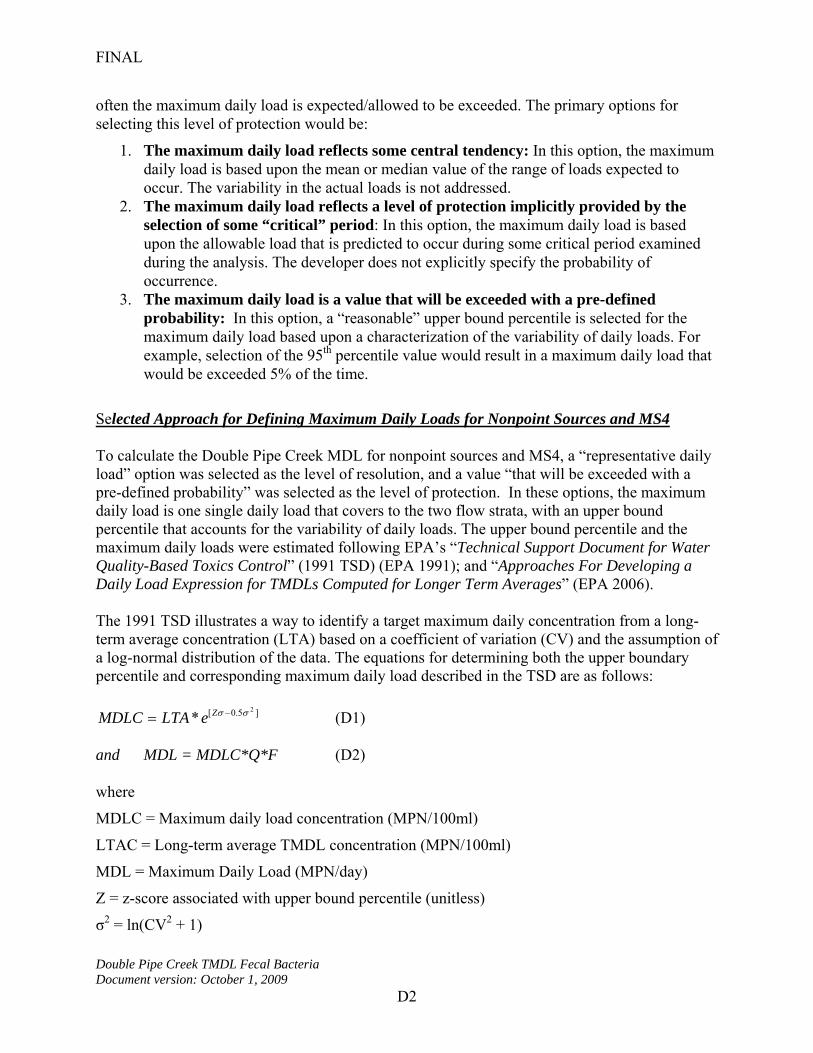
FINAL
Double Pipe Creek TMDL Fecal Bacteria Document version: October 1, 2009
D2
often the maximum daily load is expected/allowed to be exceeded. The primary options for selecting this level of protection would be:
1. The maximum daily load reflects some central tendency: In this option, the maximum daily load is based upon the mean or median value of the range of loads expected to occur. The variability in the actual loads is not addressed.
2. The maximum daily load reflects a level of protection implicitly provided by the selection of some “critical” period: In this option, the maximum daily load is based upon the allowable load that is predicted to occur during some critical period examined during the analysis. The developer does not explicitly specify the probability of occurrence.
3. The maximum daily load is a value that will be exceeded with a pre-defined probability: In this option, a “reasonable” upper bound percentile is selected for the maximum daily load based upon a characterization of the variability of daily loads. For example, selection of the 95th percentile value would result in a maximum daily load that would be exceeded 5% of the time.
Selected Approach for Defining Maximum Daily Loads for Nonpoint Sources and MS4 To calculate the Double Pipe Creek MDL for nonpoint sources and MS4, a “representative daily load” option was selected as the level of resolution, and a value “that will be exceeded with a pre-defined probability” was selected as the level of protection. In these options, the maximum daily load is one single daily load that covers to the two flow strata, with an upper bound percentile that accounts for the variability of daily loads. The upper bound percentile and the maximum daily loads were estimated following EPA’s “Technical Support Document for Water Quality-Based Toxics Control” (1991 TSD) (EPA 1991); and “Approaches For Developing a Daily Load Expression for TMDLs Computed for Longer Term Averages” (EPA 2006). The 1991 TSD illustrates a way to identify a target maximum daily concentration from a long-term average concentration (LTA) based on a coefficient of variation (CV) and the assumption of a log-normal distribution of the data. The equations for determining both the upper boundary percentile and corresponding maximum daily load described in the TSD are as follows:
]5.0[ 2
* Ze LTAMDLC (D1) and MDL = MDLC*Q*F (D2) where
MDLC = Maximum daily load concentration (MPN/100ml)
LTAC = Long-term average TMDL concentration (MPN/100ml)
MDL = Maximum Daily Load (MPN/day)
Z = z-score associated with upper bound percentile (unitless)
σ2 = ln(CV2 + 1)
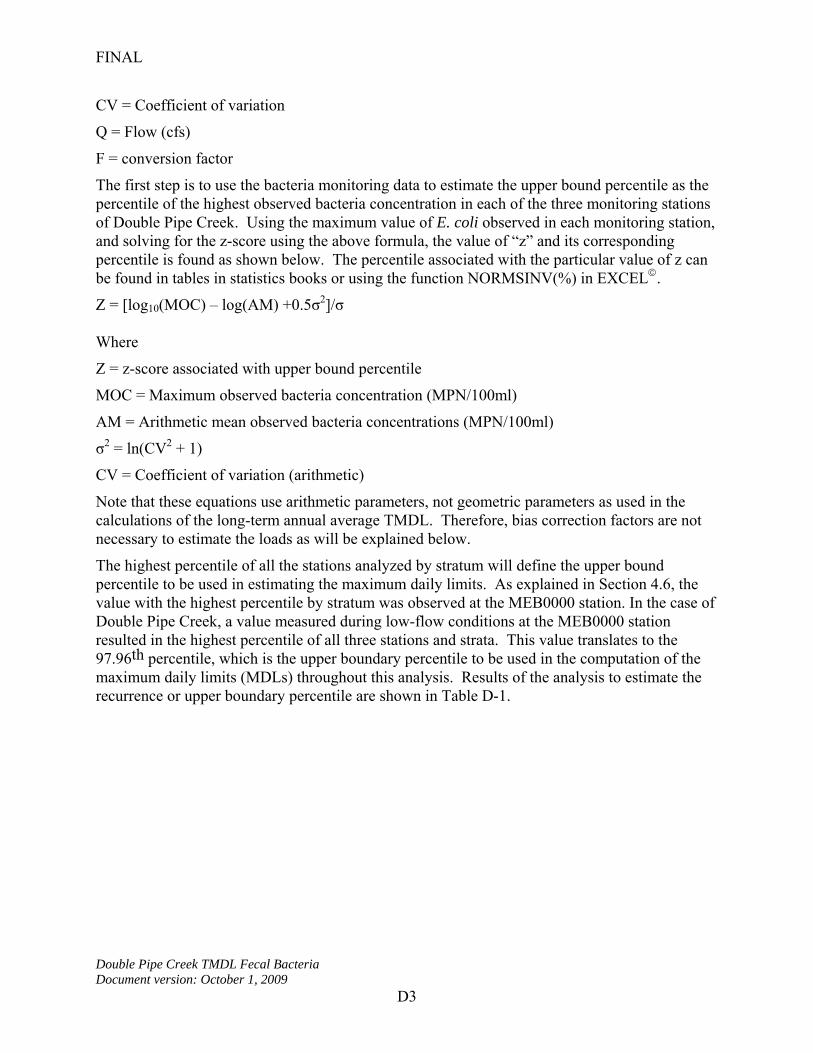
FINAL
Double Pipe Creek TMDL Fecal Bacteria Document version: October 1, 2009
D3
CV = Coefficient of variation
Q = Flow (cfs)
F = conversion factor
The first step is to use the bacteria monitoring data to estimate the upper bound percentile as the percentile of the highest observed bacteria concentration in each of the three monitoring stations of Double Pipe Creek. Using the maximum value of E. coli observed in each monitoring station, and solving for the z-score using the above formula, the value of “z” and its corresponding percentile is found as shown below. The percentile associated with the particular value of z can be found in tables in statistics books or using the function NORMSINV(%) in EXCEL.
Z = [log10(MOC) – log(AM) +0.5σ2]/σ Where
Z = z-score associated with upper bound percentile
MOC = Maximum observed bacteria concentration (MPN/100ml)
AM = Arithmetic mean observed bacteria concentrations (MPN/100ml)
σ2 = ln(CV2 + 1)
CV = Coefficient of variation (arithmetic)
Note that these equations use arithmetic parameters, not geometric parameters as used in the calculations of the long-term annual average TMDL. Therefore, bias correction factors are not necessary to estimate the loads as will be explained below.
The highest percentile of all the stations analyzed by stratum will define the upper bound percentile to be used in estimating the maximum daily limits. As explained in Section 4.6, the value with the highest percentile by stratum was observed at the MEB0000 station. In the case of Double Pipe Creek, a value measured during low-flow conditions at the MEB0000 station resulted in the highest percentile of all three stations and strata. This value translates to the 97.96th percentile, which is the upper boundary percentile to be used in the computation of the maximum daily limits (MDLs) throughout this analysis. Results of the analysis to estimate the recurrence or upper boundary percentile are shown in Table D-1.

FINAL
Double Pipe Creek TMDL Fecal Bacteria Document version: October 1, 2009
D4
Table D-1: Percentiles of Maximum Observed Bacteria Concentrations in the Double Pipe Creek Subwatersheds
Station Strata
Maximum Observed
E. coli Concentration (MPN/100ml)
Percentile
High Flow 14,200 97.04 BEB0009
Low Flow 4,880 96.34
High Flow 29,100 97.04 BPC0120
Low Flow 9,210 96.34
High Flow 8,800 93.03 MEB0000
Low Flow 17,330 97.96
High Flow 24,190 97.18 BPC0006sub
Low Flow 540 83.05
High Flow 24,190 95.40 LPC0091
Low Flow 2,480 93.71
High Flow 68,700 97.62 SAM0001 Low Flow 7,700 90.06
High Flow 130,000 97.36 LPC0032sub
Low Flow 2,910 84.70
As seen in Table D-1, the highest percentile value obtained from all three stations and strata is 97.96%, therefore, the upper boundary percentile to be used to estimate MDLs in this analysis will equal 97.96%. This 97.96th percentile value results in a maximum daily load that would not be exceeded 97.96% of the time, as, in a similar manner, a TMDL that represents the long term average condition would be expected to be exceeded half the time even after all required controls were implemented.
The MDLCs are estimated based on a statistical methodology referred to as “Statistical Theory of Rollback (STR)”. This method predicts concentrations of a pollutant after its sources have been controlled (post-control concentrations), in this case after annual average TMDL implementation. Using STR, the daily TMDLs are calculated as presented below.
First, the long-term average TMDL concentrations (CLTA) by stratum are estimated by applying the required percent reduction to the baseline (monitoring data) concentrations (Cb) by stratum as follows:

FINAL
Double Pipe Creek TMDL Fecal Bacteria Document version: October 1, 2009
D5
From Section 4.3, equations (8) and (9):
Lb = Lb-H + Lb-L
Lb = QH*CbH*F1H*WH + QL*CbL*F1L*WL
And from equation (10)
Annual Average )1(* RLTMDL b
Therefore, Lb*(1-R) = QH*CH*F1H*WH *(1-R) + QL*CL*F1L*WL*(1-R)
As explained before, a reduction in concentration is proportional to a reduction in load, thus the bacteria concentrations expected after reductions are applied are equal to the baseline concentrations multiplied by one minus the required reduction:
CLTA-H = Cb-H*(1-RH)
CLTA-L = Cb-L*(1-RL)
The TMDL concentrations estimated as explained above are shown in Table D-2.
Table D-2: Long-term Annual Average (LTA) TMDL Bacteria Concentrations
Station Strata
LTA Geometric Mean Concentrations (MPN/100ml)
LTA Arithmetic Mean*
Concentrations (MPN/100ml)
High Flow 20 83 BEB0009
Low Flow 27 45
High Flow 17 228 BPC0120
Low Flow 15 31
High Flow 19 104 MEB0000
Low Flow 30 84
High Flow 63 330 BPC0006sub
Low Flow 68 124
High Flow 135 395 LPC0091
Low Flow 63 76
High Flow 11 107 SAM0001 Low Flow 12 38
High Flow 65 382 LPC0032sub
Low Flow 30 50
*Only arithmetic parameters are used in the daily loads analysis.

FINAL
Double Pipe Creek TMDL Fecal Bacteria Document version: October 1, 2009
D6
The next step is to calculate the 97.96th percentile (the MDL concentrations) of these expected concentrations (LTA concentrations) using the coefficient of variation of the baseline concentrations. Based on a general rule for coefficient of variations, the coefficient of variation of the distribution of the concentrations of a pollutant does not change after these concentrations have been reduced or controlled by a fixed proportion (Ott, Wayne R. 1995). Therefore, the coefficient of variation estimated using the monitoring data concentrations does not change, and it can be used to estimate the 99.5th percentile of the long-term average TMDL concentrations (LTAC) using equation (D1). These values are shown in Table D-3.
Table D-3: Maximum Daily Load (MDL) Concentrations
Station Strata CV MDL
Concentrations (MPN/100ml)
High Flow 4.0 632 BEB0009
Low Flow 1.3 215
High Flow 13.4 1,798 BPC0120
Low Flow 1.7 171
High Flow 5.5 831 MEB0000
Low Flow 2.7 572
High Flow 5.1 2,613 BPC0006sub
Low Flow 1.5 640
High Flow 2.8 2,712 LPC0091
Low Flow 0.7 226
High Flow 9.5 868 SAM0001 Low Flow 3.0 270
High Flow 5.8 3,051 LPC0032sub
Low Flow 1.3 231
With the 97.96th percentiles of LTA TMDL bacteria concentrations estimated for both high flow and low flow strata as explained above, the maximum daily load for MS4 and nonpoint sources for each subwatershed can be now estimated as: Daily TMDL (MPN/day) = QH*(97.96thCLTA-H)*F1H*WH + QL*(97.96thCLTA-L)*F1L*WL

FINAL
Double Pipe Creek TMDL Fecal Bacteria Document version: October 1, 2009
D7
Selected Approach for Defining Maximum Daily Loads for Other Point Sources The TMDL also considers contributions from other point sources (i.e., municipal and industrial WWTP) in watersheds that have NPDES permits with fecal bacteria limits. The TMDL analysis that defined the average annual TMDL held each of these sources constant at their existing NPDES permit limit (daily or monthly) for the entire year. The approach used to determine maximum daily loads was dependent upon whether a maximum daily load was specified within the permit. If a maximum daily load was specified within the permit, then the maximum design flow is multiplied by the maximum daily limit to obtain a maximum daily load. If a maximum daily limit was not specified in the permit, then the maximum daily loads are calculated from guidance in the TSD for Water Quality-based Toxics Control (EPA 1991). The long-term average annual TMDL was converted to maximum daily limits using Table 5-2 of the TSD assuming a coefficient of variation of 0.6 and a 99th percentile probability. This results in a dimensionless multiplication factor of 3.11. The average annual bacteria loads for WWTPs are reported in billion MPN/year. In Double Pipe Creek, to estimate the maximum daily loads for WWTPs, the annual average loads are multiplied by the multiplication factor as follows: WLA-WWTP MDL (bill MPN/day) = [WLA-WWTP bill MPN/year)]*(3.11/365) The Maximum Daily Loads for the Double Pipe Creek subwatersheds are presented in Table D-4 below.
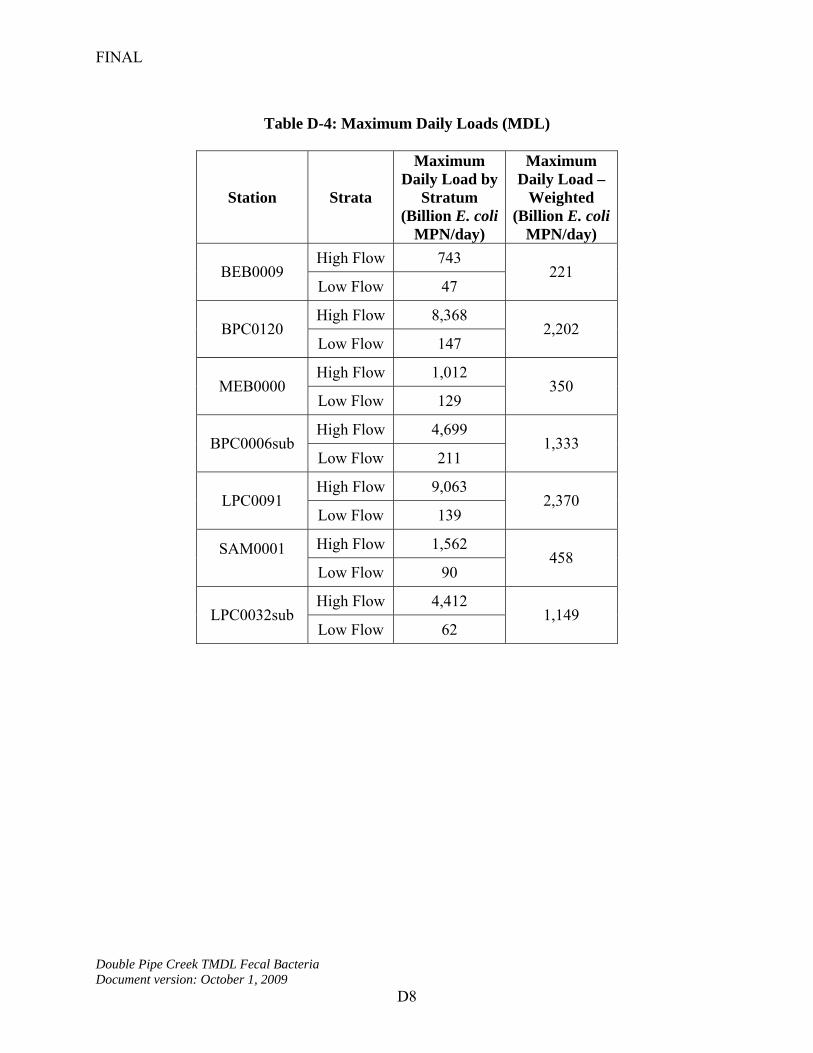
FINAL
Double Pipe Creek TMDL Fecal Bacteria Document version: October 1, 2009
D8
Table D-4: Maximum Daily Loads (MDL)
Station Strata
Maximum Daily Load by
Stratum (Billion E. coli
MPN/day)
Maximum Daily Load –
Weighted (Billion E. coli
MPN/day)
High Flow 743 BEB0009
Low Flow 47 221
High Flow 8,368 BPC0120
Low Flow 147 2,202
High Flow 1,012 MEB0000
Low Flow 129 350
High Flow 4,699 BPC0006sub
Low Flow 211 1,333
High Flow 9,063 LPC0091
Low Flow 139 2,370
High Flow 1,562 SAM0001 Low Flow 90
458
High Flow 4,412 LPC0032sub
Low Flow 62 1,149
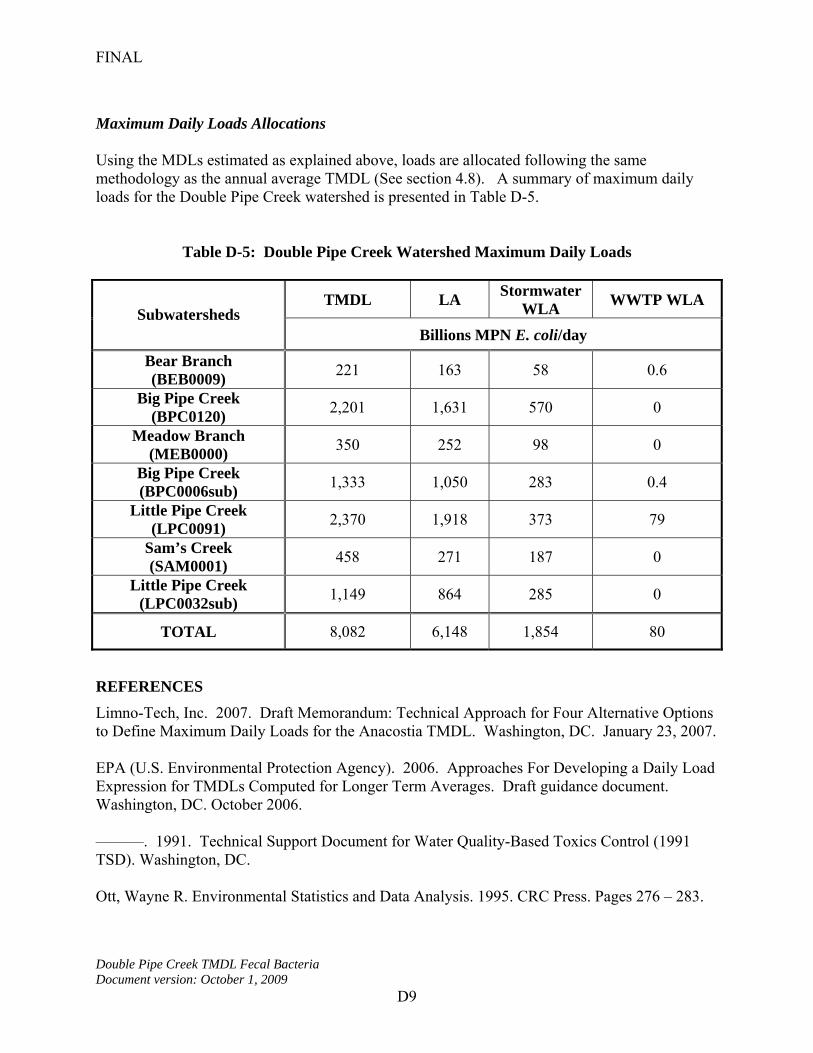
FINAL
Double Pipe Creek TMDL Fecal Bacteria Document version: October 1, 2009
D9
Maximum Daily Loads Allocations Using the MDLs estimated as explained above, loads are allocated following the same methodology as the annual average TMDL (See section 4.8). A summary of maximum daily loads for the Double Pipe Creek watershed is presented in Table D-5.
Table D-5: Double Pipe Creek Watershed Maximum Daily Loads
TMDL LA Stormwater
WLA WWTP WLA
Subwatersheds Billions MPN E. coli/day
Bear Branch (BEB0009)
221 163 58 0.6
Big Pipe Creek (BPC0120)
2,201 1,631 570 0
Meadow Branch (MEB0000)
350 252 98 0
Big Pipe Creek (BPC0006sub)
1,333 1,050 283 0.4
Little Pipe Creek (LPC0091)
2,370 1,918 373 79
Sam’s Creek (SAM0001)
458 271 187 0
Little Pipe Creek (LPC0032sub)
1,149 864 285 0
TOTAL 8,082 6,148 1,854 80
REFERENCES
Limno-Tech, Inc. 2007. Draft Memorandum: Technical Approach for Four Alternative Options to Define Maximum Daily Loads for the Anacostia TMDL. Washington, DC. January 23, 2007. EPA (U.S. Environmental Protection Agency). 2006. Approaches For Developing a Daily Load Expression for TMDLs Computed for Longer Term Averages. Draft guidance document. Washington, DC. October 2006. ———. 1991. Technical Support Document for Water Quality-Based Toxics Control (1991 TSD). Washington, DC. Ott, Wayne R. Environmental Statistics and Data Analysis. 1995. CRC Press. Pages 276 – 283.

FINAL
Monocacy-Double Pipe Creek fecal bacteria Document Version: October 1, 2009
E1
Appendix E – Relationship of Fecal Bacteria TMDLs for the Double Pipe Creek, Upper Monocacy River, and Lower Monocacy River Watersheds
The purpose of this appendix is to explain the hydrologic relationship between the Double Pipe Creek, Upper Monocacy River, and Lower Monocacy River watersheds and how this affects the fecal bacteria TMDLs for each of the respective watersheds. As illustrated in Figure E-1, the three watersheds are hydrologically connected, beginning with the Double Pipe Creek watershed to the east. The Double Pipe Creek watershed flows into the Upper Monocacy River watershed, near the small town of Rocky Ridge. It is also shown in Figure E-1 that the Upper Monocacy River watershed includes land in Pennsylvania and Maryland. The combined flow from the Upper Monocacy River watershed and the Double Pipe Creek watershed flows into the Lower Monocacy River watershed. The hydrologic connectivity of the watersheds is illustrated in Figure E-2. The baseline fecal bacteria loads for the watersheds are shown in Table E-1. The TMDL calculations are shown in Tables E-2 through E-4. Further information can be found in the individual TMDL documents for each watershed.
FINAL
Monocacy-Double Pipe Creek fecal bacteria Document Version: October 1, 2009
E2
Figure E-1: Location of the Double Pipe Creek, Upper Monocacy River, and Lower
Monocacy River Watersheds
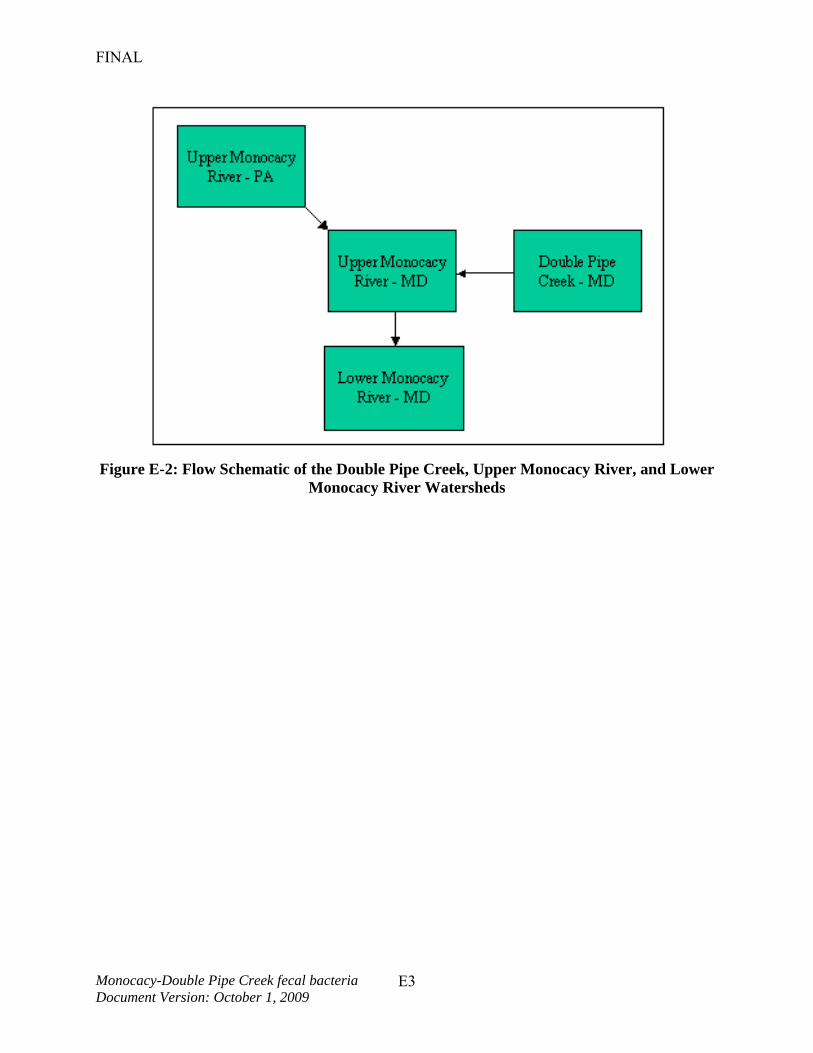
FINAL
Monocacy-Double Pipe Creek fecal bacteria Document Version: October 1, 2009
E3
Figure E-2: Flow Schematic of the Double Pipe Creek, Upper Monocacy River, and Lower
Monocacy River Watersheds

FINAL
Monocacy-Double Pipe Creek fecal bacteria Document Version: October 1, 2009
E4
Table E-1: Fecal Bacteria Baseline Loads
Total Baseline Load =MD 8-digit Basin
Load +
Upstream Load Watershed
Billion MPN E. coli/year
Double Pipe Creek 11,614,269 = 11,614,269 + N/A Upper Monocacy
River 15,073,485 = 1,985,054 + 13,088,4311
Lower Monocacy River
20,856,810 = 5,783,325 + 15,073,4852
1The upstream load is equivalent to the Double Pipe Creek baseline load (11,614,269 billion MPN E. coli/year) plus the PA baseline load (1,474,162 billion MPN E. coli/year). 2The upstream load is equivalent to the Upper Monocacy River baseline load.
Table E-2: Double Pipe Creek TMDL
LA +Stormwater
WLA + +
WWTP WLA
+ MOS TMDL
Billion MPN E. coli/year
=
Billion MPN E. coli/year
282,168 = 181,528 + 91,249 + 9,391 + Incorporated
Table E-3: Upper Monocacy River TMDL Summary
LAUM + WLAUM + LADP + LAPA + MOS TMDL
Billion MPN E. coli/year
=
Billion MPN E. coli/year
1,353,850 = 483,751 + 57,483 + 282,1681 + 575,4482 + Incorporated1 This upstream load allocation is equivalent to the Double Pipe Creek TMDL. 2 This upstream PA load allocation is determined to be necessary in order to meet MD water quality standards in the MD portion of the Upper Monocacy River watershed.
Table E-4: Lower Monocacy River TMDL Summary
LALM + WLALM + LAUM + MOS TMDL
Billion MPN E. coli/year
=
Billion MPN E. coli/year 2,033,379 = 426,161 + 253,368 + 1,353,8501 + Incorporated
1The upstream load is equivalent to the Upper Monocacy River TMDL.